Article

Taking the Time Characteristic into Account of Life Cycle Assessment: Method and Application for Buildings

Department of disaster prevention mitigation and construction technology, College of Civil Engineering and Architecture, Zhejiang University of Technology, No. 18 Chao Wang Road, Xia Cheng District, Hangzhou 310014, China
Sustainability 2017, 9(6), 922; https://doi.org/10.3390/su9060922
Submission received: 14 April 2017 / Revised: 14 April 2017 / Accepted: 18 May 2017 / Published: 31 May 2017
(This article belongs to the Special Issue Sustainable and Resource–Efficient Homes and Communities)

Abstract

:
Life cycle assessment (LCA) involves many temporal issues. It is necessary to make a clear distinction between long-term impacts and short-term impacts, especially for those structures with long service life, such as buildings. With their long service life of 50 years, a great deal of maintenance and repairs could be conducted, causing a respective environmental impact. In this paper we explored a monetization method to convert the life cycle environmental impact into a life cycle environmental cost to address the temporal issues involved in LCA by discounting. This method can facilitate decision-making when tradeoffs between current and future environmental impacts exist. Moreover, this method can be used as an effective supplement to life cycle cost and provide decision support for making trade-off between cost and environmental impact. Finally, a building located in Xiamen City, China was selected as a case study and analyzed by the proposal LCA method. The results indicated that carbon cost in the operational stage is the maximum, building material production and transportation stages are ranked second, and the amount in the demolition stage is negligible, compared with the other three stages. Additionally, with the increase of the discount rate, the carbon cost in different life cycle stages will decrease, the percentage of the carbon cost in the operational stage will gradually decrease, but the percentage of the carbon cost in building material production and transportation stages will gradually increase.

1. Introduction

Life cycle assessment (LCA) is a pre-eminent and effective tool for estimating environmental effects of different products, processes, or activities over their life cycle [1,2]. Despite its popularity and codification by organizations, such as the International Standards Organization (ISO) and the Society of Environmental Toxicology and Chemistry (SETAC), LCA still has several aspects that need to be taken into account and is a tool in need of improvement [3,4]. Reap et al. [3,5] identified 15 major problem areas of LCA and organized them by the LCA phases in which each appears. Functional unit definition, boundary selection, allocation, spatial variation, and local environmental uniqueness are critical problems of LCA requiring particular attention. In addition, LCA integrates environmental impacts over time, to which special attention should be paid. It is worth noting that LCA involves many temporal issues [6], and decision-makers are often faced with tradeoffs between current and future environmental impacts. For example, Option A and Option B have the same overall environmental impact, but Option A has a high initial environmental impact while having a low future environmental impact, and Option B is the opposite. In this situation, how do the decision-makers choose a suitable option? However, LCA makes no explicit differentiation between emissions at different times. For instance, the carbon emissions emitted today or 100 years later are treated equally in LCA, as only different time horizons have been chosen for the global warming effect, typically 20, 100 and 500 years [7,8]. Depending on this choice, the global warming potential of a pollutant may differ considerably. Therefore, it is necessary to make a clear distinction between long-term impacts and short-term impacts in LCA, especially for those structures with long service lives, such as buildings with their service life of 50 years, in which maintenance and repair works could be conducted causing additional environmental impacts.
Nowadays, most studies on LCA assume that environmental impact occurs with absolute certainty and the magnitude of the impact is always the same. The environmental impact of seven concrete and steel representative building frames in Sweden was analyzed using the LCA method by Jonsson et al. [9], in the assumed user time of 50 years, the energy use during service life largely exceeded the impacts from other parts of the life cycle. Kofoworola and Gheewala [10] provided an environmental LCA of a typical commercial office building in Thailand, and indicated that the operational phase has the highest energy and environmental impacts, followed by the manufacturing phase. In addition, the analysis of the manufacturing phase indicates that steel reinforcement and concrete are the most significant materials in terms of their associated environmental impacts as they accounted for about 17% and 64%, respectively; lighting, air conditioning, office equipment, and other office appliances in the operational phase produced 40% or more of the overall impact in any given category. Chau et al. [11] provided a review on three streams of LCA studies (life cycle assessment, life cycle energy assessment, and life cycle carbon emissions assessment) on buildings. From the review, we can see that all of the studies of LCA of the mentioned buildings adopted a deterministic analysis, i.e., the environmental impact will not change over time.
However, since LCA integrates the environmental impact over time, valuing impacts distributed in time is a problem of continuing discussion in the LCA community [5]. Only a few studies have realized that whether an identical environmental impact can be worth more or less in the future than today is an important question that needs to be addressed. Huijbregts et al. [12] found that metal toxicity potentials differed up to 6.5 times depending on the time horizon chosen in the fate model. Hellweg et al. [13] analyzed the time-dependent life cycle assessment of slag landfills and suggested that landfills remain a risk to the environment for very long time periods. The long-term emissions might be valued differently than current emissions, for instance, as a result of a changing the background concentration in the environment. Hellweg et al. [14] presented an environmental impact discounting method to consider the effect of the time characteristic on the results of LCA. They indicated that discounting in environmental impact should take the following factors into consideration: (1) changes in the magnitude of damage; (2) pure time preference; (3) productivity of capital; and (4) uncertainties. However, the principle of sustainable development [15] claimed that future generations have the same right to a good environment as current generations. Thus, the welfare of future generations should be a concern to us and that all members of all generations deserve equal treatment, including those not yet born. Based on this discussion, the discounting rate should be set to zero.
Given the consideration that it is controversial to discount the environmental impact directly [3,5,15], in this paper, a method of discounting the monetary value of the environmental impact is presented in Section 2. Firstly, the impact quantified by LCA is converted to monetary units, and it is worth noting that the pollutant damage cost should not be defined as a fixed value, since the money needed to pay in order to avoid the environmental impact and the policy targets on environmental impact mitigation are both time-varying. Then, the related depreciation by the discounting rate is considered, which is often employed in the method of life cycle cost (LCC) [16]. In Section 3 the method mentioned above is applied to a building located in Xiamen Province, China, as a case study. According to the case study, the environmental cost was calculated, and the main impact phase was identified. Finally, the scenario analysis method was used to analyze the effect of the discount rate on the life cycle cost of building. In conclusion, we discuss our findings and address remaining challenges of the LCA approach with a time effect.

2. Method of Life Cycle Assessment with a Time Effect

A method of life cycle assessment with a time effect was put forward in this paper. The method integrates two steps. First, the environmental impact quantified by LCA is converted to monetary units (eco-cost). Second, similar to the traditional LCC analysis [16,17], the eco-cost is discounted according to the relevant discounting rates. The following sections describe the method in detail.

2.1. Monetary Valuation of the Environmental Impact (Environmental Cost)

The LCC-oriented environmental accounting tools suggested as useful in environmental decision-making have been identified [18]. In environmental economics it is common practice to assign prices to external benefits and costs [19]. These prices can be called virtual costs, which quantify the cost of preventing a certain amount of environmental burden related to a product or activity. There are various methods to estimate these virtual costs, such as willingness to pay (WTP) and willingness to accept (WTA), etc. [20]. WTA is the minimum amount of money that person is willing to accept to abandon a good or to put up with something negative, such as pollution. It is the equivalent to the minimum monetary amount required for the sale of a good or acquisition of something undesirable to be accepted by an individual. Conversely, WTP is the maximum amount an individual is willing to sacrifice to procure a good or avoid something undesirable. The price of any goods transaction will, thus, be any point between a buyer’s willingness to pay and a seller’s willingness to accept. The net difference between WTP and WTA is the social surplus created by the trading of goods. These two methods mentioned above both have good application. For example, Barrington-Leigh and Behzadnejad [21] presented a life satisfaction approach in the valuation of air quality. According to the calculation, an individual with a household average income is willing to pay $890 to reduce the SO2 level by 1 μg m−3 throughout the year. Ferreira et al. [22] presented an environmental valuation method to convert the environmental results into a common unit (EUR), and applied this method to a packaging waste management system. Carreras et al. [23] put forward a method that translated the environmental impact of a product or activity into a monetary value, which can be incorporated explicitly into the economic performance assessment. However, in the previous studies, there is no explicit differentiation among the environmental impacts (environmental costs) occurring at different times. It is worth noting that when converting the environmental impact into an environmental cost, the pollutant damage cost should not be defined as a fixed value, since the money needed to pay in order to avoid the environmental impact, and the policy targets on environmental impact mitigation, are both time-varying.
In this paper, the environmental cost is determined by the life cycle inventory of the impact and the relevant unit pollution damage cost associated with a specific process or activity. The calculation method of the life cycle environmental cost is shown in Equation (1):
E C = i , j I M i , j × C i , j
where EC is the life cycle environmental cost, IMi,j are the environmental emissions, such as CO2, SO2, etc., in different life cycle stages, Ci,j is the unit pollution damage cost of the environmental impact i in the different life cycle stages, and j represents the life cycle stage. Usually, a building’s life cycle includes four stages, which begins with building materials production, through including construction and operation, then ends with building demolition [24,25].
The research on the unit pollution damage cost is still very weak, making it difficult to convert all of the environmental impacts into an environmental cost. Kendall et al. [26] provided pollution damage cost estimates, and these cost estimates were adjusted to 2003 United States dollars, as shown in Table 1.
According to the WTP method, Li et al. put forward the carbon emission and energy damage costs of China, with 0.22 Yuan/kg CO2-e and 3.79 × 10⁻³ Yuan/kgce, respectively [27]. By reviewing the existing literature, Isacs et al. [28] give some guidance to practitioners who want to—or must—apply a monetary value of CO2 and other greenhouse gases in tools, such as cost-benefit analysis (CBA) and LCA. For example, the minimum level of the Swedish tax on carbon emissions in 2015 is 72 EUR/ton CO2. Additionally, in the study of Kumer [29], the carbon price is equivalent to 10–15 EUR/ton CO2.
However, it is worth noting that C i , j should not be defined as a fixed value, since people’s willingness to pay a given amount of money in order to avoid global warming and the policy targets on climate change mitigation are both time-varying. Therefore, Equation (1) should be changed to:
E C ( t ) = i , j I M i , j × C i , j ( t )
Based on a thorough review of the corresponding literature, the European Investment Bank (EIB) [30,31] indicated that the unit pollution damage cost of carbon emissions increased geometrically over time, reflecting the cumulative damage of increasing concentrations of carbon dioxide in the atmosphere (Figure 1 in Annex 2 of Reference [30]). The unit pollution damage cost of carbon emissions rises by approximately half a euro per year through to 2030. Thereafter, it rises to approximately one euro per year to 2040, and approximately two EUR per year thereafter.

2.2. Discounting the Environmental Cost

In economics, money is thought to have a time value. The future costs and benefits are often discounted to a present value in order to make them comparable to current costs and benefits [19]. This is also applicable to the environmental cost. The time value of money and the concept of economic equivalence allows money spent over various points in time to be converted to a common basis. This study considers the environmental cost in terms of the present value of the environmental cost at time t, P V ( t ) , as follows:
P V ( t ) = E C ( t ) ( 1 + υ ) t
where υ is the discount rate, which refers to the interest rate used in discounted cash flow analysis to determine the present value of future cash flows [32].
The selection of the discount rate will directly affect the ultimate result of the cost analysis [33]. The discount rate depends on the expectations about the development of the world’s economy [34]. Generally, in the case of economics, a positive discount will be used, and in the case of a recession, a negative rate will be adopted. In addition, the risk or uncertainty about future developments might have an influence on the discount rate [14,35]. The greater the risk or uncertainty of future developments, the higher the discount rate. The Board of Governors of the Federal Reserve [36] provide three types of discount items: main credit, subprime credit, and seasonal credit, with different discount rates of 0.75~6.25%, 1~6.75% and 0.15~5.65%, respectively. China’s National Development and Reform Commission (NDRC) and the Ministry of Housing and Urban-Rural Development (MOHURD) [37] recommended that the selection of the discount rate should be based on the project nature. For instance, for those projects with low risk, the discount rate can be less than 8%. According to China’s current situation of civil engineering, Shao [38] presented the suggested values of the discount rate in different provinces, for example, 5.5% in relatively developed areas, 6.5% in developed areas, and 8% in the less developed areas, respectively.

3. Case Study

3.1. Description of the Building

A residential building with 27 stories, 82.95 m high, and a total floor area of 12,594.89 m2 in Xiamen City, Fujian Province, China was chosen for the case study [39]. According to the construction organization plan, the building started construction in 2000, its project time limit is two years, and its designed service life is 50 years. As mentioned above, four stages are investigated in this study, including the building material production and transportation stage (Stage 1), construction stage (Stage 2), operational stage (Stage 3), and demolition stage (Stage 4), respectively. Due to the incomplete unit pollution damage cost, in this study, we only calculate carbon emissions as the environmental impact.

3.2. Carbon Emissions Calculation of the Case Building

(1) Carbon Emissions in Stage 1
In this stage, carbon emissions mainly consist of direct carbon emissions from materials production and indirect carbon emissions from energy consumption. For a specific building case, the carbon emissions calculation is based on the consumption of building materials and the corresponding carbon emission factors. The equation is as follows:
C m = i C M i × Q i + C t
where C M i is the carbon emission factor of material i, which is provided in the Chinese life cycle database (CLCD) developed by IKE Environmental Technology CO., Ltd (IKE, Chengdu, China) [40]; Q i is the quantity of material i; C t is the carbon emission of transportation, mainly related with the quantity of material, transportation distance, and fuel type, which can be expressed as:
C t = i C T i × Q i × T D i
where C T i is the carbon emissions factor of transportation with material i (kg/t·km), which is provided by the Chinese life cycle database (CLCD) developed by IKE Co. Ltd [40], and T D i is transportation distance of material i.
According to the bill of materials, transportation mode, and distance, the carbon emission in building material production and transportation stages can be acquired. Since hundreds of types of building materials are involved in the building, it is difficult to quantify them all. Therefore, by consulting the bill of quantities, the consumption data of three types of main building materials (concrete, reinforcement bars, and blocks) was collected. Their consumption is 5831.02 m3, 881.64 t, and 2110.28 m3, respectively. Investigating the results indicate that the materials are transported from the suburbs by diesel truck (the carbon emission factor of diesel trucks is 1983 kg CO2-e/104·t·km). Due to the inability to specifically measure the transport distance, this paper assumes that the transportation distance is 15 km. The carbon emission in this stage can be calculated by Equation (4) and Equation (5). The calculation results of carbon emissions in Stage 1 are shown in Table 2.
(2) Carbon Emissions in Stage 2
Building construction stage means the construction process after building materials transported to the construction site. Carbon emissions of the construction stage can be calculated according to construction technology, as shown in Equation (6):
C c = i R i × P i
where R i is total construction of construction method i, and P i is carbon emission factor of the construction method i. Construction technology normally includes earthwork excavation, earthwork leveling, crane handling, horizontal transportation, lighting, and concrete pouring. Table 3 shows the carbon emission factors of different construction technologies.
According to the machine-team table, the carbon emission in the construction stage can be calculated by the construction technology, as shown in Table 3.
(3) Carbon Emissions in Stage 3
Carbon emissions of the operational phase are mainly converted from energy and resource consumption used during the building’s life, such as lighting, heating, air conditioning, ventilation, and others:
C o = i C E i × e i × a
where C E i is the carbon emission factor of energy i, e i is the quantity of energy i consumption, and a is the building design service life of 50 years.
The main resource consumed in the building operational stage is tap water; 1 m3 tap water will create 0.213 kg of carbon emissions [27]. It is worth noting that the carbon emissions of the operational phase are not only related to building energy consumption, but also related to the energy structure of the area where the building located. The Intergovernmental Panel on Climate Change (IPCC) [41] pointed out that the carbon emissions from fossil fuel combustion can be estimated based on the total amount of used energy and their average carbon content. Carbon emission factors of different fossil energy types are shown in Table 4.
Electricity, as a secondary energy, is closely related to the local energy structure. The higher the proportion of thermal power, the greater the unit power of carbon emissions. The 2010 China Regional Power Grid Baseline Emission Factor released by China’s National Development and Reform Commission climate division announced the carbon emission factors of the regional power grid [42], as seen in Table 5.
In the operational stage, carbon emissions are related to many factors, such as human behavior, methods of energy consumption, and so on. Since the case building is a newly-constructed building, there is no related data. Thus, in this study, the average value of Xiamen City by searching the statistical yearbook is adopted; the annual water consumption per capita is 54.3 t, and the electricity and natural gas consumption is 1163.93 kWh and 17.39 m3, respectively. According to the design drawing of residential architecture, there are 78 households in total. Assuming that every household is a typical Chinese family of three—in this case, a residential building—the annual water consumption, electricity, and natural gas consumption are 12,706.2 t, 272,359.62 kWh, and 4069.26 m3, respectively. In addition, the two elevators equipped in the building also consume some energy. The nominal power of each elevator is 18 kW. According to the calculation method of elevator energy consumption presented by Al-Sharif, the annual energy consumed by the two elevators is 32,850 kWh. The detailed calculation process can be found in the supplementary material. According to the carbon emission conversion factors of different types of energy, the annual carbon emissions in the operational stage can be calculated. Since natural gas is measured by m3, and the carbon emission factor for natural gas is 2.36 kgCO2-e/kg, it is necessary to convert the volume of natural gas to calculate the carbon emission. Table 6 shows the annual carbon emissions in the operational stage.
(4) Carbon Emissions in Stage 4
The demolition stage refers to the demolition process of the site, site preparation, and solid waste shipping and handling, etc. Carbon emissions in this stage are mainly indirect carbon emissions caused by energy consumption, such as construction machines and equipment operation, transportation energy, and disposal of solid wastes. The equation is as follows:
C d = i C E i × e i
Since the building is still in operation, there is no relevant demolition data. According to Japanese AIJ-LCA research [
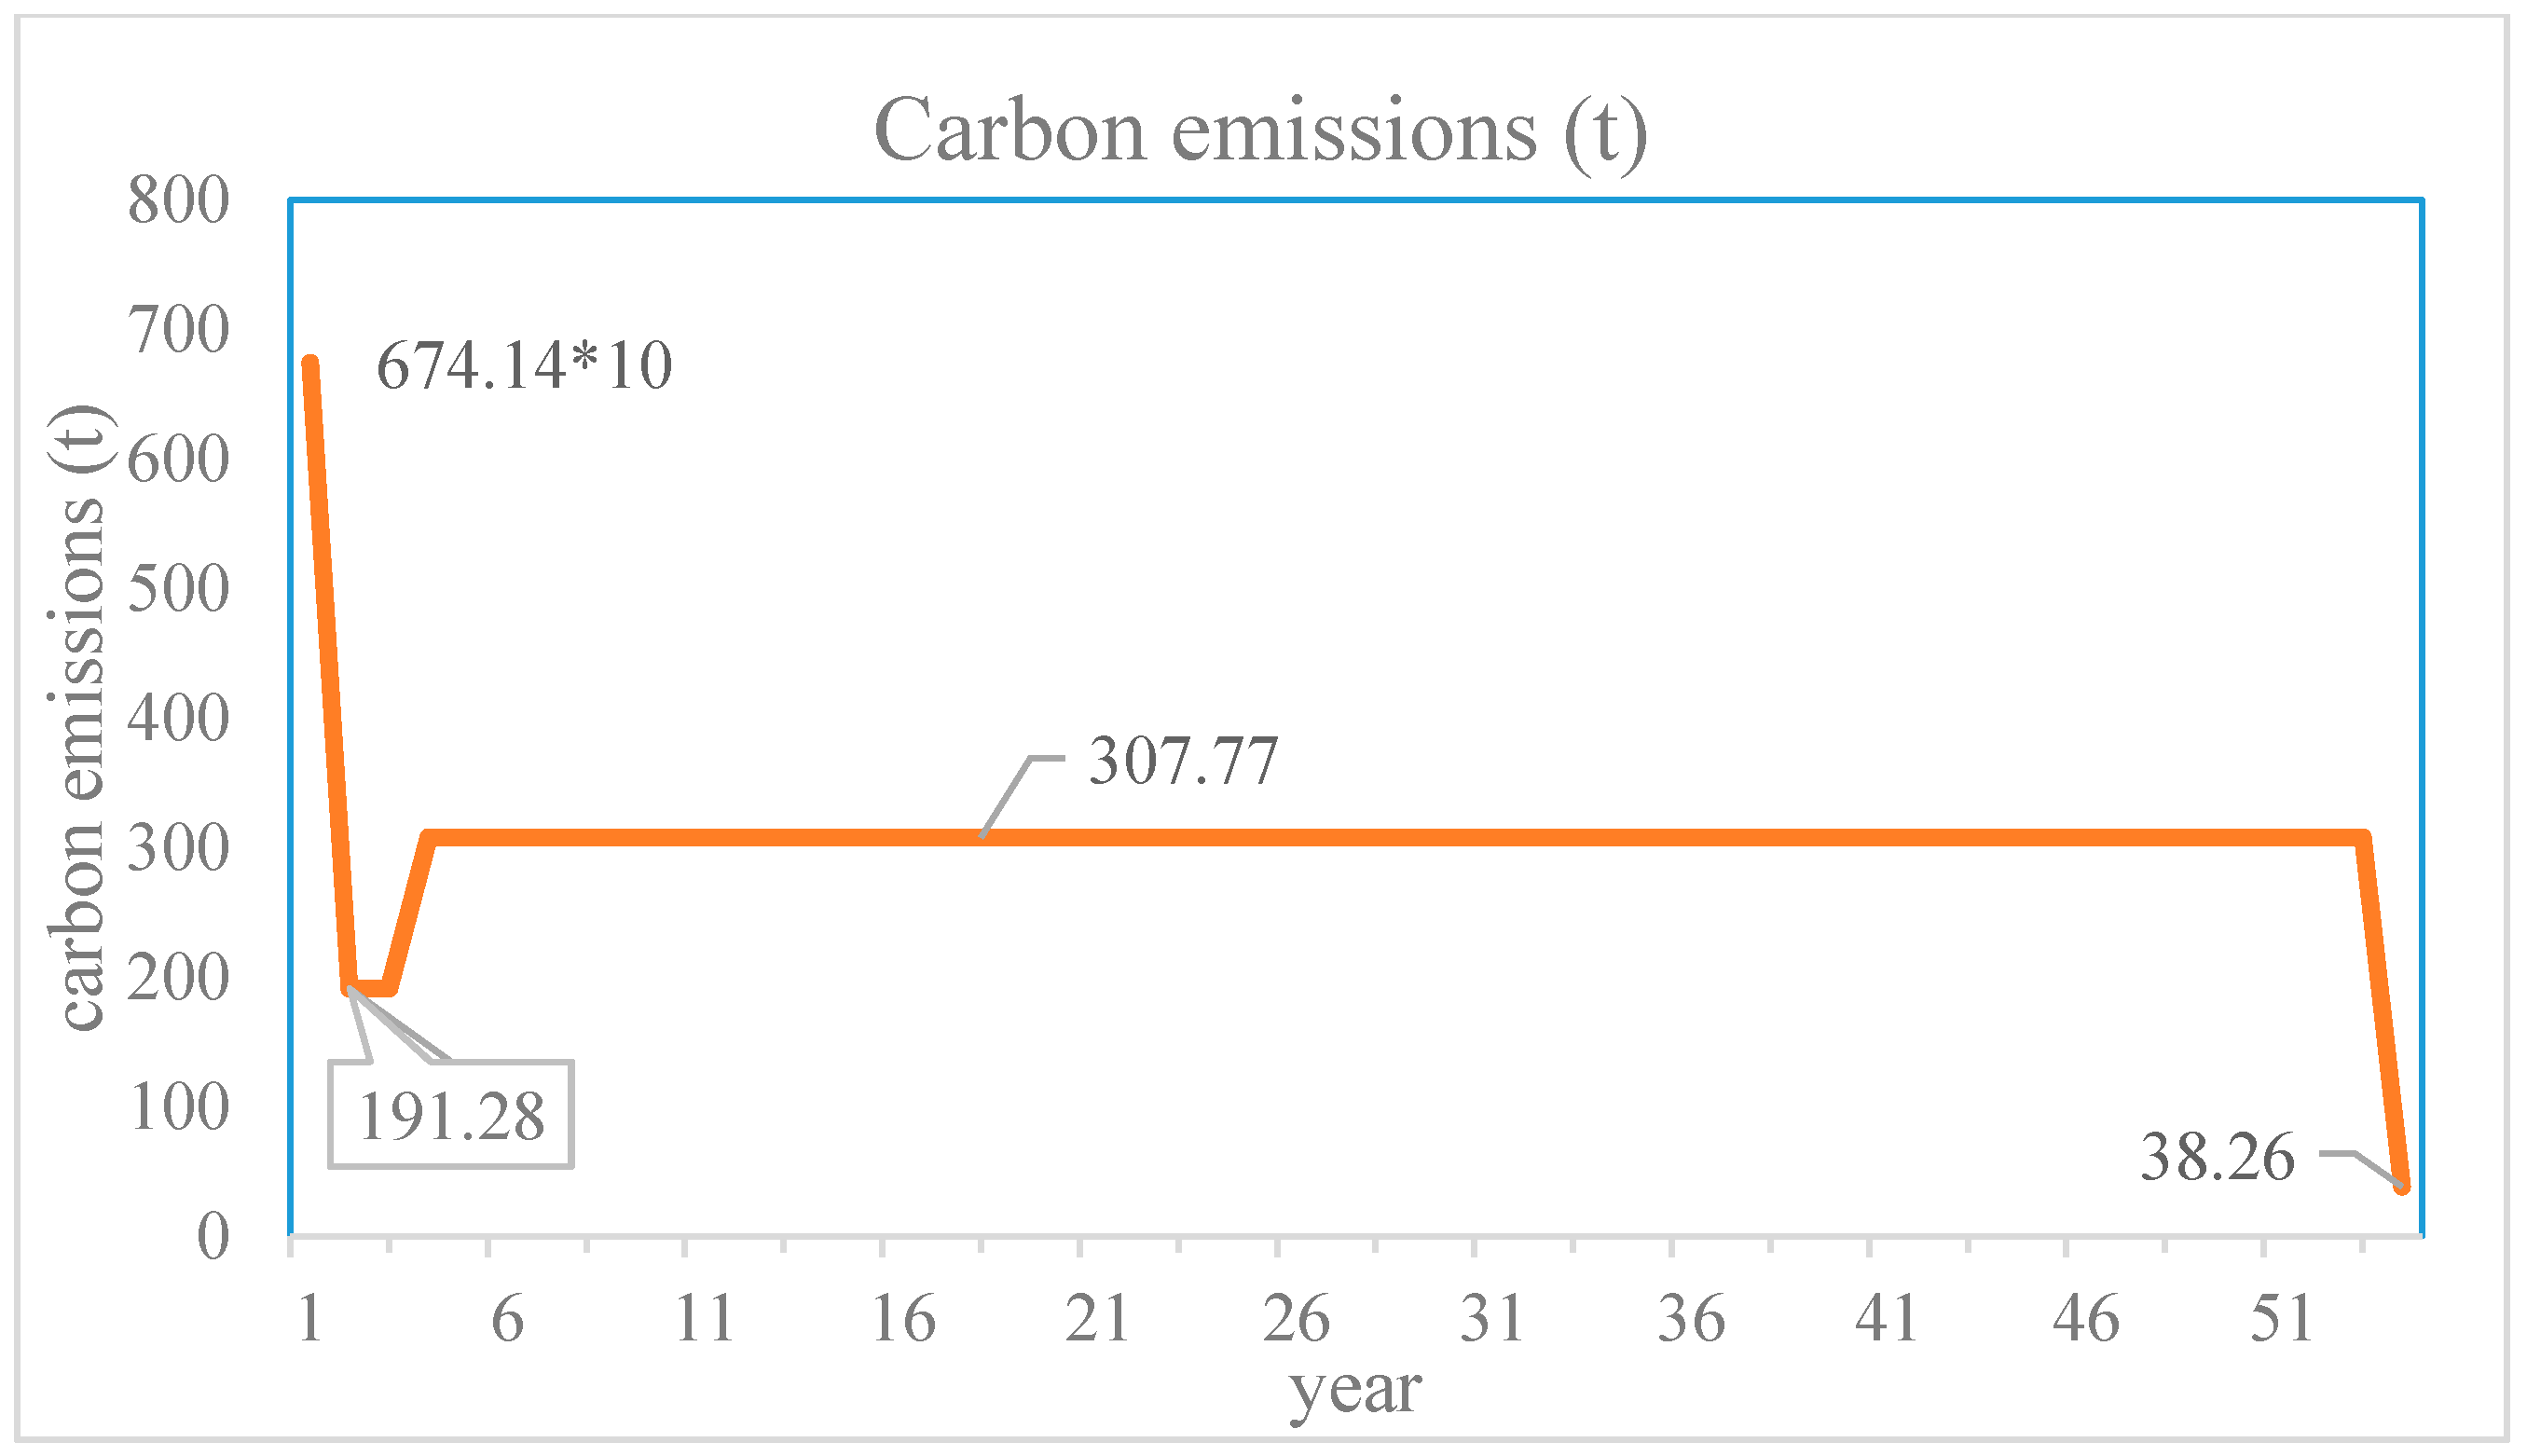
43], the carbon emission in the demolition stage is about 10% of the construction stage. Therefore, the carbon emission in the demolition stage is about 38.26 t CO2-e.
(5) Total Carbon Emissions of the Case Building during its Life Cycle
The calculation model of the total life cycle carbon emissions of the case building can be determined as follows:
L C C O 2 = C m + C c + C o + C d
The carbon emissions in the four stages have been calculated, then the total carbon emissions can be obtained. Table 7 summarized the carbon emissions in the case building’s different life cycle stages.

3.3. Determining Life Cycle Carbon Cost

Supposing that the carbon cost in the building materials production and transportation stage occurred in the initial year (2000), this carbon cost is the present value. In addition, the building’s project time limit is two years, assuming that the annual carbon emission in the construction stage is similar, so the related carbon cost in this stage can be calculated. Figure 1 shows the quantity of carbon emissions and their occurrence time.
Due to the scarcity of research on unit pollution damage costs of carbon emission, in this study, EIB’s research results are adopted [30,31]. In addition, it is noted that the selection of a suitable discount rate is crucial in LCC analysis. Kishk et al. gave a review of various criteria proposed in the literature for the selection of the discount rate [44]. For example, the discount rate may be established as the highest interest an organization expects to pay to borrow the money needed for a project; or defined as the rate of return that could be earned from the best alternative use of the funds devoted for the project under consideration. Nowadays, there is no consensus regarding the selection of the most suitable discount rate. In the UK, a discount rate of 8% is usually used, whilst in the USA the rate is 6%, in Germany, 3%, and in Switzerland, 2% [45]. Rebitezer [
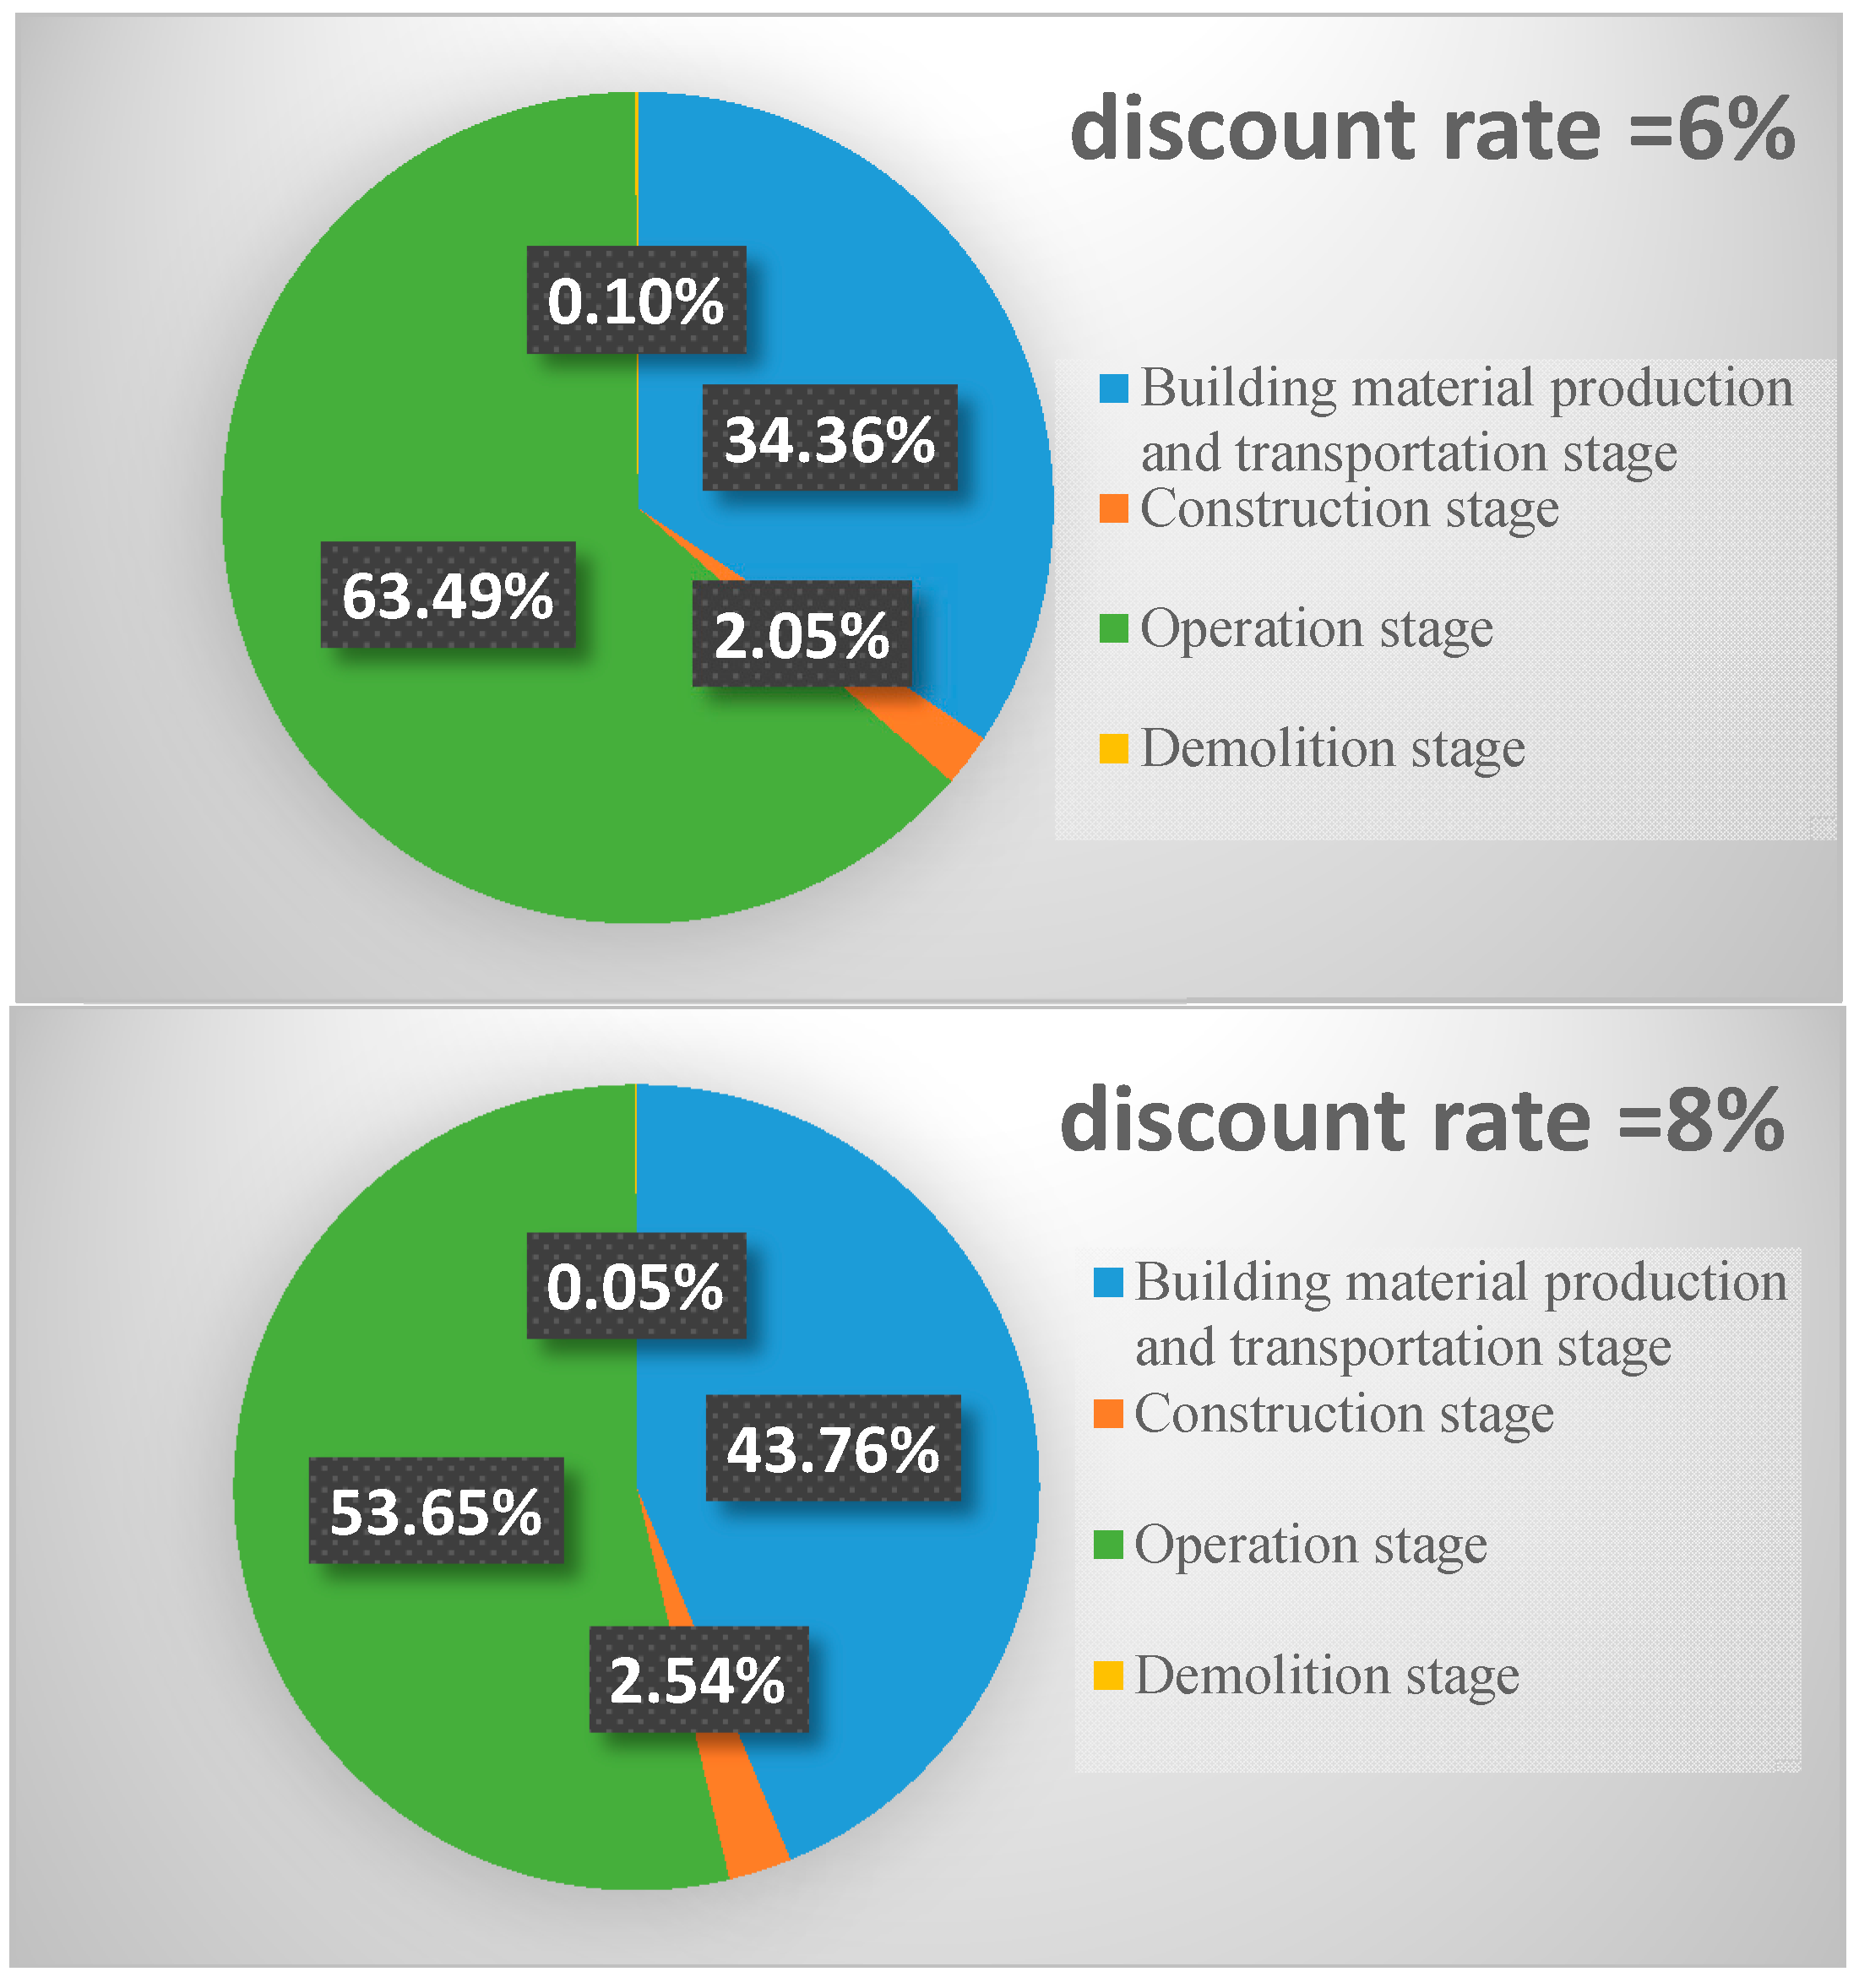
46] proposed to use a 5% discount rate and employ a sensitivity analysis, varying the rate from 0% to 10%, to test the robustness of the results. Research indicated that a high discount rate will tend to favor options with low capital cost and high recurring cost, whilst a low discount rate will have the opposite effect [47]. That is to say, the higher the discount rate, the less important are the long term costs.
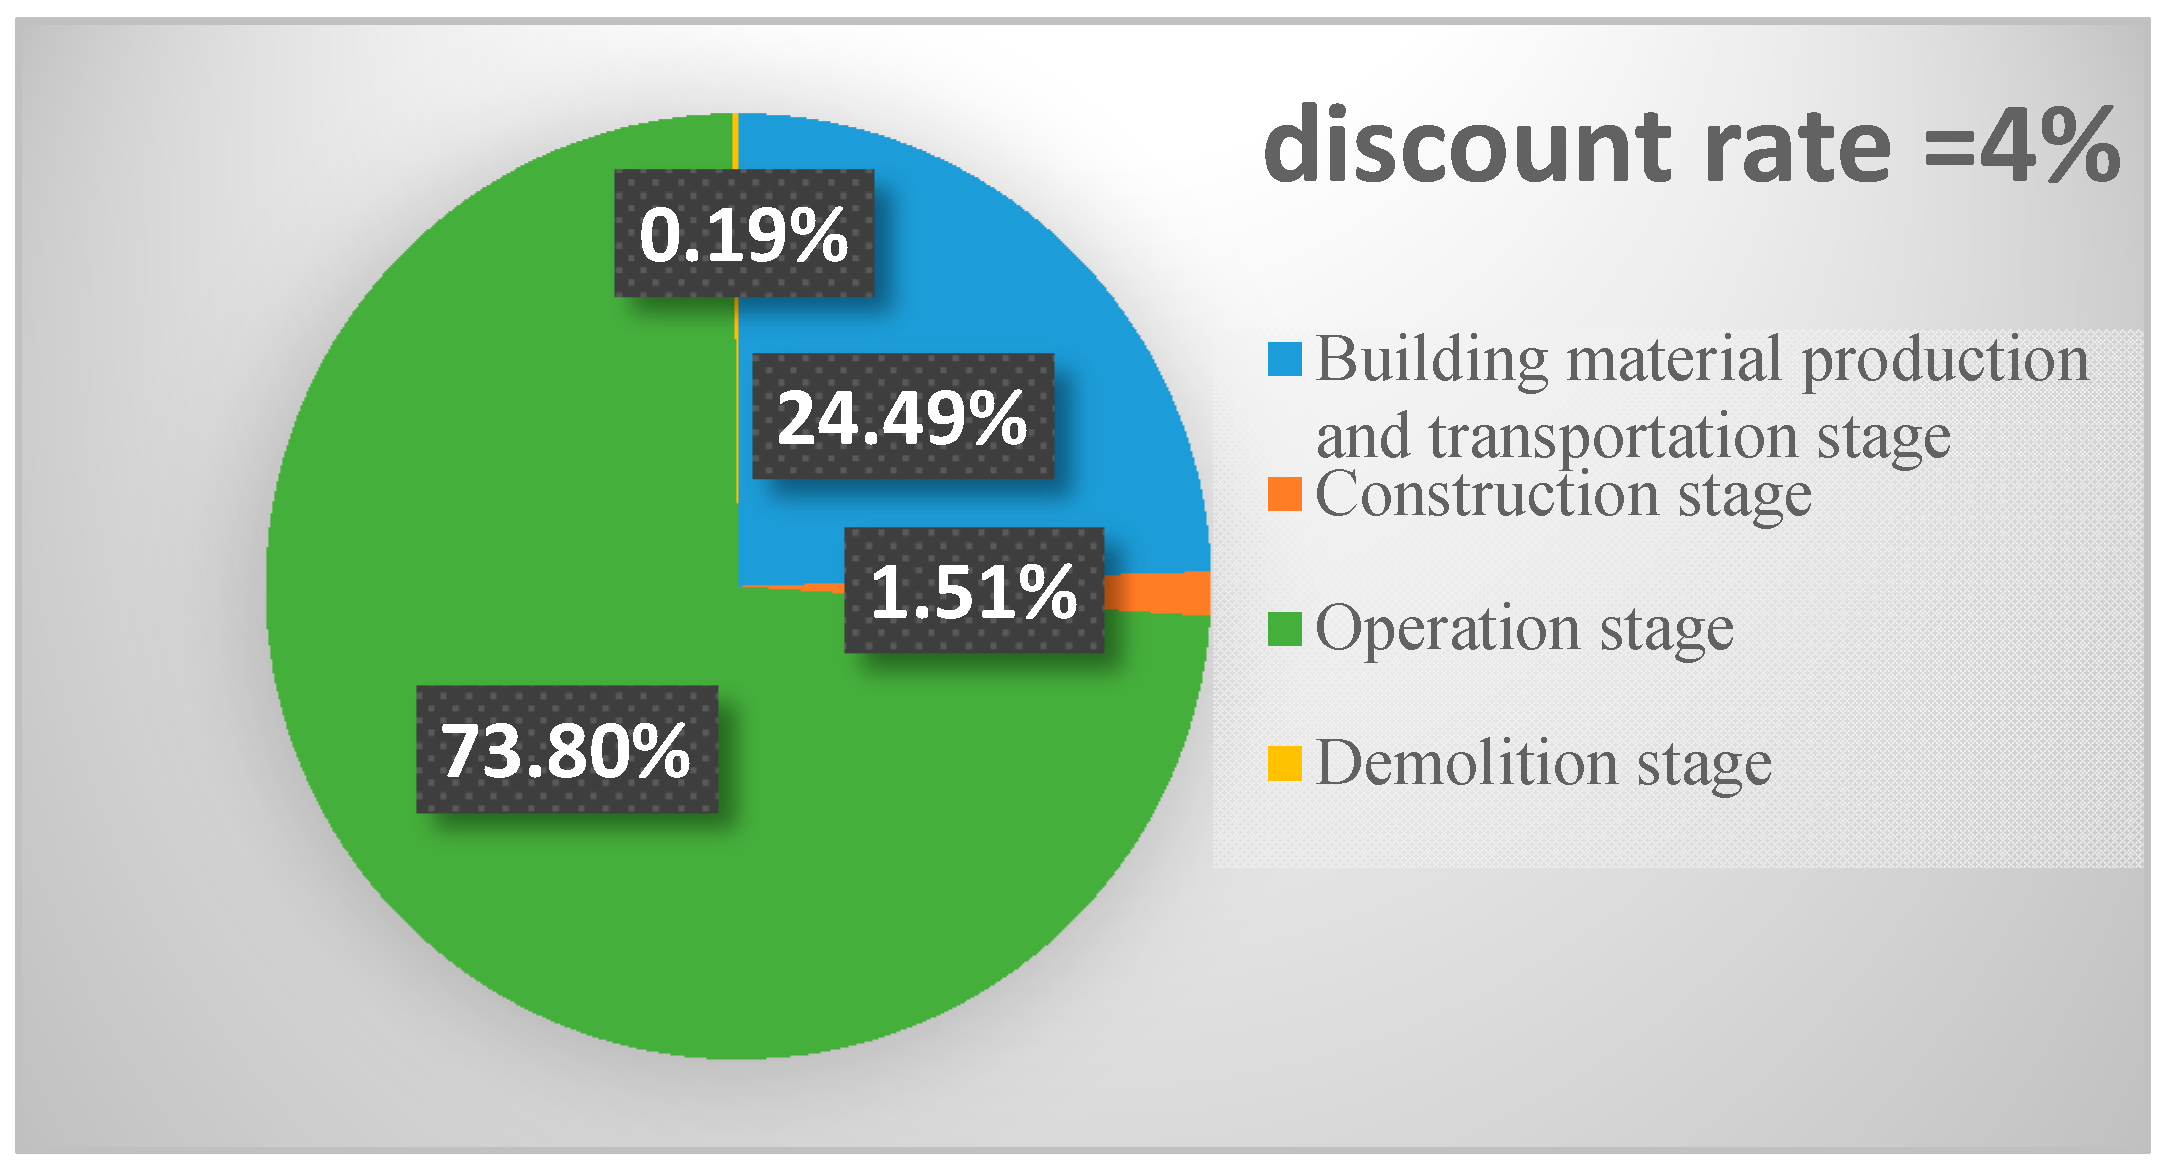
Therefore, a scenario analysis of the discount analysis is conducted. According to the previous studies on the discount rate mentioned above and at the end of Section 2.2, the discount rate is chosen as 4%, 6%, and 8% for comparison. According to Equation (3) mentioned above, the present value of the life cycle carbon cost can be determined, with the known discount rate, quantity, and occurrence time of carbon emissions, and the relevant unit pollution damage cost of carbon emissions.

4. Results and Discussion

4.1. Results

The calculated results of the carbon cost in different life cycle stages under different discount rates are shown in Table 8.
As seen in Table 8, it is well-know that with the increase in the discount rate, the carbon cost will decrease, except for the carbon cost in the building material production and transportation stage. The reason is that a positive discount rate will reduce the present value of any future environmental damage, and the carbon cost in the building material production and transportation stage occurs in the initial year (t = 0), thus, this carbon cost is the present value and will not change with the discount rate. Moreover, at low discount rate, long-term future costs are immediately meaningful and, therefore, investment for a better future would look more rewarding.
Figure 2 shows the percentage of the carbon cost at different stages. We can see that, for this case building, the carbon cost in the operational stage is the maximum, the building material production and transportation stage ranks second, and the amount in the demolition stage is negligible, compared with the other three stages. It is worth noting that with the increase in the discount rate, the percentage of the carbon cost in the building material production and transportation stage gradually increases, but the percentage of carbon costs in the operational stage gradually decreases.

4.2. Discussion

According to the results or the analysis mentioned above, we can see that the operational stage accounted for the majority of the life cycle environmental impact, regardless of the means of expression (life cycle carbon emission or life cycle carbon cost). When considering the discount rate in calculating the carbon cost, the present value of any future environmental damage will be reduced and, thus, the percentage of the carbon cost in the operational stage is gradually decreasing.
Note that the case building is located in Xiamen City, Fujian Province, China, and the calculation of life cycle carbon emissions is based on China’s life cycle inventory database. However, the unit pollution damage cost of carbon emissions is adopted by EIB’s research results, which is based on the situation of European countries. Therefore, in view of the difference between China’s situation and the European situation, the validity of the life cycle carbon cost calculation results of the case building remains open to question. Further studies are required to explore the time-dependent unit pollution damage cost in China.
According to Equation (3), we can see that when the time-dependent environmental impact EC(t) is determined, the present value is only related to the discount rate. In this paper, the different discount rates (4%, 6%, and 8%) are used to analyze its effect on the present value of the carbon cost. However, the discount rate is directly related to inflation. Its selection should be determined according to the country’s social and economic development goals, development strategy, and other factors, and should reflect the impact of historical trends in the past period of time. Therefore, it is more reasonable to consider the discount rate as a variable, not a constant. The determination of the time-varying discount rate is one of the problems which requires thorough study.

5. Conclusions and Policy Proposals

In this paper, we explored a monetization method to convert the life cycle environmental impact into a life cycle environmental cost. In addition, by discounting, we attempted to solve the temporal issues involved in LCA. This method can facilitate decision-making when tradeoffs between current and future environmental impacts exist. Moreover, this method can be used as an effective supplement to life cycle cost and provide decision support for making trade-offs between cost and environmental impacts.

5.1. Conclusions

By conducting a carbon cost calculation of a residential building in Xiamen City, China, several concrete conclusions for the case building are drawn, as follows:
(1)
The operational stage accounted for the majority of the life cycle environmental impact, regardless of the means of expression (life cycle carbon emission or life cycle carbon cost).
(2)
With the increase of the discount rate, the carbon cost will decrease, except for the carbon cost in building material production and transportation stage. The reason is that a positive discount rate will reduce the present value of any future environmental damage, and the carbon cost in building materials production and transportation stage occurred in the initial year (t = 0); thus, this carbon cost is a present value, and will not change with the discount rate.
(3)
Carbon cost in the operational stage is the maximum, the building material production and transportation stage ranks second, and the amount in demolition stage is negligible, compared with the other three stages.
(4)
It is worth noting that with the increase in the discount rate, the percentage of the carbon cost in the building material production and transportation stage is gradually increasing, but the percentage of the carbon cost in operational stage is gradually decreasing.
Although a monetization method to analyze the life cycle environmental impact is presented and, by discounting, the temporal issues involved in LCA are attempted to be solved in this paper. Moreover, a residential building located in Xiamen City, China, is taken as an example to verify the effectiveness of the proposed method. However, there are still some shortcomings that remain to be improved, as described below.
(1)
In this paper, only carbon emissions were considered as the indicator of the environmental impact. It is advisable to investigate other environmental impacts, such as resource and energy consumption, ozone depletion, and eutrophication, etc. In addition, the unit pollution damage costs of different environmental impacts and their values as they change with time also need to be studied.
(2)
It is widely accepted that life cycle environmental impact is a function of space and time [48,49]. In this study, due to the lack of relevant data, a hybrid of the environmental impact data in China and the unit pollution damage cost of carbon emissions in European countries is used. Thus, the validity of the life cycle carbon cost calculation results of the case building remain open to question. Further studies are needed to explore the time-dependent unit pollution damage cost in China.
(3)
The discount rate is directly related to inflation. Its selection should be determined according to the country’s social and economic development goals, development strategy, and other factors, and should reflect the impact of historical trends in past time periods. Therefore, it is more reasonable to consider the discount rate as a variable, not a constant. The determination of the time-varying discount rate is one of the problems which requires thorough study.

5.2. Policy Proposals

Since the operational stage and the material production and transportation stage account for the majority of the life cycle carbon emissions and carbon costs of buildings, it is necessary to reduce the carbon emissions by policy instruments, as well as by using abatement technologies.
To reduce the carbon emissions and carbon costs in the material production and transportation stage of buildings, related policies should be formulated that encourage the use of green building materials to reduce the embodied carbon of materials. In addition, local materials should be recommended for use to reduce the transportation emissions and related carbon costs. The carbon emissions and carbon costs in the operational stage of buildings are directly related to the energy consumption and energy structure. Therefore, it is advisable to advocate the use of renewable energy to reduce carbon emissions [50]. Moreover, some market-based mechanisms, such as a carbon trading system, to put constraints on emissions for different market parties, should also be established [51].

Supplementary Files

Supplementary File 1

Conflicts of Interest

The author declares no conflict of interest.

References

  1. International Standards Organization (ISO). ISO 14040—Environmental Management-Life Cycle Assessment-Principles and Framework; International Organization for Standardization: Geneva, Switzerland, 2006. [Google Scholar]
  2. International Standards Organization (ISO). ISO 14044—Environmental Management-Life Cycle Assessment-Requirements and Guidelines; International Organization for Standardization: Geneva, Switzerland, 2006. [Google Scholar]
  3. Reap, J.; Roman, F.; Duncan, S.; Bras, B. A survey of unresolved problems in life cycle assessment Part 1: Goal and scope and inventory analysis. Int. J Life Cycle Assess. 2008, 13, 290–300. [Google Scholar] [CrossRef]
  4. Ferreira, S.; Cabral, M.; Da, C.N.; Simoes, P.; Marques, R.C. Life cycle assessment of a packaging waste recycling system in Portugal. Waste Manag. 2014, 34, 1725–1735. [Google Scholar] [CrossRef] [PubMed]
  5. Reap, J.; Roman, F.; Duncan, S.; Bras, B. A survey of unresolved problems in life cycle assessment Part 2: Impact assessment and interpretation. Int. J. Life Cycle Assess. 2008, 13, 374–388. [Google Scholar] [CrossRef]
  6. Bender, M.A.; Farach-Colton, M. The LCA problem revisited. In Proceedings of the Latin American Symposium on Theoretical Informatics, Punta del Esk, Uruguay, 10–14 April 2000; Springer: Heidelberg, Germany, 2000; pp. 88–94. [Google Scholar]
  7. Levasseur, A.; Lesage, P.; Margni, M.; Deschênes, L.; Samson, R. Considering Time in LCA: Dynamic LCA and Its Application to Global Warming Impact Assessments. Environ. Sci. Technol. 2010, 44, 3169–3174. [Google Scholar] [CrossRef] [PubMed]
  8. Kendall, A. Time-adjusted global warming potentials for LCA and carbon footprints. Int. J. Life Cycle Assess. 2012, 17, 1042–1049. [Google Scholar] [CrossRef]
  9. Jonsson, A.; Bjorklund, T.; Tillman, A.M. LCA of concrete and steel building frames. Int. J. Life Cycle Assess. 1998, 3, 216–224. [Google Scholar] [CrossRef]
  10. Kofoworola, O.F.; Gheewala, S.H. Environmental life cycle assessment of a commercial office building in Thailand. Int. J. Life Cycle Assess. 2008, 13, 498–511. [Google Scholar] [CrossRef]
  11. Chau, C.K.; Leung, T.M.; Ng, W.Y. A review on Life Cycle Assessment, Life Cycle Energy Assessment and Life Cycle Carbon Emissions Assessment on buildings. Appl. Energy 2015, 143, 395–413. [Google Scholar] [CrossRef]
  12. Huijbregts, M.A.; Guinée, J.B.; Reijnders, L. Priority assessment of toxic substances in life cycle assessment. III: Export of potential impact over time and space. Chemosphere 2001, 44, 59–65. [Google Scholar] [CrossRef]
  13. Hellweg, S.; Hofstetter, T.B.; Hungerbühler, K. Time-dependent life-cycle assessment of slag landfills with the help of scenario analysis: The example of Cd and Cu. J. Clean. Prod. 2005, 13, 301–320. [Google Scholar] [CrossRef]
  14. Hellweg, S.; Hofstetter, T.B.; Hungerbuhler, K. Discounting and the environment. Should current impacts be weighted differently than impacts harming future generations? Int. J. Life Cycle Assess. 2003, 8, 8–18. [Google Scholar]
  15. World Commission on Environment and Development (WCED). Our Common Future; Oxford University Press: Oxford, UK, 1987. [Google Scholar]
  16. Fabrycky, W.J.; Blanchard, B.S. Life-Cycle Cost and Economic Analysis; Prentice Hall: Upper Saddle River, NJ, USA, 1991. [Google Scholar]
  17. Fuller, S. Life-Cycle Cost Analysis (LCCA). Available online: https://www.wbdg.org/resources/life-cycle-cost-analysis-lcca (accessed on 19 March 2017).
  18. Gluch, P.; Baumann, H. The life cycle costing (LCC) approach: A conceptual discussion of its usefulness for environmental decision-making. Build. Environ. 2004, 39, 571–580. [Google Scholar] [CrossRef]
  19. Boardman, A.E.; Greenberg, D.; Vining, A.R.; Weimer, D.L. Cost-Benefit Analysis: Concepts and Practice, 2nd ed.; Prentice Hall: Upper Saddle River, NJ, USA, 2011. [Google Scholar]
  20. Fenwick, E.; Briggs, A.; O’Brien, B.J. Cost-Effectiveness Acceptability Curves. In Handbook of Disease Burdens and Quality of Life Measures; Springer: New York, NY, USA, 2010. [Google Scholar]
  21. Barrington-Leigh, C.; Behzadnejad, F. Evaluating the short-term cost of low-level local air pollution: A life satisfaction approach. Environ. Econ. Policy Stud. 2017, 19, 269–298. [Google Scholar] [CrossRef]
  22. Ferreira, S.; Cabral, M.; Jaeger, S.D.; Da Cruz, N.F.; Simoes, P.; Marques, R.C. Life cycle assessment and valuation of the packaging waste recycling system in Belgium. J. Mater. Cycles Waste Manag. 2015, 39, 1–11. [Google Scholar] [CrossRef]
  23. Carreras, J.; Boer, D.; Cabeza, L.F.; Jiménez, L.; Guillén-Gosálbez, G. Eco-costs evaluation for the optimal design of buildings with lower environmental impact. Energy Build. 2016, 119, 189–199. [Google Scholar] [CrossRef]
  24. Charlene, B.; Michael, G.; Surahbi, J. AIA Guide to Building Life Cycle Assessment in Practice. 2010. Available online: http://s3.amazonaws.com/zanran_storage/ www.aia.org/ContentPages/49630264.pdf (accessed on 9 April 2017).
  25. Bribián, I.Z.; Usón, A.A.; Scarpellini, S. Life cycle assessment in buildings: State-of-the-art and simplified LCA methodology as a complement for building certification. Build. Environ. 2009, 44, 2510–2520. [Google Scholar] [CrossRef]
  26. Kendall, A.; Keoleian, G.A.; Helfand, G.E. Integrated Life-Cycle Assessment and Life-Cycle Cost Analysis Model for Concrete Bridge Deck Applications. J. Infrastruct. Syst. 2008, 14, 214–222. [Google Scholar] [CrossRef]
  27. Li, X.D.; Wu, X.; Zhang, Z.H. Study on social WTP for environmental impacts based on the LCA theory. J. Harbin Inst. Technol. 2005, 37, 1501–1510. (In Chinese) [Google Scholar]
  28. Isacs, L.; Finnveden, G.; Dahllöf, L.; Håkansson, C.; Petersson, L.; Steen, B.; Swanstrom, L.; Wikstrom, A. Choosing a monetary value of greenhouse gases in assessment tools: A comprehensive review. J. Clean. Prod. 2016, 127, 37–48. [Google Scholar] [CrossRef]
  29. Kumar, S. Thermal–economic analysis of a hybrid photovoltaic thermal (PVT) active solar distillation system: Role of carbon credit. Urban Clim. 2013, 5, 112–124. [Google Scholar] [CrossRef]
  30. European Investment Bank (EIB). EIB Climate Strategy. Mobilising Finance for the Transition to a Low-Carbon and Climate-Resilient Economy; European Investment Bank: Luxembourg, 2015. [Google Scholar]
  31. European Investment Bank (EIB). The Economic Appraisal of Investment Projects at the EIB; European Investment Bank: Luxembourg, 2013. [Google Scholar]
  32. Farber, D.A.; Hemmersbaugh, P.A. The Shadow of the Future: Discount Rates, Later Generations, and the Environment. Vanderbilt Law Rev. 1993, 46, 267–304. [Google Scholar]
  33. Hall, K.T.; Correa, C.E.; Carpenter, S.H.; Elliott, R.P. Rehabilitation Strategies for Highway Pavements; Transportation Research Board of the National Research Council: Dallas, TX, USA, 2001. [Google Scholar]
  34. Allenby, B.R. Industrial Ecology: Policy Framework and Implementation, 1st ed.; Prentice Hall: Upper Saddle River, NJ, USA, 1998. [Google Scholar]
  35. Petcherdchoo, A. Repairs by fly ash concrete to extend service life of chloride-exposed concrete structures considering environmental impacts. Constr. Build. Mater. 2015, 98, 799–809. [Google Scholar] [CrossRef]
  36. Board of Governors of the Federal Reserve System. The Discount Rate [OL]. Available online: http://www.federalreserve.gov/monetarypolicy/discountrate.htm (accessed on 1 May 2015).
  37. Wang, F.; Li, D.; Wand, C.; Liu, Y.; Lin, Y. Construction Project Economic Evaluation Approaches and Parameters, 3rd ed.; China Planning Press: Beijing, China, 2008. [Google Scholar]
  38. Shao, X.P. Durability Research on the Jiaozhou Bay Bridge in Qingdao; China Communications Press: Beijing, China, 2013. [Google Scholar]
  39. Zhang, X.J. Study on Building’s Life Cycle Cost Considering Environmental Cost. Master’s Thesis, Beijing Jiaotong University, Beijing, China, 2015. (In Chinese). [Google Scholar]
  40. IKE Co. Ltd. CLCD-China Life Cycle Database. Available online: http://www.ike-global.com/archives/1094.html (accessed on 5 June 2012).
  41. Intergovernmental Panel on Climate Change (IPCC). 2006 IPCC Guidelines for National Greenhouse Gas Inventories. Available online: http://www.wmo.int/pages/prog/gcos/documents/Mitigation_IPCC_Guidelines_GHG_inventories_2006_Vol1_overview.pdf (accessed on 15 July 2012).
  42. NDRC. 2010 China Regional Power Grid Baseline Emission Factor [OL]. Available online: http://cdm.ccchina.gov.cn/WebSite/CDM/UpFile/File2552.pdf (accessed on 15 May 2012).
  43. Architectural Institute of Japan. LCA Pointer to the Buildings; Architectural Institute of Japan: Tokyo, Japan, 1999; Available online: http://www.aij.or.jp/aijhome.htm (accessed on 5 June 2012).
  44. Kishk, M.; Al-Hajj, A.; Pollock, R.; Bakis, N.; Aouad, G. Whole Life Costing in Construction: A State of the Art Review; RICS Foundation: London, UK, 2003. [Google Scholar]
  45. Ryall, M.J. Bridge Management; Butterworth-Heinemann: Oxford, UK, 2001. [Google Scholar]
  46. Rebitzer, G. Enhancing the Application Efficiency of Life Cycle Assessment for Industrial Uses. Int. J. Life Cycle Assess. 2005, 10, 446. [Google Scholar] [CrossRef]
  47. Helena, G. Sustainable Design and Integral Life-Cycle Analysis of Bridges. Ph.D. Thesis, Department de Engenharia Civil Faculdade Ciências e Tecnologia da Universidade de Coimbra, Institute for Sustainability and Innovation in Structural Engineering, Coimbra, Portugal, 2010. [Google Scholar]
  48. Dewulf, J.; Meester, S.D.; Alvarenga, R.A.F. Time-Dependent Life-Cycle Assessment of Bio-Based Packaging Materials: Sustainability Assessment of Renewables-Based Products: Methods and Case Studies; John Wiley & Sons: Hoboken, NJ, USA, 2015. [Google Scholar]
  49. Potting, J.; Schöpp, W.; Blok, K.; Hauschild, M. Site-Dependent Life Cycle Impact Assessment of Acidification. J. Ind. Ecol. 1998, 2, 63–87. [Google Scholar] [CrossRef]
  50. Wang, Z.; Zhao, J.; Li, M. Analysis and optimization of carbon trading mechanism for renewable energy application in buildings. Renew. Sustain. Energy Rev. 2017, 73, 435–451. [Google Scholar] [CrossRef]
  51. Lu, Y.; Cui, P.; Li, D. Carbon emissions and policies in China’s building and construction industry: Evidence from 1994 to 2012. Build. Environ. 2016, 95, 94–103. [Google Scholar] [CrossRef]
Figure 1. Quantity and occurrence time of carbon emission.
Sustainability 09 00922 g001
Figure 2. Percentage of the carbon cost in different stages.
Sustainability 09 00922 g002aSustainability 09 00922 g002b
Table 1. Pollution damage costs by impacted region [26].
Pollutant NameAverage Cost (2003 $US/t)
UrbanUrban FringeRuralGlobal
Particulate Matter61442750800/
Nitrogen Oxides1566519/
Sulfur Dioxides1708821/
Carbon Monoxide210/
Lead39552059480/
VOC196019601960/
Carbon dioxide///21
Nitrous oxide///7112
Methane///384
Table 2. Summary of carbon emissions in Stage 1.
TypesQuantitiesCarbon Emission Factors [40]Carbon Emissions (t)
Materials ProductionTransportationTotal
Concrete5831.02 m3561.7 kg/m33275.2841.633316.91
Reinforcement881.64 t3.5 kg/kg3085.742.623088.36
Block2110.28 m3156.9 kg/m3331.105.02336.12
Total 6692.1249.276741.39
Table 3. Summary of carbon emissions in stage 2 [40].
Construction TechnologyEarthwork ExcavationEarthwork Leveling upCrane HandlingHorizontal TransportationLightingConcrete PouringTotal
Unitm3m3m2t·kmm2m3-
Quantities6859.87932.38186.16230.512,594.8913,061.48-
Pi3.510.9561.76.115.40.91-
Carbon emissions (t)24.0110.16104.5338.01193.9611.89382.56
Table 4. Carbon emission factors of fossil energy (kg CO2-e/kg) [41].
TypesStandard CoalRaw CoalCleaned CoalCokeCrude OilMotor GasolineAviation Gasoline
C E i 20.081.481.872.953.233.513.54
TypesKeroseneDieselFuel oilNatural gasLiquefied petroleum gasCoke oven gasRefinery gas
C E i 3.273.683.752.363.780.842.80
Table 5. Carbon emission factors of regional power grid (t CO2-e/MWh) [42].
Northern ChinaNortheastEastern ChinaNorthwestCentral ChinaSouth ChinaHainan
C E i 0.99141.11090.85921.08710.99470.97620.7972
Table 6. Annual carbon emissions in operational stage.
QuantitiesCarbon Emission FactorsCarbon Emissions (t)
Tap water12,706.2 t0.213 kg/t [27]2.71
Electricity consumption305,209.62 kWh0.9762 kg/kWh [42]297.95
Natural gas4069.26 m32.36 kg/kg [41]7.01
Total--307.77
Table 7. Carbon emissions in different life cycle stages of the case building.
Life Cycle StageCarbon Emissions (t)Percentage
Stage 16741.3929.89%
Stage 2382.561.70%
Stage 3 (Annual)307.77/
Stage 3 (Total)15,388.5068.24%
Stage 438.260.17%
Table 8. Carbon cost calculation result (EUR).
Carbon Cost (EUR)Discount Rate
Life Cycle Stage 4%6%8%
Stage 133,706.9533,706.95(–)33,706.95(–)
Stage 22072.672013.92(–58.75)1958.06(–114.61)
Stage 3101,563.8962,276.79(–39,287.10)41,328.29(–60,235.603)
Stage 4268.0297.66(–170.36)36.26(–231.76)
Total137,611.5498,095.33(–39,516.21)77,029.57(–60,581.97)
Note: The values in brackets refer to the variation calculated by the discount rates of 6% and 8% when comparing with the discount rate of 4%, respectively.

