Article

Quantitative Research on Regional Ecological Compensation from the Perspective of Carbon-Neutral: The Case of Hunan Province, China

1
School of Resource, Environmental, and Safety Engineering, Hunan University of Science and Technology, Xiangtan 411201, China
2
Hunan Software Vocational Institute, Xiangtan 411100, China
3
South China Institute of Environmental Science, MEP, Guangzhou 510655, China
*
Author to whom correspondence should be addressed.
Sustainability 2017, 9(7), 1095; https://doi.org/10.3390/su9071095
Submission received: 7 April 2017 / Revised: 13 June 2017 / Accepted: 19 June 2017 / Published: 23 June 2017

Abstract

:
The reduction in CO2 emissions is very important, as highlighted by the issue of global climate warming. As a developing country, China has great differences in regional economic development, which makes it necessary to implement the ecological compensation of regional carbon emissions to coordinate the relationship between regional economic development and environmental protection. Using the ecological system in Hunan Province, China as the research object, this study analyzed and calculated the carbon emissions and carbon sequestration across different industries and different regions of Hunan using ArcGIS and theoretical model calculation methods. Quantitative research on region ecological compensation was undertaken by establishing the ecological compensation coefficient and ecological compensation model based on the carbon-neutral principal. The results showed that there were significant differences in carbon sources and carbon sequestration in the different cities. Out of all the cities investigated, Changsha had the highest carbon emissions and Huaihua had the largest carbon sequestration. In terms of per capita, Xiangtan had the highest carbon emissions and Zhangjiajie had the largest carbon sequestration. Through the quantification of carbon compensation in the cities of Hunan, we found that Changsha, Zhuzhou, Xiangtan, Hengyang, Yueyang, and Loudi were in a state of ecological deficit, and should pay an amount of ecological compensation, respectively. Meanwhile, the other eight cities (Shaoyang, Changde, Zhangjiajie, Yiyang, Chenzhou, Yongzhou, Huaihua, and Xiangxi) were in a state of ecological surplus; they could receive some ecological compensation, respectively. Our results will provide a reference for areal carbon trading and ecological compensation mechanisms as significant instruments and measures to realize payment for environmental resource services.

1. Introduction

One of the most important environmental problems faced by human beings today is global climate change, which includes the importance of carbon emissions in the current global state. Currently, there are no doubts as to the influence of carbon emissions on global warming and the environmental consequences that this has on our planet [1]. Therefore, reducing carbon emissions is an important task for every country and, in response, various measures have been taken by international communities to reduce carbon sources and increase the amount of carbon sequestration. Thus, carbon compensation has come into being. In recent years, research has been conducted not only in calculating carbon sources and carbon sequestration in different fields, and the methods and technologies of decreasing carbon sources and increasing carbon sequestration, but also on the principles, standards, and models of carbon compensation. These studies have made beneficial explorations into establishing models and methods of carbon compensation and have provided relevant ideas and methods for related countries to conduct carbon compensation. Nevertheless, there has been relatively more progress from foreign-related research on carbon compensation; for example, Australia and New Zealand were the first to develop and implement carbon neutral regimes early on, followed by the UK and Canada, who adopted carbon offset policies. The Guidance on Carbon Neutrality (which provides guidelines for the three stages of carbon emission calculation, reduction, and elimination) has proposed a government quality assurance mechanism (QAS) for carbon offsets that can review and guarantee the quality of the credits, thus providing effective information and guidance for organizations and individuals who want to achieve carbon neutrality [2]. Furthermore, practices on carbon compensation have achieved good results, such as the grassland and pastoral ecosystem compensation project in Nicaragua [3], the environmental quality incentive program in the USA [4], and the Payment for Environmental Services (PES) project initiated by the World Bank in Latin American countries [5].
As a party to the Kyoto Protocol and the United Nations Framework Convention on Climate Change, China has been working positively to reduce emissions of carbon dioxide and other greenhouse gases to mitigate global warming, and it was announced that China intends to decrease its CO2 emissions per unit of GDP by 60–65% (based on 2005 levels) by 2030 in its Intended Nationally Determined Contributions, described in Reference [6]. Specifically, with the green development concepts and clear targets for carbon emission reduction presented in the 12th Five-Year Plan, the development of a low-carbon economy and green construction have become the basic policies of our country, and the provinces have put forward clear requirements for low-carbon economic development in succession. In the Research on Framework of Chinese Carbon Balance Trading report, carbon was clearly set as a rigid index to monitor, identify, and regulate economic activities. It also proposed the establishment of a Chinese carbon fund and Chinese ecological compensation system, and recommended that a carbon emission-carbon sequestration trading system be implemented at the provincial level in China [7]. However, only a few pilot sites of the carbon trading market currently exist in China, with most of them are in the embarrassing situation of being a market without transactions due to the few voluntary carbon emission transactions in the exchanges. This situation is not only due to the lack of legal protection, but also it has a great relationship with the lack of Chinese carbon emission estimation system and compensation mechanism [8].
At present, there are few studies on carbon compensation in China, with most of them aimed towards certain fields such as agriculture, forestry, and land use. For example, Li [9] studied the agricultural carbon sequestration function and its compensation mechanism, and concluded that as food crops played a role in carbon sequestration, farmers should receive a certain amount of ecological compensation. Ding [10] researched the theoretical framework of carbon emission estimation and carbon compensation mechanisms in rural tourist sites, and analyzed the carbon emission structure in eco-agricultural parks [10]. Furthermore, most regional carbon compensation studies have been confined to theoretical and institutional explorations. To achieve the goals of interregional carbon neutral and green development by taking regional carbon compensation measures, quantitative research on regional carbon compensation is required, and these studies are relatively few [11,12]. Nowadays, with the requirement of regional carbon emission reduction in China, the problems between regional environmental relations and economic development are becoming more serious. It is a pressing and worthwhile issue to consider how carbon compensation can be used to realize regional low carbon operations and the fair development between different regions and economic entities [13]. Thus, it is necessary to conduct research on the regional carbon emission compensation mechanisms in China.
Based on the principle of carbon neutrality, this paper attempts to estimate the carbon emissions of different cities in Hunan Province and quantify ecological compensation by establishing a mesoscale model of regional ecological compensation. Furthermore, we propose methods of conducting ecological compensation, which provides scientific references for regional carbon control and carbon compensation.

2. Methodology and Data

2.1. Establishment of the Regional Ecological Compensation Model

Ecological compensation scales include the macroscopic scale, mesoscale, and microcosmic scales. The macroscopic scale includes different areas and countries in the world; the mesoscale includes different provinces, cities, and towns in a country; and the microcosmic scale includes specific enterprises, families, etc. [14].
From a mesoscale perspective and using cities in Hunan Province as the research objects, we determined whether cities in Hunan Province should pay or receive ecological compensation by analyzing their carbon sources, carbon sequestration, and ecological compensation standard. The values of compensation were quantified by establishing the model of regional ecological compensation [11], as shown in Equation (1).
Mi = Li × l × r
where Mi is the amount of ecological compensation region i should pay or receive; Li is the standard of eco-compensation region i should pay or receive; l is the ecological compensation coefficient; and r is the price of carbon units.

2.2. Determination of Regional Ecological Compensation Standards

Based on the theory of carbon neutrality, a regional ecological compensation standard was judged by analyzing the carbon emissions and carbon sequestration of each region to obtain the net carbon sequestration of each area. If the net carbon sequestration was more than 0, it indicated that the area should receive a certain amount of ecological compensation, otherwise it needed to pay an amount of ecological compensation, as shown in Equation (2).
Li = |Sci − Eci|
where Li is the net carbon sequestration in region i; when Li is 0, this means that this region neither pays nor receives any amount of ecological compensation. Sci is the carbon sequestration of the ecosystem in region i, that is, the amount of carbon sequestration. This is mainly manifested on the photosynthesis of green vegetation in the ecosystem, which fixes the CO2 in the air, and Eci is the carbon emissions of ecosystem in region i. There are two ways to calculate carbon emissions: (1) only the greenhouse gases emitted by human activities are calculated, which is currently used by the Intergovernmental Panel on Climate Change (IPCC) [15]; and (2) the ecosystem is used as the research object, which includes the emission of greenhouse gases from both human activities and natural systems. To research carbon sources, most studies have only considered carbon emissions from the aspect of energy by using the method the IPCC adopted from the macroscopic view; the impacts of humans, natural biological respiration, and industrial production on carbon emissions have not been discussed. From within a meso-regional scope, this paper studied the carbon compensation of cities in Hunan Province, and sources of carbon emission from natural ecosystems were fully considered, which meant that carbon emissions were calculated not only from energy, but also from humans, biological respiration, industry production, and other activities. Therefore, this paper adopted the second above mentioned approach, using cities in Hunan Province as independent ecological systems.

2.2.1. Analysis of Carbon Sequestration

Based on the distribution and size of different vegetation types in cities in Hunan Province (obtained from a remote sensing image of land cover in Hunan Province in 2015), combined with research on different carbon sequestration vegetation in China, the main carbon sequestration vegetation in this study area was identified as forests, shrubs, grasslands, wetlands, and farmlands. Next, the carbon density of the different vegetation types was multiplied by the corresponding area to calculate the carbon sequestration (Equation (3)).
S ci = j = 1 j = 5 ( M ij × V ij )
where Sci is the capacity of carbon sequestration in region i, in other words, the total amount of carbon sequestration in area i; Mij is the area (hm2) of vegetation j in region i; and Vij is the carbon density of vegetation j, indicating the amount of carbon sequestration per year per area. The forest carbon density was 51.7 t/hm2∙a−1 [16]. Wetland vegetation included mainly swamps and aquatics; based on that, the carbon density of marsh and aquatic vegetation was ascertained to be 35.05 t/hm2∙a−1 and 5.38 t/hm2∙a−1, respectively, by averaging the carbon density of the Dongting Lake and Huarong East Lake wetlands from a few studies on wetland carbon density in Hunan Province [17]. The carbon density of shrubs was 6.6 t/hm2∙a−1, calculated by taking the average density of sparse and closed shrubs. The carbon density of grassland and farmland was 3.46 t/hm2∙a−1 and 5.7 t/hm2∙a−1, respectively [18].

2.2.2. Analysis of Carbon Emissions

Most carbon sources include fossil fuel combustion, industrial production, biomass biochemical, soil respiration, and human respiration. Due to the overall balance between the production and consumption of biomass fuels, the carbon dioxide produced by combustion and the carbon absorbed by photosynthesis during the growth process are roughly offset, so we did not consider those carbon emissions [19].
(1) Carbon emissions from fossil energy consumption.
Fossil energy consumption is the most important source of CO2 emissions. In this study, based on the characteristics of Hunan Province and combined with the approach recommended by the IPCC, the consumption of different energies was converted into amounts of standard coal to calculate for carbon emissions (Equation (4)).
E cn = Q n   × F n + Q e × F e   ( Q n = A × K ,    Q e = B × K )
where Ecn is the carbon emissions from regional energy consumption; Qn is the amount of regional energy consumption (which was converted into the amount of standard coal); A is the energy consumption per unit of GDP (which was converted into the amount of standard coal); K is the regional GDP; and Fn is the carbon emission coefficient of standard coal. Based on the carbon emission coefficient of different energy sources, the carbon emission coefficient of standard coal was confirmed as 0.5101 [20]. Qe is the regional electricity consumption; B is the regional electricity consumption of per unit of GDP; and Fe is the coefficient of electricity carbon emission, which was determined as 1.50627, as per the factor of provincial average carbon emissions from Chinese power grids in 2015.
(2) Carbon emissions from industrial production processes.
Accounting for more than 90% of the greenhouse gas emissions from industrial processes, only carbon emissions from cement, steel, pig iron, and calcium carbide were considered in this study [21]. In addition, cement clinker accounted for 65% of the total cement [22]. The calculation is shown as Equation (5).
E ci = m = 1 m = 4 ( Q im × F im )
where Eci is the carbon emissions from industrial processes; Qim is the industrial production; and Fim is the carbon emission factor of the corresponding industrial product. The carbon emission factor of cement, steel, pig iron, and calcium carbide was 0.0954, 0.0025, 0.0410, and 0.3147, respectively [19].
(3) Carbon emissions from human and livestock respiration.
Calculation formula:
E cb = ( Q p × C p + t = 1 t = 2 ( Q at × C at ) ) × 12 / 44
where Ecb is the total carbon emissions from both human and livestock respiration. Qp is the resident population in each city in Hunan; CP is the carbon dioxide emission coefficient of human respiration; and Qat is the number of animals at the end of stocks in each city in Hunan. Considering that small livestock have little effect on carbon emissions, this paper only considered cattle and pigs as they are the main large livestock in Hunan Province. Cat is the carbon dioxide emission coefficient of the corresponding livestock, and the carbon dioxide emission coefficients of human, cattle, and pigs were 0.079 t/a, 0.796 t/a, and 0.082 t/a, respectively [23]. Finally, 12/44 represents the amount of carbon dioxide converted into carbon (the same below).
(4) Carbon emissions from soil respiration.
The formula is:
E cs = j = 1 j = 5 ( R sj × M sj ) × 12 / 44
where Ecs is the carbon emissions from soil respiration; Rsj is the average soil respiration rate of different vegetation; and Msj is the soil area of different vegetation. Based on the literature, the mean soil respiration rates of different vegetation types such as forests, grasslands, farmlands, shrubs, lakes, and reservoirs were determined to be 7.6411 t/hm2∙a−1, 2.8233 t/hm2∙a−1, 4.6872 t/hm2∙a−1 [24], 5.67 t/hm2∙a−1 [25], 2.56 t/hm2∙a−1, and 8.21 t/hm2∙a−1, respectively [23].
It is generally assumed that plant root respiration accounts for 30–60% of total soil respiration, and this fraction of carbon is already included in the respiration of the plant community. Therefore, the amount of carbon dioxide emission from soil respiration in the atmosphere should be equal to that of the amount of carbon dioxide emission from soil respiration minus that from root respiration when calculating the carbon balance of terrestrial ecosystems. Here, taking the intermediate valve, the ratio of root respiration to total soil respiration was 45% [26].

2.3. Determination of Carbon Price and Ecological Compensation Coefficient

The unit price of carbon sequestration is RMB/t (carbon). Most commonly, two methods have been used to calculate the value of fixed CO2. The first method calculates the cost of afforestation, which is based on the relationship between the absorption of CO2 and the cost of afforestation. The other method is based on the carbon tax rate. Combined with the shadow price per unit of carbon sinks in our country (calculated by Zhang) and the carbon tax price (used in the research on the quantification of the regional ecological compensation by Guanghui Yu), this study set the value of the unit price at 66.7 RMB/t [11,27].
Initially, L presents the coefficient of ecological value in the development stage, which expresses the willingness of people to pay for ecological values under different socioeconomic levels and living standards. Thus, the coefficient in the development stage is indicative of the relative levels of people’s willingness to pay for ecological values at various stages of development. Currently, the Peal growth curve is widely used as a standard model to estimate the coefficient of ecological value in the development stage; however, the Peal growth curve model is suitable for the characteristics of developed stages, and China is still in a stage of development. Therefore, multiple estimation models of the coefficient of ecological value in the development stage that China has been in were put forth by Bu Jinfeng in her theoretical research and comparative study of the stages of ecological value development in China and abroad [28]. Combined with the Engel coefficient of Hunan Province in 2015 (42.4%), this paper adopted the estimated model where the Engel coefficient was between 50% and 30%, as shown in Equation (8).
l = L 1 + e ( t 8 / 3 )
where l is the ecological compensation coefficient. L is the compensation capacity, which equals the ratio of per capita GDP in region i to per capita GDP in the research area in 2015 [11]; e is the base of the natural logarithms; and t is the reciprocal of the Engel’s coefficient.

2.4. Overview of the Study Region and Data Sources

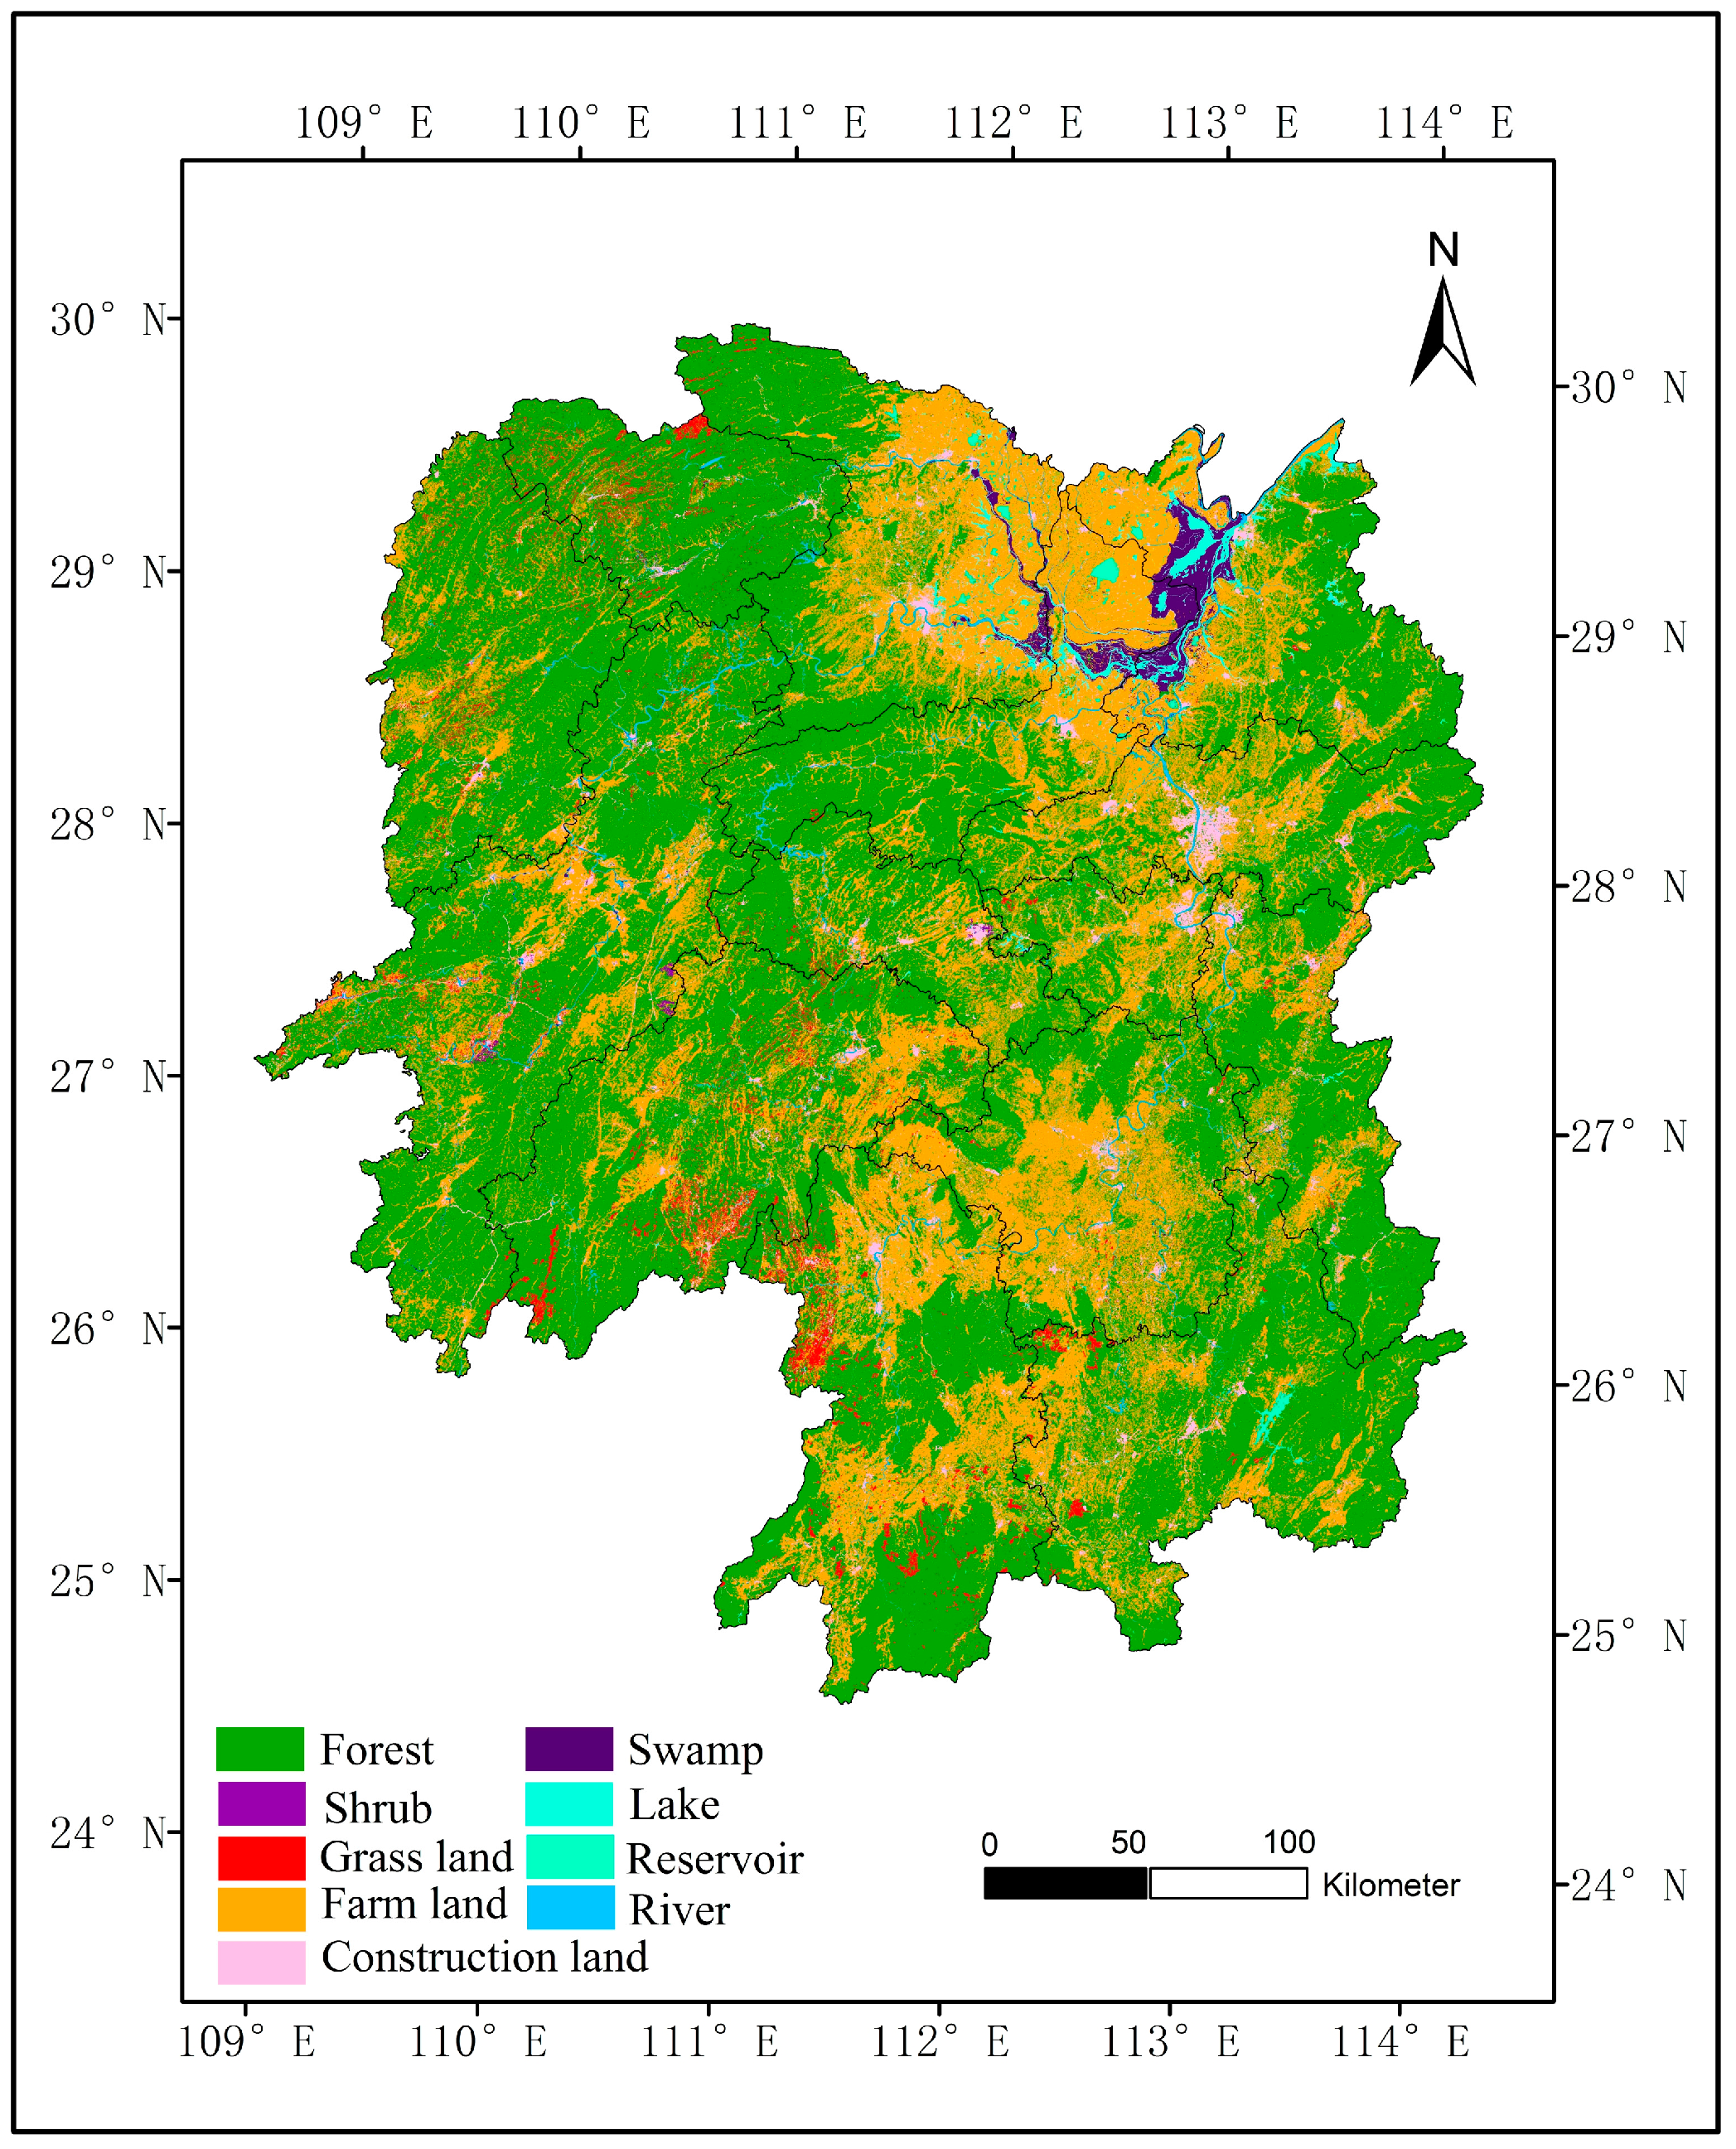
2.4.1. Overview of the Study Region

Hunan Province is located in the middle of China, where the middle reaches of the Yangtze River are surrounded by Jiangxi, Chongqing, Guizhou, Guangdong, Guangxi, and Hubei, which includes Changsha, Zhuzhou, Xiangtan, Hengyang, Yueyang, Loudi, Shaoyang, Changde, Yiyang, Chenzhou, Yongzhou, Huaihua, and Xiangxi. With a land area of 211,800 km2, the total population of Hunan Province was 66,290,000 people in 2015. The different types of land and its utilization in Hunan Province in 2015 are shown in Figure 1.

2.4.2. Data Sources and Data Processing Methods

The 2015 consumption data of coal, petroleum, natural gas, electricity and other energies, GDP, regional population, and regional Engel coefficient were obtained from the Energy Statistical Yearbook and Statistical Yearbook of Hunan; and the factor of power carbon emissions was adopted from the China Power Grid.
To obtain the property data of different vegetation, the remote sensing image data (TM Landsat 7) covering Hunan Province in 2015 were processed using ArcGIS and other technology. Furthermore, cloud-free images from July to September were selected to obtain the vegetation area data. First, the images were subjected to geometrical correction and coordinate processing to ensure that the registration of different vegetation spatial positions had an error not exceeding two to three pixels. Other remote sensing image preprocessing followed, including band combination, image fusion, image enhancement, image mosaic, and image clipping. Once achieved, the images were input into the ArcGIS system, and through human-computer interaction interpreting, the area data of different types of vegetation were retrieved. After that, the superposition and merging functions in ArcGIS were used to acquire the attribute data (combined with the administrative regions of cities in Hunan Province) before we obtained the different vegetation area data for each city. Finally, the EXCEL PivotTable function was used to superimpose the same type vegetation area in each city before the area data of the different vegetation in each city in Hunan Province was obtained.

3. Results

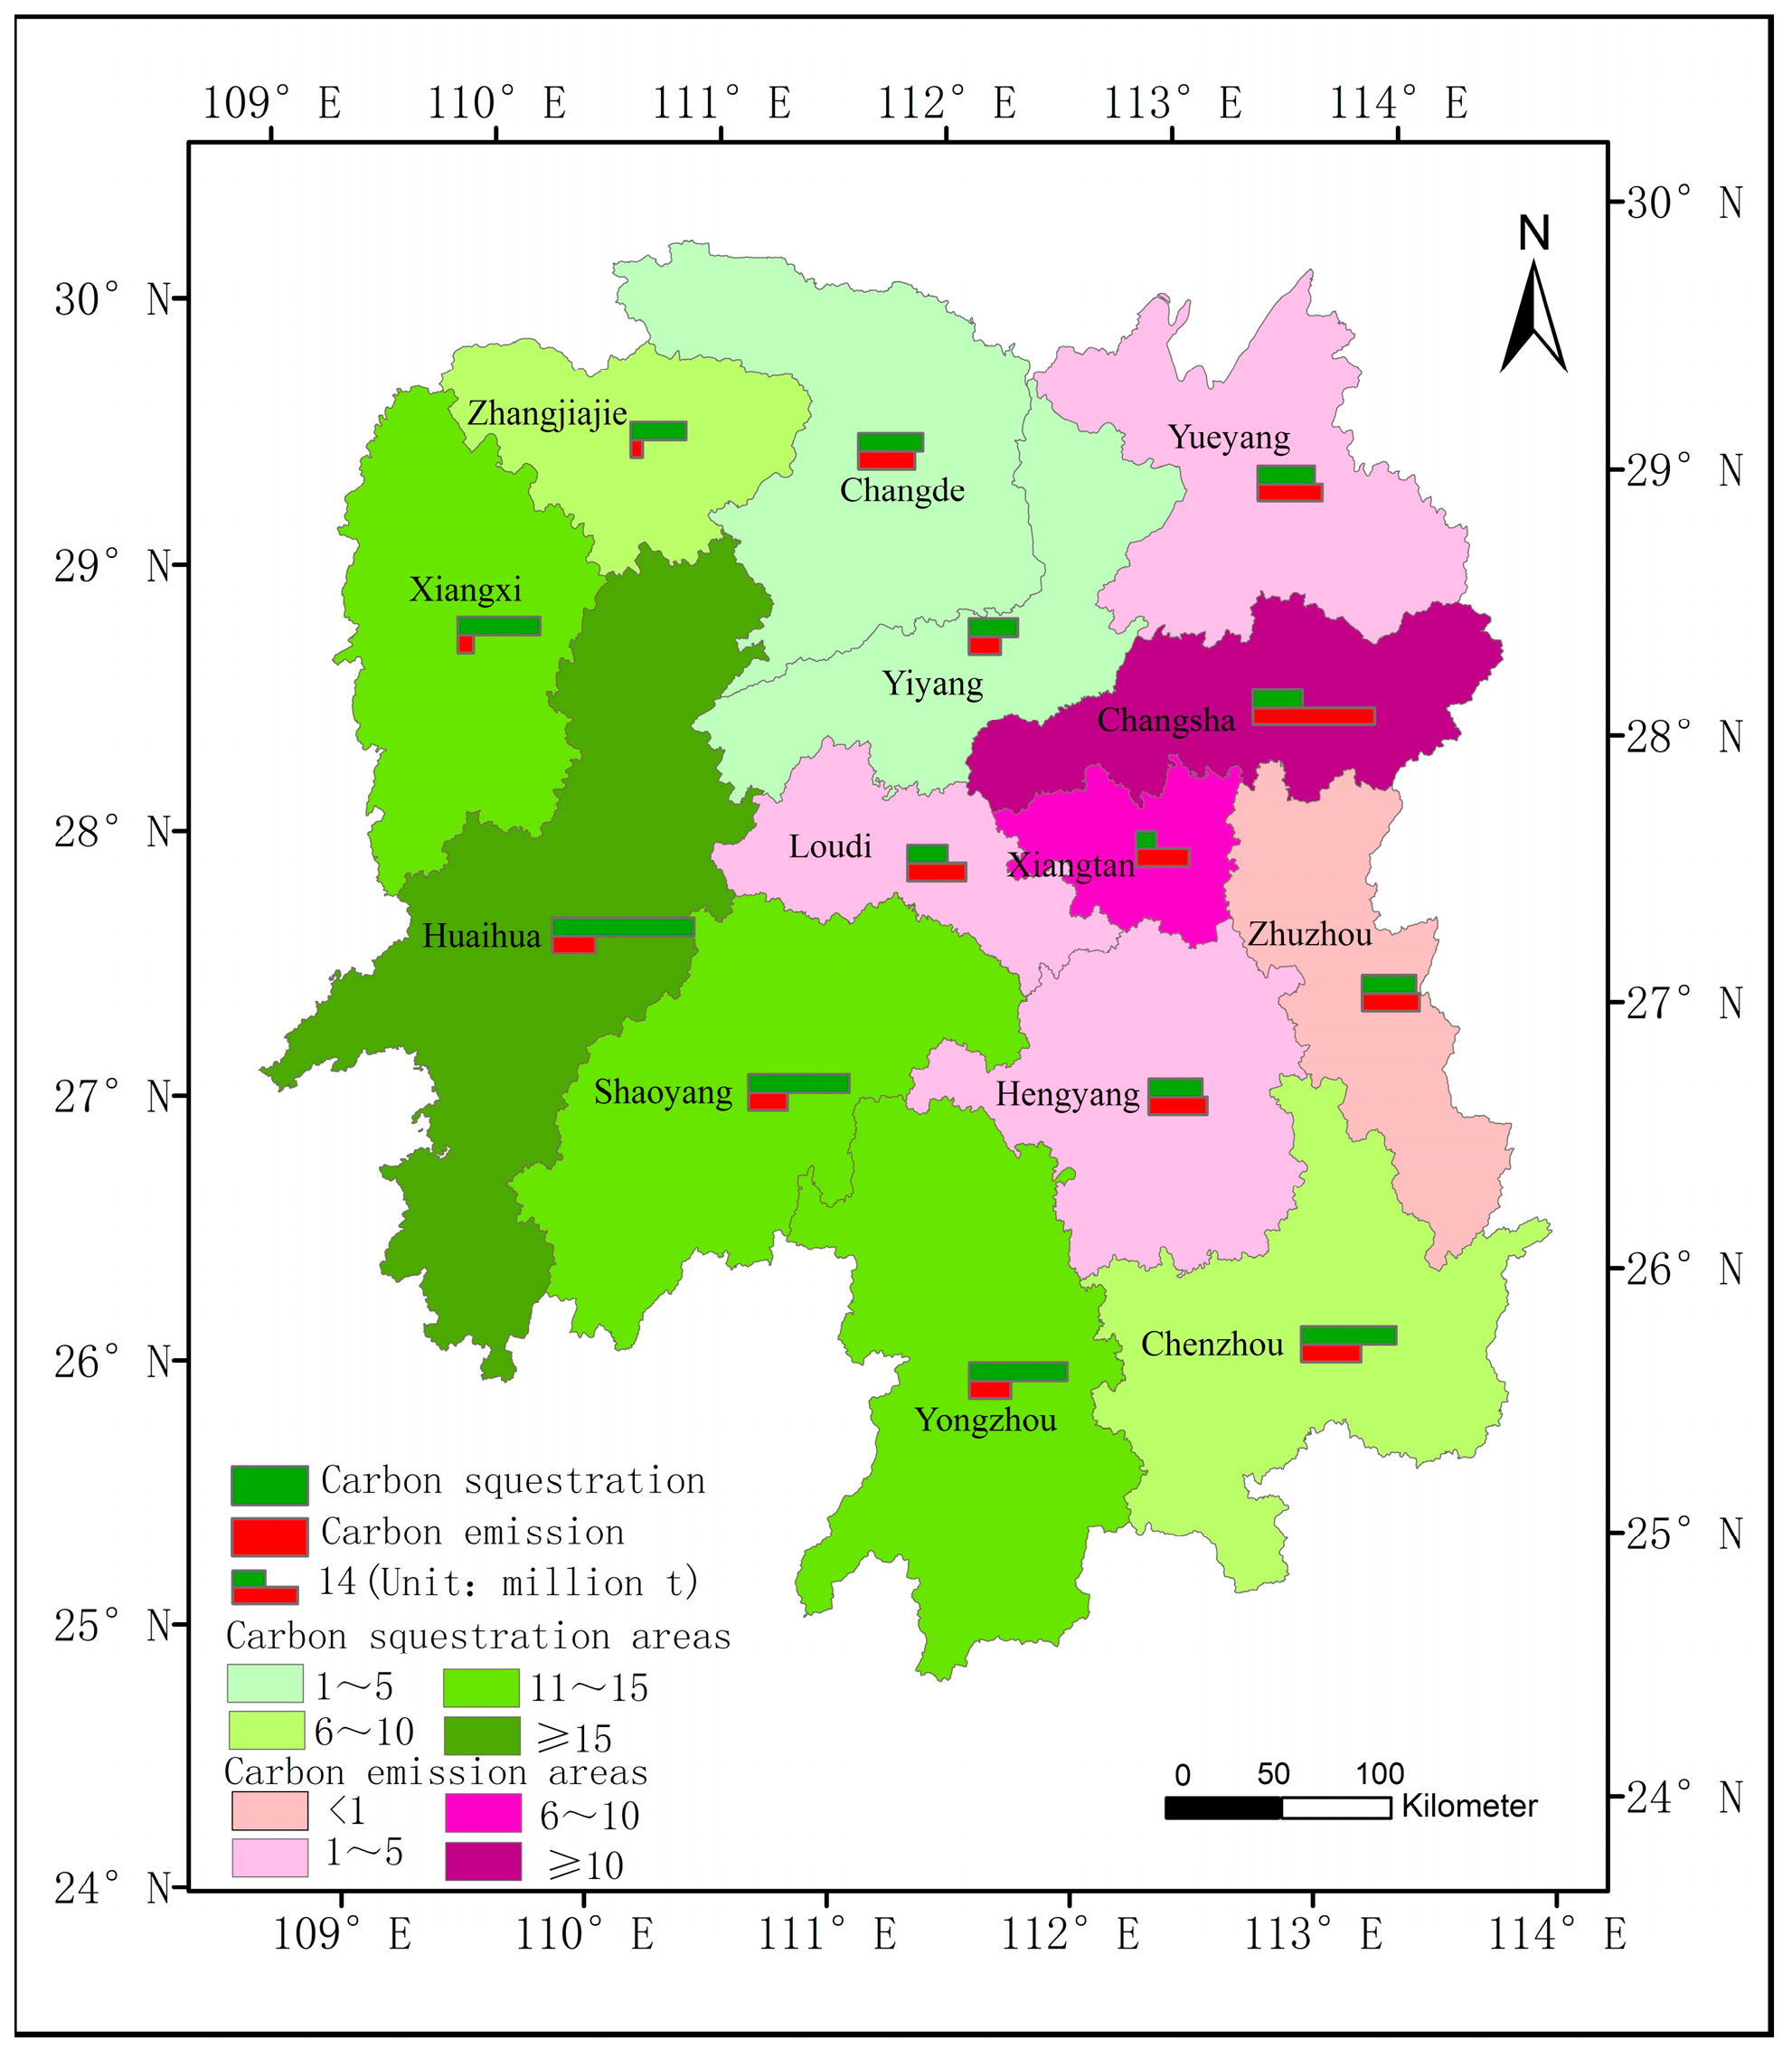
3.1. Carbon Sequestration

The results of carbon sequestration in each city (from Equation (3)) are shown in Table 1. From this, we could see that among the different vegetation types, the largest contributors to carbon sequestration in Hunan Province are forests, accounting for 83–96% of the total carbon sequestration of each city. From each city’s total point of view, the order from high to low was Huaihua, Shaoyang, Yongzhou, Chenzhou, Xiangxi, Changde, Yueyang, Zhangjiajie, Hengyang, Changsha, Yiyang, and Loudi. Huaihua had the largest carbon sequestration with an amount 7.2 times that of Xiangtan. However, in terms of per capita carbon sequestration in these cities, the order from high to low was Zhangjiajie, Xiangxi, Huaihua, Chenzhou, Yongzhou, Shaoyang, Zhuzhou, Yiyang, Changde, Loudi, Yueyang, Hengyang, Xiangtan, and Changsha.

3.2. Carbon Emissions

As shown in Table 2, the amount of carbon emissions from the sources of energy, electricity, soil respiration, human and animal respiration, and industrialization in the cities of Hunan Province were different. Furthermore, the total carbon emissions were quite different between each city. Of all the cities in Hunan Province, Changsha had the largest amount of carbon emissions from both energy and electricity sources, which was more than 18 times and 13.5 times, respectively, to those in Zhangjiajie. The largest contributor of carbon emissions from soil respiration was Huaihua, followed by Yongzhou, and the smallest was Xiangxi as the city with the least emissions from industrialization. Furthermore, Changsha had the largest number of carbon emissions from industrialization, with a difference of 18 times that of Xiangxi. In terms of carbon emissions from people and livestock respiration, Yongzhou had the largest and Zhangjiajie the least. Regarding the total carbon emissions in the cities, the order from high to low was Changsha, Yueyang, Chenzhou, Hengyang, Loudi, Zhuzhou, Changde, Xiangtan, Huaihua, Yongzhou, Shaoyang, Yiyang, Xiangxi, and Zhangjiajie. In addition, of all the cities in Hunan, the total carbon emissions in Changsha was 10.2 times that in Zhangjiajie. For per capita carbon emissions, the order from high to low was Xiangtan, Changsha, Loudi, Zhuzhou, Chenzhou, Yueyang, Changde, Huaihua, Hengyang, Zhangjiajie, Yongzhou, Yiyang, Xiangxi, and Shaoyang.

3.3. Quantization of Ecological Compensation

The net carbon emissions of cities in Hunan Province were calculated using Equation (2), revealing that Changsha, Zhuzhou, Xiangtan, Hengyang, Yueyang and Loudi were carbon emission areas, and Shaoyang, Changde, Zhangjiajie, Yiyang, Chenzhou, Yongzhou, Huaihua and Xiangxi were carbon sequestration areas (Figure 2).
Next, as per the compensation model (Equation (1)) and the data from the above tables, the ecological compensation of the cities in Hunan Province were calculated (Table 3). The results indicated that Changsha, Zhuzhou, Xiangtan, Hengyang, Yueyang, and Loudi were areas with an ecological deficit in Hunan Province, with values of ecological compensation totaling RMB 1121.47 million; RMB 29.19 million; RMB 247.18 million; RMB 24.03 million; RMB 51.11 million, and RMB 75.37 million, respectively. In terms of per capita compensation, the value of ecological compensation for Changsha was RMB 159, which was the highest out of these cities, and the lowest was Hengyang at only RMB 3. Meanwhile, the other eight cities, Shaoyang, Changde, Zhangjiajie, Yiyang, Chenzhou, Yongzhou, Huaihua, and Xiangxi, were in a state of ecological surplus. The amount of ecological compensation they could receive was RMB 151.89 million; RMB 49.71 million; RMB 165.39 million; RMB 68.23 million; RMB 195.01 million; RMB 191.55 million; RMB 335.28 million, and RMB 190.12 million, respectively. In terms of per capita compensation, Zhangjiajie should receive RMB 112, which was the highest and Changde had the lowest compensation value of RMB 9.

4. Conclusions

Due to the influence of economic levels, environmental resources, construction situations, ecological protection and other factors, carbon emissions and carbon sequestration were quite different across the cities in Hunan Province. The cities with carbon sources were Changsha, Zhuzhou, Xiangtan, Hengyang, Yueyang, and Loudi, which are located in the central and eastern regions of Hunan. Using the Changsha-Zhuzhou-Xiangtan economic sector as the center, its neighboring cities Hengyang, Yueyang, and Loudi formed a large contiguous carbon emission area, among them, the provincial capital Changsha had carbon emissions ranked first in the Province. However, in the carbon source areas, the production of carbon emissions was more than their carbon sequestrations, causing carbon overflow. This overflow of carbon was absorbed directly by adjacent carbon sequestration areas, so as the beneficiaries of the environment, they are required to pay compensation. In contrast, the carbon sequestration cities (Shaoyang, Changde, Zhangjiajie, Yiyang, Chenzhou, Yongzhou, Huaihua and Xiangxi) are mainly distributed in the northwestern, western, and southern parts of Hunan Province, like a ring surrounding the carbon source area. As their carbon absorption is greater than the amount of carbon emissions, the carbon sequestration areas not only absorb their own carbon, but also the overflow carbon from the carbon source areas. Therefore, these cities, as opposites to carbon source cities, belong to ecological protectors, who should be compensated accordingly. Furthermore, these results were in accordance with the current situation of Hunan Province, and the amount of carbon compensation quantified by the compensation model could be accepted as per the economic level of each city.
This study realized the regional quantification of carbon compensation. Not only did it provide the theoretical and technical basis to realize carbon trading and carbon emission management of great practical significance towards achieving green construction for Hunan Province, it also provided references on carbon emission reduction for other regions. Fair development could be realized in Hunan Province by giving corresponding economic compensation to the carbon-sequestration functional regions from the high-carbon emission areas through the regional carbon offset. Therefore, this study could be used by China’s other provinces to achieve regional carbon trading and ecological compensation. However, if this method extended to other countries, several parameters inside the model may be influenced by the local economic development and the willingness to pay. Still, if there are reasonable adjustment parameters, the overall research ideas could be used for regional carbon trading and regional ecological compensation models elsewhere. Of course, according to foreign carbon compensation systems and the effectiveness of related practical projects, to achieve the regional carbon balance and carbon emissions reduction (in addition to quantifying the carbon compensation with the application of this model) related policies of compensation implementation are required. Specific measures could be considered from the following points. First, establish and improve regional carbon offset compensation systems and mechanisms, and set up agencies for regional ecological compensation calculation, collection, distribution, and management to ensure that ecological compensation activities are operational. Second, require the regions to establish carbon files, launch campaigns of national carbon reduction education, and enhance awareness of carbon storage and carbon compensation. Third, formulate inter-regional ecological compensation policies, laws and rules, confirming the absolute attribute of carbon emission rights from the legal level, which provides principle, compensation discipline, procedures, and implementation rules for inter-regional ecological compensation activities. Finally, establish inter-regional ecological compensation institutions with the mandates of supervision, consultation, and sanctions, which are responsible for supervising the parties involved in ecological compensation behaviors and timely sanctioning against violations and illegal acts to ensure that ecological compensation activities can be carried out smoothly. Through the above steps, the promotion of the coordination of environmental and economic development in different regions will ensure the fairness of regional environmental and economic development, and achieve a regional reduction in carbon emissions.

Acknowledgments

The authors would like to acknowledge the financial support of National Planning Office of Philosophy and Social Science through National Social Science Fund, Project 15BSH038.

Author Contributions

Guanghui Yu, Di Liu, Xiuying Liao, Ting Wang, Qianjin Tian and Yan Liao conceived and designed the experiments; Guanghui Yu, Di Liu and Xiuying Liao performed the experiments; Guanghui Yu and Di Liu constructed the model, analyzed the data and wrote the paper; Xiuying Liao and Ting Wang contributed analysis tools and analyzed the data. Qianjin Tian and Yan Liao revised the paper.

Conflicts of Interest

The authors declare no conflict of interest.

References

  1. Luis, M.C.; Rosario, D. CO2 Emissions reduction and energy efficiency improvements in paper making drying process control by sensors. Sustainability 2017, 9, 514. [Google Scholar] [CrossRef]
  2. Department of Energy & Climate Change. Guidance on Carbon Neutrality. 2009. Available online: https://www.waddensea-forum.org/images/archive/co2/carbon%20neutrality%20guidance.pdf (accessed on 15 February 2016).
  3. Stefano, P.; Elias, R.; Jose, G.; Cees, D.H.; Muhammad, I.; Enrique, I.; Juan, P.R. Paying for the environmental services of silvo pastoral practices in Nicaragua. Ecol. Econ. 2007, 64, 374–385. [Google Scholar] [CrossRef]
  4. Qin, Y.H.; Kang, M.Y. A review of ecological compensation and its improvement measures. Nat. Resour. Res. 2007, 22, 557–567. [Google Scholar]
  5. Thomas, L.D.; Jules, P. Case study of agri-environmental payments: The United Kingdom. Ecol. Econ. 2008, 65, 765–775. [Google Scholar] [CrossRef]
  6. Mi, Z.F.; Zhang, Y.K.; Guan, D.B.; Shan, Y.L.; Liu, Z.; Cong, R.G.; Yuan, X.C.; Wei, Y.M. Consumption-based emission accounting for Chinese cities. Appl. Energy 2016, 184, 1073–1081. [Google Scholar] [CrossRef]
  7. Zhang, Z. China will promote the province as a unit of low-carbon trading. China Electric Power News, 20 November 2008. [Google Scholar]
  8. Zhao, Z.M.; Zhu, Y.Z.; Wang, X.; Wang, W. Analysis of fundamental condition on constructing Chinese carbon market. Ecol. Econ. 2011, 10, 70–72. [Google Scholar]
  9. Li, Y. Study on Agricultural Carbon Sink Function and Compensation Mechanism—Taking Alimentarn Crop as an Example. Ph.D. Thesis, Shandong Agricultural University, Tai’an, China, 2014. [Google Scholar]
  10. Ding, Y.L. Estimation of Carbon Emissions and Carbon Compensation in Rural Tourism Areas under the Carbon Neutrality Perspective: A Case Study of Hong Village in Anhui South Area and Daxu County in Hefei. Ph.D. Thesis, Nanjing Normal University, Nanjing, China, 2015. [Google Scholar]
  11. Yu, G.H.; Geng, J.J.; Zhou, P.C.; Zhu, J.W.; Li, Z.G. Quantitative research of regional ecological compensation based on carbon balance—Take zhaoshan demonstration area of changzhutan green heart as an example. Resour. Environ. Yangtze Basin 2012, 21, 455–459. [Google Scholar]
  12. Sun, X.B.; Fu, X.L.; Ni, J.H.; Zhao, T. Intensity of carbon emissions and ecological compensation in the city ecology circle in Anhui province. Areal Res. Dev. 2012, 31, 135–138. [Google Scholar]
  13. Zhao, R.Q.; Liu, Y.; Li, Y.X.; Ding, M.L.; Zhang, Z.P.; Chuan, X.W.; Jiao, S.X. Overview of regional carbon compensation: Mechanism, pattern and policy suggestions. Areal Res. Dev. 2015, 34, 116–120. [Google Scholar]
  14. Chen, Y.Q.; Gao, W.S. How to determine the payment amount of ecological compensation: Based on the theories and methods of ecological economics. Syst. Eng. Theory Pract. 2007, 4, 165–170. [Google Scholar]
  15. IPCC. Climate Change 2007; IPCC: Valencia, Spain, 2007. [Google Scholar]
  16. Xu, B.; Guo, Z.D.; Piao, S.L.; Fang, J.Y. Biomass carbon stocks in China’s forests between 2000 and 2050: A prediction based on forest biomass-age relationships. Chin. Sci. 2010, 40, 587–594. [Google Scholar] [CrossRef] [PubMed]
  17. Wu, X.L. The Research on Basic Ecological Functions of Huarong East Lake National Wetland Park. Master’s Thesis, Central South University Forestry and Technology, Changsha, Hunan, China, 2014. [Google Scholar]
  18. Li, K.R.; Wang, S.Q.; Cao, M.K. Vegetation and soil carbon storage in China. Chin. Sci. 2003, 33, 72–80. [Google Scholar] [CrossRef]
  19. National Development and Reform Commission, Climate Division. Guidelines for the Preparation of Provincial Greenhouse Gas Inventories; National Development and Reform Commission, Climate Division: Beijing, China, 2011.
  20. Jiang, J.H. An evaluation and decomposition analysis of carbon emissions in China. Resour. Sci. 2011, 33, 597–604. [Google Scholar]
  21. Bai, B.; Li, XC.; Liu, YF.; Zhang, Y. Preliminary study on CO2 industrial point sources and their distribution in China. Chin. J. Rock Mech. Eng. 2006, 25, 2918–2923. [Google Scholar]
  22. Zhao, J.N.; Wei, D.Q. Carbon emission factors for cement plants in China. Resour. Sci. 2013, 35, 800–808. [Google Scholar]
  23. Xiao, H.J.; Kuang, Y.Q.; Huang, N.S.; Zhu, Z.Y.; Liu, Y.; Tang, J.L. Variation of the carbon budget in Guangzhou during its rapid industrialization course. Ecol. Environ. 2006, 15, 1209–1215. [Google Scholar]
  24. Zhan, X.Y.; Yu, G.R.; Zheng, Z.M.; Wang, Q.F. Carbon emission and spatial pattern of soil respiration of terrestrial ecosystems in China: Based on geostatistical estimation of flux measurement. Prog. Geogr. 2012, 31, 97–108. [Google Scholar]
  25. Peng, J.Y. Roles of vegetation on balance of carbon and oxygen in the Pearl River Delta. J. Sun Yatsen Univ. (Nat. Sci. Ed.) 2003, 42, 105–108. [Google Scholar]
  26. Wang, R.S. Modern Ecology of the Hot Issues: Volume one; Science and Technology China Press: Beijing, China, 1996; pp. 240–250. [Google Scholar]
  27. Zhang, Y.; Wu, L.L.; Su, F.; Yang, Z.G. An accounting model for forest carbon sinks in China. J. Beijing For. Univ. 2010, 32, 194–200. [Google Scholar]
  28. Bu, J.F. Study on Domestic and Abroad Development Stage Coefficient of the Ecological Value. Master’s Thesis, Beijing Technology and Business University, Beijing, China, 2006. [Google Scholar]
Figure 1. Different types of land cover in Hunan Province in 2015.
Sustainability 09 01095 g001
Figure 2. Net carbon emissions in cities of Hunan Province in 2015.
Sustainability 09 01095 g002
Table 1. Carbon sequestration in different cities of Hunan (Unit: t).
RegionForestShrubGrasslandWetlandFarmlandTotal SequestrationPer Capita Sequestration
Changsha34,871,512.81011.620,716.344,047.92,272,215.310,148,046.51.44
Zhuzhou38,374,735.4191,322.439,896.7111,092.81,567,814.410,986,780.52.85
Xiangtan13,531,033.847.110,838.436,988.11,105,519.34,004,843.71.46
Hengyang35,419,408.9352,793.124,069.5272,405.53,939,503.610,911,322.01.53
Shaoyang72,115,678.3146,799.3342,405.836,123.6 2,896,979.820,601,269.12.91
Yueyang35,503,194.71158.819,391.34,093,574.02,904,254.811,596,792.82.12
Changde42,251,170.81456.733,036.61,465,248.04,458,025.813,147,892.22.30
Zhangjiajie40,569,770.52563.0203,912.4149,750.4455,583.911,285,885.57.64
Yiyang31,401,776.7421.35653.32,570,169.02,594,110.59,974,217.52.32
Chengzhou67,718,938.6143,905.968,263.2280,223.92,792,590.619,364,706.04.22
Yongzhou68,797,262.324,093.7300,957.351,404.63,993,158.919,954,602.83.84
Huaihua102,295,401.29195.9169,697.796,879.83,556,425.828,943,891.06.10
Loudi28,581,961.313.128,737.916,726.21,199,598.68,134,646.52.15
Xiangxi59,466,950.75024.0199,437.79601.21,832,903.216,776,522.76.58
Table 2. Carbon emissions in different cities of Hunan (Unit: t).
RegionEnergyElectricitySoil RespirationIndustrial ProductionPeople/Livestock RespirationTotal EmissionsPer Capita Emissions
Changsha19,158,700.83,246,460.11,065,134.6 1,395,886.6 30,674.8 24,896,857.0 3.54
Zhuzhou8,275,916.31,852,740.41,079,832.7 511,536.1 34,462.0 11,754,487.4 3.05
Xiangtan7,611,215.81,760,162.7442,971.9 917,210.1 11,037.8 10,742,598.3 3.90
Hengyang7,991,405.21,859,191.91,323,755.8 711,183.4 54,992.6 11,940,529.0 1.67
Shaoyang4,336,880.5950,590.92,022,868.8 501,945.8 137,926.2 7,950,212.0 1.12
Yueyang9,854,605.61,657,685.81,211,160.1 342,683.9 94,520.8 13,160,656.1 2.40
Changde6,938,950.71,999,132.51,556,250.0 898,242.4 99,289.5 11,491,865.0 2.01
Zhangjiajie1,062,488.9240,760.1981,279.1 109,942.5 35,681.1 2,430,151.8 1.64
Yiyang3,829,540.7930,220.91,054,972.3 563,310.8 68,934.3 6,446,978.9 1.50
Chengzhou7,686,654.51,831,571.01,898,423.2 745,308.3 71,815.7 12,233,772.7 2.67
Yongzhou4,605,033.71,054,777.02,068,127.2 557,017.5 182,704.1 8,467,659.4 1.63
Huaihua3,941,968.11,340,496.82,730,647.8 708,361.4 115,638.0 8,837,112.0 1.86
Loudi7,983,601.91,991,047.0787,622.0 1,056,151.4 82,850.2 11,901,272.6 3.14
Xiangxi1,867,319.21,093,971.092,734.5 77,237.7 72,362.1 3,203,624.4 1.26
Table 3. Quantization of ecological compensation for different cities in Hunan.
RegionSequestration (10,000 t)Emissions (10,000 t)Net Emissions (10,000 t)Compensation CoefficientPrice of Unit Carbon (RMB/t)Amount of Compensation (RMB Million)Per Capita Compensation (RMB)
Changsha1014.80 2489.69 −1474.88 1.1466.7−1121.47−159
Zhuzhou1098.68 1175.45 −76.77 0.5766.729.19−8
Xiangtan400.48 1074.26 −673.78 0.5566.7−247.18−90
Hengyang1091.13 1194.05 −102.92 0.3566.7−27.03−3
Shaoyang2060.13 795.02 1265.11 0.1866.7151.8921
Yueyang1159.68 1316.07 −156.39 0.4966.7−51.11−9
Changde1314.79 1149.19 165.60 0.4566.749.719
Zhangjiajie1128.59 243.02 885.57 0.2866.7165.39112
Yiyang997.42 644.70 352.72 0.2966.768.2316
Chengzhou1936.47 1223.38 713.09 0.4166.7195.0143
Yongzhou1995.46 846.77 1148.69 0.2566.7191.5537
Huaihua2894.39 883.71 2010.68 0.2566.7335.2871
Loudi813.46 1190.13 −376.66 0.30 66.7−75.37−20
Xiangxi1677.65 320.36 1357.29 0.2166.7190.1275

