Article

Assessment of China’s Mitigation Targets in an Effort-Sharing Framework

1
Academy of Chinese Energy Strategy, China University of Petroleum-Beijing, Beijing 102249, China
2
Institute of Energy, Environment and Economy, Tsinghua University, Beijing 100084, China
*
Author to whom correspondence should be addressed.
Sustainability 2017, 9(7), 1104; https://doi.org/10.3390/su9071104
Submission received: 24 April 2017 / Revised: 23 June 2017 / Accepted: 23 June 2017 / Published: 25 June 2017
(This article belongs to the Section Environmental Sustainability and Applications)

Abstract

:
Nationally Determined Contributions (NDCs) are a core component for post-2020 global climate agreements to achieve the 2 °C goal in addressing climate change. In the NDC, China has declared to lower carbon intensity by 60–65% from the 2005 level by 2030 and achieve the peak of CO2 emissions around 2030. In the context of the 2 °C goal, this study assesses China’s CO2 mitigation targets in the NDC using fair ranges of emissions allowances as calculated from an effort-sharing framework based on six equity principles (and cost-effectiveness). Results show that understanding the fairness of China’s NDC would rely heavily on selected equity principles. If the 65% target is implemented, China’s NDC would position within full ranges of emissions allowances and align with responsibility–capacity–need based on comparisons in 2030, and with responsibility–capacity–need and equal cumulative per capita emissions based on comparisons during 2011–2030. Implications of the NDC on China’s long-term CO2 mitigation targets beyond 2030 are also explored, which indicate that China’s energy system would need to realize carbon neutrality by 2070s at the latest in the scenarios in this study.

1. Introduction

The Fifth Assessment Report (AR5) of the Intergovernmental Panel on Climate Change (IPCC) has confirmed that global climate change has been an extremely severe challenge faced by humanity [1]. Climate change is mainly characterized as global warming, which is near-linearly correlated with cumulative CO2 emissions released into the atmosphere globally [2,3]. The international community has recognized that all countries must collaborate constructively to reduce anthropogenic emissions. The United Nations Framework Convention on Climate Change (UNFCCC) has established various guiding principles to cope with climate change, especially including the principles of equity and common but differentiated responsibilities and respective capabilities. Although the equity principle has been elaborated in various climate decisions, what it explicitly indicates remains debatable in political negotiations [4]. Based on diverse equity understandings and methodologies, a broad spectrum of effort-sharing schemes (e.g., contraction and convergence, equal cumulative emissions per capita, greenhouse development rights) has been proposed in the literature since the Kyoto Protocol [5,6,7]. These schemes would like to promote worldwide satisfactory efforts and avoid the tragedy of the atmosphere as a global commons. However, the lack of a commonly agreed interpretation of equity principles has resulted in the tendency of countries to select effort-sharing schemes that are favorable to them, and has failed to provide a specific solution to split global mitigations across countries.
With increasing adverse impacts and vulnerability observed, it is really urgent and imperative for humans to tackle climate change. The world requires a new agreement to avoid inextricable equity bargaining and promote broad participations. To this end, a bottom-up mitigation mechanism emerged during the 2009 Copenhagen Conference. In the bottom-up structure, each country individually proposes mitigation contributions in light of a package of considerations such as development need, responsibility, capability, technology progress, and international supports. To establish global governance and accelerate mitigations for the post-2020 period, an increasing number of parties have gradually formulated their respective targets and measures they intend to take, in terms of the Warsaw Outcome and the Lima Call for Action. These ambitions are the so-called Intended Nationally Determined Contributions (INDCs). Responding to the call for INDC submissions, over 190 countries and regions had already submitted their INDCs by May 2017 (when a country ratifies the Paris Agreement, its INDC turns into an NDC).
As the largest developing country (per capita GDP was only about $8000 in 2015), China has been involved in the fight against global climate change. In 2009, China pledged to lower carbon intensity (CO2 emissions per unit of GDP) by 40–45% from the 2005 level by 2020. In the US-China Joint Announcement on Climate Change in 2014, China committed to achieve the peak of CO2 emissions (energy-related) around 2030 and make best efforts to peak early. At the end of June 2015, China officially submitted the INDC to the UNFCCC secretariat (since China ratified the Paris Agreement in 2016, its INDC turned into an NDC), where a comprehensive package of policies and measures was proposed to achieve the peak target and lower carbon intensity by 60–65% from the 2005 level by 2030 (this is referred to as the 60–65% targets in this study). In the Paris Agreement, all parties to the UNFCCC have agreed on an overarching goal to hold “the increase in the global average temperature to well below 2 °C above pre-industrial levels and to pursue efforts to limit the temperature increase to below 1.5 °C above pre-industrial levels” [8]. In light of the 2 °C goal, it is essential that all countries provide fair and ambitious contributions in reducing emissions [9]. As the largest CO2 emitter and energy consumer, China’s mitigation targets would have a significant effect on global emissions trajectories. Thus, China providing fair and ambitious contributions is deemed important to retain the possibility of keeping global warming well below 2 °C.
Although identifying an explicit resolution of climate equity or fairness is still difficult under the UNFCCC at present, a basic set of shared equity principles does exist and has been applied in sharing mitigation efforts [10]. The IPCC AR5 [11] has grouped existing effort-sharing schemes into six categories, according to specific interpretations of equity principles on which they are based, including responsibility, capability, equality, responsibility–capability–need, equal cumulative per capita emissions, and staged approaches. In general, the responsibility category allocates mitigations directly based on countries’ historical contributions to warming; the capability category frequently relates reductions to different abilities to pay for mitigations; the equality category provides allocations based on immediate or converging per capita emissions; the responsibility-capability-need category combines responsibility, capability and sustainable development need to allocate mitigations; the equal cumulative per capita emissions category allocates equal cumulative emissions rights to individuals across the world; the staged approaches category differentiates countries’ commitments into various stages. Besides the six categories based on specific equity principles, the IPCC AR5 has also listed another category called “cost-effectiveness”, which uses allocations emerging from an equal carbon tax worldwide. Although cost-effectiveness is not considered as a convincible ethical argument in the literature, it has been often used as a reference to compare other allocations [10,11].
The six categories have been used to highlight all plausible equity principles or fairness arguments to share efforts in the international community [10,11]. Hence, allocations resulting from these effort-sharing categories could facilitate in providing ranges and boundaries of countries’ fair contributions in the future [12,13]. Current climate negotiations have focused on countries’ mitigation targets in the INDCs. Even in the absence of a commonly accepted effort-sharing scheme, comparing the INDCs with allocations as calculated from an effort-sharing framework, is still worthwhile to clarify whether and to what degree countries’ INDCs meet their fair contributions aroused by different equity principles, and, illustrate some guidance in the considerations of ratcheting-up ambitions. In this sense, this study assesses China’s NDC mitigation targets against various effort-sharing principles and schemes under the 2 °C goal. In the literature, some studies have analyzed China’s emissions allowances under different schemes and scenarios [14,15,16], however, few studies have systematically shed light on the compatibility between its NDC and 2 °C-consistent contributions. The endeavor of this study might facilitate a comprehensive understanding of the fairness of China’s NDC.

2. Methods

2.1. Effort-Sharing Framework

The process of combating climate change has resulted in a sequence of effort-sharing schemes proposed in the literature, which have projected quite varied emissions allowances (or carbon budgets) allocations among countries [17,18,19,20]. This is in large part because the concept of distributive equity or fairness, which is central to any effort-sharing scheme, has been hitherto ambiguous and controversial [21]. Climate equity or fairness is usually explained in an ethical perspective (e.g., egalitarian, sovereignty, horizontal, vertical, polluter pays) [22]. A number of studies have tried to discuss and compare emissions allowances calculated from multiple effort-sharing schemes [23,24,25], which have been assessed in the IPCC AR4 [26] and AR5 [11]. Nevertheless, the intricate ethical debates and value judgments surrounding effort-sharing in political negotiations [27,28,29] have made it complex to compare existing schemes and rank them in an explicit order acknowledged by all parties to the UNFCCC. For instance, industrialized countries may select allocations based on emissions status quo, whereas developing countries may select allocations based on differentiated responsibilities. To facilitate comparisons, the IPCC AR5 has developed a categorization of schemes into seven categories (six equity-based categories plus cost-effectiveness, as we have mentioned) [10,11]. However, even in the same category, there is still generally no evidence to determine which schemes are exactly fairer than others, or which schemes are strictly dominated by others.
In that there is currently no consensus on the superiority of a unique effort-sharing principle and scheme in climate decisions (i.e., providing a clearly acknowledged definition for fair allocations seems impractical at present) [22], this study builds an effort-sharing framework by incorporating an extensive variety of schemes, as presented in Table 1 (some schemes may have different variations). It is noted that all these schemes have been to some degree suggested as equitable paradigms by certain equity interpretations or fairness arguments in the literature. Based on the survey of literature, the framework has covered most important effort-sharing schemes and ideas in the international community (details and associated equity arguments of these schemes can be quickly found in comparative assessment studies of effort-sharing schemes [30,31,32]).
This framework has also covered all the categories of effort-sharing schemes in the IPCC AR5 (it is noted that, in this study, we would mainly focus on the first six equity-based categories but still present cost-effectiveness as a reference, in order to ensure consistency with the categorization of the IPCC AR5), thereby indicating it would be expected to properly highlight fair ranges of China’s possible emissions allowances for meeting the 2 °C goal. The resulting ranges could thus constitute appropriate benchmarks from the equity or fairness perspective to compare and assess the fairness of China’s NDC. This study largely follows Pan et al. [44] (which provided a summary of key formulas to model different effort-sharing schemes) to calculate and operate the effort-sharing framework (main sources of implementations are also included in Table 1).

2.2. Scenario and Data

The choice of global emissions pathways might be significant for China’s emissions allowances by 2030 in the context of 2 °C [11]. In this study, the global emissions pathway associated with representative concentration pathway 2.6 (RCP2.6), which is widely treated as one of those “likely” (> 66% chance) pathways towards the 2 °C goal [45], is primarily employed to shape global trajectory in the future (sensitivity of pathways will be discussed in Section 4). Following RCP2.6, global CO2 emissions in 2030 are about 20% below 2010 levels. Numerous studies [10,46] have distributed global carbon budgets applying one or several effort-sharing schemes at the regional level (for instance, dividing the world into 5 or 10 regions). Different from those studies, this study will implement allocations directly among around 190 countries. Under the 2 °C goal, global mitigation targets are quite stringent. In this case, we believe, a disclosure of disparities among countries within the same region, would be important to appropriately identify emissions allowances for large emitters such as China (especially in the schemes considering gradual participations of countries).
The choice of baseline scenarios might also affect China’s calculated emissions allowances [10]. In this study, the baseline is primarily obtained from the Global Change Assessment Model (GCAM) (the version 4.0) (http://www.globalchange.umd.edu/gcam) (sensitivity of baseline scenarios will be discussed in Section 4). GCAM, which is mainly developed by the Joint Global Change Research Institute, is a dynamic recursive model that has participated in a sequence of model inter-comparison exercises. With 2010 as the base year, it runs from 2010 to 2100. All integrated assessment models, including GCAM (the 4.0 version divides the world into 32 regions [47], where most of the influential parties such as China and the United States are individual regions), are developed at the regional level. To implement national-level allocations, countries’ population projections in the future are obtained from the GCAM4.0 scenario following their population proportions in the median-fertility case of the United Nations Population Prospects (https://esa.un.org/unpd/wpp/). Then countries’ GDP (as expressed in market exchange rate (MER) in GCAM4.0) and baseline emissions projections are downscaled from the same scenario using the assumption of convergence of per capita GDP and emissions intensity [48,49] within each GCAM4.0 region by 2100, respectively. Although downscaling still has several weaknesses, the technique could provide credible national-level data in a transparent and consistent manner [49]. Certain uncertainties exist in historical emissions across different datasets. This study obtains the national-level historical CO2 emissions from the Climate Analysis Indicators Tool (http://cait.wri.org), which shows a good comparability with China’s official emissions data [50].

2.3. Parameterization

In this study, allocations of emissions allowances primarily start from 2011 (the base year of GCAM4.0 is 2010) to 2050. When implementing allocations, any pledge or INDC is set aside. For parameterization of effort-sharing schemes, it is noted that there is generally no consensus on how the value of each parameter should be set at present (in theory, the value could be set freely by users). This study largely follows the method proposed in Pan et al. [51] to set allocation parameters. That is, values of parameters either come from the original literature proposing the scheme, or are calibrated to fit into a global emissions trajectory close to RCP2.6. For transparency, Table 2 lists the values of key parameters (which are used in multiple schemes). For example, historical emissions are counted from 1850 with no discount; the threshold to determine developing countries’ participations (through per capita GDP) is 30% of the Annex I countries’ average per capita GDP (in MER) in 1990; per capita emissions across countries are assumed to converge by 2050.
The effort-sharing methodology has been built upon a vast number of previous studies (such as papers listed in Table 1). Compared with them, this study contributes in effort-sharing as follows: (1) more effort-sharing schemes are included. That is, most major schemes in the international community, covering all the categories in the IPCC AR5, are considered to constitute fair ranges of China’s emissions allowances; and (2) improved consistency for comparison. That is, all schemes are quantified in the same scenario, and take the same set of historical emissions and parameters for allocations, indicating the calculated emissions allowances across schemes would be more comparable.

3. Results

In accordance with China’s NDC, this study considers CO2 emissions (energy-related). The NDC emissions coupled to intensity improvement targets critically depend on GDP growths, implying actual emissions in China by 2030 would be uncertain and fluctuant. In that emissions allowances are calculated based on the GCAM4.0 scenario, the GDP prediction in GCAM4.0, where the average annual growth rate is projected as 6.5% before 2020 and 5.2% in 2020–2030, is immediately adopted to estimate China’s NDC emissions levels in 2030 (sensitivity of GDP growths will be discussed in Section 4).

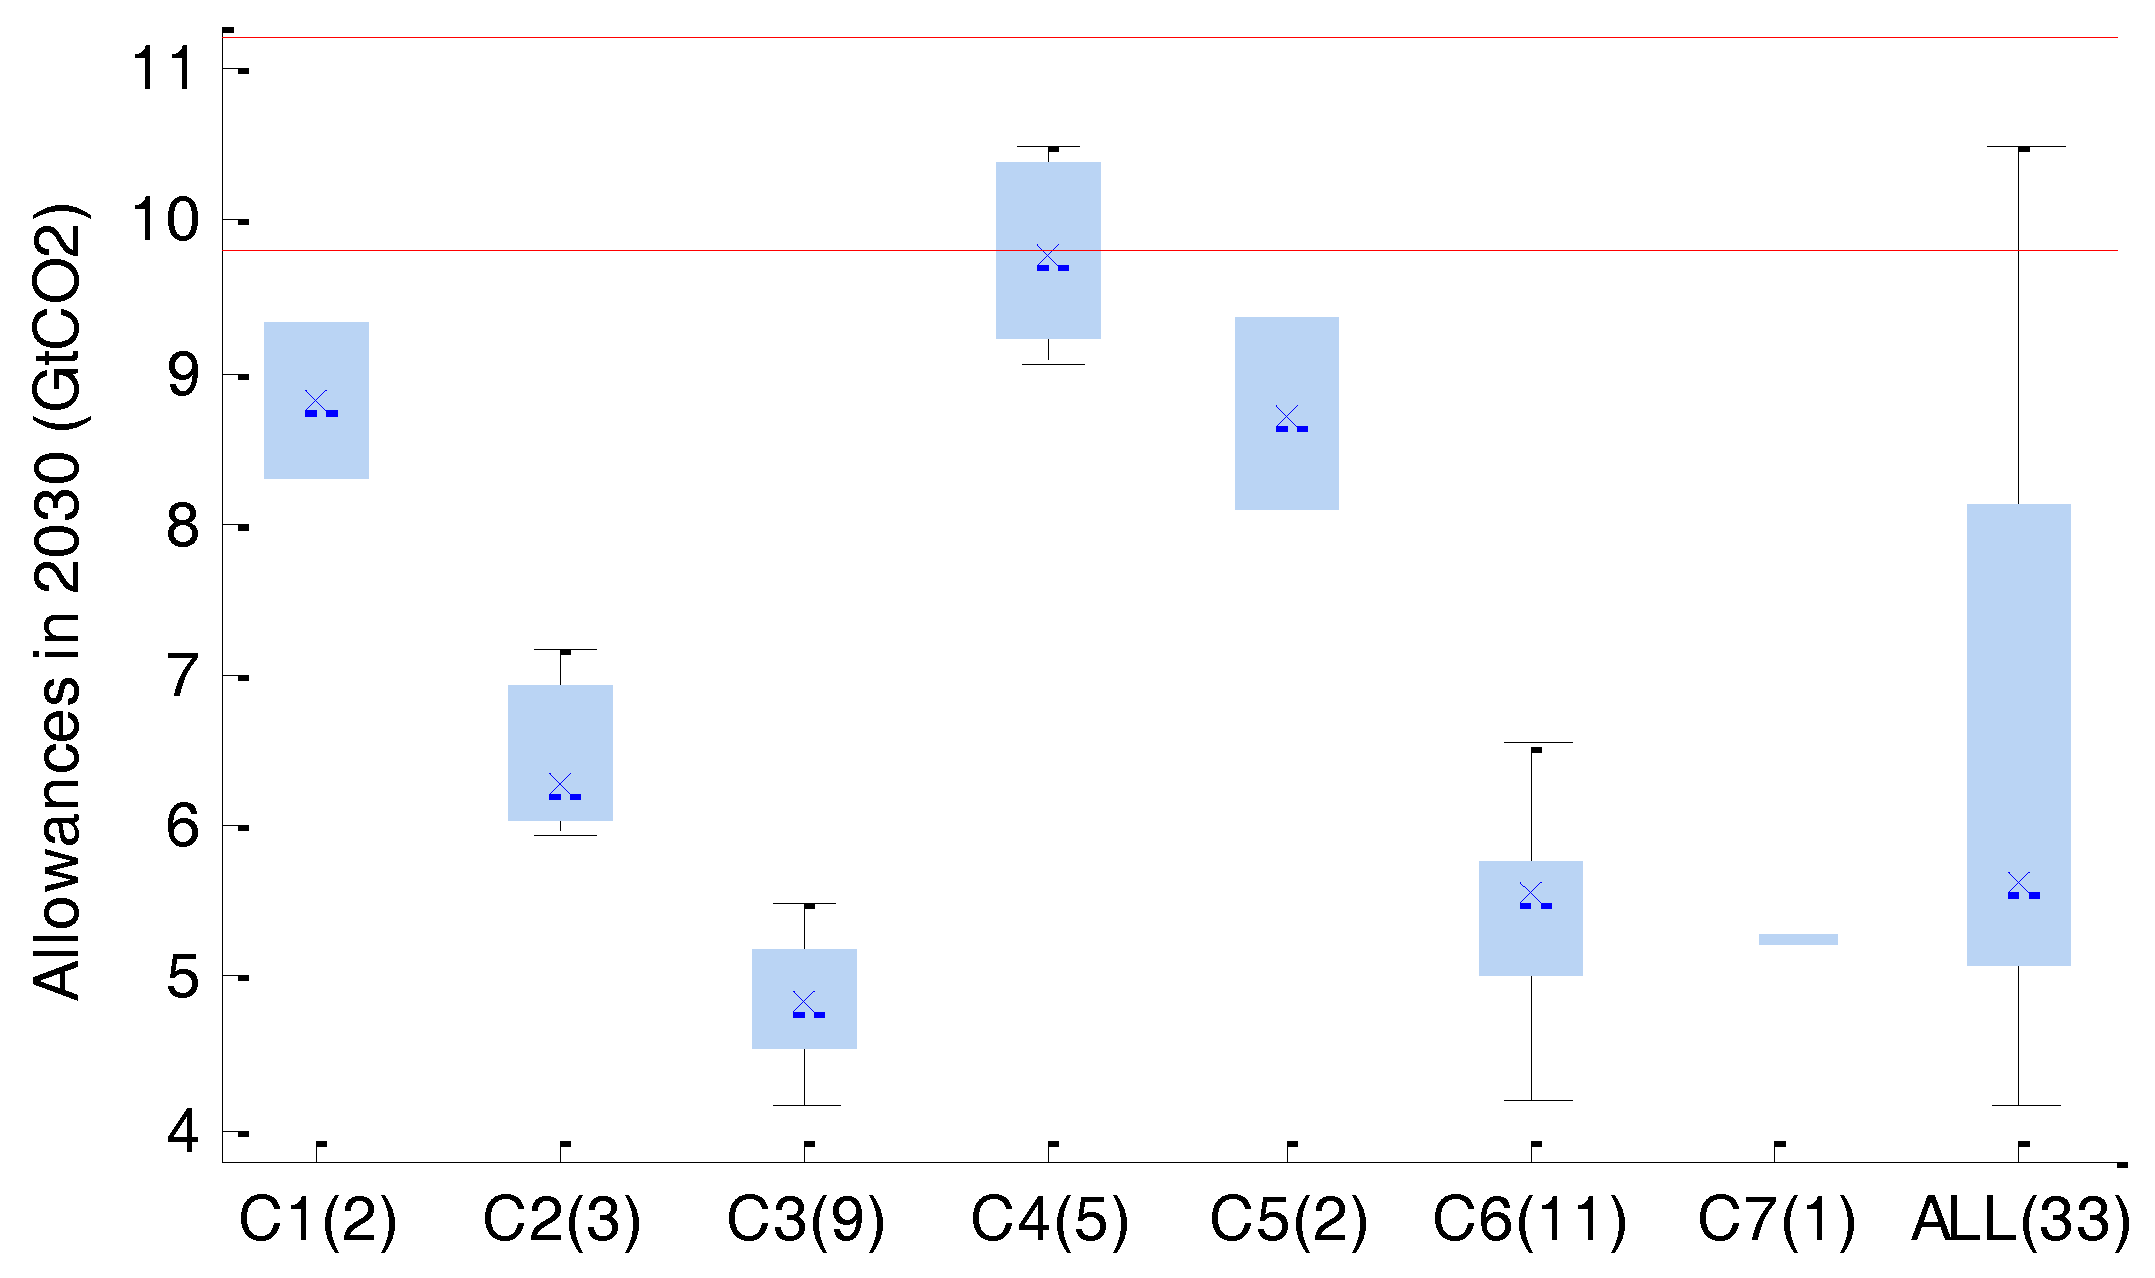
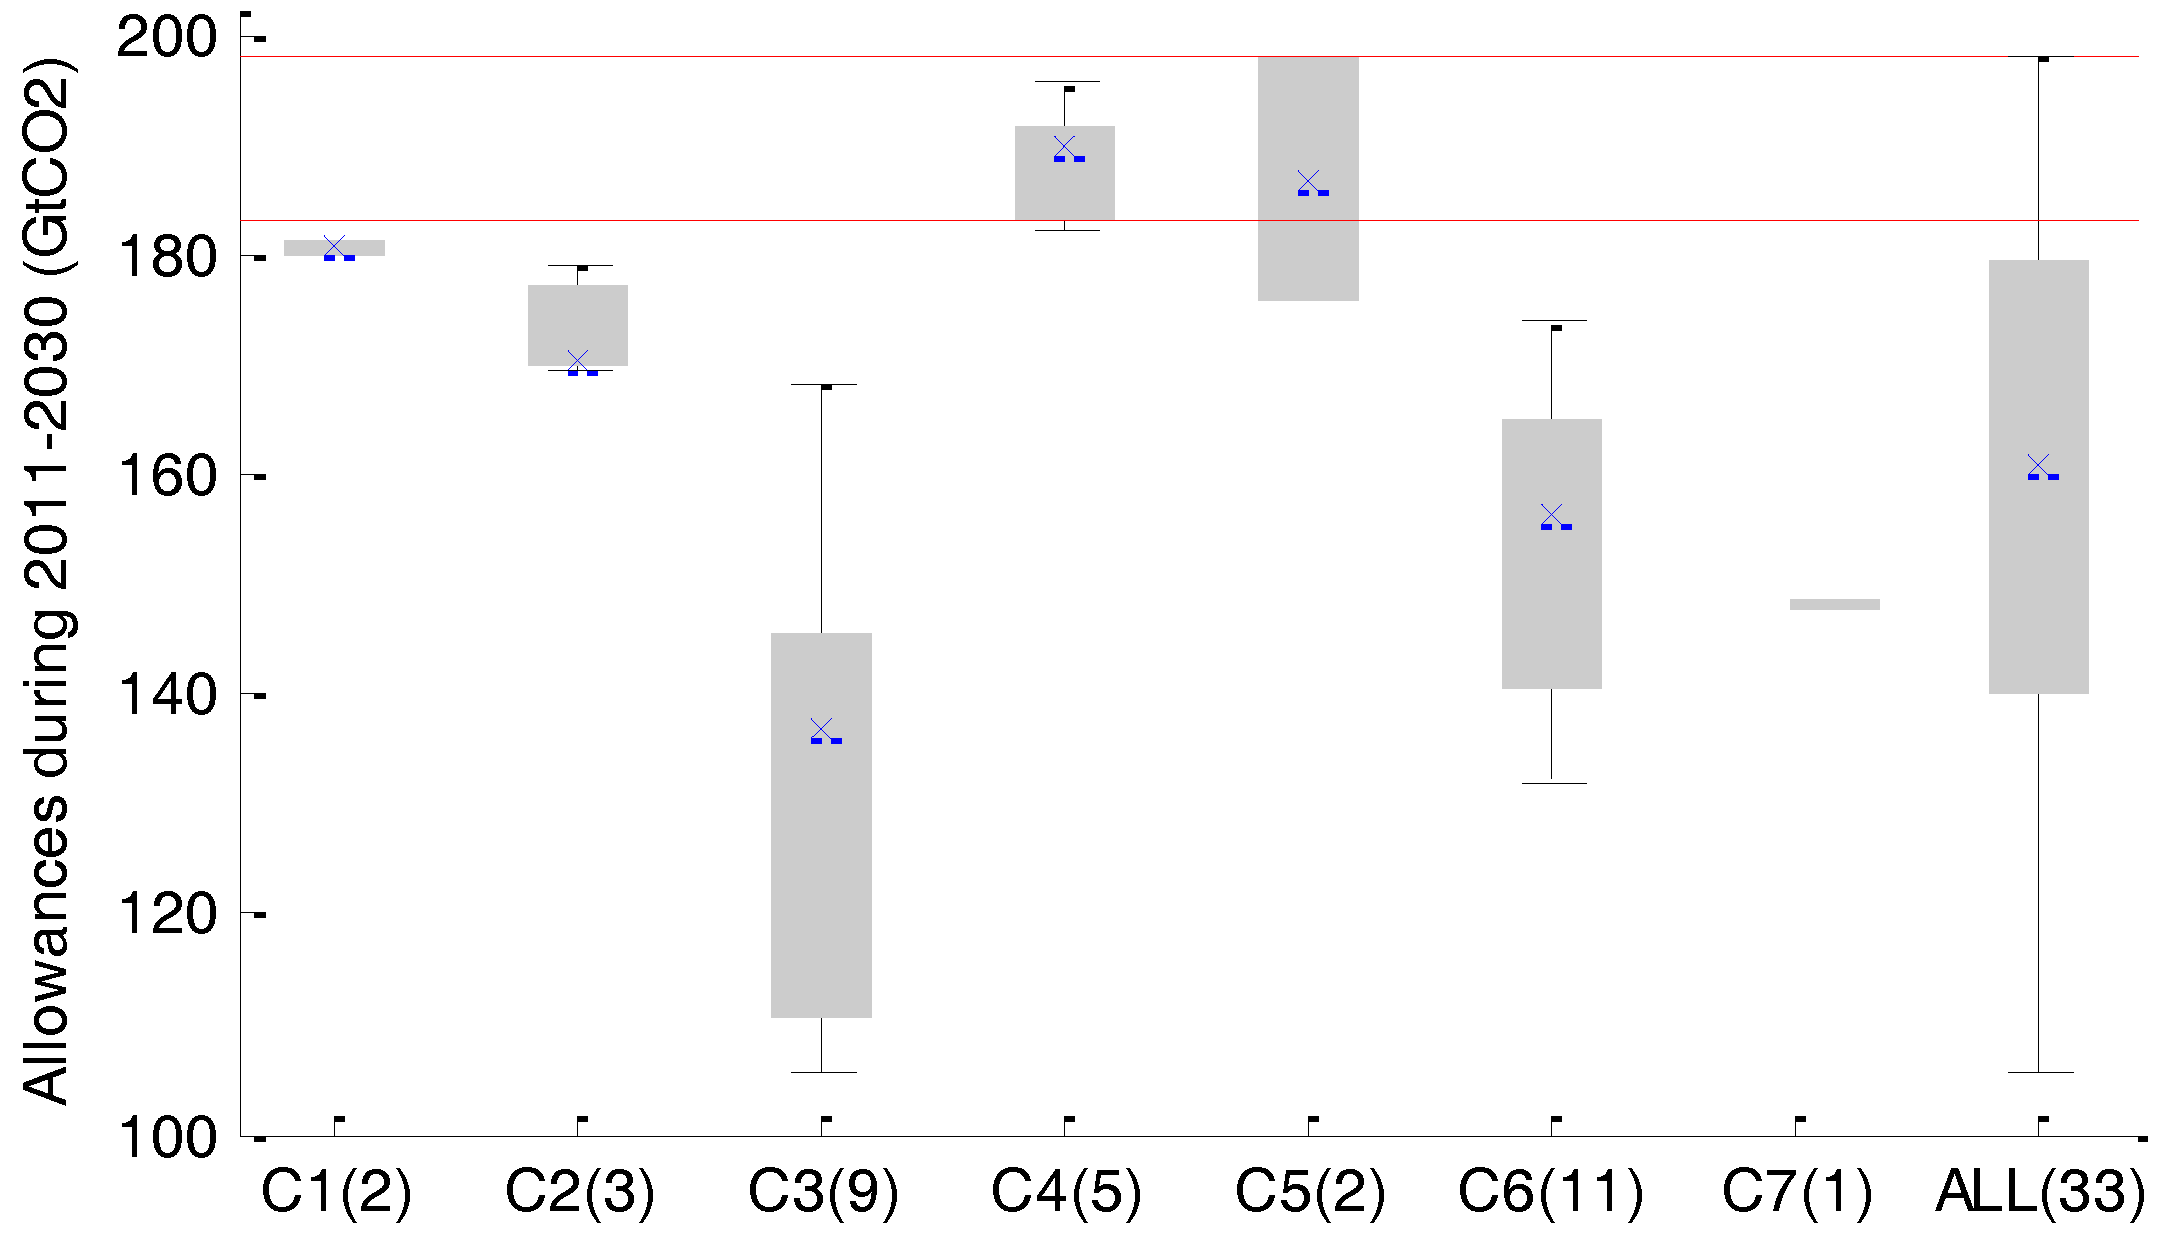
3.1. Emissions Allowances in 2030

Figure 1 presents the ranges of China’s emissions allowances in 2030 under RCP2.6 by the seven effort-sharing categories in the IPCC AR5. Intuitively, emissions allowances for China change considerably across categories. China is currently the most populous country, but the equality principle would assign it as having the smallest emissions allowances (4.1–5.5 GtCO2) in 2030, followed by staged approaches (4.2–6.5 GtCO2) and cost-effectiveness (5.3 GtCO2). In the capability category, China would receive emissions allowances of about 6.0–7.2 GtCO2. Under all schemes in the four categories, China’s emissions allowances in 2030 would be lower than its energy-related CO2 emissions in 2010 (about 7.3 GtCO2). By contrast, responsibility–capability–need would provide China with the largest emissions allowances in 2030 (9.1–10.5 GtCO2), followed by responsibility (8.3–9.3 GtCO2) and equal cumulative per capita emissions (8.1–9.4 GtCO2).
The Second National Communication reported that CO2 emissions from China’s energy system were 5.4 GtCO2 in 2005. The 60–65% targets (with the GDP prediction in GCAM4.0) thus translate to approximately 9.8–11.2 GtCO2 emissions (energy-related) in 2030 (in this study, CO2 emissions levels in 2030 are assumed as the product of the projected GDP and emissions intensity (determined by the 60–65% targets) at that year), which is largely consistent with the projection in Peters et al. [53] (9.9–11.3 GtCO2). The projected NDC emissions (red lines) are compared with fair ranges of emissions allowances in Figure 1. If the 65% target is implemented, China’s NDC emissions would be within the upper bound of emissions allowance ranges and meet the fair contributions resulting from responsibility–capability–need (the median of this principle is just about 9.8 GtCO2), which indicates that the formulation of China’s NDC is actually in line with its position in international climate change negotiations (i.e., concerning both historical responsibilities and sustainable needs in the future). However, if other visions of climate equity or justice are considered, the NDC would fall short of fair contributions in the scenario. Hence, understanding the fairness of China’s NDC would hinge on the equity principle applied to guide countries in mitigations.

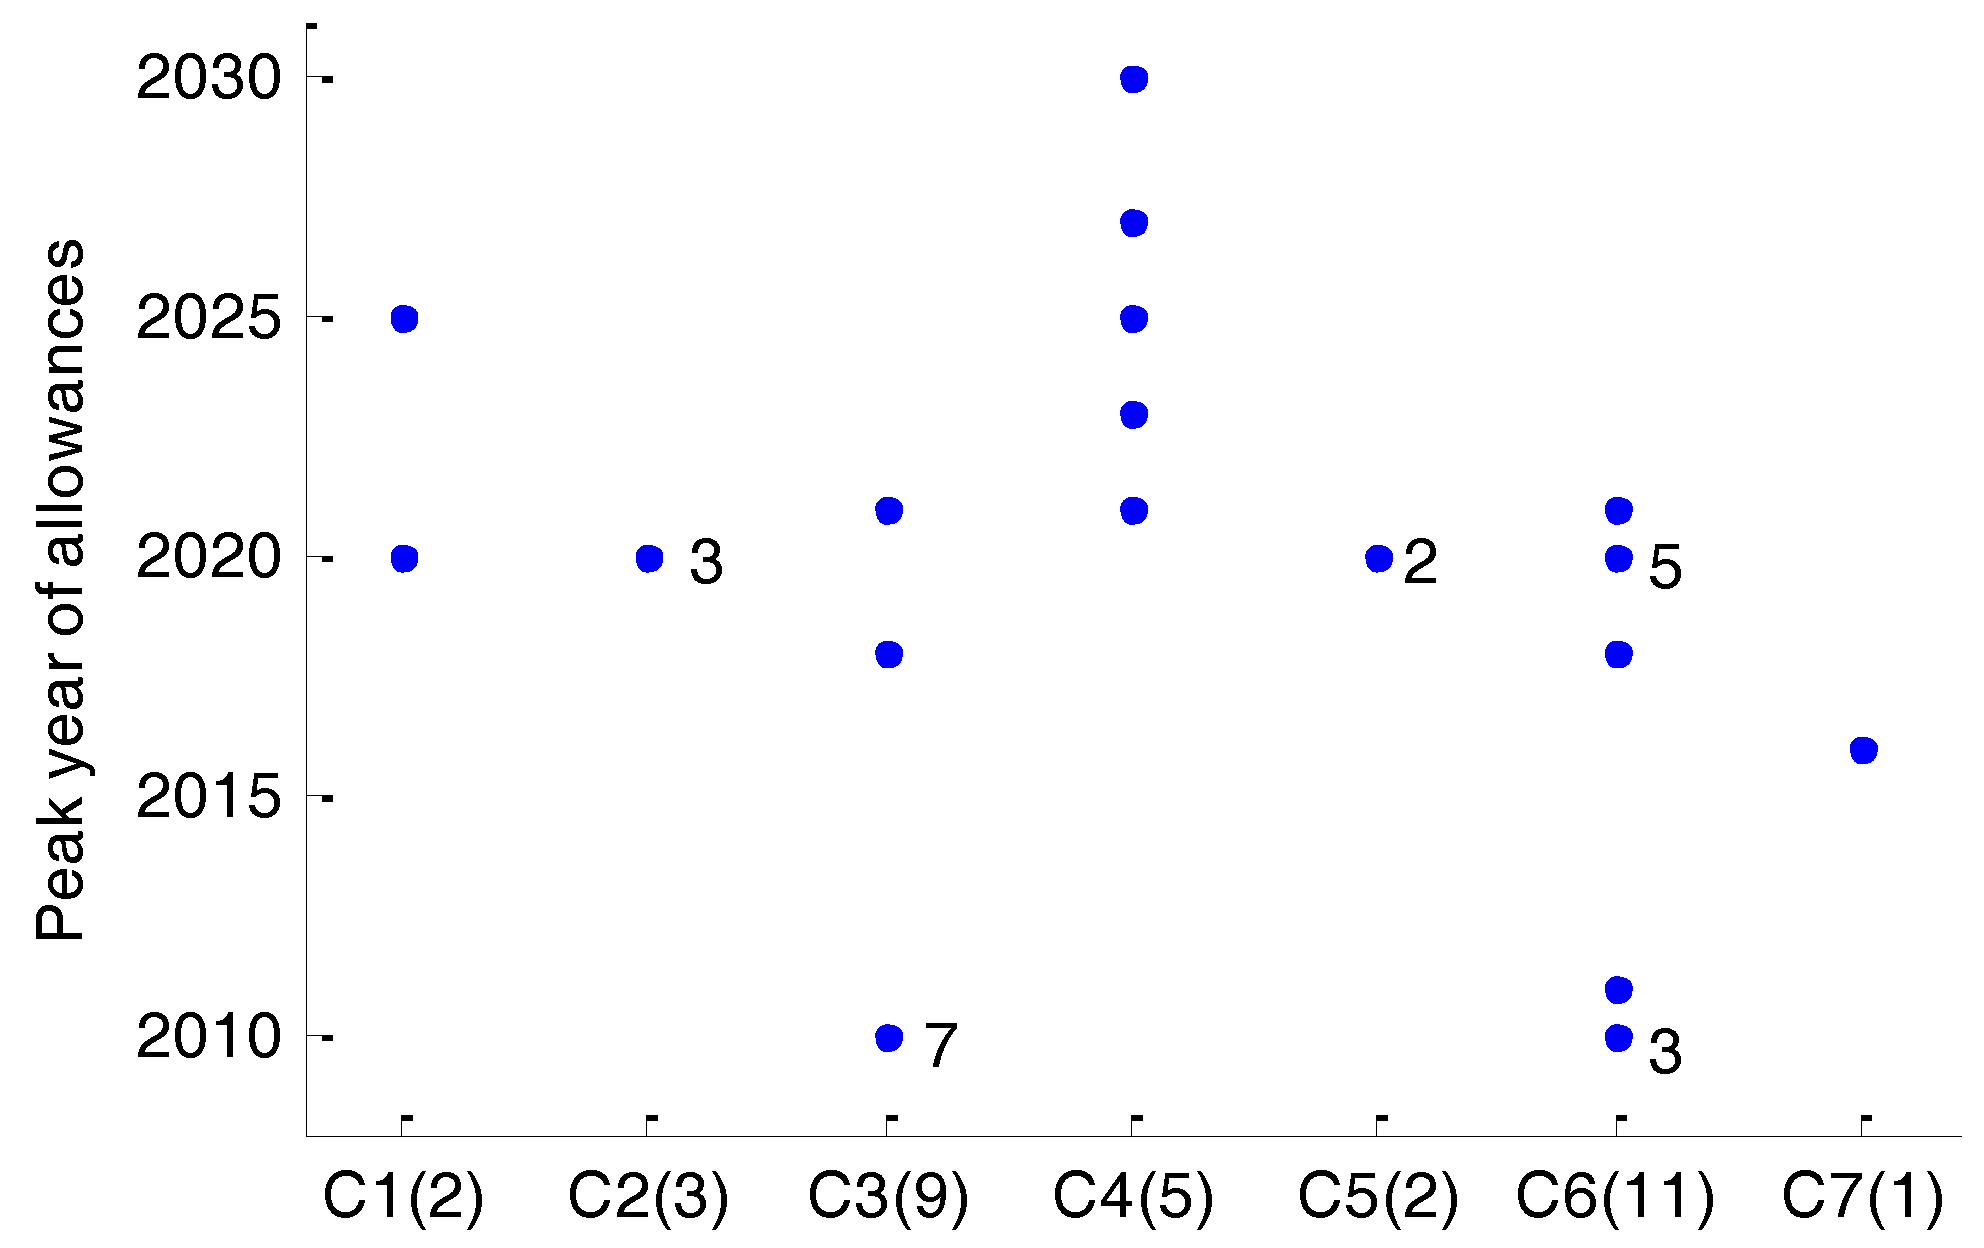
3.2. Peak Years of Emissions Allowances

In the NDC, China has also declared to peak CO2 emissions around 2030. For developing countries, the peak of emissions would have vital influences on socioeconomic development and poverty eradication. Figure 2 depicts peak years of China’s calculated emissions allowances under different effort-sharing categories under RCP2.6. As far as the peak year is concerned, responsibility–capability–need offers the most lenient peak years (during 2020–2030), and China’s 2030 peak target is in agreement with the essential requirements by this principle. In 2010, China contributed approximately 25% of the world’s CO2 emissions, and its per capita emission had already reached the global average level. Consequently, China’s emissions allowances would directly decrease onwards under most schemes in the equality category, as well as in a few schemes in the staged approaches category utilizing per capita emission to index stages. Under all other principles and schemes, China’s emissions allowances would be likely to peak by around 2020. To make efforts to peak early, a few Chinese think tanks [54] have start to consider the possibility to peak CO2 emissions in the energy sector by 2020 or shortly after (in fact, according to the Climate Action Tracker (CAT) (http://climateactiontracker.org/), China’s energy-related CO2 emissions may currently appear to be plateauing).

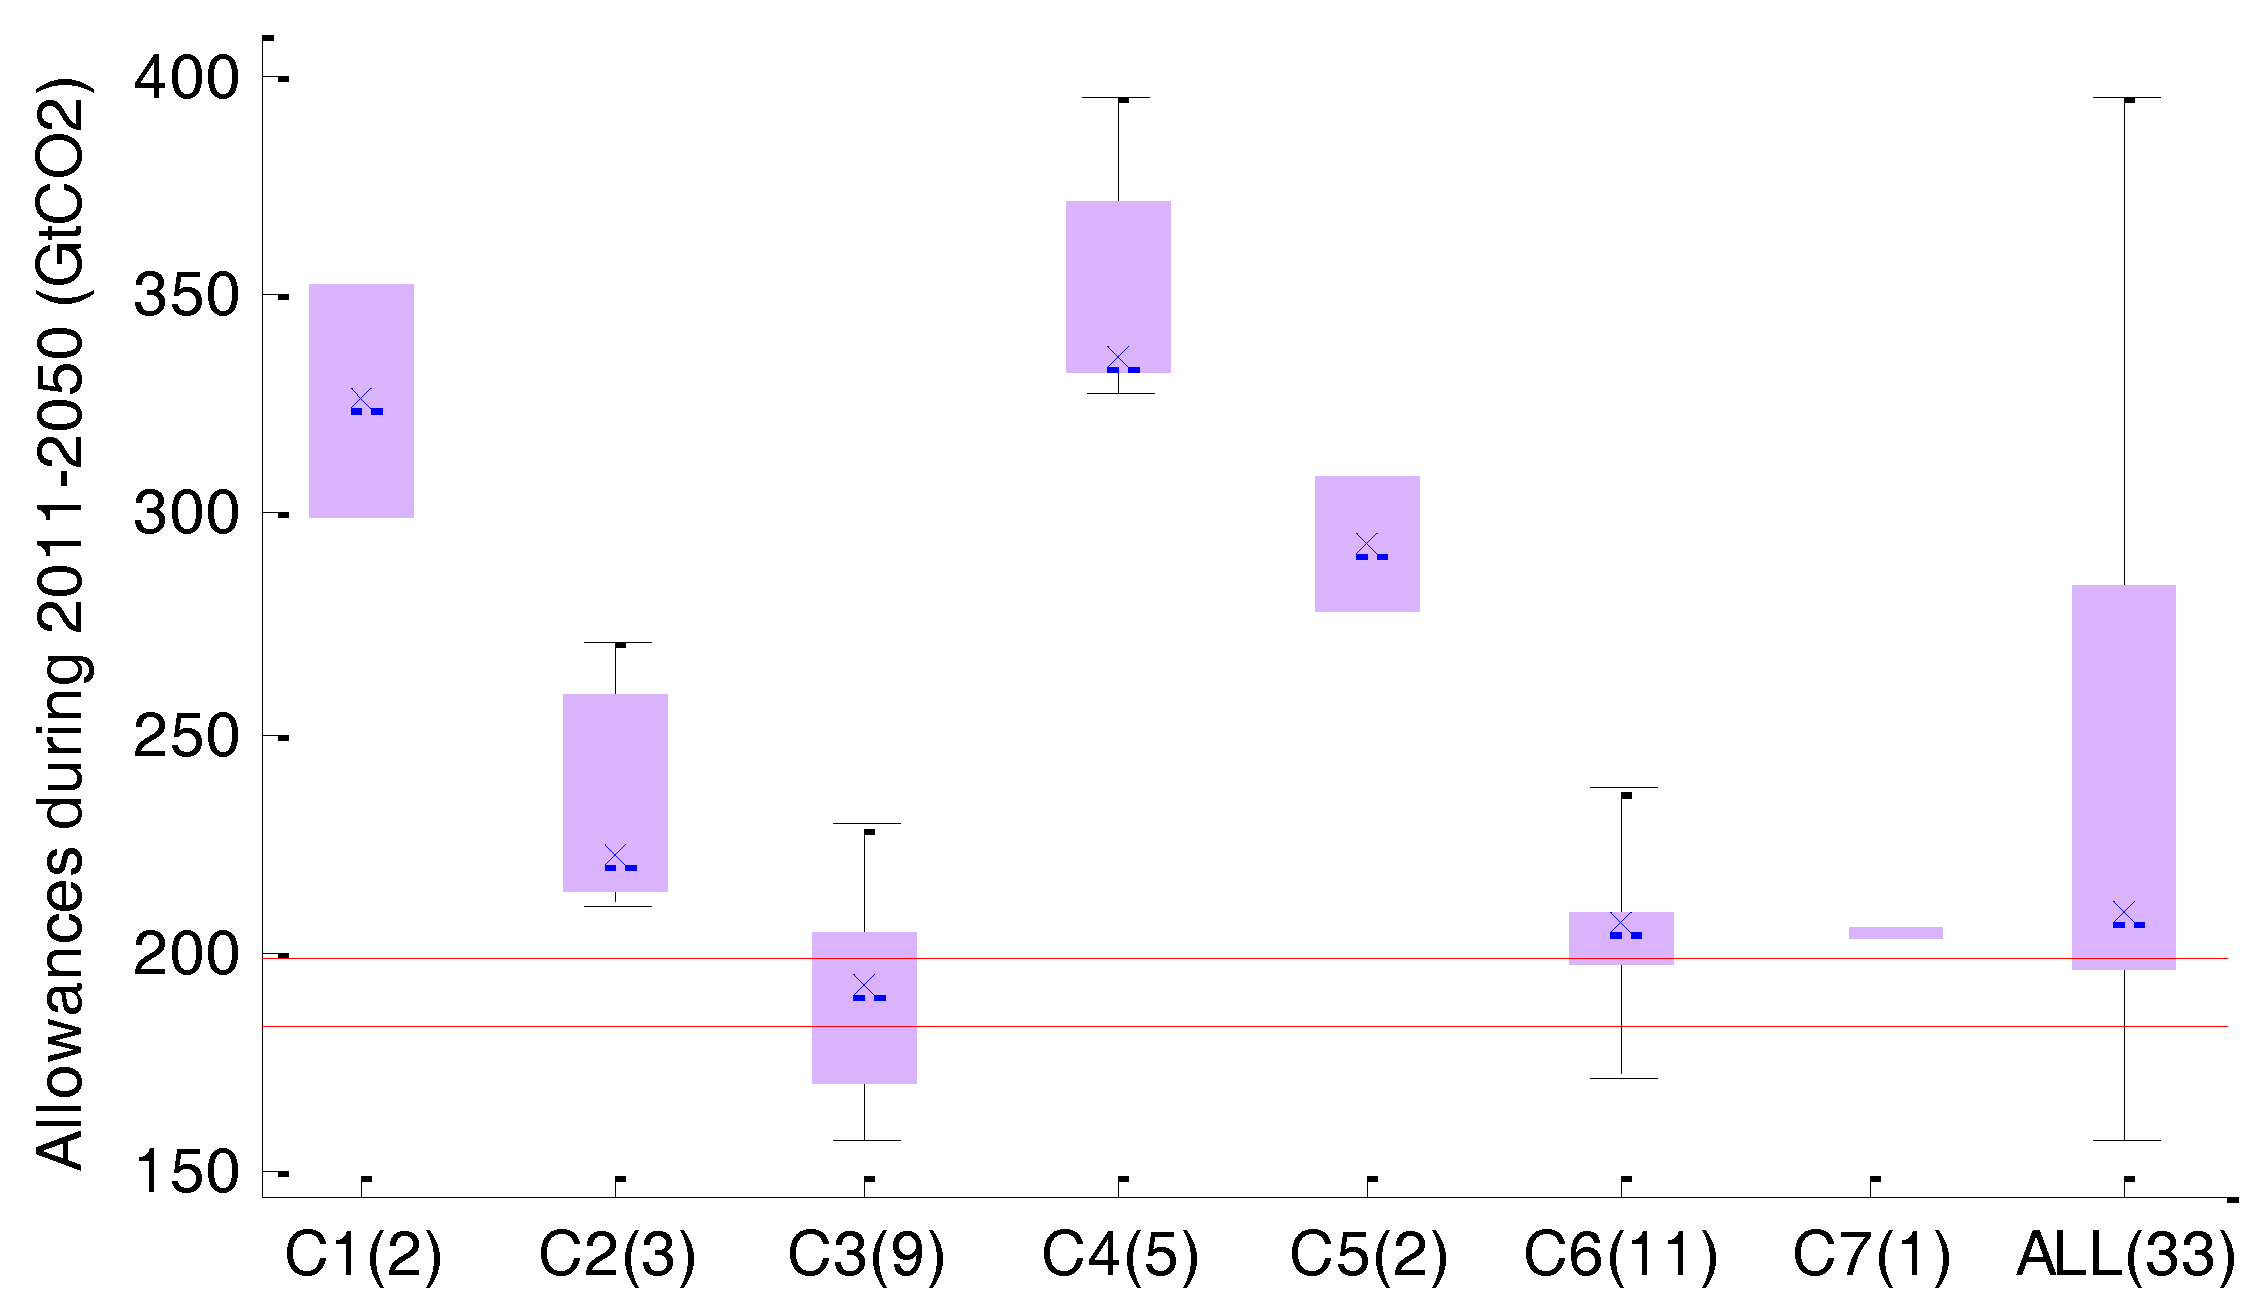
3.3. Cumulative Emissions Allowances

The annual comparison in 2030 has explained the degree of compatibility of China, between the NDC emissions and fair contributions for meeting different equity principles, at that snapshot of time. Nonetheless, this annual comparison does not cover the time-pathway (or dynamics) of emissions and allowances from 2010 to 2030. In other words, the difference between actual emissions and emissions allowances in the process of reaching the NDC targets by 2030 is not clearly understood in Figure 1. To this end, we further use cumulative emissions during 2011–2030 in assessing China’s NDC mitigation targets. Figure 3 presents the comparison between projected cumulative NDC emissions (red lines) and carbon budgets by category for China in 2011–2030. The cumulative emissions corresponding to the 60–65% targets are about 183–198 GtCO2, approximated through linear interpolations in the intervals of 2012 (the latest year of historical emissions in CAIT)–2020 (emissions in 2020 are determined by the 40–45% targets in the Cancun Pledges) and 2020–2030.
Figure 3 shows that China’s carbon budgets from five categories (responsibility, capability, equality, staged approaches, and cost-effectiveness) are lower than cumulative NDC emissions. Combined with the annual comparison, substantial reductions in China would constantly be needed under all these five categories. The full ranges of 2011–2030 carbon budgets provided by all schemes are about 106–198 GtCO2 for China. Different from the annual comparison where only responsibility–capability–need is met, the 65% target could be now compatible with responsibility–capability–need (182–195 GtCO2) and equal cumulative per capita emissions (176–198 GtCO2), and the 60% target with the maximal emissions allowances resulting from responsibility–capability–need. Figure 4 further compares cumulative NDC emissions until 2030 (red lines) and carbon budgets for China in 2011–2050. China’s NDC would consume approximately one-half of the largest budgets until 2050. For equality and staged approaches, carbon budgets up to 2050 might even run out before 2030. Thus, from the perspective of cumulative comparison, the NDC may be also important to consider China’s mitigation targets beyond 2030, which will be discussed in Section 5.

4. Uncertainty Analysis

Various key factors would have implications on comparisons between the NDC emissions and calculated emissions allowances. In this section, these key factors are identified, and uncertainty analyses are performed to discuss the robustness of our findings in Section 3.

4.1. GDP Growths

For intensity-based targets, uncertainties are first highly related to GDP projections. Numerous studies have estimated China’s future GDP, such as the International Energy Agency [55], the United Nations Development Program [56], and the Lawrence Berkeley National Laboratory (LBNL) [57]. The New Climate Economics (NCE) program [58], a recent study in China, showed three hierarchical levels (high, median, and low) of GDP increases. Table 3 presents China’s projected NDC emissions associated with GDP growths in these studies. In the pessimistic case (NCE-low), the projected NDC emissions would be significantly low; in the substantially optimistic case (NCE-high and LBNL), the projected NDC emissions would be much higher than China’s fair allowance ranges; beyond that, in all moderate cases (i.e., GCAM4.0, NCE-median, IEA, UNDP), the projected NDC emissions would generally position around upper ends of what would be fair contributions for China (in Figure 1 and Figure 3). To ensure China’s NDC emissions resulted from the 60–65% targets at least within full ranges of emissions allowances under RCP2.6, the average annual growth rate of GDP would be at most 5.5–6.2% and 6.1–6.8% between 2011 and 2030 for the annual and cumulative comparison, respectively. If China’s economy develops faster than those scales, then more ambitious targets of intensity improvements need to be pursued.

4.2. Baseline Scenarios

The upper boundaries of China’s fair ranges, determined by responsibility–capability–need, are largely based on deviations from baseline emissions. Three additional baseline scenarios (A1B, A1F, and B2) in the IPCC Special Report on Emission Scenarios [59] are therefore considered. The corresponding ranges of emissions allowances for China under RCP2.6 are presented in Figure 5. The fair ranges do vary across these baselines because of diverse storylines and assumptions for the future. For instance, emissions allowances in 2030 change from 4.1–10.5 GtCO2 for GCAM4.0 to 3.7–11.3 GtCO2 for A1B, 3.7–11.8 GtCO2 for A1F and 4.3–10.6 GtCO2 for B2. However, it seems that the baseline scenarios would have relatively limited effects on understanding China’s NDC fairness. Keeping the projected NDC emissions in Section 3 as a reference (9.8–11.2 GtCO2 in 2030 and 183–198 GtCO2 in 2011–2030), the annual NDC emissions under the 65% target, as well as the cumulative NDC emissions under the 60–65% targets, would be in line with the upper bounds of the ranges of fairness interpretations regardless of baseline scenarios.

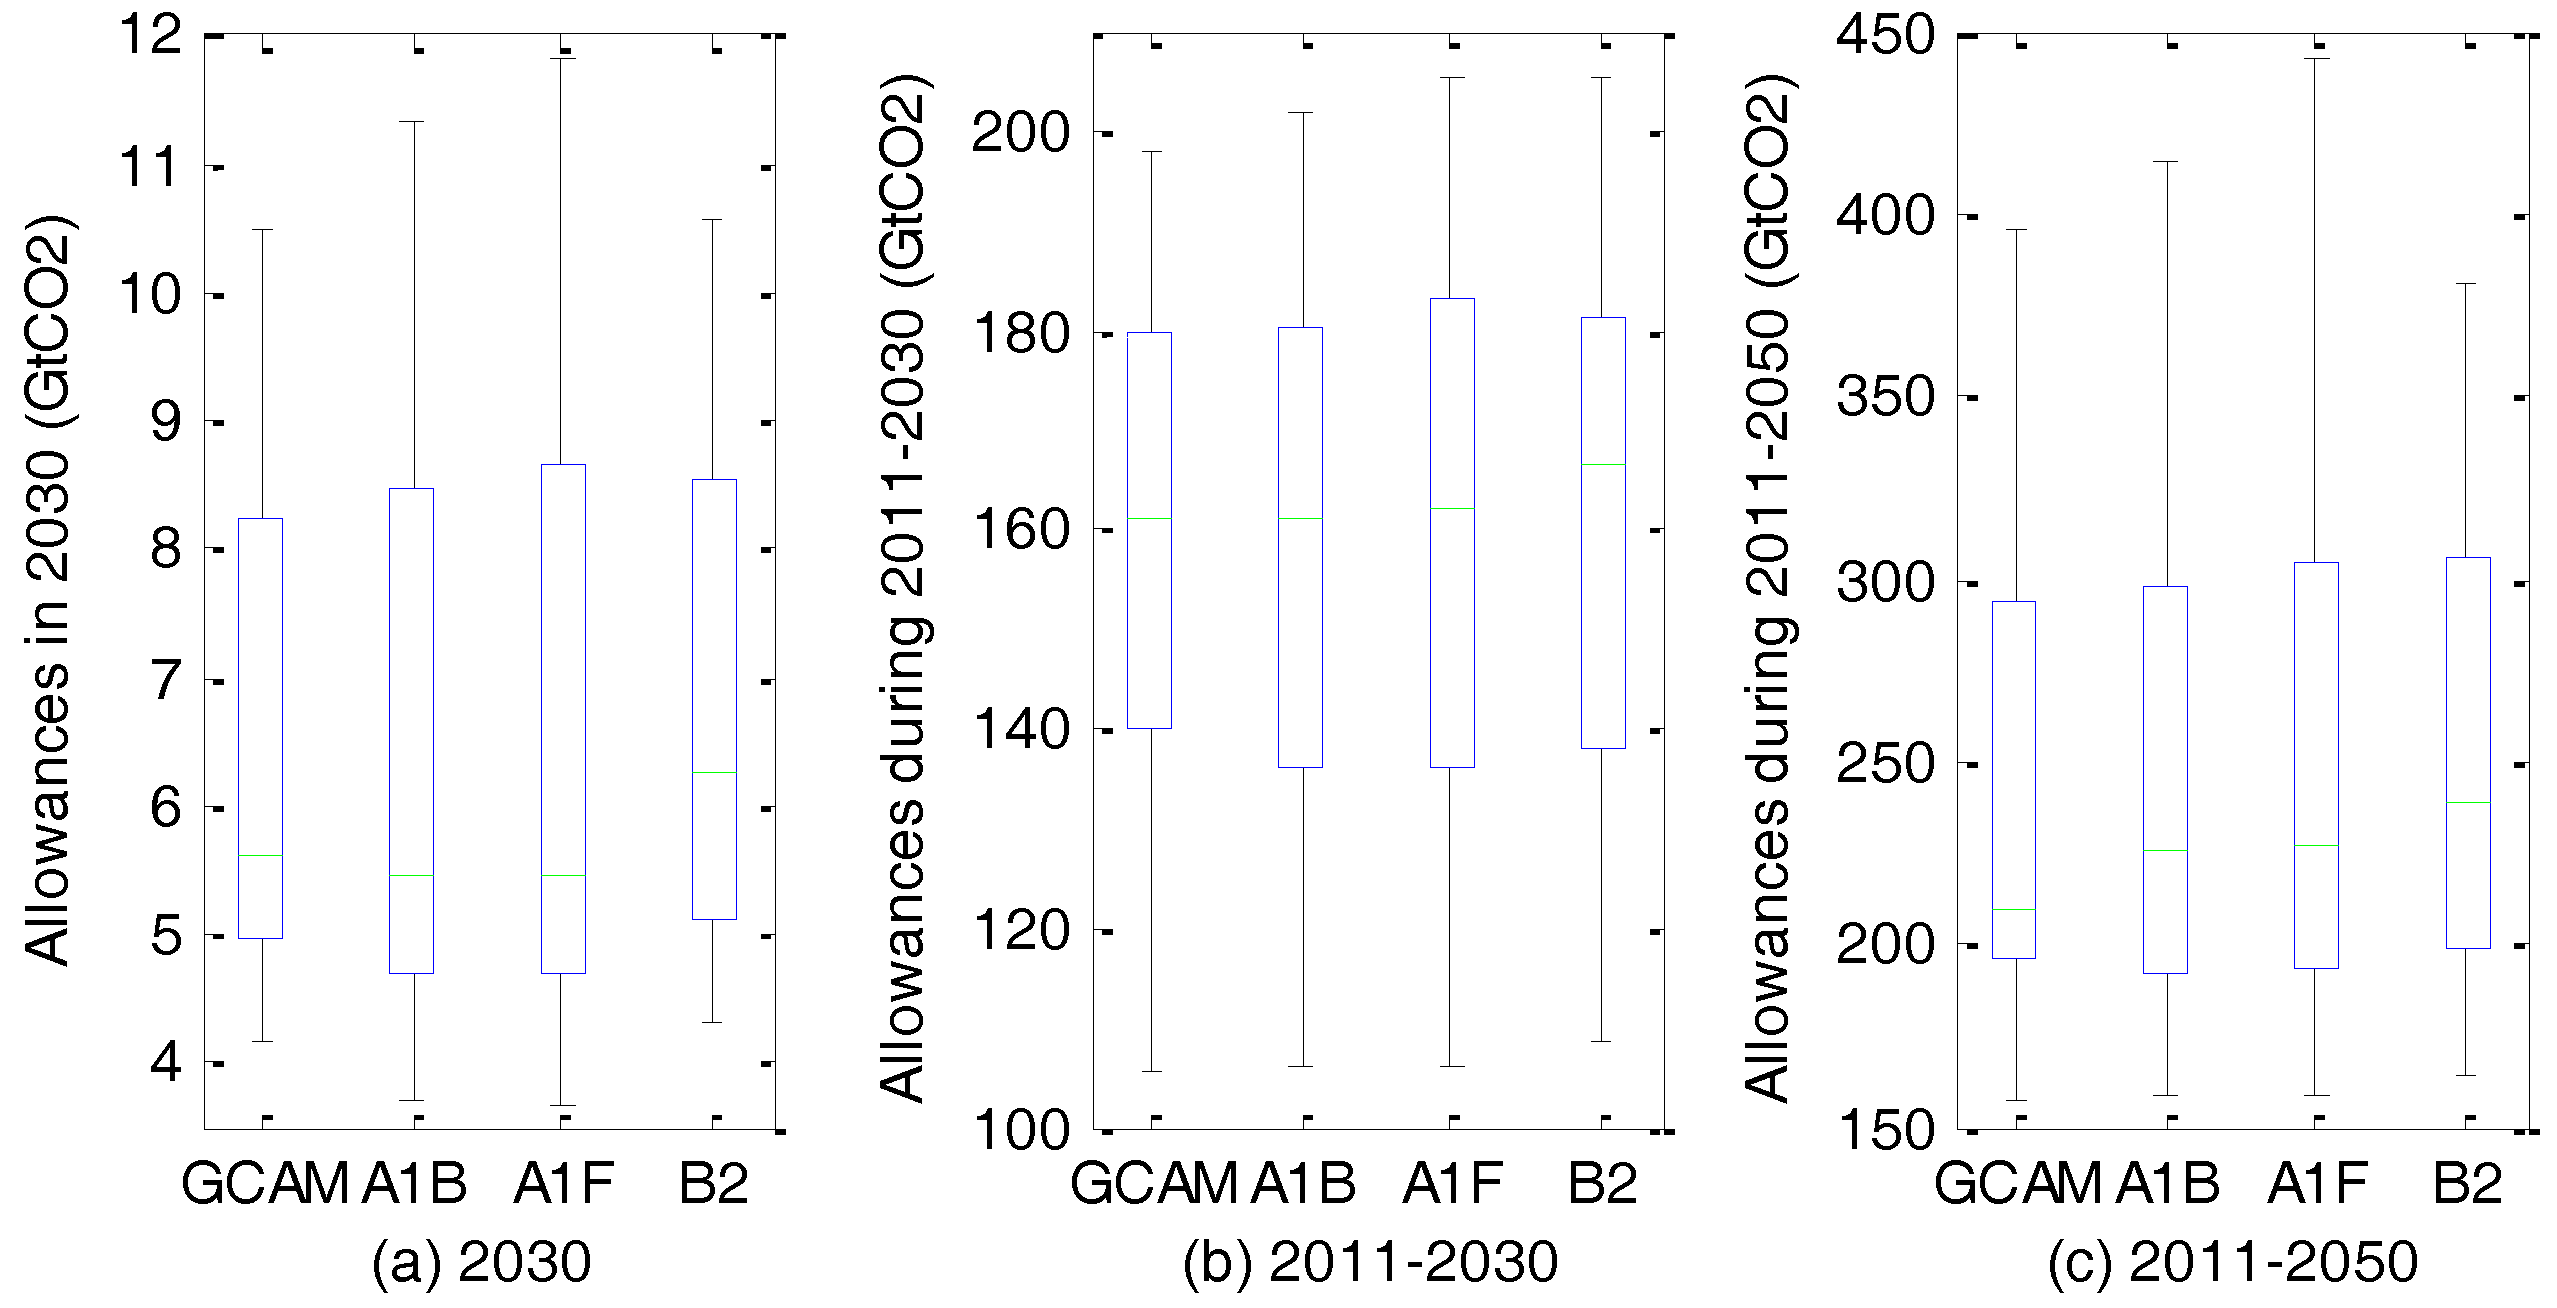
4.3. Global Emissions Pathways

A significant uncertainty would also appear in global emissions pathways. The international model comparison exercises have shown a considerable scope of cost-optimal pathways which have a likely chance towards the 2 °C goal [60,61]. According to the IPCC AR5 database (https://tntcat.iiasa.ac.at/AR5DB), global CO2 emissions in 2030 would change by −40–20% from 2010 levels under about 80% of these likely pathways. To consider this uncertainty, ceilings of China’s fair ranges of emissions allowances (i.e., maximal emissions allowances) are calculated from the effort-sharing framework over different categories of global pathways, as presented in Table 4. With larger global budgets in 2030, these ceilings would unambiguously move upward. Compared with the NDC emissions under moderate GDP increases in Table 3, a robust result can be determined, that is, both annual and cumulative emissions driven by the 65% target could meet certain equity principles regardless of pathways. For the 60% target, annual emissions in 2030 could be probably within full ranges of emissions allowances if global emissions in 2030 increase from 2010 levels, and cumulative emissions in 2011–2030 within full ranges as long as changes of global emissions are not below −30%.

4.4. Compared with Existed Studies

The Emissions Gap Report of the United Nations Environment Programme (UNEP) [62] has demonstrated that the global emissions gap between the INDCs and the least-cost 2 °C pathways is about 12–14 GtCO2eq in 2030. However, it has not pointed out whether each country is bearing its fair contributions. In this regard, CAT has already taken the lead. CAT has established its emissions allowance database of high emitters under the 2 °C goal by aggregating and harmonizing over 40 effort-sharing studies in the literature. In the NDC, China has not yet implemented explicit mitigation targets addressing non-CO2 emissions. Robiou Du Pont et al. [13,63] showed that China’s projected greenhouse gas emissions (including both CO2 and non-CO2), based on annual comparisons in 2030, might not align with any equity principle (it is noted that Robiou Du Pont et al. considered only one effort-sharing scheme per IPCC category, and didn’t cover the categories of responsibility and cost-effectiveness). However, if we focus exclusively on CO2 (what is covered in the NDC), our findings here (based on a more comprehensive effort-sharing framework accounting for more schemes per IPCC category) have demonstrated that, China’s CO2 mitigation targets could possibly meet upper ends of fair ranges of carbon allowances (especially when we consider cumulative emissions), which is largely in agreement with the assessment of CAT (CAT considered greenhouse gas emissions and made annual comparisons in the year 2030). Energy and climate policies are developing rapidly in China. A recent estimate from CAT [64] presented that energy-related CO2 emissions in China might drop to 8.6–10.1 GtCO2 in 2030 based on the latest policies and actions including all the NDC aspects (e.g., significantly cutting coal consumption, enlarging the share of non-fossil fuels, improving local air quality). This current policy projection, which is more aggressive than the projection in this study, would place China’s NDC lower in fair ranges of emissions allowances depicted in Figure 1.

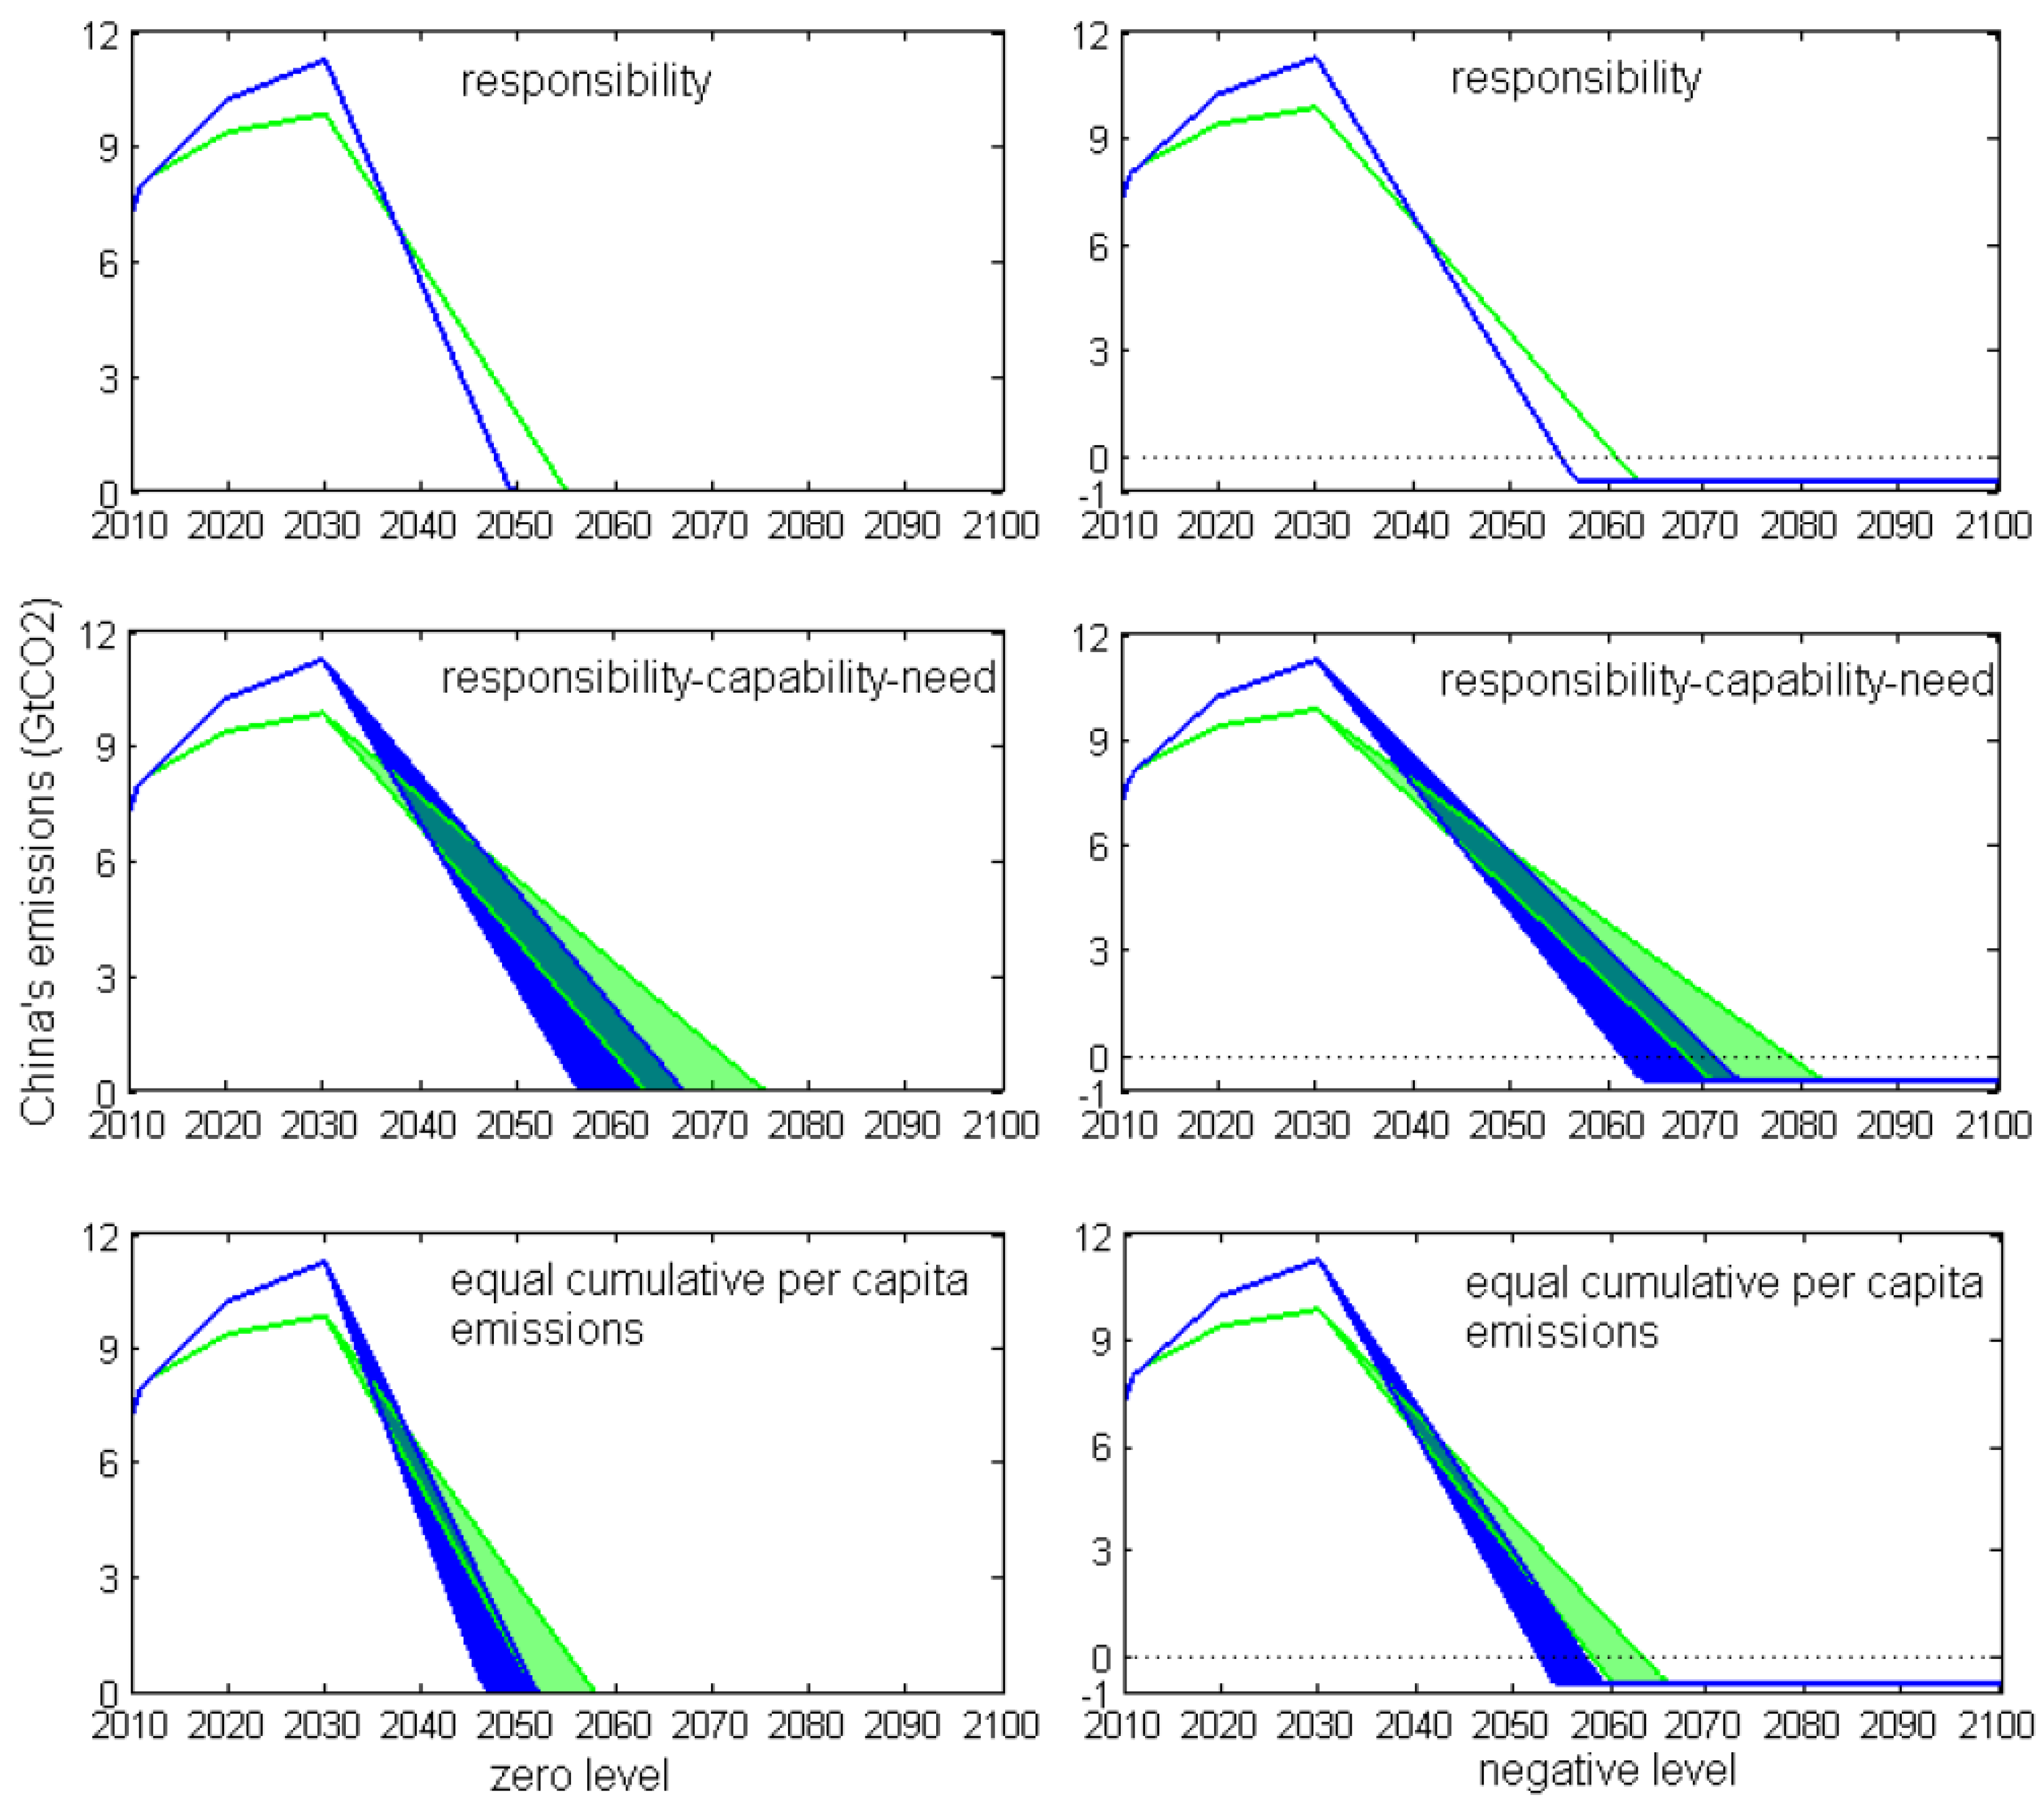
5. Implications on Mitigation Targets beyond 2030

In the Paris Agreement, parties have agreed to formulate and communicate low-emission development strategies by 2020 to envisage their long-term mitigations until 2050 [8]. The UNEP Emissions Gap Report has indicated that staying temperature rise well below 2 °C (with a likely chance) would imply that global carbon emissions need to become zero by 2060–2075 [62]. Due to the near-linear relationship between cumulative CO2 emissions and long-term anthropogenic temperature change, emissions before 2030 would exhaust available carbon budgets throughout the century. To control China’s cumulative emissions within its 2 °C-consistent budgets over the course of the century, the NDC would have important implications on China’s long-term mitigation targets beyond 2030. In the following analyses, the GCAM4.0 scenario and RCP2.6 remain as baseline and global emissions pathway, respectively, and allocations are extended to 2100.
To develop post-2030 emissions trajectories, China’s energy-related CO2 emissions are assumed to decrease linearly form the 2030 (the peak year) level to a certain steady-state level and then hold constant through 2100 [15,65]. In this manner, the year when emissions meet the steady-state level would be determined by matching cumulative emissions beyond 2030 with carbon budgets remaining for the years 2031–2100 (calculated as the differences between carbon budgets during 2011–2100 resulted from effort-sharing schemes and projected cumulative NDC emissions during 2011–2030). Even implementing the 65% target before 2030, managing China’s post-2030 emissions within remaining budgets under capability (28 GtCO2), equality (−19 GtCO2 to 52 GtCO2), staged approaches (−6.1 GtCO2 to 53 GtCO2) and cost-effectiveness (53 GtCO2) is considered to be highly unlikely (if projected emissions levels in 2030 are to continue beyond 2030, China’s remaining budgets would almost run out before 2035 under the four categories). To this end, this section mainly focuses on the other three effort-sharing principles (responsibility, responsibility–capability–need, equal cumulative per capita emissions). Two steady-state levels are considered: (1) a zero level; and (2) a negative level, which could be achieved through the deployment of carbon dioxide removal (CDR) technologies such as biomass energy with carbon dioxide capture and storage. It is noted that there is a great uncertainty in regard of the potential and feasibility of CDR technologies at present [11]. Here, a 110% reduction from China’s 2010 emissions is assumed as the steady-state level, which is consistent with the change of global emissions under RCP2.6 in 2100 from 2010 levels. Figure 6 portrays the corresponding CO2 emissions trajectories for China.
For the zero steady-state level, based on the 65% target before 2030, China’s CO2 emissions (energy-related) would need to arrive at zero in 2052–2058 for equal cumulative per capita emissions. The responsibility principle would require a similar zero time (2055). Responsibility–capability–need could delay carbon neutral year for China to 2064–2075. The CO2 emissions in 2050 are also investigated. Responsibility–capability–need would allow 3.9–5.5 GtCO2, which are approximately 53–74% as percentage of the 2010 level. However, beyond that, China would need to reduce by at least about 60% from the 2010 level. When the 60% target is implemented before 2030, the remaining budgets after that year would apparently run low for China, resulting in the years reaching zero emissions moving up by 5–8 years.
The long-term steady-state level would influence the decarburization pace for China. Figure 6 presents that a negative steady-state level would make emissions trajectories less steep, thereby indicating later zero emissions years for China. For responsibility–capability–need, emissions in 2050 would increase to 62–79% (as percentage of the 2010 level) and 56–78% under the 65% and 60% target, respectively. Table 5 summarizes China’s long-term mitigation targets based on the NDC. It should be noted here that many factors, such as the assumption of GDP growths, the choice of baseline scenarios and global emissions pathways, would be likely to change concrete numbers in Table 5. However, given deep reductions required to meet 2 °C [66], in the absence of dramatically more net negative emissions, we believe the urgency of drastic mitigations would largely hold for China’s energy system beyond 2030.

6. Conclusions

Under the UNFCCC, the INDCs, providing fair and ambitious mitigation contributions, have been hailed as a major first step on the long road for human society to keep temperature rise well below 2 °C. In the NDC, China has announced to lower carbon intensity in 2030 by 60–65% below the 2005 level and peak CO2 emissions around the same year. This study has compared and evaluated China’s CO2 mitigation targets against emissions allowances under the 2 °C goal, as calculated from a consistent effort-sharing framework based on seven categories listed in the IPCC AR5. Uncertainties of this assessment have been analyzed. Implications of the NDC on China’s post-2030 mitigation targets have been further explored.
In general, with moderate economic growths in the “new normal”, China’s NDC emissions would be around upper ends of fair ranges of emissions allowances regardless of baseline scenarios and likely 2 °C pathways. Understanding the fairness of China’s NDC would largely depend on the equity principle applied to set mitigation benchmarks. If implementing the 65% target, China’s NDC could match the fair contributions resulting from responsibility–capability–need by 2030; the cumulative CO2 emissions during 2011–2030 could further align with equal cumulative per capita emissions. In order to hold cumulative emissions within 2 °C-consistent carbon budgets throughout this century, the analyses of long-term emissions trajectories under RCP2.6 have shown that, CO2 emissions in China’s energy system would need to phase out by 2070s at the latest, irrespective of principles and schemes. A negative steady-state level would to an extent prolong arrivals at carbon neutrality, but absent dramatically large net negative emissions in the second half of this century, radical mitigations would be immediately expected in China beyond 2030.
As the aspirations of the Paris Agreement, the world would further pursue efforts to limit temperature increase to below 1.5 °C, which would require more significant mitigations worldwide. In the global scope, there is currently a large gap between emissions resulting from the INDCs and the least-cost levels needed for achieving the Paris Agreement goals [66]. Although working on fair shares guided by responsibility–capability–need, China might also consider to elevate the level of CO2 mitigations in the future, so that more ambitious contributions could be provided to help close the global gap.

Acknowledgments

This study is supported by the National Natural Science Foundation of China (No. 71690243, No. 71673162 and No. 71573145) and the Science Foundation of China University of Petroleum, Beijing (2462016YJRC023).

Author Contributions

Both authors contributed to designing the study, collecting the data, performing the calculations, analyzing the results and writing the manuscript.

Conflicts of Interest

The authors declare no conflict of interest.

References

  1. Intergovernmental Panel on Climate Change (IPCC). Climate Change 2013: The Physical Science Basis. Contribution of Working Group I to the Fifth Assessment Report of the Intergovernmental Panel on Climate Change; Cambridge University Press: Cambridge, UK; New York, NY, USA, 2013. [Google Scholar]
  2. Allen, M.R.; Frame, D.J.; Huntingford, C.; Jones, C.D.; Low, J.A.; Meinshausen, M.; Meinshausen, N. Warming caused by cumulative carbon emissions towards the trillionth tonne. Nature 2009, 458, 1163–1166. [Google Scholar] [CrossRef] [PubMed]
  3. Matthews, H.D.; Gillett, N.P.; Stott, P.A.; Zickfeld, K. The proportionality of global warming to cumulative carbon emissions. Nature 2009, 459, 829–832. [Google Scholar] [CrossRef] [PubMed]
  4. Klinsky, S.; Winkler, H. Equity, sustainable development and climate policy. Clim. Policy 2014, 14, 1–7. [Google Scholar] [CrossRef]
  5. Baer, P.; Kartha, S.; Athanasiou, T.; Kempbenedict, E. The greenhouse development rights framework: Drawing attention to inequality within nations in the global climate policy debate. Dev. Chang. 2009, 40, 1121–1138. [Google Scholar] [CrossRef]
  6. Global Commons Institute (GCI). GCI Briefing: Contraction & Convergence; Global Commons Institute: London, UK, 2005. [Google Scholar]
  7. Pan, X.; Teng, F.; Wang, G. Sharing emission space at an equitable basis: Allocation scheme based on the equal cumulative emission per capita principle. Appl. Energy 2014, 113, 1810–1818. [Google Scholar] [CrossRef]
  8. United Nations Framework Convention on Climate Change (UNFCCC). Adoption of the Paris Agreement (1/CP.21); United Nations Framework Convention on Climate Change: Bonn, Germany, 2015. [Google Scholar]
  9. United Nations Framework Convention on Climate Change (UNFCCC). Lima Call for Climate Action; United Nations Framework Convention on Climate Change: Bonn, Germany, 2014. [Google Scholar]
  10. Höhne, N.; den Elzen, M.; Escalante, D. Regional GHG reduction targets based on effort sharing: A comparison of studies. Clim. Policy 2013, 14, 122–147. [Google Scholar] [CrossRef]
  11. Clarke, L.; Jiang, K.; Akimoto, K.; Babiker, M.; Blanford, G.; Fisher-Vanden, K.; Hourcade, J.C.; Krey, V.; Kriegler, E.; Löschel, A.; et al. Assessing transformation pathways. In Climate Change 2014: Mitigation of Climate Change. Contribution of Working Group III to the Fifth Assessment Report of the Intergovernmental Panel on Climate Change; Edenhofer, O., Pichs-Madruga, R., Sokona, Y., Farahani, E., Kadner, S., Seyboth, K., Adler, A., Baum, I., Brunner, S., Eickemeier, P., et al., Eds.; Cambridge University Press: Cambridge, UK; New York, NY, USA, 2014. [Google Scholar]
  12. Höhne, N.; Fekete, H.; den Elzen, M.; Hof, A.F.; Kuramochi, T. Assessing the ambition of post-2020 climate targets: A comprehensive framework. Clim. Policy 2017. [Google Scholar] [CrossRef]
  13. Robiou Du Pont, Y. The Paris Agreement Global Goals: What DOES a Fair Share for G20 Countries Look Like? Australian-German Climate and Energy College: Melbourne, Australia, 2017. [Google Scholar]
  14. BASIC Experts. Equitable Access to Sustainable Development: Contribution to the Body of Scientific Knowledge; BASIC Experts: Beijing, China; Brasilia, Brazil; Cape Town, South Africa; New Delhi, India, 2011. [Google Scholar]
  15. Pan, X.; Chen, W.; Clarke, L.; Wang, L.; Liu, G. China’s energy system transformation towards the goal: Implications of different effort-sharing principles. Energy Policy 2017, 103, 116–126. [Google Scholar]
  16. Van Ruijven, B.; Weitzel, M.; den Elzen, M.; Hof, A.F.; van Vuuren, D.P.; Peterson, S.; Narita, D. Emission allowances and mitigation costs of China and India resulting from different effort-sharing approaches. Energy Policy 2012, 46, 116–134. [Google Scholar] [CrossRef]
  17. Chakravarty, S.; Chikkatur, A.; de Coninck, H.; Pacala, S.; Socolow, R.; Tavoni, M. Sharing global CO2 emission reductions among one billion high emitters. Proc. Nat. Acad. Sci. USA 2009, 106, 11884–11888. [Google Scholar] [CrossRef] [PubMed]
  18. Höhne, N.; den Elzen, M.; Weiss, M. Common but differentiated convergence (CDC): A new conceptual approach to the long-term climate policy. Clim. Policy 2006, 6, 181–199. [Google Scholar] [CrossRef]
  19. Raupach, M.R.; Davis, S.J.; Peters, G.P.; Andrew, R.M.; Canadell, J.G.; Ciais, P.; Friedlingstein, P.; Jotzo, F.; van Vuuren, D.P.; Le Quéré, C. Sharing a quota on cumulative carbon emissions. Nat. Clim. Chang. 2014, 4, 873–879. [Google Scholar] [CrossRef]
  20. Ringius, L.; Torvanger, A.; Holtsmark, B. Can multi-criteria rules fairly distribute climate burdens? OECD results from three burden sharing rules. Energy Policy 1998, 26, 777–793. [Google Scholar] [CrossRef]
  21. Shukla, P.R. Aligning justice and efficiency in global climate change regime: A developing country perspective. Adv. Econ. Environ. Resour. 2005, 5, 121–144. [Google Scholar]
  22. Rose, A.; Stevens, B.; Edmonds, J. International equity and differentiation in global warming policy. Environ Resour. Econ. 1998, 12, 25–51. [Google Scholar] [CrossRef]
  23. Den Elzen, M.; Lucas, P. FAIR 2.0—A Decision-Support Tool to Assess the Environmental and ECONOMIC Consequences of Future Climate Regimes; National Institute of Public Health and the Environment: Bilthoven, The Netherlands, 2003. [Google Scholar]
  24. Höhne, N.; Harnisch, J.; Phylipsen, D.; Blok, K.; Galleguillos, C. Evolution of Commitments under the UNFCCC Involving Newly Industrialized Economies and Developing Countries; Ecofys: Cologne, Germany, 2002. [Google Scholar]
  25. Pan, X.; Teng, F.; Ha, Y.; Wang, G. Equitable access to sustainable development: Based on the comparative study of carbon emission rights allocation schemes. Appl. Energy 2014, 130, 632–640. [Google Scholar] [CrossRef]
  26. Gupta, S.; Tirpak, D.A.; Burger, N.; Gupta, J.; Höhne, N.; Boncheva, A.I.; Kanoan, G.M.; Kolstad, C.; Kruger, J.A.; Michaelowa, A.; et al. Policies, Instruments and Co-operative Arrangements. In Climate Change 2007: Mitigation of Climate Change. Contribution of WG III to the Fourth Assessment Report of the Intergovernmental Panel on Climate Change; Metz, B., Davidon, O.R., Bosch, P.R., Dave, P., Meyer, L.A., Eds.; Cambridge University Press: Cambridge, UK; New York, NY, USA, 2007. [Google Scholar]
  27. Beckerman, W.; Pasek, J. The equitable international allocation of tradable carbon emission permits. Glob. Environ. Chang. 1995, 5, 405–413. [Google Scholar] [CrossRef]
  28. Ringius, L.; Torvanger, A.; Underdal, A. Burden sharing and fairness principles in international climate policy. Int. Environ. Agreem. Politics Law Econ. 2002, 2, 1–22. [Google Scholar] [CrossRef]
  29. Böhringer, C.; Welsch, C. Burden sharing in a greenhouse: Egalitarianism and sovereignty reconciled. Appl. Econ. 2006, 39, 981–996. [Google Scholar] [CrossRef]
  30. Den Elzen, M.; Höhne, N. Reductions of greenhouse gas emissions in Annex and non-Annex I countries for meeting concentration stabilization targets. Clim. Chang. 2008, 91, 249–274. [Google Scholar] [CrossRef]
  31. Meinshausen, M.; Jeffery, M.L.; Guetschow, J.; Robiou du Pont, Y.; Rogelj, J.; Schaeffer, M.; Höhne, N.; den Elzen, M.; Oberthür, S.; Meinshausen, N. National post-2020 greenhouse gas targets and diversity-aware leadership. Nat. Clim. Chang. 2015, 5, 1098–1106. [Google Scholar] [CrossRef]
  32. Pan, X.; Teng, F.; Wang, G. A comparison of carbon allocation schemes: On the equity-efficiency tradeoff. Energy 2014, 74, 222–229. [Google Scholar] [CrossRef]
  33. Rive, N.; Torvanger, A.; Fuglestvedt, J.S. Climate agreements based on responsibility for global warming: Periodic updating, policy choices, and regional costs. Glob. Environ. Chang. 2006, 16, 182–194. [Google Scholar] [CrossRef]
  34. Filar, J.; Gaertner, P. A regional allocation of world CO2 world reductions. Math. Comput. Simulat. 1997, 43, 269–275. [Google Scholar] [CrossRef]
  35. Jacoby, H.; Schlamensee, R.; Wing, I.S. Toward a Useful Architecture for Climate Change Negotiations; Joint Program on the Science and Policy of Global Change Report No.49; MIT: Cambridge, MA, USA, 1999. [Google Scholar]
  36. Park, J.; Kim, C.; Isard, W. Permit allocation in emissions trading using the Boltzmann distribution. Physica A 2012, 391, 4883–4890. [Google Scholar] [CrossRef]
  37. Centre for Science and Environment (CSE). Definitions of Equal Entitlements, CSE-Dossier, Fact Sheet5; Centre for Science and Environment: Delhi, India, 1998. [Google Scholar]
  38. Robiou Du Pont, Y.; Jeffery, M.L.; Gütschow, J.; Christoff, P.; Meinshausen, M. National contributions for decarbonizing the world economy in line with the G7 agreement. Environ. Res. Lett. 2016, 11, 054005. [Google Scholar] [CrossRef]
  39. Zhang, Y.; Wang, D.; Da, Y. Regional allocation of carbon emission quotas in China: Evidence from the Shapley value method. Energy Policy 2014, 74, 454–464. [Google Scholar] [CrossRef]
  40. Winkler, H.; Letete, T.; Marquard, A. Equitable access to sustainable operationalizing key criteria. Clim. Policy 2013, 13, 411–432. [Google Scholar] [CrossRef]
  41. Lecocq, F.; Crassous, R. International Climate Regime beyond 2012: Are Quota Allocation Rules Robust to Uncertainty; World Bank: Washington, DC, USA, 2003. [Google Scholar]
  42. Den Elzen, M.; Berk, M.; Lucas, P.; Criqui, P.; Kitous, A. Multi-stage: A rule-based evolution of future commitments under the climate change convention. Int. Environ. Agreem. Politics. Law Econ. 2006, 6, 1–28. [Google Scholar] [CrossRef]
  43. Den Elzen, M.; Höhne, N.; Brouns, B. Differentiation of countries’ future commitments in a post-2012 climate regime: An assessment of the “South-North Dialogue” proposal. Environ. Sci. Policy 2007, 10, 185–203. [Google Scholar] [CrossRef]
  44. Pan, X.; den Elzen, M.; Höhne, N.; Teng, F.; Wang, L. Exploring fair and ambitious mitigation contributions under the Paris Agreement goals. Environ. Sci. Policy 2017, 74, 49–56. [Google Scholar] [CrossRef]
  45. Van Vurren, D.P.; Stehfest, E.; den Elzen, M.; Kram, T.; van Vliet, J.; Deetman, S.; Isaac, M.; Goldewijk, K.K.; Hof, A.; Beltran, A.M.; et al. RCP2.6: Exploring the possibility to keep global mean temperature increase below 2 °C. Clim. Chang. 2011, 109, 95–116. [Google Scholar] [CrossRef]
  46. Den Elzen, M.; Lucas, P.; van Vuuren, D.P. Regional abatement action and costs under allocation schemes for emission allowances for achieving low CO2-equivalent concentrations. Clim. Chang. 2008, 90, 243–268. [Google Scholar] [CrossRef]
  47. Calvin, K.; Clarke, L.; Kyle, P.; Wise, M.; Hartin, C.; Patel, P. Introduction to the Global Change Assessment Model (GCAM); Joint Global Change Research Institute: College Park, MA, USA, 2015. [Google Scholar]
  48. Ha, Y.; Teng, F. Midway toward the 2 degree target: Adequacy and fairness. Appl. Energy 2013, 112, 856–865. [Google Scholar] [CrossRef]
  49. Van Vuuren, D.P.; Lucas, P.; Hilderink, H. Downscaling drivers of global environmental change: Enabling use of global SRES scenarios at the national and grid levels. Glob. Environ. Chang. 2007, 17, 114–130. [Google Scholar] [CrossRef]
  50. Zhu, S. Comparison and analysis of CO2 emissions data for China. Adv. Clim. Chang. Res. 2014, 5, 17–27. [Google Scholar] [CrossRef]
  51. Pan, X.; Teng, F.; Tian, Y.; Wang, G. Countries’ emission allowances towards the low-carbon world: A consistent study. Appl. Energy 2015, 155, 218–228. [Google Scholar] [CrossRef]
  52. Den Elzen, M.; Lucas, P. The FAIR model: A tool to analyse environmental and costs implications of climate regimes. Environ. Model. Assess. 2005, 10, 115–134. [Google Scholar] [CrossRef]
  53. Peters, G.P.; Andrew, R.M.; Solomon, S.; Friedlingstein, P. Measuring a fair and ambitious climate agreement using cumulative emissions. Environ. Res. Lett. 2015, 10, 105004. [Google Scholar] [CrossRef]
  54. He, J. Analysis of CO2 emissions peak: China’s objective and strategy. China Popul. Resour. Environ. 2014, 12, 189–198. [Google Scholar] [CrossRef]
  55. The International Energy Agency (IEA). World Energy Outlook 2014; The International Energy Agency: Paris, France, 2014. [Google Scholar]
  56. United Nations Development Programme (UNDP). China Human Development Report 2009/10: China and a Sustainable Future: Towards a Low Carbon Economy and Society; China Translation and Publishing Corporation: Beijing, China, 2009. [Google Scholar]
  57. Zhou, N.; Fridley, D.; McNeil, M.; Khanna, N.; Ke, J.; Levine, M.D. China’s Energy and Carbon Emissions Outlook to 2050; Lawrence Berkeley National Laboratory: Berkeley, CA, USA, 2012.
  58. NCE. China and New Climate Economics; The New Climate Economics Program in Tsinghua University: Beijing, China, 2014. (In Chinese) [Google Scholar]
  59. Intergovernmental Panel on Climate Change (IPCC). Emissions Scenarios: A Special Report of IPCC Working Group III; Cambridge University Press: Cambridge, UK; New York, NY, USA, 2000. [Google Scholar]
  60. Kriegler, E.; Riahi, K.; Bauer, N.; Schwanitz, V.J.; Petermann, N.; Bosetti, V.; Marcucci, A.; Otto, S.; Paroussos, L.; Rao, S.; et al. Making or breaking climate targets: The AMPERE study on staged accession scenarios for climate policy. Technol. Forecast. Soc. Chang. 2014, 90, 24–44. [Google Scholar] [CrossRef]
  61. Luderer, G.; Bosetti, V.; Jakob, M.; Leimbach, M.; Steckel, J.C.; Waisman, H.; Edenhofer, O. The economics of decarbonizing the energy system-results and insights form the RECIPE model intercomparison. Clim. Chang. 2012, 114, 9–37. [Google Scholar] [CrossRef]
  62. United Nations Environment Programme (UNEP). The Emissions Gap Report 2016; United Nations Environment Programme: Nairobi, Kenya, 2016. [Google Scholar]
  63. Robiou Du Pont, Y.; Jeffery, M.L.; Gütschow, J.; Rogelj, J.; Christoff, P.; Meinshausen, M. Equitable mitigation to achieve the Paris Agreement goals. Nat. Clim. Chang. 2017, 7, 38–43. [Google Scholar] [CrossRef]
  64. Climate Action Tracker (CAT). China Page: Current Policy Projections; Climate Analytics: Berlin, Germany; Ecofys: Cologne, Germany; NewClimate Institute: Cologne, Germany; PIK: Potsdam, Germany, 2017. [Google Scholar]
  65. Kuramochi, T.; Asuka, J.; Fekete, H.; Tamura, K.; Höhne, N. Comparative assessment of Japan’s long-term carbon budget under different effort-sharing principles. Clim. Policy 2016, 16, 1029–1047. [Google Scholar] [CrossRef]
  66. Rogelj, J.; den Elzen, M.; Höhne, N.; Fransen, T.; Fekete, H.; Winkler, H.; Schaeffer, R.; Fu, S.; Riahi, K.; Meinshausen, M. Paris Agreement climate proposals need a boost to keep warming well below 2 °C. Nature 2016, 534, 631–639. [Google Scholar] [CrossRef] [PubMed]
Figure 1. China’s NDC emissions in comparison with emissions allowances in 2030. The labels sequentially correspond to the seven categories (and the number of schemes within categories) in Table 1. The symbol “×” marks median over schemes in each category. The cost-effectiveness category has only one scheme. The responsibility and equal cumulative per capita emissions categories both have two schemes, and the boxes indicate minimum and maximum ranges. For the other four categories, the box-and-whisker plots indicate the maximum, upper quartile, lower quartile, and minimum over schemes. The red lines indicate China’s projected NDC CO2 emissions in 2030 corresponding to the 60–65% targets.
Sustainability 09 01104 g001
Figure 2. Peak years of China’s emissions allowances. The figures indicate the number of schemes overlapping at those points.
Sustainability 09 01104 g002
Figure 3. Cumulative NDC emissions in comparison with carbon budgets for China in 2011–2030. The red lines indicate China’s projected cumulative CO2 emissions during 2011–2030 corresponding to the 60–65% targets.
Sustainability 09 01104 g003
Figure 4. China’s carbon budgets in 2011–2050. The red lines indicate China’s projected cumulative CO2 emissions during 2011–2030 corresponding to the 60–65% targets.
Sustainability 09 01104 g004
Figure 5. Fair ranges of China’s emissions allowances under different baseline scenarios.
Sustainability 09 01104 g005
Figure 6. Exemplary emissions trajectories for China under RCP2.6. The green and blue areas correspond to the 65% and 60% target, respectively. When allocations are extended to 2100, only historical responsibility scheme remains in the responsibility category (schemes sharing mitigation burdens based on static responsibilities in the base year are excluded for long-term allocations in this section). In addition, schemes that cannot work with negative emissions allowances are also excluded in this section (global emissions under RCP2.6 would reduce to below zero after 2070).
Sustainability 09 01104 g006
Table 1. Effort-sharing framework in this study.
CategoryDescriptionEffort-Sharing Schemes and Main Sources of Their Implementations in the Literature
Responsibility C1Reductions are shared among the participating parties in line with their historical responsibilities to global warmingHistorical responsibility a [33], the Shapley value method [34]
Capability C2Emissions allowances are assigned in terms of the ability to payAbility to pay approach [35], equitable international allocation [27], emission intensity target approach [23]
Equality C3Allocations are provided in the view of immediate or converging per capita emissionsBoltzmann distribution [36], sharing emission among one billion high emitters [17], per capita emission convergence b [6], CSE convergence b [37], equal per capita emission c [38], the Indian Prime Minister proposal [23]
Responsibility–capability–need C4Burdens are shared by synthetically considering the metrics for responsibility, capacity, and needThe entropy-based method [39], the greenhouse development rights framework d [5], the South African approach e [40]
Equal cumulative per capita emissions C5Allocations provide an equal per capita cumulative emission to all partiesEqual per capita cumulative emissions c [7]
Staged approaches C6Different parties take differentiated commitments in various stages; the stage of a party could be determined by various indicatorsCommon but differentiate convergence f [18], the grandfathering rule [41], the multi-criteria convergence g [20], the multi-stage approach h [42], the preference score approach [23], the South–North dialogue approach [43], the Triptych approach [23]
Cost-effectiveness C7Allocations minimize abatement costs of the worldEqual marginal abatement cost i [32]
Notes: a extended from the Brazilian Proposal and responsibilities are proportional to cumulative emissions; b exponential or linear convergence; c based on dynamic population or static population in the reference year; d responsibilities are calculated as the sum of annual responsibilities or approximated by cumulative emissions; e responsibilities are dynamic or static in the reference year; f threshold is determined by per capita emission or GDP; g full or gradual participation; h threshold is determined by a capacity-responsibility index, per capita emission or GDP; i marginal abatement cost curves are model-dependent and beset with high uncertainties. In this study, allocations are obtained from the Global Change Assessment Model (GCAM) (the version 4.0).
Table 2. Key parameter settings.
ParameterValues
Starting year to cumulate emissions1850 [7,14]
Convergence year of per capita emissions2050 [6,52]
Discount rate of historical emissions0 [14,40]
Weights of responsibility and capability(0.6, 0.4) [14,40]
Elasticity of per capita emissions with per capita GDP1 [5,17]
Per capita GDP threshold for participations30% of the average per capita GDP (in MER) of Annex-I countries in 1990 [25,32]
Table 3. China’s projected NDC emissions under different GDP growths.
Study Average Growth before 2020 (%)Average Growth in 2020–2030 (%)Emissions in 2030 (GtCO2) aEmissions in 2011–2030 (GtCO2) b
This study 6.55.29.8–11.2183–198
NCE [58]high7.96.012.1–13.9207–225
median7.34.810.2–11.7192–208
low6.13.37.9–9.1170–183
IEA [55] 6.95.310.3–11.8189–205
UNDP [56] 6.65.510.3–11.7186–202
LBNL [57] 7.85.911.8–13.5205–222
a the ranges correspond to the 60–65% targets, and emissions levels are calculated as the product of the projected GDP (determined by the growth rates in different studies) and emissions intensity (determined by the 60–65% improvements from the 2005 level) in 2030; b the ranges also correspond to the 60 (40% in 2020)–65% (45% in 2020) targets, which are approximated by linear interpolations between 2012–2020 and 2020–2030.
Table 4. Maximal emissions allowances for China over different pathways and schemes.
Changes in 2030 (%) a2030 (GtCO2)2011–2030 (GtCO2)
−40 to −3010.0 to 10.2189 to 196
−30 to −2010.2 to 10.5190 to 208
−20 to −1010.5 to 10.7193 to 207
−10 to 010.8 to 10.9198 to 212
0 to 1011.0 to 11.2204 to 222
10 to 2011.2 to 11.5210 to 222
a a negative number indicates global emissions in 2030 decrease from 2010 levels, while a positive number indicates increasing.
Table 5. Mitigation targets for China beyond 2030.
Steady-State LevelCategoryYears Reaching Zero EmissionsCO2 Emissions Levels in 2050 (%, as Percentage of the 2010 Level)
ZeroC1205526
C42064–207653–74
C52052–205812–39
C120500
C42057–206837–70
C52047–20520–12
NegativeC1206147
C42068–207962–79
C52059–206439–54
C1205530
C42062–207156–78
C52053–205818–41
Notes: for each steady-state level, the upper and lower sections correspond to the 65% and 60% target by 2030, respectively.

