1. Introduction
Regarding worldwide efforts in raising renewable energies’ contribution to overall energy supply, Germany is seen as both ambitious and successful in continuingly increasing the installed capacity of renewable energies [
1,
2]. The declared target within the scope of the so called “energy transition” is to heighten the national proportion of renewable energies from 30% at present to 40–45% by 2025, to 55–60% by 2035, and to at least 80% by 2050 [
3]. Within this framework, wind energy is awarded a crucial role. Wind farms can mostly be found in the northern part of Germany near the coast or offshore, where wind resource is abundant [
4]. The expansion of onshore wind turbines, however, is experiencing a significant upswing as well. For instance, the onshore capacity of wind energy rose from 5 GW in 2000 to nearly 31 GW in 2012 and is now holding a share of 34% in electricity supply from renewable energies [
5].
In the southwestern German federal state of Baden-Wuerttemberg, wind energy contributed 5.8% to the total electricity production in 2015 [
6], and is supposed to contribute 10% by 2020 [
7]. However, to realize this goal in a region with rather low mean annual wind speed, the potential of wind energy has to be accurately assessed at very small spatial scales, and suitable areas for wind energy production have to be identified.
Wind energy potential can be divided up into five different levels: meteorological potential (MP), geographical potential (GP), technical potential, economic potential, and implementation potential [
8,
9,
10]. The meteorological potential describes the available kinetic energy contained in the atmosphere over an area. MP can be assessed by wind power density (
P). Sites where
P values are below 100 W/m
2 are considered as unprofitable, those with values around 400 W/m
2 are considered as profitable, and those with values around 700 W/m
2 are considered as very profitable [
9]. The geographical potential corresponds to the total exploitable area (in km
2) for installing wind turbines within a region based on the meteorological potential and taking into account geographical restrictions such as orography, competing land use, and legislation on protection requirements. The technical potential addresses the minimization of GP due to turbine efficiency and transformation from kinetic to electrical energy (in kWh/year). It also defines the economic wind energy potential, namely, the potential which can be realized when taking into consideration the cost of installing wind turbines. The implementation potential is an addition to the economic potential and assesses the installable capacity during a specific time period, taking into account institutional constraints and legal incentives.
Since evaluating GP is an important step to find suitable locations for wind energy turbines, previous studies have assessed GP in southwest Germany based on annual wind speed data [
8,
11]. However, wind speed in Central Europe shows pronounced seasonal behavior being considerably higher in winter than in summer [
12]. Therefore, detailed information about the intra-annual dynamics of the spatiotemporal pattern of wind speed can be helpful to seasonally optimize the utilization of wind energy.
This investigation aims at assessing GP in southwest Germany. In a first step, GP is assessed based on the mean annual MP. In order to account for the seasonal behavior of MP, GP is also determined for the mean MP in the month with the maximum MP, which is December, and the month with the minimum MP, which is August. Since, in Germany, the determination of restriction criteria is upon the federal states, this study focuses on GP assessment in the southwestern German federal state of Baden-Wuerttemberg.
2. Materials and Methods
2.1. Study Area
The southwestern German federal state of Baden-Wuerttemberg is the study area. It extends over 35,752 km
2 and shows a diverse landscape with a highly complex orography. Main orographic characteristics are the low mountain ranges Black Forest (length ~150 km, width ~30–50 km, highest elevations > 1,450 m above sea level (a.s.l.)) and Swabian Alb (length ~180 km, width ~35 km, highest elevations > 1,000 m a.s.l.) as well as the broad, flat Rhine Valley including the lowest elevations (85 m a.s.l.). Most of the study area’s relief varies between 200 and 800 m a.s.l. [
13]. The highest mountain top in the study area is the Feldberg (1,493 m a.s.l.). Due to small-scale land cover changes (<1 km), the landscape is strongly fragmented. According to the Corine Land Cover (CLC) 2006 dataset for Germany [
14], the study area’s surface is mainly covered by agricultural areas (51%), forests (38%), and artificial surfaces like urban areas, airports, road networks, and rail networks (9%).
2.2. Methodology
2.2.1. Data
In order to achieve an accurate and reliable assessment of GP, proper data in accordance with the required information about MP and the determined restriction criteria is needed. Therefore, several sources are used. High spatial resolution (50 m × 50 m)
P maps for characterizing MP were created based on the methods outlined in References [
13,
15]. The most relevant data for nature conservation aspects are covered by freely available geodata from the State Institute for the Environment, Measurements, and Nature Conservation of Baden-Wuerttemberg (LUBW) [
16]. The CLC dataset for Germany with a spatial resolution of 100 m × 100 m as well as a digital landscape model from the German Federal Agency for Cartography and Geodesy [
17] accounted for applying the remaining legal restriction criteria. In addition, to determine slope, a digital elevation model (DEM) from the State Agency for Spatial Information and Rural Development with a spatial resolution of 50 m × 50 m was used.
To estimate GP in the study area, a GIS-based approach was employed using ESRI’s ArcGIS 10.2. software. First, areas with sufficient MP were located. After that, geographical restrictions and their corresponding expansion were identified in order to determine the remaining freely available areas. In a third step, intersections of areas with sufficient MP and areas without geographical restrictions were sought out. GP was then estimated for the entire study area on a 50 m × 50 m grid.
2.2.2. MP assessment
Mapping of MP is based on 58 near surface wind speed (
Ug) time series measured by the German Weather Service (DWD) in the period from 1 January 1979 to 31 December 2010 [
15]. After the data preparation, which included gap filling, testing for homogeneity, and detrending [
13], median wind speed (
) values were computed over the entire investigation period and on a monthly basis. Subsequently,
values were extrapolated to hub height (
hhub) by using the Hellmann power law [
18]:
was calculated for hhub = {100 m, 140 m, 200 m}. These hhub values were chosen because in the study area, hhub of existing wind turbines mainly varies between 100 m and 140 m. In addition, hhub = 200 m was chosen to take the future height development of wind turbines into account.
In this study, a location suitable for wind turbine installation, from a meteorological viewpoint, is defined as a site where the median wind power density (
) exceeds 100 W/m
2. Therefore,
was computed at every location over the entire investigation period and on a monthly basis by:
with air density
being 1.225 kg/m
3. The least squares boosting (LSBoost) method [
13,
19] was used to predict
at every grid cell in the study area. The underlying predictor variables were created based on CLC, DEM, and European Centre for Medium-Range Weather Forecasts re-analysis (ERA)-Interimdata [
20]. A detailed description of model building and predictor selection is outlined in a previous study [
15].
2.2.3. Determination of Restriction Criteria
The criteria for assessing GP have been identified in various previous studies for different regions [
10,
21,
22,
23,
24,
25,
26,
27]. Generally, there are two different categories of criteria: exclusion criteria and consideration criteria comprising orographical restrictions and restrictions due to competing land use or protection requirements. Exclusion criteria include, in general:
High elevation areas (>2,000 m), because of low air density
Sloped areas (>15°), because of large proportions of turbulent airflow
Water bodies and wetlands, because of their unsuitability for installation and their need for protection
Urban settlement areas and urban infrastructure, because of protection from noise, shadowing, and damage (i.e., from ice dropping)
Agricultural land, because of the competing land use
Nature conservation zones, because of their special protection requirements.
Depending on a country’s legislation, some of the above listed exclusion criteria may also be consideration criteria, such as agricultural land and nature conservation zones, due to the possibility of dual land use or compensation measures.
Wind farm planning in the study area is upon the regional federal associations, local communities, and cities [
28]. Statutory regulations give specifications for site assessment such as minimum distances to urban settlements or nature conservation areas [
7].
In this investigation, the applied legal exclusion and consideration criteria for GP assessment are based on a list given by the LUBW [
16]. Orographical exclusion criteria were taken from References [
10,
22,
25]. The applied exclusion criteria include:
Areas with slopes greater than 15°
Water bodies such as lakes and rivers
Residential areas with a buffer zone of 700 m and industrial areas with a buffer zone of 250 m
Traffic infrastructure including 100 m buffer zones around the road network, 50 m buffer zones around the railway network, and 1,000 m buffer zones around airports
Protection areas such as national parks, nature conservation areas, inner zones of biosphere areas, protective forests with an additional buffer zone of 200 m
European bird protective areas with the existence of wind energy sensitive bird species with a buffer zone of 700 m.
The applied consideration criteria are water protection zones, natural monuments, biotopes, landscape protection areas, outer zones of biosphere areas, flora-fauna-habitat directive areas, nature parks, and moors.
3. Results
3.1. MP Assessment
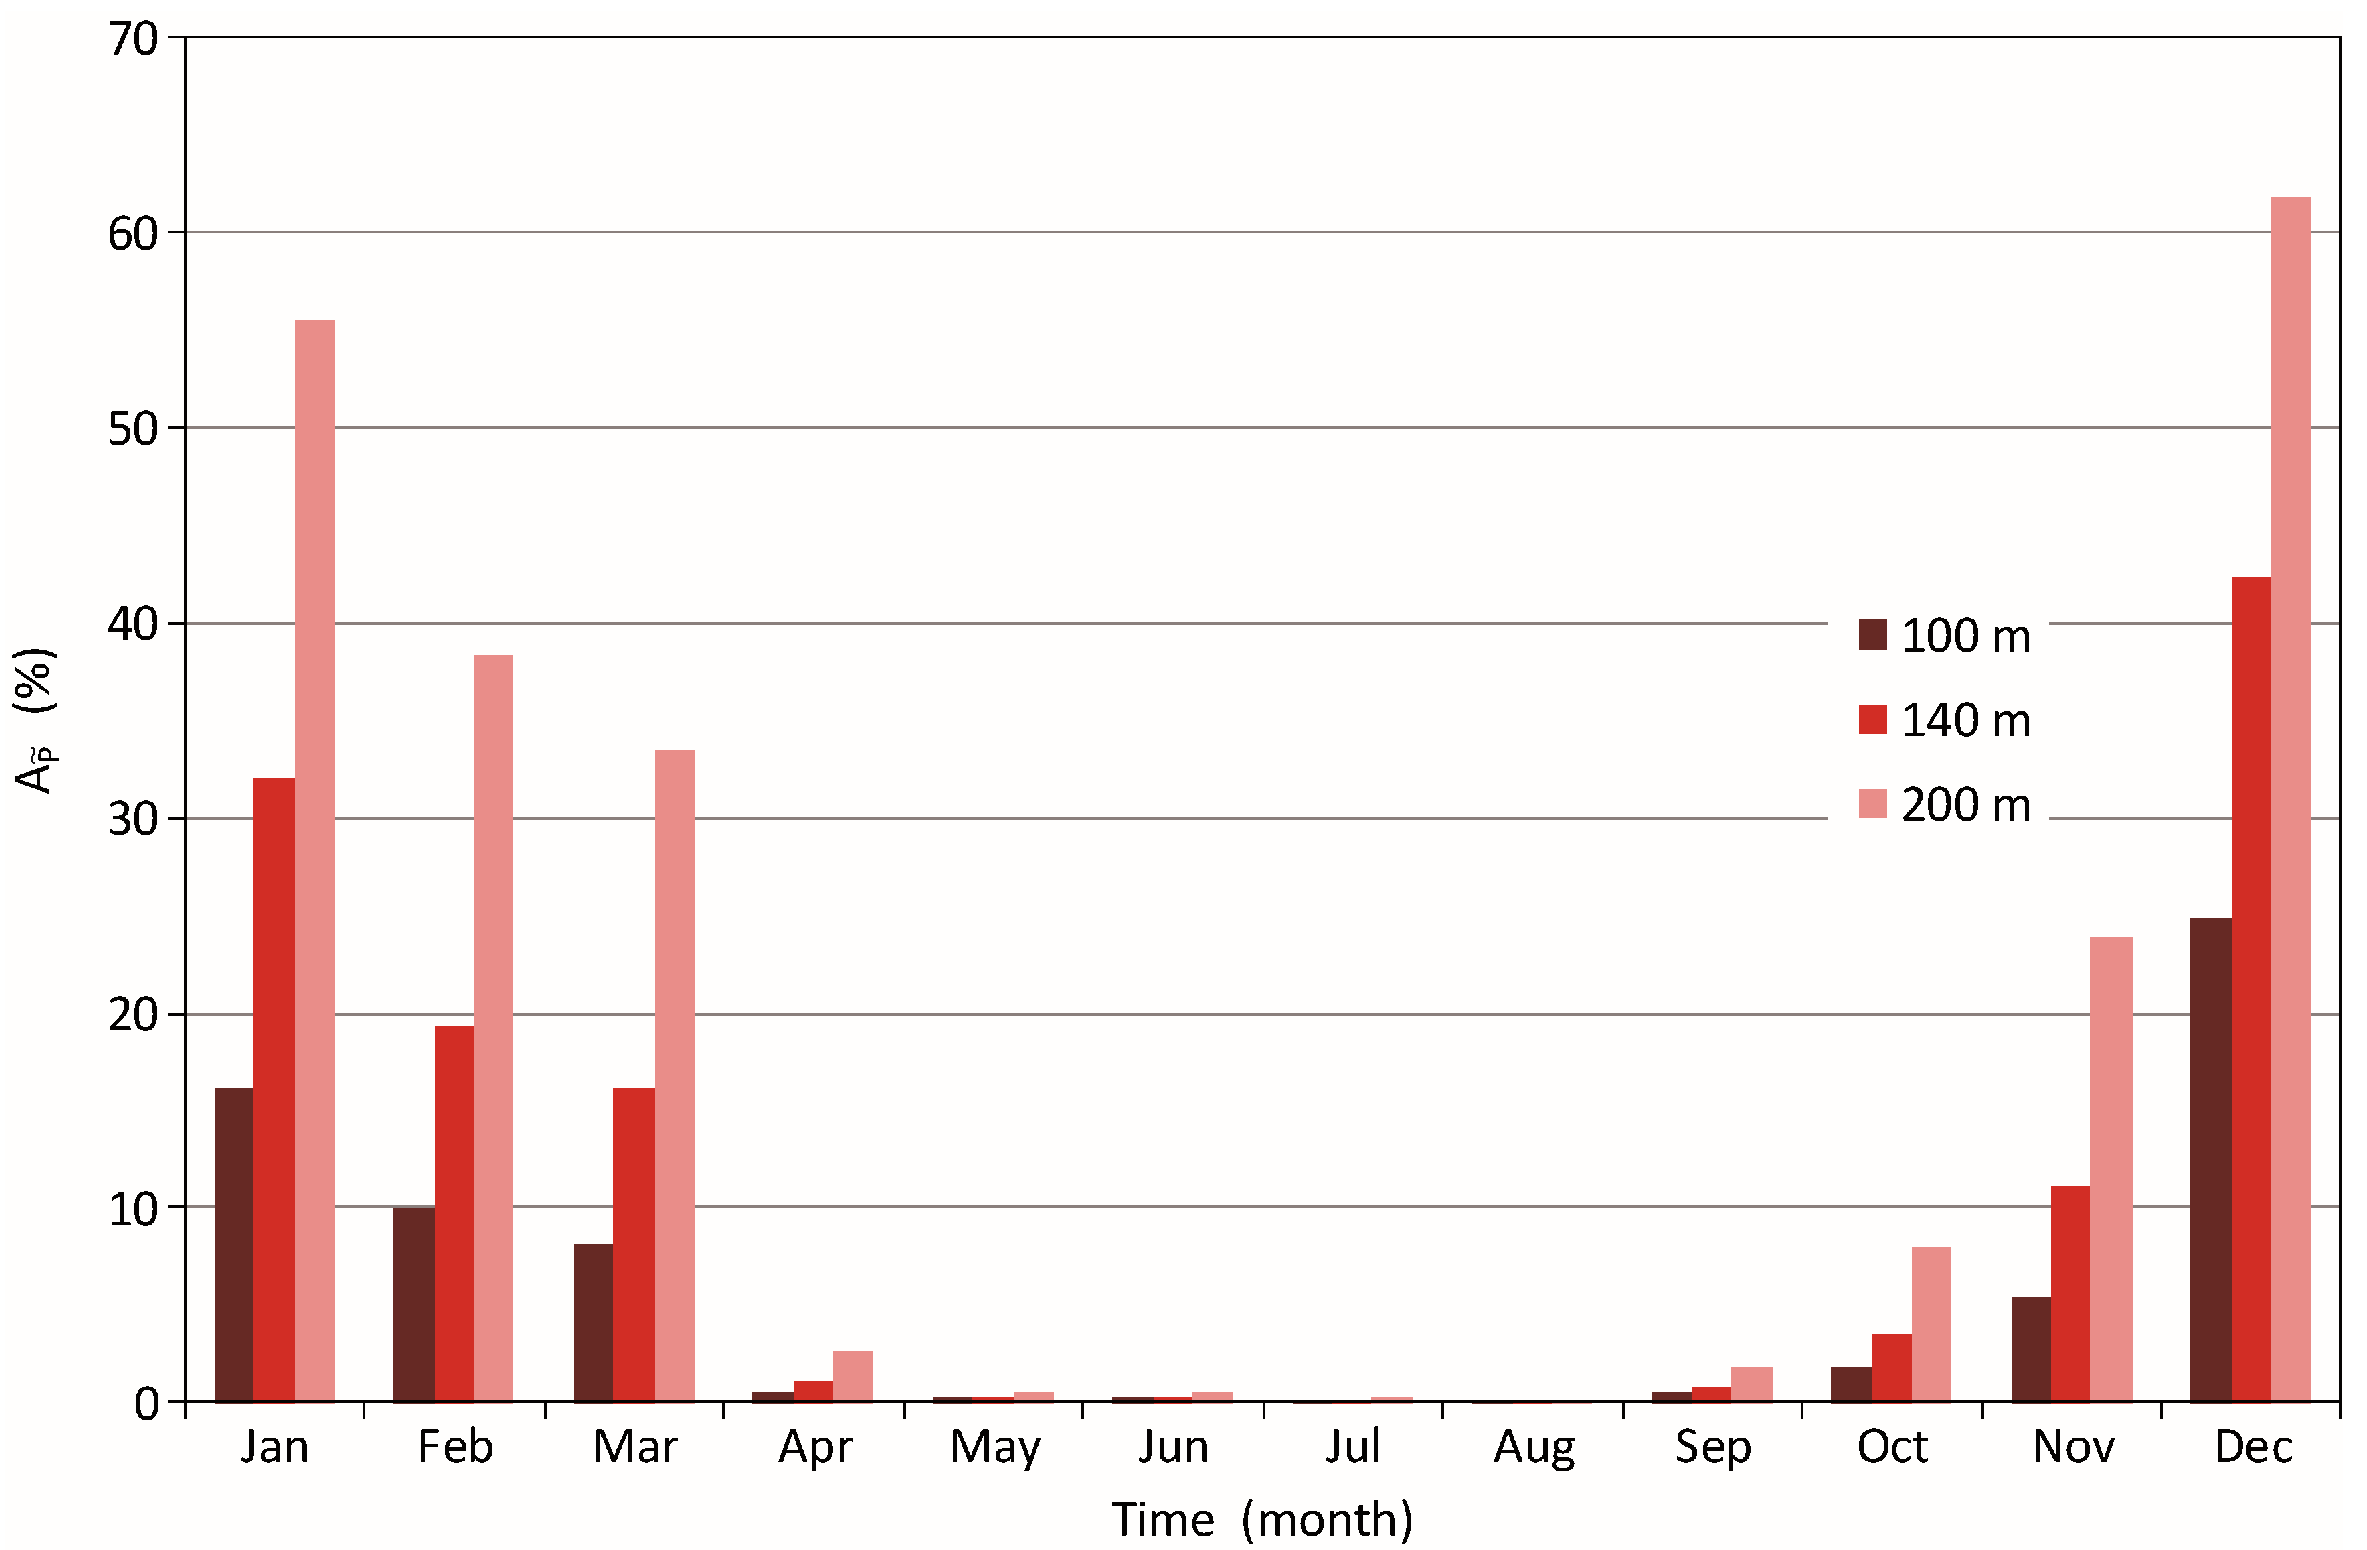
It was found that highest
values occur in December, while lowest
values occur in August. The monthly
share of at least 100 W/m
2 (
) at
hhub = {100 m, 140 m, 200 m} associated with monthly
is shown in
Figure 1. Over the course of the year,
varies between 0.05% (August,
hhub = 100 m) and 62% (December,
hhub = 200 m). At all analyzed hub heights, the highest
values were calculated for December (25% at
hhub = 100 m; 42% at
hhub = 140 m). The minimum
always occurs in August (0.06% at
hhub = 140 m; 0.10% at
hhub = 200 m). The higher
values during the Northern Hemisphere winter (December–January–February) are due to the more pronounced west wind drift [
29].
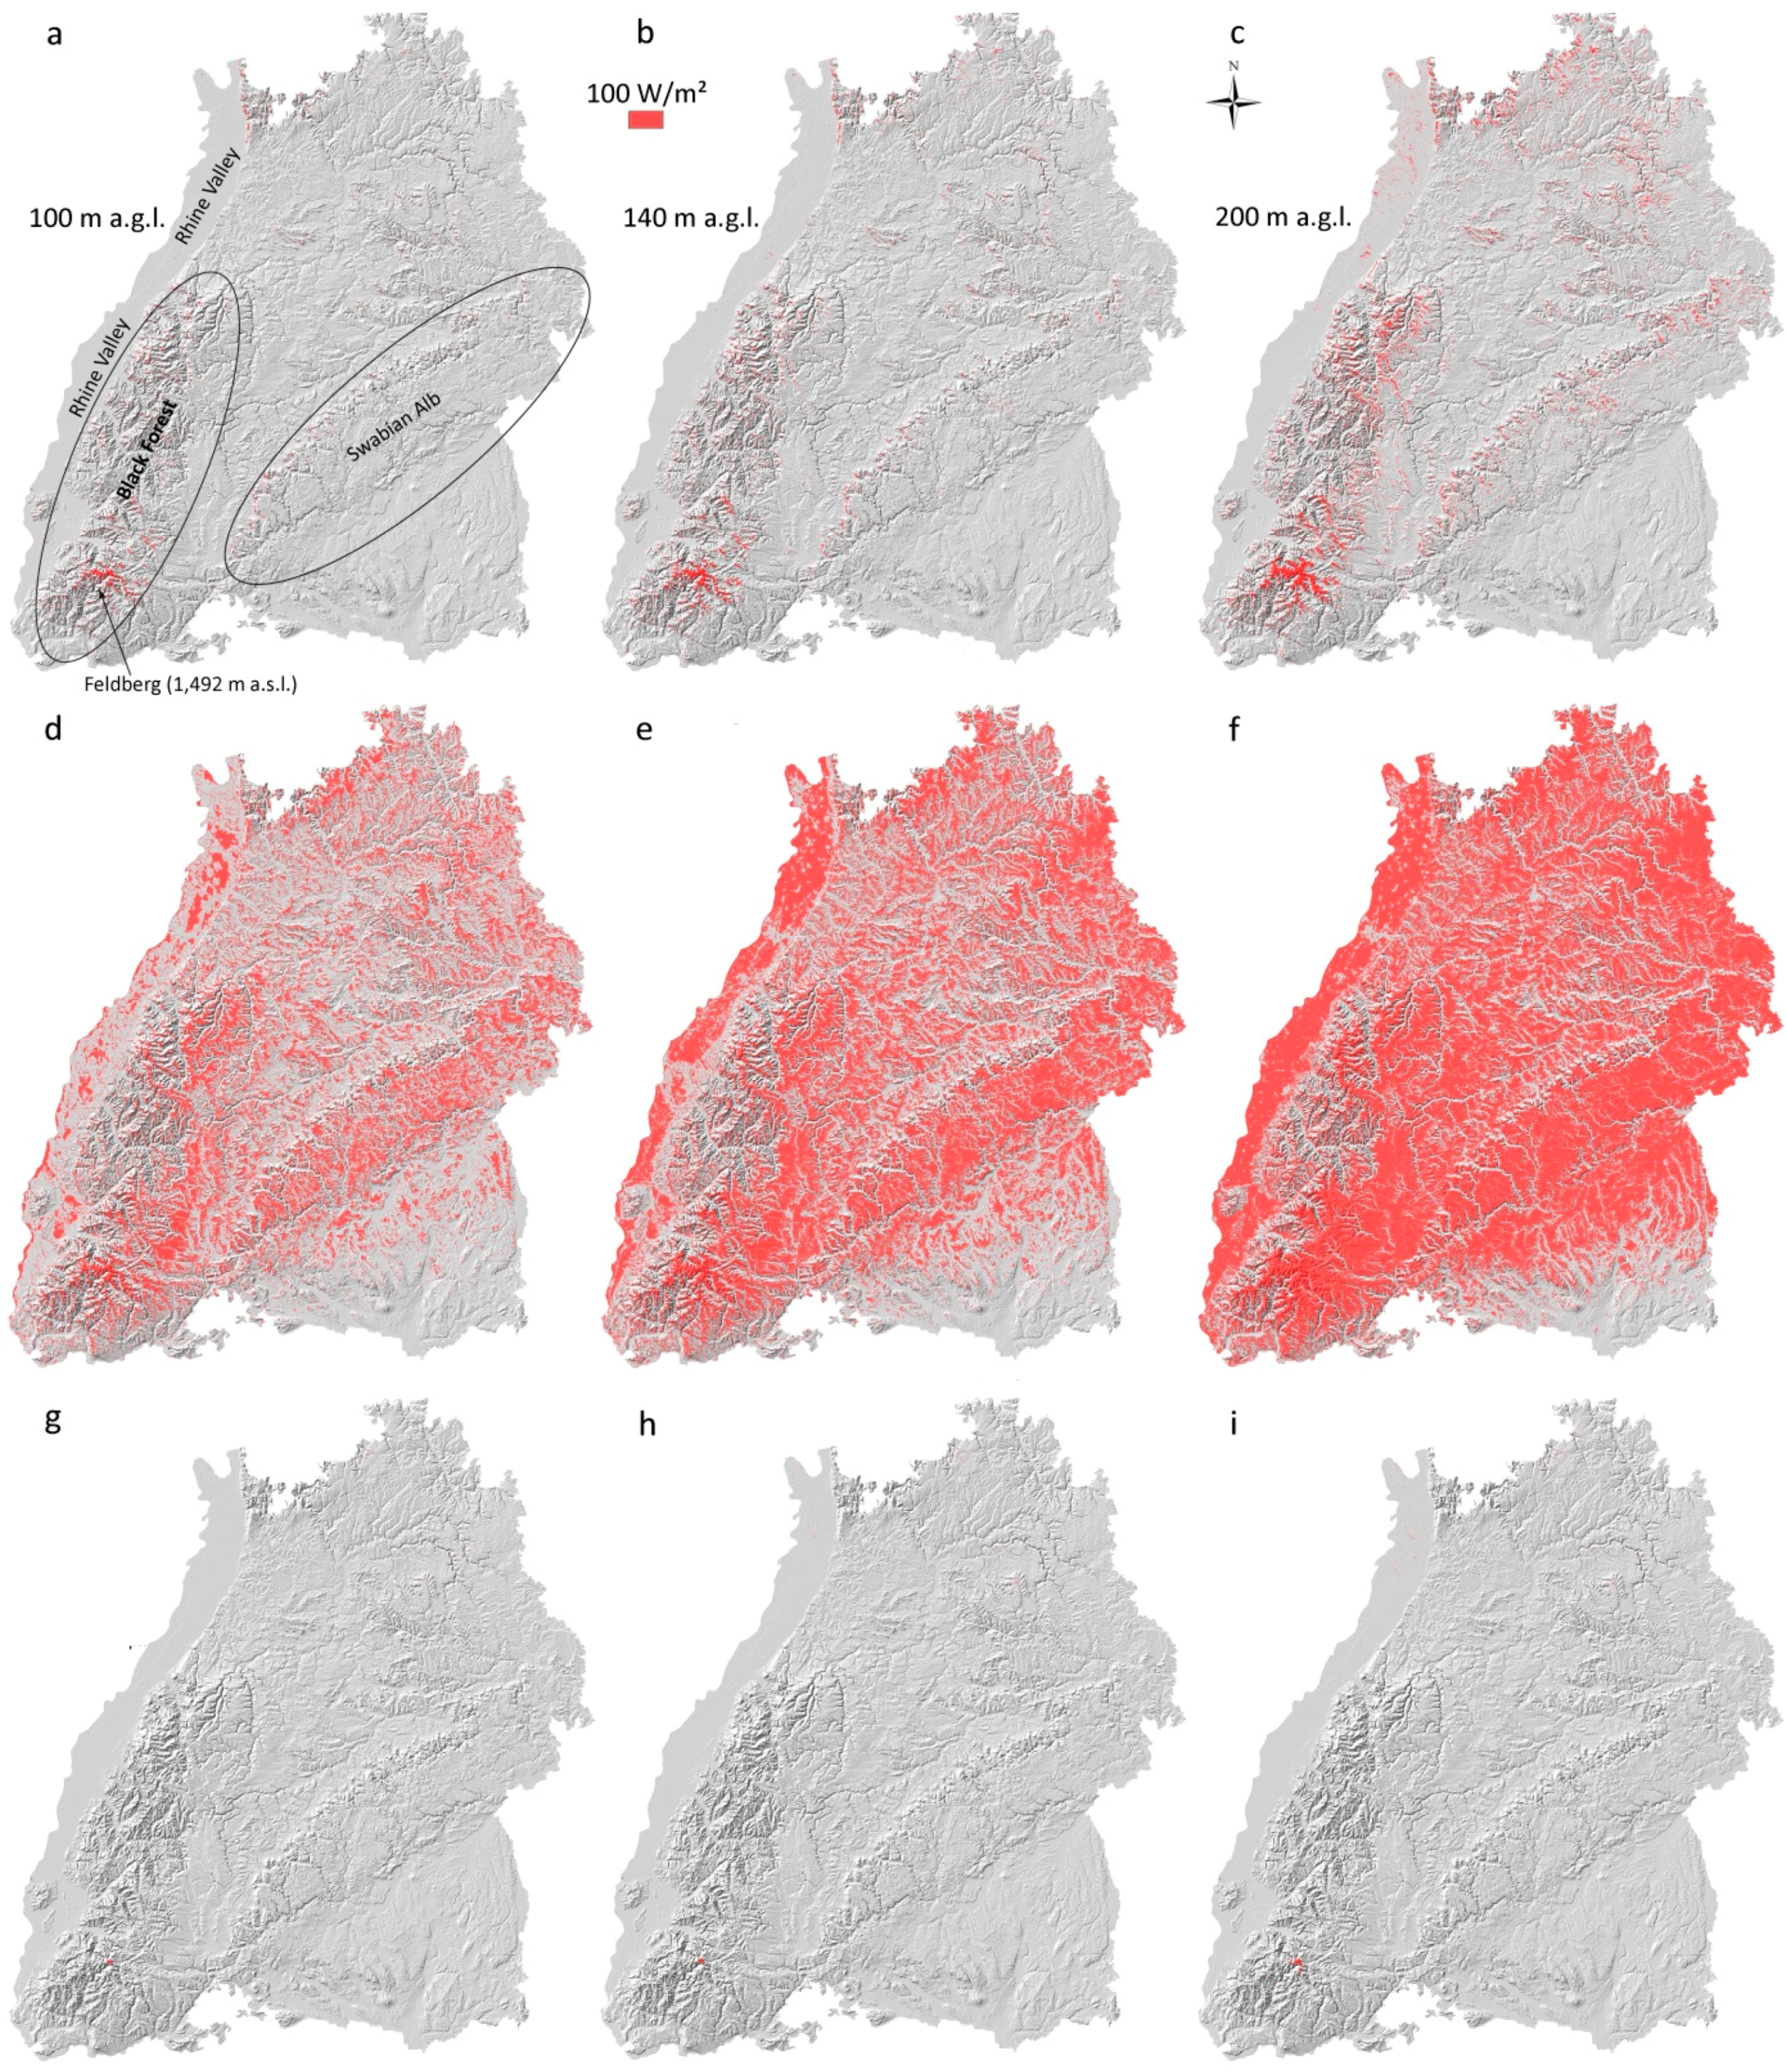
Areas where the annual
at
hhub = 100 m is at least 100 W/m
2 account for 0.9% (316 km
2) of the total study area and are dispersed over the heights of the Black Forest, especially around the Feldberg and over the Swabian Alb (
Figure 2a). The growth rate in annual
at
hhub = 140 m amounts to only 0.6%, leading to a share of 1.5% (530 km
2) in the total area (
Figure 2b). At
hhub = 200 m, the rise of
in areas results in 3.8% (1,377 km
2) with the areas being mainly located in the northeastern part of the study area (
Figure 2c).
In the course of the year, the maximum
occurs in December. With reference to the total study area, it amounts to 24.9% (8,964 km
2) at
hhub = 100 m, to 42.3% (15,242 km
2) at
hhub = 140 m, and to 61.8% (22,289 km
2) at
hhub = 200 m. It spreads over vast parts of the study area including flat areas such as the Rhine Valley (
Figure 2d–f). Only the very southeastern part hardly contains any areas with
of at least 100 W/m
2.
The month in which MP is lowest for all studied hub heights is August (
Figure 2g–i). Only 0.05% (17 km
2) at
hhub = 100 m, 0.06% (22 km
2) at
hhub = 140 m, and 0.09% (32 km
2) at
hhub = 200 m of the study area show
values of at least 100 W/m
2. These areas are mainly located in the Feldberg region where the highest mountain tops are located.
3.2. Areas with Geographical Restrictions
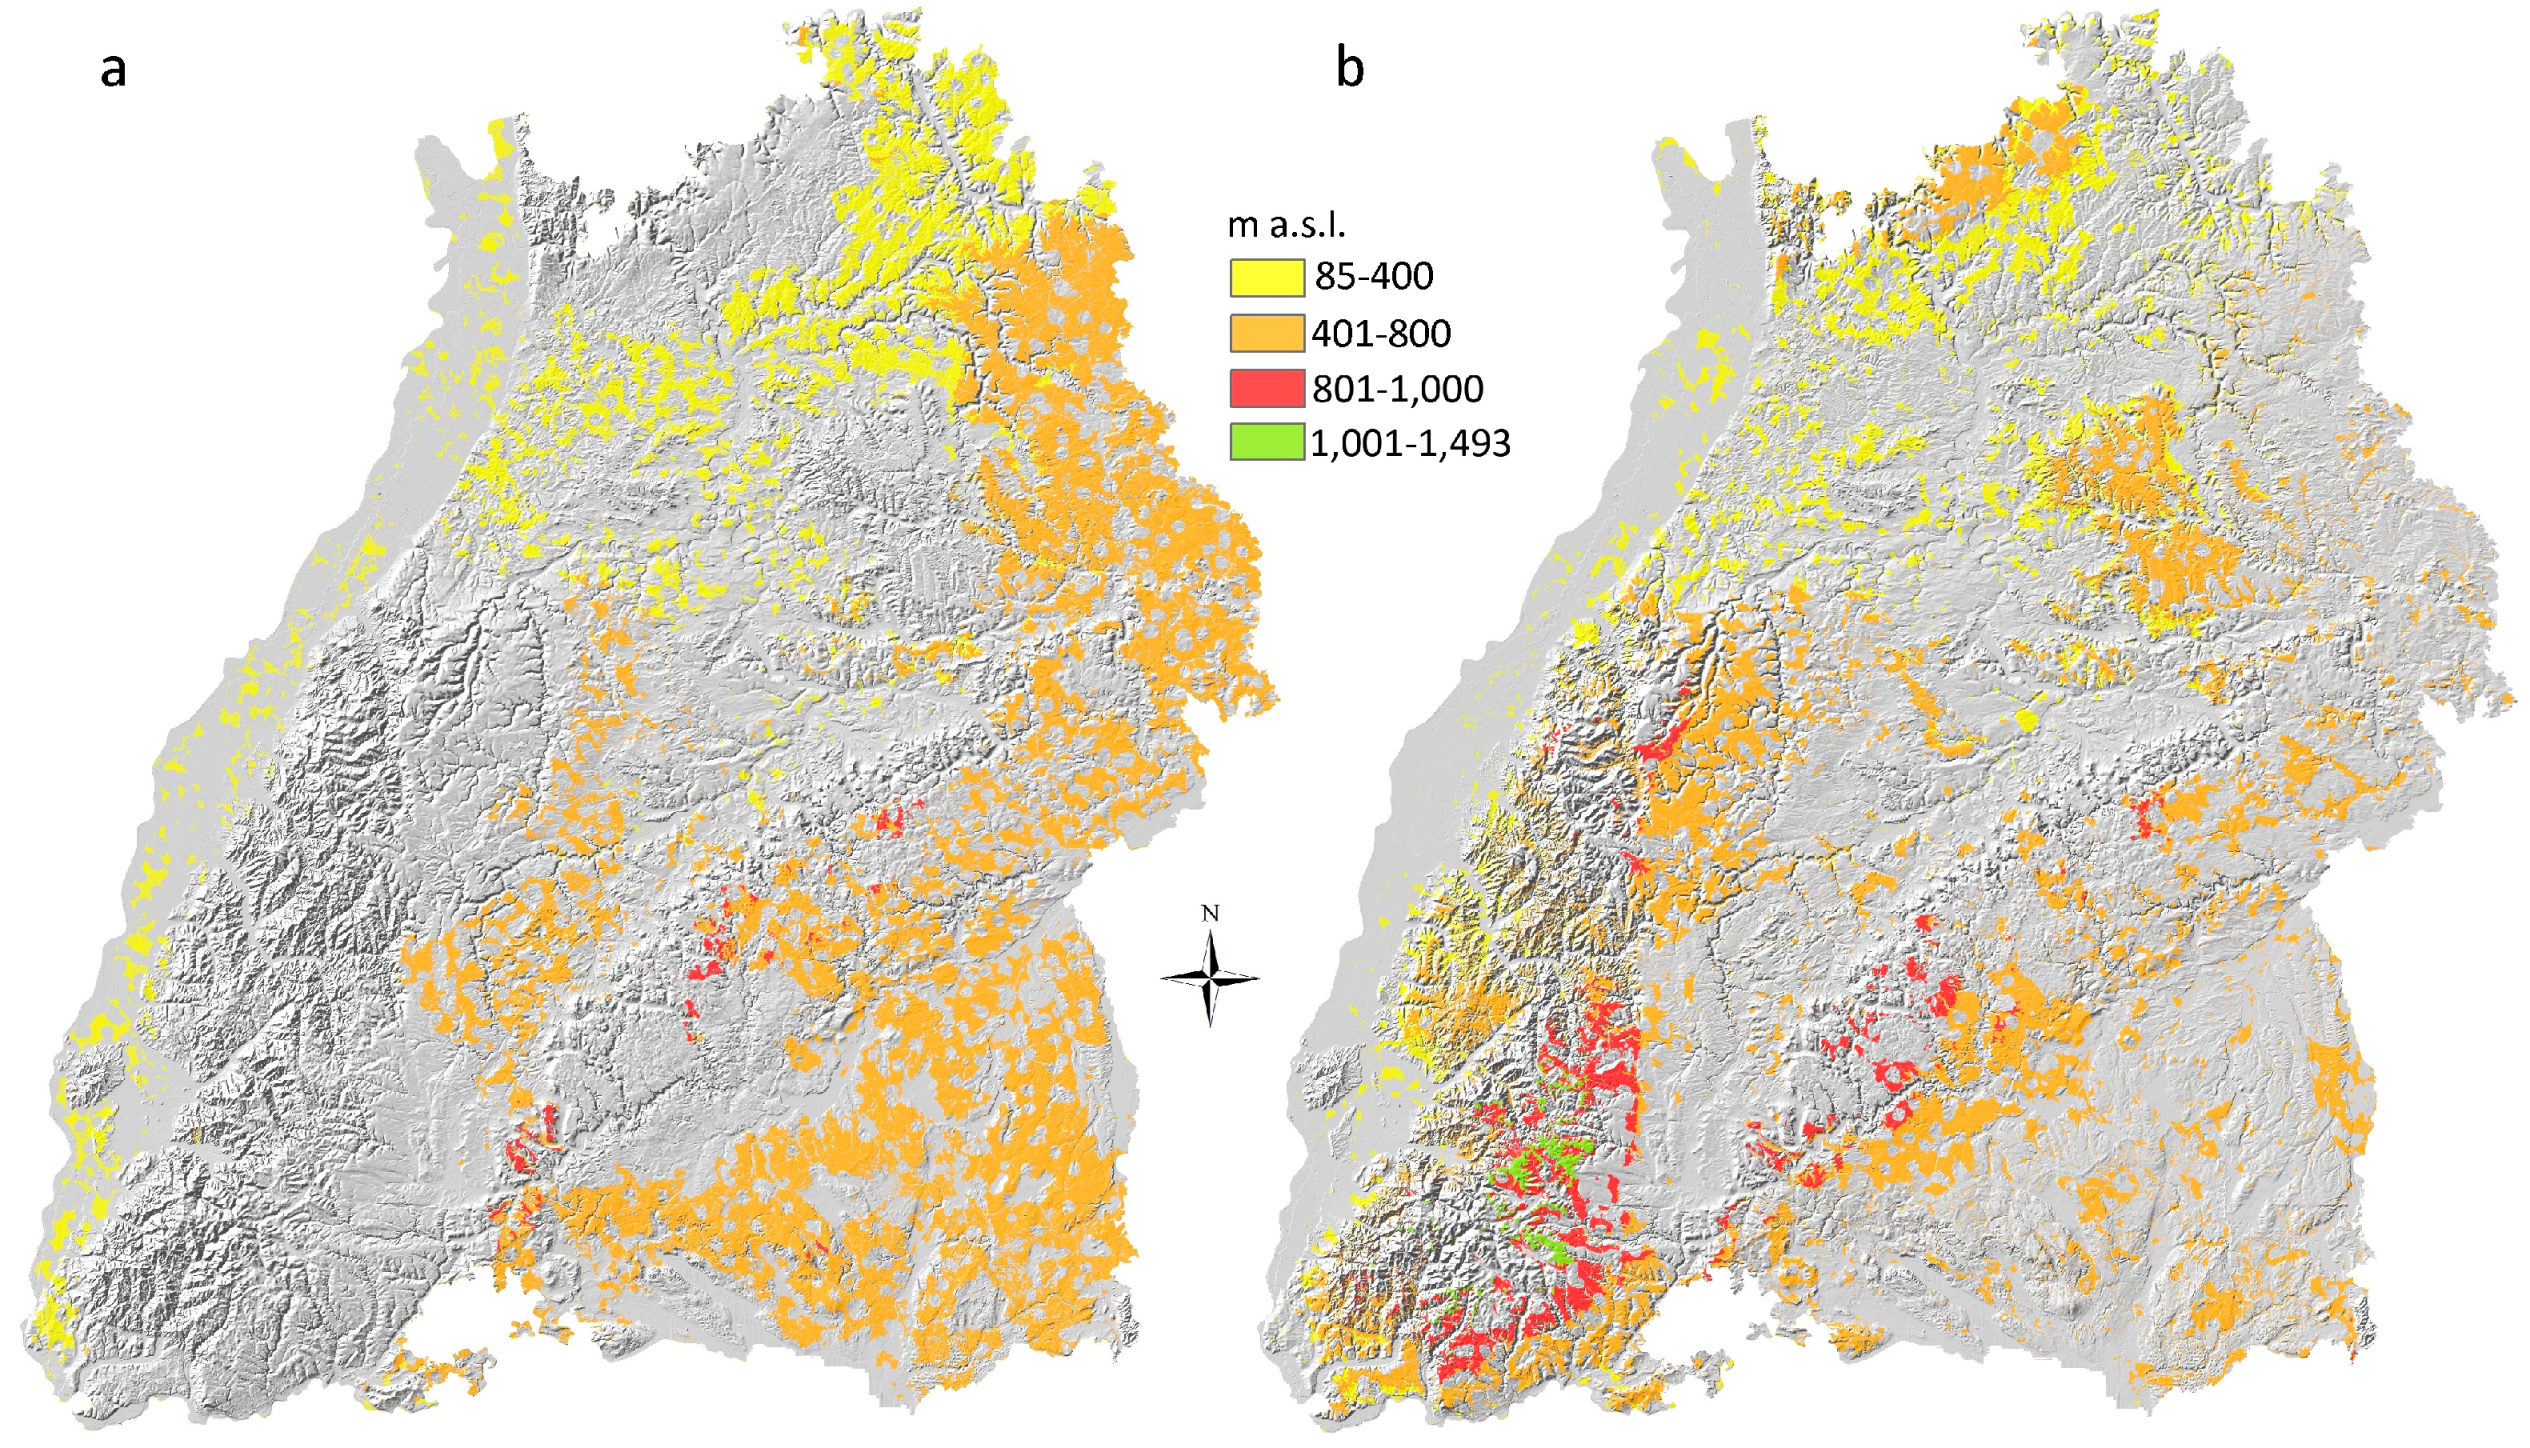
Exclusion areas account for 59.3% (21,201 km2), whereas consideration areas account for 18.7% (6,721 km2). Thus, the area with geographical restrictions is 78.0% (27,922 km2) of the total study area. Accordingly, available areas amount to 22.0% (7,865 km2). Assuming that all consideration areas were free to be used for wind power utilization, the amount of usable areas would rise to 40.8% (14,587 km2).
Figure 3a shows the distribution of available areas and consideration areas for four different elevation ranges. Available areas can mostly be found in the elevation range of 401–800 m, accounting for 15.4% (5,506 km
2) of the total study area. In the elevation range of 85–400 m, available areas make up 6.3% (2,252 km
2), whereas in the range of 801–1,000 m a.s.l. they only account for 0.2% (72 km
2). There are no available areas in the range of 1,001–1,493 m a.s.l.
The distribution of the available areas among the elevation ranges shows that many of the productive heights of the Black Forest and the Swabian Alb are excluded from areas available for wind energy utilization. Generally, available areas are mainly limited to the eastern parts of the study area as well as to small sections in the Rhine Valley and in the lee of the Black Forest.
Consideration areas (
Figure 3b) are distributed similarly over each category: 5.1% (1,823 km
2) fall in the elevation range of 85–400 m, 11.6% (4,147 km
2) fall in the elevation range of 401–800 m, and 1.7% (608 km
2) lie between 801 and 1,000 m a.s.l. Consideration areas above 1,000 m a.s.l. are found in 0.4% (143 km
2) of the study area. Some parts of the Black Forest and the Swabian Alb might be usable if case-by-case decision-making falls in favor of those areas.
3.3. GP Assessment
Since the maximum MP occurs in December, the GP is expected to be at its maximum as well. The same applies for August with the smallest GP, since August shows the minimum MP.
Since consideration areas depend on individual case decisions, taking compensation measures or dual land use into account, their suitability for wind energy utilization did not allow for a systematic quantification of GP. The results thus show some degree of uncertainty and will be presented distinguishing between available geographical potential (AGP) and geographical consideration potential (GCP).
In general, the results show a considerable reduction of MP because of strong geographical restrictions. Annual AGP holds a very small share in the total area at all hub heights, amounting to only 0.02% (7 km
2) at
hhub = 100 m, 0.07% (25 km
2) at
hhub = 140 m, and 0.45% (161 km
2) at
hhub = 200 m (
Table 1).
Annual GCP shows slightly higher rates being at 0.13% (46 km2) at hhub = 100 m, 0.25% (89 km2) at hhub = 140 m, and 0.89% (322 km2) at hhub = 200 m.
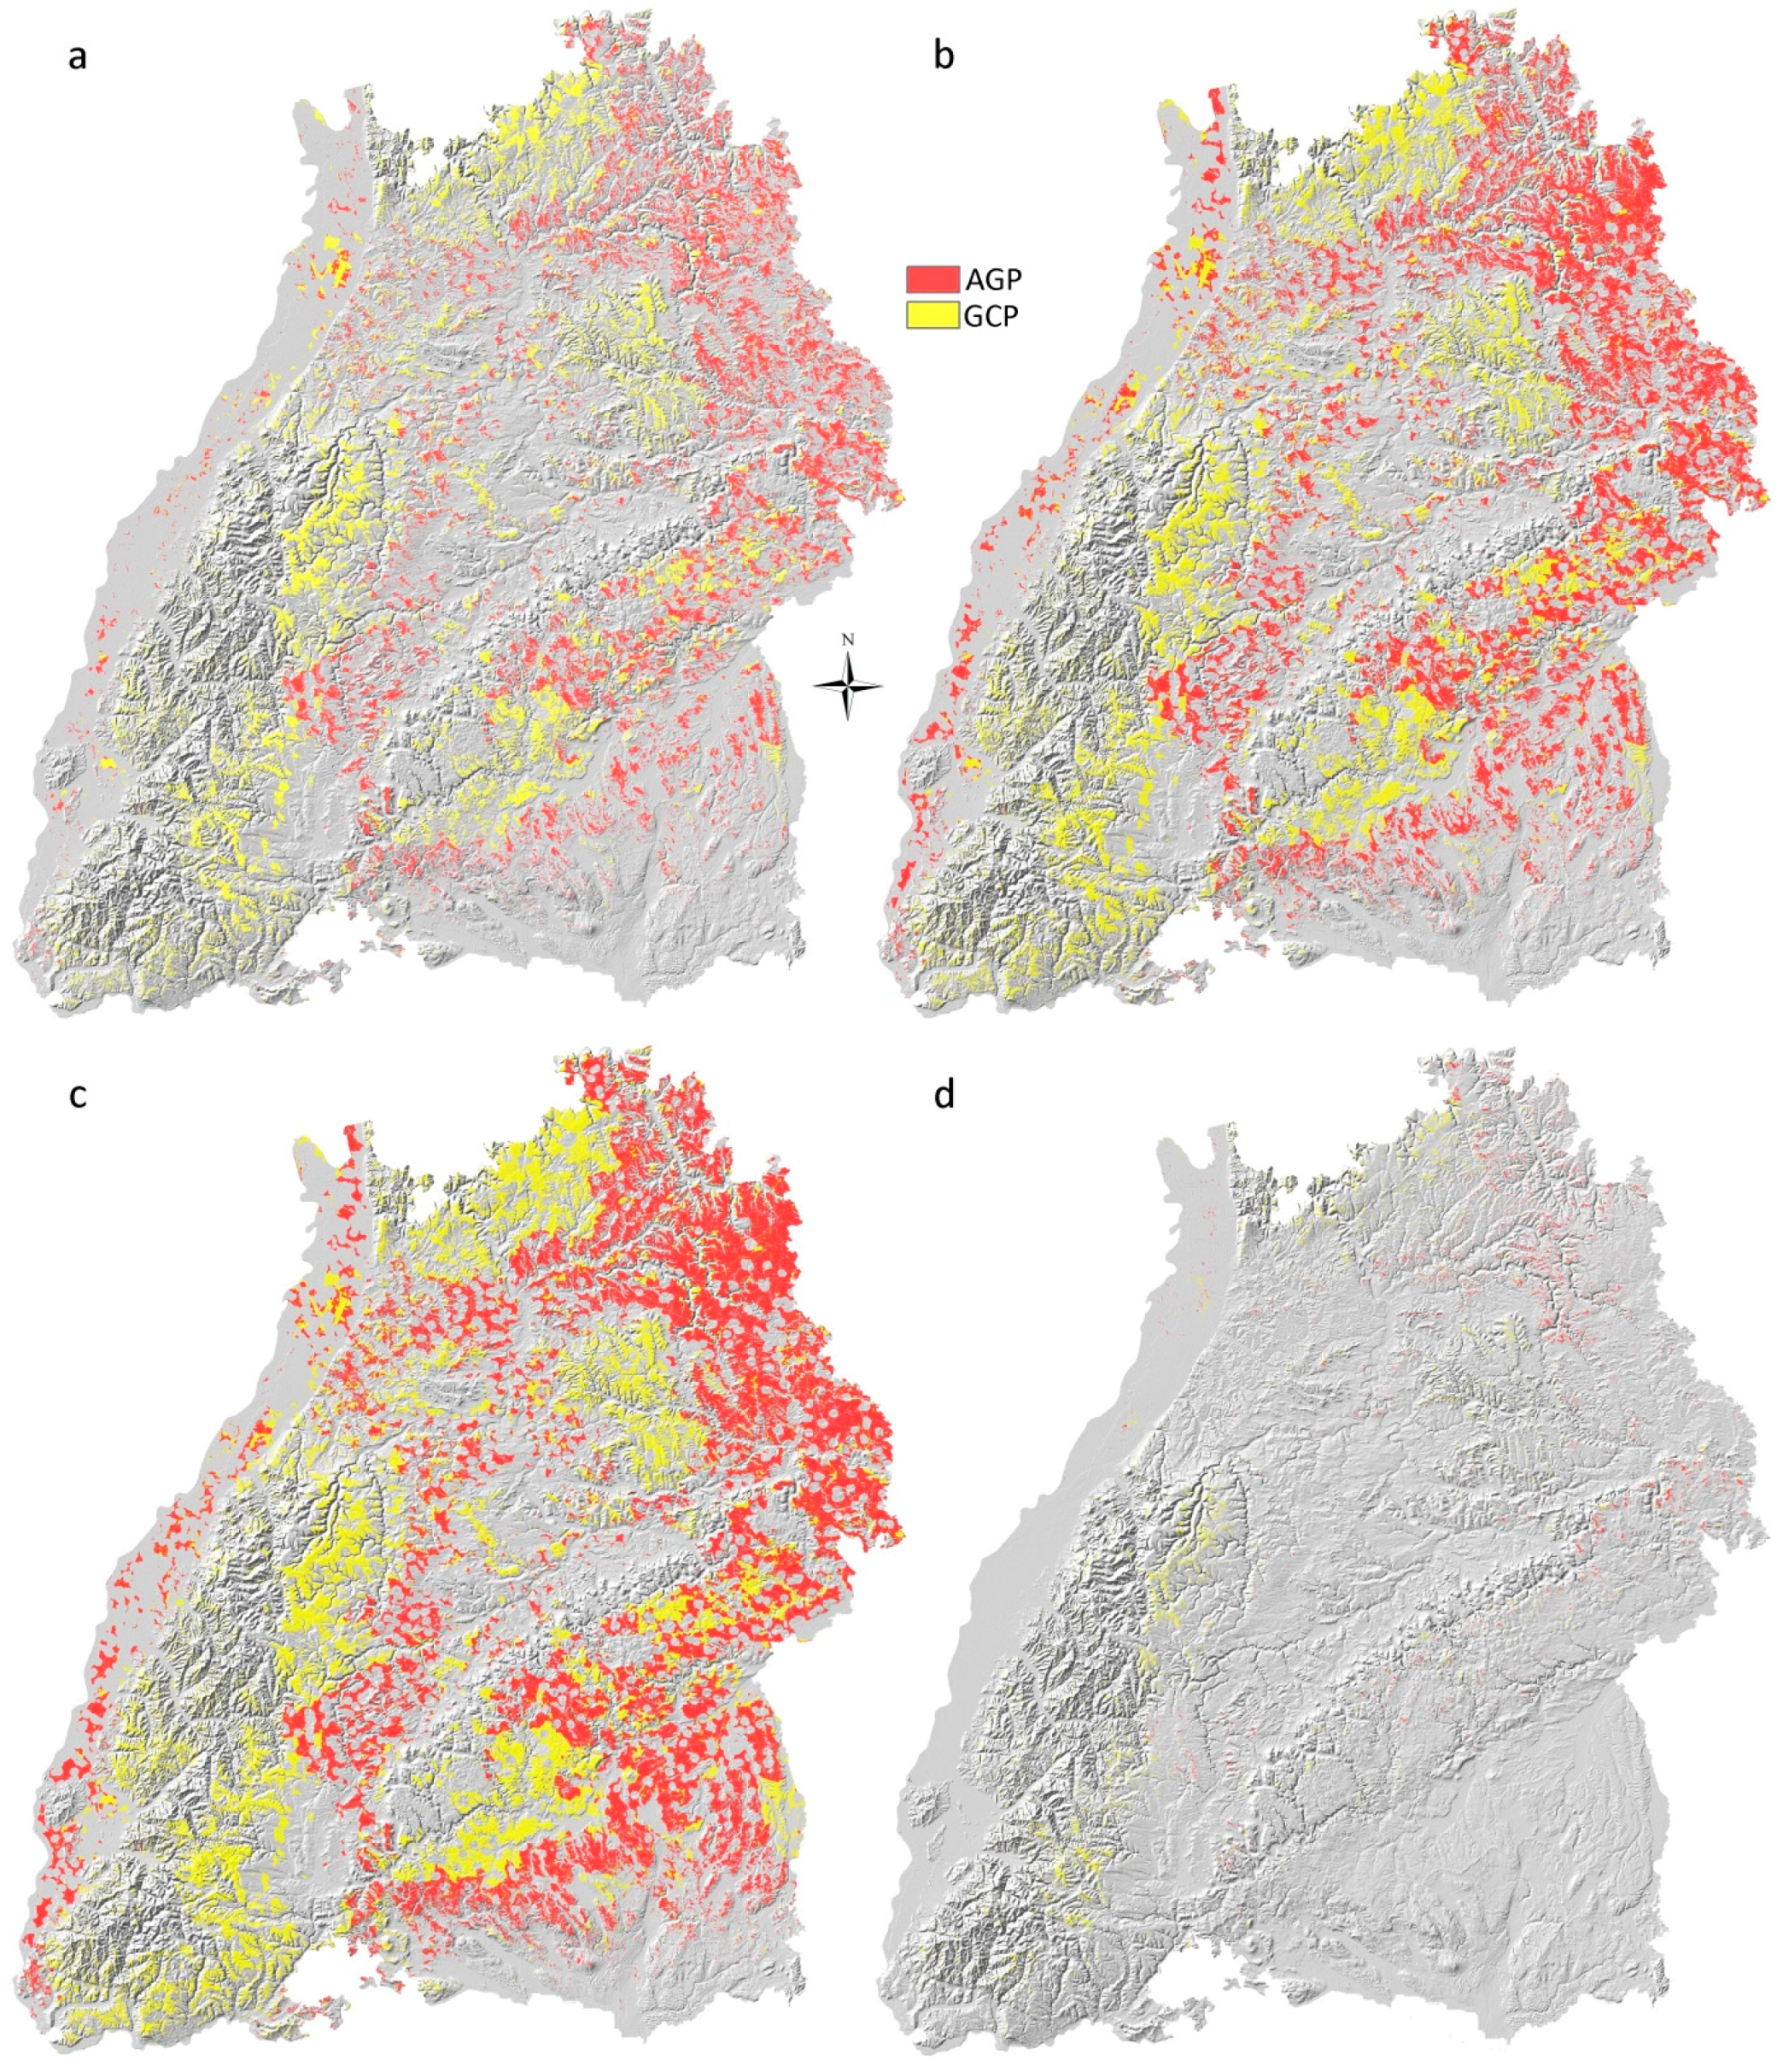
Figure 4a shows the distribution of AGP in December at different hub heights. At
hhub = 100 m, AGP spreads over parts in the northeast, the Swabian Alb, some areas in between the Swabian Alb and the Black Forest and in the Rhine Valley. At
hhub = 140 m (
Figure 4b) and
hhub = 200 m (
Figure 4c), those areas continuously increase and extend to southeastern regions. Simultaneously, GCP gains areas with increasing hub height being distributed over the Black Forest, the Swabian Alb, and some parts in the very north of the study area and in the Rhine Valley. Annual GP at
hhub = 200 m is limited to some parts of the northeastern regions as well as the Black Forest in the southwest (
Figure 4d).
In December, AGP is at its maximum since areas with sufficient MP cover large parts of the study area and, therefore, have many intersections with available areas. In December, AGP accounts for 6.4% (2,288 km
2) at
hhub = 100 m, for 11.4% (4,075 km
2) at
hhub = 140 m, and for 16.0% (5,720 km
2) at
hhub = 200 m of the total study area. Similarly, GCP amounts to 6.2% (2,217 km
2) at
hhub = 100 m, to 9.1% (3,253 km
2) at
hhub = 140 m, and to 12.5% (4,469 km
2) at
hhub = 200 m of the total study area (
Table 2).
In August, AGP stretches from 0.01 to 0.02% of the total study area at different hub heights, whereas GCP varies between 0.02 and 0.03% (
Table 3).
In summary, it can be noted that the maximum AGP occurs in December at hhub = 200 m and amounts to 5,760 km2, with another 4,510 km2 being associated with GCP. Together, their share in the total study area is at 28.5%. The minimum AGP occurs in August at hhub = 100 m and accounts for 4 km2, whereas GCP accounts for 7 km2. The sum of both is 0.03% of the total study area.
4. Discussion
The results show that most of MP is dispersed over the low mountain ranges, being precisely those areas which are largely covered by exclusion and consideration criteria. Thus, the annual MP is reduced by 98.0% at hhub = 100 m, by 95.2% at hhub = 140 m, and by 88.2% at hhub = 200 m on the level of AGP. In December, the reduction is 74.3% at hhub = 100 m, 73.0% at hhub = 140 m, and 74.2% at hhub = 200 m, whereas in August it comes to 72.9% at hhub = 100 m, to 75.3% at hhub = 140 m, and to 77.8% at hhub = 200 m.
Similar reductions apply to GCP. However, it generally amounts to a slightly larger size in area than AGP. This applies to the annual AGP being 39 km2 higher at hhub = 100 m, 65 km2 higher at hhub = 140 m, and 160 km2 higher at hhub = 200 m. The same is true for AGP in August, being 2 km2 higher at hhub = 100 m, 3 km2 at hhub = 140 m, and 4 km2 at hhub = 200 m. Solely in December, GCP is less in size than AGP, being 84 km2 lower at hhub = 100 m, 841 km2 lower at hhub = 140 m, and 1,250 km2 lower at hhub = 200 m. Assuming that the total GCP was available for wind power utilization, areas in regions with high elevation such as the Black Forest would be usable. In general, GP is greatest at hhub = 200 m at all timescales. Moreover, it is at its maximum extent in December and at its minimum extent in August, clearly showing strong seasonal pattern.
The resulting GP in this investigation diverges from findings in other studies, where the mean annual GP amounts to 4,402 km
2 [
8] and 125 km
2 [
11]. Reasons can be found in differing assumptions on the meteorological potential and in not taking into account consideration criteria by both studies. In previous studies, MP was assessed on an annual basis, whereas in this investigation MP was estimated on a monthly basis. The presented results demonstrate that the strong seasonal pattern of MP heavily affects GP calculation, thus strongly limiting the exploitation of wind energy during the summer.
The data used in this study can comply with most claims for assessing GP in the study area. However, there are some requirements that could not be satisfied. Some restriction criteria could not be included because of missing information about, for example, the occurrence of specific bird species which are sensitive to wind turbines such as the black kite (Milvus migrans), the red kite (Milvus milvus), the eagle owl (eagle owl), or the peregrine falcon (Falco peregrinus). If considered, however, the corresponding information would be expected to give further limitations to AGP as such information represents exclusion criteria. This also applies to other exclusion criteria which could not be included because of lack of data, lack of sufficient spatial resolution, or lack of sufficient differentiation within datasets. For example, legally made distinctions within urban areas such as between residential areas, villages, industrial estates, hospitals, and nursing homes are not fully differentiated within the CLC dataset. Hence, variations in defined minimum distances could not be adopted properly and generalizations were applied.
Furthermore, as mentioned before, the consideration criteria exclude the possibility of making a clear statement on whether or not those areas can be used for wind power utilization. This leaves another degree of uncertainty about the assessment of GP since it depends on local case-by-case decision-making.
5. Conclusions
The assessment of GP in this study provides a guideline to identify suitable locations for seasonally optimized wind energy utilization at very small spatial scales as well as a basis for further analysis concerning technical and economic wind energy potential. Intersections between areas with sufficient MP and areas without geographical restrictions have been located, distinguishing between available areas and areas where individual case-by-case consideration is necessary. The generated grid point-specific information on GP is a high-resolution planning guide for new installations of wind turbines in the study area and has the potential to reduce site assessment costs. An optimized exploitation of wind energy in the immediate future in the study area is crucial because political targets in Baden-Wuerttemberg are to raise the share of wind energy in overall electricity supply to 10% by 2020. The presented results also imply that the strong seasonal pattern of GP requires the integration of other renewable energies such as solar energy in the energy mix in order to maintain a constant share of renewables over the course of the year.


