1. Introduction
Human interference has occurred with the climate system, with climate change posing a threat to natural systems and human sustainable development. The core concept of the fifth assessment report of Work Group II of the Intergovernmental Panel on Climate Change (IPCC WGII AR5) is the theme of impact, adaptation, and vulnerability related to climate change. It illustrates that climate-related risk results from the interaction of natural hazards (including hazardous events and trends) with the vulnerability and exposure of human and natural systems [
1,
2]. In the traditional agricultural society of historical China, climate change first impacts the level of food production, which hinders the improvement in living standards and social development by a transmission of forcing–responding chain. The forcing–responding chain means that the impact of climate change passes on from climate change to agriculture harvest to food supply, and finally to famine and social stability [
3]. Overall, the extent of the impact on society by climate change depends on the social vulnerability and human adaptation actions. Socially sustainable development depends on whether the contradiction between human and land is resolved.
In the majority of current studies on the impact of historical climate change and human adaptation, climate change and societal stability have been well studied. For example, some typical researchers analyzed the impact of climate change on violent conflict in Europe over the last millennium [
4]; the relationship between climate and the collapse of Maya civilization [
5]; North Atlantic seasonality and implications for Norse colonies [
6]; the relationship between sun, climate, hunger, and mass migration [
7]; linkage of climate with Chinese dynastic change [
8], and so on. However, some intermediate factors in this influencing process (e.g., population, agricultural production, and policy adjustment) were not fully considered. In addition, social vulnerability has not been stressed in these similar international studies.
In China, some researchers discussed the Chinese population and cropland area mainly from the perspective of historical geography or agricultural history. For example, Ge [
9] studied the history of Chinese demographic composition, population change, and distribution; Li [
10] analyzed the impact of climate change on several instances of Chinese historical population fluctuation; He [
11] firstly evaluated the ancient land data in China; and other researchers [
12,
13,
14,
15,
16] evaluated Chinese historical land data. They have produced methods for the data estimation of Chinese population and cropland area. Recently, scientists working in the field of global change have reconstructed the spatial distribution of historical cropland cover in China [
17,
18] or regions in China [
19,
20,
21,
22]. However, to understand the dynamics of climate-related risks, it would be better to combine agricultural production with the impacts of historical climate change. Pressure index on cropland was first put forward by Cai et al. [
23], and has been extensively used to evaluate food security in certain regions [
24,
25]. In addition, the indexes (e.g., population density, cropland area per capita, pressure index on cropland, and so on) are important parameters that represent societal vulnerability from the perspective of food security. They are available to be used for research on the impact of historical climate change and social sustainability development.
North China is located in the northern temperate monsoon belt. The variability of temperature and precipitation is significant here. It has both higher sensitivity and certain adaptation ability to the impact of climate change. In addition, it was the administrative center of the traditional agricultural area in China during the Qing Dynasty. The impacting and responding processes of climate change in this region directly relate to the social stability, which is often preferentially considered by the central government. There have been many studies on the impact of climatic disasters and its response in this region. They include the analysis of relationship between revolt and drought–flood in Shandong Province during middle and late Qing Dynasty [
26]; a case study on the impact of extreme climate events on migration and land reclamation in the early Qing Dynasty [
27]; various types of responses in Northeast China to climatic disasters in North China over the past 300 years [
28]; revolts frequency in the North China Plain during 1644–1911 and its relationship with climate [
29]; social responses in Eastern Inner Mongolia to flood/drought-induced refugees from the North China Plain during 1644–1911 [
30], and so on. In these similar national studies, the impacting and responding processes of historical climate change were mostly based on the method of time series comparison, with less attention paid to social vulnerability from the perspective of food security.
This article explores the spatial difference of factors such as the labor/household density, cropland area per capita, and pressure index on cropland in Shandong Province during the 17th–20th century. It would be used to estimate change of social vulnerability and sustainability from the perspective of food security in this region during the historical periods. It also provides fundamental data for research on historical climate change impact and adaptation.
2. Research Area
This paper takes the modern Shandong Province in China as the research area. It is located in the mid-latitude area of the northern hemisphere, within the range of 34°22′52″ N 114°19′53″ E–38°15′02″ N 122°42′18″ E, including 110 cities or counties. In the Qing dynasty, Shandong Province had 10 districts (named as Fu), 3 states directly under the central government (named as Zhili states), 8 scattered states under Fu (named as San states), and 96 counties [
31]. The administrative boundaries of some counties in Shandong Province have changed, although this was mainly attributed to the split and combination of counties. Therefore, for ease of comparison with modern results, we converted historical data into the following indexes based on modern county boundaries (the base map comes from the 1:400 base data of China including administrative boundaries, rivers, roads, cities, etc.).
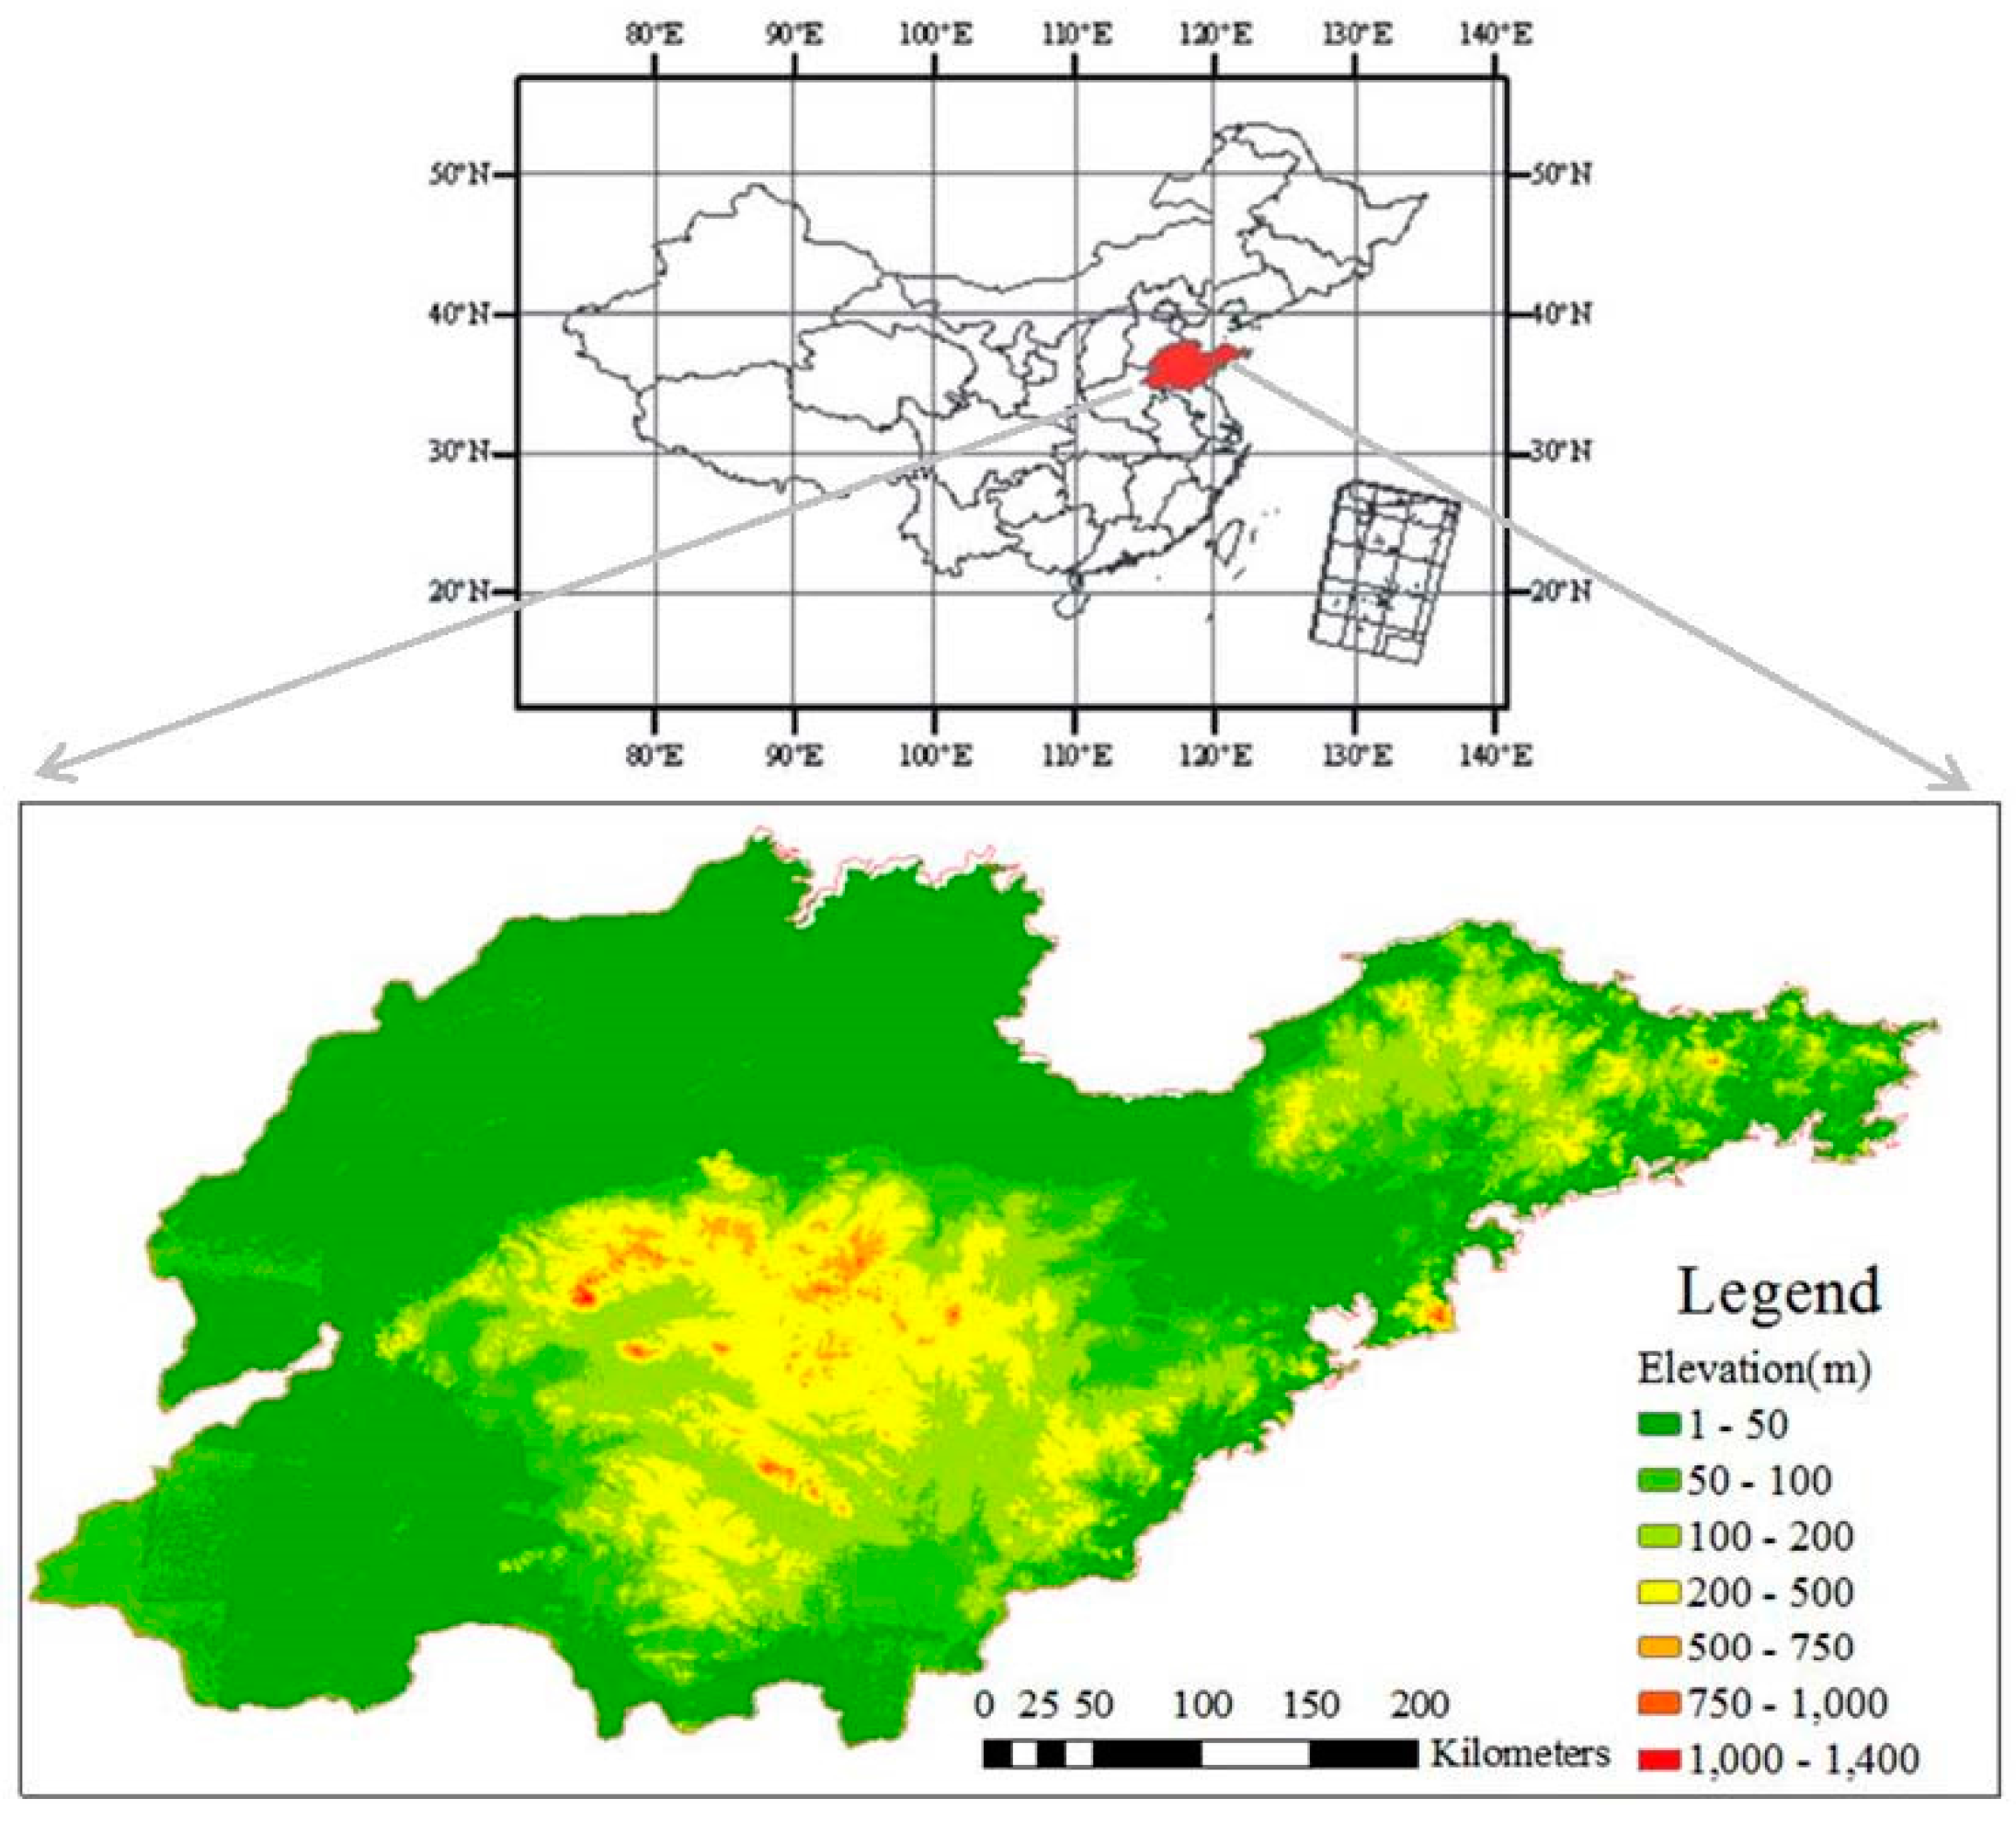
Shandong Province is located on eastern coast area of China, which is the lower reach of the Yellow River (the middle and northern part of Beijing). The Hangzhou Great Channel runs through Shandong Province. Shandong mainly consists of plain and hilly area, which occupies 55% and 28.7% of the total land area, respectively. This is located in the Middle and South Shandong. The northwest area includes the Northwest Plain of Shandong, an alluvial plain formed by the Yellow River. The eastern peninsula is mostly gently fluctuating hilly areas (
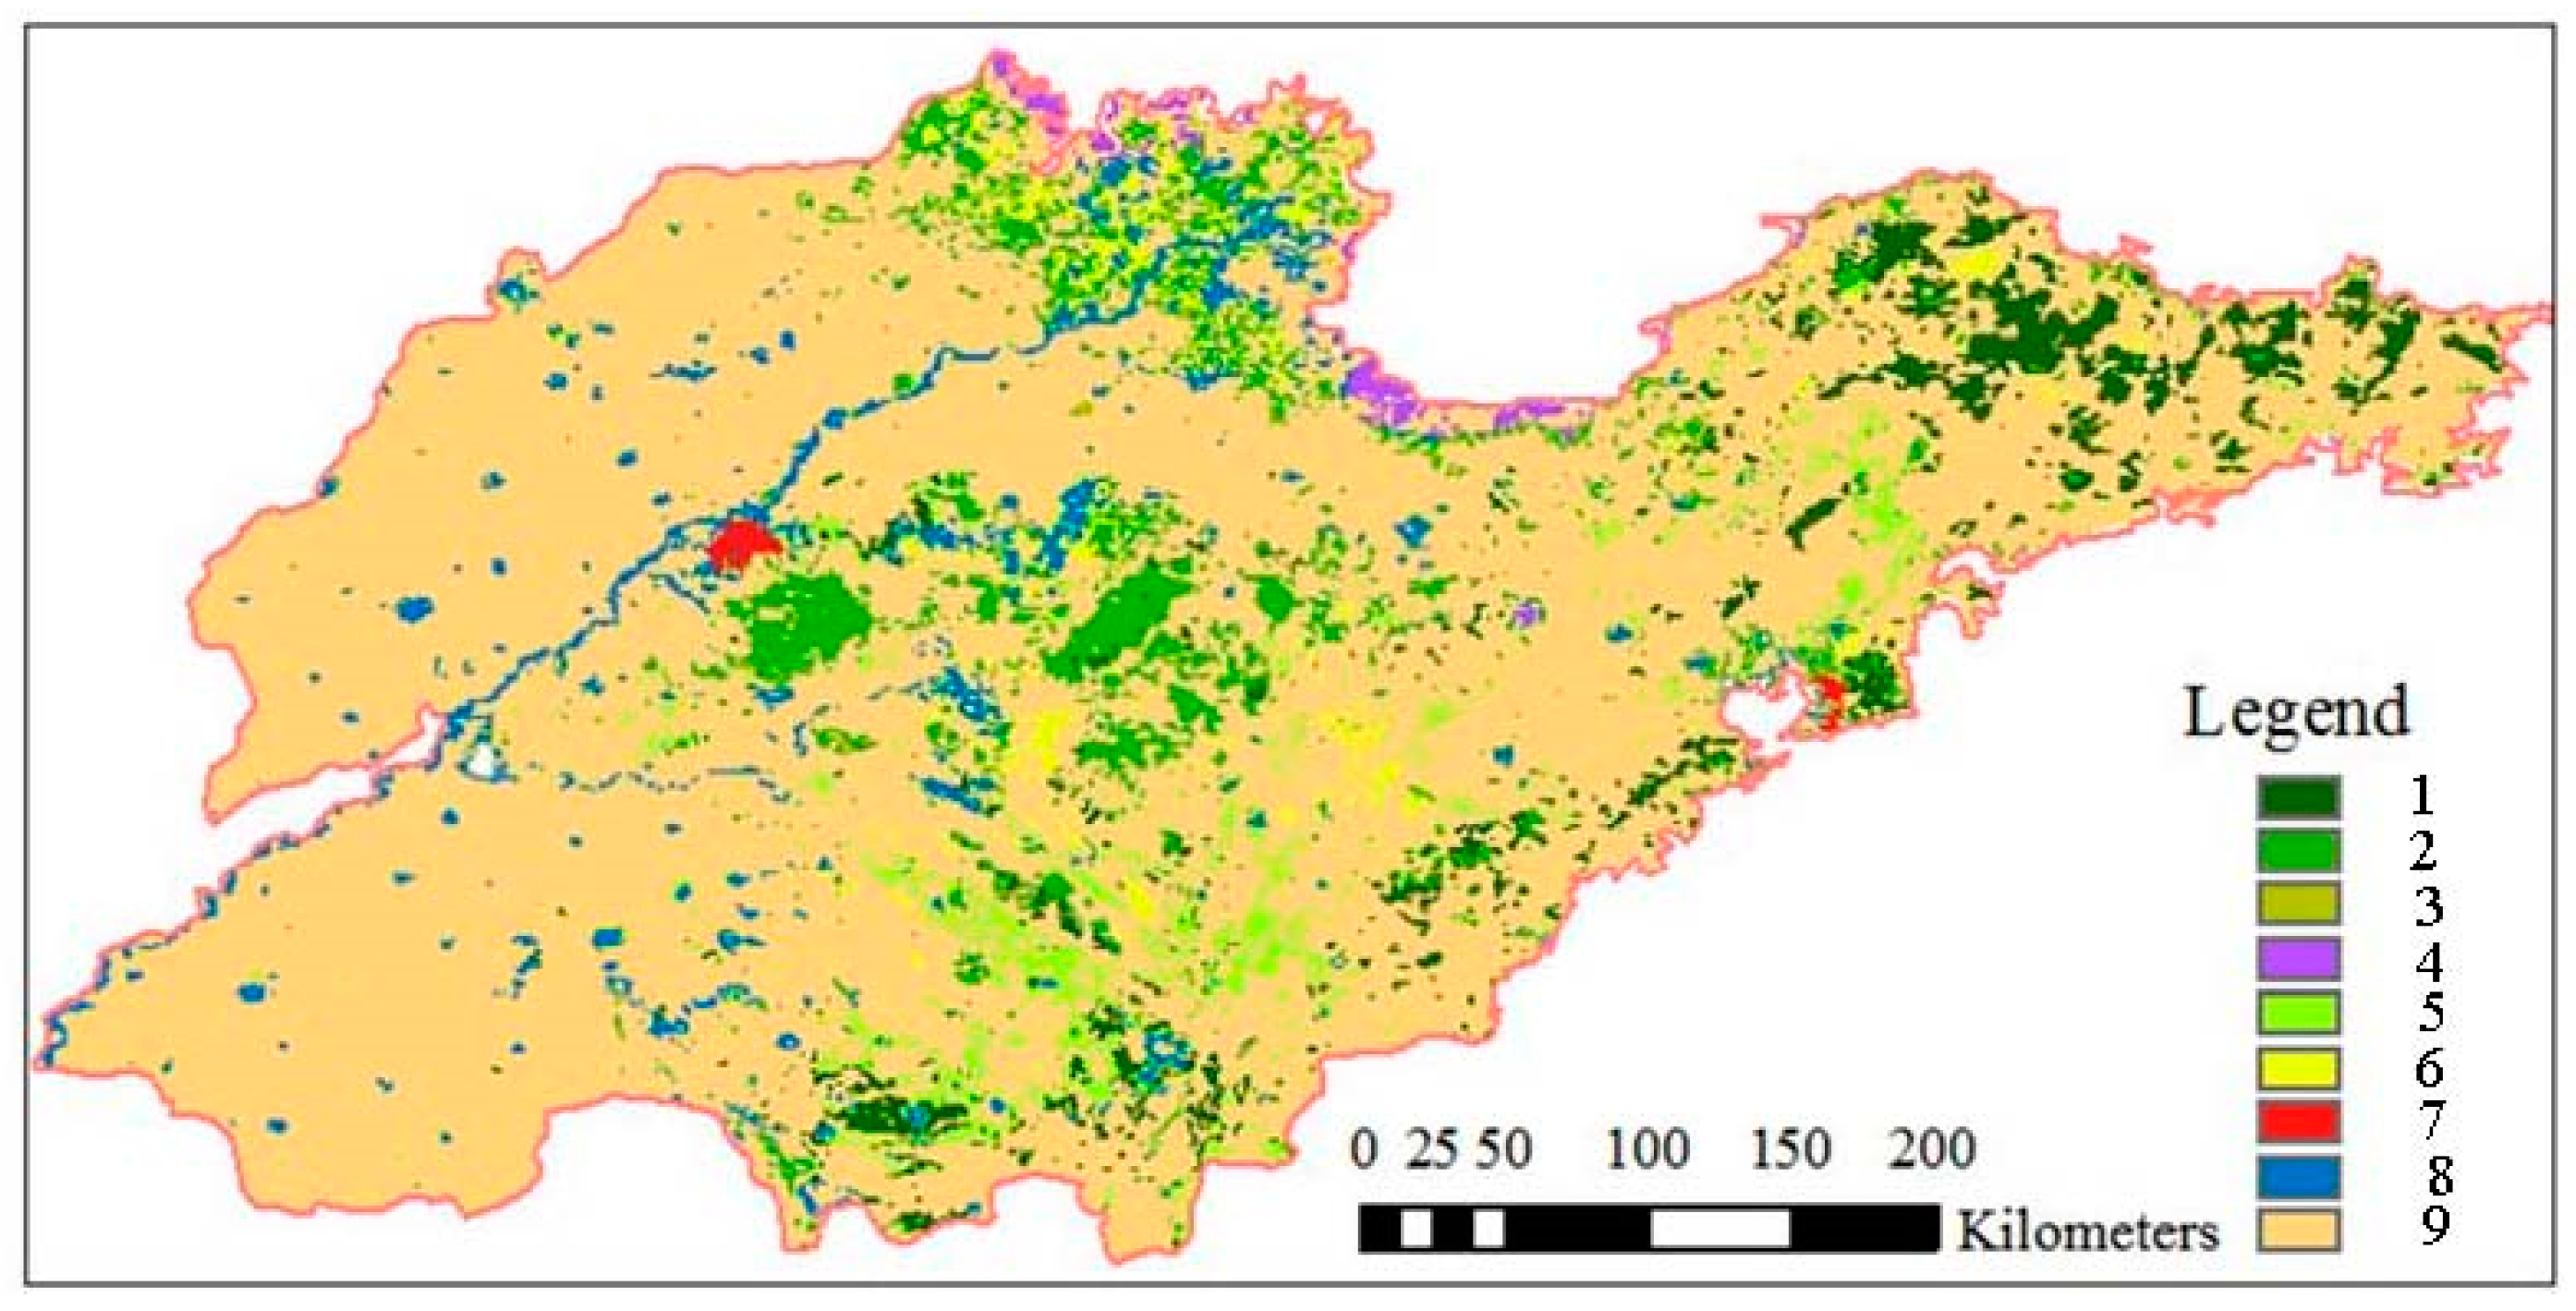
Figure 1). Shandong has a semi-humid monsoon climate in the warm temperate zone. The climate is mild, and four seasons are discernible. The mean annual temperature is 11–14 °C. The mean annual precipitation is 550–950 mm. Shandong Province is an important agricultural production area in China. Cropland is distributed extensively, being found mainly on the Northwest Plain, Southwest Plain, and Jiaolai Plain. Forest and grassland are mainly distributed on the mountain, and hilly areas in Middle and South Shandong, Jiaodong Peninsula, and the Yellow River Delta. Wetland occurs mainly along the coast (
Figure 2).
3. Data Sources and Methods
3.1. Sources of Historical Climatic Data
The temperature data were sourced from the decadal mean temperature change series of North China from 1380s to 1980s [
32] and that of Eastern China over the past 1000 years [
33]. Precipitation data were sourced from precipitation (drought/flood) change series of North China over the past 2000 years [
33]. These climatic data were all based on historical documents.
3.2. Sources and Processing of Population Data
Population data were sourced from gazetteers of counties in Shandong Province during the Qing Dynasty (1644–1911) and the period of Republic of China (1912–1949). There was a total of 244 volumes, which cover the 110 cities or counties in the research area. For one county, there are sometimes 2–4 versions of gazetteers in different periods. The records on the amount of labor, households, and population in different versions of gazetteers were validated with each other. The units of labor and household amount are “Ding” and “Hu”, respectively. Ding and Hu are the population tax units in China during the historical periods.
First, we estimated the calculation ratio of labor, household, and population. “Ding” is mostly defined as an adult male aged from 16–60, who must pay the labor tax. One household has 2–3 laborers and includes 5–6 persons in Shandong Province generally during the 17th–20th century. The ratios of labor, household, and population were calculated from county data recording these numbers in 244 volumes of gazetteers, which is relatively reasonable at that time.
Secondly, we reconstructed the numbers of laborer of the 17th century and 18th century as well as the number of households of the 19th century and 20th century by interpolation. The number of records for labor, households, and population during the past four centuries used in this paper are listed in
Table 1. The correlation analysis results used for interpolation are as follows:
- (1)
Y = 1.444x, R2 = 0.843; (x = laborer in the 17th century; Y = laborer in the 18th century)
- (2)
Y = 0.461x, R2 = 0.869; (x = laborer in the 18th century; Y = households in the 19th century)
- (3)
Y = 1.14x, R2 = 0.802; (x = household in the 19th century, Y = household in the 20th century).
3.3. Spatial Distribution Change of Labor/Household Density and Cropland Areas per Capita
According to the above data for labor, household, and cropland area [
34] in each county in Shandong during the 17th–20th century, by the equations of 1 Hu = 2–3 Ding, 1 Hu = 5–6 person the labor/household density and cropland area per capita in the four time-sections were calculated and spatially analyzed using the inputs of 1 Hu = 2–3 Ding and 1 Hu = 5–6 people (
Figure 3 and
Figure 4). To represent the social vulnerability from the perspective of food security, we used 0.05 ha as the basic unit of division referring to the warning line of cropland area per capita (0.053 ha) put forward by Food and Agriculture Organization of United Nations (FAO) [
35]. The legend of cropland area per capita is expressed as the segmentations separated by 1, 2, 4, 8, 16, 32 times 0.05 ha.
3.4. Spatial Distribution of Pressure Index on Cropland
Pressure index on cropland measures the degree of shortage of cropland resources in a certain region. It also reflects the pressure on cropland and the social vulnerability from the perspective of food security during the historical periods. The minimum cropland area per capita represents the necessary cropland area to satisfy a person’s basic food consumption at the normal living level in a certain region. Since the Qing dynasty, the “warning line” of cropland area per capita in Shandong has changed, as crop yield had been improved from about 1500 kg/ha to 6000 kg/ha [
36,
37]. Dietary structure based on grain has most likely remained the same. To make historical research easier, the model put forward by Cai et al. (2002) [
23] is simplified by assuming the minimum cropland area per capita in four time-sections to be four times greater than those in modern times, while minimum cropland area per capita in modern times applies the warning line of cropland area per capita (0.053 ha) put forward by FAO (Wang, 2001) [
35]. Pressure index on cropland (K) is the ratio of minimum cropland area per capita (S
min) and actual cropland area per capita (S
a). Its formulation is:
Assume cropland area per labor and cropland area per household are Sd and Sh, respectively. According to the ratios of the numbers of laborer, household, and population discussed above (1 Hu = 3 Dings, 1 Hu = 6 people), it can be obtained that:
The pressure index on cropland in each county in four time-sections was calculated. Following this, we produced the spatial distribution map of K-values by the ArcGIS software (ArcGIS is a word-leading application platform which can be used for collecting, organizing, managing, analyzing, communicating, and releasing geographic information) and analyzed its change (
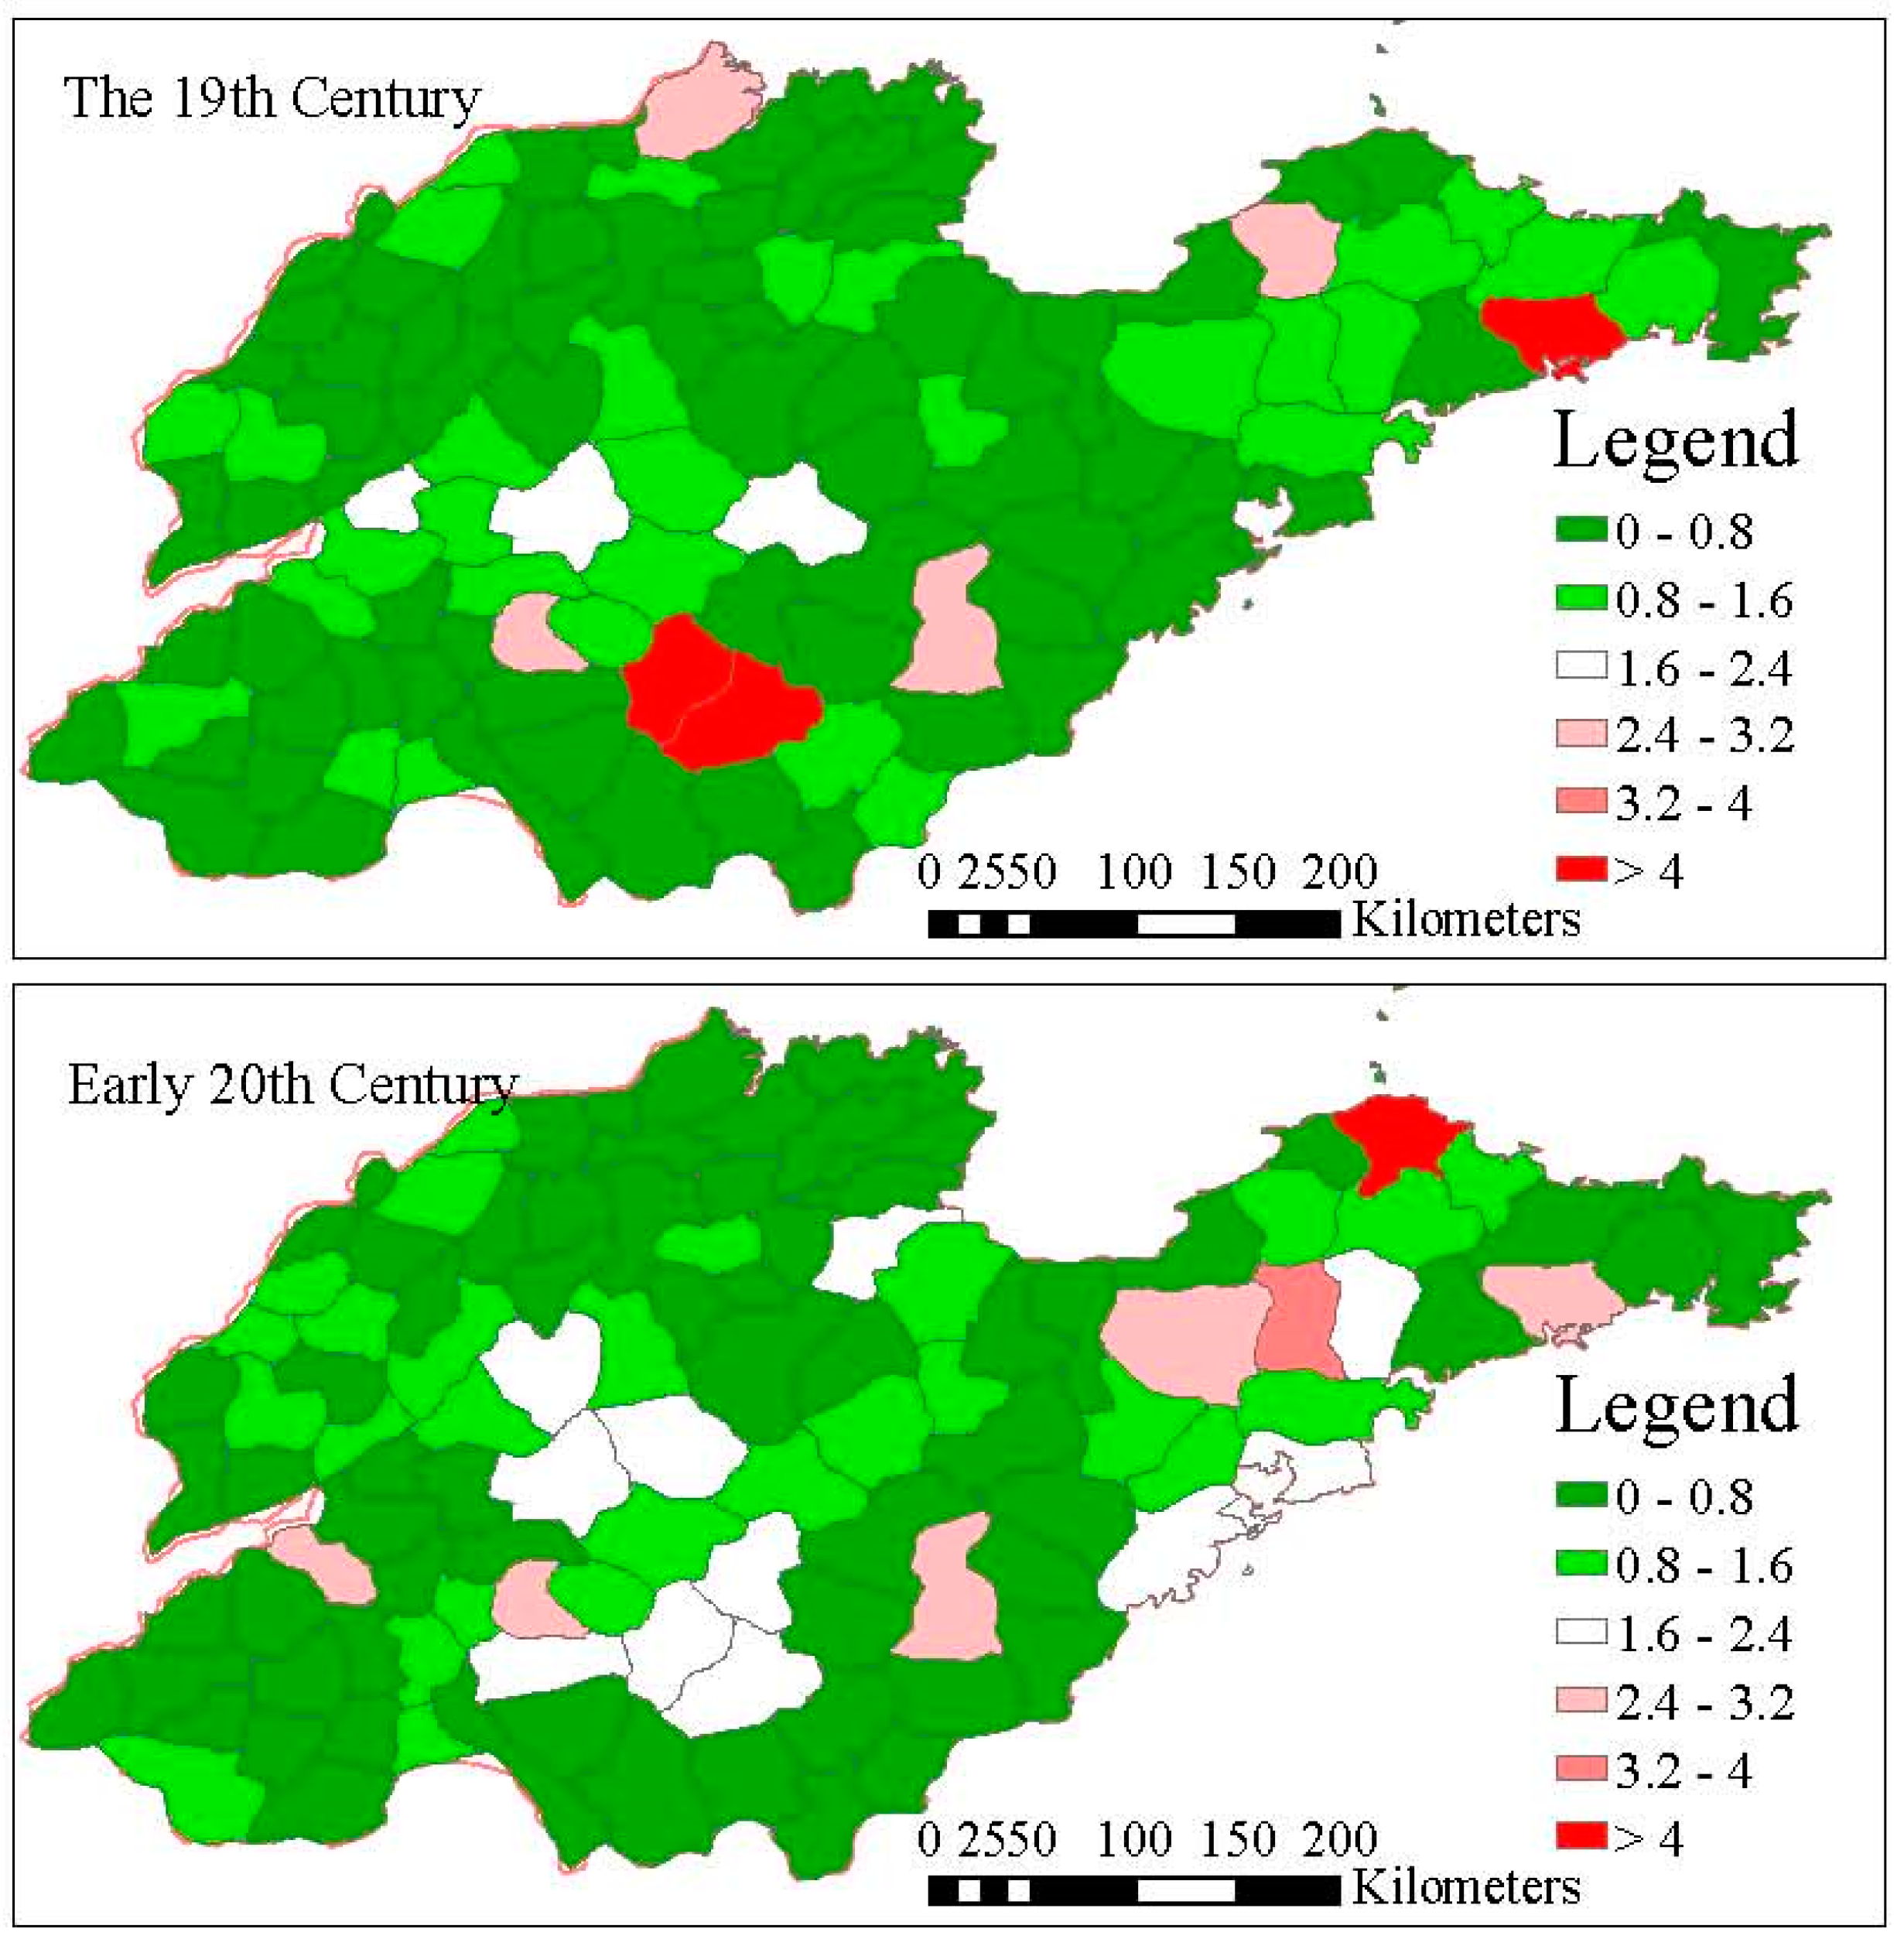
Figure 5). Finally, K value is interpolated by the inverse distance weighted method to identify the vulnerable center in the 19th century and at the beginning of 20th century, which is shown as the brown area in
Figure 6. We divided K into 1–6 grades, which are 0–0.8, 0.8–1.6, 1.6–3.2, 3.2–4, and >4 by considering the actual discrete distribution of K-value and lower historical agricultural production level. The higher index grade represents a heavier pressure on sustainable cropland use and a larger possibility of an impending food crisis.
3.5. Analysis of Climate Change and Sustainable Cropland Use
The sustainability of cropland use can be measured by the above indexes, including population density, cropland area per capita, and pressure index on cropland. We compared climate change phases with the extent of sustainable cropland use in Shandong during different periods over the past 300 years. By the linkage of some intermediate elements, such as population, agricultural production, policy adjustment, and so on, society vulnerability and food sustainability during different periods were analyzed and discussed.
4. Results of Analysis
4.1. Climate Change in North China over the Past 300 Years
It shows that five regions in Eastern China (including North China) all had two distinctive cold periods (1620s–1710s and 1800s–1860s). The warmest period occurred in the 20th century during the past 500 years. The annual average temperature in the coldest hundred years (1800s–1900s) was lower than that of 20th century by 1.0 °C, with the coldest 30 years having happened in 1650s–1680s (Ge et al., 2012 [
33]. The series of average temperatures in North China since the 1380s show that two cold periods occured (1550s–1690s and 1800s–1860s) (Wang et al., 1991 [
32]).
The climate in Eastern China during the Qing Dynasty (1644s–1911s) was generally humid, although decadal variation was very distinctive. There were continuous droughts in 1720, 1785, 1810, and 1877. Climate in the 20th century tended to be dry but fluctuating, with the middle of 1940s being wetter than the middle of the 1960s. After this, the weather tended to be dry since the 1980s. It also shows that three sub-regions in Eastern China had a high consistency in the dry/wet change since the 1680s (all humid relatively), although the change in the dry/wet trend of North China (dry relatively) during 1520s–1680s was opposite to that of Jianghuai and Jiangnan regions (wet relatively) (Ge et al., 2012 [
33]).
4.2. Spatial Distribution Change of Labor/Household Density in Shandong over the Past 300 Years
From the spatial distribution map of labor/household density (
Figure 3), it was found that there existed an obvious spatial difference in labor/household density, which showed a similar pattern to cropland area in the corresponding periods. In essence, there was a relatively greater proportion of the population in the agricultural area appropriate for cultivation, while only a minority of the population settled in the regions not appropriate for cultivation. This embodies the impact of land suitability for cultivation on population distribution. In agricultural areas such as Northwest and Southwest Shandong as well as the Jiaolai Plain, the density of labor/household in the majority of cities/counties was above 10 Ding/km
2 during the 17th–18th century. At the beginning of the 20th century, most of cities/counties reached above 10 Hu/km
2. In comparison, there was a smaller distribution of the population in the hilly areas of middle and south Shandong, the Jiaodong Peninsula, and coastal swamp area. The density of labor/household in many cities/counties in these regions was below 5 Ding/km
2 or 5 Hu/km
2 from the 17th century to the beginning of the 20th century.
The population density of Shandong Province over the past 300 years has been increasing, especially in the three agricultural areas. Furthermore, the spatial difference of population density decreased from the 19th century to the beginning of the 20th century. In the Northwest and Southwest agricultural areas, the labor densities were above 10 Ding/km2 during the 17th–18th century. Until the 19th century and the beginning of 20th century, the population densities in the whole research area were increasing, and reached 20 Hu/km2 in many regions of the three agricultural areas.
4.3. Spatial Distribution Change of Cropland Area per Capita in Shandong over the Past 300 Years
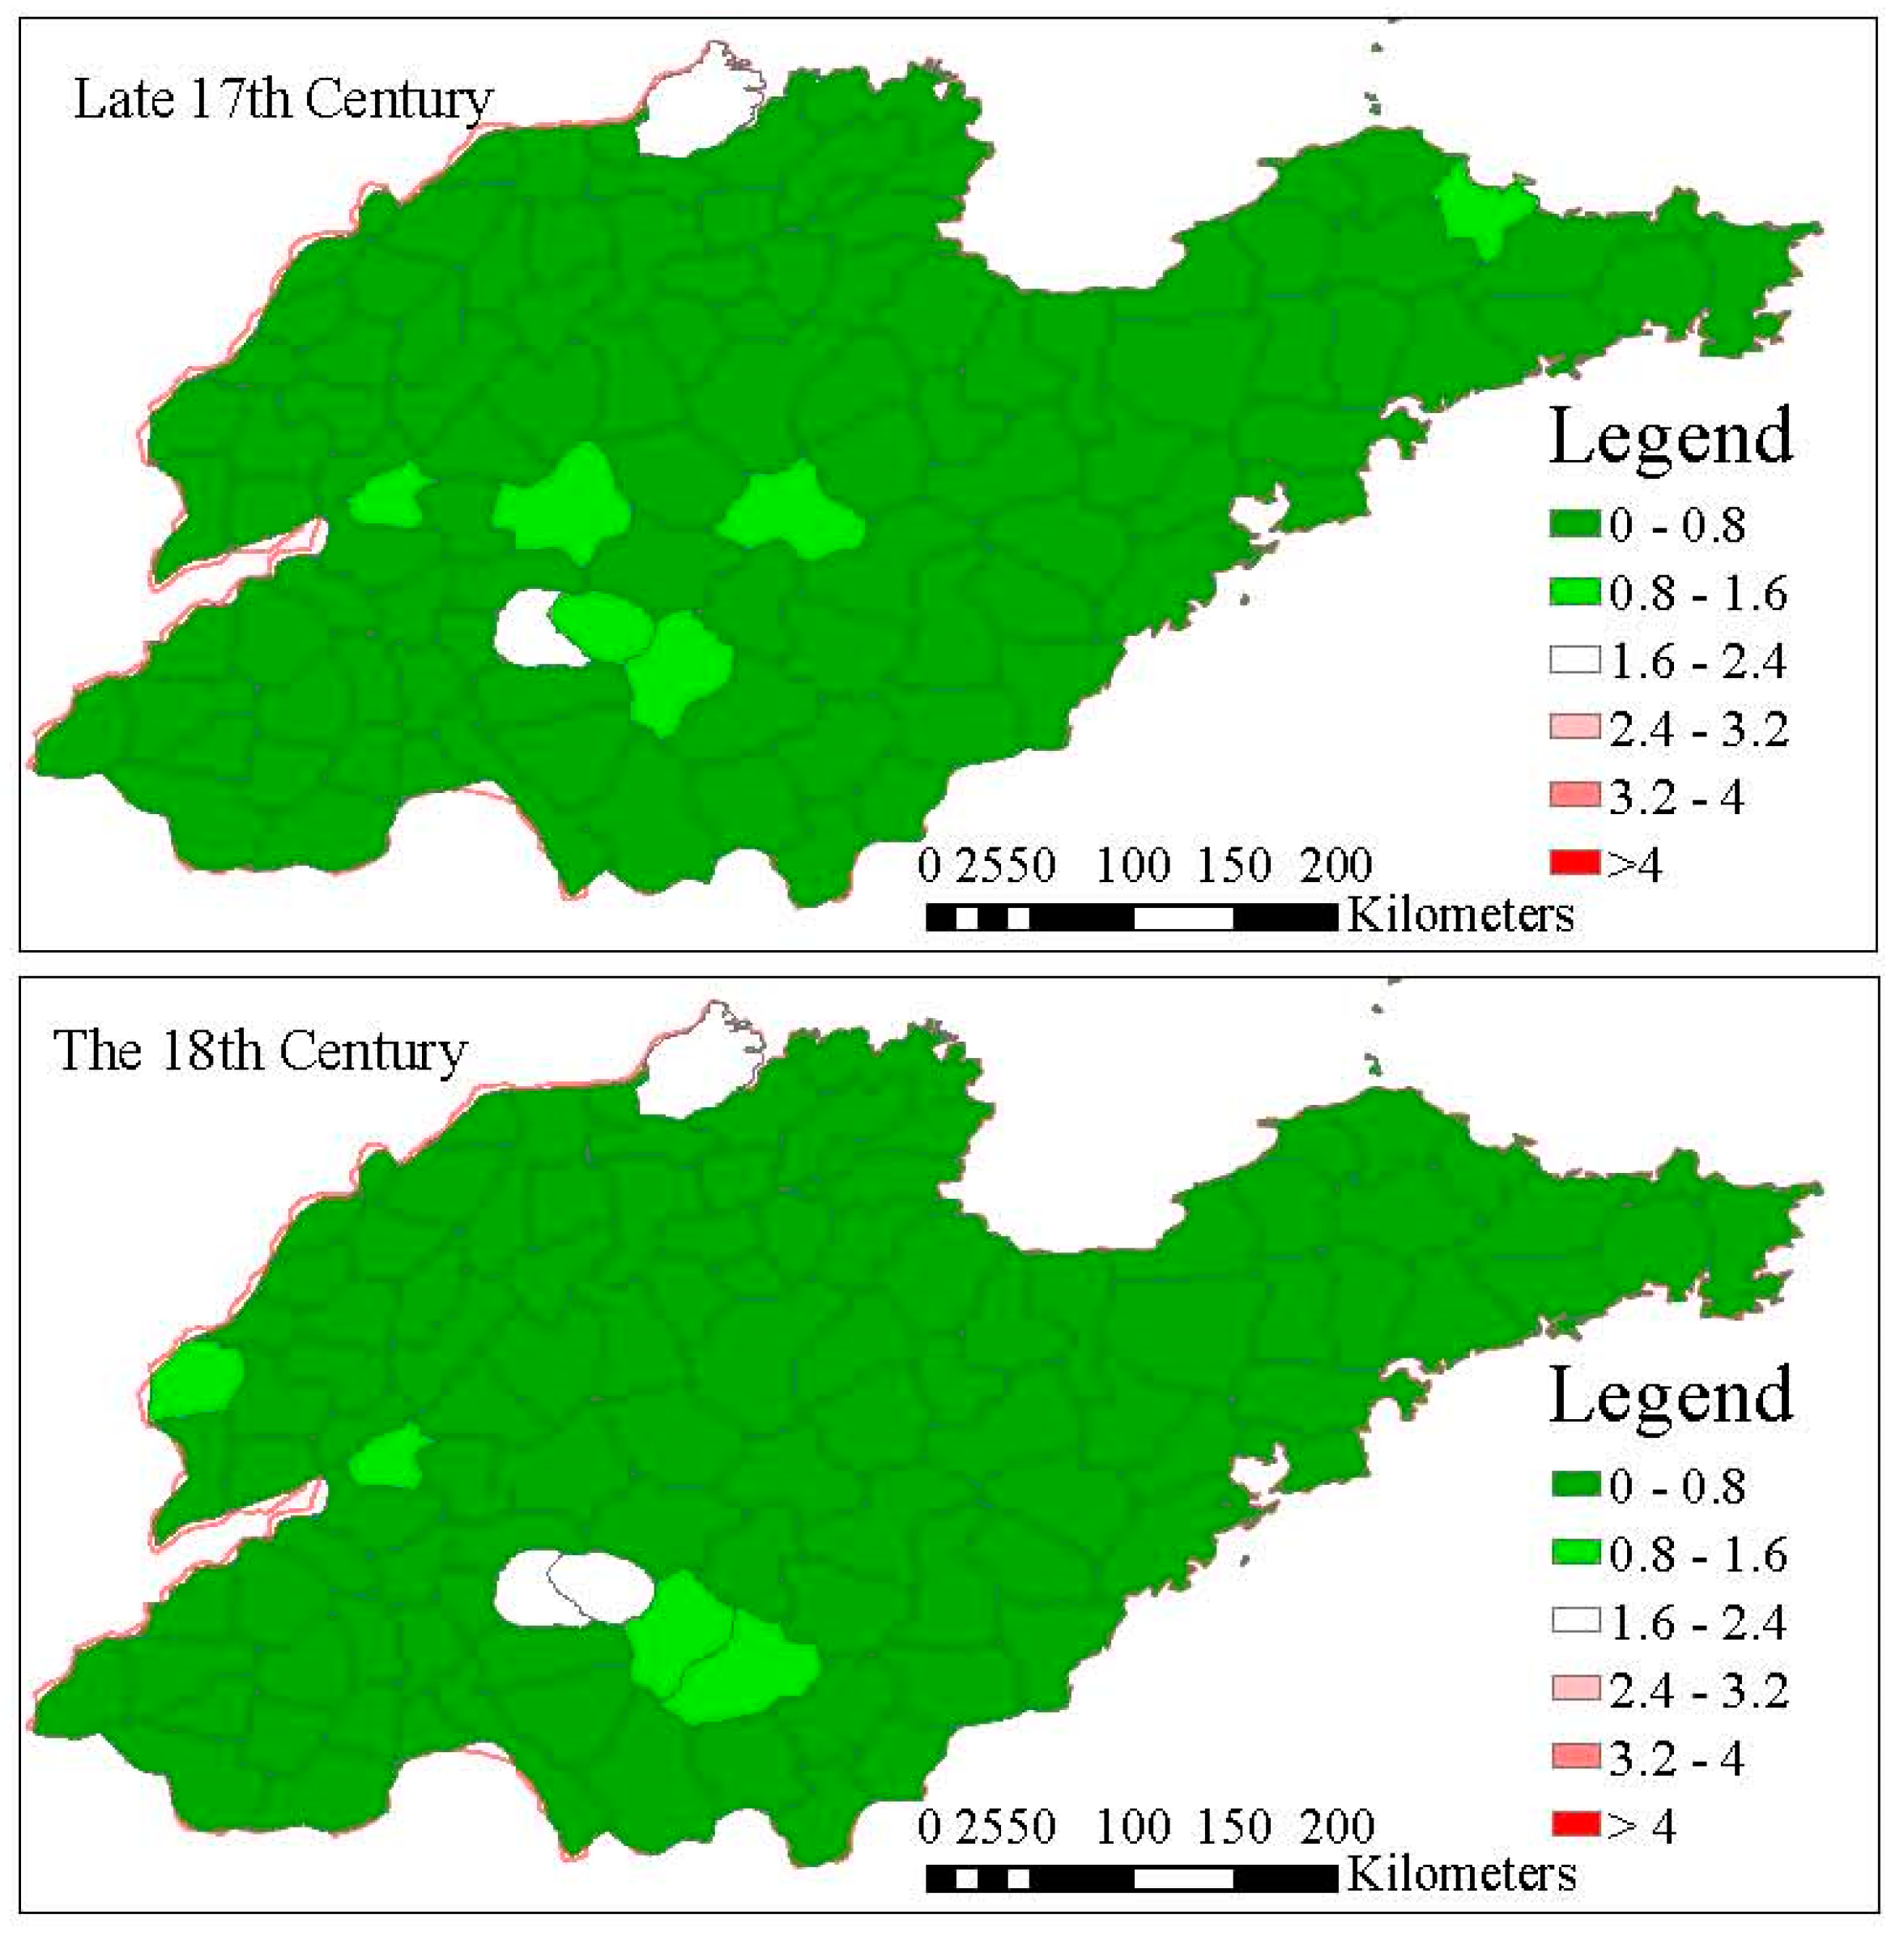
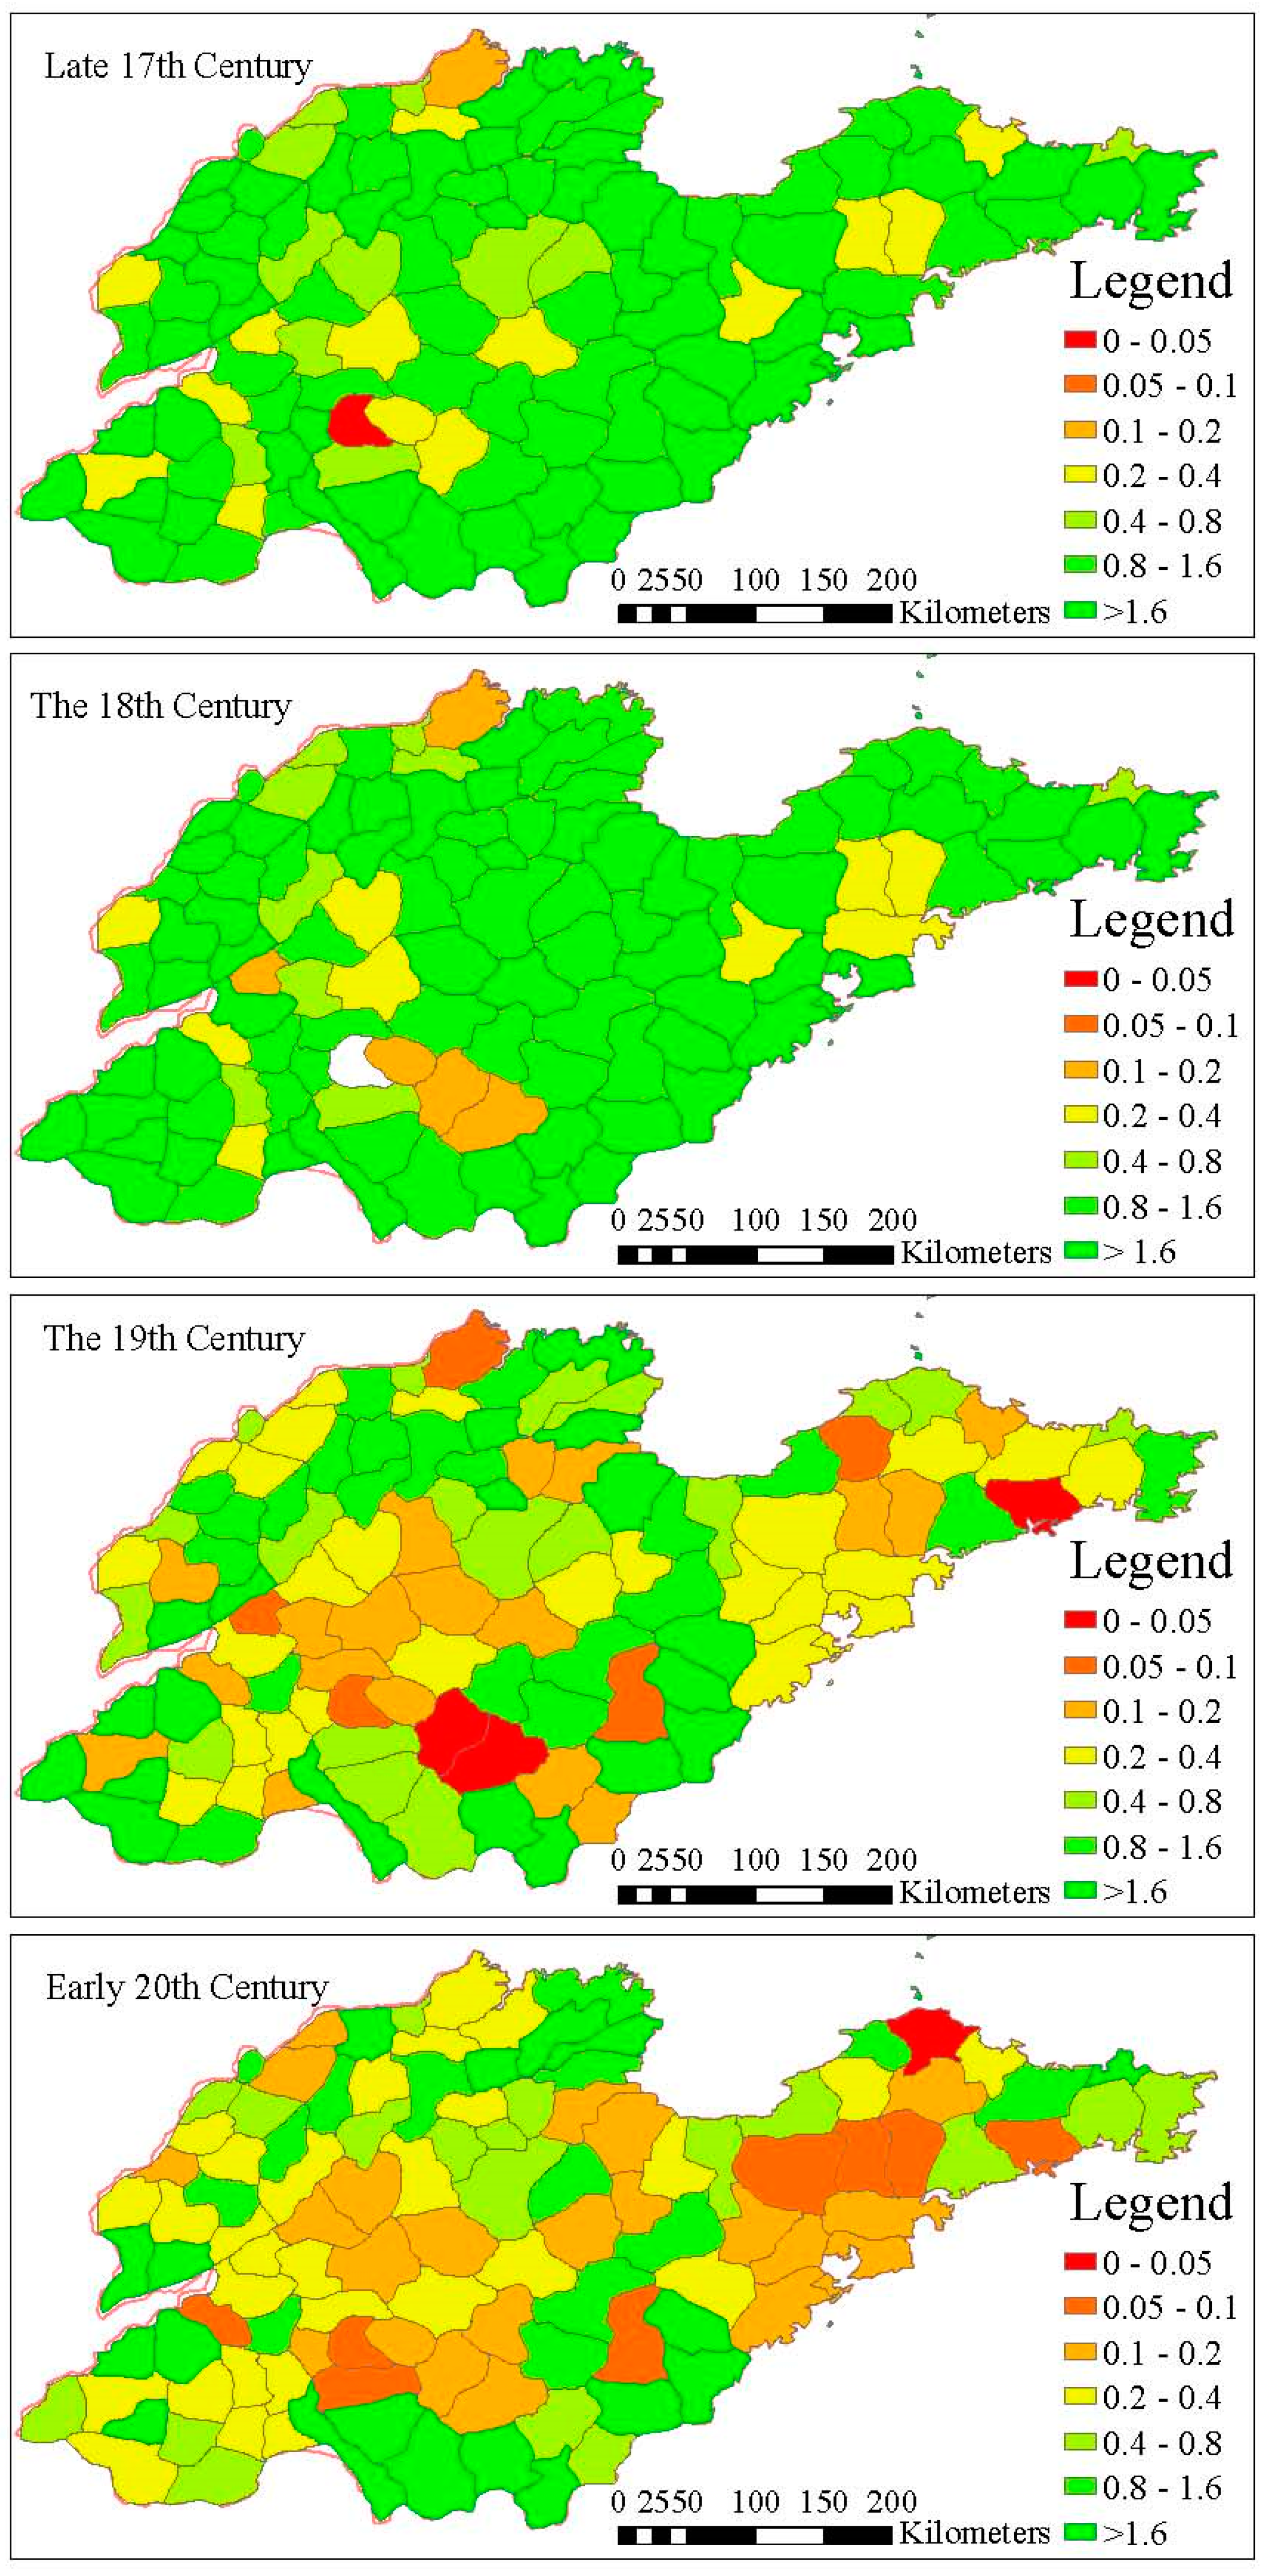
From the spatial distribution map of cropland area per capita in Shandong from the late 17th century to the beginning of the 20th century (
Figure 5), it was found that the cropland area per capita was distributed relatively uniformly and the spatial difference was less obvious than the population density.
The values of cropland area per capita during the 17th–18th century were higher, with those of the majority of counties being above 0.4 ha. This is eight times higher than the modern warning line of cropland area per capita put forward by the FAO. However, cropland area per capita in a few counties in Binzhou, Linyi, and Jining was below four times higher than the modern warning line, which means that food security in these regions might be at risk with stronger social vulnerability and would most likely be affected by climatic disasters.
The value of cropland area per capita from the 19th century to the beginning of 20th century generally decreased. The strength of social vulnerability and the possibility of social turbulence resulting from threatened food security increased. During the 19th century, the cropland area per capita in the majority of counties in the middle Shandong and Jiaodong Peninsula was below 0.1 ha, which was two times higher than the modern warning line of cropland area per capita. Food security in Binzhou, Linyi, Jining, Laiwu, Tai’an, Yantai, and Weihai were under threat. At the beginning of the 20th century, the cropland area per capita in the whole research area decreased universally, especially in counties in Jiaolai Plain and middle Shandong, as the area in these places decreased to below 0.2 ha. In Northwest and Southwest of Shandong, it appeared that the cropland area per capita of many counties were lower than 0.4 ha. The numbers of vulnerable regions increased. New areas under threat (e.g., Jinan, Dezhou, and Qingzhou) appeared at the beginning of 20th century with previous areas under threat to food security in the 19th century still having this risk (
Figure 5).
4.4. Spatial Distribution Change of Pressure on Cropland in Shandong over the Past 300 Years
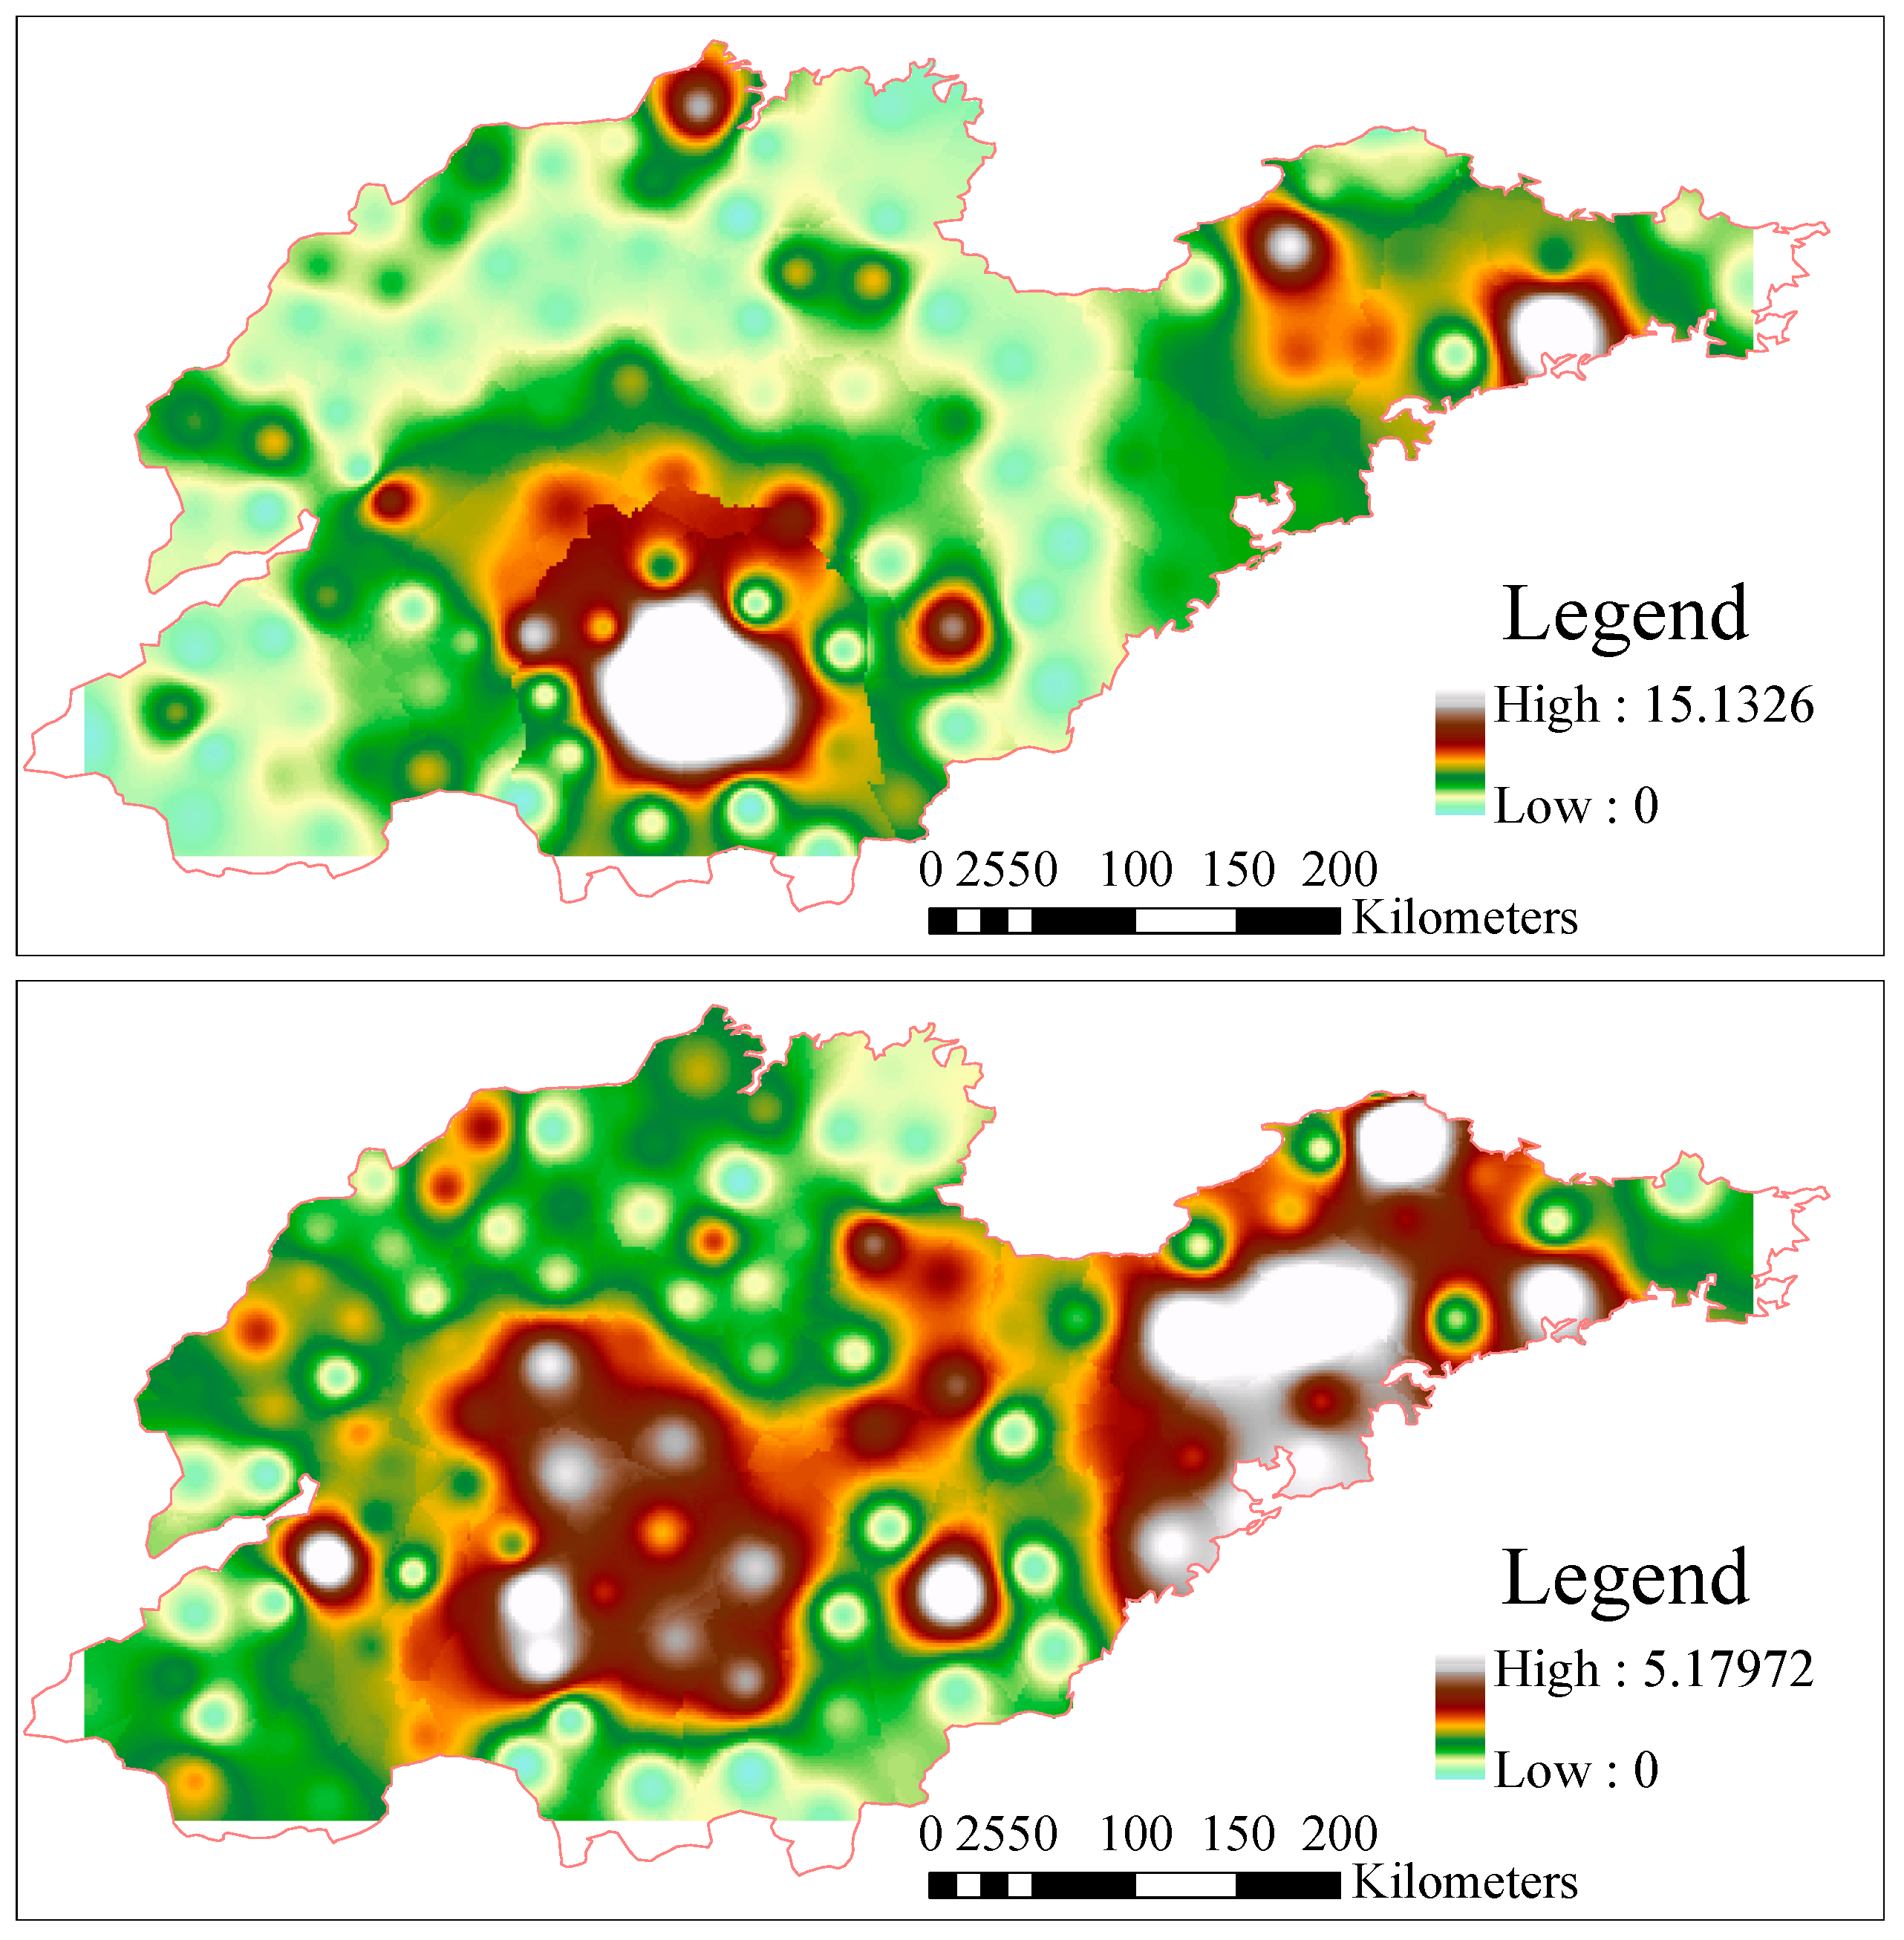
From the spatial distribution map of the pressure index on cropland in Shandong from the late 17th century to the beginning of the 20th century (
Figure 6), it was found that the pressure index on cropland showed a similar spatial distribution to cropland area per capita, and its threshold was lower than that in modern times. The pressure index on cropland distributed homogeneously. It was relatively lower in the 17th–18th century and increased during the 19th–20th century.
Pressure index on cropland in the majority of counties during the 17th–18th century was below 0.8, which means that there was no pressure on cropland. The exceptions included minority regions in Jinan, Linyi, and Binzhou, which probably had threat to food security with the pressure index being above 0.8 (
Figure 6). Until the 19th century and the beginning of the 20th century, two high-value centers of pressure on cropland appeared in middle Shandong and the Jiaodong Peninsula (
Figure 7), including some cities or counties in Linyi, Tai’an, Jinan, Laiwu, Yantai, Qingzhou, and Weihai, with their pressure index on cropland being above 1.6. There is the possibility of a food crisis in these areas.
4.5. Comparison between Climate Change Phases and the Extent of Sustainable Cropland Use in Shandong
First, it seems that a higher extent of sustainable cropland use occurred in the cold period, while a lower extent of sustainable cropland use occurred in the warm period in Shandong over the past 300 years. In the two cold periods (1620s–1710s and 1800s–1860s), the population density in Shandong was relatively lower. At this time, the labor/household densities of the majority of cities or counties during the 17th–18th century were below 10 Ding/km2, which reached above 10 Hu/km2 at the beginning of the 20th century during the warm period. In particular, the labor densities of the Northwest and Southwest agricultural areas increased from above 10 Ding/km2 during the 17th–18th century to reach 20 Hu/km2 in many regions until the beginning of 20th century. The cropland area per capita during the 17th–18th century was higher above 0.4 ha, which was eight times higher than the modern warning line of cropland area per capita put forward by the FAO. From the 19th century to the beginning of the 20th century, the cropland area per capita in the majority of counties in middle Shandong and the Jiaodong Peninsula decreased to below 0.1 ha, which is two times higher than the modern warning line. This meant that the strength of social vulnerability and the possibility of social turbulence resulting from a threat to food security increased. Similarly, the pressure index on cropland in the majority of counties during the 17th–18th century was below 0.8, which means that there was no pressure on cropland. Until the 19th century and the beginning of the 20th century, two high-value centers of pressure on cropland appeared in middle Shandong and the Jiaodong Peninsula. In these places, the pressure index on cropland in some cities or counties reached above 1.6, meaning that there was the possibility of a food crisis in these areas.
Second, the turning point of the 1680s from dry to relatively wet in North China seems to be attributed to the decrease in the extent of sustainable cropland use in Shandong, although this was not very distinctive. During the 17th–18th century, the population density in Shandong was relatively lower, the cropland area per capita was higher (above 0.4 ha), and the pressure index on cropland in majority of counties was below 0.8. This means that there was no pressure on cropland during the period around the 1680s. It is likely that the effect of dry/wet change on the sustainability of cropland use was not as obvious as that of temperature change.
5. Discussion
5.1. Impacting Process of Climate Change and the Sustainability of Cropland Use
Many researchers have analyzed the relationships between climate change or extreme climatic events with refugees and social stability in North China (Ye, et al., 2004; Xiao, 2011; Fang et al., 2007; Ye and Fang, 2013; Xiao et al., 2013). These case studies all showed that the impact of historical climate change on social stability in this area was often influenced by a failure in food production. In this present study, the intermediate elements of population, cropland area per capita, and pressure on sustainable cropland use were emphasized as a means of obtaining a better understanding of the impacting and responding processes of climate change.
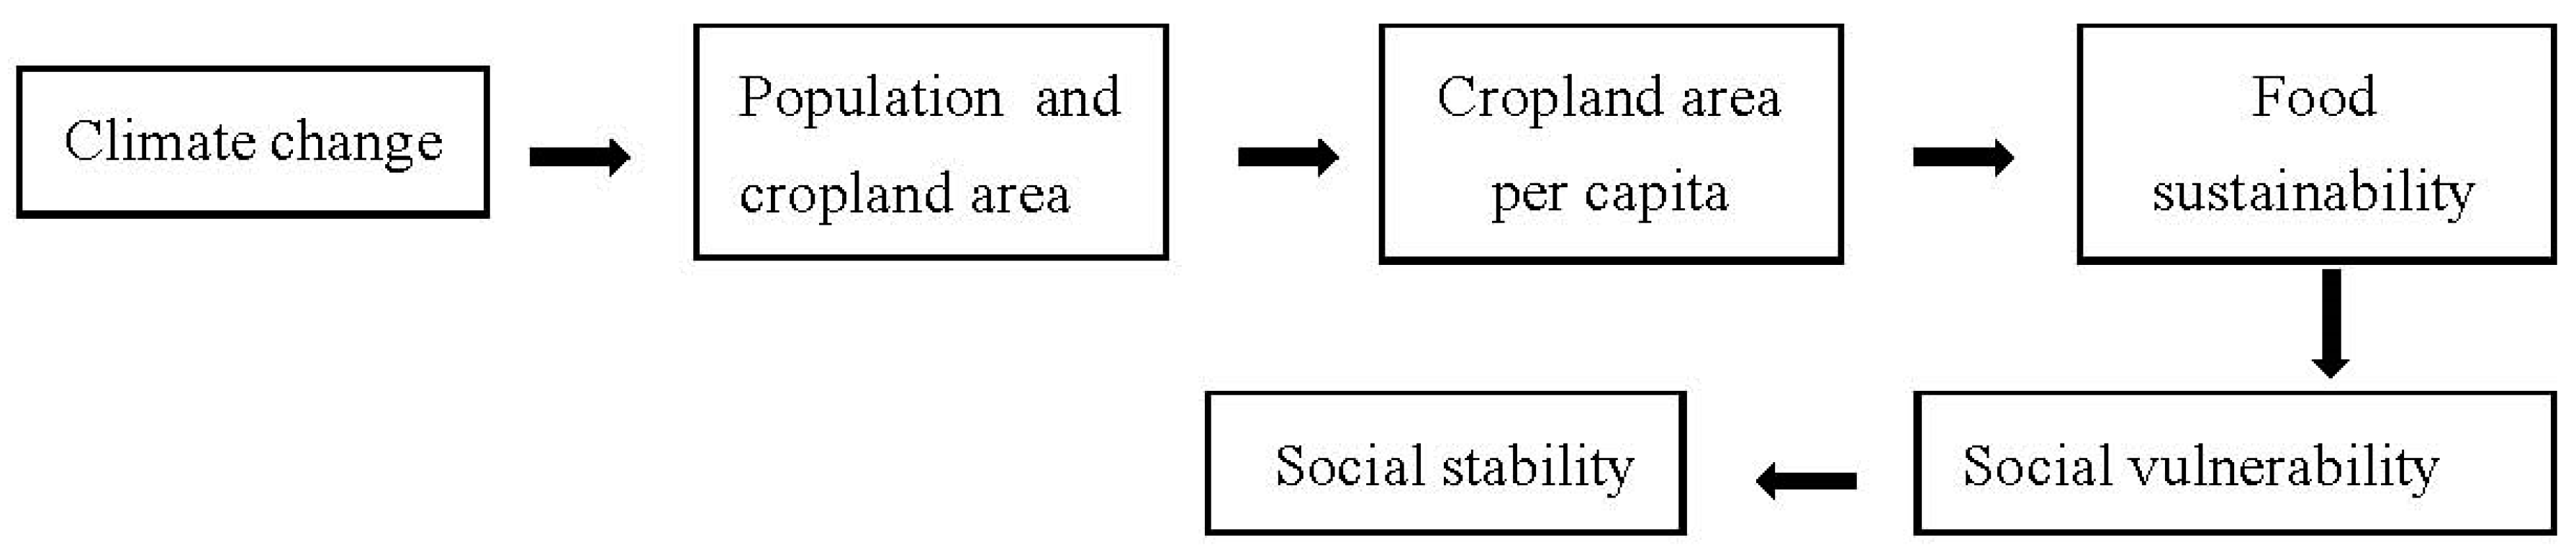
It appears that a warm climate was beneficial in driving an increase in population and agricultural development, which finally resulted in pressure on the sustainability of cropland use. In the cold periods, the population density in Shandong was relatively lower and the cropland area per capita was higher. During these periods, there was no pressure on sustainable cropland use. In the warm periods of the 20th century, the population density in Shandong increased more quickly, while cropland area increased slowly. This led to a decrease in cropland area per capita, which was followed by a decrease in the sustainability of cropland use. This would intensify the social conflict and increase the probability of social revolts. Therefore, the impacting process of climate change can be depicted as shown in
Figure 7.
In addition, the turning point of the 1680s from dry to wet in North China seemed to contribute to the decrease in the extent of sustainable cropland use in Shandong, although this was not very distinctive.
5.2. Special View of this Research and Its Scientific Value
Although some deviation still exists in the reconstructed results of population and cropland area per capita, this paper provides a perspective of food security and social vulnerability in the research area. To a certain extent, it makes up for the deficiency of paying more attention to the comparison of a series of climate change and social results while neglecting some intermediate links in the impact process and social vulnerability in this research area. By combining social vulnerability and human adaptation actions with climate-related hazards and physical exposure, it aims to accurately evaluate the impact of historical climate change or risk on human society. It also provides references to modern sustainable cropland use.
6. Conclusions
By analyzing historical documents, regression analysis, model of pressure index on cropland, and geographic information system (GIS), this paper reconstructed spatial patterns of labor/household density, cropland area per capita, and pressure index on cropland at the county level in Shandong Province during the 17th–20th century. Following this, we analyzed the impacting process of climate change and the sustainability of cropland use during the different periods. The conclusions of this study are as follows:
There was a distinct spatial difference in labor/household density which showed the effect of land suitability for reclamation on the population distribution. There was a greater proportion of the population in the agricultural area of Northwest and Southwest Shandong as well as the Jiaolai Plain. The population density of Shandong Province over the past 300 years has been increasing, especially in the three agricultural areas.
The spatial distribution of cropland area per capita in Shandong over the past 300 years has been relatively uniform. From the 19th century to the beginning of the 20th century, cropland area per capita decreased extensively and social vulnerability was strengthened. There was likely a threat to food security in Binzhou, Linyi, Jining, Laiwu, Taian, Yantai, Weihai, Jinan, Dezhou, Qingzhou.
The pressure index on cropland also showed a similar spatial distribution to cropland area per capita, but its threshold was lower than that in modern times. During the 19th century and the beginning of the 20th century, two high-value centers of pressure on cropland appeared in Middle Shandong and the Jiaodong Peninsula.
A warm climate was beneficial to driving an increase in population and agricultural development, which finally resulted in increasing pressure on the sustainability of cropland use. This increase in pressure on cropland was also related to the growth of the population as well as the spatial differences in land quality between plain and hill areas. The impacting process of climate change was sketched as following the flowchart shown in
Figure 7: climate change—population and cropland area—cropland area per capita—food sustainability and society vulnerability—social stability.


