Article

Tunisian Extra Virgin Olive Oil Traceability in the EEC Market: Tunisian/Italian (Coratina) EVOOs Blend as a Case Study

by
Chiara Roberta Girelli
,
Laura Del Coco
and
Francesco Paolo Fanizzi
*
Department of Biological and Environmental Science and Technologies (Di.S.Te.B.A.), University of Salento, via Prov.le Lecce-Monteroni, 73100 Lecce, Italy
*
Author to whom correspondence should be addressed.
Sustainability 2017, 9(8), 1471; https://doi.org/10.3390/su9081471
Submission received: 31 July 2017 / Revised: 14 August 2017 / Accepted: 16 August 2017 / Published: 19 August 2017

Abstract

:
In order to check the reliability of an NMR-based metabolomic approach to evaluating blend composition (and declaration), a series of 81 Italian/Tunisian blends samples at different percentage composition (from 10/90 to 90/10% Coratina/Tunisian oil by 10% increase step) were prepared starting from five Coratina (Apulia) and five Tunisian extra virgin olive oil (EVOO) batches. Moreover, a series of nine binary mixtures blend oils were obtained, starting from the two batches’ oil sums. The models built showed the linear relationship between the NMR signals and the percentage composition of the blends. In particular, a high correlation with the percentage composition of blends was obtained from the partial least squares (PLS) regression model, when the two batches oil sums were used for the binary mixtures of blend samples. These proposed methods suggest that a multivariate analysis (MVA)-based NMR approach—in particular PLS regression (PLSR)—could be a very useful tool (including for trading purposes) to assess quantitative blend composition. This is important for the sustainability of the goods’ free movement, especially in the agrifood sector. This cornerstone policy of current common markets is also clearly linked to the availability of methods for certifying the origin of the foodstuffs and their use in the assembly of final product for the consumer.

1. Introduction

Extra virgin olive oil (EVOO) is one of the most famous symbols of Italian agricultural products. It can be considered a strategic foodstuff for the national economy that leads Italy to an internationally significant position in olive oil commerce. The important commercial value of authentic olive oils led to the risk of adulteration, as recently described in the Report of the Parliamentary Committee Inquiry on Counterfeiting [1]. As reported, frauds and adulterations threatening 250 million plants, 50 million working days, sales of over 2 billion euro, and 43 Italian olive oils with denomination of origin recognized by the European Union. Among fraudulent practices: alterations in the composition of the organoleptic character of the product and of geographical indications (reported as forgeries), adulteration (addition or subtraction of specific components of the product), sophistication (addition of foreign substances), falsifications (substitutions of specific components). All of these conducts represent violations of industrial property rights. Recently, the so-called “Italian sounding” has been added to the list of scams. In particular, it is considered as the “production and marketing of foods containing a false evocation of the Italianness of the product”, able to induce the consumer to presume an Italian origin of the product. To this, a sophisticated fraudulent technique has been considered: deodorized oil, wherein poor-quality olive oil is manipulated and enriched in order to be introduced in the market with competitive prices. Moreover, the faked production of extra virgin olive oil supported by invoicing for unreal product or even by milling yields higher than effective ones lead to a misbranding system, known in Italy as “paper oil”, by which foreign olive oils are introduced in the Italian extra virgin olive oil production and labeled as Italian oils [2]. In particular, Italian producers criticized the recent regulation 2016/580 of the European Parliament and of the Council of 13 April 2016 [3], by which an autonomous annual duty free tariff quota of 35,000 tons for 2016 and 2017 for imports of lampante, virgin, and extra virgin olive oils (CN codes 15091010 and 15091090) originating in Tunisia, was opened. Italian producers and farmers’ association severely criticized this measure, by which they said Italian producers could be harmed and the risk that consumers will be exposed to “fake oil” could be seriously increased. Notwithstanding the assessment of the impact of this Regulation on the Union olive oil market [4], performed by the European Commission, according to which the implementation of Regulation (EU) 2016/580 would have had a marginal impact on the EU olive oil market, Coldiretti Association President Roberto Moncalvo declared that cheaply imported Tunisian oil could be mixed with Italian oil and falsely labeled “Made in Italy” for a premium price on the international market [5].
In 2014, The New York times reported that “Much of the extra virgin Italian olive oil flooding the world’s market shelves is neither Italian, nor virgin”. More recently, the economics and finance journal Forbes reported that “It's reliably reported that 80% of the Italian olive oil on the market is fraudulent…it’s likely that when you buy olive oil, you're not buying what it says on the label. …Italian extra virgin is very probably a fake” [6].
As a consequence, the detection of adulteration in extra virgin olive oil (EVOO) is one of the main aspects in the quality control and authenticity of the product [7,8,9,10,11,12,13,14,15,16,17]. Moreover, the need of a scientific tool to assess EVOOs geographical origin represents a hot topic issue since the European Regulation 182 of 6 March 2009—which declared the compulsory labeling of EVOOs with the geographical origin of the olives in all European countries [18]—still lacks an official validation methodology. We are currently involved in several NMR based metabolomics and chemometric studies to assess cultivar composition and geographical areas origin of extra virgin olive oils [19,20,21,22,23,24,25]. In this work we focused on a methodological 1H-NMR spectroscopy coupled with a chemometrics approach in order to provide a quantitative blend composition assessment.
In particular, we build a specific 1H-NMR spectral database with blends of a typical Apulian oil obtained from the popular cultivar Coratina [20,25,26], and a widely available Tunisian oil (obtained from Chemlali and Chetoui cultivars) at different known Coratina/Tunisian percentage composition. The relation obtained between the 1H-NMR based metabolic profiles of the reference blends (accounting for their overall molecular content) and their content could be used as a tool to evaluate the blend composition in analogous possible test samples.

2. Materials and Methods

2.1. Sampling

EVOO oil batches (from the same single harvesting season 2014/2015) from five monocultivar Italian (from Apulia, Italy) Coratina (indicated as C1, C2, C3, C4, C5) and five Tunisian (from Sfax, Tunisia) Chemlali/Chetoui cultivars (indicated as T1, T2, T3, T4, T5), obtained from local producers, were supplied by Certified Origins Italia Srl. All the samples were stored in sealed dark glass bottles at room temperature in the dark prior to analysis.
Nine series of Coratina/Tunisian blend samples were obtained by using several combinations (C1, T1; C2, T2, etc.) of the available original oils following a regular grid sampling (see Scheme 1). Each series consisted of nine blends with different percentage composition (see Table 1) (from 10/90 to 90/10% Coratina/Tunisian oil by 10% increase step) reaching a total of 81 blend samples. The 112 overall number of analyzed samples also included 31 further samples. These latter were constituted by two technical replicates from each original (C1–C5 and T–T5) batch EVOO sample (for a total of 10 C and 10 T samples), two batches oil sums: Cs = C1 + C2 + C3 + C4 + C5 and Ts = T1 + T2 + T3 + T4 + T5) (Figure 1) and nine further blends (from 10/90 to 90/10% Cs/Ts oil by 10% increase step). The analyses were performed by using 1H-NMR spectroscopy and multivariate analysis (MVA), within the maximum optimal shelf life (12–18 months from the date of bottling) [27].

2.2. Sample Preparation for 1H-NMR Analysis

NMR samples were prepared dissolving ~140 mg of olive oil in CDCl3 and adjusting the overall batches oil sums ratio of olive oil:CDCl3 to 13.5%:86.5%. Next, 600 μL of the prepared mixture were transferred into a 5-mm NMR tube. This ratio was chosen to give the best tradeoff for sensitivity/solution viscosity in spectral acquisition (Bruker Italia, standardized procedure for olive oil analysis) [21]. 1H-NMR spectra were recorded on a Bruker Avance spectrometer (Bruker, Karlsruhe, Germany) operating at 400.13 MHz, T = 300 K, equipped with a PABBI 5-mm inverse detection probe incorporating a z axis gradient coil. NMR experiments were performed under full automation for the entire process after loading individual samples on a Bruker Automatic Sample Changer (BACS-60), interfaced with the software IconNMR (Bruker).
Automated tuning and matching, locking and shimming, and calibration of the 90° hard pulse P(90°) were done for each sample using standard Bruker routines ATMA, LOCK, TOPSHIM, and PULSECAL to optimize NMR conditions. For each sample, after a 5-min waiting period for temperature equilibration, a standard one-dimensional (1H ZG) NMR experiment was performed. The relaxation delay (RD) and acquisition time (AQ) were set to 4 s and ~3.98 s, respectively, resulting in a total recycle time of ~7.98 s. Free Induction Decays (FIDs) were collected into time domain (TD) = 65,536 (64 k) complex data points by setting: spectral width (SW) = 20.5524 ppm (8223.685 Hz), receiver gain (RG) = 4, number of scans (NS) = 16. An accumulation of 16 scans (or even fewer) are usually used for samples where metabolites are present in high concentrations, as in the case of olive oil [19,28].

2.3. 1H-NMR Spectra Pre-Processing and Multivariate Statistical Analysis

The NMR raw data set was pre-processed using Topspin 2.1 and AMIX 3.9.15 (Bruker BioSpin GmbH, Rheinstetten, Germany). The FIDs were multiplied by an exponential line broadening function (0.3 Hz) before Fourier transformation and automatically phased. Spectra were referenced to the tetramethylsilane (TMS) single signal at 0.00 ppm, used as an internal standard, obtaining good peak alignment. NMR spectra were processed using Topspin 2.1 (Bruker) and visually inspected using Amix 3.9.15 (Bruker, Biospin, GmbH, Germany). Furthermore, spectra were segmented in rectangular buckets of fixed 0.04 ppm width and integrated using the Bruker Amix software. Bucketing was performed within 10.00–0.5 ppm region, excluding the signal of the residual non-deuterated chloroform and its carbon satellites (7.6–6.9 ppm); total sum normalization was applied to minimize small differences due to total olive oil concentration and/or acquisition conditions among samples. The Pareto scaling method (performed by dividing the mean-centered data by the square root of the standard deviation) was then applied to the variables [29]. The data table generated by all aligned buckets row-reduced spectra was used for multivariate data analysis. Each bucket row represents the entire NMR spectrum, and all the molecules present in the sample. Each bucket in a buckets row-reduced spectrum is labeled with the value of the central chemical shift for its specific 0.04 ppm width. The variables used as descriptors for each sample in chemometric analyses are the buckets.
Multivariate analyses (MVAs) and graphics were obtained using Simca-P version 14 (Umetrics, Malmö, Sweden) using different procedures: principal components analysis (PCA), partial least-squares discriminant analysis (PLS-DA), and orthogonal partial least-squares discriminant analysis (OPLS-DA) [30]. PCA is an unsupervised pattern recognition method, and was performed to examine the intrinsic variation in the data set. PLS-DA was applied to maximize the separation between sample classes. PLS-DA is the regression extension of PCA, and gives the maximum covariance between the measured data (X variable, matrix of buckets related to metabolites in NMR spectra), and the response variable (Y variable, matrix of data related to the class membership). In addition to PLS-DA, OPLS-DA was also applied in MVA. As shown in several recent metabolomics studies, OPLS-DA represents the most recently used technique for the discrimination of samples with different characteristics (such as cultivars and/or geographical origin). OPLS-DA is a modification of the usual PLS-DA method which filters out variation that is not directly related to the response. The further improvements made by the OPLS-DA in MVA resides in the ability to separate the portion of the variance useful for predictive purposes from the not predictive variance (which is made orthogonal). Furthermore, OPLS-DA focuses the predictive information in one component, facilitating the interpretation of spectral data. On the other hand, when a four-category (i.e., the cultivars) model was used for further classification purposes, PLS-DA rather than OPLS-DA was preferred [31]. For both PLS-DA and OPLS-DA, the quality of the models obtained was assessed by R2 and Q2 values. The first (R2) is a cross-validation parameter defined as the portion of data variance explained by the models, and indicates goodness of fit. The second (Q2) represents the portion of variance in the data which is predictable by the model. This latter indicates the model’s predictive ability, which is extracted according to the internal seven-fold cross-validation method and further evaluated with permutation test (400 permutations) of SIMCA-P software [32,33]. The minimal number of components required can be easily defined since R2(cum) and Q2(cum) parameters display completely diverging behaviour as the model complexity increases. The addition of further unnecessary components to the model can therefore be easily detected and avoided.
PLS-regression (PLSR) is the PLS (projections to latent structure by means of partial least squares) approach in its simplest and—in chemistry and technology—most-used form (two-block predictive PLS). PLS-regression is a method for relating two data matrices, X and Y, by a linear multivariate model, but goes beyond traditional regression in that it also models the structure of X and Y. Its usefulness arises from its ability to analyze data with many, noisy, collinear, and even incomplete variables in both X and Y. PLSR has the desirable property that the precision of the model parameters improves with the increasing number of relevant variables and observations. In addition, PLSR models the structure of X and of Y, which gives richer results than the traditional multiple regression approach. PLSR is of particular interest because it also simultaneously models several response variables, Y (i.e., profiles of performance). The purpose of the PLS-regression is to build a linear model enabling the prediction of a desired characteristic y from a measured spectrum x and profitably applies to the task of the present work when analyzing and predicting olive oil blends of different composition by 1H-NMR spectra. The predictive power of the PLS model is evaluated by the RMSECV(Y) (root mean square error of cross-validation) [34]. In general, multivariate regression methods are used to make quantitative predictions relative to one or more properties of the system in question. The aim was to find the best relationship between a set of variables describing the objects studied (the oil samples) and a set of measured responses of the same objects. In our case, we created a regression model for interpolation of nuclear magnetic resonance spectroscopy data (matrix of X variables, NMR signals) with the percentages of mixed-composition oil (Italian/Tunisian, blend samples, response variable, Y).

2.4. Chemicals

All chemical reagents for analysis were of analytical grade. CDCl3 (99.8 atom % D) and tetramethylsilane, TMS (0.03 v/v %) were purchased from Armar Chemicals (Switzerland).

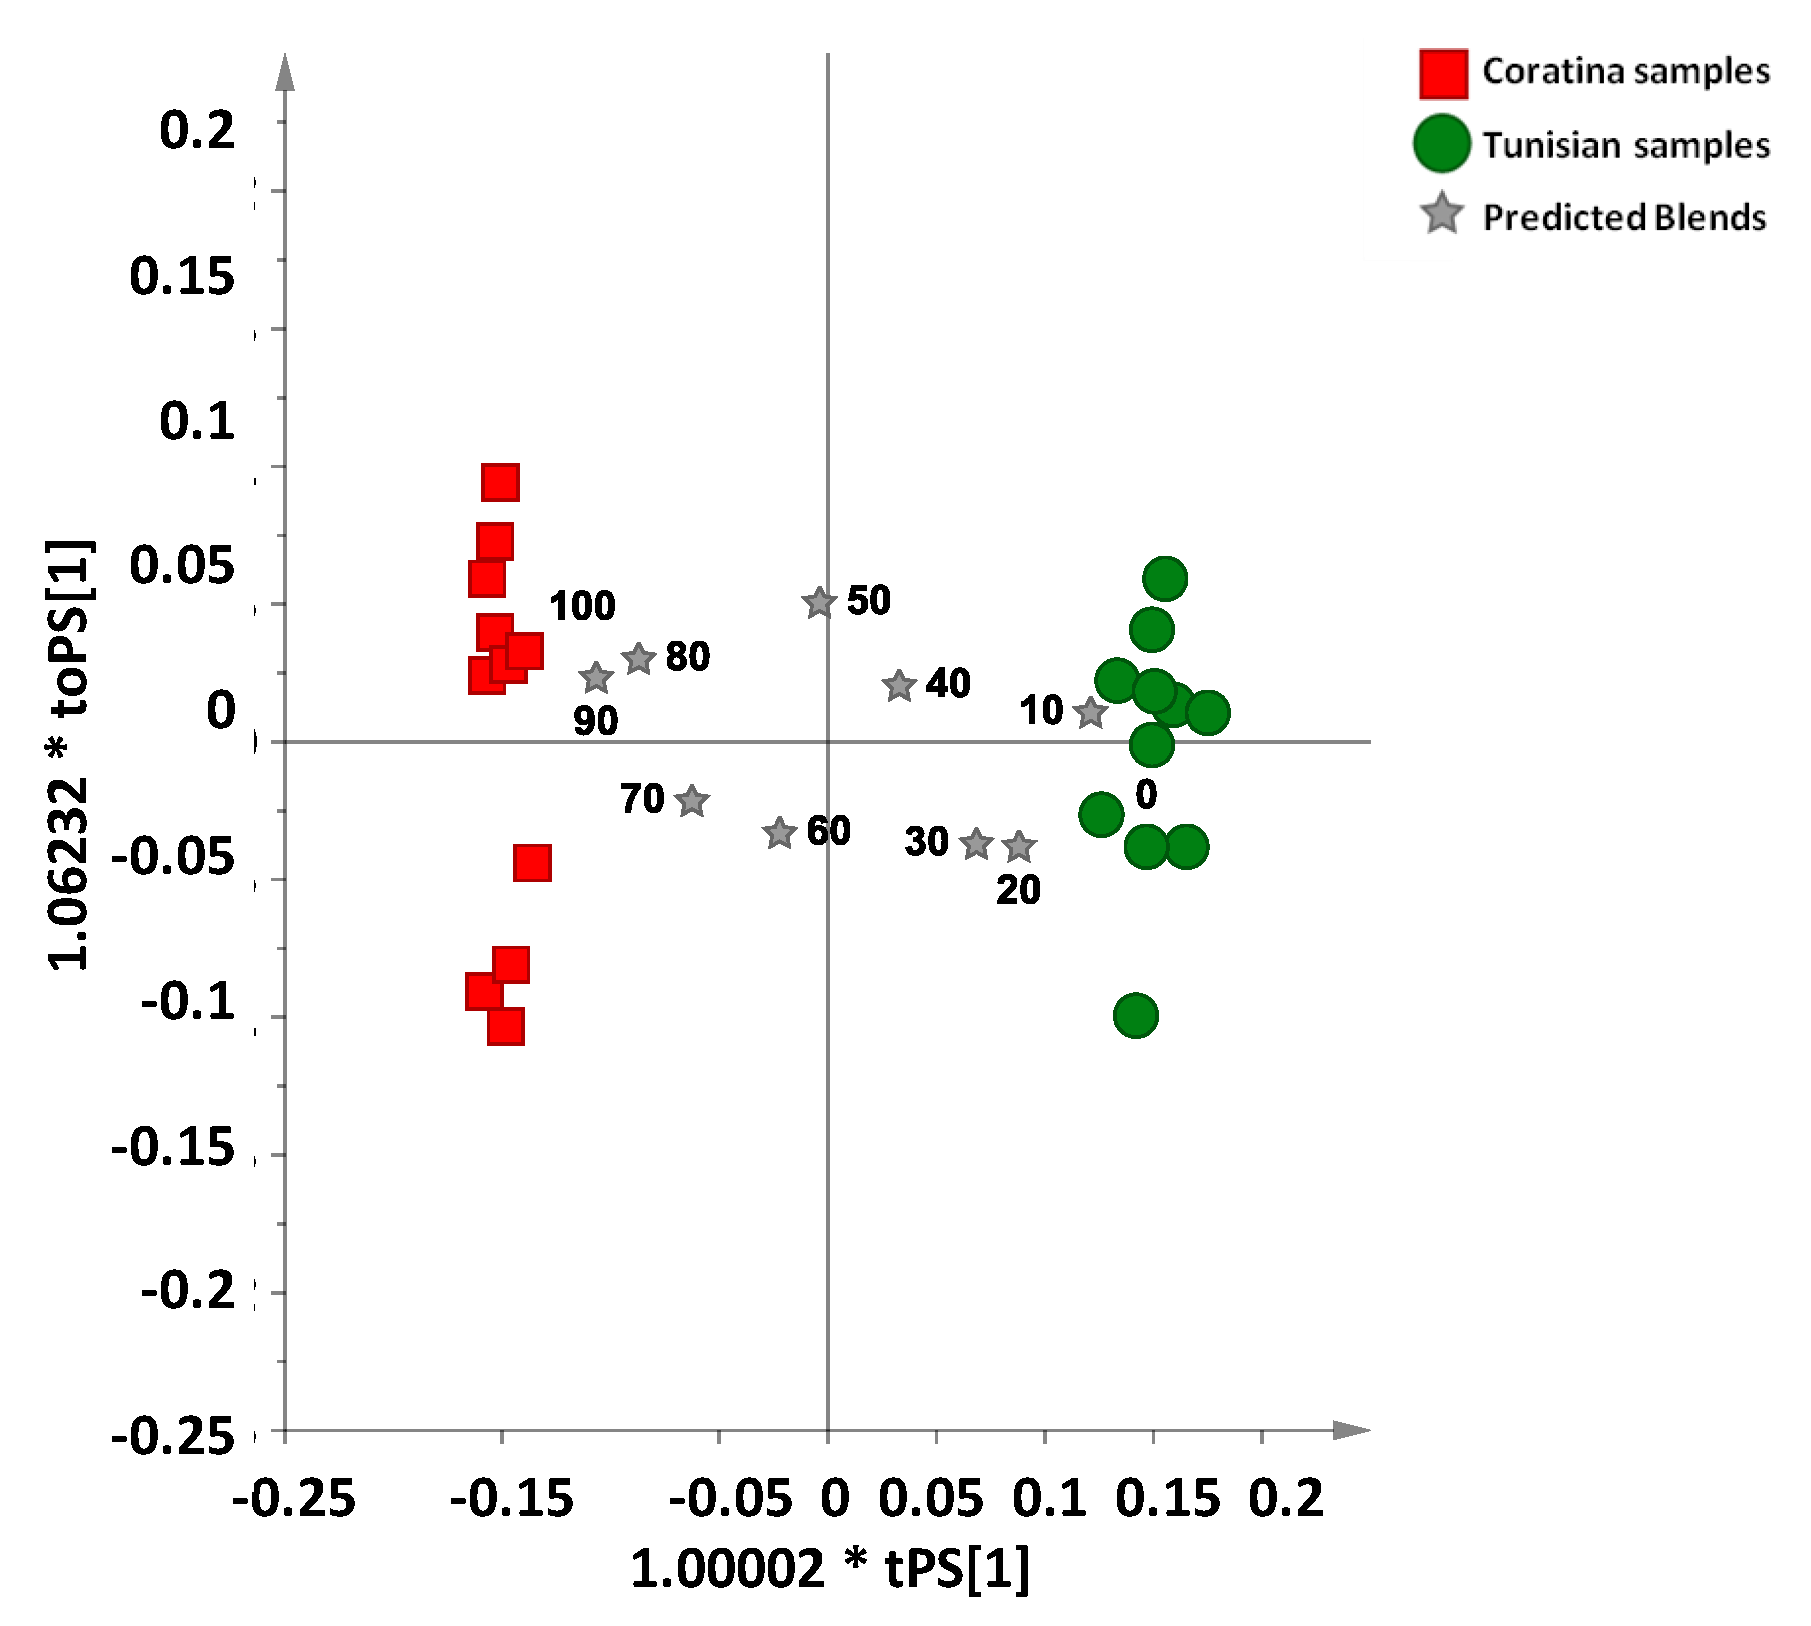
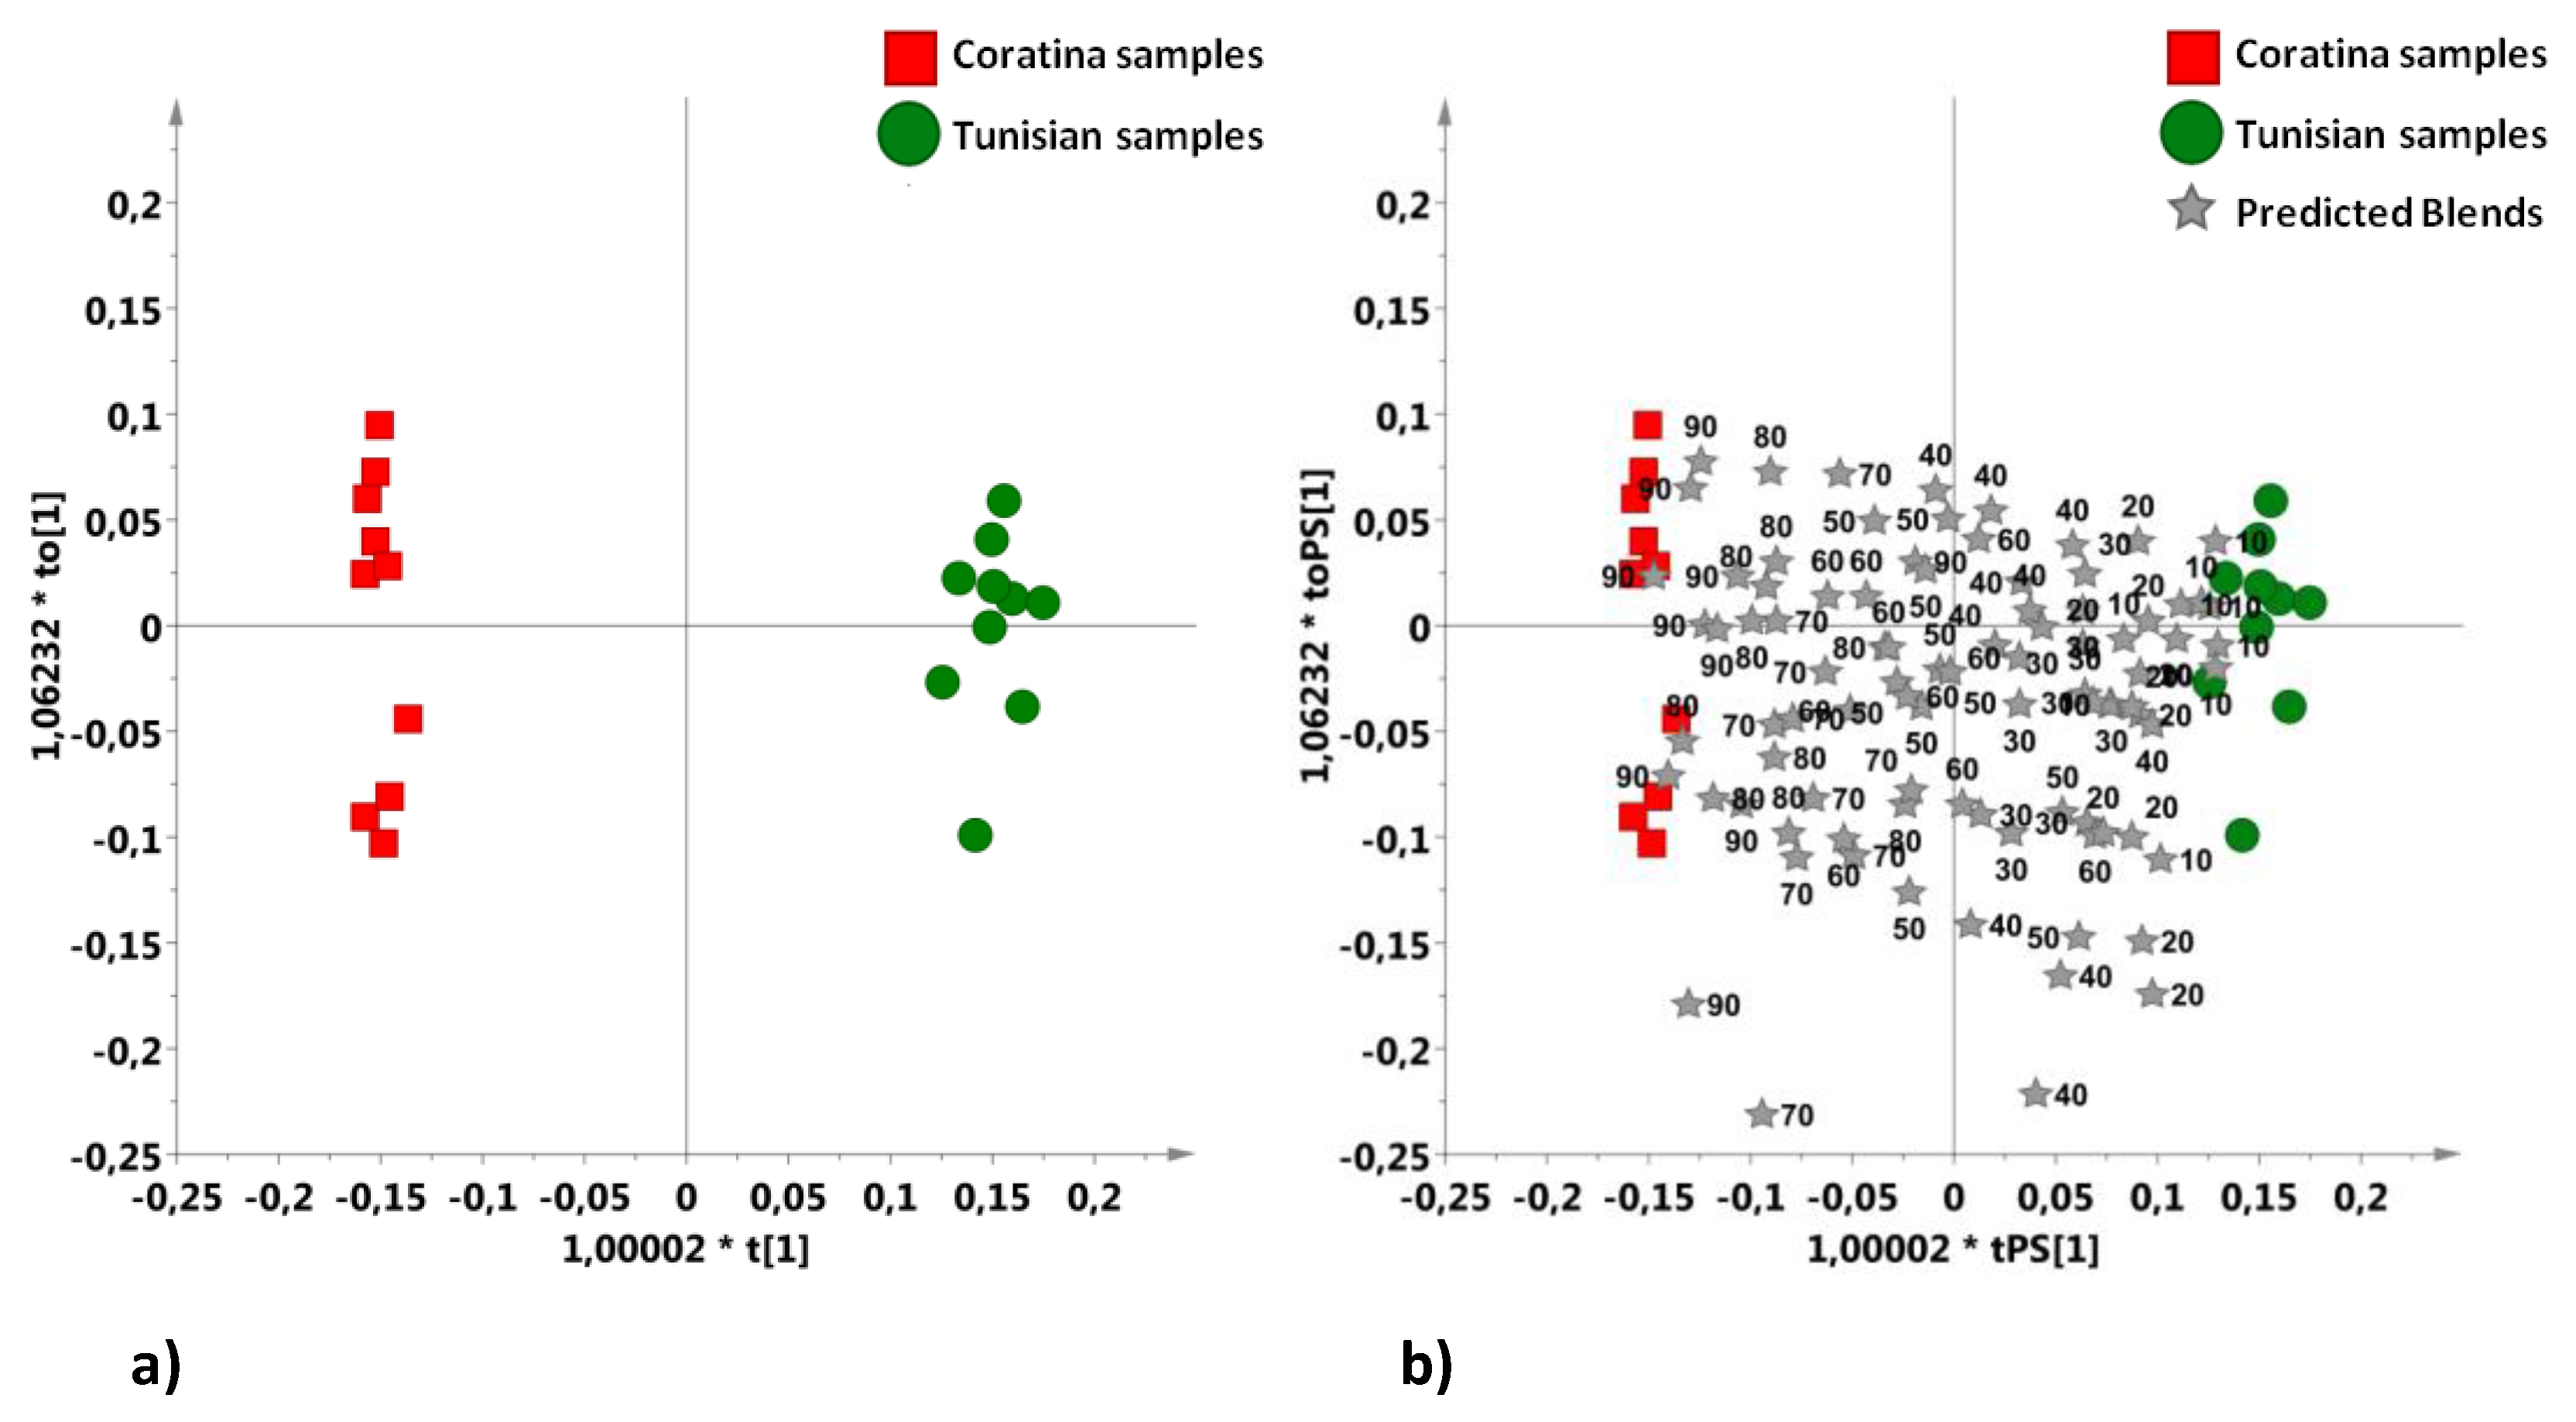
3. Results and Discussion

A 1H-NMR spectral database with blends of a typical Apulian oil obtained from the popular cultivar, Coratina, and a widely available Tunisian oil (obtained from Chemlali and Chetoui cultivars) at different known Coratina/Tunisian percentage composition was specifically constituted for this study. We chose Italian monocultivar Coratina EVOO for the model because Coratina is the most important cultivar of the Apulia region—the leading olive oil producer in Italy, accounting for almost 40% of the total country’s production. Therefore Coratina-based blends represent an essential part of Italian EVOOs. A regression model was obtained by the PLSR procedure described in the Materials and Methods section for 101 Coratina/Tunisian EVOO blend samples (81 CnTn together with 10 C and 10 T samples obtained from the original C1–C5 and T1–T5 batches EVOO samples) as a function of the percentage of Coratina oil calculated for each blend sample. The existence of a linear relationship can be clearly observed in Figure 2. The estimated regression line is more appropriate to describe the relationship between the two variables, as the points observed are close to this line, while the observed distance from the line observation may represent potential measurement or response variable Y errors. The linear relationship between the two matrices (X, the NMR data; and Y, the dependent variable—i.e., the percentage of Coratina oil for each blend oil) was expressed by the linear function y = x + 3.13* e−007, and the correlation is described by the regression coefficient (R2 = 0.961), which expresses how much the dependent character increases on an independent character unit on average. The model parameters (three components) indicate both a good descriptive (R2X(cum) = 0.837, R2Y(cum) = 0.961) and predictive (Q2(cum) = 0.953) ability of the system. The overall result could be considered satisfactory since variable Y errors (RMSECV(Y) = 6.7652%) also account for the heterogenic blend composition (blends formed by five Coratina and five Tunisian different oil batches).
Italian Coratina and Tunisian EVOO oil batches were also used to build a two-group OPLS-DA model (Figure 3a). To search for a better model with higher prediction capability, the original samples of Coratina and Tunisian oils were duplicated (total of 20 samples). The two groups appeared well-separated in the scoreplot, according to the cultivar properties, with the Coratina samples characterized by a higher relative content of monounsaturated fatty acids (δH 1.30 ppm signal corresponding to the acyl group of oleic acid, loadings plot analysis, data not shown). On the other hand, the Tunisian oils showed a considerably higher relative content of polyunsaturated acyl groups (δH 1.38 ppm signal corresponding to the methylene of the unsaturated acyl groups, δH 2.74 and 2.78 ppm, signals of linoleic and linolenic diallilyc groups, signals in the range δH 5.38–5.42 ppm ascribed to linoleic and linolenic olefinic protons). This model was also used to predict all the oil blends prepared in the laboratory. From the score plot of the model which included—as predicted—the 81 CnTn blends prepared in the laboratory (Figure 3b), the distribution of these latter ones according to the percentage of Coratina over Tunisian oil can be observed. Coratina’s highest percentage blends (containing from 90 to 60% of Coratina oil) are evidently placed in the area of the graphic which is clearly closer to the monocultivar Coratina reference class, while the other mixed oils are gradually distributed in the dispersion graph, with the increasing amount of Tunisian percentage positioned towards the area identified by the pure Tunisian samples.
Finally, a series of 11 blend oils, starting from the 2 batches oil sums (Cs = C1 + C2 + C3 + C4 + C5 and Ts = T1 + T2 + T3 + T4 + T5), from 0/100 to 100/0% Cs/Ts oil by 10% increase step, were obtained. From the PLSR analysis a clear improvement with respect to the model originated by the blends formed by five Coratina and five Tunisian different oil batches (Figure 2) could be observed. The obtained linear function y = 0.9757x + 0.9308 showed higher goodness of fit (R2 = 0.998) and much lower RMSECV(Y) = 1.6221%. Accordingly, the model parameters were better for both descriptive (R2X(cum) = 0.905, R2Y(cum) = 0.998) and predictive (Q2(cum) = 0.997) ability of the system (Figure 4). This occurs because the two “overall batches oil sums” (Cs and Ts) obtained by mixing the individual Coratina and Tunisian oil batches clearly average the small variations that differentiate the different samples batches within each individual class (Coratina or Tunisian). The blends originated from the overall batches oil sums line up along the regression line, confirming the perfect linear dependence between the NMR data and the percentage composition of each mixed oil sample.
The eleven samples consisting of the two batches oil sums Cs and Ts and the nine blends (from 0/100 to 100/0% Cs/Ts oil by 10% increase step) used for the PLSR model of Figure 4 were also predicted on the OPLS-DA model (Figure 5), built with the pure Coratina (10 C) and Tunisia (10 T) reference samples. Again, a very good scoreplot was obtained for the predicted samples. A potentially good degree of blend composition assessment was observed, as the samples distribution follows the trend of the Coratina vs. Tunisian percentage present in the blend (from 0/100 to 100/0% Cs/Ts oil by 10% increase step).
The 11 blends series consisting of known percentages of Coratina and Tunisian overall batches oil sums used for the PLSR model of Figure 4 were also predicted by using the PLSR model of 101 blend samples (81 CnTn together with 10 C and 10 T samples obtained from the original C1–C5 and T1–T5 batches EVOOs) (Figure 2). The PLSR prediction plot (Figure 6) showed the observed versus predicted samples in the model. The predicted oil samples fall close to the 45 degree regression line (goodness of fit R2= 0.964), confirming the averaging effect obtained by using overall batches oil sums on the small variations that differentiate the different samples batches within each individual class (Coratina or Tunisian).

4. Conclusions

In this work, a chemometric approach was applied on a 1H-NMR spectral database of blends Italian (Apulian) and Tunisian oils (obtained from Chemlali and Chetoui cultivars) at different known Coratina/Tunisian percentage composition. Two PLSR models were built: one for 101 Coratina/Tunisian EVOO blend samples (81CnTn, 10 C and 10 T obtained from the original C1–C5 and T1–T5 batches) and another for 11 blend samples (9 Cs/Ts blends, Cs and Ts) obtained from the 2 overall batches oil sums (Cs, Ts). The PLSR quality parameters showed that both PLSR models could be profitably used for blend prediction and classification. This was also confirmed by predicting, in the 101 PLSR model, the samples used to build the 11 blend system. The gradual merging of the characteristics of Coratina and Tunisian oils in the blend formation was clearly shown by predicting all the studied blends in an OPLS-DA model built using pure Coratina (10 C) and Tunisian (10 T) samples. A clear improvement in the goodness of fit and the predictive power was observed in the 11 with respect to 101 PLSR model. This occurs because the two “overall batches oil sums” obtained by mixing the individual Coratina and Tunisian oil batches clearly average the small variations that differentiate the different samples batches within each individual class (Coratina or Tunisian). Although further studies should be conducted taking into account commercial olive oils, it can be concluded that the MVA-based NMR approach could be a very useful tool to assess not only cultivar and/or geographical origin, but also quantitative blend composition of EVOOs. In particular, PLSR models built with a statistically significant number of EVOOs could also be used as a tool for identifying products for commercial quality characterization related to blend composition. On the other hand, the sustainability of the goods free movement—especially in the agrifood sector—is clearly also linked to the availability of methods for certifying the origin of the foodstuffs and their use in the final product assembly for the consumer.

Acknowledgments

The authors give special thanks to the olive oil suppliers and in particular to “Certified Origins Italia Srl” (Località il Madonnino, Grosseto, Toscana, Italy) for collaboration and support the present work. This work was supported by the grant project, the PON (Programma Operativo Nazionale) 254/Ricerca. Potenziamento del “Centro Ricerche per la Salute dell’Uomo e dell’Ambiente” PONa3_00334.

Author Contributions

C.R.G. and L.D.C. prepared the samples for NMR analysis; performed the NMR experiments; analyzed and interpreted the NMR and statistical data; wrote and reviewed drafts of the manuscript, prepared the final writing; F.P.F. supervised NMR experiments and statistical analysis, wrote and reviewed drafts of the paper and contributed to the final writing. All authors read and approved the final manuscript.

Conflicts of Interest

The authors declare no conflict of interest.

References

  1. Camera dei Deputati. Parliamentary Committee Inquiry on Counterfeiting. Available online: http://www.camera.it/leg17/491?idLegislatura=17&categoria=022bis&tipologiaDoc=documento&numero=004&doc=intero (accessed on 28 July 2017).
  2. Osservatorio Parlamentare. La Contraffazione Degli Oli di Oliva: Relazione della Commissione di Inchiesta Parlamentare. Available online: http://www.avvisopubblico.it/osservatorio/contenuti-dellosservatorio/attivita-dinchiesta/commissione-sulla-contraffazione/la-contraffazione-degli-oli-di-oliva-relazione-della-commissione-di-inchiesta-parlamentare/ (accessed on 28 July 2017).
  3. EUR-Lex. Regulation (EU) 2016/580 of the European Parliament and of the Council of 13 April 2016 on the Introduction of Emergency Autonomous Trade Measures for the Republic of Tunisia. Available online: http://eur-lex.europa.eu/legal-content/EN/TXT/?qid=1475139131335&uri=%20CELEX:32016R0580 (accessed on 28 July 2017).
  4. European Commission. Assessment of the Impact of Regulation (EU) 2016/580 of the European Parliament and Council on the Introduction of Emergency Autonomous Trade Measures for the Republic of Tunisia. Available online: https://ec.europa.eu/agriculture/sites/agriculture/files/olive-oil/oo-tq-assessment-impact-regulation.pdf (accessed on 28 July 2017).
  5. The Arab Weekly. Available online: http://www.thearabweekly.com/Interview/5103/Tunisian-olive-oil-overcomes-Italian-protests%2C-climate-change (accessed on 28 July 2017).
  6. Forbes. The Olive Oil Scam: If 80% Is Fake, Why Do You Keep Buying It? Available online: https://www.forbes.com/sites/ceciliarodriguez/2016/02/10/the-olive-oil-scam-if-80-is-fake-why-do-you-keep-buying-it/#568422aa639d (accessed on 28 July 2017).
  7. Camin, F.; Pavone, A.; Bontempo, L.; Wehrens, R.; Paolini, M.; Faberi, A.; Marianella, R.M.; Capitani, D.; Vista, S.; Mannina, L. The use of IRMS, H-NMR and chemical analysis to characterise Italian and imported Tunisian olive oils. Food Chem. 2016, 196, 98–105. [Google Scholar] [CrossRef] [PubMed]
  8. Sun, X.; Lin, W.; Li, X.; Shen, Q.; Luo, H. Detection and quantification of extra virgin olive oil adulteration with edible oils by FT-IR spectroscopy and chemometrics. Anal. Methods 2015, 7, 3939–3945. [Google Scholar] [CrossRef]
  9. Mannina, L.; Sobolev, A.P. High resolution NMR characterization of olive oils in terms of quality, authenticity and geographical origin. Magn. Reson. Chem. 2011, 49, S3–S11. [Google Scholar] [CrossRef] [PubMed]
  10. Alonso-Salces, R.M.; Holland, M.V.; Guillou, C. 1H-NMR fingerprinting to evaluate the stability of olive oil. Food Control 2011, 22, 2041–2046. [Google Scholar] [CrossRef]
  11. Alonso-Salces, R.M.; Moreno-Rojas, J.M.; Holland, M.V.; Reniero, F.; Guillou, C.; Héberger, K. Virgin olive oil authentication by multivariate analyses of 1H-NMR fingerprints and δ13C and δ 2H data. J. Agric. Food Chem. 2010, 58, 5586–5596. [Google Scholar] [CrossRef] [PubMed]
  12. Dais, P.; Hatzakis, E. Quality assessment and authentication of virgin olive oil by NMR spectroscopy: A critical review. Anal. Chim. Acta 2013, 765, 1–27. [Google Scholar] [CrossRef] [PubMed]
  13. Longobardi, F.; Ventrella, A.; Napoli, C.; Humpfer, E.; Schütz, B.; Schäfer, H.; Kontominas, M.G.; Sacco, A. Classification of olive oils according to geographical origin by using 1H-NMR fingerprinting combined with multivariate analysis. Food Chem. 2012, 130, 177–183. [Google Scholar] [CrossRef]
  14. Popescu, R.; Costinel, D.; Dinca, O.R.; Marinescu, A.; Stefanescu, I.; Ionete, R.E. Discrimination of vegetable oils using NMR spectroscopy and chemometrics. Food Control 2015, 48, 84–90. [Google Scholar] [CrossRef]
  15. Laincer, F.; Iaccarino, N.; Amato, J.; Pagano, B.; Pagano, A.; Tenore, G.; Tamendjari, A.; Rovellini, P.; Venturini, S.; Bellan, G.; et al. Characterization of monovarietal extra virgin olive oils from the province of Béjaïa (Algeria). Food Res. Int. 2016, 89, 1123–1133. [Google Scholar] [CrossRef]
  16. Gòmez-Caravaca, A.M.; Maggio, R.M.; Cerretani, L. Chemometric applications to assess quality and critical parameters of virgin and extra-virgin olive oil. A review. Anal. Chim. Acta 2016, 913, 1–21. [Google Scholar] [CrossRef] [PubMed]
  17. Corsaro, C.; Mallamace, D.; Vasi, S.; Ferrantelli, V.; Dugo, G.; Cicero, N. 1H-HR-MAS NMR Spectroscopy and the Metabolite Determination of Typical Foods in Mediterranean Diet. J. Anal. Methods Chem. 2015, 2015, 175696–175710. [Google Scholar] [CrossRef] [PubMed]
  18. The Commission of the European Communities. Commission Regulation (EC) No. 182/2009 of 6 March 2009 amending Regulation (EC) No. 1019/2002 on marketing standard for olive oil. Off. J. Eur. Union 2009, L63, 6–8.
  19. Del Coco, L.; Mondelli, D.; Mezzapesa, G.N.; Miano, T.; De Pascali, S.A.; Girelli, C.R.; Fanizzi, F.P. Protected Designation of Origin Extra Virgin Olive Oils Assessment by Nuclear Magnetic Resonance and Multivariate Statistical Analysis: “Terra di Bari”, an Apulian (Southeast Italy) Case Study. J. Am. Oil Chem. Soc. 2016, 93, 373–381. [Google Scholar] [CrossRef]
  20. Del Coco, L.; De Pascali, S.A.; Fanizzi, F.P. 1H-NMR spectroscopy and multivariate analysis of monovarietal EVOOs as a tool for modulating Coratina-based blends. Foods 2014, 3, 238–249. [Google Scholar] [CrossRef] [PubMed]
  21. Girelli, C.R.; Del Coco, L.; Papadia, P.; De Pascali, S.A.; Fanizzi, F.P. Harvest year effects on Apulian EVOOs evaluated by 1H-NMR based metabolomics. PeerJ 2016. [Google Scholar] [CrossRef]
  22. Girelli, C.R.; Del Coco, L.; Fanizzi, F.P. 1H-NMR spectroscopy and multivariate analysis as possible tool to assess cultivars, from specific geographical areas, in EVOOs. Eur. J. Lipid Sci. Technol. 2016, 118, 1380–1388. [Google Scholar] [CrossRef]
  23. Binetti, G.; Del Coco, L.; Ragone, R.; Zelasco, S.; Perri, E.; Montemurro, C.; Valentini, R.; Naso, D.; Fanizzi, F.P.; Schena, F.P. Cultivar classification of Apulian olive oils: Use of artificial neural networks for comparing NMR, NIR and merceological data. Food Chem. 2017, 15, 131–138. [Google Scholar] [CrossRef] [PubMed]
  24. Piccinonna, S.; Ragone, R.; Stocchero, M.; Del Coco, L.; De Pascali, S.A.; Schena, F.P.; Fanizzi, F.P. Robustness of NMR-based metabolomics to generate comparable data sets for olive oil cultivar classification. An inter-laboratory study on Apulian olive oils. Food Chem. 2016, 199, 675–683. [Google Scholar] [CrossRef] [PubMed]
  25. Del Coco, L.; Perri, E.; Cesare, G.; Muzzalupo, I.; Zelasco, S.; Simeone, V.; Schena, F.P.; Fanizzi, F.P. NMR-based metabolomic approach for EVOO from secular olive trees of Apulia region. Eur. J. Lipid Sci. Technol. 2013, 115, 1043–1052. [Google Scholar] [CrossRef]
  26. Dabbou, S.; Dabbou, S.; Chehab, H.; Taticchi, A.; Servili, M.; Hammami, M. Content of fatty acids and phenolics in Coratina olive oil from Tunisia: Influence of irrigation and ripening. Chem. Biodivers. 2015, 12, 397–406. [Google Scholar] [CrossRef] [PubMed]
  27. Barbarisi, C.; Di Stasio, M.; La Cara, F.; Nazzaro, M.; Siano, F.; Coppola, R.; Volpe, F.; Di Mattia, A.; Volpe, M.G. Shelf-life of extra virgin olive oils from Southern Italy. Curr. Nutr. Food Sci. 2014, 10, 234–240. [Google Scholar] [CrossRef]
  28. Barison, A.; Pereira da Silva, C.W.; Campos, F.R.; Simonelli, F.; Lenz, C.A.; Ferreira, A.G. A simple methodology for the determination of fatty acid composition in edible oils through 1H-NMR spectroscopy. Magn. Reson. Chem. 2010, 48, 642–650. [Google Scholar] [CrossRef] [PubMed]
  29. Sundekilde, U.K.; Larsen, L.B.; Bertram, H.C. NMR-based milk metabolomics. Metabolites 2013, 3, 204–222. [Google Scholar] [CrossRef] [PubMed]
  30. Lindon, J.C.; Nicholson, J.K.; Holmes, E. The Handbook of Metabonomics and Metabolomics; Elsevier: Amsterdam, The Netherlands, 2006. [Google Scholar] [CrossRef]
  31. Boccard, J.; Rutledge, D.N. A consensus orthogonal partial least squares discriminant analysis (OPLS-DA) strategy for multiblock Omics data fusion. Anal. Chim. Acta 2013, 769, 30–39. [Google Scholar] [CrossRef] [PubMed]
  32. Holmes, E.; Loo, R.L.; Stamler, J.; Bictash, M.; Yap, I.K.; Chan, Q.; Ebbels, T.; De Iorio, M.; Brown, I.J.; Veselkov, K.A.; et al. Human metabolic phenotype diversity and its association with diet and blood pressure. Nature 2008, 453, 396–400. [Google Scholar] [CrossRef] [PubMed]
  33. Trygg, J.; Wold, S. Orthogonal projections to latent structures (O-PLS). J. Chemom. 2002, 16, 119–128. [Google Scholar] [CrossRef]
  34. Wold, S.; Sjöström, M.; Eriksson, L. PLS-regression: a basic tool of chemometrics. Chemom. Intell. Lab. 2001, 58, 109–130. [Google Scholar] [CrossRef]
Scheme 1. Square matrix describing the Coratina/Tunisian blend samples preparation following a regular grid sampling (red and green background, respectively). Samples were prepared according to the couples of Coratina and Tunisian samples in the two main diagonals (highlighted in yellow). A blend sample at different percentage composition was obtained for each pair of oils (C1T1, C2T2, … CnTn).
Sustainability 09 01471 sch001
Figure 1. Schematic representation of Coratina and Tunisian batch oil sums composition. The overall batches oil sums were formed by the same amount of each of the five Coratina and each of the five Tunisian olive oil samples.
Sustainability 09 01471 g001
Figure 2. The partial least squares regression (PLSR) model for 101 Coratina/Tunisian extra virgin olive oil (EVOO) blend samples (81 CnTn together with 10 C and 10 T samples obtained from the original C1–C5 and T1–T5 batches EVOO samples) as a function of the percentage of Coratina oil calculated for each blend sample (three components, R2X(cum) = 0.837, R2Y(cum) = 0.961, Q2(cum) = 0.953, goodness of fit R2 = 0.961, root mean square error of cross-validation (RMSECV)(Y) = 6.7652%).
Sustainability 09 01471 g002
Figure 3. (a) Scoreplot of the orthogonal partial least-squares discriminant analysis (OPLS-DA) model for Coratina and Tunisian EVOO samples (one predictive and one orthogonal component give R2X(cum) = 0.843 and Q2(cum) = 0.993); (b) OPLS-DA prediction scoreplot for known percentage Coratina/Tunisian blends. The predicted test samples are depicted as grey five-pointed stars; label of samples refers to the percentage of Coratina present for each blend oils.
Sustainability 09 01471 g003
Figure 4. PLSR analysis for the 11 blend oils, starting from the 2 batches oil sums, Cs and Ts, from 0/100 to 100/0% Cs/Ts oil by 10% increase step). Two components, R2X(cum) = 0.905, R2Y(cum) = 0.998 and Q2(cum) = 0.997, goodness of fit R2 = 0.998. RMSECV(Y) = 1.6221%.
Sustainability 09 01471 g004
Figure 5. OPLS-DA prediction scoreplot for Coratina/Tunisia blend samples at known percentage obtained starting from the overall batches oil sums, Cs and Ts, from 0/100 to 100/0% Cs/Ts oil by 10% increase step (1 predictive and 1 orthogonal component, R2X(cum) = 0.843, Q2(cum) = 0.993). The predicted samples are depicted as grey five-pointed stars; the label of the samples refers to the percentage of Coratina in the blend.
Sustainability 09 01471 g005
Figure 6. PLS prediction plot of 11 blend oil samples obtained from the 2 batches oil sums, Cs and Ts, from 0/100 to 100/0% Cs/Ts oil by 10% increase step) (three components, R2X(cum) = 0.837, R2Y(cum) = 0.961, Q2(cum) = 0.953), goodness of fit R2 = 0.961, RMSECV(Y) = 6.7652%).
Sustainability 09 01471 g006
Table 1. Weighted percentage composition (from 90 to 10) for preparation of blends with different percentage composition.
%Weight (g) %Weight (g)
C900.828T100.092
C800.736T200.184
C700.644T300.276
C600.552T400.368
C500.46T500.46
C400.368T600.552
C300.276T700.644
C200.184T800.736
C100.092T900.828

