Conceptual Design and Energy Analysis of Integrated Combined Cycle Gasification System


1
Faculty of Energy Systems and Nuclear Science, University of Ontario Institute of Technology, 2000 Simcoe Street North, Oshawa, ON L1H 7K4, Canada
2
Faculty of Engineering and Applied Science, University of Ontario Institute of Technology, 2000 Simcoe Street North, Oshawa, ON L1H 7K4, Canada
3
Department of Energy, Politecnico di Torino, Torino 10129, Italy
*
Author to whom correspondence should be addressed.
Sustainability 2017, 9(8), 1474; https://doi.org/10.3390/su9081474
Submission received: 24 July 2017
/
Revised: 9 August 2017
/
Accepted: 10 August 2017
/
Published: 19 August 2017
(This article belongs to the Special Issue Clean Waste to Energy)
Abstract
:In this paper, an integrated gasification combined cycle conceptual design that achieves optimum energy efficiency and 82.9% heat integration between hot and cold utilities is illustrated. The integrated combined gasification cycle (IGCC) is also modeled and evaluated for the co-production of electricity, ammonia and methane for 543.13 kilo tonne per annum (KTA) of municipal solid waste (MSW). The final products are 1284.89 MW, 8731.07 kg/h of liquid ammonia at 8 °C and 32,468 kg/h of methane gas at 271 °C. The conceptual design includes advanced heat integration between syngas and hot and cold streams in all process units. The water gas shift (WGS) unit includes integration between equilibrium reactors and cold streams. The air separation unit (ASU) includes four air compressors followed by a pressure swing adsorber (PSA), which separates oxygen and nitrogen gases into separate streams. Both O2 and N2 gases are compressed and sent to gasifier and syngas cleaning unit, respectively. The overall design shows reliability and solved steady state equations for all process units with improvements in thermal efficiency in comparison with single cycle gasification plants. The environmental emissions for GHGs such CO2 and SO2 are lower due to higher overall energy efficiency.
1. Introduction
The integrated gasification combined cycle is a new technology that enables chemical recycling of solid waste for high efficient power production [1]. The technology arises to improve the current thermal and electrical efficiencies of waste to energy single cycle chemical plants, and will be commercially available within the next 10 years [2]. The worldwide capacity of gasification is growing exponentially, and 80% of expansion is in Asia, where the majority of development is in China [3]. Integration in waste to energy plants can only occur by sharing a steam cycle or by integrating more than one chemical reactor in series or parallel [4]. The integrated gasification combined cycle (IGCC) shows higher thermal efficiencies, in both medium scale and large scale gas turbines [4]. Integrated combined cycles show 7% higher electrical efficiency in medium scale plants with higher initial investment justified by more equipment and more complex heat exchange networks [5]. In addition, the IGCC has higher feedstock flexibility such as biomass, municipal solid waste (MSW), refinery residues or coke showing better environmental performance and higher energy conversion in comparable with single cycle gasification systems [6]. Due to high operating pressures and temperatures, improving the process efficiency has emerged as one of the high priorities in waste to energy plants [7]. Integrated waste to energy systems have become a very interesting topic for both industry and research institutes due to interest in energy production from waste and improved chemical and thermal efficiencies with more cost effective designs achieved in such systems [8]. Below are recommended design considerations that improve process optimization and energy usage [6]:
- High and low temperature heat recovery networks
- Optimization of operating parameters in reactors
- Air extraction from gas turbine and integration with air separation unit (ASU)
- Polygeneration of steam and other main streams
- Optimize gas turbine power due to higher gas flow rates
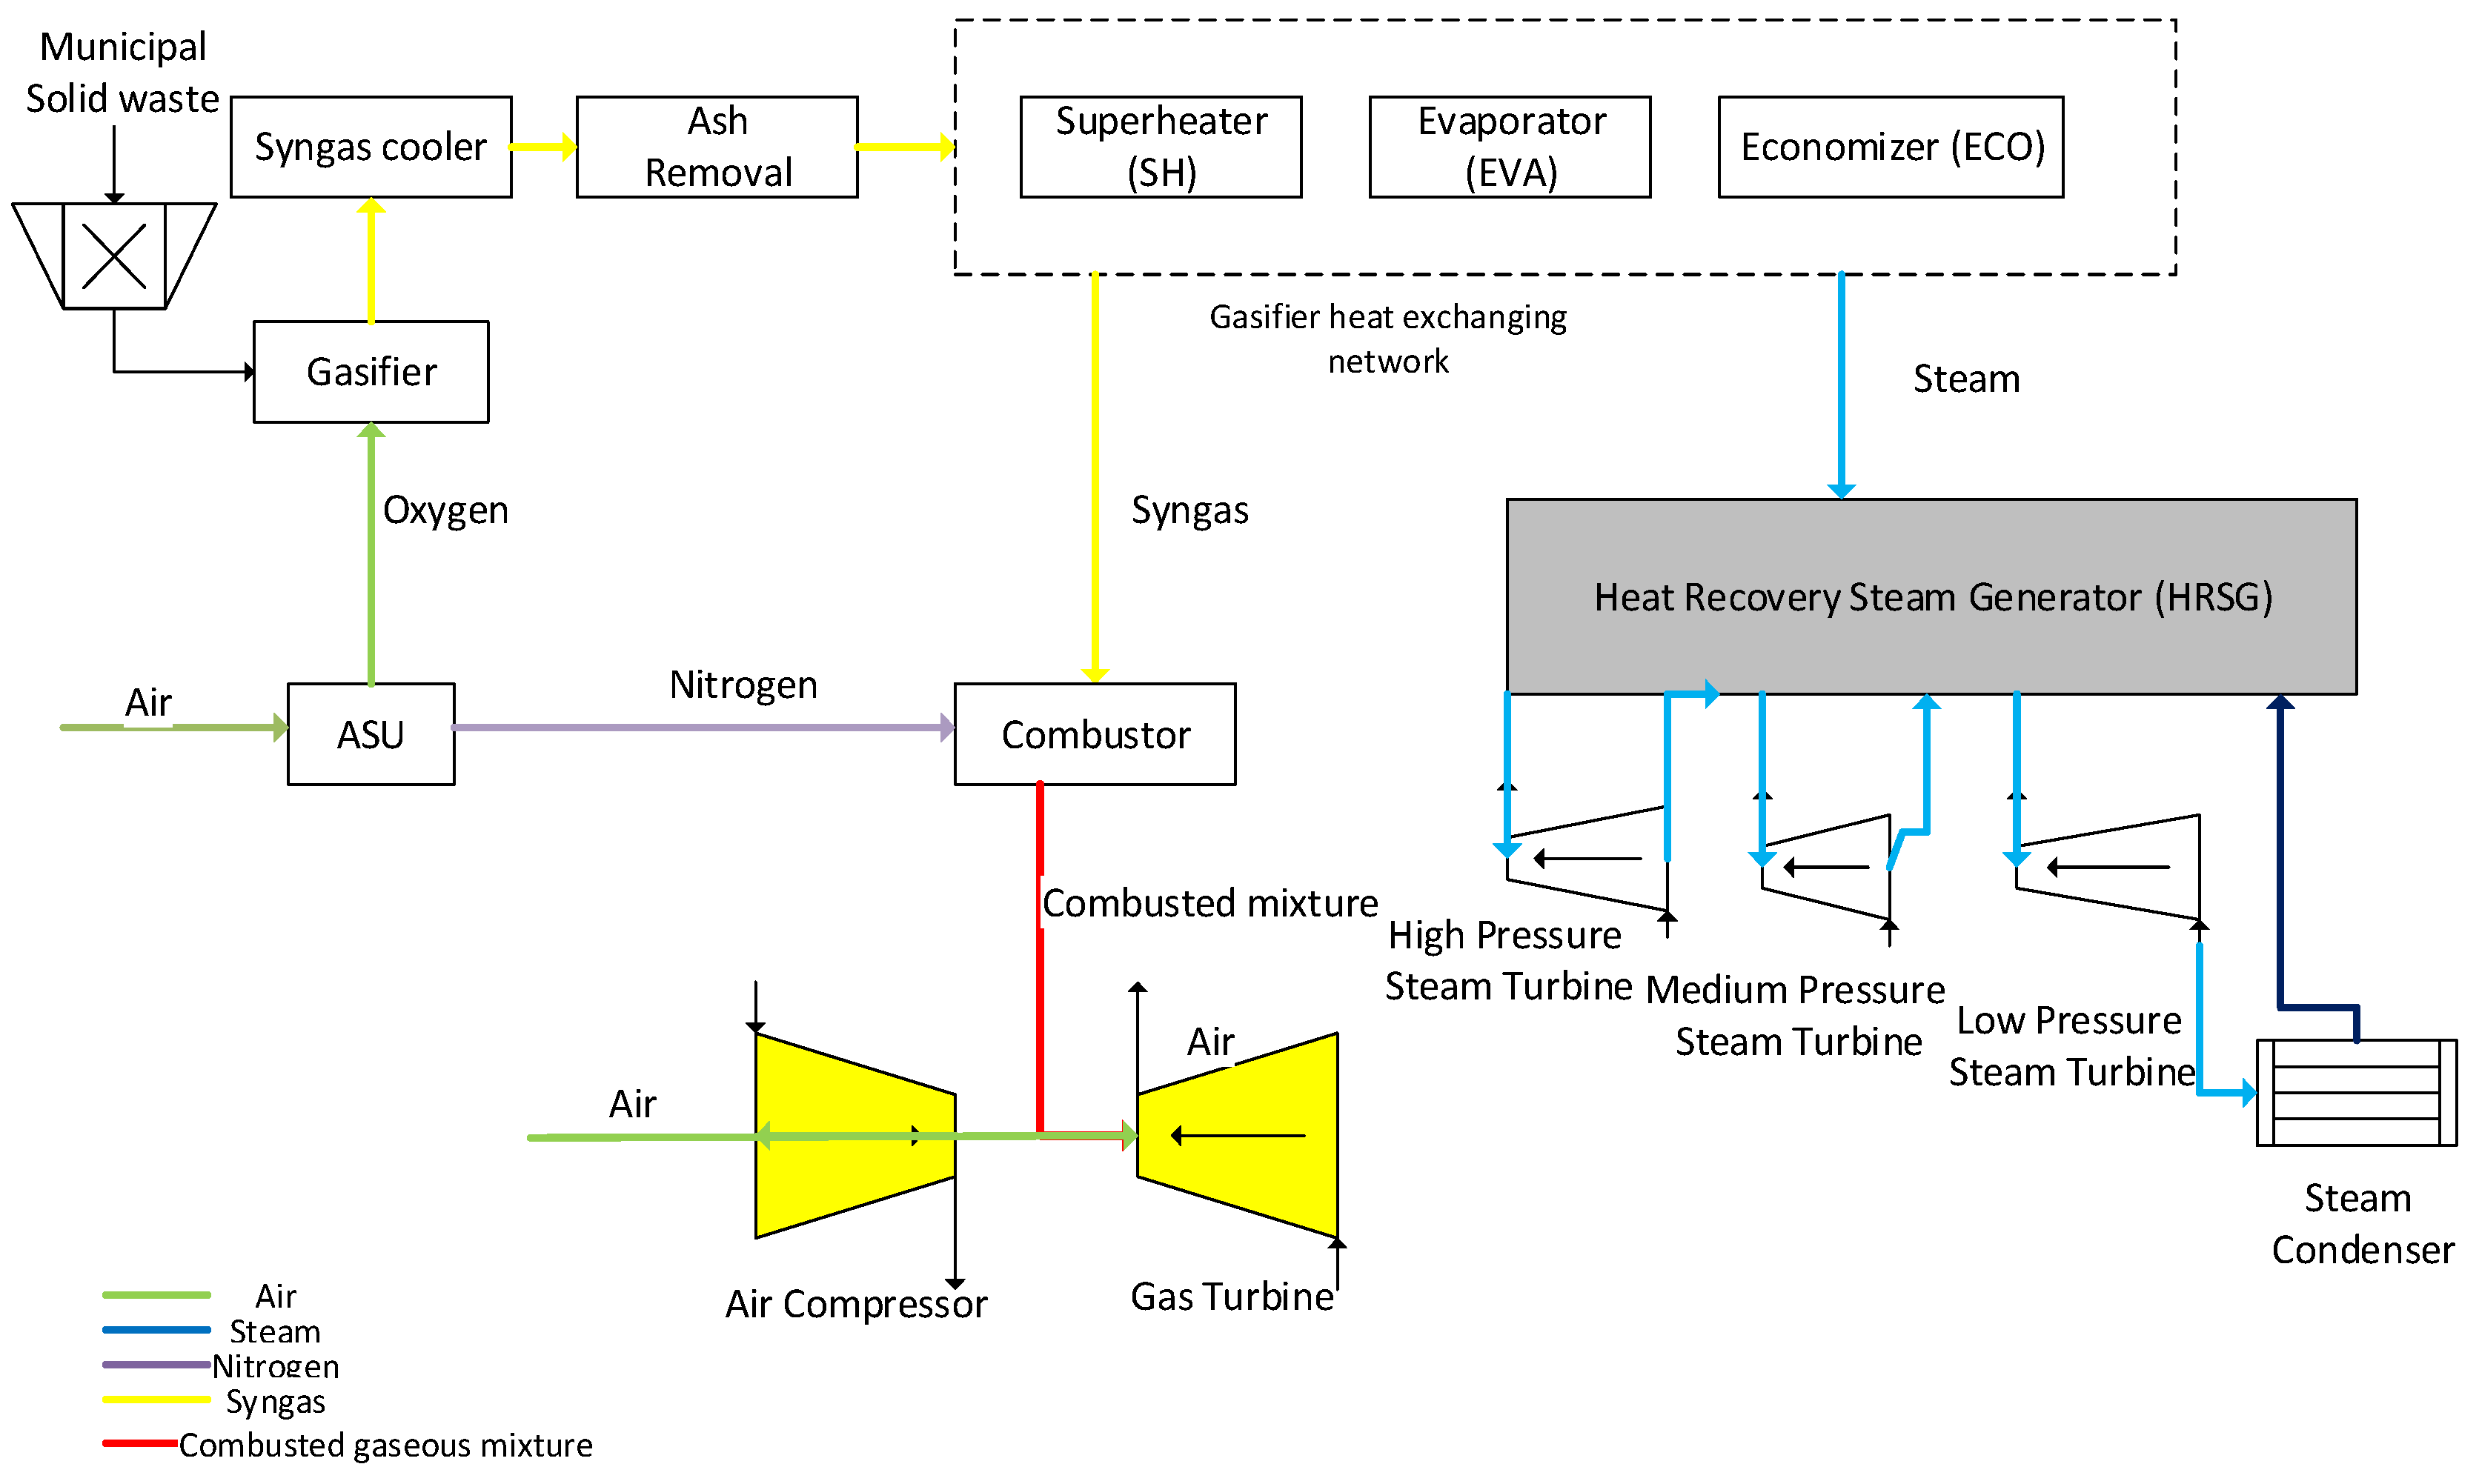
Due to the increasing amount of global solid waste production, more efficient chemical recycling strategies and technologies are needed [9]. In our work, a proposed integrated gasification combined cycle is designed for municipal solid waste (MSW) treatment. Steam integration is accomplished by sharing steam cycle: saturated steam is generated in MSW reactors using heat exchanging network (HEN) and converted to high pressure steam (HPS) through heat recovery steam generator (HRSG) zone. A schematic diagram of an integrated gasification combined cycle (IGCC) conceptual design is shown in Figure 1.
As seen in Figure 1, an integrated gasification cycle consists of solid waste pretreatment stage which consists of pretreatment, mechanical separation or RDF production of solid waste. The carbonaceous feedstock material should include only combustibles, which are converted to gaseous products using gasification process in an oxygen starved environment [10]. Syngas mainly consists of carbon monoxide (CO) and hydrogen (H2), which are produced through series of endothermic and exothermic reactions as shown in Table 1 after passing through heat exchanging networks that generate steam. A heat exchanging network includes superheater (SH), Evaporator (EVA), and an Economizer (ECO) [11]. The superheater is usually located close to gasifier effluents where high temperature zones generate high pressure steam (HPS) followed by evaporator and economizer [12]. To utilize syngas, cooling and cleaning are required, including particulate removal, and tar, sulfur and ammonia formation before combustion. A gas cyclone, filters and acid removal equipment are used after the gasification process to ensure no toxic gases are combusted. The operating conditions affect the gaseous effluents, thermal and electrical efficiencies achieved in single cycle gasification plants. For example, methane (CH4) and carbon dioxide (CO2) formation favors lower operating temperatures and higher operating pressures [13], while carbon monoxide (CO) and H2 formation favors higher operating temperatures and lower operating pressures. Thus, gasifier temperatures are controlled for optimal concentration for desired products.
The electrical efficiency in waste to energy (WTE) single cycle varies in steam and gas turbines. Gas turbine efficiencies for gasification plants are in the range 13–24% and steam turbines achieve 9–20% [14]. The main process stages in an integrated gasification combined cycle (IGCC) is shown below:
- Waste pretreatment unit
- Gasification unit (GU)
- Acid gas removal unit
- Sulfur recovery unit (SRU)
- Air separation unit (SRU)
- Combined cycle of gas turbine and steam turbine (CC)
- Heat recovery steam generator (HRSG)
2. Integrated Gasification Plant Concept
The concept combines gasifier effluents in both thermal integration and thermochemical conversion of MSW over two reactors in series as seen in Figure 1. This also allows the possibility to maximize process efficiency and thermally crack heavy waxes into a second reaction system. Below are the main advantages of integrated combined gasification cycle (IGCC) compared to single waste to energy (WTE) [15]:
- Higher chemical conversion of MSW per unit mass to useful hydrocarbon products since reactants are thermochemical treated in two reaction systems rather than a single reactor
- Increase the maximum temperature of steam cycle due to more heat zones allowing high pressure steam production
- Increase steam turbine efficiency due to higher steam capacity and larger turbine size
- Less capital cost per unit mass since a number of equipment are shared in hybrid waste to energy systems such as steam turbine serving high pressure steam from two reactors
- Production and optimization of syngas flow and composition from two gasifier reactors rather than a single gasifier reactor
- Reduction in tar production since heavy components from pyrolysis reactor are thermally cracked to syngas, thus no tar is produced in the process system
- Reduction of the total exhaust mass flow rate due to high process conversion to desired products
- Lower environmental impact since all flue gases flew through same stack [4]. In addition, integrated combined cycles reduce toxic emissions due to higher operating pressures which improves process efficiency leading to lower SO2, NO2, particulate matter and particularly 73.2% reduction in CO2 emissions [16]
- Higher heat exchanger optimization and integration in two reaction systems
The average efficiency of electrical power production in a WTE plant is approximately 18% with a conversion efficiency in the gasifier of only 63%. For integrated gasification combined cycle plants, the electrical power efficiency reaches up to 43% [17]. As seen above, the solid waste is granulated and fed to the gasification reactor where most of the MSW is converted to hydrocarbon oils at 400–700 °C. The heavy components and waxes are fed to the gasifier where they are thermally cracked at elevated temperatures to produce syngas. Below are the operating conditions of gasification reactor (Table 1).
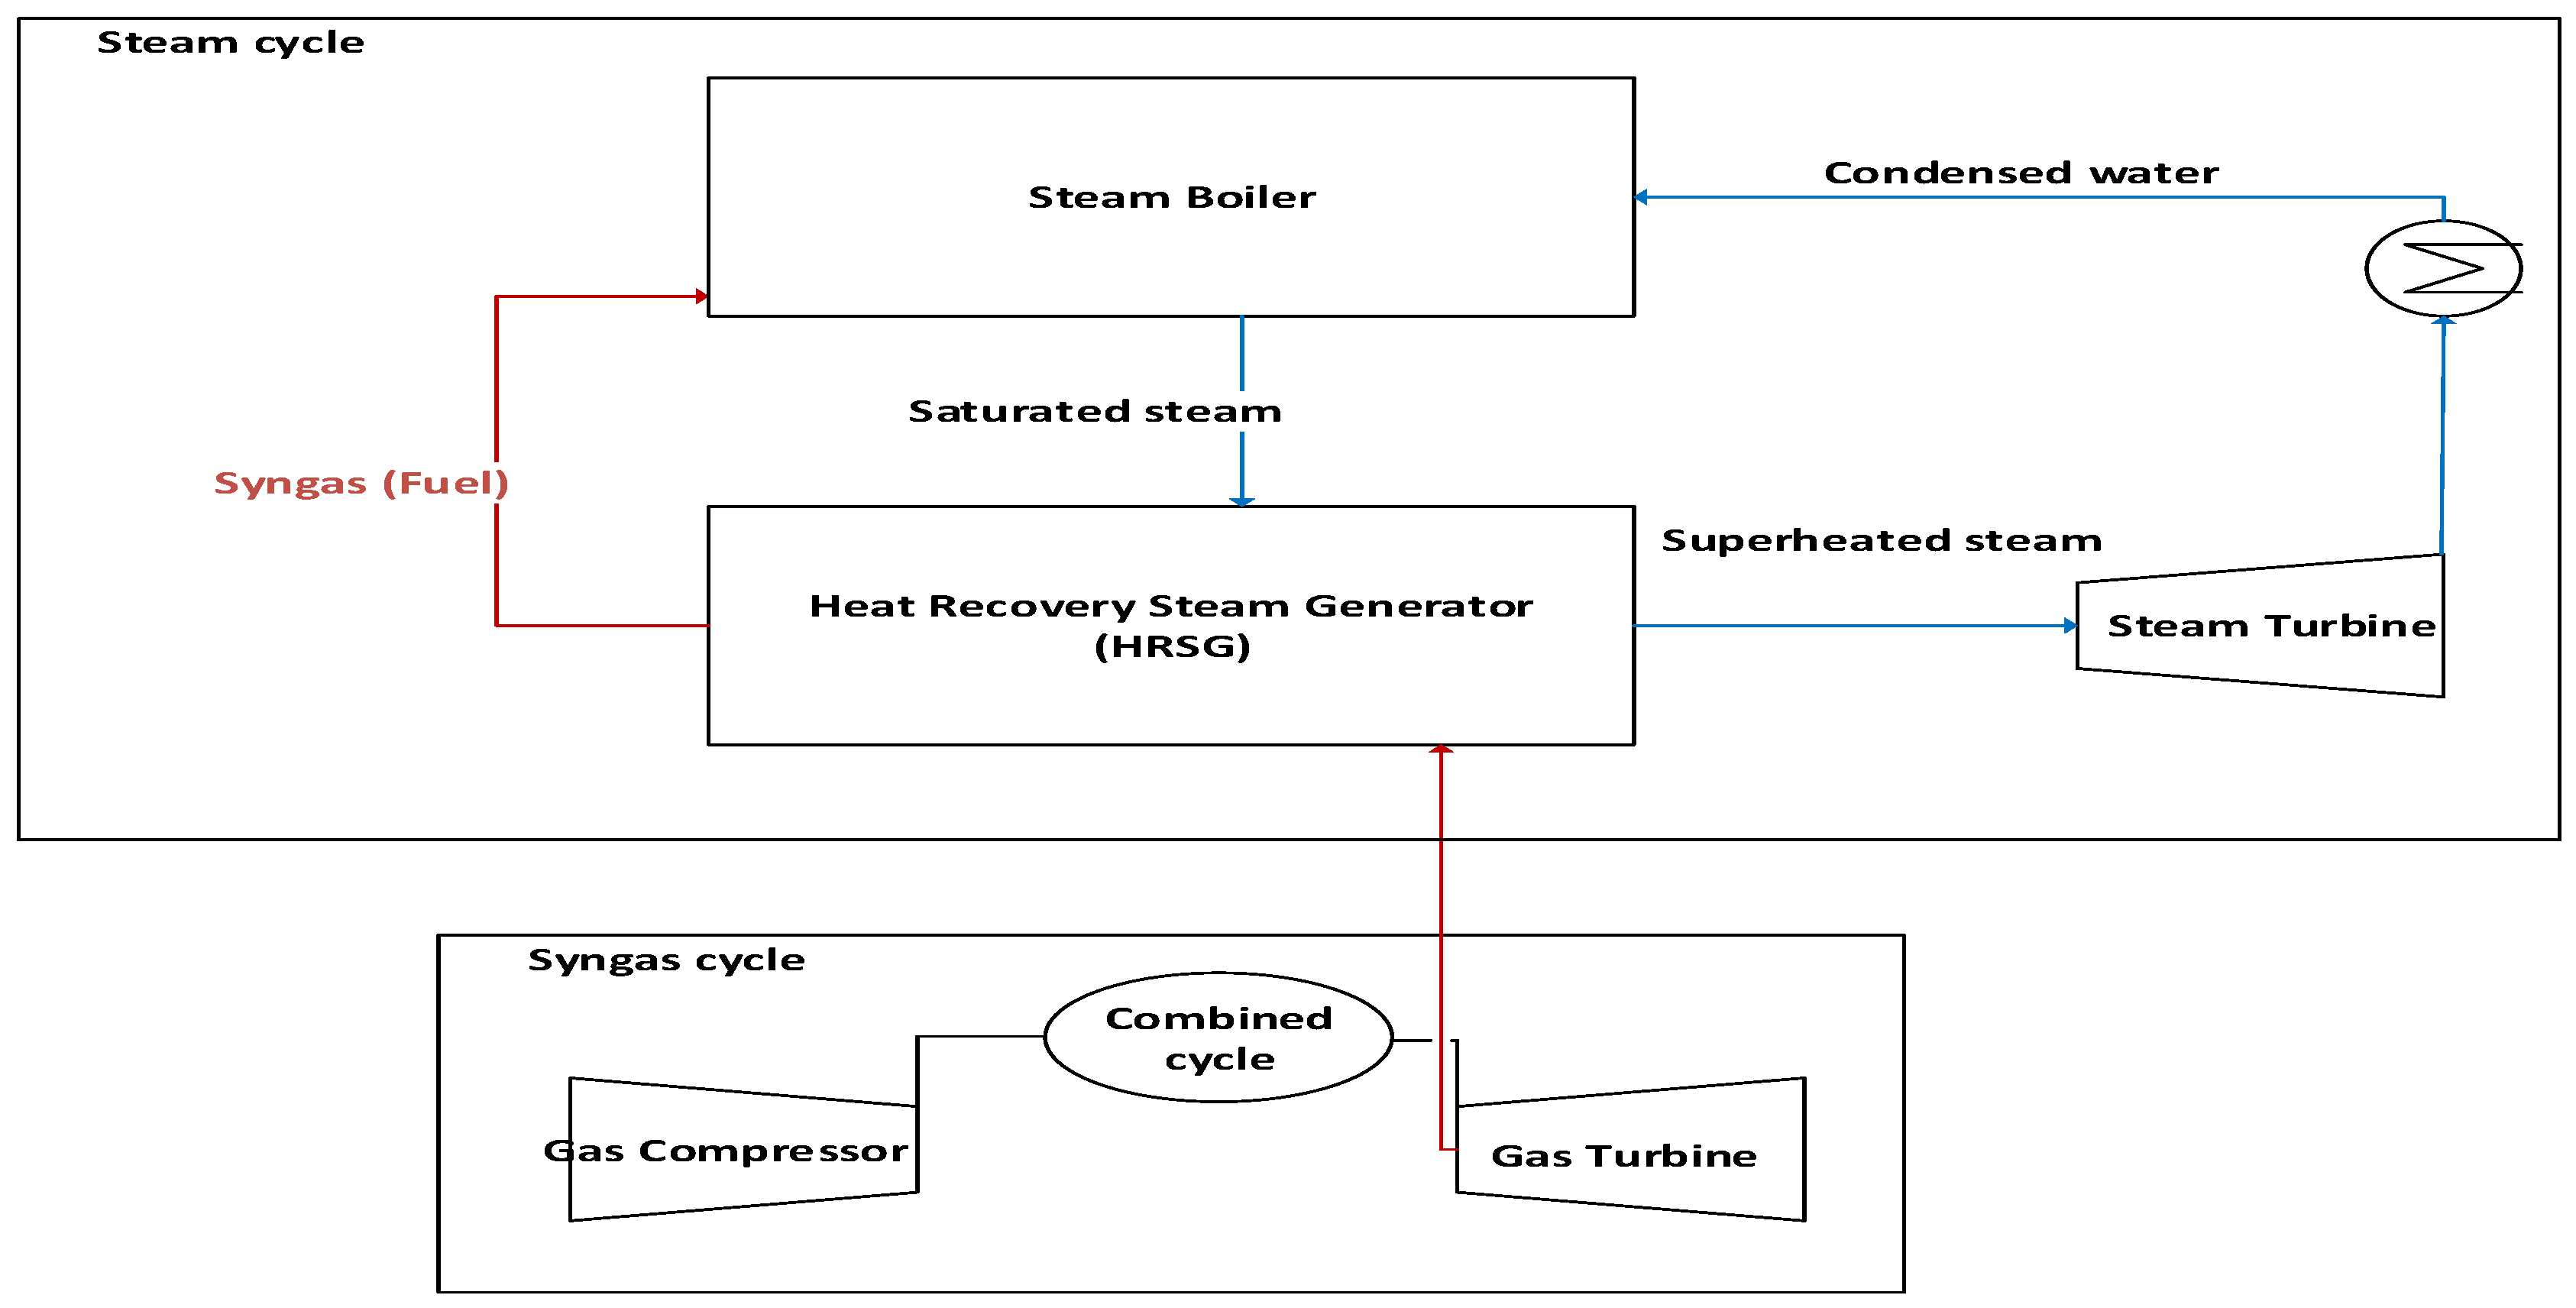
The possibility of using more than one reactor or one chemical reaction at a time is an advantage of integrated waste to energy systems. The reactor effluents are integrated in a combined syngas and steam cycle as shown in Figure 3. The heat recovery steam generator (HRSG) generates steam in the range 520–560 °C, which is utilized in the steam turbine to generate electricity. The steam turbine exhaust is exchanged with a heat exchanger before exiting to steam boiler. The electrical efficiency of combined syngas and steam cycle exceeds individual single fuel plants and may reach up to 25% efficiency [19]. The heat recovery steam generator (HRSG) consists of several heat exchanging equipment including the following three heat exchanging zones as stated below. The combined syngas and steam cycle is shown in Figure 2.
- Superheater (SH): The superheater raises the temperature of saturated steam to high pressure steam and is located at the high temperature zone in the gasifier stream due to higher available temperature zones.
- Evaporator (EVA): The evaporator converts the saturated water to saturated steam.
- Economizer (ECO): The economizer consists of water pipes made of steel or cast iron materials that stands high pressure and temperature and used to heat feed water to saturated water temperatures before entering evaporator.
Combined Syngas and Steam Cycle
The integrated gasification system relies on syngas and steam combined cycles to boost the process efficiency including integrating more than one gas turbine (GT) and several steam turbines depending on the steam flow rate. Higher flow rates in the integrated combined cycle allows higher flow rate to steam turbines thus maximizes thermal efficiency [20]. The steam boiler generates saturated steam above 100 °C, which reaches to superheated steam at 230 °C after passing through HRSG before entering the steam turbine, as shown in Figure 2.
3. Integrated Gasification Combined Cycle Process Description
In gasification, several factors have an impact on reaction rate and products composition. The gasification reacting gases either oxygen, air or steam affect the final products. Air as a reacting agent promotes nitrous products, about 47.5 vol % on dry basis [21]. The gasification reactions occurring simultaneously in a gasifier are shown in Table 2.
The MSW is supplied to the gasifier which is partially oxidized under high pressure up to 80 bar based on stoichiometric ratio. High temperatures may reach 1500 °C which ensures that the ash is liquefied and allowed to escape at the lower end of the gasifier chamber [23]. The produced syngas is cooled and cleaned before combusted in the syngas turbine which helps to meet air emission standards. The combusted gases pass through the HRSG for steam generation and heat exchanged with saturated steam before combustion. The high thermal conversion efficiencies result in a significant decrease in CO2 and SO2 emissions [6].
The three major types of gasifiers are moving bed/fixed bed gasifiers, fluidized bed gasifiers and entrained flow gasifiers. In moving bed gasifiers, large particles of MSW moves slowly down the bed while reacting with oxygen forming gaseous products. Moving bed gasifiers form more than 42% of world’s installed gasifiers [24]. The moving bed gasifiers are divided into the following three zones [25]:
- Dry zone: Located at top of the reactor
- Carbonization zone: A high temperature zone located in the middle of the gasifier for heating and devolatilization of MSW feedstock
- Gasification zone: This zone is located at the bottom of the reactor where the highest temperature initiates MSW and ash gasification with oxygen
Fluidized bed gasifiers are divided into bubbling bed and circulating bed gasifiers. Below are the stated advantages of fluidized bed gasifiers [25]:
- Avoidance of hot spots and good temperature distribution
- Optimum heat exchanging with low operating times (i.e., seconds to minutes)
- Easy startup and possibility to operate at partial loads
- Steady gas flow due to fluidization and low tar content
- High reaction conversion efficiency
The entrained-flow gasifiers are one of the most common gasification technologies. The advantages of this type of gasifiers are [26]:
- Reliable and proven design
- No internal moving parts
- Ability to supply syngas at higher pressures
- Ability to gasify MSW feedstocks regardless of composition
- Uniform temperature
- Short residence time
4. Integrated Combined Gasification Cycle Aspen HYSYS Simulation
The assumptions made in the simulation are as follows:
- All MSW used as feedstock are conventional solids with no sludge or undissolved solids.
- MSW is defined using ultimate analysis and heat of formation.
- Thermodynamic properties for phase separation are calculated using Peng–Robinson equation of state.
- Isentropic efficiencies of all turbines are set to 86% [27].
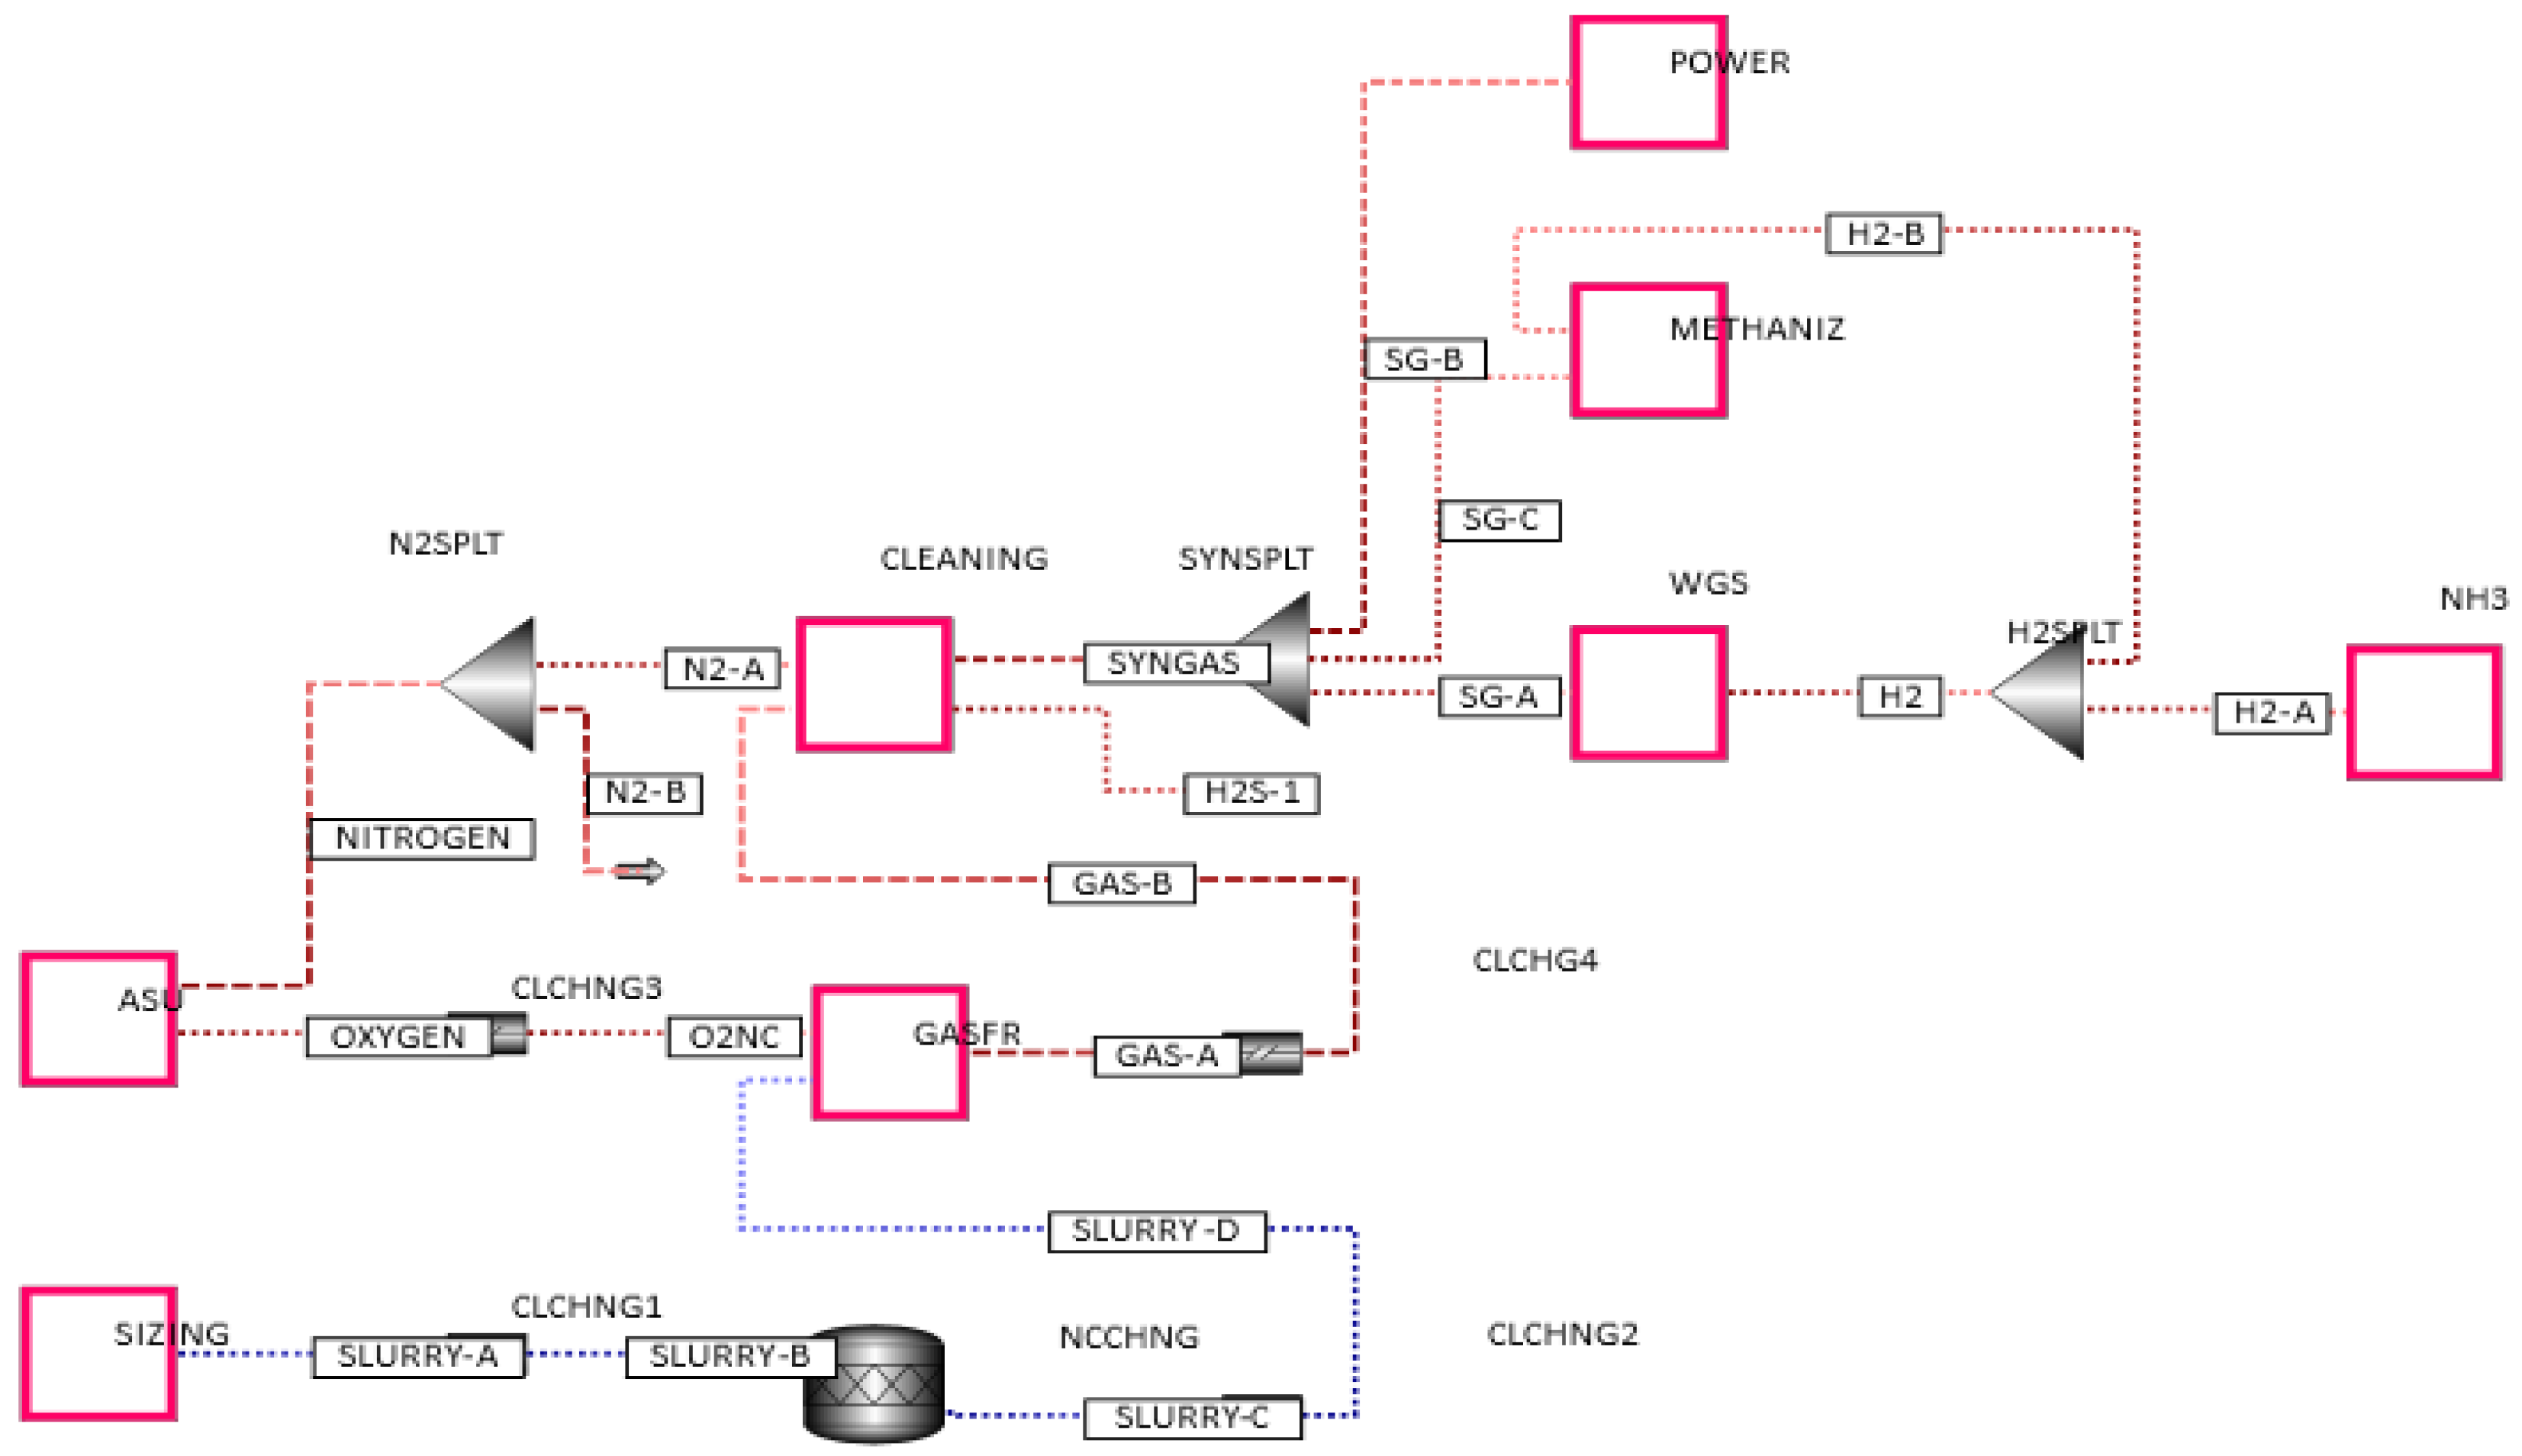
Below is the flow sheet used in integrated gasification combined cycle (IGCC) using Aspen HYSYS version 8.8 process simulation tool. The Advantages of using Aspen HYSYS includes optimization of plant operations, reducing energy consumption through heat integration, GHGs emissions estimations, and powerful approach in steady state modeling [28]. Thus, these simulation tools provide optimum conceptual design and operations. The plant feed flow rate is 67,766.35 kg/h or 543.13 KTA (kilo tonnes per annum) based on 8000 h of annual plant operation. The chemical plant main process stages are listed below and seen in Figure 3:
- MSW feedstock sizing
- Air separation unit (ASU)
- Gasification unit (GASFR)
- Syngas cleaning
- Water gas shift (WGS)
- Methanation
- Ammonia synthesis
- Electric power generation
The feedstock consists of the following municipal solid waste (MSW) mass composition shown in Table 3. The feedstock stream slurry A passes through CLCHNG1 which changes the simulation feed from stream class MIXCINC (conventional and nonconventional solids) to slurry B, a conventional stream [29]. In addition, slurry C stream (i.e., MIXNCPSD: non-conventional solids with particle distribution of D10: 0.01 mm; D20: 0.02 mm; D50: 0.0759; D75: 0.108 mm; D90: 0.143; and D100: 0.2 mm, which are intercepts of 10%, 20%, 50%, 75% and 90% of the cumulative mass) is converted to slurry D (i.e., MIXNC: non-conventional solids with no particle distribution) before being sent to gasifier unit. The air separation unit (ASU) separates the air into two main streams which are oxygen stream (O2NC) fed to gasifier and nitrogen stream (NITROGEN) which is utilized in syngas cleaning. The air separation unit divides 477.7 tonne per hour (TPH) air flow by ratio of 1:3.0968 for O2:N2. The product exiting the gasification unit consists of the mass composition shown in Table 4, and is mainly CO, CO2 and H2O.
The syngas enters the syngas cleaning unit which consists of series of heat exchangers that reduces temperature from (stream B(IN) 152.22 °C to stream (Gas-AA) 140 °C after passing through SG-HTX and is cooled to (stream Gas-B2) 12.22 °C after passing through cooler. The stream passes through H2S separator followed by CO2 separator explained further in Section 4.4. The pure syngas at a flow rate of 216,491.28 kg/h passes through a syngas split (SYNSPLT) which divides the syngas to the following units:
- Methanation (stream SG-C), 16268.27 kg/h; mass fraction: 0.0751
- Power generation (stream SG-B), 196,470.81 kg/h; mass fraction: 0.908
- Ammonia synthesis (stream SG-A), 37,542.21 kg/h; mass fraction: 0.01733
For stream SG-A, the syngas passes through an equilibrium gas shift reactor that converts carbon monoxide and water to carbon dioxide and hydrogen in a stoichiometric in Table 6 [30]. For ammonia synthesis, the treated gas, stream H2-A (IN), passes through a pressure swing adsorption (PSA) unit which separates hydrogen and carbon dioxide. The hydrogen stream (stream H2) is mixed with nitrogen stream and converted to ammonia gas at 471.9 °C and 159 bar using Benedict–Webb–Rubin–Starling (BWRS) equation of state property method. For methane synthesis, hydrogen is mixed with carbon monoxide in ratio of 0.9958:1. The methanation reactor converts carbon monoxide and hydrogen to methane and water at 271.11 °C in a Sabatier reaction [31]. For power production, more than 90% of the syngas passes through heat exchangers and combusted with excess oxygen to yield high gases at 1362.44 °C that is compressed before entering a turbine.
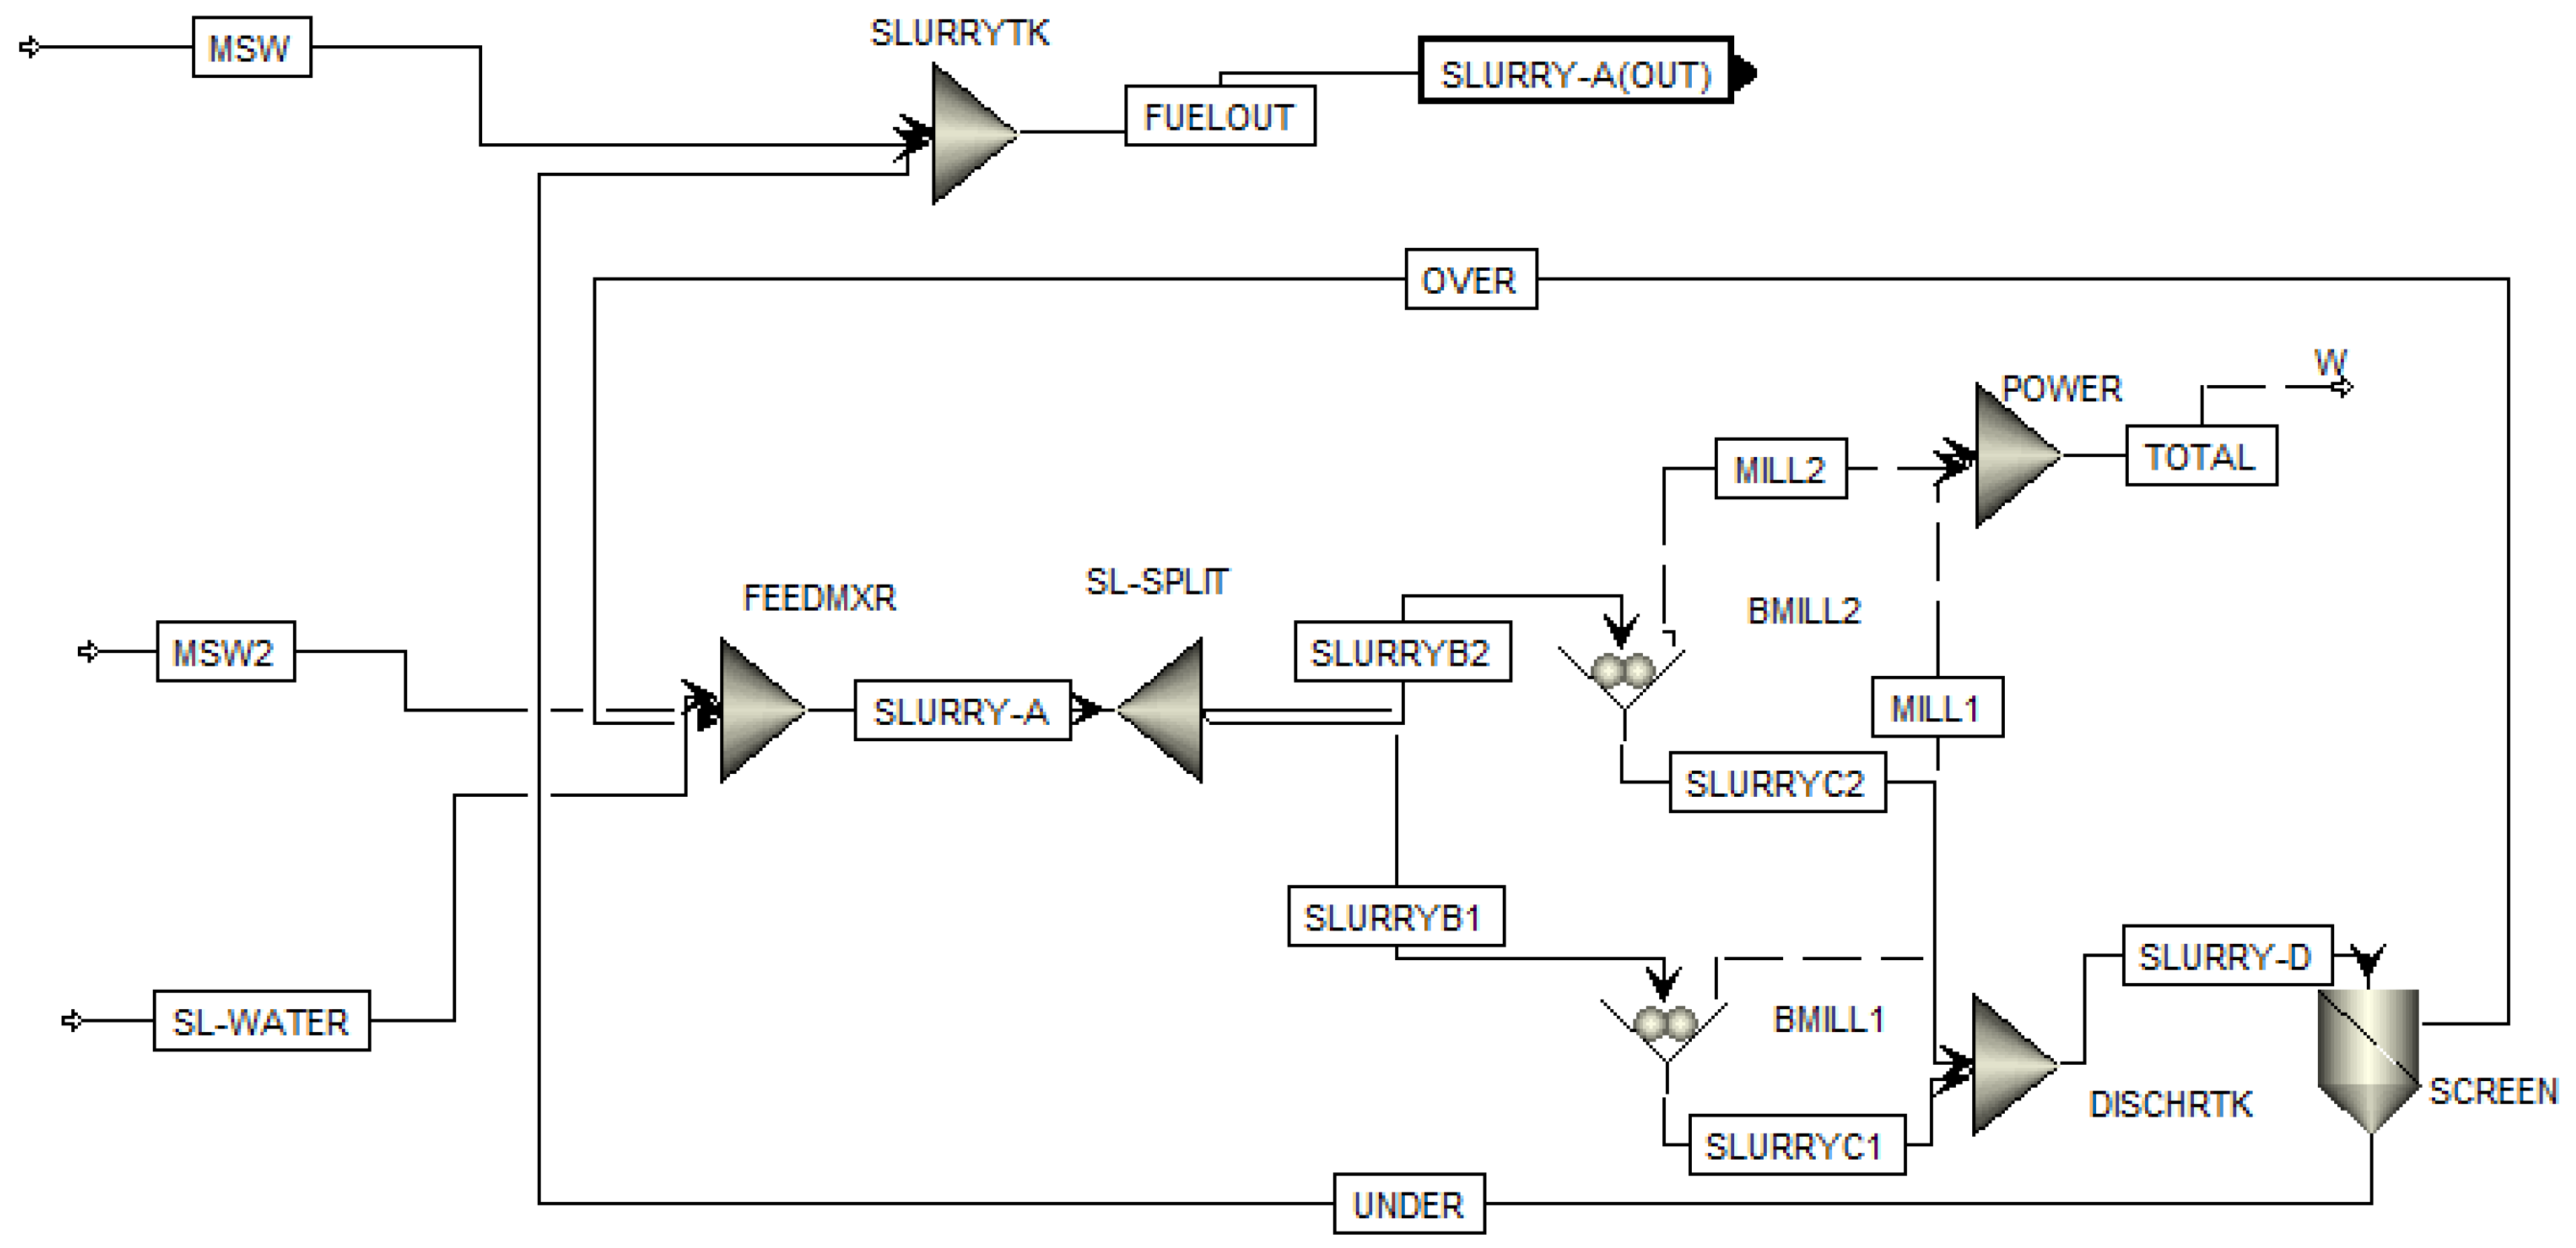
4.1. MSW Sizing
The MSW feedstock is fed at 125,840.58 kg/h and mixed with water stream in ratio of 2.392:1 respectively and converted to slurry before being grinded to 0.2 mm using a multiple roll crushers (BMILL1 and BMILL 2) followed by a wet screening which screens to 0.3 mm using coarse split entrainment specification as seen in Figure 4.
Crushers BMILL1 and BMILL2 each has a mass flow rate of 33,880.16 kg/h and uses 306 HP of power using screening equipment which have power efficiency of 0.324.
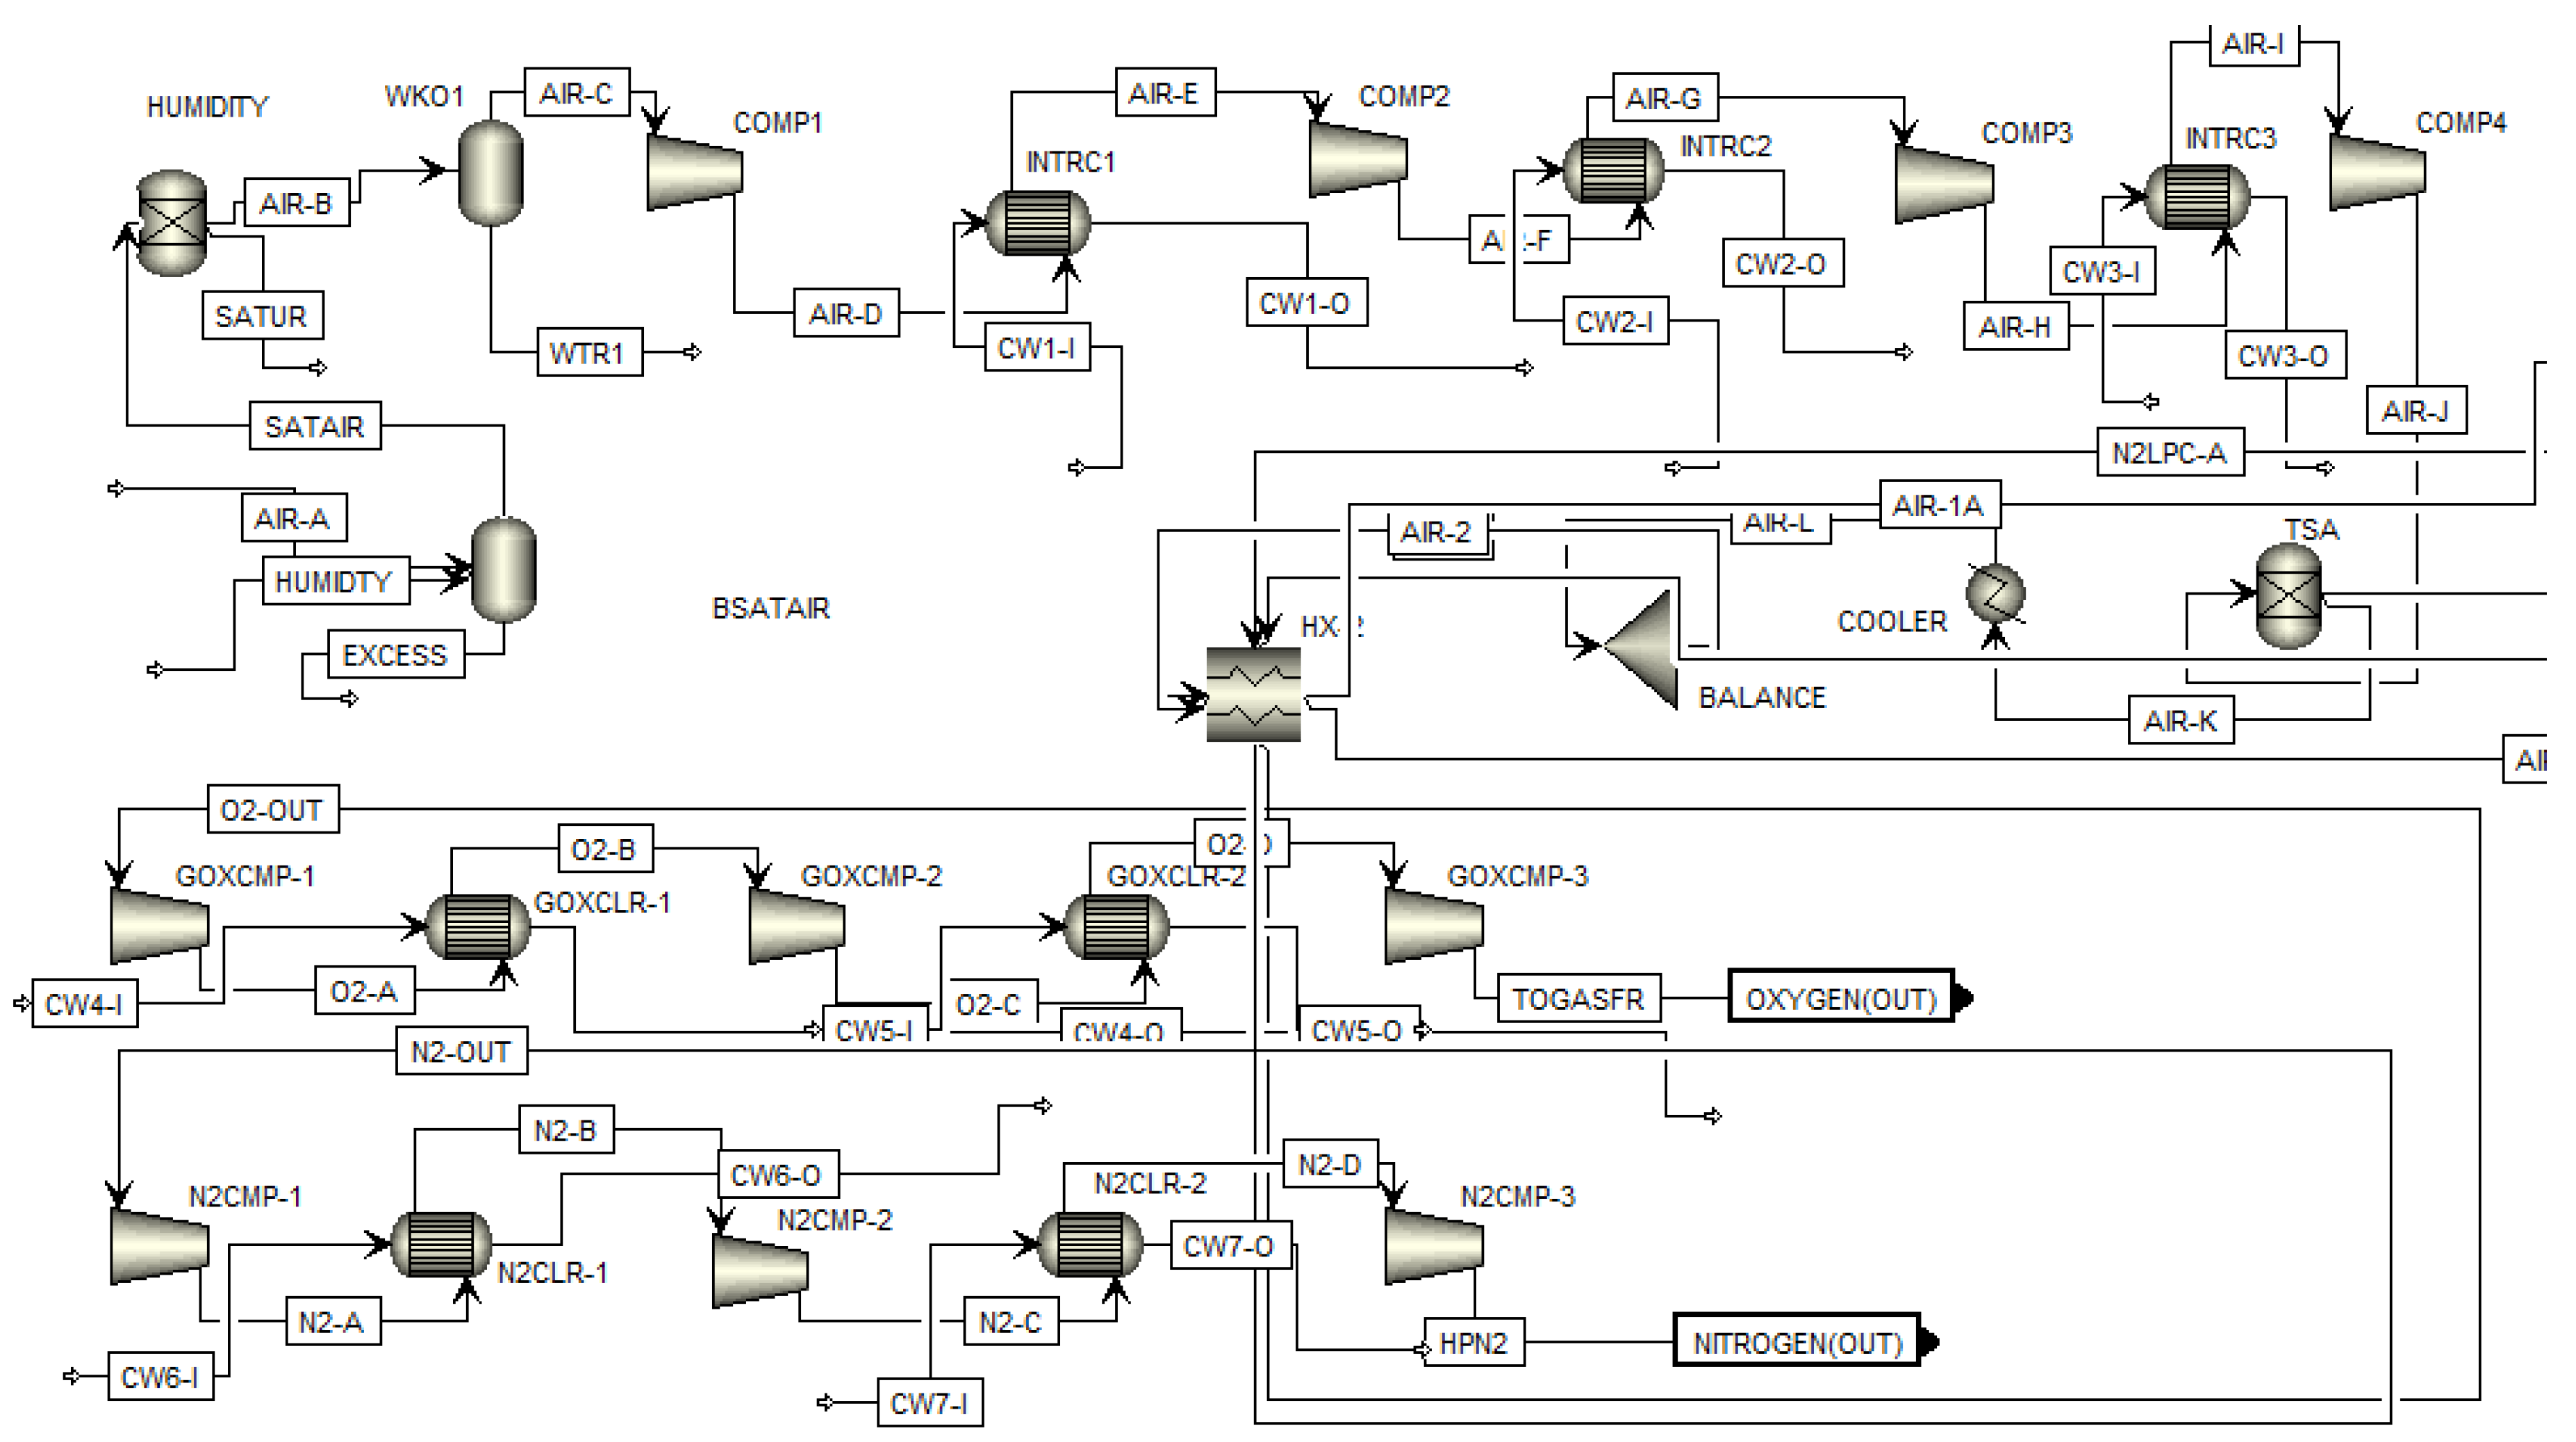
4.2. Air Separation Unit (ASU)
The inlet air (stream AIR-A), is fed at a flow rate of 16,495.22 kg/h and mixed with water vapor to produce saturated air stream (SATAIR). The temperature of saturation drums (BSATAIR) is adjusted based on relative humidity and saturated air (stream AIR-B) is fed to coolant drum that reduces its temperature to 10 °C followed by four compression stages that increases air pressure from 1.01 bar to 1.97 bar, 3.65 bar, 5.13 bar and 6.22 bar, respectively, over four compressors (COMP1 to COMP4). The compressed air enters the temperature swing adsorption unit (TSA) which operates at 60.2 °C. The temperature swing adsorber (TSA) separates O2 and N2 gases where both gases are compressed separately over three compressors (For O2: GOXCMP1, GOXCMP2, and GOXCMP3, For N2:N2CMP1, N2CMP2 and N2CMP3), as shown in Figure 5. For O2, the gas is compressed from 1.1 bar to 6.5 bar, 23.08 bar and 41.03 bar, respectively, before being sent to gasifier unit, as seen in Figure 5. For N2 gas, it is compressed from 1.1 bar to 5.52 bar, 20.7 bar and 27.58 bar, respectively, and sent to gasifier at the latter pressure (stream: NITROGENOUT). The work duties of compressors are shown in Table 5.
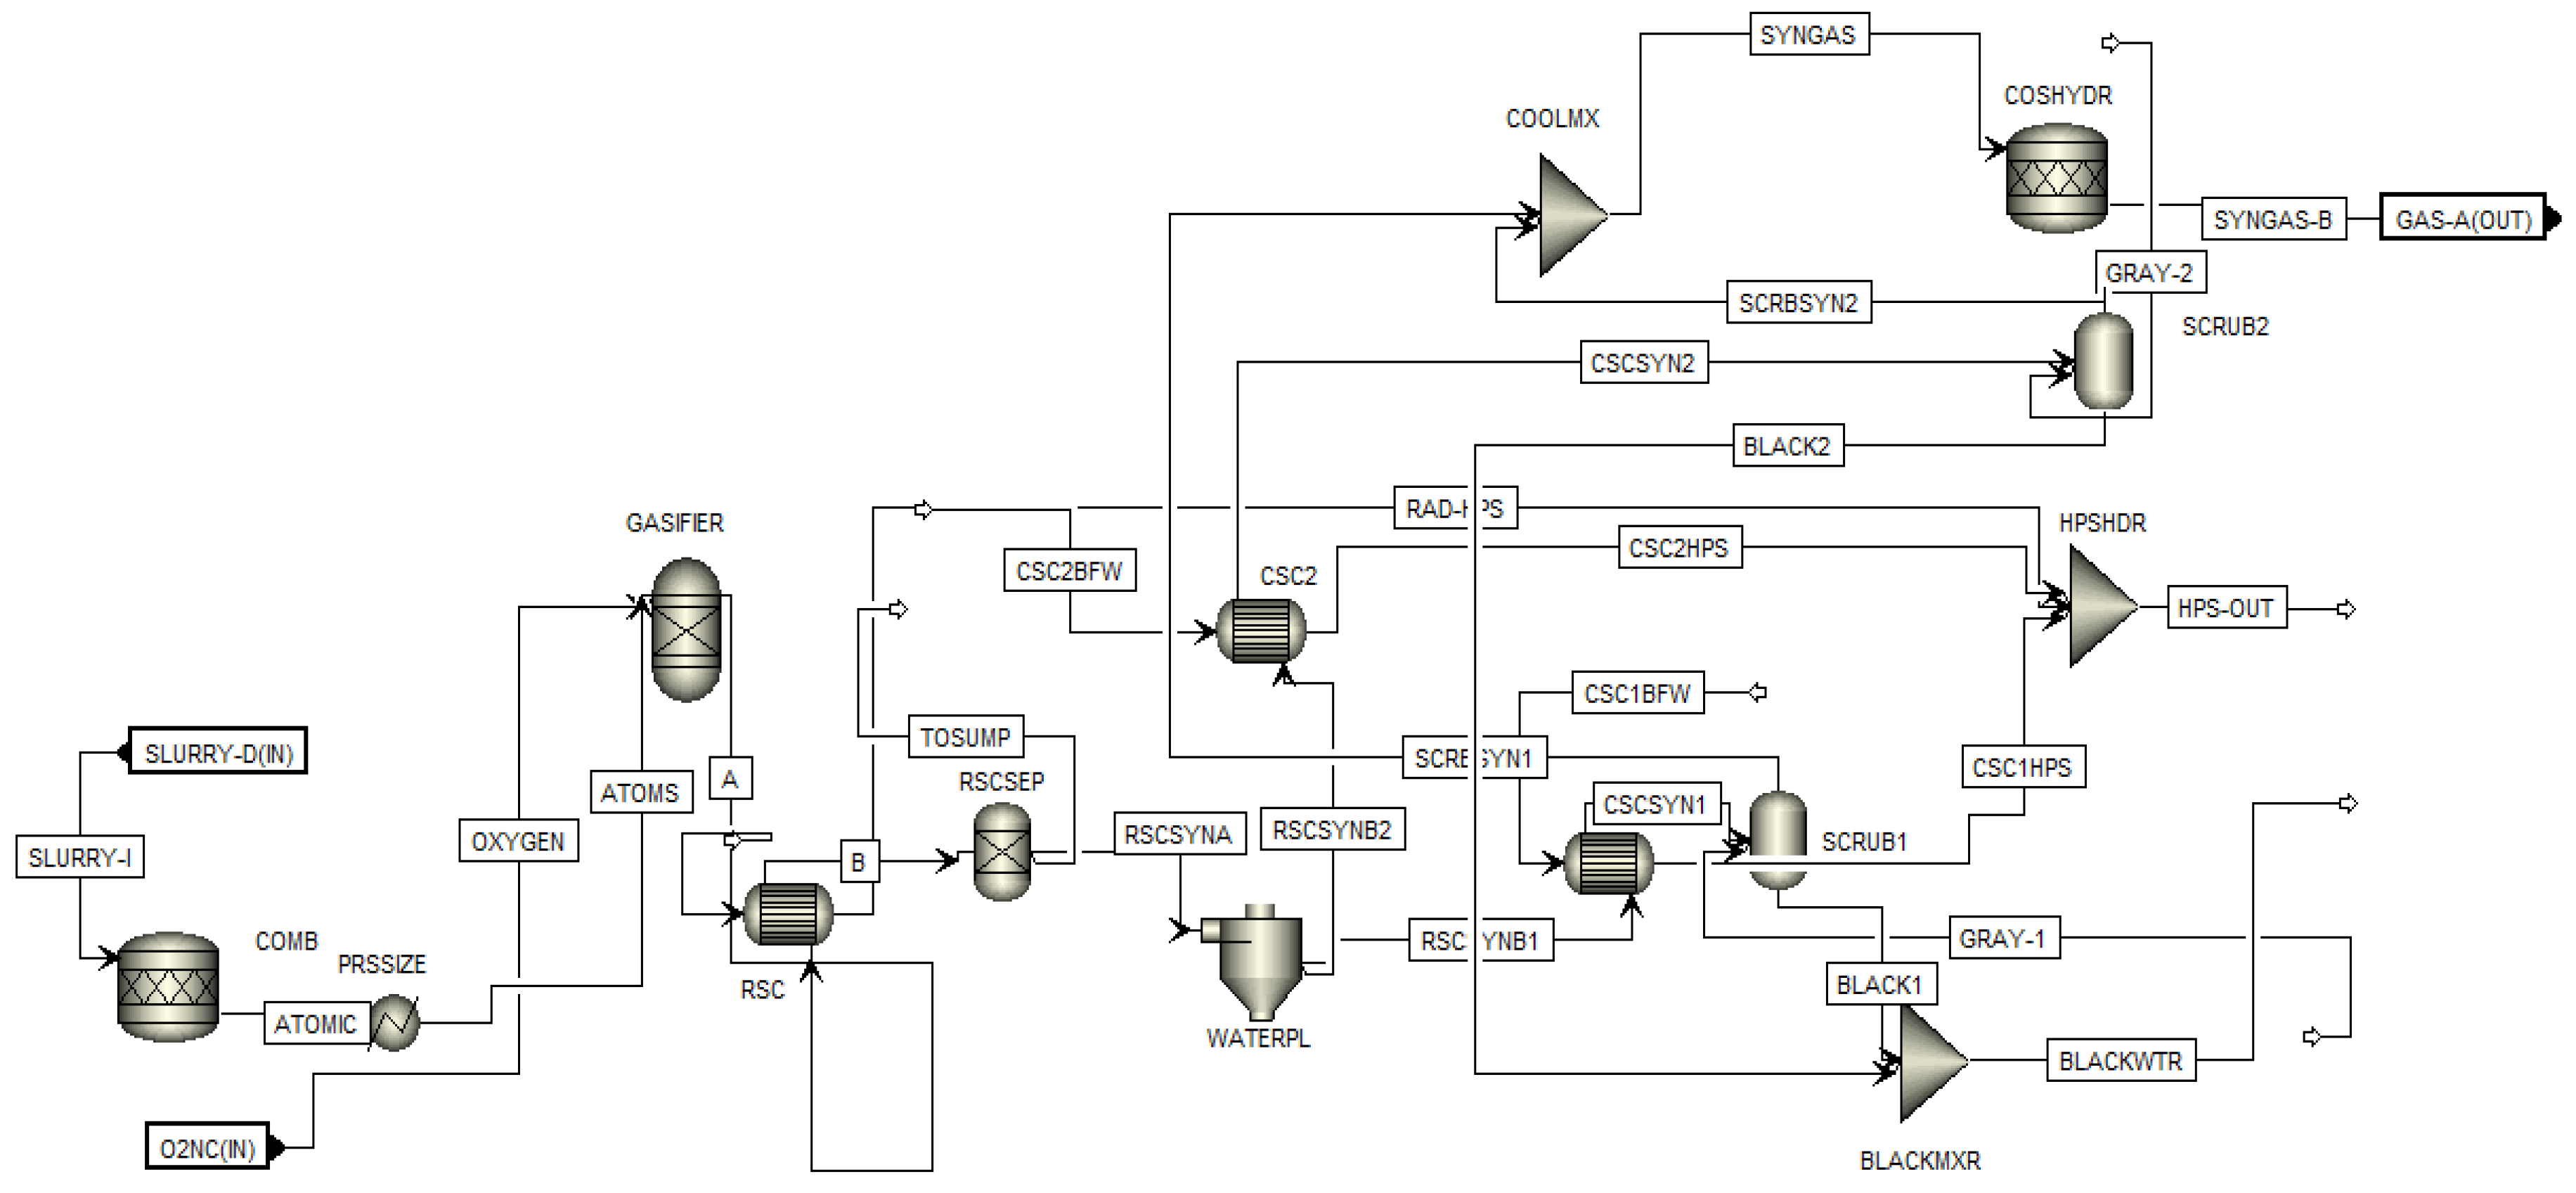
4.3. Gasification Unit
The municipal solid waste slurry enters the gasification unit at a flow rate of 67,766.35 kg/h and mixed with air flow at 116,601.36 kg/h in a ratio of 1.721:1 (air: MSW) at 49.6 bar in the gasification chamber. The gasifier operates at 32.75 bar and 1437.92 °C in a continuous reaction emitting vapor phase at a composition of 49% CO, 22.4% CO2, 20% H2O and traces of argon and nitrogen gas. The gasification effluent pass through heat exchangers that reduce its temperature from 1437.92 °C to 818.728 °C before passing through two scrubbers (SCRUB1 and SCRUB2) that reduces water content, H2S, methane, CO, CO2, and COS before being sent to syngas cleaning unit (stream: GAS-A(OUT)) as seen in Figure 6.
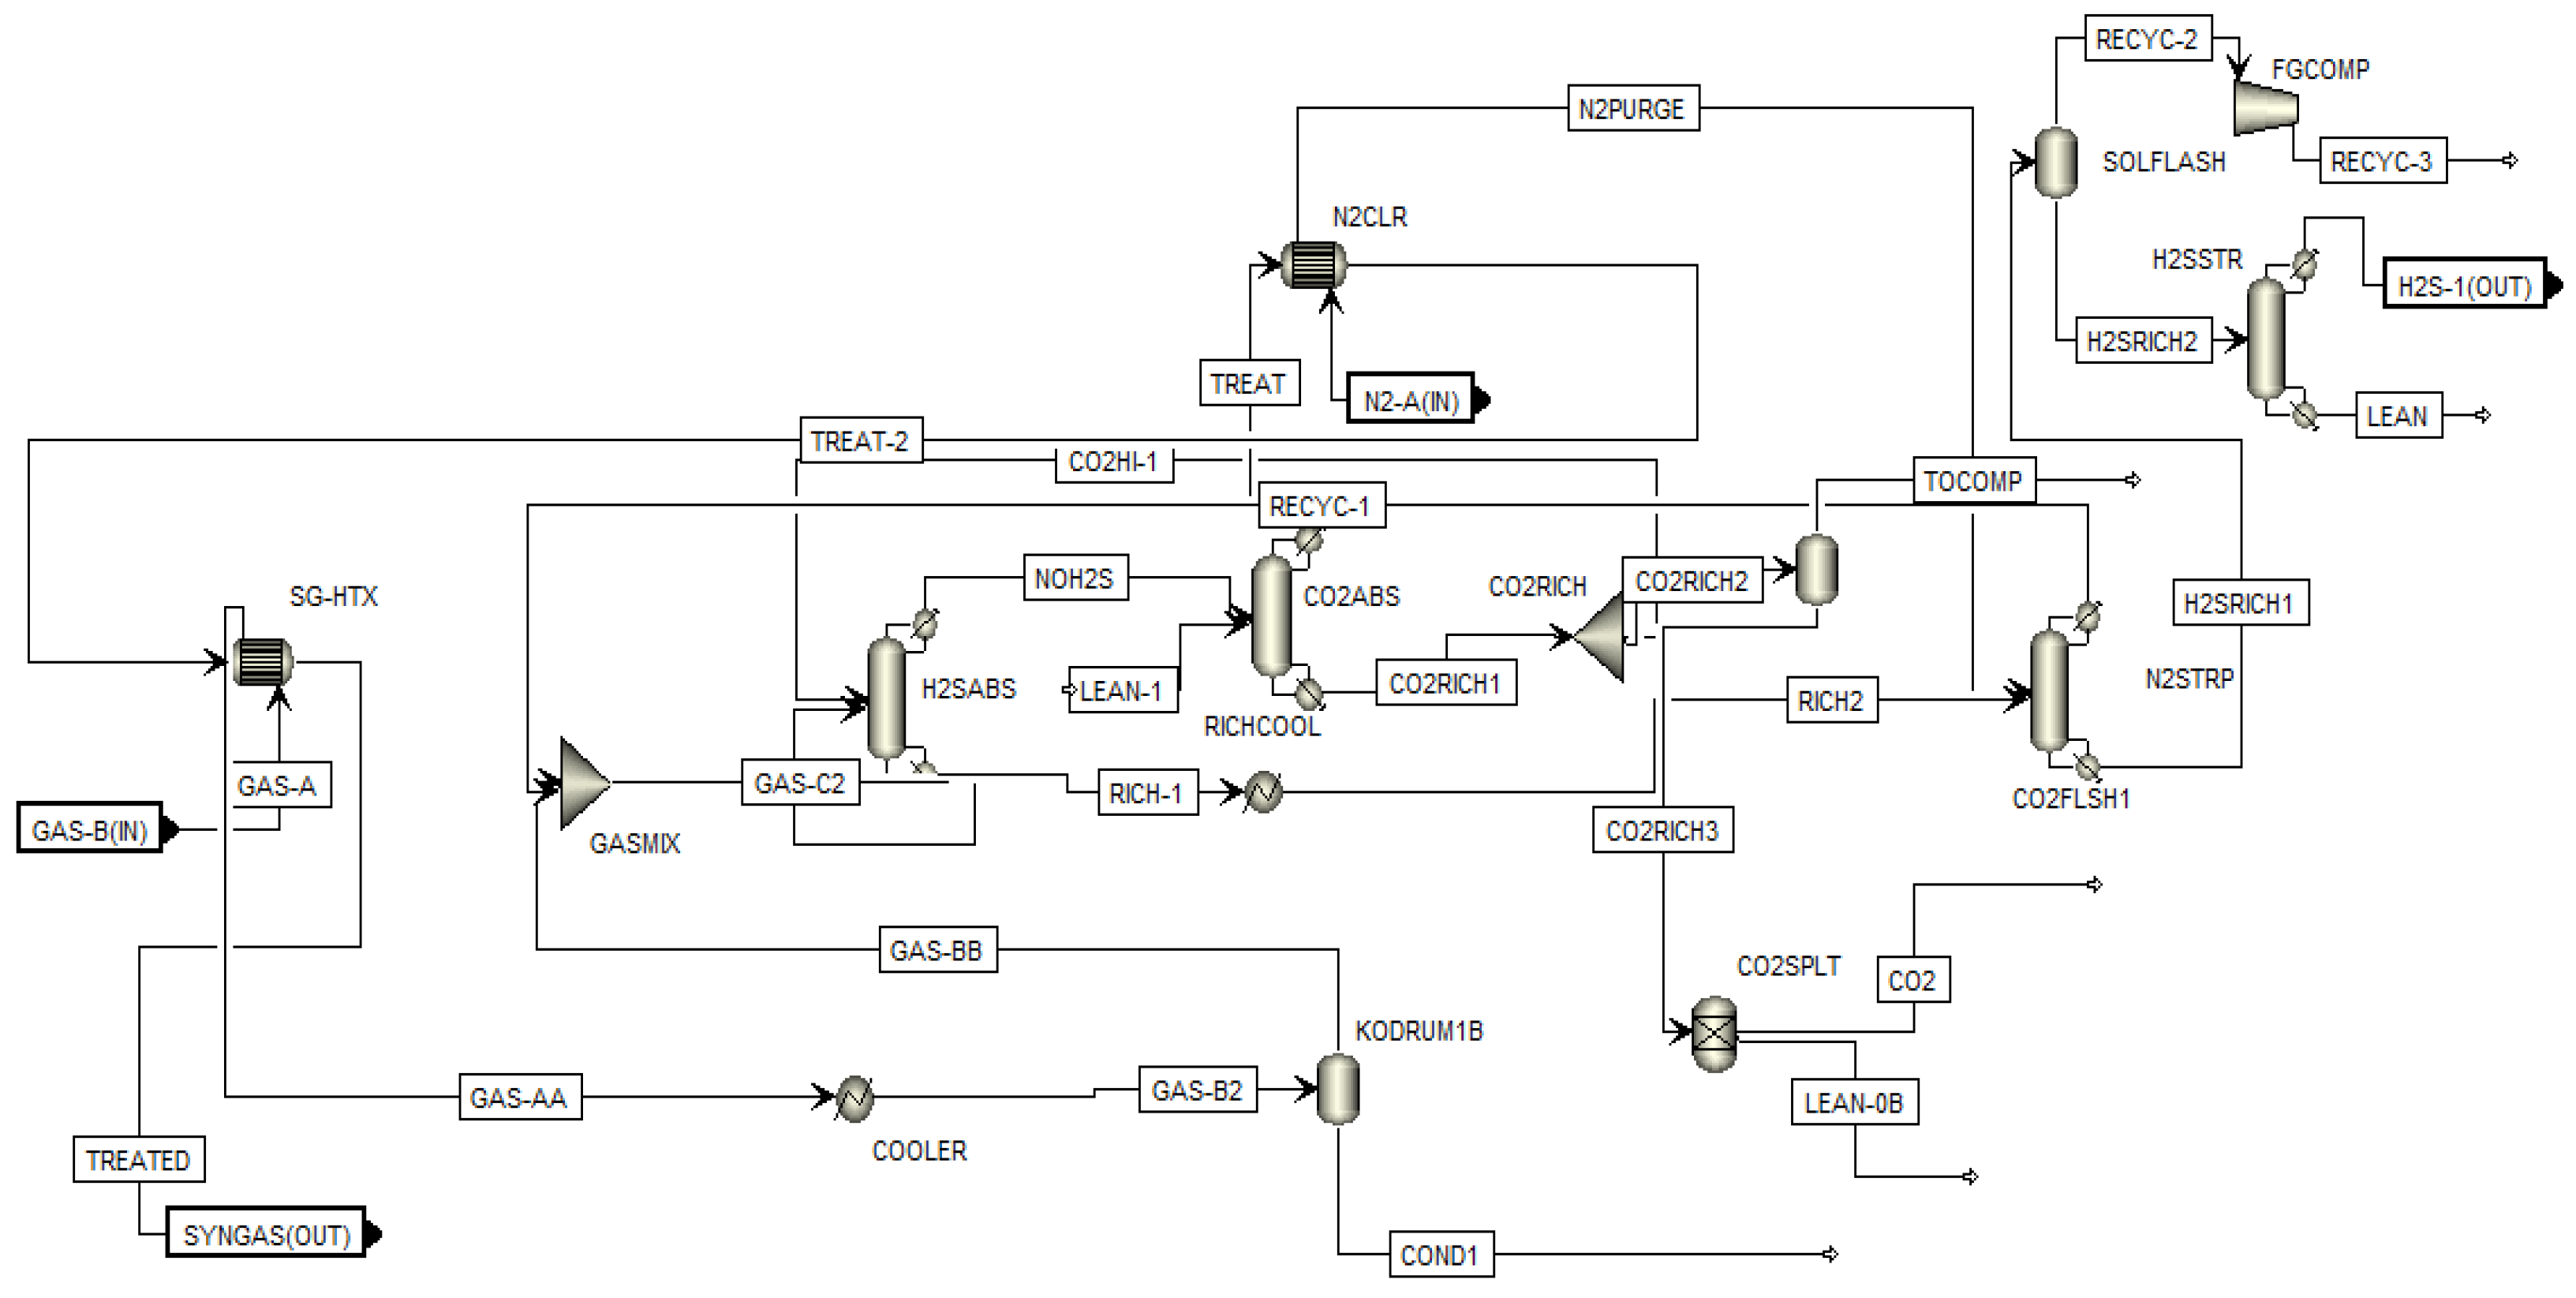
4.4. Syngas Cleaning Unit
The inlet syngas flow rate is 272,183.998 kg/h which enters SG-HTX where it is mixed with treated syngas and nitrogen and cooled from 140 °C to 12.22 °C. The cooled gas enters KODRUM for O2, Argon, CO, N2, COS and H2S removal and cleaning. The outlet gas is mixed with CO2 free syngas and enters 20 stage H2S absorber (H2SABS) that operates at 27.58 bar where H2S is removed and pure outlet stream (NOH2S) is sent to carbon dioxide absorber (CO2ABS), as seen in Figure 7. The CO2ABS is a 10-stage equilibrium reaction that operates at 27.58 bar and removes CO2. The effluent gas is then mixed with nitrogen stream (N2-A (IN) and is sent to N2STRP vessel. The N2STRP vessel consists of a 15-stage vessel that separates nitrogen allowing the effluent to be recirculated again in gas mixture (GASMIX) before H2S absorber. The final gas stream SYNGAS (OUT) is heat exchanged and sent to at 93.33 °C at a flow rate of 13, 440 m3/h to methanizer, power generator and ammonia synthesis unit.
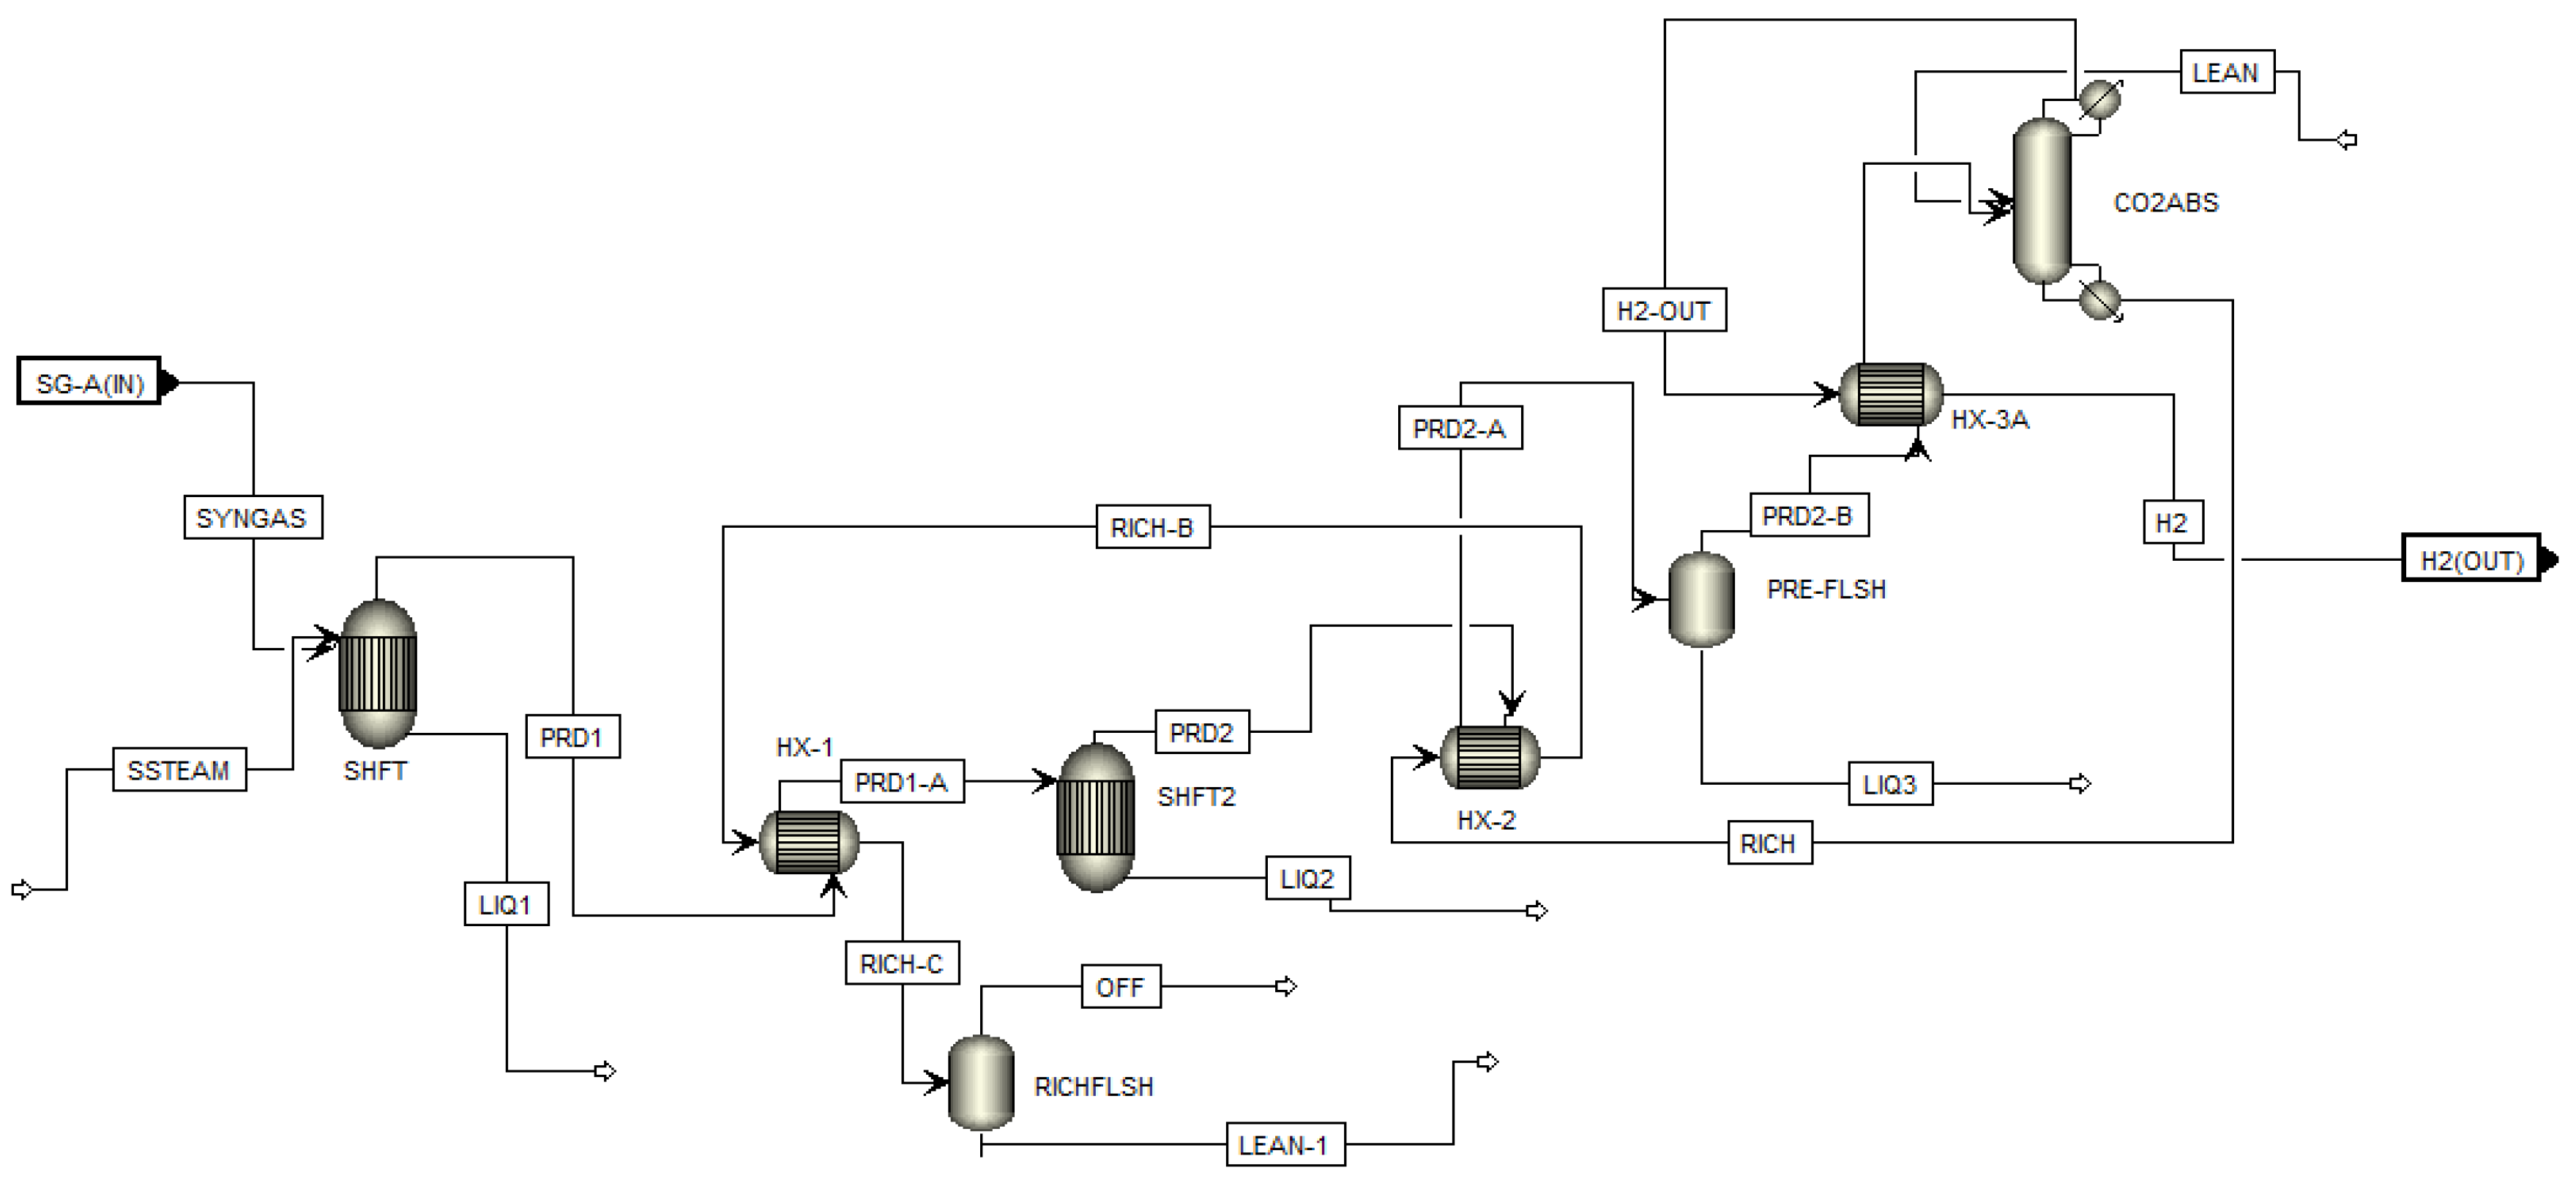
4.5. Water Gas Shift Unit (WGS)
The inlet syngas flow rate is 37,542.21 kg/h which enters the first shift reactor (SHFT, 2.73:1, syngas: H2O) with 13,778.05 kg/h steam at 343.33 °C and 24.13 bar to achieve the stoichiometric reaction. The product gas is 51,320.35 kg/h consisting of 41% hydrogen, 20% carbon dioxide, 19% nitrogen and traces of methane and carbon monoxide. The effluent stream (PRD1) is cooled from 415.75 °C to 132.22 °C in HX-1 before entering second shift reactor (SHFT2).
In the second shift reactor, water and carbon monoxide are converted to carbon dioxide and hydrogen at 210.44 °C and 24.13 bar. The effluent gases consists of 48%, 27% CO2 and traces of nitrogen and water and cooled in HX-2 from 210.44 °C to 0 °C. The effluent gas PRD2-A enters flash separator (PRE-FLSH) where 94% of water is removed through a bottom outlet stream (LIQ3). The effluent of flash separator is cooled from 0 °C to −23.33 °C before entering the carbon dioxide separator (CO2ABS). The carbon dioxide separator is a 15-stage equilibrium reactor at −22.55 °C and 24.13 bar that absorbs 88% of CO2 as seen in Figure 8.
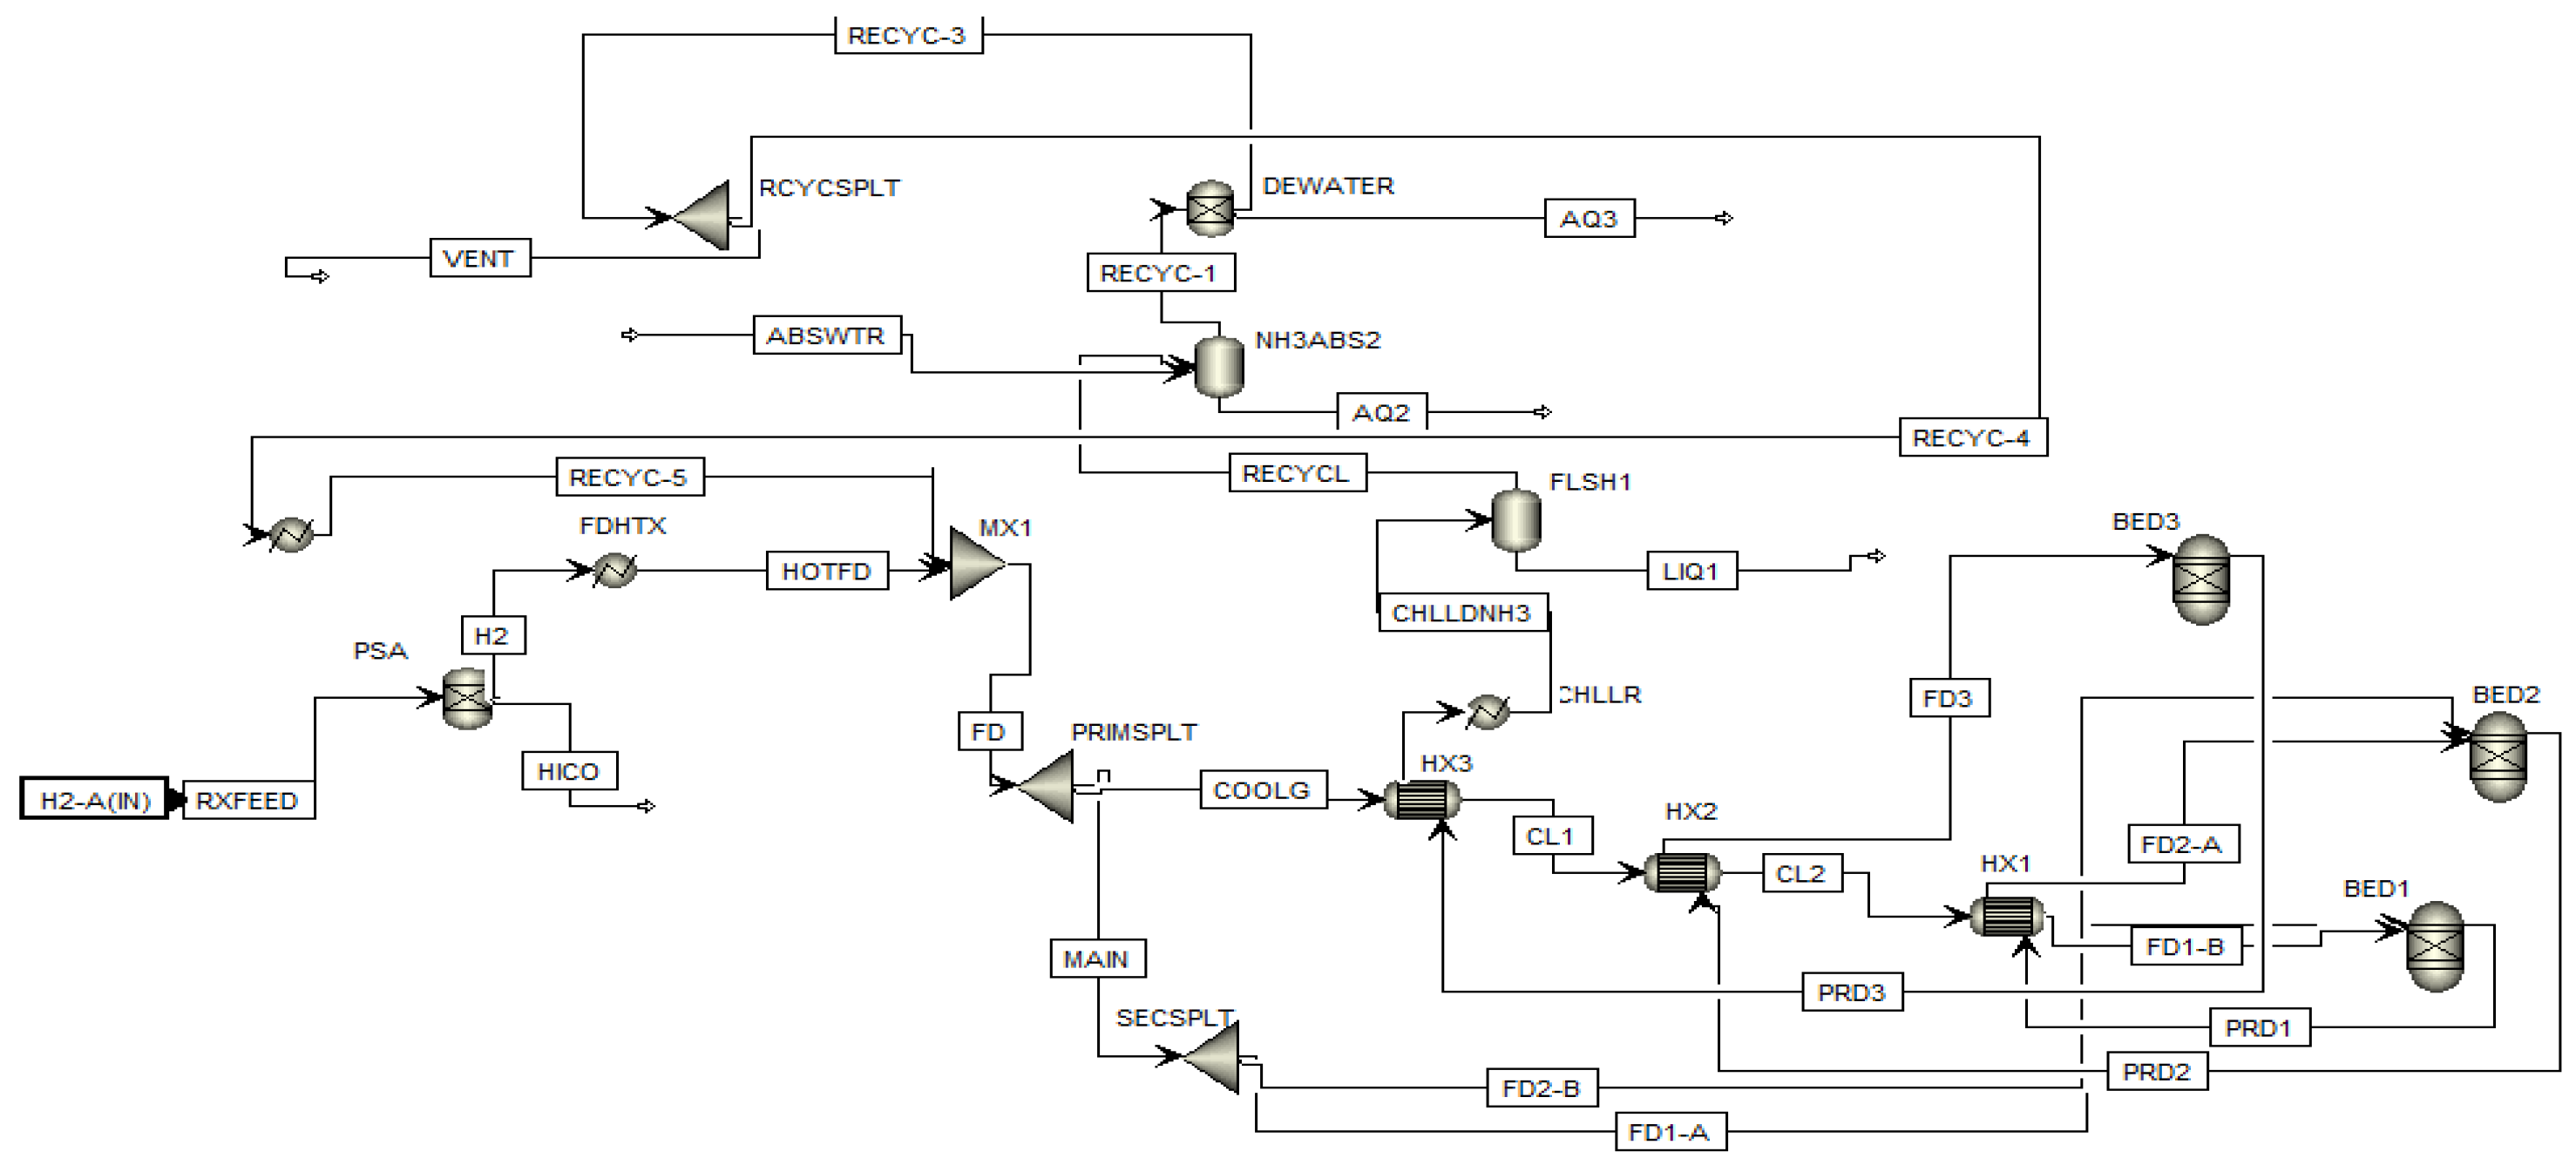
4.6. Ammonia Synthesis Unit
As seen in Figure 9, 8723.26 kg/h (H2-A (IN)) hydrogen and nitrogen mixture stream is fed to the pressure swing adsorber (PSA) in ratio (H2:N2, 0.75:0.2502) where pure hydrogen is produced at a flow rate of 6047.07 kg/h and heated from −4.04 °C to 219 °C in FDHTX. The hydrogen is then heated over three heat exchangers (HX3, HX2, and HX1) from 218.99 °C to 239.21 °C, 366.68 °C and 390.76 °C, respectively, and enters ammonia synthesis reactor. The ammonia synthesis reactor (Bed1 and Bed2) operates at 426.99 °C and 159 bar in a phase equilibrium reaction followed by ammonia absorption vessel (NH3ABS2).
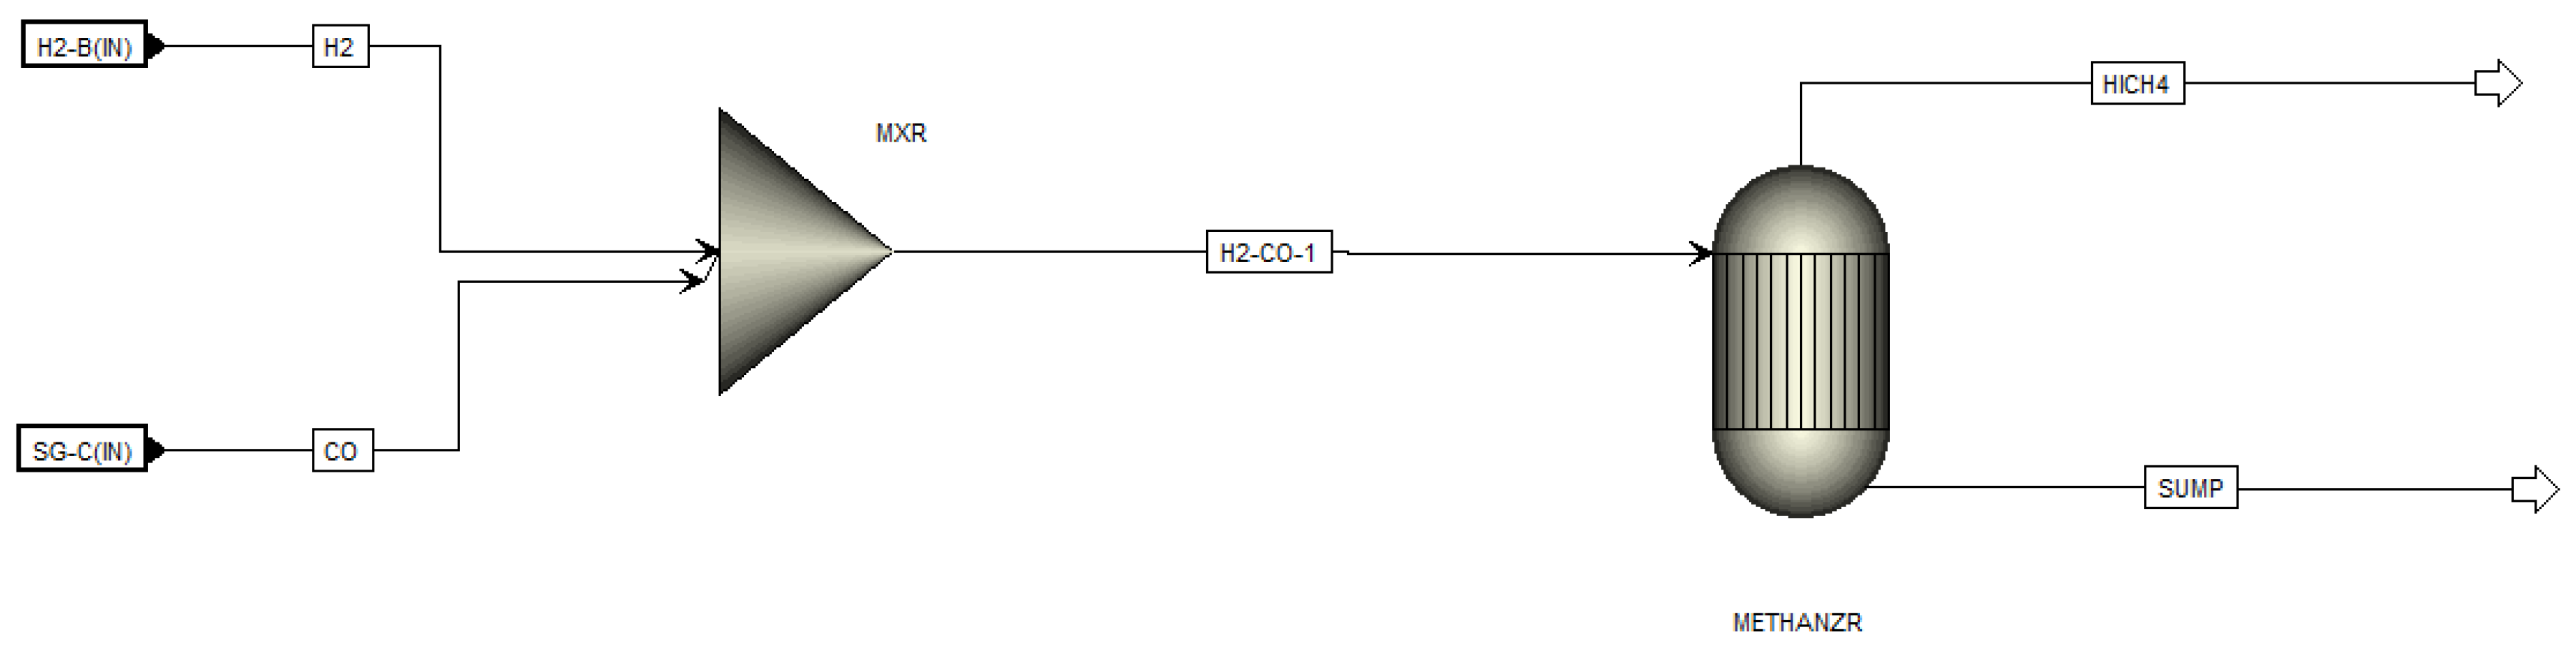
4.7. Methanation Unit
In this unit, carbon monoxide reacts with hydrogen in a reverse reaction to yield methane and water, as shown in Figure 10. The flow rate of hydrogen is 16,200.38 kg/h which reacts with 61,627 kg/h N2 (H2:N2, 1:3.804) at 271.11 °C in an equilibrium reaction producing 32,468.66 kg/h CH4 at product yield of 24% with nitrogen steam (HICH4) [32,33].
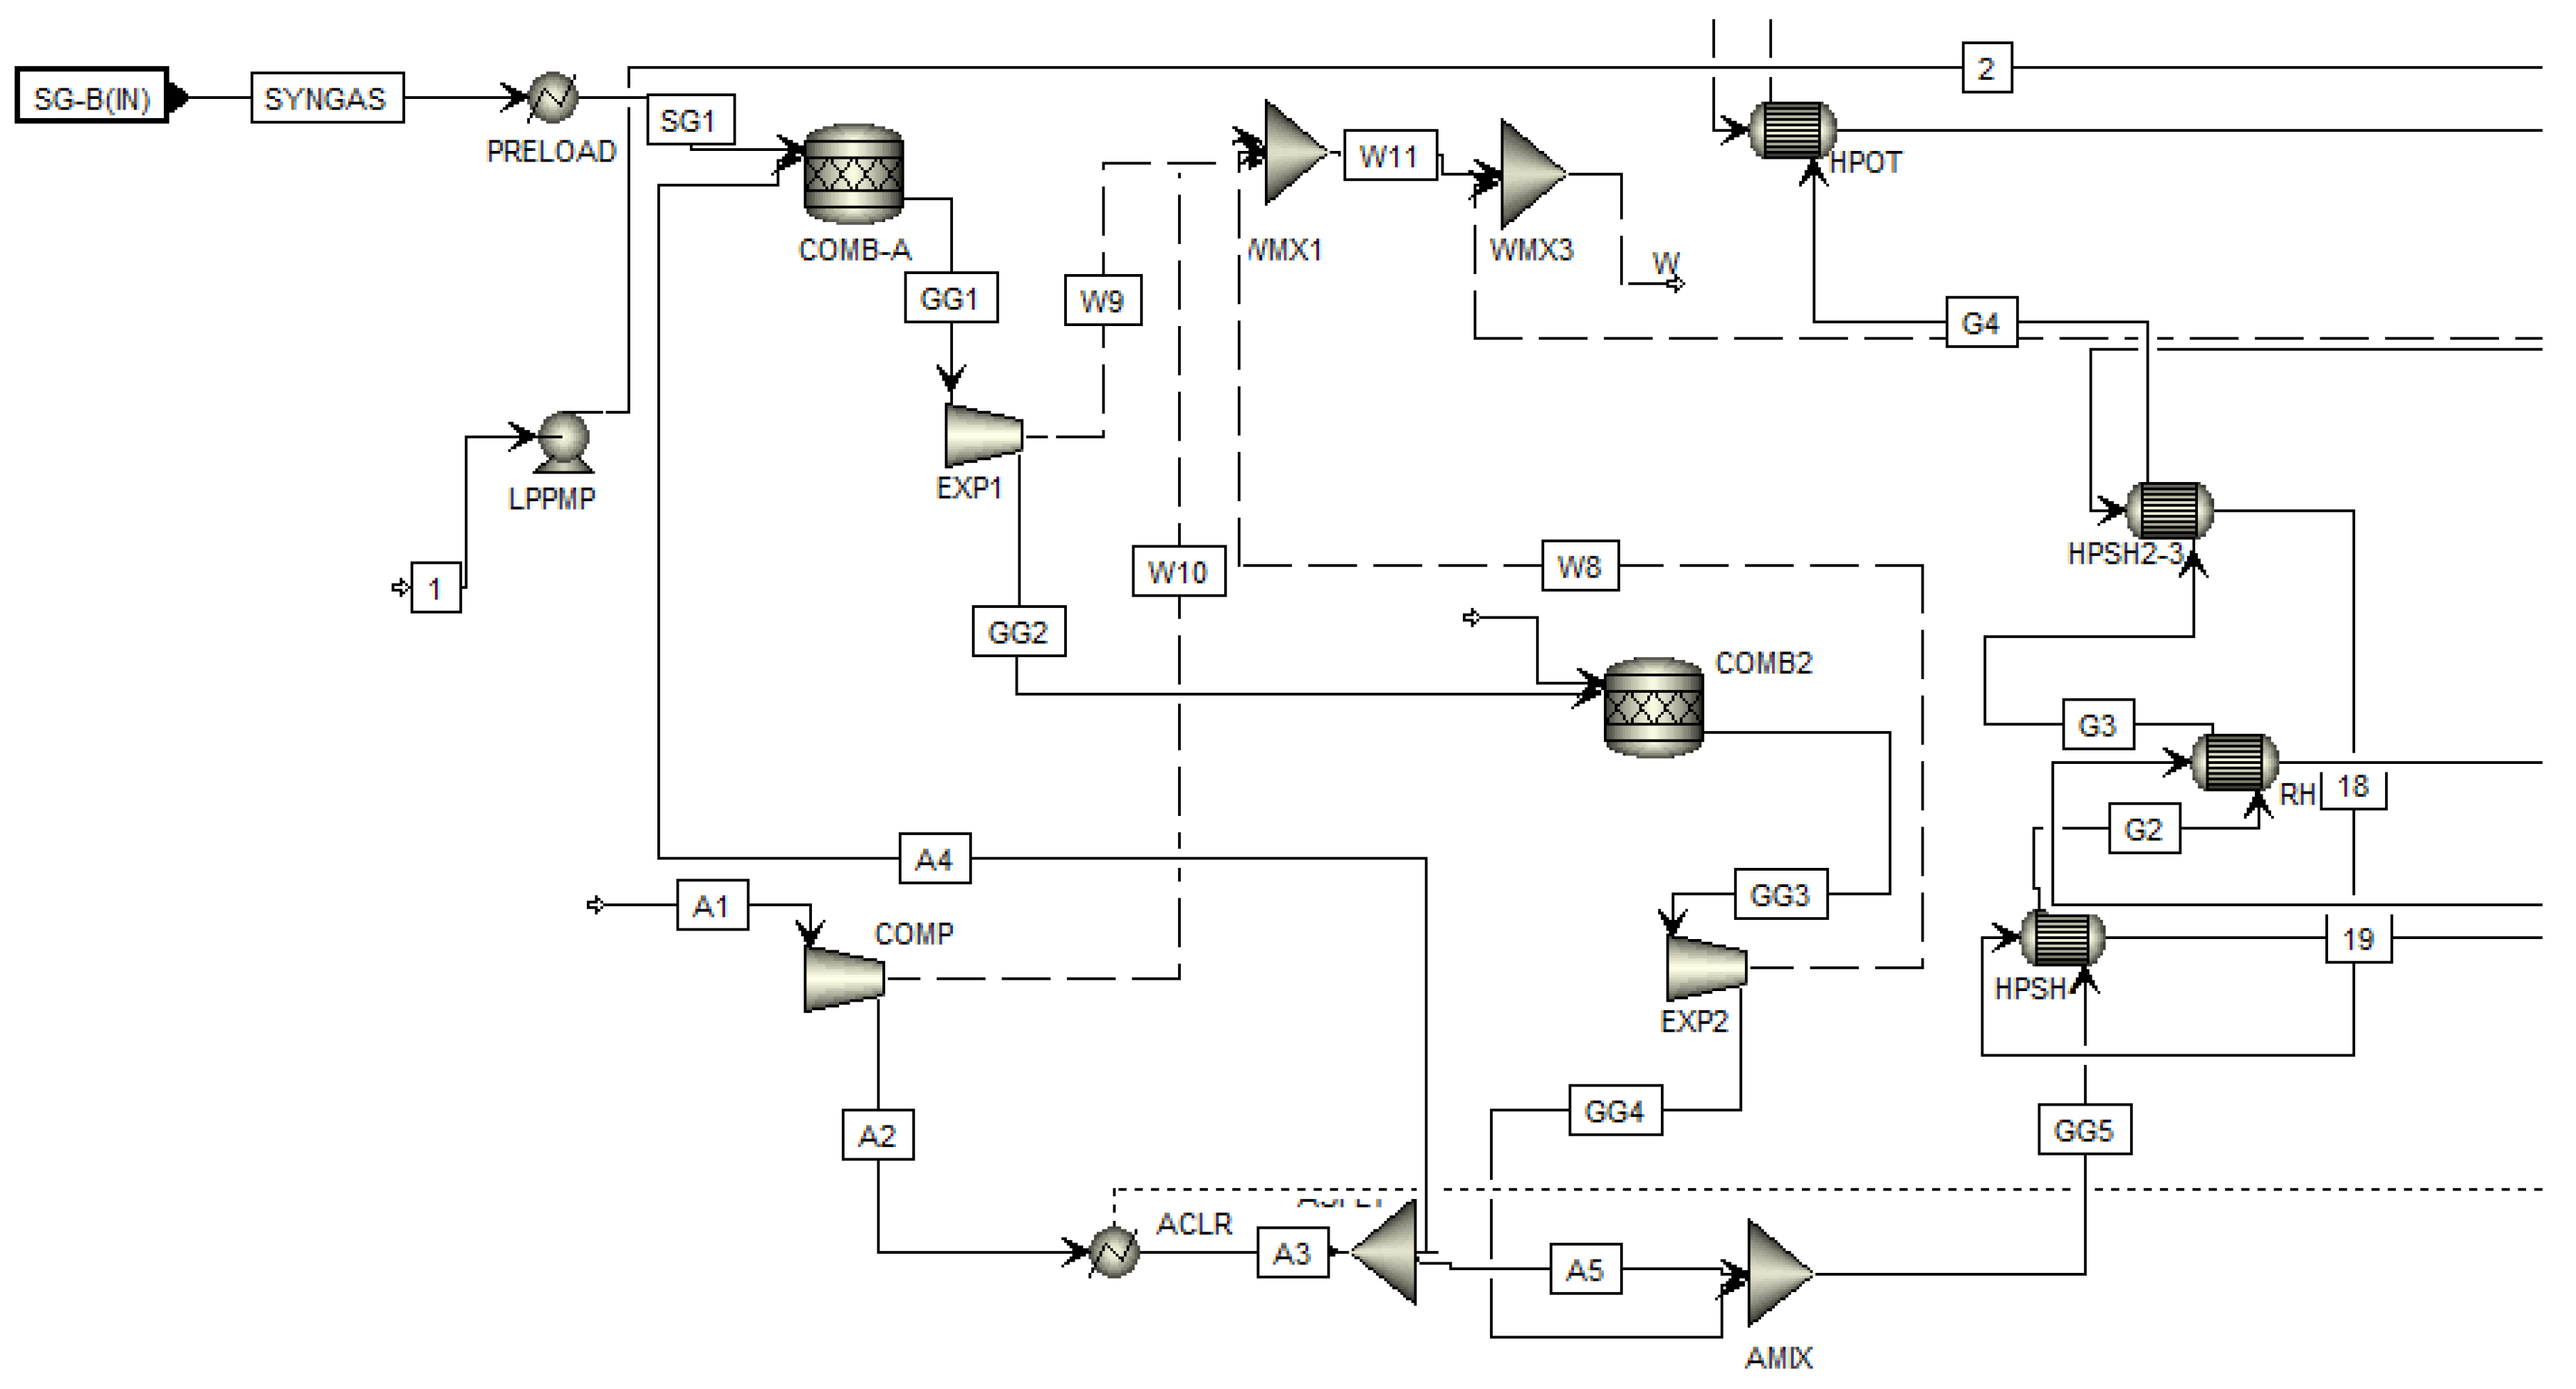
4.8. Power Generation Unit
The input flow rate of syngas to power generation unit is 196,470.81 kg/h which accounts for 90.8% of syngas and is combusted with 1,344,103.05 kg/h in ratio of (Syngas: Air, 1: 6.84) generating 1,540,576.59 kg/h of combustible gases. The gases generate 121,104 HP in turbine 1 (EXP1), and 470,269 HP in turbine 2 (EXP2). In the first combustion chamber (COMB1), carbon monoxide is combusted to carbon dioxide, while, in the second combustion chamber (COMB2), hydrogen is combusted to water as seen in Figure 11.
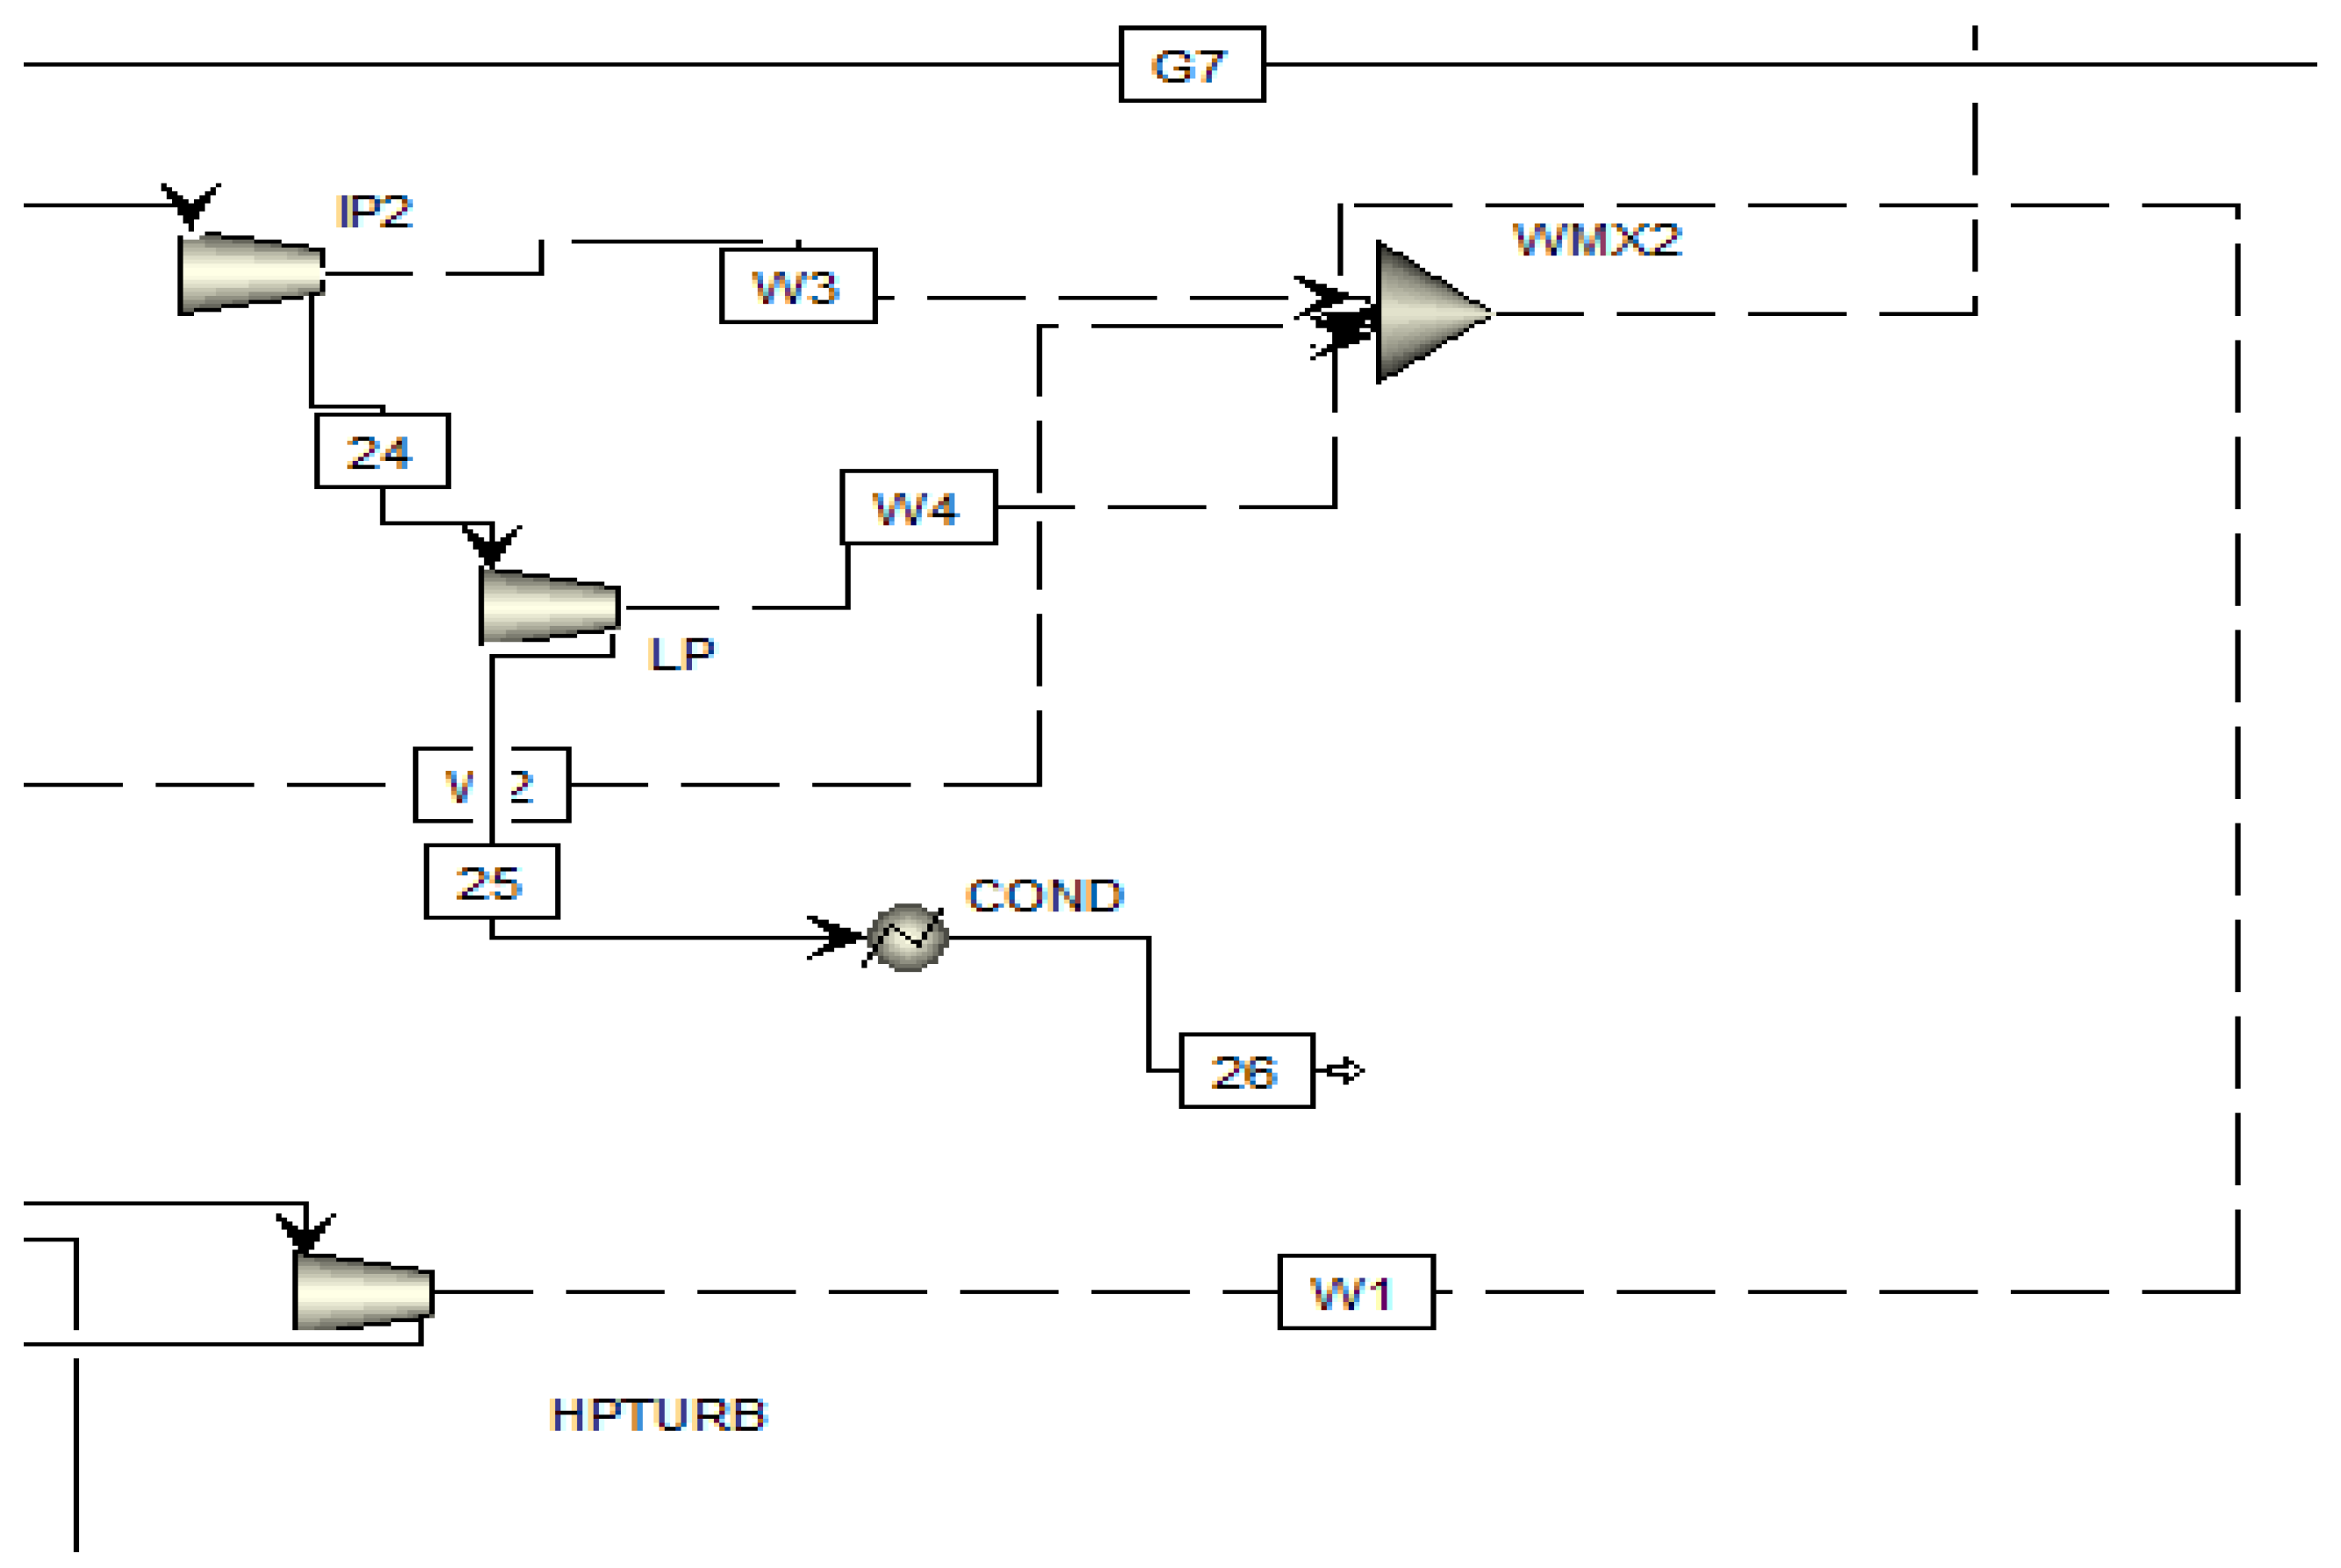
In the second stage of electricity generation (Figure 12), there are four turbines that generate electricity: IP1, IP2, LPTURB and HPTURB. IP1 generates 38,157 HP, IP2 generates 15,123 HP, LPTURB generates 52,887 HP and HPTURB generates 28,801 HP. Overall, this unit generates 1284.89 MW using combusted fuels from syngas. The isentropic efficiencies of all the turbines are 86%.
As seen in Figure 13, FWECON1 and FWECON2 heat exchanges water with air, where water is exchanged from 177 °C to 38.42 °C in FWECON1 and sent to LPDRUM which separates vapor from liquid content. The liquid content (Stream 12) is sent for further separation (Figure 13), while vapor content leaves the drum as effluent.
The Steam/Water heat exchange integration is chosen in which the turbine exhausts are exchanged with water. This solution guarantees an increasing of the WTE plant efficiency and avoids corrosion problems.
4.9. Chemical Reactions
Table 6 lists the chemical reactions used in simulation.
4.10. Energy Analysis
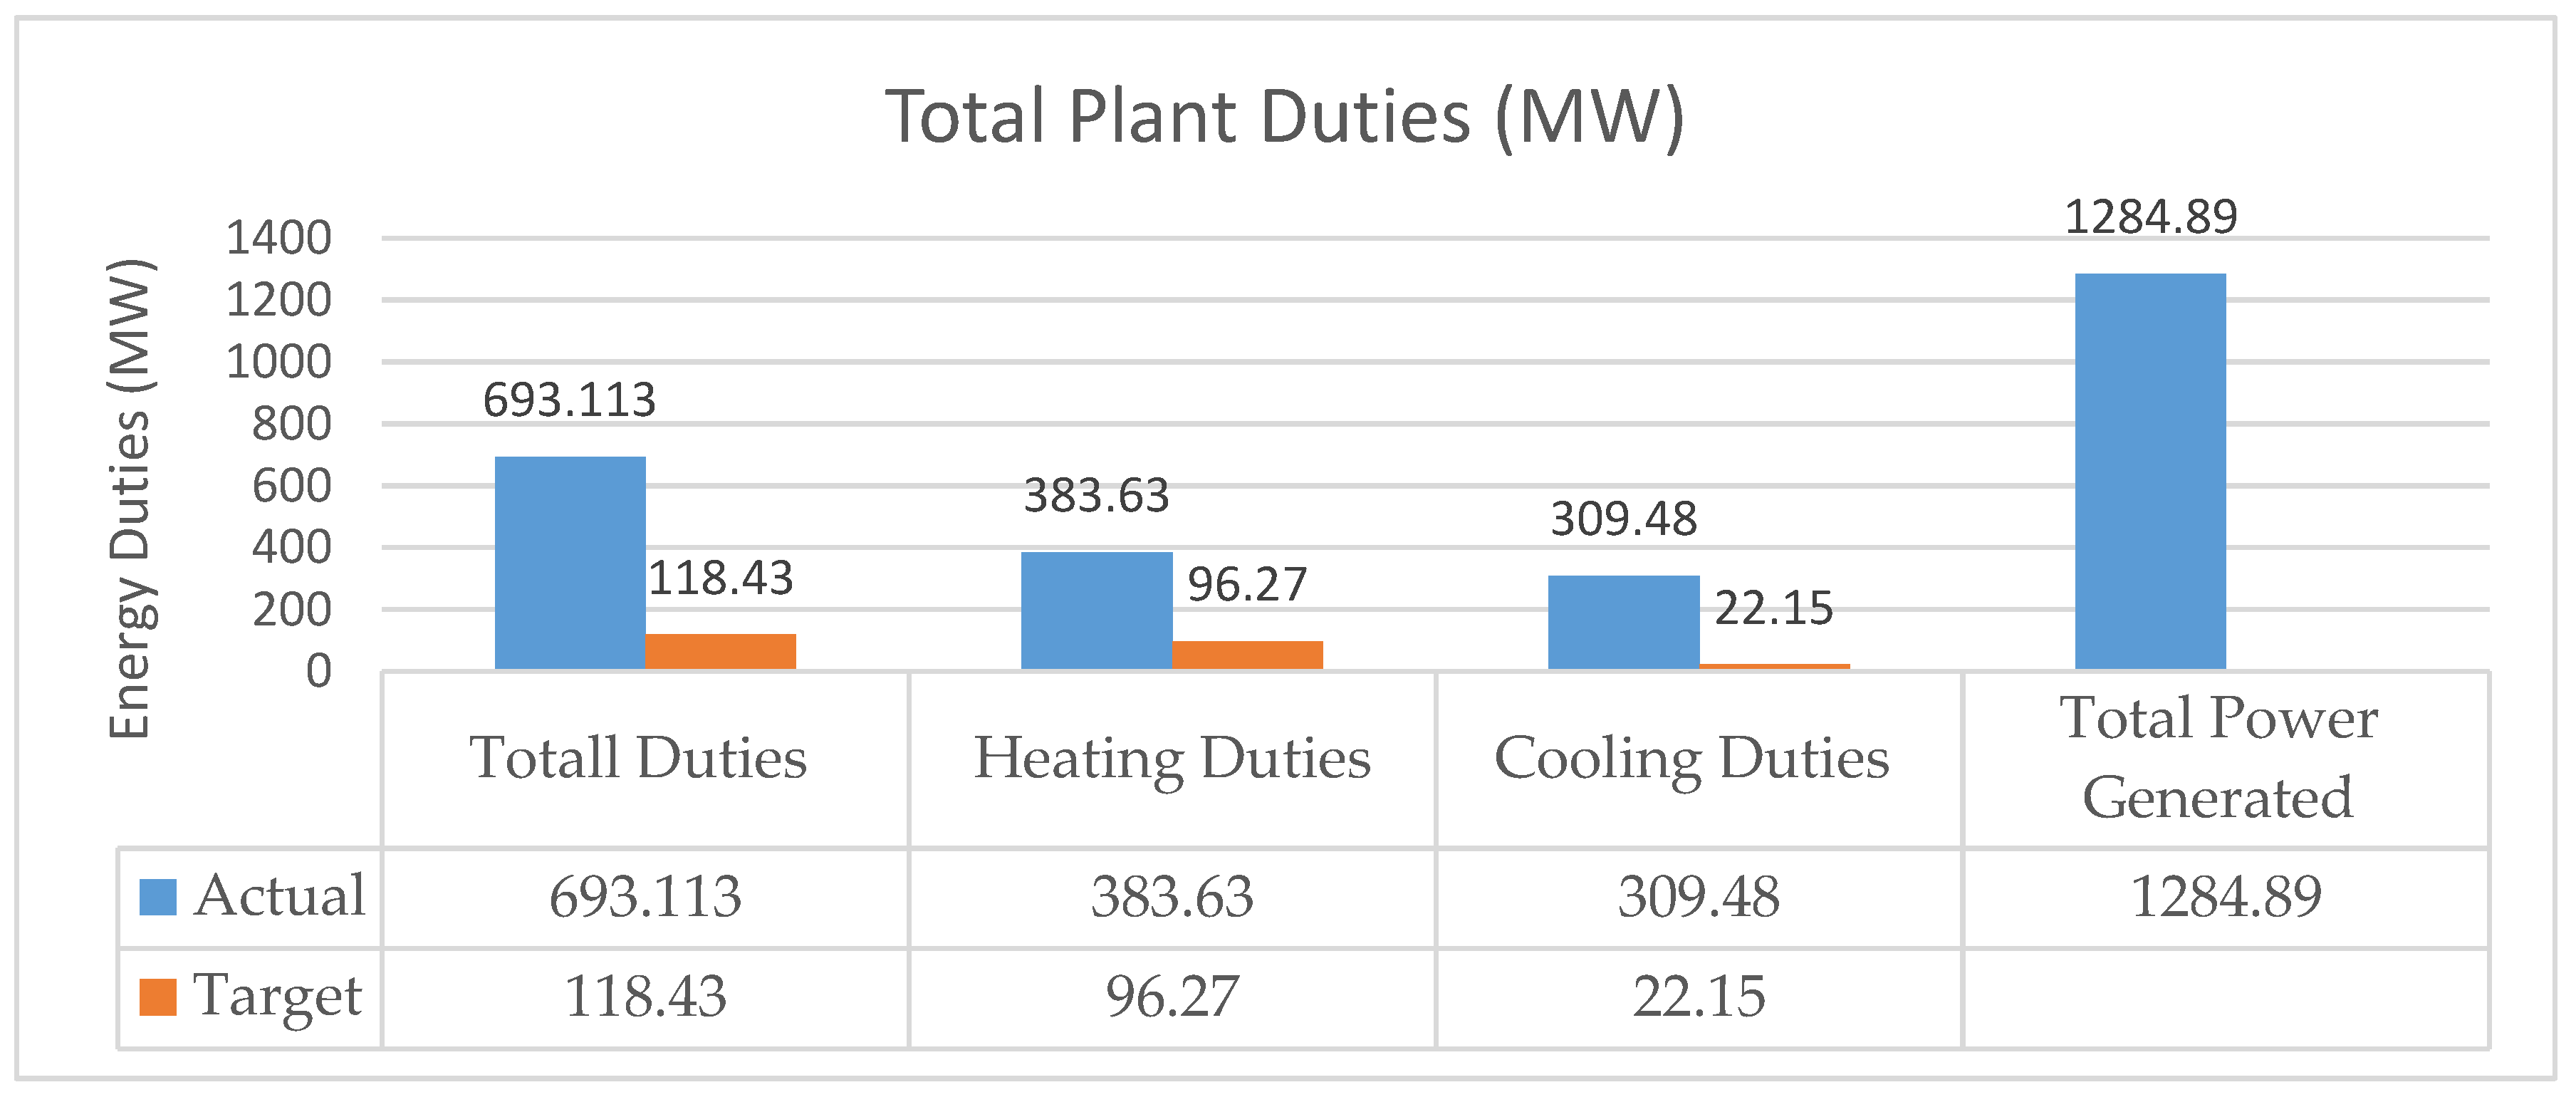
4.10.1. Heating and Cooling Duty Analysis
Figure 14 shows the overall energy plant results, comparing actual energy duties with target duties. The heating duties form 55.3% while cooling duties form 44.65% of a 543.13 KTA MSW IGCC gasification plant.
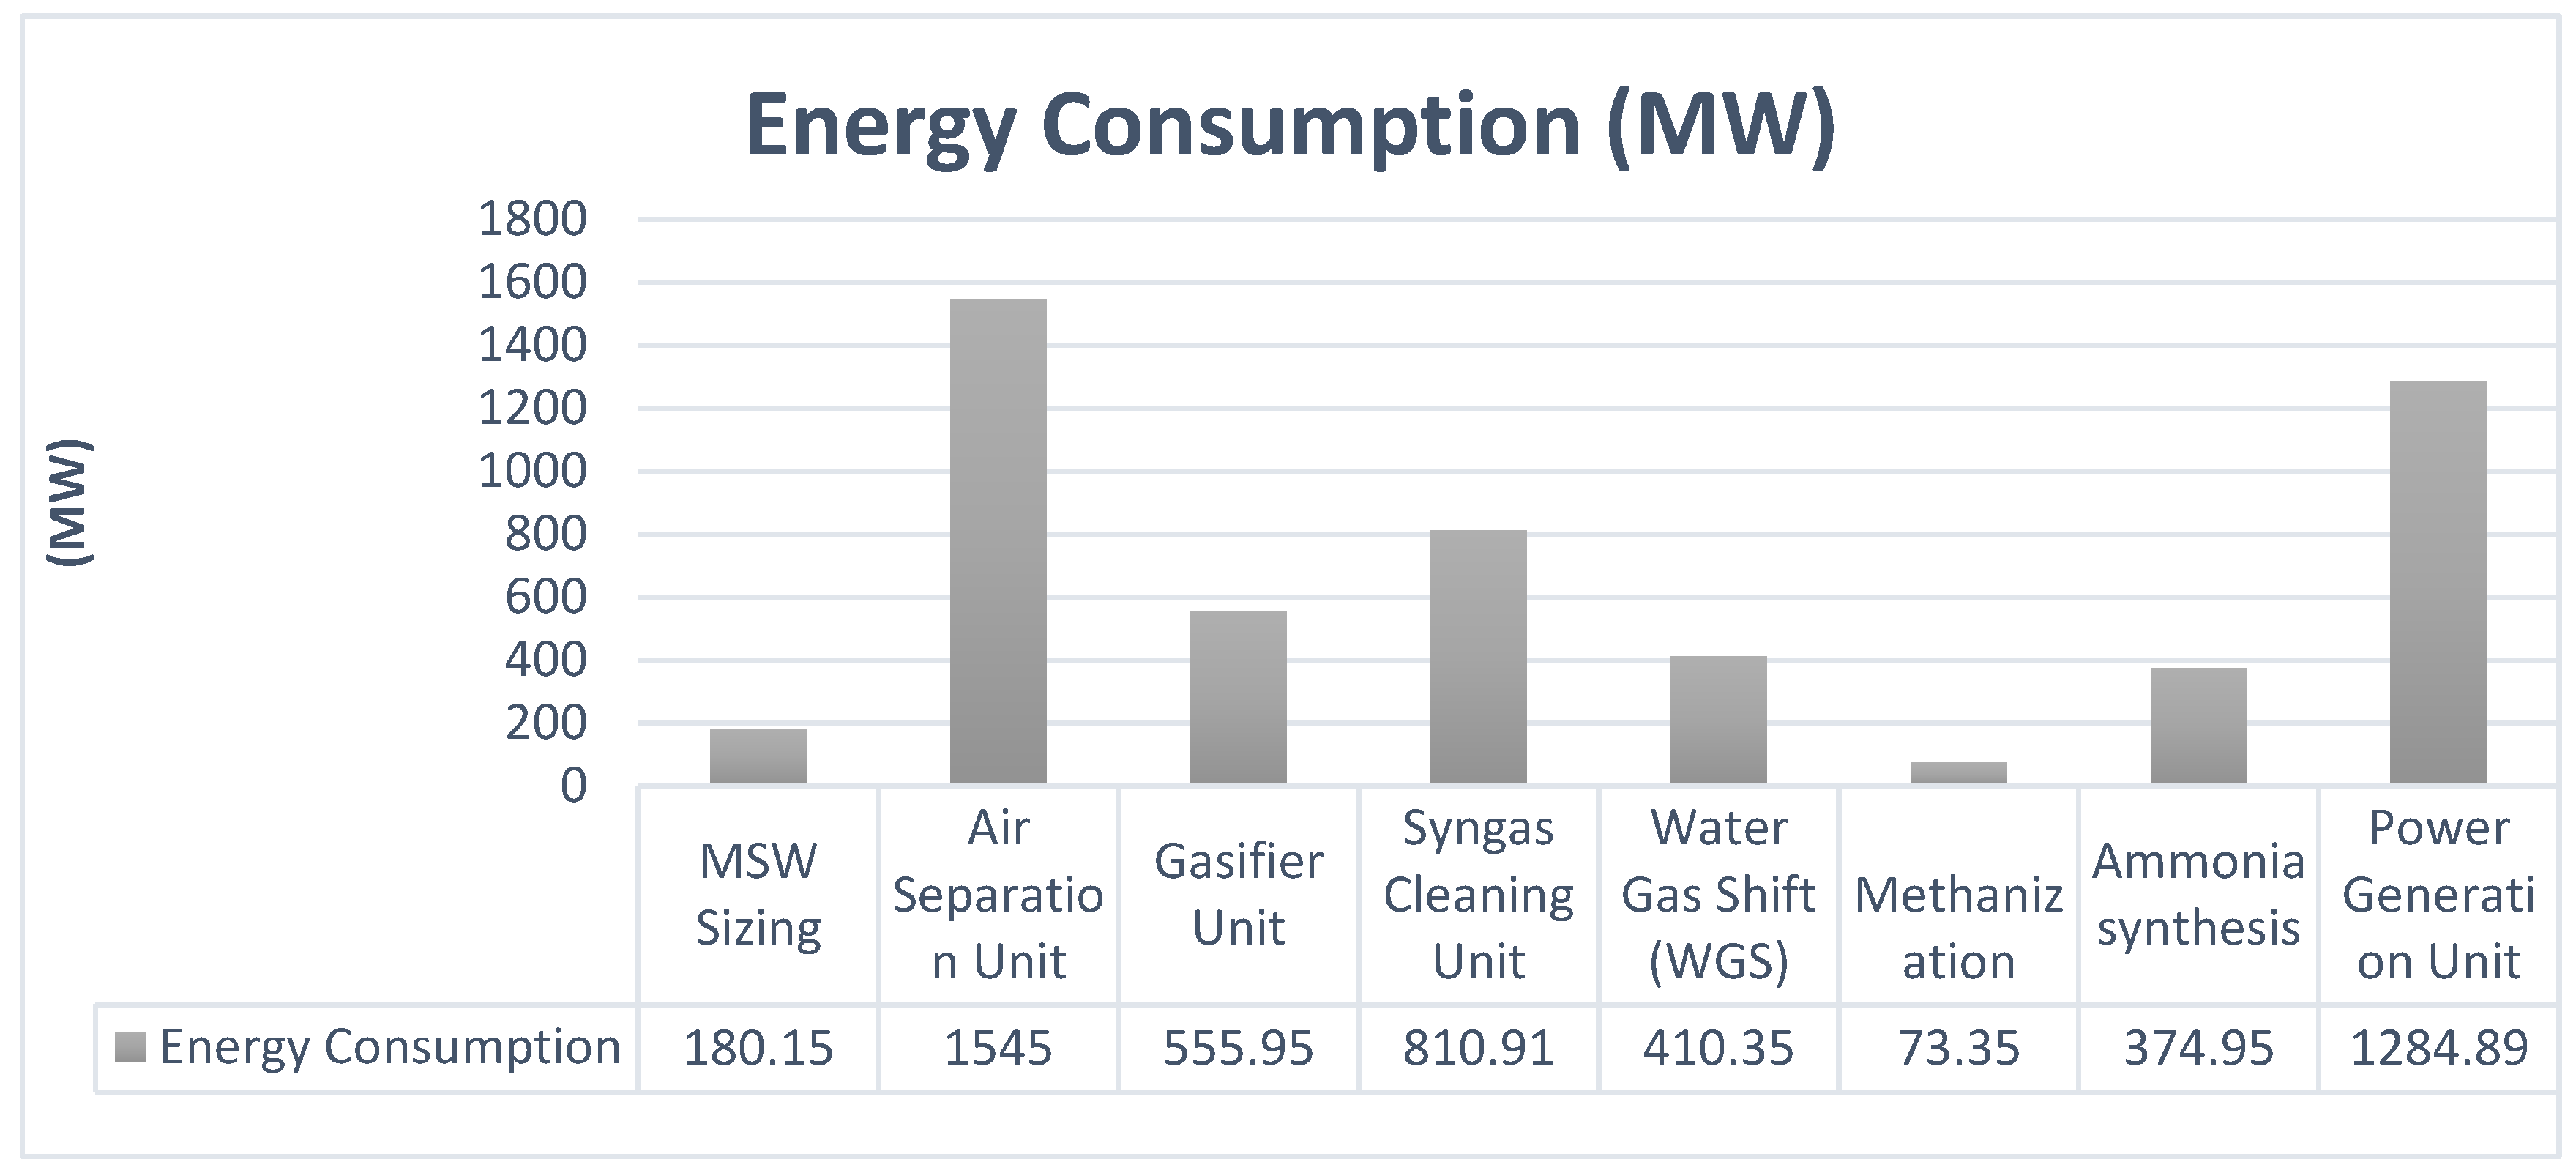
4.10.2. Energy Analysis
Figure 15 shows the energy consumption for every stage in the MSW IGCC plant.
5. Discussion
The 543.13 KTA IGCC plant consists of seven process units in which the air separation unit (ASU) consumes 30% of energy consumption used in the process system. This can be justified by use of 10 compressors in ASU as well as the very high flow rates. In addition, the syngas cleaning unit consumes 15.5% of energy used due to large number of separators, coolers and compressors. In terms of heat integration network, 693.3 MW is saved, accounting for 82.9% of total energy. The final products are the following:
- 1284.89 MW of energy produced
- Liquid ammonia: 8,731.07 kg/h at 8 °C
- Methane: 32,468 kg/h at 271 °C
In the MSW sizing unit, MSW is wet mixed with water in ratio of 2.392:1 followed by two crushing units to 0.2 mm and one screening unit. The screened MSW is then sent to the gasifier unit. Advantages of wet crushing design are the ability to crush highly cohesive materials, shorter processing times in comparison to dry crushers and less equipment maintenance. The air separation unit (ASU) receives 16,495.22 kg/h of air, which is mixed with water vapor, forming the saturated air stream that is fed to four compressors raising its pressure to 6.22 bar before entering the temperature swing adsorption (TSA) unit that operates at 60.2 °C and separates nitrogen and oxygen into two streams. The oxygen is then compressed over four compressors to 41.03 bar and fed to gasifier in a stoichiometric ratio. Nitrogen stream is compressed over three compressors to 27.58 bar and is sent to syngas cleaning unit. This ASU design has the advantage of fast operations using continuous TSA as well as multistage compressors for oxygen and nitrogen thus increasing operation reliability. It is noted that nitrogen compressors have higher working duties justified by higher pressure differentials. The gasifier unit gasifies MSW at air ratio of (1.721:1, air:MSW) at 32.75 bar and 1437.92 °C in a continuous process releasing syngas with a composition of 49% CO, 22.4% CO2, and 20% H2O following the gas scrubbing stage. The scrubbed syngas is sent for syngas cleaning unit followed by power generation, methanation and ammonia units. The advantage of the gasification unit is continuous gasifier operations with multistage syngas scrubbing, which increases reliability and delivers continuous syngas to the whole plant. The syngas cleaning unit consists of H2S absorbers, CO2 absorbers and N2S absorbers, respectively. This design starts with H2S absorber since this improves process stability and reduces severity in other separation drums [34]. The water gas shift (WGS) unit is a preliminary stage of ammonia synthesis, which includes a shift reactor followed by heat exchangers and a CO2 absorber. This design eliminates toxication of reactors in methanation and ammonia synthesis units and ensures continuous flow of hydrogen to both units [35]. The ammonia synthesis unit consists of pressure swing adsorber (PSA) followed by ammonia equilibrium reactors that operate in a stoichiometric continuous flow. The methanizer unit consists of a methanation equilibrium reactor that mixes hydrogen and carbon monoxide. The power generation unit consists of two combustors in series that utilize syngas to generate electricity followed by series of gas and steam turbines. This design has an advantage of multistage pressure turbines, which increases both thermal and electrical efficiencies [36]. Overall, the plant shows reliability and steady stage modeling in all units
6. Conclusions
In conclusion, the proposed conceptual design achieves 82.9% energy integration efficiency, which is much higher than non-integrated single cycle gasification plants. The conceptual design converts 542.13 KTA of MSW to 1284.89 MW electricity, 8731.07 kg/h liquid ammonia and 32,468 kg/h methane. The electricity is produced using four syngas turbines and three steam turbines as well as liquid ammonia at a flow rate of 8731.07 kg/h and methane at a flow rate of 32,468 kg/h. The air separation unit (ASU) consumes the highest energy, approximately 30%, followed by syngas cleaning unit (15.5%), while the gasification unit consumes only 10.7%. The conceptual simulation model reflects real plant simulations and enhances system energy efficiency considering heat integration and continuous operations. It can be concluded that integrated gasification systems have higher thermal efficiencies with lower environmental emissions.
Acknowledgments
This research is part of the collaboration with ProFlange, and authors would like to thank the support from Janak Handa, ProFlange.
Author Contributions
Hossam A. Gabbar and Mohamed Aboughaly conceived and designed the plant design; M. Aboughaly and Stefano Russo performed the simulation; and Hossam A. Gabbar and Mohamed Aboughaly analyzed the data and wrote the paper.
Conflicts of Interest
The authors declare no conflict of interest.
Abbreviations
| ASU | Air separation unit |
| CC | Combined syngas-steam cycle |
| ECO | Economizer |
| EVA | Evaporation |
| GHGs | Green house gases |
| GT | Gas turbine |
| KTA | Kilo tonne per annum |
| HP | Horse power |
| HRSG | Heat recovery steam generator |
| SH | Superheater |
| ST | Steam turbine |
| WTE | Waste-to-energy |
Nomenclature
| CH4 | Methane |
| Cx Hy | Hydrocarbon |
| COMP | Air stream from compressor |
| CO2 | Carbon dioxide |
| GOXCMP | Oxygen stream from compressor |
| H2S | Hydrogen sulfide |
| N2XCMP | Nitrogen stream from compressor |
| SG-A | Syngas stream to water gas shift unit |
| SG-B | Syngas stream to methanizer unit |
| SB-C | Syngas stream to power unit |
| SG-HTX | Syngas heat exchanger |
References
- Kunzea, C.; Riedl, K.; Spliethoff, H. Structured exergy analysis of an integrated gasification combined cycle (IGCC) plant with carbon capture. Energy 2011, 36, 1480–1487. [Google Scholar] [CrossRef]
- Rocco, M.; Lucchio, A.; Colombo, E. Exergy Life Cycle Assessment of electricity production from waste-to-energy technology: A Hybrid input-output approach. Appl. Energy 2017, 2017, 832–844. [Google Scholar] [CrossRef]
- Ni, W.; Li, Z.; Ma, L.; Liu, H. Strategic thinking on IGCC development in China. Energy Policy 2008, 11, 1–11. [Google Scholar]
- Consonni, S.; Silva, P. Off-design performance of integrated waste-to-energy, combined cycle plants. Appl. Therm. Eng. 2007, 27, 712–721. [Google Scholar] [CrossRef]
- Poma, C.; Verdaa, V.; Consonni, S. Design and performance evaluation of a waste-to-energy plant integrated with a combined cycle. Energy 2010, 35, 786–793. [Google Scholar] [CrossRef]
- Majozi, T.; Boerc, D.; Emun, F. Integrated gasification combined cycle (IGCC) process simulation and optimization. Comput. Chem. Eng. 2010, 34, 331–338. [Google Scholar]
- Lee, J.; Lee, H.; Joo, Y.; Lee, C.; Oh, M. Process simulation and thermodynamic analysis of an IGCC (integrated gasification combined cycle) plant with an entrained coal gasifier. Energy 2014, 64, 58–68. [Google Scholar] [CrossRef]
- Petrov, M.; Hunyadi, L. Municipal solid waste boiler and gas turbine hybrid combined cycles performance analysis. In Proceedings of the 1st International Conference on Sustainable Energy Technologies, Porto, Portugal, 12–14 June 2002. [Google Scholar]
- Minutillo, M.; Perna, A.; Bona, D. Modelling and performance analysis of an integrated plasma gasification combined cycle (IPGCC) power plant. Energy Convers. Manag. 2009, 50, 2837–2842. [Google Scholar] [CrossRef]
- Young, G. MSW processes to energy with high-value products and specialty by-products. In Municipal Solid Waste to Energy Conversion Processes, Economic Technical and Renewable Comparisons; Wiley: Hoboken, NJ, USA, 2010; pp. 155–156. [Google Scholar]
- Blumberg, T.; Sorgenfrei, M.; Tsatsaronis, G. Design and assessment of an IGCC concept with CO2 capture for the co-generation of electricity and substitute natural gas. Sustainability 2015, 7, 16213–16225. [Google Scholar] [CrossRef]
- Branchini, L. Waste-To-Energy Steam Cycle. In Waste-to-Energy Steam Cycle: Advanced Cycle and New Design Concepts for Efficient Power Plants; Springer: Berlin/Heidelberg, Germany, 2015; pp. 39–40. [Google Scholar]
- Reddy, P. Energy Recovery from Municipal Solid Waste by Thermal Conversion Technologies; CRC Press: Chennai, India, 1999. [Google Scholar]
- Panepinto, D.; Tedesco, V.; Brizio, E.; Genon, G. Environmental performances and energy efficiency for MSW gasification treatment. Waste Biomass Valor. 2015, 6, 123–125. [Google Scholar] [CrossRef]
- Consonni, S. Combined cycles for high performance, low cost, low environmental impact waste-to-energy systems. In Proceedings of the ASME TURBOEXPO, Munich, Germany, 8 May 2000. [Google Scholar]
- Falcke, T.; Hoadley, A.; Brennan, D.; Sinclair, S. The sustainability of clean coal technology: IGCC with/without CCS. Process Saf. Environ. Prot. 2011, 89, 41–52. [Google Scholar] [CrossRef]
- Stehlık, P. Contribution to advances in waste-to-energy technologies. J. Clean. Product. 2009, 17, 919–931. [Google Scholar] [CrossRef]
- Niu, M.; Huang, Y.; Jin, B.; Wang, X. Simulation of syngas production from municipal solid waste gasification in a bubbling fluidized bed using aspen plus. Ind. Eng. Chem. Res. 2013, 52, 14768–14775. [Google Scholar] [CrossRef]
- Branchini, L. Waste-To-Energy and Gas Turbine: Hybrid Combined Cycle Concept; Springer: Berlin, Germany, 2015. [Google Scholar]
- Fortes, M.; Bojarski, A.D.; Velo, E.; Nougues, J.M.; Puigjaner, L. Conceptual model and evaluation of generated power and emissions. Energy 2009, 34, 1721–1732. [Google Scholar] [CrossRef]
- Reddy, P. Pyrolysis and Gasification Technologies. In Energy Recovery from Municipal Solid Waste by Thermal Conversion Technologies; Taylor & Francis Group: London, UK, 2016; p. 98. [Google Scholar]
- Begum, S.; Rasul, M.G.; Akbar, D.; Ramzan, N. Performance analysis of an integrated fixed bed gasifier model for different biomass feedstocks. Energies 2013, 6, 6508–6524. [Google Scholar] [CrossRef]
- Wang, M.P. Slag behavior in gasifiers. Part I: Influence of coal properties and gasification conditions. Energies 2013, 6, 784–806. [Google Scholar] [CrossRef]
- Young, G.C. MSW gasifiers and process equipment. In Municipal Solid Waste to Energy Conversion Processes, Economic Technical and Renewable Comparisons; Wiley: New York, NY, USA, 2010; p. 210. [Google Scholar]
- Warnecke, R. Gasification of biomass: comparison of fixed bed and fluidized bed gasifier. Biomass Bioenergy 2000, 18, 489–497. [Google Scholar] [CrossRef]
- Dai, Z.; Guo, X.; Gong, X.; Chen, X.; Liu, H.; Wang, F.; Yu, Z. Performance of an entrained-flow gasification technology of pulverized coal in pilot-scale plant. Fuel Process. Technol. 2007, 88, 451–459. [Google Scholar]
- Unger, H.Y.; Frihling, W. Thermodynamic assessment of plant efficiencies for HTR power conversion systems. In Proceedings of the Conference on High Temperature Reactors, Vienna, Austria, 24 April 2002. [Google Scholar]
- Ambar, T.; Chavan, T.; Kavale, M.; Walke, S.M. Simulation of process equipment by using Hysys. In Proceedings of the National Conference on Emerging Trends in Engineering & Technology, Mumbai, India, 12 March 2012. [Google Scholar]
- Robayo, A.L. Process Analysis and Simulation in Chemical Engineering; Springer: Berlin, Germany, 2015. [Google Scholar]
- Reddy, G.K. Water Gas Shift Reaction: Research Developments and Applications; Elsevier: Amsterdam, The Netherlands, 2015. [Google Scholar]
- Denny, K.S.Ng.; Tan, R.R.; Dominic, C.Y.F.; El-Halwagi, M.M. Process Design Strategies for Biomass Conversion Systems; Wiley: New York, NY, USA, 2016. [Google Scholar]
- Er-rbib, C.H. Modelling and simulation of methanation catalytic reactor for renewable electricity storage. Chem. Eng. Trans. Ital. Assoc. Chem. Eng. 2013, 35, 541–546. [Google Scholar]
- Tripodi, A.; Martinazzo, R.; Gianguido, R.; Rosseti, I. Process Simulation for the design and scale up of heterogeneous catalytic process: Kinetic modelling issues. Catalysts 2017, 7, 1–33. [Google Scholar] [CrossRef]
- Wang, G.T. Integrated Gasification Combined Cycle (IGCC) Technologies; Elsevier: Amsterdam, The Netherlands, 2016; p. 397. [Google Scholar]
- Preciado, J.E.; Ortiz Martinez, J.J.; Gonzalez-Rivera, J.C. Simulation of synthesis gas production from steam oxygen gasification of colombian coal using aspen plus. Energies 2012, 5, 4924–4940. [Google Scholar] [CrossRef]
- Holt, N.A.H. Integrated Gasification Combined Cycle Power Plants, Encyclopedia of Physical Science and Technology, 3rd ed.; Academic Press: Pittsburgh, MA, USA, 2001. [Google Scholar]
Figure 1.
Integrated gasification combined cycle schematic diagram.

Figure 2.
Schematic diagram of combined syngas and steam cycle.

Figure 3.
Process flow diagram of integrated gasification combined cycle.

Figure 4.
MSW sizing and shredding flow sheet.

Figure 5.
Air separation unit (ASU) flow sheet.

Figure 6.
Gasification unit flow sheet.

Figure 7.
Syngas cleaning flow sheet.

Figure 8.
Water gas shift (WGS) process sheet.

Figure 9.
Ammonia synthesis process sheet.

Figure 10.
Methanation flow sheet.

Figure 11.
Power generation turbines flow sheet - Stage 1.

Figure 12.
Power generation turbines flow sheet - Stage 2.

Figure 13.
Power generation heat exchange flow sheet.

Figure 14.
Heating and cooling duties of MSW IGCC plant.

Figure 15.
Process stages energy consumption.


Table 1.
MSW gasification operating conditions.
| Pyrolysis Reactions | Operating Temperature (°C) | Operating Pressure (bar) | Heating Rate (°C/s) | Reaction Residence Time (min) |
|---|---|---|---|---|
| Gasification Reaction [18] | >900 | 1–45 | >100 | <0.1 |
Table 2.
Basic reactions for MSW gasification process.
| Chemical Reaction | Activation Energy (KJ/mol) | Reaction Classification |
|---|---|---|
| Gasification Reactions [22] | ||
| C + O2 CO2 (exothermic) | −393 | Complete oxidation |
| C + 0.5O CO (endothermic) | −110.56 | Partial oxidation |
| C + 2H2 CH4 (exothermic) | −74 | Hydrogasification |
| Cx Hy + (x/2) O2 (y/2) H2 + xCO | Dry reforming | |
| C + CO2 2CO | +172 | Boudouard reaction |
| CO + H2O CO2 + H2 | −41 | CO shift reaction |
| C + H2O CO + H2 | +131.2 | Water-gas reaction |
| CH4 + H2O CO + 3H2 | Steam reforming | |
| CO + 3H2 CH4 + H2O | −206.23 | Methanation |
Table 3.
MSW feedstock mass composition analysis [10].
Table 3.
MSW feedstock mass composition analysis [10].
| Base Element | Mass Fraction (wt/wt) |
|---|---|
| Wet Basis | |
| Fixed carbon (FC) | 0.1914 |
| Volatile matter (VM) | 0.2579 |
| Moisture | 0.0369 |
| Ash | 0.035035 |
| Hydrogen | 0.02926 |
| Nitrogen | 0.004419 |
| Chlorine | 0.00052 |
| Sulfur | 0.00891 |
| Oxygen | 0.0218633 |
| Carbon | 0.385 |
Table 4.
Gasifier effluent (Gas A Stream).
| Element | Mass Flow Rate (kg/h) | Mass Fraction |
|---|---|---|
| Nitrogen | 3330.048 | 0.0122 |
| Argon | 4893.22 | 0.01798 |
| Water vapor | 44,201.89 | 0.162 |
| Carbon monoxide | 145,538.74 | 0.535 |
| Carbon dioxide | 65,760.91 | 0.242 |
| Carbonyl sulfide | 21.37 | 0.0000785 |
| Hydrogen sulfide | 1500.38 | 0.0055 |
| Hydrogen | 6926 | 0.02545 |
| Methane | 2.42 | 0.00000891 |
| Total Flow rate | 272,175 |
Table 5.
Energy analysis of air separation unit (ASU) compressors.
| Compressor | Inlet Flow Rate (kg/h) | Inlet Pressure (bar) | Outlet Pressure (bar) | Gas Medium | Work Duty (Horse Power) |
|---|---|---|---|---|---|
| Compressors | |||||
| COMP1 | 480,576.58 | 1.01 | 1.97 | Air | 15,206 |
| COMP2 | 480,576.58 | 1.97 | 3.65 | Air | 14,754 |
| COMP3 | 480,576.58 | 3.65 | 5.13 | Air | 7830 |
| COMP4 | 480,576.58 | 5.13 | 6.22 | Air | 4366 |
| GOXCMP1 | 116,601.36 | 1.1 | 6.5 | Oxygen | 7691 |
| GOXCMP2 | 116,601.36 | 6.5 | 23.08 | Oxygen | 5416 |
| GOXCMP3 | 116,601.36 | 23.08 | 41.03 | Oxygen | 2205 |
| N2CMP1 | 361,096.27 | 1.1 | 5.52 | Nitrogen | 24,200 |
| N2CMP2 | 361,096.27 | 5.52 | 20.7 | Nitrogen | 20,471 |
| N2CMP3 | 361,096.27 | 20.7 | 27.58 | Nitrogen | 3803 |
| Temperature swing adsorber (TSA) | 480,576.58 | 6.3 | 6.3 | Air | −183.16 |
Table 6.
Chemical reactions used in simulation.
| Reaction Type | Specification Type | Reaction Conversion | Base Component | Fraction Conversion | Activation Energy (KJ/mol) |
|---|---|---|---|---|---|
| Gasifier | Fractional conversion | MSW H2O + O2 + N2 + C (ash) | MSW | 0.95 | −131.4 |
| (COMB-A) reactor | Fractional conversion | CO + 0.5O2 CO2 | Carbon monoxide and hydrogen | 1 | −393 |
| H2 + 0.5O2 H2O | −285.8 | ||||
| Combustor | Fractional conversion | CH4 + 2O2 CO2 + 2H2O | Methane | 1 | −890.4 |
| Water gas shift reactors (SHFT1 and SHFT 2) | Temperature approach | CO + H2O CO2 + H2 | Carbon monoxide | 1 | −41 |
| Methanizer equilibrium reactor | Temperature approach | CO + 3H2 H2O + CH4 | Both hydrogen and carbon monoxide | 1 | −205 |
© 2017 by the authors. Licensee MDPI, Basel, Switzerland. This article is an open access article distributed under the terms and conditions of the Creative Commons Attribution (CC BY) license (http://creativecommons.org/licenses/by/4.0/).
Share and Cite
MDPI and ACS Style
Gabbar, H.A.; Aboughaly, M.; Russo, S. Conceptual Design and Energy Analysis of Integrated Combined Cycle Gasification System. Sustainability 2017, 9, 1474. https://doi.org/10.3390/su9081474
AMA Style
Gabbar HA, Aboughaly M, Russo S. Conceptual Design and Energy Analysis of Integrated Combined Cycle Gasification System. Sustainability. 2017; 9(8):1474. https://doi.org/10.3390/su9081474
Chicago/Turabian StyleGabbar, Hossam A., Mohamed Aboughaly, and Stefano Russo. 2017. "Conceptual Design and Energy Analysis of Integrated Combined Cycle Gasification System" Sustainability 9, no. 8: 1474. https://doi.org/10.3390/su9081474
Note that from the first issue of 2016, this journal uses article numbers instead of page numbers. See further details here.