Article

Establishing a Framework to Evaluate the Effect of Energy Countermeasures Tackling Climate Change and Air Pollution: The Example of China

1
Institute of Energy, Environment and Economy, Tsinghua University, Haidian District, Beijing 100084, China
2
China Automotive Energy Research Center, Tsinghua University, Haidian District, Beijing 100084, China
*
Author to whom correspondence should be addressed.
Sustainability 2017, 9(9), 1555; https://doi.org/10.3390/su9091555
Submission received: 8 July 2017 / Revised: 18 August 2017 / Accepted: 29 August 2017 / Published: 11 September 2017

Abstract

:
Due to the large-scale utilization of high-carbon fossil energy, considerable amounts of critical air pollutants (CAPs) and greenhouse gas (GHG) have been emitted, which has led to increasingly serious global climate change and local air pollution problems. Given that climate change and air pollution have the same source, energy systems, the rational development and use of energy for collaborative governance should be emphasized to solve these problems in parallel. This paper presents a multi-dimensional, multi-perspective and achievable analysis framework to quantitatively evaluate the emission reduction effects of energy countermeasures aimed at tackling climate change and governing air pollution in support of sustainable development. As a typical developing country pursuing sustainable development, China is taken as an example to demonstrate an application of the proposed framework to assess the emission reduction effects of energy countermeasures issued for tackling climate change and governing air pollution on CAPs and GHG. The results indicate that the key energy actions proposed in this paper would result in emission reductions of approximately 6 million tons (Mt) of CAPs and 575 Mt of GHG in 2016. By 2020 and 2030, emission reductions of 12 Mt of CAPs and 1094 Mt of GHG and of 21 Mt of CAPs and 1975 Mt of GHG, respectively, will be achieved. The proposed framework can effectively help China identify the emissions reduction effect of a given energy countermeasure and support the development of policy describing the next steps for tackling climate change and haze pollution. The proposed framework in this paper is also beneficial for countries similar to China in their efforts to simultaneously address climate change and improve air quality.

1. Introduction

As the population of the world increases and the economy of the world prospers, and especially as developing countries advance, energy needs have increased significantly. Between 1971 and 2015, the global total primary energy consumption increased significantly by a factor of almost 2.6 [1,
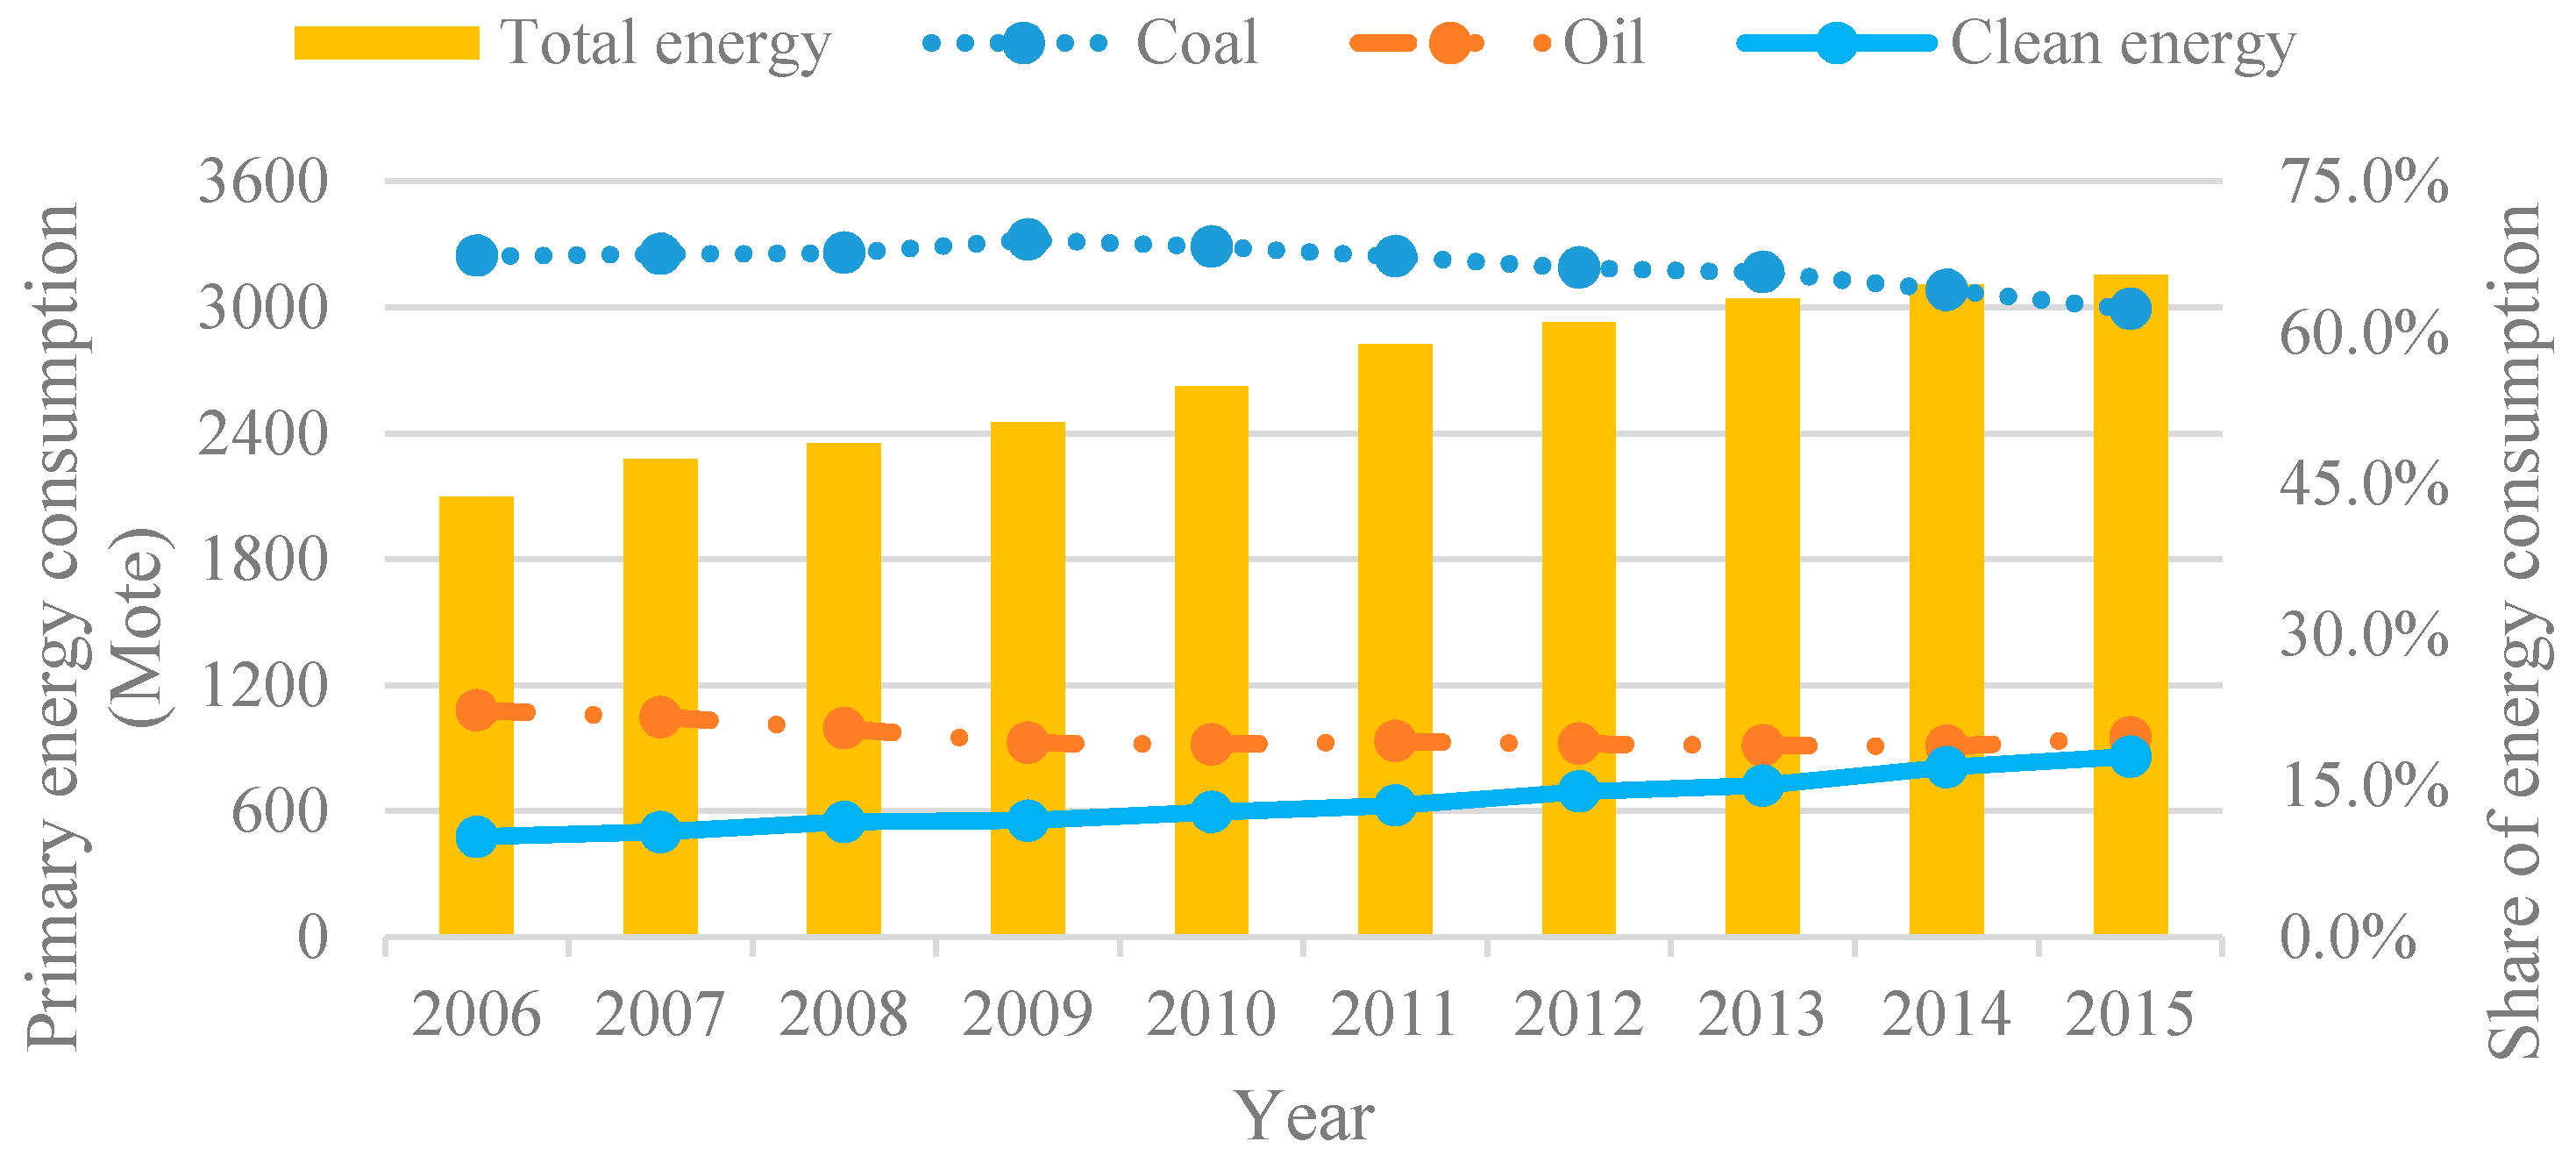
2]. The share of high-carbon fossil energy sources, such as coal and oil, is gradually decreasing, while other relatively low-carbon energy sources grow rapidly, but the former still dominates the world total primary energy consumption, accounting for more than 60% [2,3,
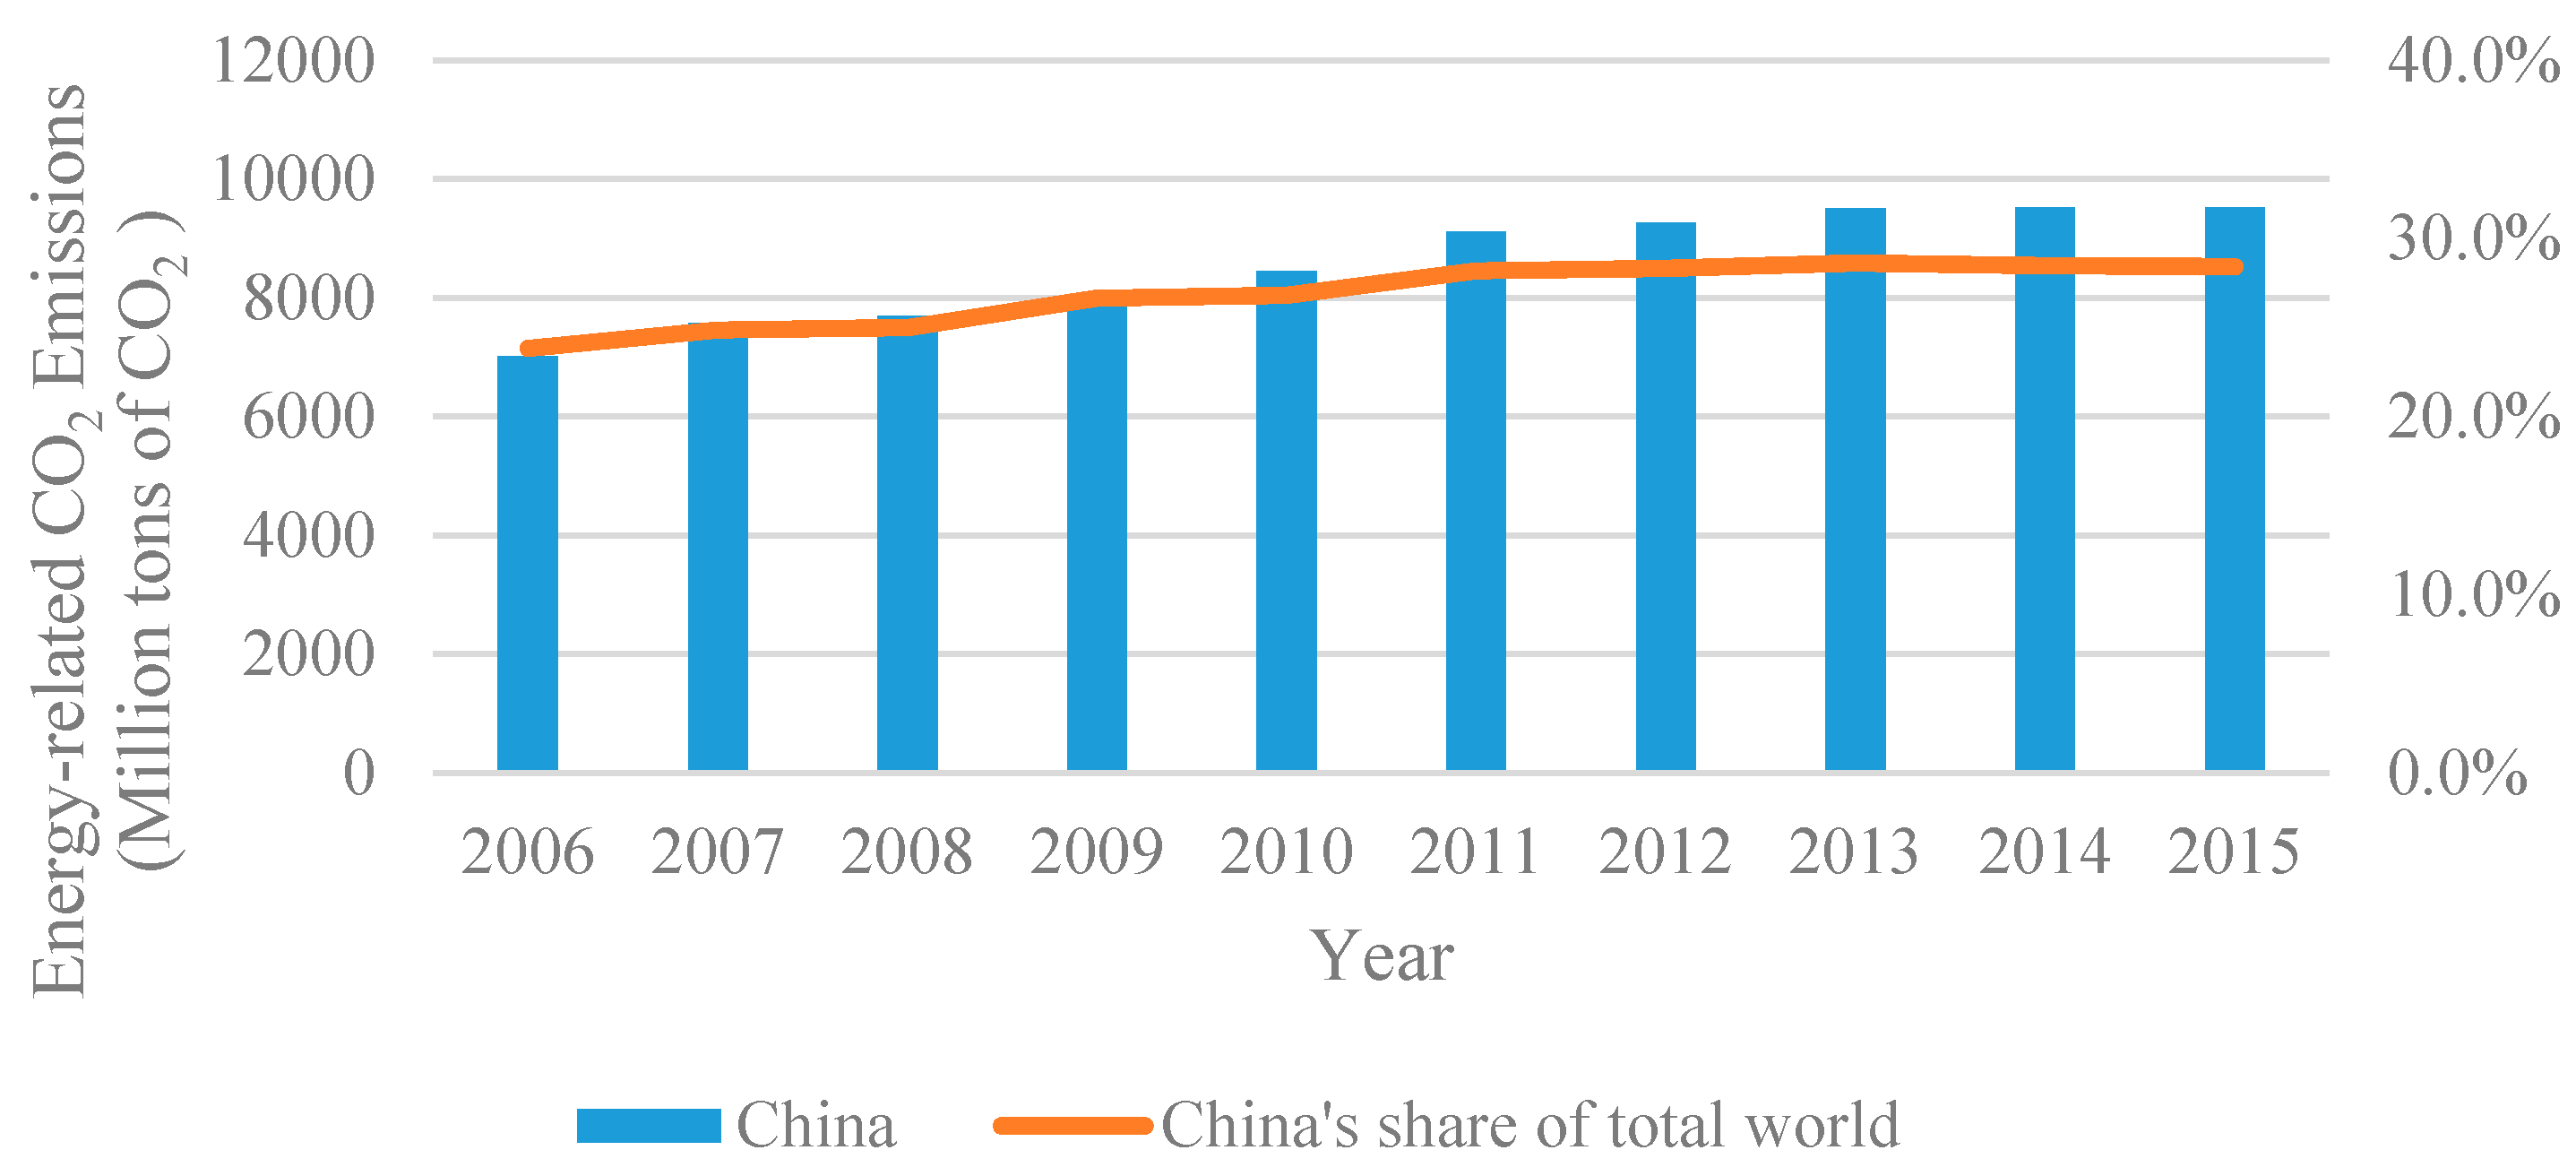
4]. Due to the heavy utilization of fossil energy, high-carbon energy structures and the number of ways in which energy is used, enormous quantities of greenhouse gas (GHG) and critical air pollutants (CAPs) have been released. Energy-related GHG emissions accounted for the largest share of global anthropogenic GHG emissions, approximately 68%, and directly contribute to climate change [4,5]. Although coal represented approximately 29.2% of the world total primary energy consumption in 2015, coal accounted for approximately 46% of the global CO2 emissions, representing the largest share of GHG emissions due to its heavy carbon content per unit of energy released [5,6,
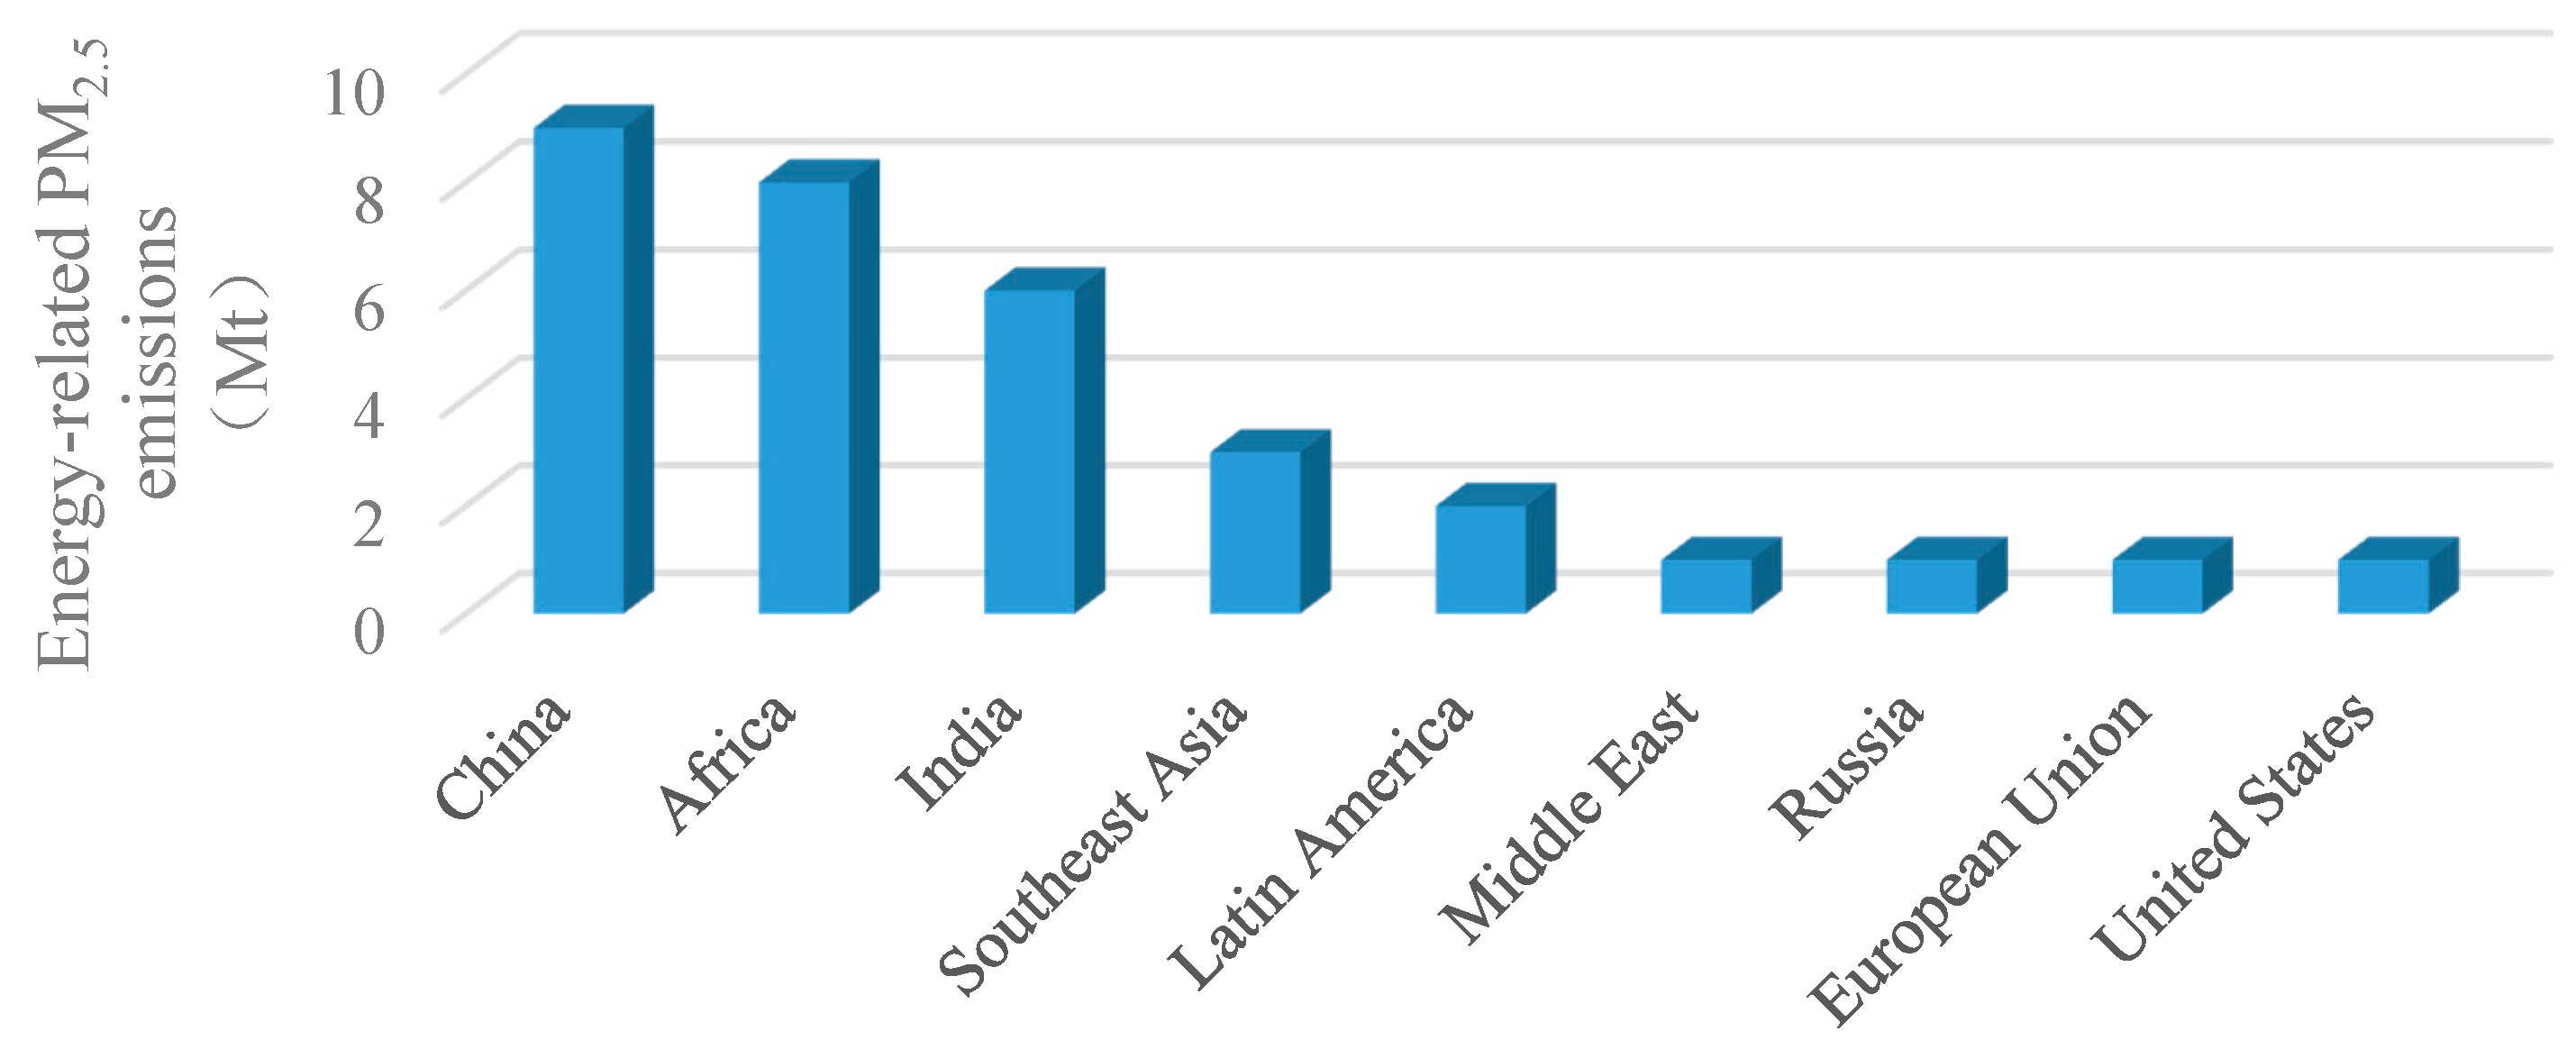
7]. Energy utilization is an important source of large quantities of directly emitted hazardous air pollutants such as particulate matter (PM, PM2.5 specifically) and sulfur dioxide (SO2), and energy use was responsible for approximately 85% and almost 99% of the of global emissions of each of these pollutants, respectively, in 2015 [7,8].
As large quantities of GHG, predominantly CO2, and CAPs have been released, increasingly serious climate change and air pollution (haze pollution especially) problems have arisen. For the past few decades, changes in climate have caused various impacts on natural and human systems on almost all continents and across the oceans [4,9,10,11]. Climate change is disrupting national economies and affecting lives, costing people, communities and countries dearly today and even more tomorrow. Simultaneously, in recent decades, air pollution has produced significantly adverse impacts on human health and the environment (as listed in Appendix A Table A1) [7,8,9,12]. In particular, many areas have suffered from serious haze disasters, such as the Donora smog event of 1948, the Great Smog of London in 1952, and the severe haze event in Beijing in 2013. These events greatly affect daily life, human health and can even cause many deaths [13,14,15].
Due to the increasing appeal of a high standard of living and the urgent duty of countries to pursue the sustainable development of the economy, society, and environment, actively addressing climate change and air pollution are necessary actions [9,16,17,18]. Given that climate change and air pollution have the same source, methods to address these problems should focus on the rational development and utilization of energy for collaborative governance, which can generate environmental benefits [19,20,21]. As the world actively works to address the risks of climate change and air pollution, there is growing concern about initiating rational energy countermeasures that achieve environmental objectives without undermining the growth of the global economy and the aspiration for a better quality of life for all. Numerous studies have been conducted to analyze the links between energy, climate change and air pollution and to assess the synergies between addressing climate change and air pollution [22,23,24]. Apsimon et al. [22] examines the interactions between strategies designed to improve air quality and those addressing climate change, analyses the benefits of combined strategies with greater attention to the overall environmental impacts, and focuses on finding “win–win” solutions for Europe. Another study conducted by Zeng et al. [23] aimed to design a co-control plan using a linear programming method for local air pollutants and CO2 reduction. The case study in Urumqi, a city in China, showed that technical reduction measures, such as energy recycling, as well as energy efficiency improvements and resource recycling measures have been shown to be control options that contribute to both reductions in local air pollutants and CO2. As demonstrated by Maione et al. [24], coordinated actions that take into account air quality-climate linkages examined from a policy perspective are required based on the Integrated Assessment Modeling (IAM) model to achieve win–win scenarios. Most previous studies have investigated the co-benefits, including environmental benefits and health benefits, of addressing climate change and air pollution in parallel using simulation models, such as the long-range energy alternatives planning (LEAP) model and the Asia-Pacific Integrated Model (AIM/Enduse) model based on scenario settings. He et al. [25] adopted an energy projection model, an emission estimation model, an air quality simulation model and a health benefit evaluation model for assessing the co-benefits achieved under different energy policies in China by 2030. In another study, Xie et al. [26] evaluated the synergies of climate change and air pollution in parallel using a LEAP model based on scenario simulations of energy consumption in Beijing. To analyze the potential and cost to reduce air pollutants while achieving the 2 °C global temperature change target relative to pre-industrial levels, Hanaoka et al. [27] used a bottom-up optimization model, AIM/Enduse (Global), based on emission constraint scenarios and carbon tax scenarios. From an international perspective, there is a gap in the knowledge regarding establishing a simple and practical analytical framework focusing on quantitatively evaluating the effect of specific energy countermeasures aimed at tackling climate change and air pollution based on the characteristics of the existing energy structure. The current study places emphasis on establishing a multi-dimensional, multi-perspective and achievable framework for the quantitative evaluation of energy countermeasures that intend to achieve the reduction of GHG and CAPs emissions for the sustainable development of the world, especially for developing countries facing these challenges.
The goal of this study was to provide an aid in planning energy-related countermeasures aimed at developing a coordinated response to climate change and air pollution while guaranteeing the sustainable development of the economy and society. This article is structured as follows. Section 2 presents a background on energy consumption, and GHG and CAP emissions in China. Section 3 proposes a detailed analytical framework for evaluating the effects of energy countermeasures on simultaneously tackling climate change and air pollution. In Section 4, the proposed analytical framework is used to evaluate a typical case study. Section 5 presents lessons for countries similar to China. The paper ends with concluding remarks for decision-making.

2. Background on Energy Consumption, GHG and CAP Emissions in China

2.1. Energy Consumption in China

Over the past few decades, increased energy consumption has resulted from the development of the global economy. Based on the purchasing power parity valuation of economies’ GDPIs, the GDP shares of emerging markets and developing economies in terms of aggregate GDP was 50.4% in 2013, exceeding that of advanced economies [28]. With the rapid economic development in emerging markets and developing economies represented by China and India, more energy resources (high-carbon fossil energy especially) will be consumed. For example, in 2015, China consumed approximately 3100 Million tons oil equivalent (Mtoe) of energy resources, dominated by coal and oil (see Figure 1) [2,29,30], accounting for more than one fifth of the total global energy consumption. Moreover, developing countries, represented by China and India, are estimated to account for the most growth in the world total energy consumption in the future [2,6].

2.2. GHG Emissions in China

The energy sector is an engine of economic and social progress but is also the largest source of GHG and CAPs resulting from human activity, mainly from the combustion of high-carbon fossil fuels. GHG emissions have increased and air quality has deteriorated while the economy has grown continuously. Though a large amount of energy-related GHG is emitted in developed countries, GHG emissions are also heavily concentrated in developing countries [7]. Moreover, the increases in GHG emissions in many developing countries have been rapid and have volumetrically outweighed the declines seen in a number of developed countries. As a typical developing country, China has played an important role in emitting CO2, a main GHG. In 2015, China emitted approximately 9500 Million tons (Mt) CO2 eq., with an annual increase of 3.6% over the past decade (shown in Figure 2) [2,6,30]. The share of the emissions of China relative to global CO2 emissions increased to almost 28.4% in 2015, giving China the status of one of the world’s most carbon-intensive economies.

2.3. CAP Emissions in China

Accompanying economic development and energy consumption, three key air pollutants, SO2, nitrogen oxides (NOx) and PM (PM2.5 specifically), are emitted. SO2 and NO2 are precursors to the formation of secondary PM. These are the most damaging of the air pollutants derived from energy activities. In 2015, the energy sector was responsible for over 80 Mt of SO2 emissions and 107 Mt of NOx emissions, mostly from industry, power and the transport sector in developing countries [7]. Emissions of PM2.5 are more heavily concentrated in developing countries represented by China than many other major energy-related air pollutants. As illustrated in Figure 3, in 2015, China emitted approximately 9 Mt of PM2.5, a main pollutant impacting air quality, which accounted for approximately 27.3% of global emissions. As in many other developing countries, the PM2.5 concentration in China is high, with an annual median concentration 59 µg/m3 [12]. Large parts of the population in many cities and beyond live with a level of air quality that does not comply with the WHO guideline for average annual PM2.5 concentrations [12,31]. Air pollution represents the biggest environmental risk to health. In 2012, one out of every nine deaths was the result of air pollution-related conditions [7,12]. The shares of deaths attributable to air pollution in 2012 are shown in Appendix B Figure A1. The burden of disease due to air pollution is heavily skewed towards Africa and Asia (China and India, in particular), and the air pollution disease incidence in these countries accounts for approximately 80% of the global total [7,32,33]. Accordingly, the energy sector must be at the forefront of any strategy to improve air quality, and such considerations are indeed increasingly motivating policymaking in many countries.

3. The Development of a Conceptual Framework

3.1. Introducing an Analytical Framework for Effect Evaluation

Given the status of the energy sector, increasing attention is devoted to an energy transition focusing on reducing high-pollution energy consumption and increasing clean and low-carbon energy use to reduce GHG and CAPs emissions. Based on identifying the characteristics of the existing energy consumption of developing countries and reviewing the experiences of developed countries in addressing energy transition challenges [34,35,36], achieving an energy transition mainly relies on solutions and measures in two ways. First, improving energy efficiency reduces the consumption of energy, especially of high-pollution energy. Second, developing clean and low-carbon energy to replace high-pollution energy optimizes the energy structure. Aiming to investigate suitable energy countermeasures, multi-dimensional, multi-perspective, practical and measurable analysis framework is established to identify the effects of these countermeasures accordingly, as displayed in Figure 4. In this study, GHG only includes CO2, and CAPs include SO2, NOx and PM2.5.

3.1.1. Promoting the Clean and Efficient Use of Coal

Burning coal is the primary source of environmental pollution from energy use. The highest use of coal resources is in coal-fired power plants and coal-fired industrial boilers, which are the two main emission sources of GHG and CAPs [36,37,38]. In China, CO2, SO2, NOx and PM2.5 emissions from coal use account for 80%, 93%, 70% and 65% of total energy-related emissions, respectively [39]. Currently, most of the power in China comes from coal-based electricity generation (more than 75%), approximately 6107 TWh in 2015 (ranking first in the world). The power generation efficiency of coal is approximately 38% on average, which is low relative to international levels, approximately 43% [1,40,41]. As a primary heat supply for industries in China, the thermal efficiency of coal-fired industrial boilers is also relatively low compared to international levels, an average of approximately 60–65% [38,42,43], as presented in Table 1. Given the endowment of this resource, coal-fired power plants and coal-fired industrial boilers will still be important components of the energy supply for a long time to come [44,45]. However, the utilization efficiency of coal is relatively low. The lack of energy efficiency in existing coal-fired power plants and coal-fired industrial boilers has resulted in large amounts of waste and pollutant emissions [46,47]. To quickly achieve energy savings and emission reduction, actively promoting and implementing the clean and efficient use of coal to increase energy efficiency is necessary.

3.1.2. Increasing the Use of Natural Gas to Replace Coal

Due to a higher calorific value and lower carbon content, natural gas (NG) is a cleaner and more efficient energy source than other fossil fuels. With the same energy consumption, the quantity of pollutants emitted from NG combustion is much lower than that of other typical fossil fuels such as coal and oil, as shown in Table 2 [48,49]. If NG were to replace coal, not only would the energy consumed and pollutant emissions be reduced but other benefits would also be seen, such as reducing the time devoted to housework and the promotion of health and convenience (presented in Table 3) [48]. Although renewable energy resources are widely recognized as the most efficient and effective solutions to sustainable development, progress in developing these solutions has been slow due to technology and cost issues as well as other risks [50,51]. Achieving a transition from the current era, which is dominated by high-carbon fossil fuels, to a green and low-carbon future will be a long-term project. NG has remarkable advantages, and increasing its use as a transitional energy solution to help bridge this gap is one realistic option [52,53,54]. As stated previously, the energy mix of many countries, including China, is dominated by coal, and switching coal with gas has great potential to promote energy savings and emission reduction.

3.1.3. Promoting the Upgrade of Petroleum Product Standards

Vehicles are not only the main consumers of the total energy used in the transportation sector but are also the main contributors of GHG and CAP emissions from this sector, accounting for the largest share (over 50%) of NOx, 20% of SO2 and 15% of PM2.5 [7]. As the number of vehicles increases, the effect will be bigger. Experimental research and international experience show that fuel quality is a key factor in vehicle emissions control. One approach typically used in developed countries to halt this trend is to impose or strengthen fuel quality standards (and/or emissions standards for new vehicles). Table 4 presents the national fuel standard and sulfur content requirements for gasoline and diesel fuel in China, which fall behind those of developed regions such as the European Union, which implemented Euro IV (50 ppm) and V (10 ppm) in 2005 and 2009, respectively [55]. Compared with vehicles in Europe, vehicles in countries such as China have produced more emissions such as SO2. Promoting a fuel standard is a viable option to improve the use of petroleum, which is helpful in reducing emissions.

3.1.4. Replacing Petroleum Products with Alternative Low-Carbon Fuels

The transport sector, led by road transportation (vehicles specifically), is a main contributor to the total CAP and GHG emissions in a country. As learned from developed countries, there is an urgent need to expand the use of less polluting and more efficient alternative fuel sources. Compared with diesel and gasoline, NG and electricity are inherently clean-burning energy sources due to their lower carbon contents (or no carbon content). Replacing traditional gasoline and diesel fuels with NG and electricity will have an important impact on reducing CAP and GHG emissions from vehicles [7,56,57]. Because they are clean burning and offer power supply advantages (see Table 2), NG vehicles (NGVs) and electric vehicles (EVs) are viable clean alternatives to traditional fuel vehicles that will offer major emissions reduction potential.

3.1.5. Improving the Concentration Utilization of Rural Energy

Rural energy consumption occupies a large proportion of the energy structure in many countries, including China. Rural energy consumption is also an important area in energy sustainable development strategies. In recent years, although the rural energy consumption structure has changed significantly, and low-quality energy sources such as firewood, straw and coal still account for a large proportion of the total structure. The proportion of high-quality energy sources, such as gas, is very low [58,59,60]. Compared with the concentration of urban energy use, rural energy use is more dispersed and is not conducive to improving energy efficiency or achieving energy conservation and emission reduction. In the event that a rural energy structure cannot be changed dramatically in a short period of time, improving the centralization of energy use such as implementing centralized heating and gas supplies is also a realistic and effective approach.
For many villagers living in the countryside, due to resource limitations, these regions have not achieved central heating and still employ traditional methods of heating with low-quality energy sources such as coal. This traditional heating supply in rural areas plays a key role in the use of charcoal. The traditional heating methods used in rural areas are not only prone to health risks (especially gas poisoning) and result in haze events but also easily waste resources and cause air pollution. Changing traditional heating methods and implementing central heating in rural areas can bring multiple benefits, including improving energy efficiency savings, reducing atmospheric pollution, improving the quality of life of rural residents and reducing heating costs.
Cooking and hot water supply in rural areas are also important contributors to the use of charcoal. Daily activities such as cooking and hot water supply in rural areas use low-efficiency energy sources such as coal as fuel, which not only cause haze but also result in the waste of resources and cause serious environmental problems. Implementing a centralized gas supply can also bring multiple benefits, including reducing the emission of GHG and CAPs, reducing deforestation to protect the environment, reducing energy costs, saving labor time, improving the living conditions of residents in rural areas, and improving the quality of life of rural residents.
In addition to the emission of large amounts of GHG and CAPs caused by burning coal, large amounts of straw were wasted by biomass combustion in rural areas in many countries, including China. Straw production has increased year by year, and large amounts of straw are abandoned or burnt, not only polluting the environment and posing a serious threat to traffic safety but also resulting in a waste of resources. Straw is a valuable resource that can be substituted with clean energy, such as gas. Switching from straw to clean energy can increase the supply of clean energy, reduce the waste of resources and reduce the emission of GHG and CAPs due to the substitution of coal with cleaner energy.

3.2. Evaluation Methods

Combined with the analysis framework above and based on a bottom-up method, an emission factor method and a “with or without” comparison method, this section establishes evaluation methods aiming to quantify the environmental benefits of implementing energy measures for tackling climate change and air pollution.
For the energy action entitled “promoting the clean and efficient use of coal”, the emission reduction effect on CAPs and GHG can be calculated using Equation (1):
E R E 1 t n = ( E C 1 t 0 E C 1 t n ) × E F 1 t 0
where ∆ERE1tn is the amount of reduction in GHG and CAP emissions due to adopting the “promoting the clean and efficient use of coal” energy action in year tn; EC1t0 is the amount of coal consumed to provide energy services such as electricity and heating supply without adopting this energy action in year t0; EC1tn is the coal consumed to provide energy services such as electricity and heating supply when adopting this energy action in year tn; and EF1t0 represents the emission factors of different energy services without adopting this energy action in year t0.
For the “increasing the use of NG to replace coal” energy action plan, the emission reduction effect on CAPs and GHG is calculated as Equation (2):
E R E 2 t n = E C R 2 t n × E F 2 t 0 E C 2 t n × E F 2 t n
where ∆ERE2tn is the amount of reduction in GHG and CAP emissions due to the adoption of the above energy action in year tn; EC2tn is the NG consumed to provide energy services such as electricity and heating supply when implementing this energy action in year tn; ECR2tn is the reduction of coal consumption due to NG use in year tn; EF2t0 represents the emission factors of different energy services without implementing this energy action in year t0; and EF2tn represents the emission factors of different energy services with implementing this energy action in year tn.
For the energy action plan entitled “promoting the upgrade of petroleum product standards”, the emission reduction effect on CAPs and GHG can be calculated using Equation (3):
E R E 3 t n = E C 3 t n × ( E F 3 t 0 E F 3 t n )
where ∆ERE3tn is the amount of reduction in GHG and CAP emissions due to the implementation of the above energy action in year tn; EC3tn is the amount of gasoline and diesel fuel consumed to provide energy services such as transportation when implementing this energy action plan in year tn; EF3t0 represents emission factors for fuel use without implementing this energy action in year t0; and EF3tn represents emission factors for fuel use when implementing this energy action in year tn.
For the energy action entitled “replacing petroleum products with alternative low-carbon fuels”, the emission reduction effect on CAPs and GHG is calculated as Equation (4):
E R E 4 t n = E C R 4 t n × E F 4 t 0 E C 4 t n × E F 4 t n
where ∆ERE4tn is the amount of reduction in GHG and CAP emission due to implementing the above energy action plan in year tn; EC4tn is the amount of low-carbon fuel consumed to provide energy services such as transportation when implementing this energy action in year tn; ECR2tn is the reduction of petroleum product consumption due to alternative fuel use in year tn; EF2t0 represents emission factors for fuel use without implementing this energy action in year t0; and EF2tn represents emission factors for fuel use when implementing this energy action in year tn.
For the energy action entitled “improving the centralized use of rural energy”, the emission reduction effect on CAPs and GHG is calculated in three parts. Regarding the promotion of centralized heating and gas supplies, the calculations of emission reduction effects, ∆ E R E 51 t n and ∆ E R E 52 t n , can be performed using Equations (1) and (2), respectively. Regarding the promotion of the clean utilization of straw, the emission reduction effect is calculated as in Equation (5):
E R E 53 t n = E C R 53 t n × E F 53 t 0 E C 53 t n × E F 53 t n
where ∆ERE2tn is the amount of reduction in GHG and CAP emissions due to adopting the energy action entitled “increasing the use of NG to replace coal” in year tn; EC2tn is the NG consumed to provide energy services such as electricity and heating supply when implementing this energy action in year tn; ECR2tn is the reduction in coal consumption due to the NG use in year tn; EF2t0 represents emission factors for different types of energy services without implementing this energy action in year t0; and EF2tn represents emission factors for different types of energy services when implementing this energy action in year tn.
Combining Equation (5) with Equations (1) and (2), the overall emission reduction effect on CAPs and GHG due to the energy action entitled “improving the centralization of rural energy” is calculated as Equation (6):
E R E 5 t n = E R E 51 t n + E R E 52 t n + E R E 53 t n
Based on the equations above, the sum of the CAP and GHG emission reduction effects of a series of energy action plans proposed to tackle climate change and air pollution is calculated, as in Equation (7):
E R E s t n = E R E 1 t n + E R E 2 t n + E R E 3 t n + E R E 4 t n + E R E 5 t n +

4. Evaluation of the Reduction Effect of Energy Actions on GHG and CAP Emissions in China

Many countries, including China, are now facing big challenges in tackling energy and environmental issues while pursuing sustainable development. As a typical developing country, China has taken many steps to implement a series of actions promoting the transformation and revolution of the energy structure to attain energy conservation and emission reductions. Based on the characteristics of energy consumption, GHG and CAP emissions in China, according to the analysis framework presented previously, the “upgrading, replacing and centralizing” actions that need to be carried out to attain the energy transition (as listed in Table 5) are as follows: (a) Action 1 is to enhance large coal-fired plants and limit small plants; (b) Action 2 is to implement a green boiler project; (c) Action 3 is to replace coal with NG in urban and rural areas; (d) Action 4 to accelerate the upgrading of petroleum products; (e) Action 5 is to promote the development of NGVs; (f) Action 6 is to promote the electrification of city public automobiles; and (g) Action 7 is to improve the centralization of rural energy use. Based on the calculation methods presented previously and related data (see Appendix A Table A2 and Table A3), the emission reduction effect of the implementation of these energy actions in China will be identified.

4.1. Emission Reduction Effect of Proposed Energy Countermeasures in China

4.1.1. Enhancing Large Coal-Fired Plants and Limiting Small Plants

The Chinese government has long been aware of the problem of coal-fired plants in terms of negative scale effects, resource waste and environmental pollution. Countermeasures aiming to achieve energy consumption and major pollutant emission reduction targets during the 11th Five-Year Plan, such as the plan to enhance large coal-fired plants and limit small coal-fired plants, were introduced by the Chinese government in 2006 [61,62]. The emission reduction effect of enhancing large coal-fired plants and limiting small plants is presented in Figure 5 for three period 2006–2015, during which time this action achieved an emission reduction of 19.9 Mt of SO2, 12.1 million tons of NOx, 1.8 Mt of PM2.5 and 499.2 Mt of CO2.

4.1.2. Implementing the Green Boiler Project

Given that many measures have been taken to reduce the emissions from coal-fired plants and that these measures have achieved a certain effect, the emissions from another main source of pollution, coal-fired industrial boilers, have become a focus of the next stage of pollution control in China. Considering that more efficient and low-emission boilers are being developed, implementing green boiler projects by taking measures such as improving quality standards and providing policy incentives will promote the application of large-capacity and high-quality boilers. The average thermal efficiency of coal-fired industrial boilers will increase to 65.3% in 2016, 68.0% in 2020, and 74.6% in 2030, from 64.6% in 2015 [63,64]. Such a plan will promote energy efficiency and reduce pollution and represents an effective way to achieve the high-efficiency and low-emission use of coal. Based on the amount of coal consumption and change in emissions per unit of coal use, the emission reduction effect created by implementing the green boiler project is estimated (illustrated in Figure 6). In 2016, an emission reduction of 0.4 Mt of CAPs and 26.1 Mt of GHG was achieved. These reductions will reach 0.3 Mt of CAPs and 18.6 Mt of GHG in 2020 and 0.2 Mt of CAPs and 8.3 Mt of GHG in 2030.

4.1.3. Replacing Coal with NG in Urban and Rural Areas

Considering the significantly lower emissions of NG compared to coal, China is increasing its efforts to replace coal with NG in urban and rural areas. This replacement is taking place in several sectors, including the urban and rural residential sector, coal power sector and coal-fired industrial boiler sector. Taking the urban residential sector as an example, a review of the related policy and plans issued by China indicates that the share of NG used by urban residents in China accounted for 18.7% of the total NG use in 2016, an increase of 6% from 2015 [65,66]. For 2020 and 2030, this share will be 19.2% and 20.7%, respectively. The estimated emission reduction effect of replacing coal with NG based on the amount of NG consumption and the emission reduction factor of fuel substitution is displayed in Figure 7. An emission reduction of 4 Mt of CAPs and 485.3 Mt of GHG was achieved in 2016. By 2020 and 2030, these reductions will be 6.1 Mt of CAPs with 802.6 Mt of GHG and 10.1 Mt of CAPs with 1454.1 Mt of GHG, respectively. The substitution of NG for coal in the city of Urumqi, China, a reduction measure for the co-control plan proposed by Zeng et al. [23], resulted in the reduction of 27.3 thousand tons of SO2, 5 thousand tons of NOx, 9.5 thousand tons of PM10, and 2099.6 thousand tons of CO2. If these estimations are applied to the entire country of China, the results are comparable with those of this study.

4.1.4. Accelerating the Upgrading of Petroleum Product Standards

Given the effects of the implementation of the national fuel standard action in China and the lessons learned from international experience, the new standards for gasoline and diesel fuel are National IV (50 ppm) for 2016, National V (10 ppm) for 2020 and National VI (5 ppm) for 2030, compared to the old National III standard (see Table 4) [67]. Figure 8 presents the emission reduction effect of petroleum standard upgrades in China. Based on the sulfur content requirements of the corresponding national fuel standards and actual fuel use, this emission reduction effect can be evaluated. In 2016, an emission reduction of 12.8 Mt of CAPs was achieved. By 2020 and 2030, these reductions will be 2.4 Mt and 0.3 Mt of CAPs, respectively.

4.1.5. Promoting the Development of NGVs

According to investigations and surveys, the largest number of NGVs in China are compressed natural gas (CNG) taxis, CNG passenger vehicles, CNG buses, CNG trucks (light duty), liquefied natural gas (LNG) buses, and LNG trucks (heavy duty). A review of related policy and plans issued by the Chinese government indicates that the population of NGVs was 5.5 million in 2016 (increasing 10% from 2015) and will grow to 8 million in 2020 and 14 million in 2030 [68]. After obtaining data about the population of NGVs and the emission reduction factor for fuel substitution by such vehicles, the emission reduction effect of increasing NGV use is estimated, as presented in Figure 9. An emission reduction of 0.1 Mt of CAPs and 13.9 Mt of GHG was achieved in 2016, after which 0.2 Mt of CAPs and 23.6 Mt of GHG will be reduced in 2020. By 2030, they will be 0.4 Mt of CAPs and 43.8 Mt of GHG. Given the significant contribution of NGVs, growing the NGV population in future will further reduce CAP and GHG emissions, which will represent a major contribution to emission reductions in China.

4.1.6. Promoting the Electrification of City Public Automobiles

China has prioritized promoting the electrification of city public vehicles (CPVs), including city public buses, taxis, sanitation trucks, shuttle buses and delivery vehicles. A review of the related policy and plans issued by China indicates that population of CPVs was 0.3 million in 2016 and will be 1.1 million in 2020 and 4.8 million in 2030 [69]. After the data on the population of CPVs and the emission reduction factor of fuel substitution by such vehicles have been obtained, the emission reduction effect of CPV use is estimated (shown in Figure 10). In 2016, an emission reduction of 0.3 Mt of CAPs and 0.7 Mt of GHG was achieved. By 2030, these reductions will be 1.3 Mt of CAPs and 9.6 Mt of GHG.

4.1.7. Improving the Concentration of Rural Energy Use

Given the large emission contribution of charcoal burning in rural areas, China is actively taking action to reduce the use of coal, including implementing policy plans and work programs to promote centralized heating with large coal-fired boilers and the increasing use of NG to replace charcoal for cooking and hot water supply [70,71,72]. Taking heating supply for example, a review of the related policy and plans issued by China indicates that the share of charcoal use replaced by centralized heating was 5% in 2016 and will be 15% in 2020 and 35% in 2030. Additionally, China is increasing its efforts to reduce the burning of straw. Switching this practice to clean energy such as gas will not only can reduce the waste of resources and reduce environment pollution but may also increase new supplies of clean energy that can also reduce the emission of GHG and CAPs from coal use. The estimated emission reduction effect of improving the centralization of rural energy use is shown in Figure 11. An emission reduction of 1 Mt of CAPs and 49.2 Mt of GHG was achieved in 2016, and 4.9 Mt of CAPs and 246.8 Mt of GHG will be reduced in 2020. By 2030, these reductions will be 8.7 Mt of CAPs and 459.3 Mt of GHG.

4.2. Overall Effect of Proposed Energy Countermeasures in China

4.2.1. Comprehensive Effects

In addition to the Action 1 energy countermeasure, which has been implemented to tackle climate change and haze pollution in China, other energy countermeasures also significantly contribute to reducing CAP and GHG emissions. Figure 12 shows the estimated overall emission reduction effect of the proposed energy countermeasures. Due to these countermeasures, an estimated emission reduction of 3.3 Mt of SO2, 1.6 Mt of NOx, and 0.8 Mt of PM2.5, i.e., 5.7 Mt of CAPs, was achieved in 2016. Simultaneously, GHG emission were estimated to have been reduced by 574.8 Mt in 2016. By 2020 and 2030, an emission reduction of 12.1 Mt of CAPs and 1093.9 Mt of GHG and an emission reduction of 20.7 Mt of CAPs and 1975.0 Mt of GHG, respectively, will be achieved. This estimate indicates that the emission reduction effect of the energy countermeasures on CAPs and GHG in China is significant.

4.2.2. Maximizing Emission Reductions for Different Targets

As stated previously, the implemented energy actions generate significant environmental benefits with respect to reducing GHG and CAP (PM2.5 especially) emissions. These actions will play a vital role in tackling climate change and haze pollution in China. However, the difference between the emission reduction effects of the different energy actions in terms of PM2.5 and GHG reduction is great, as illustrated in Figure 13. For reducing the emission of GHG in China, the best energy action is Action 7. To reduce PM2.5 emissions in China, the best energy action is Action 4. Therefore, this analysis is helpful for the decision-making body in China to identify key actions and the implementation priority thereof to maximize emissions reductions for different targets.

5. Lessons for Countries Similar to China

Given the increasing attention to the significant impacts of climate change and air pollution, society is increasingly emphasizing finding ways to provide more clean energy for a growing global population while emitting much less GHG and CAPs. The Paris Agreement reached in the 21st Conference of the Parties held in Paris in December 2015 is a major milestone in the effort to combat climate change and will also play a vital role in reducing air pollutants. The ultimate objective, which has already been adopted by the governments of more than 150 countries, is to limit global warming to an average of no more than 2 °C relative to pre-industrial levels [4,18,33]. To achieve the 2 °C target, global anthropogenic GHG emissions must be decreased by 40–70% by 2050 compared to 2010 levels, and emissions levels must be near zero or below zero by 2100 [4]. Many countries, including China, have submitted their Intended Nationally Determined Contributions (INDCs), mainly focusing on achieving peak CO2 emissions, lowering CO2 emissions per unit of GDP, and increasing the share of non-fossil fuels in primary energy consumption. Facing these huge challenges, many countries must take suitable countermeasures, especially from an energy perspective, to guarantee green and low-carbon development.

5.1. Establishing an Analysis Framework

As stated above, the energy countermeasures aimed at addressing climate change and improving air quality implemented in China can play a significant role in reducing CAP and GHG emissions. This finding also means that the analysis framework presented here is helpful for China to identify energy action options and to investigate the order in which the plans should be implemented and prioritized. Many countries similar to China also need to establish an analysis framework based on the characteristics of their domestic energy consumption and GHG and CAP emissions. Based on the analysis framework established here, these countries can make wise decisions on the implementation of suitable energy actions to tackle climate change and air pollution. Additionally, actively promoting the use of energy-saving stoves in rural areas is a way of promoting the clean and efficient use of coal, which is helpful in achieving energy savings and emission reductions. Although the use of such stoves is also an energy action option to reduce CAP and GHG emissions, this action falls outside of the scope of this paper. The analysis framework presented in this paper can serve as a model for countries similar to China.

5.2. Using the Framework to Evaluate the Emission Reduction Effect of Energy Countermeasures

After the analysis framework has been established, the emission reduction effect of energy countermeasures implemented in these countries can be measured using the proposed calculation methods. As with the methods used for China, these calculations could adopt a “with and without” comparison method. A comparison of scenarios with and without the implementation of the given energy actions in a target year allows for the calculation of emission reductions in GHG and CAPs. If the energy countermeasures implemented obtain emission reductions, the comprehensive and collaborative effects of energy actions can be identified. Although this proposed framework is presented for the analysis of the emission reduction effects of energy countermeasures at the country level, the framework can also be used for analyses at the province level or city level if key data can be obtained.

5.3. Identifying Vital Energy Countermeasures with Effect Analysis

The overall emission reduction effect of energy countermeasures implemented can be measured with an analysis of comprehensive effects. This approach will be helpful in identifying the potential to achieve the emission reduction targets of these countries, including China. For example, the Chinese government has made certain energy commitments, such as raising the low-carbon fuel rate to 20% by 2030. These considerations have been taken into account in the case study presented here. The comprehensive effect analysis finds that raising the low-carbon fuel rate can result in significant emission reductions, which is helpful in achieving environmental targets. The energy actions analyzed in this study support the control of CAP and GHG emissions in parallel. Moreover, this analysis can help identify the GHG and CAP emission reduction effect sizes of each energy action, which can help in the investigation of key actions and the identifying implementation priorities. Therefore, action priorities should be identified when energy actions are needed to tackle climate change and to improve air quality. For example, if the work priority is to improve air quality, energy actions contributing to reducing PM2.5 emissions, such as reducing the use of rural charcoal burning, should be prioritized. Similarly, for tackling climate change, energy actions contributing to reducing GHG emissions, such as replacing coal with NG in urban and rural areas, should be prioritized. The effect analysis is also helpful for exploring the order in which energy actions should be taken for different targets to maximize emissions reduction. This effect analysis can identify suitable energy countermeasures while incorporating regional differences. For example, in northern areas, centralized heating is an effective way to reduce GHG and CAP emissions.

5.4. Issuing Assistance Measures to Support the Implementation of Energy Countermeasures

Given the significant emission reduction effect of energy countermeasures, ensuring the implementation of these energy actions is key. Using China as a case study, these countries should take a number of additional measures, such as issuing policies and regulations, to ensure the implementation of these energy countermeasures. When replacing coal with NG in urban and rural areas, for example, measures to support the implementation of this energy action may be necessary, e.g., strengthening the construction of NG infrastructure, adjusting the price of NG to make it competitive, and improving pollutant emission standards to promote the use of NG. If the assistance measures are not powerful enough to ensure the implementation of these actions, the implementation effect of energy actions will be difficult to measure, which will in turn affect the decision-making process on measures to climate change and improve air quality.

6. Concluding Remarks

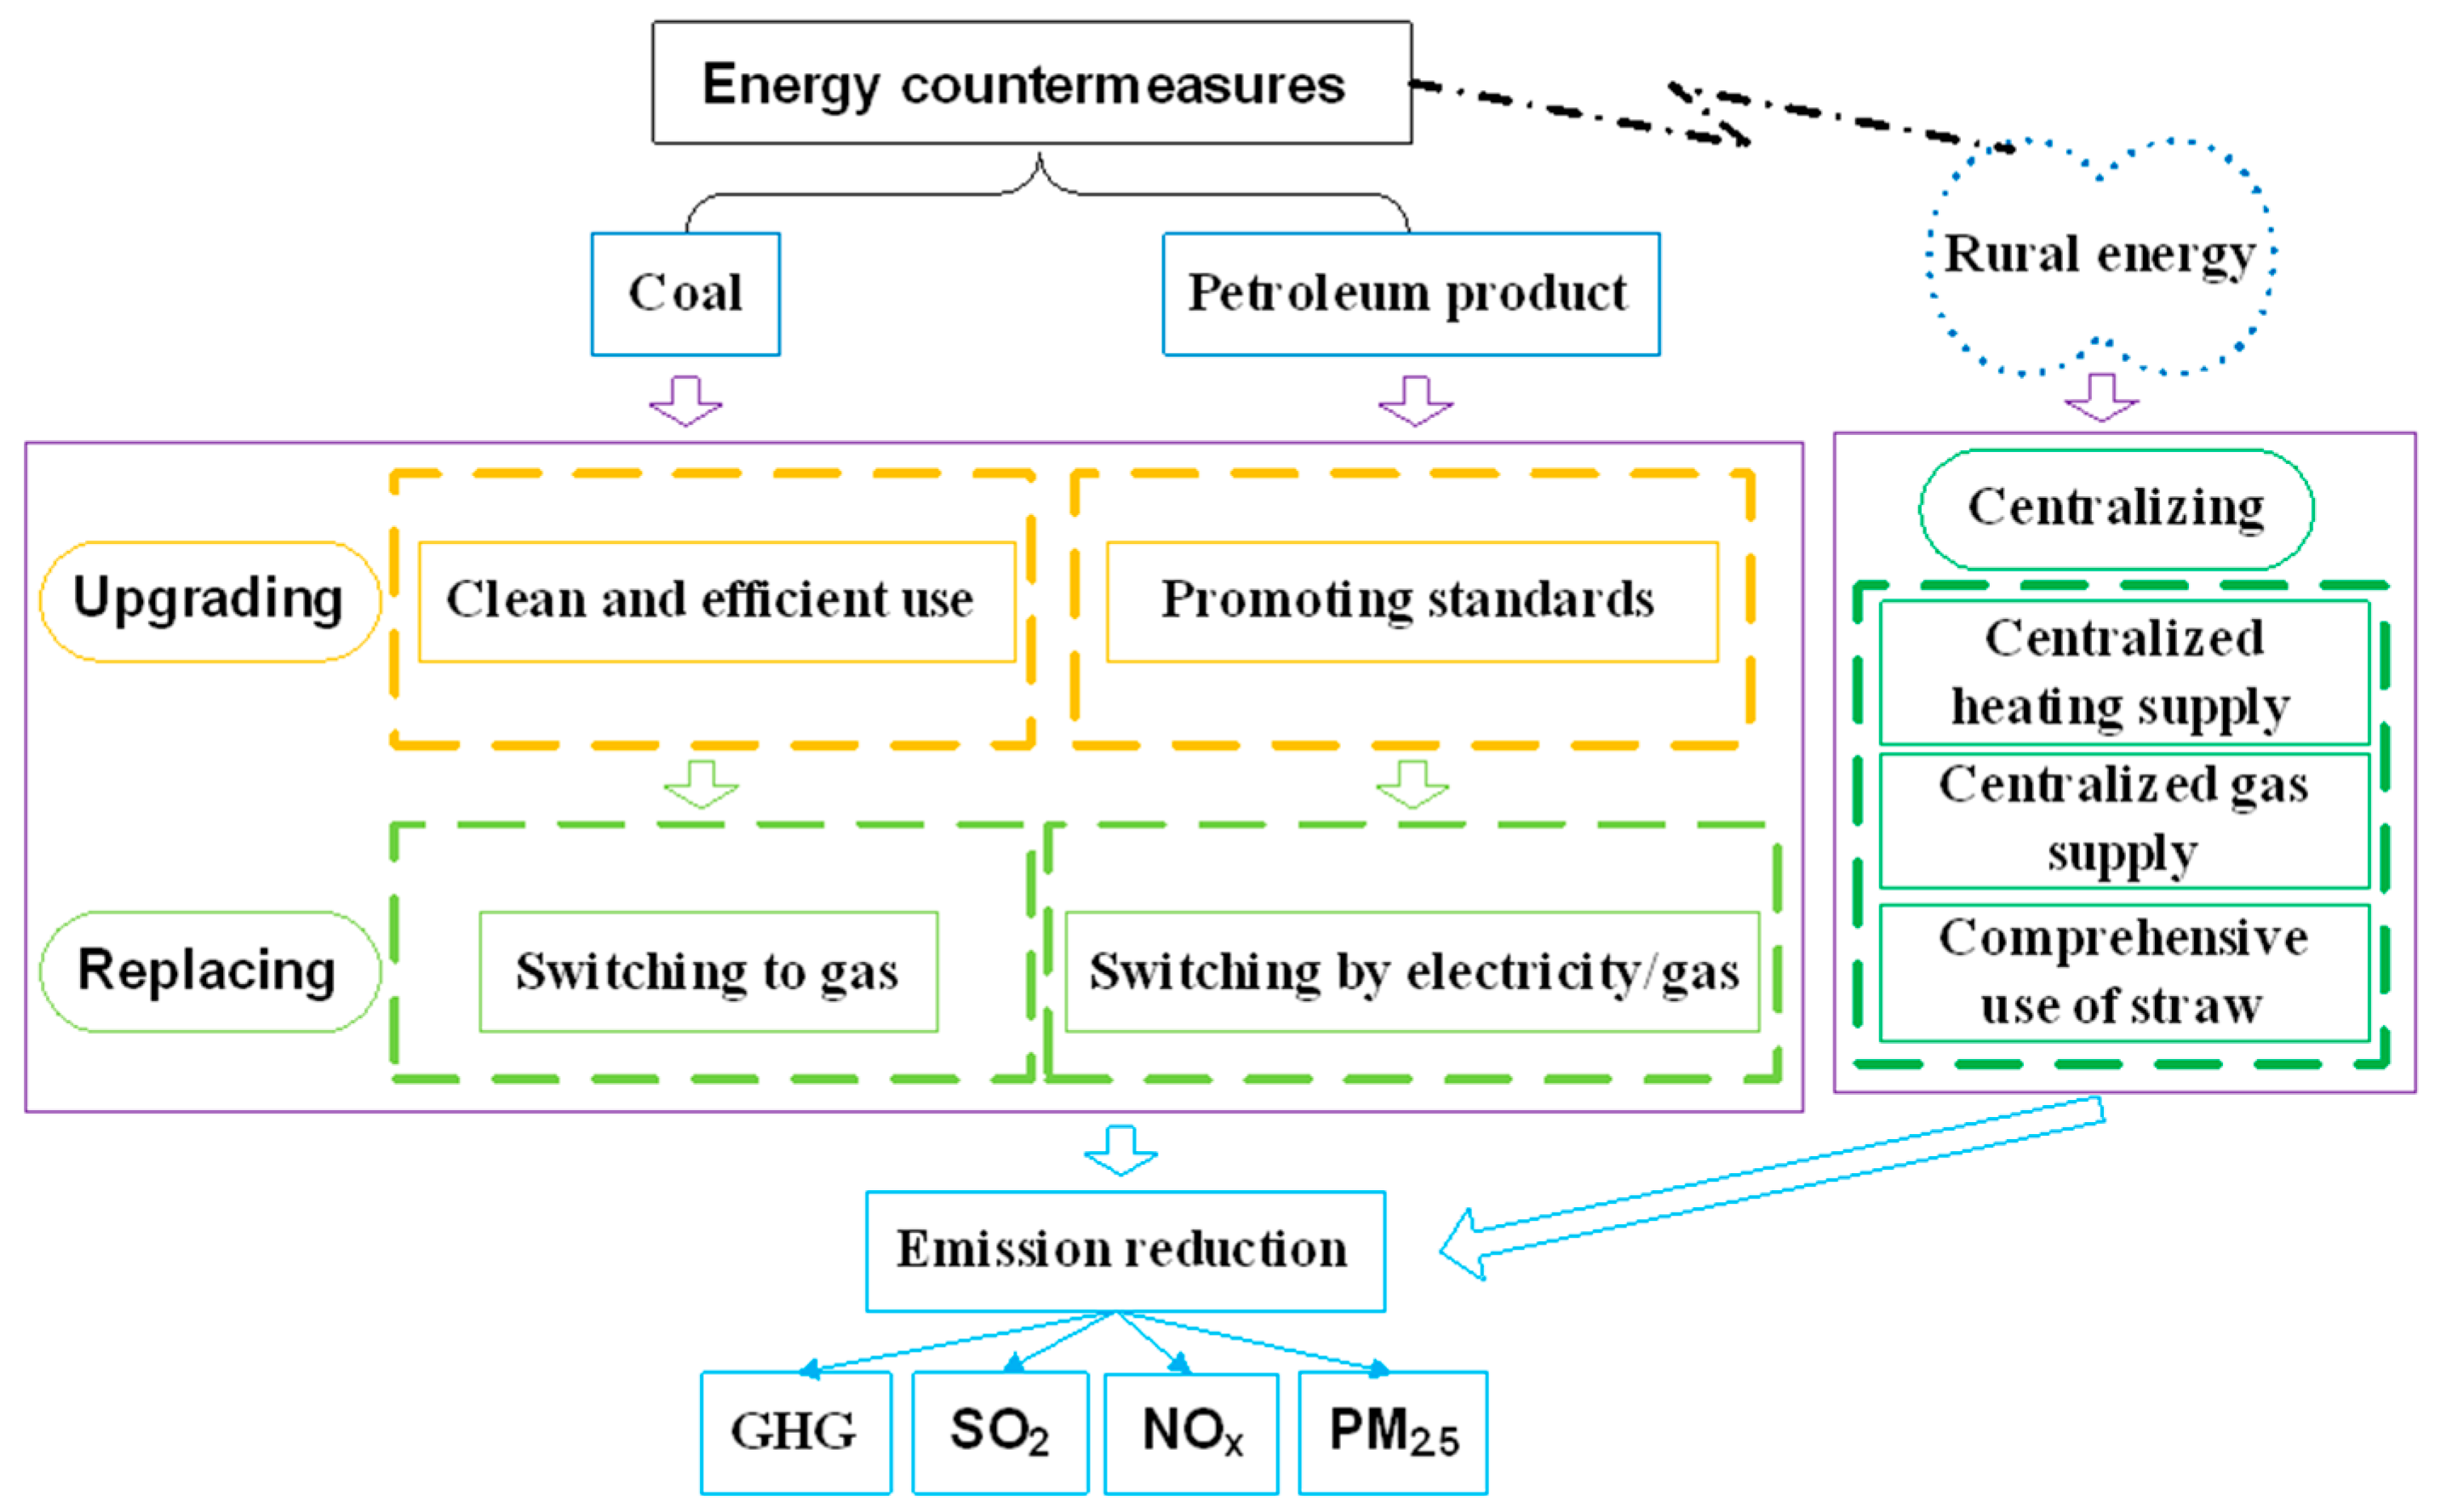
To tackle climate change and air pollution in the pursuit of sustainable development, many countries, including China, are increasing their efforts to develop and implement suitable energy countermeasures. This paper establishes a framework for the quantitative evaluation of the emission reduction effects of energy actions that provide suitable energy countermeasures. This analysis framework focuses on implementing “upgrading, replacing and centralizing” actions to achieve energy transitions based on the characteristics of energy consumption and related GHG and CAP emissions.
As a typical developing country pursuing green and low-carbon development, China is taken as an example to demonstrate the application of the proposed analysis framework to evaluate the effect of the presented energy actions. Using the proposed framework, the emission reduction effects of energy actions implemented in China are estimated. The results indicate that, due to the implementation of the presented energy actions, a significant emission reduction effect on CAPs and GHG has been achieved. There are differences in the emission reduction effects of each energy action, especially for different targets. This finding means that the proposed framework can not only effectively help China identify the effect of a given energy action on reducing GHG and CAP emissions but can also help China identify key actions and their implementation priority and order to maximize emissions reductions for different targets. This framework can help China generate ideas and develop programs to tackle climate change and haze pollution. Moreover, this proposed framework can also help countries similar to China make decisions on suitable energy countermeasures to address climate change and improve air quality.
Based on the analyses presented in this paper, when developing suitable energy countermeasures to maximize emissions reductions, some key actions should be taken. First, priorities should be identified when energy actions are needed to tackle climate change and to improve air quality. Second, the implementation priority and order of energy actions should be evaluated to maximize emission reductions. Third, suitable energy countermeasures should incorporate regional differences. Finally, measures should to be taken to support and ensure the implementation of these energy actions.

Acknowledgments

This project was co-sponsored by the Postdoctoral Science Foundation of China (2017M610096), the National Natural Science Foundation of China (71774095, 71690244 and 71673165) and International Science & Technology Cooperation Program of China (2016YFE0102200).

Author Contributions

Xunmin Ou and Gehua Wang conceived and designed the research framework. Jiehui Yuan and Xunmin Ou performed the model development, analyzed the data and wrote the paper.

Conflicts of Interest

The authors declare no conflict of interest.

Appendix A

Table A1. Deaths attributable to ambient air pollution in 2012, by disease and region (one thousand).
WprEurEmrAmrSearAfr
LMICHICLMICHICLMICHICLMICHIC
ALRI11120280304976
COPD8497090301264
Lung cance22526501882119475
IHD27027157106911502430452
Stroke47520934664130727374
Total10658330917020049740799211
Note: ALRI, acute lower respiratory disease; COPD, chronic obstructive pulmonary disease; IHD, ischeamic heart disease; Wpr, Western Pacifc; Eur, Europe; Emr, Eastern Mediterranean; Amr, Americas; Sear, Southeast Asia; Afr, Africa; LMIC: Low- and middle-income countries; HIC: High-income countries. Source: based on WHO (2016) [12].
Table A2. Key parameters for the calculation of the emission reduction effect of energy Action 1.
Action 1EC1t0 (108 tce)EC1tn (108 tce)EF1t0 (kg/tce)
SO2NOxPM2.5CO2
20068.098.0618.8610.521.752990.20
20079.258.9618.8610.521.752990.20
20089.619.0318.8610.521.752990.20
200910.339.6418.8610.521.752990.20
201011.7210.6618.8610.521.752990.20
201113.3812.0118.8610.521.752990.20
201213.4611.9718.8610.521.752990.20
201314.4812.7518.8610.521.752990.20
201414.7612.9118.8610.521.752990.20
201514.3612.4318.8610.521.752990.20
Data source: [26,61,62].
Table A3. Key parameters for the calculation of the emission reduction effects of energy Actions 2 to 7.
Action TypesECOt (108 tce)ECAt (108 tce)EFOt (kg/tce)EFAt (kg/tce)
201620202030201620202030SO2NOxPM2.5CO2SO2NOxPM2.5CO2Data Sources
Action 25.144.023.064.893.692.7511.506.651.352934.0511.506.651.352934.05[63,64]
Action 34.235.256.124.235.256.120.35N/AN/AN/A0.1N/AN/AN/A[65]
Action 41.762.574.121.241.812.918.214.750.962095.800.10.480.11257.48[66,67]
Action 50.540.801.260.590.861.370.2627.850.212750.120.1616.710.131650.07[68]
Action 60.851.432.230.470.791.230.2627.850.212750.120.1313.930.111375.06[68,69]
Action 72.613.023.791.842.132.6815.761.17.222188.258.670.613.971203.54[70,71,72]

Appendix B

Figure A1. The shares of deaths attributable to air pollution in 2012. Source: based on [7,12].
Sustainability 09 01555 g014

References

  1. International Energy Agency (IEA). World Energy Balances (2016 Edition); IEA: Paris, France, 2016. [Google Scholar]
  2. British Petroleum (BP). BP Statistical Review of World Energy 2016; BP: London, UK, 2016. [Google Scholar]
  3. International Energy Agency (IEA). Key World Energy Statistics; IEA: Paris, France, 2016. [Google Scholar]
  4. Intergovernmental Panel on Climate Change (IPCC). Climate Change 2014: Synthesis Report; IPCC: Geneva, Switzerland, 2014. [Google Scholar]
  5. International Energy Agency (IEA). CO2 Emissions from Fuel Combustion (2016 Edition); IEA: Paris, France, 2016. [Google Scholar]
  6. U.S. Energy Information Administration (EIA), Department of Energy (DOE). International Energy Outlook 2016; DOE/EIA: Washington, DC, USA, 2016.
  7. International Energy Agency (IEA). World Energy Outlook Special Report 2016—Energy and Air Pollution; IEA: Paris, France, 2016. [Google Scholar]
  8. European Environment Agency (EEA). The European Environment—State and Outlook 2015: European Briefings—Air Pollution; EEA: Copenhagen, Denmark, 2016. [Google Scholar]
  9. United Nations (UN) Sustainable Development. Sustainable Development Goals—17 Goals to Transform Our World; UN: New York, NY, USA, 2016. [Google Scholar]
  10. Lundgren, K.; Kjellstrom, T. Sustainability challenges from climate change and air conditioning use in urban areas. Sustainability 2013, 5, 3116–3128. [Google Scholar] [CrossRef]
  11. Beg, N.; Morlot, J.C.; Davidson, O.; Afrane-Okesse, Y.; Tyani, L.; Denton, F.; Sokona, Y.; Thomas, J.P.; La Rovere, E.L.; Parikh, J.K.; et al. Linkages between climate change and sustainable development. Clim. Policy 2002, 2, 129–144. [Google Scholar] [CrossRef]
  12. World Health Organization (WHO). Ambient Air Pollution: A Global Assessment of Exposure and Burden of Disease; WHO: Geneva, Switzerland, 2016. [Google Scholar]
  13. Helfand, W.H.; Lazarus, J.; Theerman, P. Donora, Pennsylvania: An environmental disaster of the 20th century. Am. J. Public Health 2001, 91, 553. [Google Scholar] [CrossRef] [PubMed]
  14. Rodriguez, Y.R. Great Smog of London. In Encyclopedia of Toxicology, 3rd ed.; Elsevier: Amsterdam, The Netherlands, 2014; pp. 796–797. [Google Scholar] [CrossRef]
  15. Gao, M.; Guttikunda, S.K.; Carmichael, G.R.; Wang, Y.S.; Liu, Z.R.; Stanier, C.O.; Saide, P.E.; Yu, M. Health impacts and economic losses assessment of the 2013 severe haze event in Beijing area. Sci. Total Environ. 2015, 511, 553–561. [Google Scholar] [CrossRef] [PubMed]
  16. United Nations (UN). Paris Agreement; UN: New York, NY, USA, 2015. [Google Scholar]
  17. United Nations (UN). Transforming Our World: The 2030 Agenda for Sustainable Development; UN: New York, NY, USA, 2015. [Google Scholar]
  18. International Energy Agency (IEA). World Energy Outlook Special Report 2015—Energy and Climate Change; IEA: Paris, France, 2015. [Google Scholar]
  19. West, J.J.; Smith, S.J.; Silva, R.A.; Naik, V.; Zhang, Y.Q.; Adelman, Z.; Fry, M.M.; Anenberg, S.; Horowitz, L.W.; Lamarque, J.-F. Co-benefits of mitigating global greenhouse gas emissions for future air quality and human health. Nat. Clim. Chang. 2013, 3, 885–889. [Google Scholar] [CrossRef] [PubMed]
  20. Von Schneidemesser, E.; Monks, P.S. Air quality and climate—Synergies and trade-offs. Environ. Sci. Processes Impacts 2013, 15, 1315–1325. [Google Scholar] [CrossRef] [PubMed]
  21. Bollen, J.; Brink, C. Air pollution policy in Europe: Quantifying the interaction with greenhouse gases and climate change policies. Energy Econ. 2014, 46, 202–215. [Google Scholar] [CrossRef]
  22. Apsimon, H.; Amann, M.; Åström, S.; Oxley, T. Synergies in addressing air quality and climate change. Clim. Policy 2009, 9, 669–680. [Google Scholar] [CrossRef]
  23. Zeng, A.; Mao, X.; Hu, T.; Xing, Y.; Gao, Y.; Zhou, J.; Qian, Y. Regional co-control plan for local air pollutants and CO2 reduction Method and practice. J. Clean. Prod. 2017, 140, 1226–1235. [Google Scholar] [CrossRef]
  24. Maione, M.; Fowler, D.; Monks, P.S.; Reis, S.; Rudich, Y.; Williams, M.L.; Fuzzi, S. Air quality and climate change: Designing new win-win policies for Europe. Environ. Sci. Policy 2016, 65, 48–57. [Google Scholar] [CrossRef]
  25. He, K.; Lei, Y.; Pan, X.; Zhang, Y.; Zhang, Q.; Chen, D. Co-benefits from energy policies in China. Energy 2010, 35, 4265–4272. [Google Scholar] [CrossRef]
  26. Xie, Y.; Li, W. Synergistic emission reduction of chief air pollutants and greenhouse gases based on scenario simulations of energy consumptions in Beijing. Environ. Sci. 2013, 34, 2057–2064. [Google Scholar] [CrossRef]
  27. Hanaoka, T.; Akashi, O.; Fujiwara, K.; Motoki, Y.; Hibino, G. Potential for reducing air-pollutants while achieving 2 °C global temperature change limit target. Environ. Pollut. 2014, 195, 336–343. [Google Scholar] [CrossRef] [PubMed]
  28. International Monetary Fund (IMF). World Economic Outlook: Recovery Strengthens, Remains Uneven; IMF: Washington, DC, USA, 2014. [Google Scholar]
  29. National Bureau of Statistics (NBS) of China. China Energy Statistical Yearbook 2016; China Statistics Press: Beijing, China, 2016.
  30. Enerdata. Global Energy Statistical Yearbook 2016; Enerdata: Grenoble, France, 2016. [Google Scholar]
  31. World Health Organization. WHO Air Quality Guidelines for Particulate Matter, Ozone, Nitrogen Dioxide and Sulfur Dioxide; WHO: Geneva, Switzerland, 2006. [Google Scholar]
  32. Cofala, J.; Bertok, I.; Borken-Kleefeld, J.; Heyes, C.; Kiesewetter, G.; Klimont, Z.; Purohit, P.; Rafaj, P.; Sander, R.; Schöpp, W.; et al. Implications of Energy Trajectories from the World Energy Outlook 2015 for India’s Air Pollution; IEA: Paris, France, 2015. [Google Scholar]
  33. International Energy Agency (IEA). World Energy Outlook Special Briefng for COP21; IEA: Paris, France, 2015. [Google Scholar]
  34. Akhmat, G.; Zaman, K.; Shukui, T.; Sajjad, F.; Khan, M.A.; Khan, M.Z. The challenges of reducing greenhouse gas emissions and air pollution through energy sources: evidence from a panel of developed countries. Environ. Sci. Pollut. Res. 2014, 21, 7425–7435. [Google Scholar] [CrossRef] [PubMed]
  35. Rafaj, P.; Amann, M.; Siri, J.; Wuester, H. Changes in European greenhouse gas and air pollutant emissions 1960–2010: Decomposition of determining factors. Clim. Chang. 2014, 124, 477–504. [Google Scholar] [CrossRef]
  36. Menegaki, A.N.; Tsagarakis, K.P. Rich enough to go renewable, but too early to leave fossil energy? Renew. Sustain. Energy Rev. 2015, 41, 1465–1477. [Google Scholar] [CrossRef]
  37. Li, H.C.; Yang, S.Y.; Zhang, J.; Qian, Y. Coal-based synthetic natural gas (SNG) for municipal heating in China: Analysis of haze pollutants and greenhouse gases (GHGs) emissions. J. Clean. Prod. 2016, 112, 1350–1359. [Google Scholar] [CrossRef]
  38. International Energy Agency (IEA). Energy, Climate Change and Environment: 2014 Insights; IEA: Paris, France, 2014. [Google Scholar]
  39. The Team of China Coal Consumption Cap Plan and Policy Research Project. Research Report on China Coal Consumption Cap Plan in 2016–2020; Natural Resources Defense Council (NRDC): Beijing, China, 2016. [Google Scholar]
  40. Hu, X.L. Establishment of Energy Flow Diagram and Coal Flow Diagram and Research of Energy System Efficiency in China in 2012; World Wide Fund for Nature and Natural Resources Defense Council: Beijing, China, 2014. [Google Scholar]
  41. International Energy Agency (IEA). Partner Country Series—Emissions Reduction through Upgrade of Coal-Fired Power Plants; IEA: Paris, France, 2014. [Google Scholar]
  42. Industrial Boiler Branch (IBB) of China Electrical Equipment Industry Association. Industry perspective. In Industrial Boiler Communication 2015; IBB: Shanghai, China, 2015; pp. 46–47. [Google Scholar]
  43. Zhao, Y.Y.; Zhao, Y.X.; Zhang, W.L.; Du, W.W. Research on the impact of the capacity on the combustion effect of coal-fired industrial boilers. China Metrol. 2015, 5, 47–48. [Google Scholar] [CrossRef]
  44. Zhao, G.L.; Chen, S. Greenhouse gas emissions reduction in China by cleaner coal technology towards 2020. Energy Strategy Rev. 2015, 7, 63–70. [Google Scholar] [CrossRef]
  45. Zhai, R.R.; Liu, H.T.; Li, C.; Zhao, M.M.; Yang, Y.P. Analysis of a solar-aided coal-fired power generation system based on thermo-economic structural theory. Energy 2016, 102, 375–387. [Google Scholar] [CrossRef]
  46. Xie, W.; Sheng, P.F.; Guo, X.H. Coal, oil, or clean energy: Which contributes most to the low energy efficiency in China? Util. Policy 2015, 35, 67–71. [Google Scholar] [CrossRef]
  47. Wang, K.; Wang, S.S.; Liu, L.; Yue, H.; Zhang, R.Q.; Tang, X.Y. Environmental co-benefits of energy efficiency improvement in coal-fired power sector: A case study of Henan Province, China. Appl. Energy 2016, 184, 810–819. [Google Scholar] [CrossRef]
  48. Office of Fossil Energy and National Energy Technology Laboratory (NETL), Department of Energy (DOE). Modern Shale Gas Development in the United States: A Primer; DOE: Washington, DC, USA, 2009.
  49. Hu, C.; Chen, M.; Deng, P. Environmental Protection and Development Strategy of Natural Gas in China; Petroleum Industry Press: Beijing, China, 2004. [Google Scholar]
  50. Jin, H.; Lior, N.; Zhang, X. Energy and its sustainable development for China: Editorial introduction and commentary for the special issue of Energy—The international journal. Energy 2010, 35, 4246–4256. [Google Scholar] [CrossRef]
  51. Wang, T.; Lin, B. Impacts of unconventional gas development on China’s natural gas production and import. Renew. Sustain. Energy Rev. 2014, 39, 546–554. [Google Scholar] [CrossRef]
  52. Aguilera, R.F. The role of natural gas in a low carbon Asia Pacific. Appl. Energy 2014, 113, 1795–1800. [Google Scholar] [CrossRef]
  53. Melikoglu, M. Shale gas: Analysis of its role in the global energy market. Renew. Sustain. Energy Rev. 2014, 37, 460–468. [Google Scholar] [CrossRef]
  54. International Energy Agency (IEA). World Energy Outlook 2011 Special Report: Are We Entering a Golden Age of Gas? IEA: Paris, France, 2011. [Google Scholar]
  55. Ministry of Environmental Protection (MEP). China Vehicle Emission Control Annual Report in 2016; MEP: Beijing, China, 2017.
  56. Shen, W.; Han, W.; Chock, D.; Chai, Q.; Zhang, A. Well-to-wheels life-cycle analysis of alternative fuels and vehicle technologies in China. Energy Policy 2012, 49, 296–307. [Google Scholar] [CrossRef]
  57. Ou, X.; Zhang, X.; Zhang, X.; Zhang, Q. Life cycle GHG of NG-based fuel and electric vehicle in China. Energies 2013, 6, 2644–2662. [Google Scholar] [CrossRef]
  58. Wang, X.; Hao, X.; Jin, L. Study on rural household energy consumption in China based on household investigation from typical counties. Trans. Chin. Soc. Agric. Eng. 2014, 30, 206–212. [Google Scholar] [CrossRef]
  59. Peng, L. Modeling the Rural Residential Fuel Consumption and Estimating the Pollutant Emissions in China Based on Survey Data; Tsinghua University: Beijing, China, 2016. [Google Scholar]
  60. Chai, F.; Xue, Z.; Zhi, G.; Du, J.; Luo, Y.; Ren, Y.; Ye, J. Complex control measures of rural coal combustion pollution. Environ. Prot. 2016, 44, 15–19. [Google Scholar] [CrossRef]
  61. China Electricity Council (CEC). Annual Report of the Development of Electric Power Industry in China (2016 Edition); CEC: Beijing, China, 2016. [Google Scholar]
  62. State Grid Energy Research Institute (SGERI). Analysis Report of Energy and Electricity Conservation in China; China Electric Power Press: Beijing, China, 2016. [Google Scholar]
  63. National Energy Administration (NEA). Action Plan for Clean and Efficient Use of Coal (2015–2020); NEA: Beijing, China, 2015.
  64. Wang, R. Fuel-Cycle Assessment of Energy and Environmental Impacts from Electric Vehicles and Natural Gas Vehicles; Tsinghua University: Beijing, China, 2015. [Google Scholar]
  65. Ye, B.; Jiang, J.; Miao, L.; Yang, P. Sustainable energy options for a low carbon demonstration city project in Shenzhen, China. J. Renew. Sustain. Energy 2015, 7, 23117–23122. [Google Scholar] [CrossRef]
  66. National Development and Reform Commission (NDRC). The 13th Five-Year Plan for Natural Gas Development; NDRC: Beijing, China, 2016.
  67. National Development and Reform Commission (NDRC); Ministry of Finance (MOF); Ministry of Environmental Protection (MEP); Ministry of Commerce (MOC); State Administration for Industry & Commerce (SAIC); General Administration of Quality Supervision; Inspection and Quarantine (GAQSIQ). The Working Plan for Accelerating the Upgrading of the Quality of Oil Products; NDRC/Ministry of Finance (MOF)/MEP/Ministry of Commerce (MOC)/State Administration for Industry & Commerce (SAIC)/General Administration of Quality Supervision, Inspection and Quarantine (GAQSIQ): Beijing, China, 2015.
  68. China Automotive Technology and Research Center (CATARC) Beijing Operations. Research Report on the Development of Natural Gas Vehicle Industry in China; CATARC Beijing Operations: Beijing, China, 2017. [Google Scholar]
  69. National Development and Reform Commission (NDRC); National Energy Administration (NEA); Ministry of Industry and Information Technology (MIIT); Ministry of Housing and Urban-Rural Development (MHURD). Guidelines for the Development of Electric Vehicle Charging Infrastructure; NRDC/NEA/Ministry of Industry and Information Technology (MIIT)/Ministry of Housing and Urban-Rural Development (MHURD): Beijing, China, 2015.
  70. Wang, Q. 2015 Energy Data; Energy Foundation: Beijing, China, 2015. [Google Scholar]
  71. Building Energy Saving Research Center of Tsinghua University. 2017 Annual Report on China Building Energy Efficiency; China Building Industry Press: Beijing, China, 2017. [Google Scholar]
  72. Zhao, C.; Zhang, H.; Zhang, X.; Yuan, J. Economic research on centralized gas power generation projects. Int. Pet. Econ. 2016, 24, 57–63. [Google Scholar] [CrossRef]
Figure 1. Shares of primary energy consumption in China in 2006–2015. Note: Clean energy includes nature gas, nuclear energy, hydroelectricity and renewables. Source: based on [2,29,30].
Sustainability 09 01555 g001
Figure 2. China’s energy-related CO2 emissions from 2006 to 2015. Source: based on [2,6,30].
Sustainability 09 01555 g002
Figure 3. Energy-related PM2.5 emissions by region, 2015. Source: based on [7].
Sustainability 09 01555 g003
Figure 4. Framework for emission reduction effect analysis of energy countermeasures to tackle climate change and air pollution.
Sustainability 09 01555 g004
Figure 5. Emission reduction effect of enhancing large coal-fired plants and limiting small plants.
Sustainability 09 01555 g005
Figure 6. Emission reduction effect of promoting green boiler use.
Sustainability 09 01555 g006
Figure 7. Emission reduction effect of replacing coal with NG.
Sustainability 09 01555 g007
Figure 8. Emission reduction effect of the fuel standard upgrades.
Sustainability 09 01555 g008
Figure 9. Emission reduction effect of NGV use.
Sustainability 09 01555 g009
Figure 10. Emission reduction effect of CPV use.
Sustainability 09 01555 g010
Figure 11. Emission reduction effect of improving the centralization of rural energy use.
Sustainability 09 01555 g011
Figure 12. Emission reduction effect of energy actions implemented in China: (a) CAP reduction effect; and (b) GHG reduction effect.
Sustainability 09 01555 g012
Figure 13. Difference in the emission reduction effects of energy actions in terms of PM2.5 and GHG reductions.
Sustainability 09 01555 g013
Table 1. The operational heat efficiency of coal-fired industrial boilers in China.
Capacity (MW)Thermal Efficiency (%)
<1.4555–60
1.45–4.3560–65
4.35–7.2565–70
7.25–14.570–75
>14.5>85
Note: MW is megawatt. Source: based on [38,42,43].
Table 2. A comparison of combustion emissions released by typical fossil fuels.
Air PollutantCombusted Source
NGOilCoal
CO211.41.8
Nitrous oxides (NOx)14.95.0
Carbon monoxide (CO)10.85.2
Sulfur dioxide (SO2)11870.04318.3
Particulates (PM)112.0392.0
Note: With the same calorific value. Source: based on [48,49].
Table 3. A comparison of the benefits of using gas versus coal by 150,000 households.
ItemsValue
The amount of coal replaced22.34 × 104 tons/year
The amount of CO2 emission reduced1.07 × 104 tons/year
The amount of fly ash reduced2.46 × 104 tons/year
The amount of traffic volume reduced111.7 × 104 km/year
Housework time saving1147.5 × 104 day/year
Source: based on [48].
Table 4. National fuel standard and sulfur content requirement in China.
National Standard2006200720082009201020112012201320142015
GasolineNational II (500 ppm)National III (150 ppm)National IV (50 ppm)
DieselNational II (2000 ppm)National III (350 ppm)National IV (50 ppm)
Source: based on [55].
Table 5. Upgrading, replacing and centralizing actions for low-quality energy in China.
Methods/Energy TypesCoalPetroleum Production
UpgradingPromoting the efficient and clean utilization of coal, such as enhancing large coal-fired plants, limiting small coal-fired plants (Action 1) and implementing a green boiler project (Action 2)Vigorously promoting petroleum product standards (Action 3)
ReplacingLarge-scale use of NG to replace coal (Action 4)NGVs to replace oil (Action 5) and the Rapid development of EVs (emphasizing the promotion of the electrification of city public automobiles) (Action 6)
CentralizingPromoting the centralization of rural energy use, including centralized heating supply, centralized gas supply and the comprehensive utilization of straw (Action 7)

