Article

Behaviour of a Sustainable Concrete in Acidic Environment

Department of Civil Engineering, Curtin University, Perth 6845, Australia
*
Author to whom correspondence should be addressed.
Sustainability 2017, 9(9), 1556; https://doi.org/10.3390/su9091556
Submission received: 29 July 2017 / Revised: 23 August 2017 / Accepted: 30 August 2017 / Published: 1 September 2017
(This article belongs to the Special Issue Sustainable Construction)

Abstract

:
Sustainability has become one of the most important considerations in building design and construction in recent years. Concrete is susceptible to acid attack because of its alkaline nature. The socioeconomic losses associated with infrastructure deterioration due to acid attack exceed billions of dollars all around the world. An experimental investigation was carried out to study the behaviour of sustainable concrete in 3% sulphuric acid and 1.5% nitric acid environment in which cement was replaced by a combination of fly ash and ultra fine fly ash. It was found that the compressive strength loss of concrete in these acid environments was the minimum in which cement was replaced by 30% fly ash and 10% ultra fine fly ash. This mix also showed the lowest mass loss when exposed to these acids.

1. Introduction

The impact of concrete, being one of the most commonly used construction materials worldwide, on sustainability can be significant. Concrete, in general, has a relatively low embodied energy compared to other construction materials. Fly ash, a by-product from thermal power stations, has been proven to have a lower embodied energy compared to ordinary Portland cement (OPC) [1]. The use of fly ash as a supplementary cementitious material (SCM) in concrete is well recognised for its economic and performance advantages such as improved workability and durability [2,3,4,5]. In fact, fly ash is specified in various Standards for use as a SCM [6] and in General Purpose and Blended Cements [7]. Studies have shown that by using high volumes of fly ash (>50%) it is possible to achieve the desired properties of concrete with a minimized cost [6,7].
The pozzolanic reaction of fly ash is a slow process. Therefore, the early strength of fly ash concrete is much lower than the concrete which does not contain any fly ash [8]. Different approaches have been used to accelerate the pozzolanic reaction of fly ash in concrete [9,10,11,12]. One of the approaches studied is the incorporation of very small size pozzolanic materials. In particular, microsilica has been used to improve the early age strength properties of concrete containing fly ash [13,14,15]. Ultra fine fly ash (UFFA) is a recently developed material. It is produced by a proprietary separation system with a mean particle diameter of 1–5 microns and contains 20% more amorphous silica than typical class F fly ash (particle diameter of 1–300 microns) [16]. Therefore, not only have the benefits of using UFFA in concrete been studied [17,18,19], but also the effectiveness of UFFA in improving the strength of fly ash concrete at early age has been evaluated [20]. The use of UFFA in concrete also contributes to the sustainability. This is because, compared to cement production, the UFFA production does not require any high energy-intensive process.
It has been recognised that, in general, ordinary Portland cement (OPC) concrete has minimal (almost no) resistance to acid attacks. While some weaker acids can be tolerated if exposed occasionally, OPC is known to be unable to hold up against any solution with a pH of 3 or lower [21]. Sulphuric acid (H2SO4) is one of the most deleterious acids to act on concrete due to the combination of acid and sulphate attack. The deterioration of concrete sewer pipes due to sulphuric acid attack is a global problem all around the world. Moreover, industrial waste often contains a large amount of sulphuric acid. Therefore, concrete structures in industrial areas are exposed to of sulphuric acid attack. Sulphuric acid reacts with calcium hydroxide (CH), hydration product of cement in concrete and produce gypsum. The creation of gypsum in concrete causes volume increase. The gypsum also reacts with calcium aluminate hydrate (C3A) to produce ettringite. The volume of ettringite is almost seven times more than the initial compounds [22]. Ettringite causes inner pressure in concrete leading to the formation of cracks [23]. Ultimately, the corroded concrete loses its mechanical strength that contributes to more cracking, spalling and finally leads to completely destruction [24].
Nitric acid (HNO3) is another powerful corrosive acid that is immensely aggressive in nature. Nitric acid occurs in chemical plants producing explosives, artificial manure and similar products. Although nitric acid is not as strong as sulphuric acid, its effect on concrete at brief exposure is more destructive. The nitric acid reacts with CH of concrete and produces a highly soluble calcium nitrate salt. This salt weakens the cement paste structure and reduces the strength of concrete.
Different strategies have been used to enhance the resistance of concrete in acidic environment. One of the strategies, found to be very effective, is the use of various supplementary cementitous materials such as fly ash, slag, microsilica and calcite laterites [25,26,27]. Although extensive research has been carried out on the use of UFFA in concrete either individually or in combination with fly ash, very few studies evaluated its effectiveness on the durability properties of fly ash concrete. This paper reports the results of an investigation on the behaviour of a concrete in sulphuric acid and nitric acid environment where cement was replaced with fly ash and UFFA.

2. Experimental Programme

2.1. Materials

The cement used in this study was a General Purpose Grey Portland cement (PC) supplied by Cockburn Cement of Western Australia. The commercially available class F fly ash (FA) and ultra fine fly ash (UFFA) were used as partial replacement of cement. The UFFA had 18% more amorphous content compared to FA. The chemical composition and physical properties of all materials used in this study are summarised in Table 1. The aggregates used consisted of coarse aggregates with sizes of 20 mm and 10 mm, while the fine aggregate was natural sand.

2.2. Mix Proportions

In total, five mixes of concrete were cast. The first mix was a control mix with 100% OPC. The remaining mixes contained OPC with at varying percentages of FA and UFFA. The amount of UFFA was kept constant at 10% based on previous studies [17,18,19]. Details of mix proportions are shown in Table 2. The water–binder ratio was kept constant at 0.35 for all the mixes. A polycarboxylate-based superplasticiser was used to maintain a constant workability (slump = 100 (±5) mm). Due to high fineness of UFFA, the water demand in the mixes increased with the increase in the quantity of UFFA. Therefore, to balance the water demand, it was needed to use higher quantity of superplasticizer as the UFFA content in the mixes increased. The target strength of control mix was 35 MPa at 28 days.

2.3. Specimen Preparation

A 160 kg capacity pan mixer was used to prepare the concrete. The speed of the mixer was 26 rotations per minute. Cube specimens (100 mm × 100 mm × 100mm) were cast in two layers. After casting each layer, the specimens were compacted using a vibrating table. The vibration was carried out until air bubbles stopped appearing on the surface. The frequency of the vibration was 60 Hz. A plastic sheet was used to cover the specimens in moulds, and these were then kept in casting room for 24 h. The temperature of the room was maintained at 20 (±1) °C. After 24 h the specimens were demoulded and placed in water bath for 3 days. The temperature of water bath was maintained at 20 (±1) °C. After this, the specimens were sealed in polythene sheets and kept in a storage laboratory until the day of testing. The temperature and relative humidity of the storage laboratory was maintained at 20 (±1) °C and 65% ± 1%, respectively.

2.4. Test Methods

2.4.1. Compressive Strength

The compressive strength testing was performed in accordance with the guidelines given in AS (1012.9-2014 [28]) at the age of 7, 14, 28, 56 and 90 days. At each age, three specimens were tested and the mean value of these measurements is reported.

2.4.2. Strength and Mass Loss

After 28 days of curing, the 100 mm cube samples were immersed in sulphuric acid of 3% concentration (H2SO4, pH ≈ 3) and nitric acid of 1.5% concentration (HNO3, pH ≈ 3) for a period up to 90 days. These concentrations have been taken from existing literatures [29,30]. The solutions of acids were prepared by mixing concentrated acids with a predetermined amount of tap water. The pH level of acid solutions was monitored regularly using a portable digital pH meter (standard error: ±0.05). To maintain the desired pH levels, the concentrated acid was added either weekly or when the pH level went up. It has to be mentioned that the pH value depends on the degree of dissociation of radicals, and it may not be a true indicator of the concentration of acid in the solution [31]. Therefore, in the present study, the concentration was used directly as an indicator of the aggressiveness of the exposure environment.
The samples were removed from the acid solution after the exposure period and brushed carefully to remove the loose particles from the surface. They were then left for drying under room temperature for 1 h before determining the loss in compressive strength and the mass changes. The loss in compressive strength was calculated by determining the strengths at 7, 14, 28, 56 and 90 days. The mass loss was determined at 3, 7, 14, 28, 56 and 90 days.

2.4.3. Scanning Electron Microscope (SEM)

The microstructure was studied using scanning electron microscope, Zeiss EVO-40 (Carl-Zeiss, Germany). The small cut samples were polished using silicon carbide paper and coated with platinum before imaging.

3. Results and Discussion

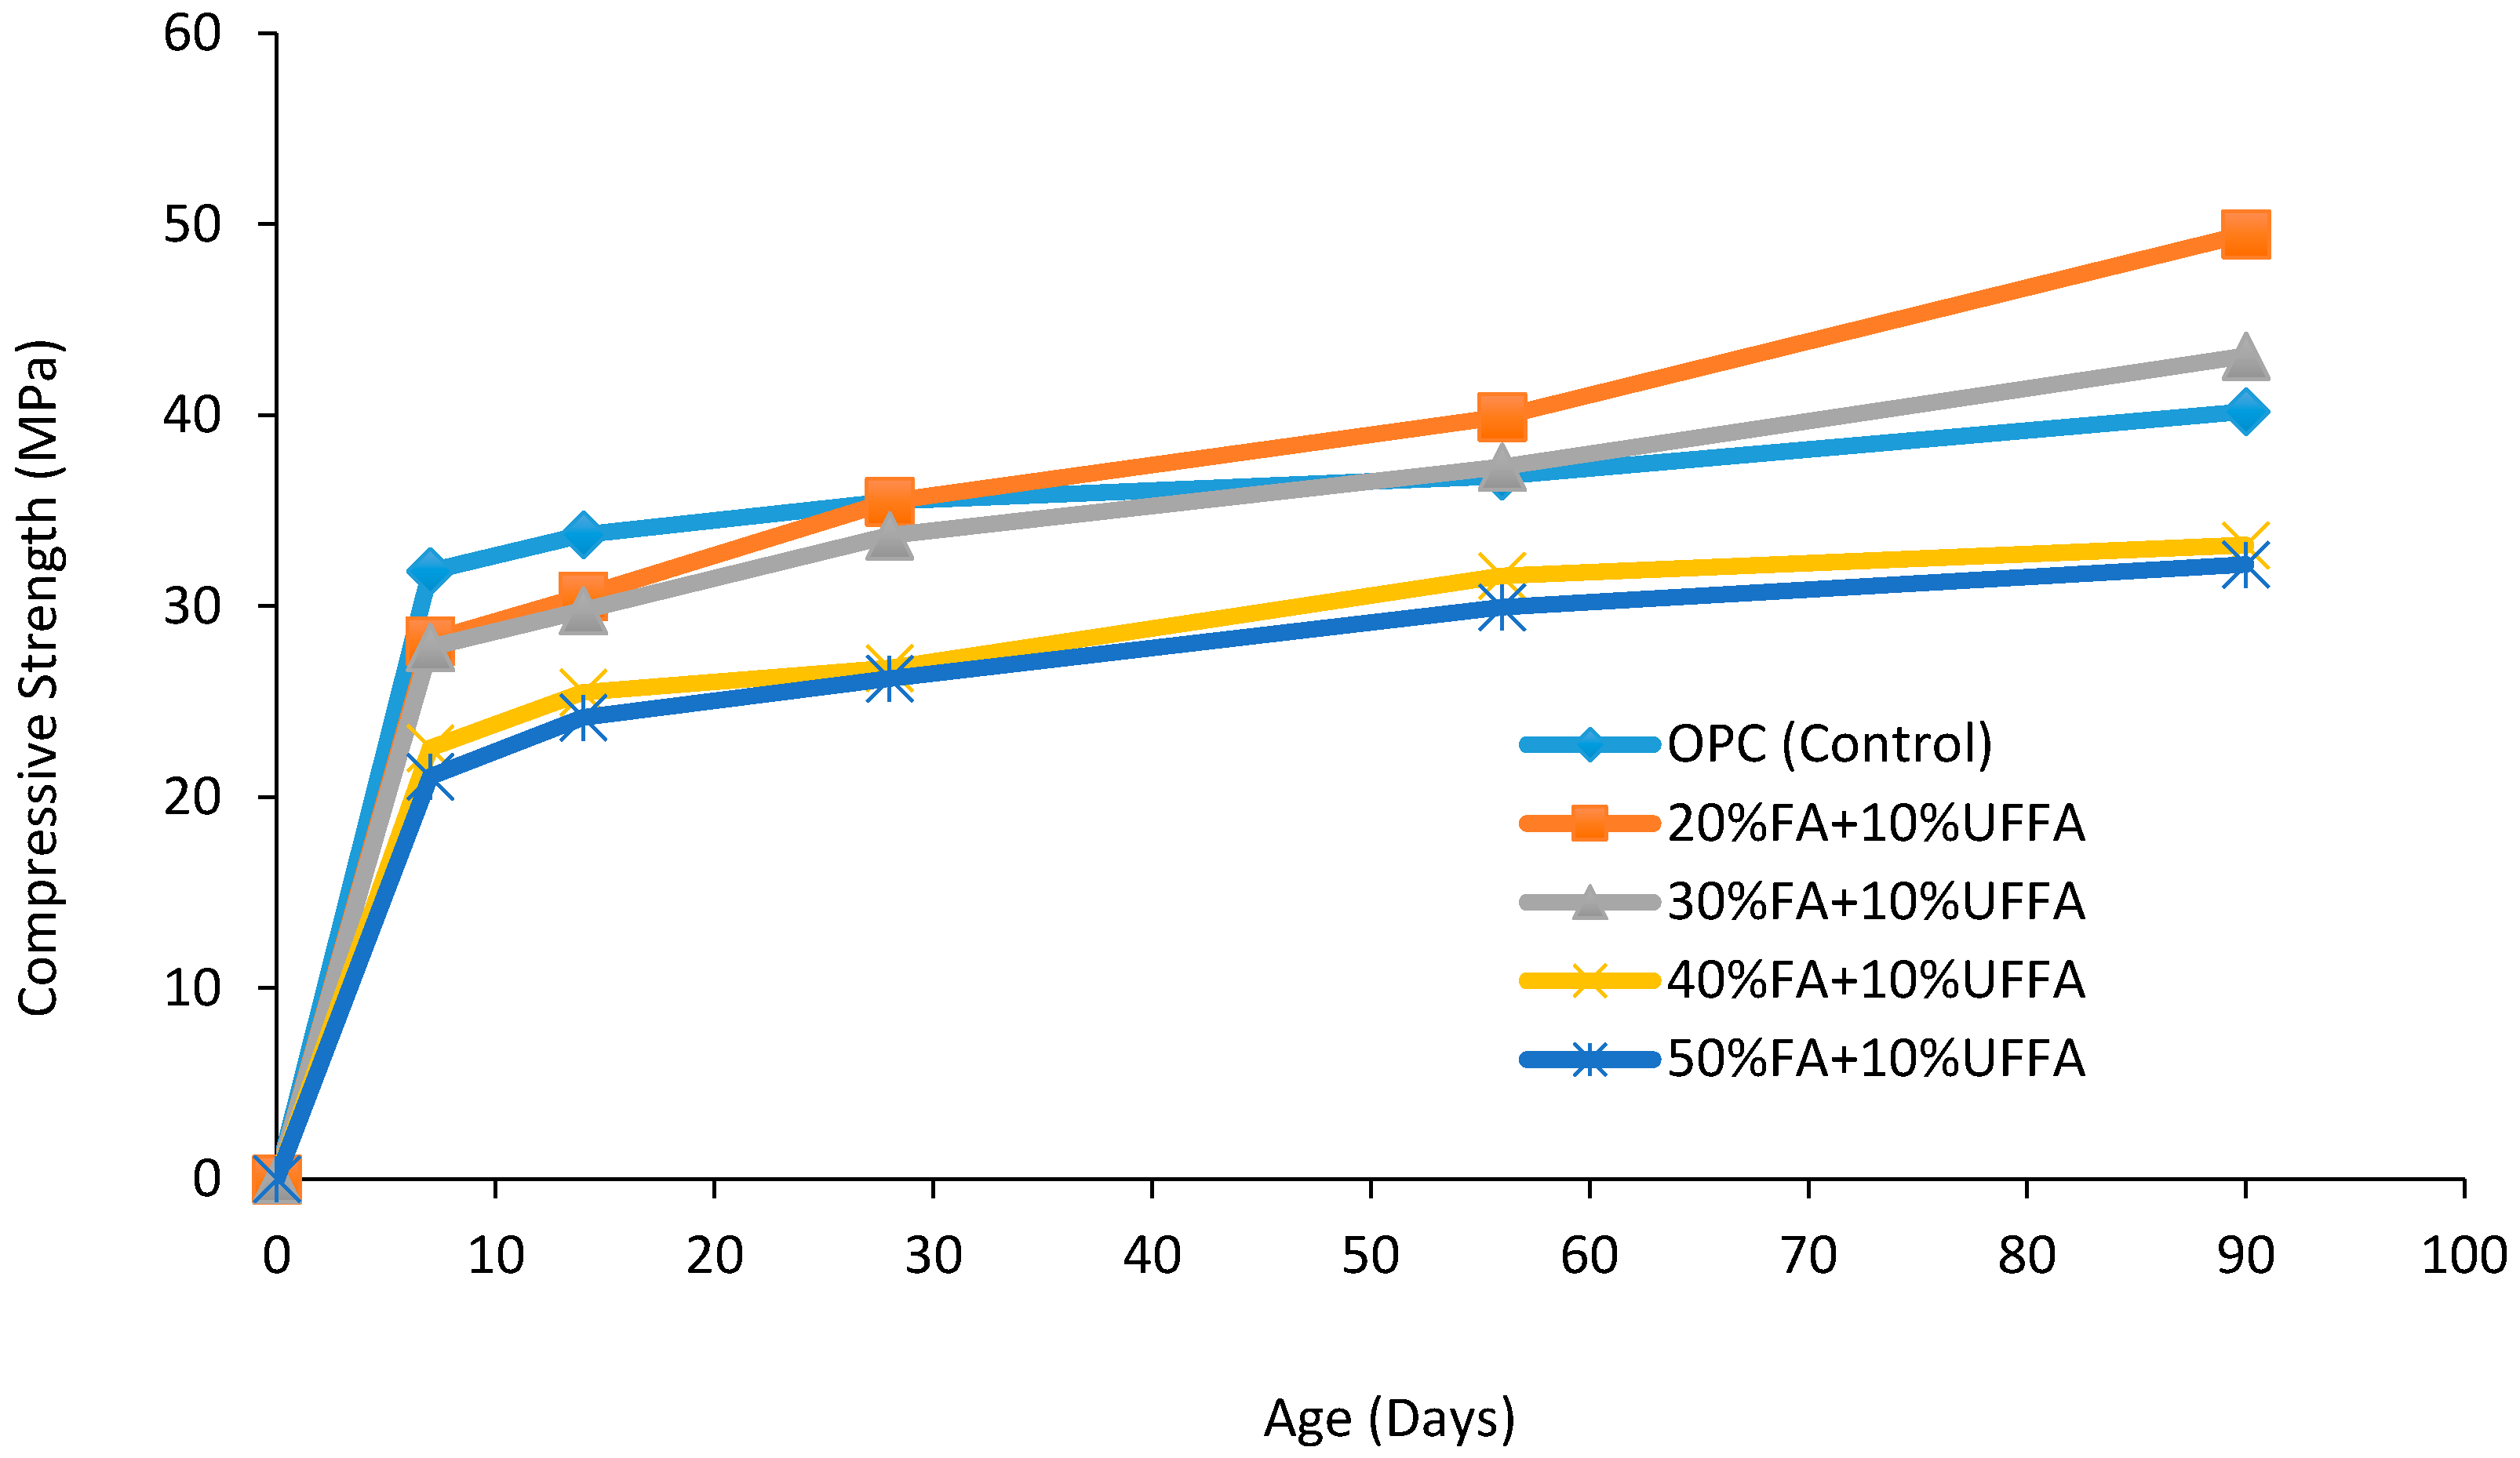
3.1. Compressive Strength Development

The compressive strength development of concrete containing different amounts of fly ash and ultra fine fly ash is shown in Figure 1. The compressive strength values are summarised in Table 3 along with standard deviation. In Figure 1, it can be seen that the strength development for Mix 1 (OPC) was much faster than the other mixes containing FA and UFFA. The compressive strength of Mix 1 (OPC) at seven days was 31.8 MPa, while this was below 30 MPa for other mixes. This trend also continues at the 14 day of curing. Therefore, it can be said that the strength gain of concrete mixes containing high volumes of FA is much slower than the concrete mixes without FA. This is due to the slower pozzolanic reactions of FA, in which the reaction between FA and water creates a slower hydration rate compared to the reaction between cement and water. However, at later ages (28 days or after), it can be seen that the strength for all the FA concrete mixes begins to develop at an accelerating rate, most notably for Mix 2 (20% FA + 10% UFFA). At 90 days, it can be seen that the compressive strength of mix Mix 2 (20% FA + 10% UFFA) far exceeds that of Mix 1 (OPC) and the rest, with Mix 3 (30% FA + 10% UFFA) coming in at the second. This also conforms to the findings of existing literature [32] that FA concrete has a slower strength gain at early age, but the strength exceeds the OPC concrete without any FA at 90 days.

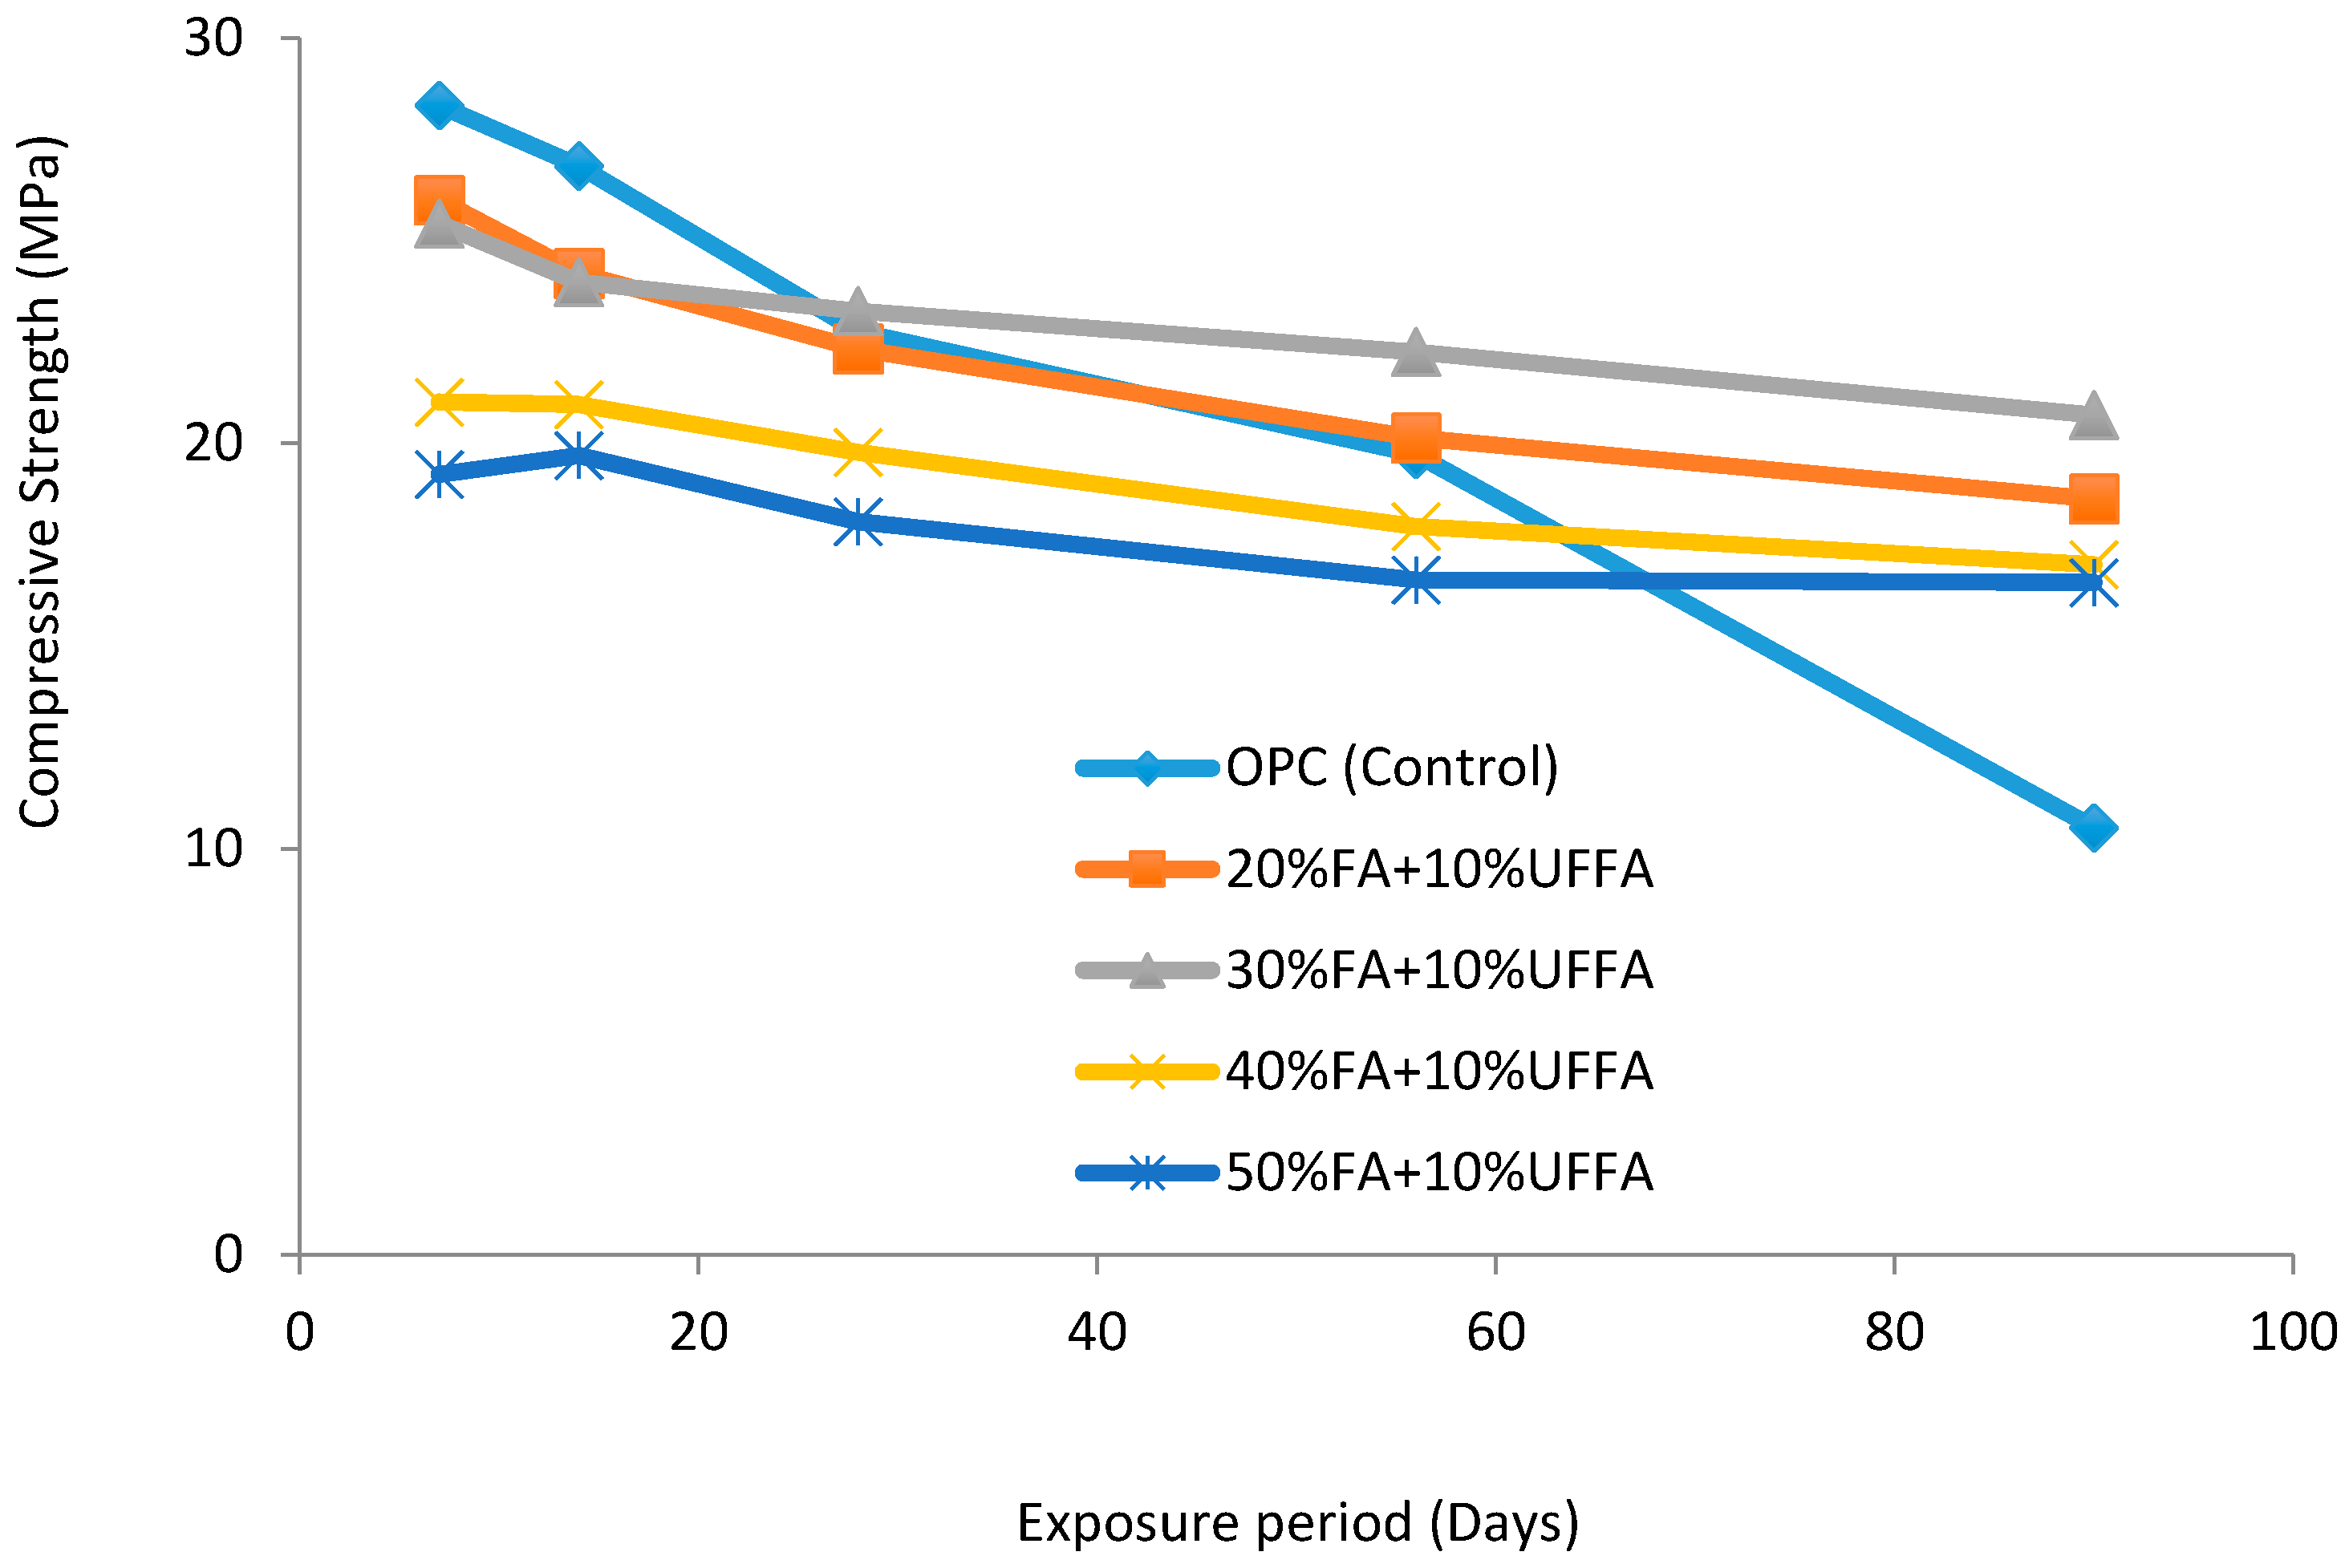
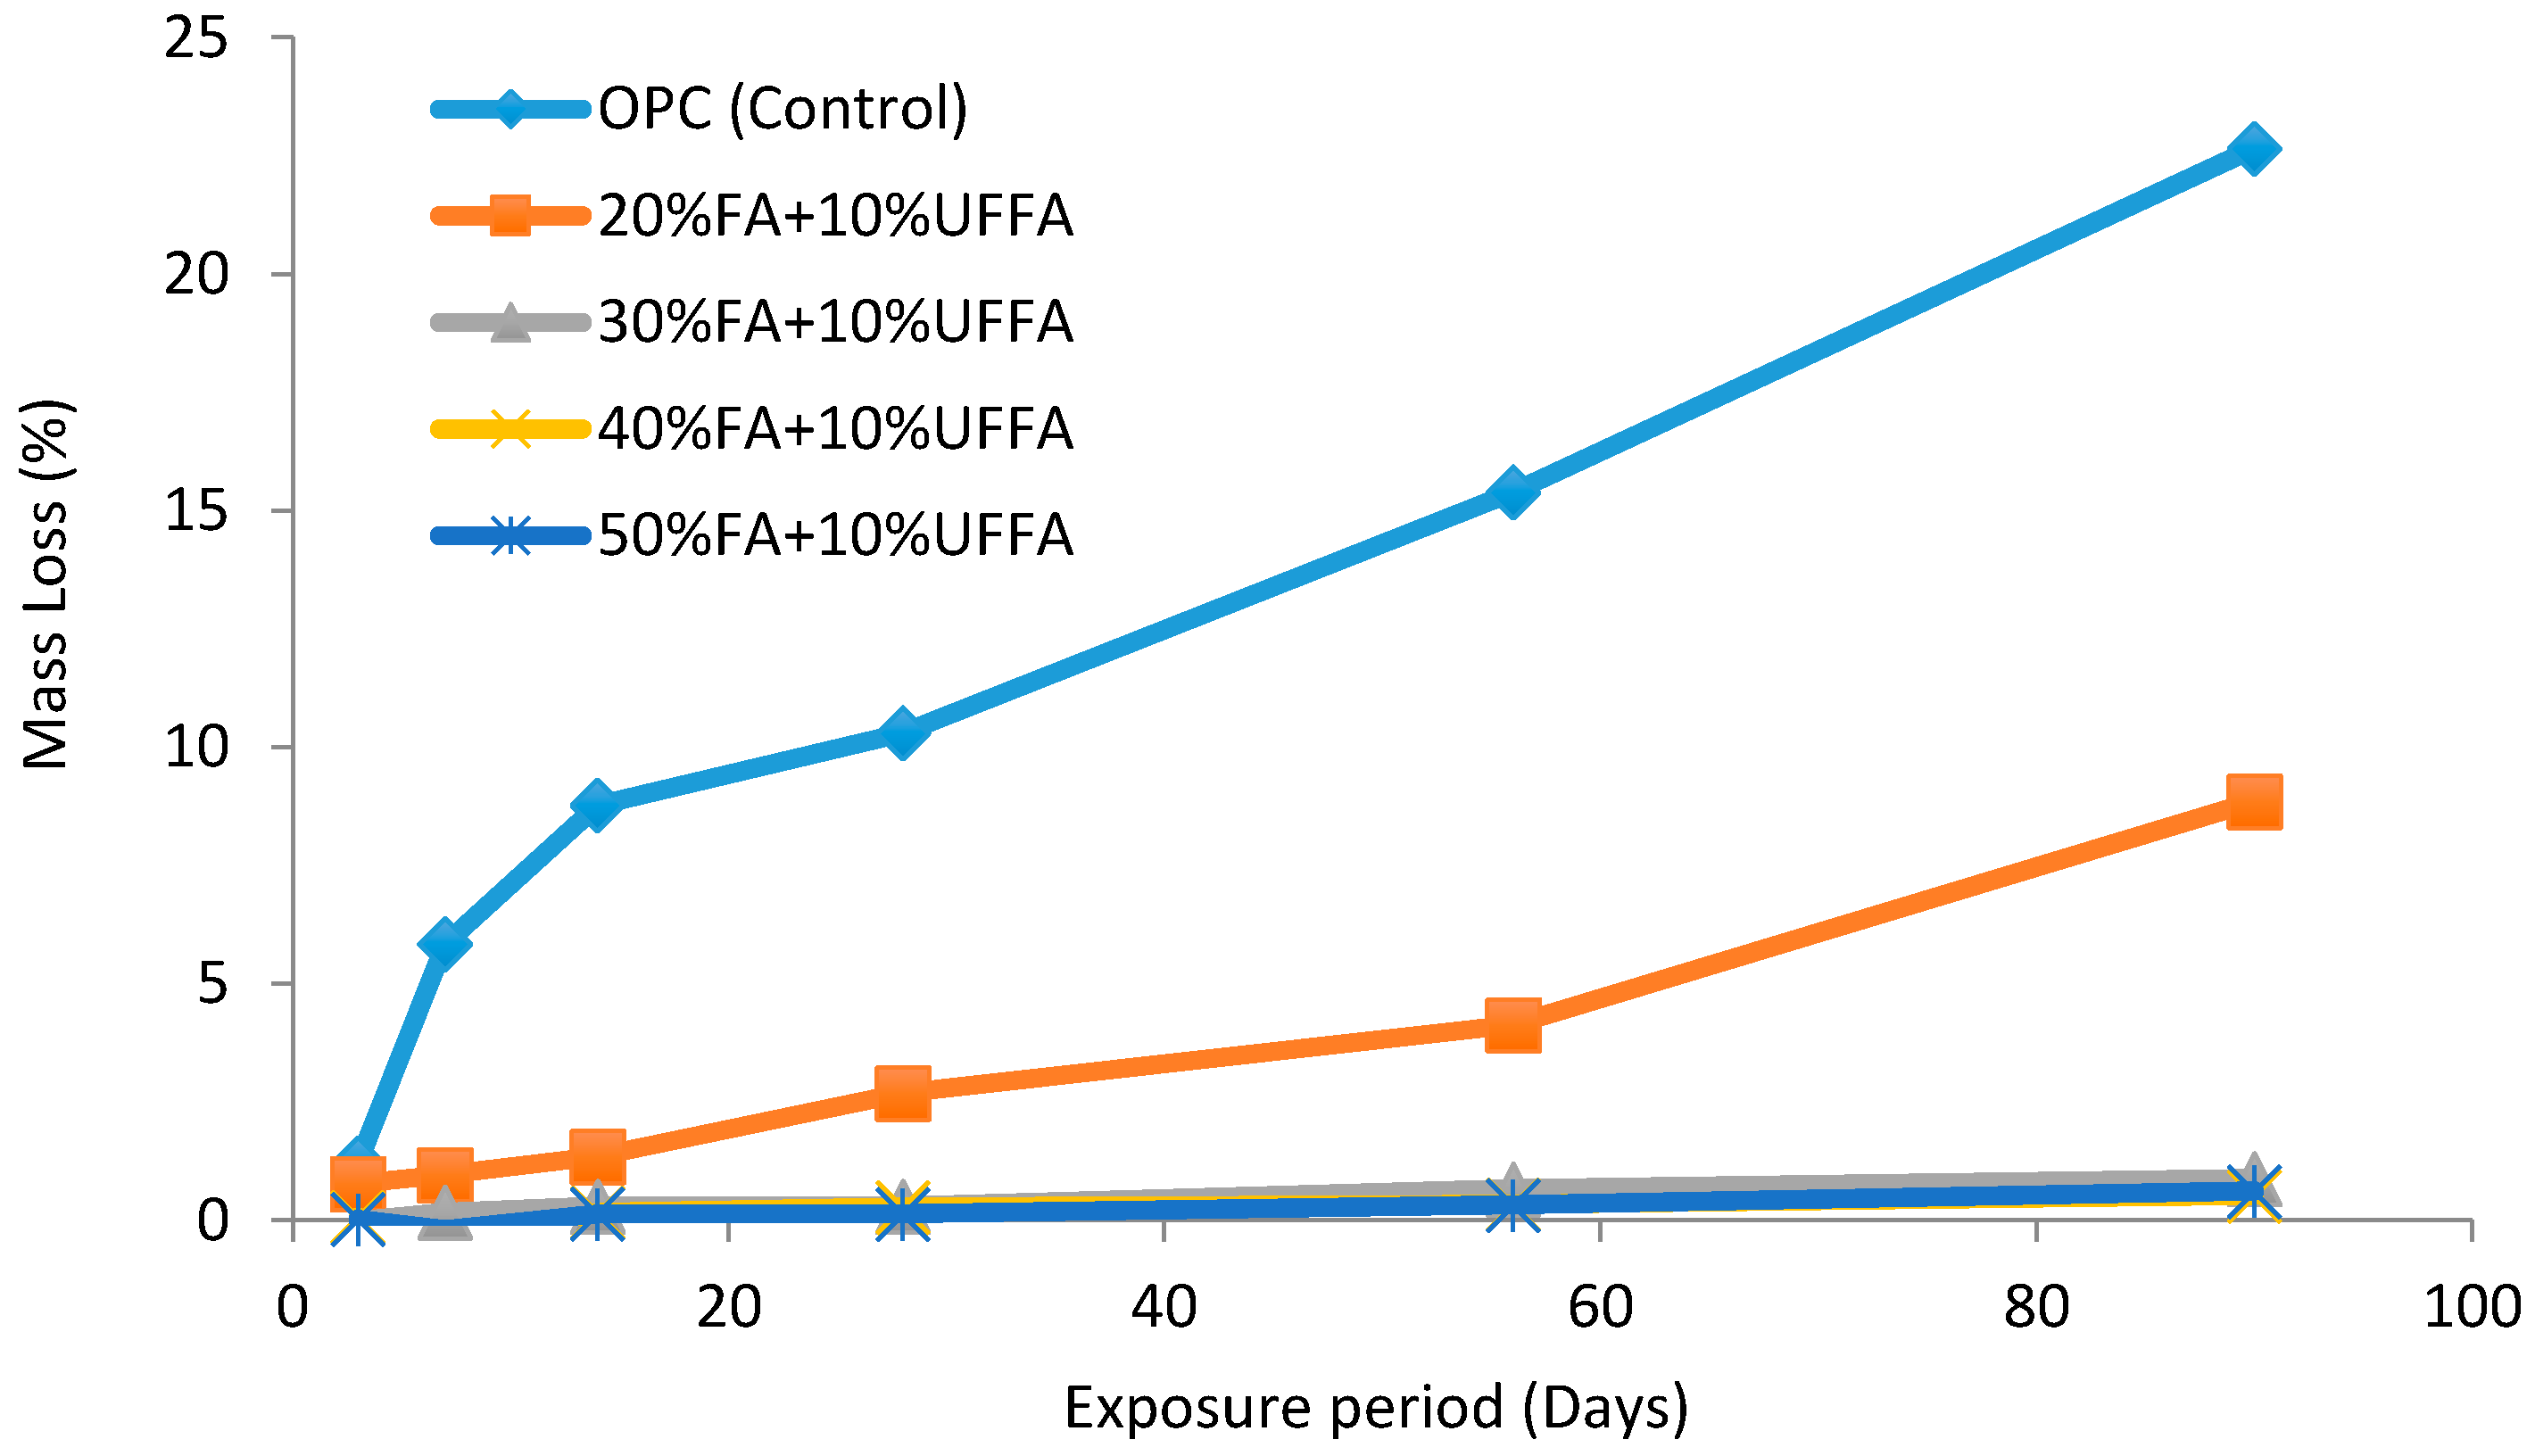
3.2. Behaviour in Sulphuric Acid Environment

Figure 2 shows the compressive strength loss for the five mixes when they are immersed in 3% sulphuric acid for a period of up to 90 days. The losses of compressive strength are summarised in Table 4 along with standard deviation. It can be observed from Figure 2 that Mix 1 (OPC) had the highest loss in the compressive strength at 90 days. Although Mix 1 (OPC) possessed the highest compressive strength initially, it was only able to retain 37.1% of its seven-day compressive strength after 90 days. This indicates that Mix 1 (OPC) was affected the most in 3% sulphuric acidic environment. Mix 2 (20% FA + 10% UFFA) showed the second largest variance, with compressive strength of 18.6 MPa compared to 26.0 MPa at seven days. Mix 3 (30% FA + 10% UFFA) also showed a declining compressive strength trend. However, this was not as severe as Mix 1 (OPC) and Mix 2 (20% FA + 10% UFFA). Mix 4 (40% FA + 10% UFFA) and Mix 5 (50% FA + 10% UFFA) showed minimal changes in strength loss, with less than 15% strength loss.
Figure 3 shows the percentage mass loss of concrete cubes immersed in 3% sulphuric acid for a period of up to 90 days. The mass losses are summarised in Table 5 along with standard deviation. It can be observed that the maximum mass loss occurred in Mix 1 (OPC). The per cent mass reduction increases as the exposure period prolongs, showing an almost linear rate of mass loss. Mix 1 (OPC) showed a mass loss of 1.2% at three days, increasing to 10.3% at 28 days up to 22.7% at 90 days. While not as significant as Mix 1 (OPC), Mix 2 (20% FA + 10% UFFA) presented a mass loss of 2.7% at 28 days up to 8.9% at 90 days. Other mixes showed minimal mass loss, with less than 1% change at the end of 90 days. It can also be seen that the percentage of mass loss decreases as the volume of FA increases in each mix. The minimal mass loss per cent change in Mix 3 (30% FA + 10% UFFA), Mix 4 (40% FA + 10% UFFA) and Mix 5 (50% FA + 10% UFFA) is associated with the greater volume of FA to cement replacement, which provides a higher resistance to sulphuric acid attack. The could also be due to the accumulation of gypsum at the surface, effectively blocking or reducing further reactions from occurring, whilst already possessing a denser matrix.

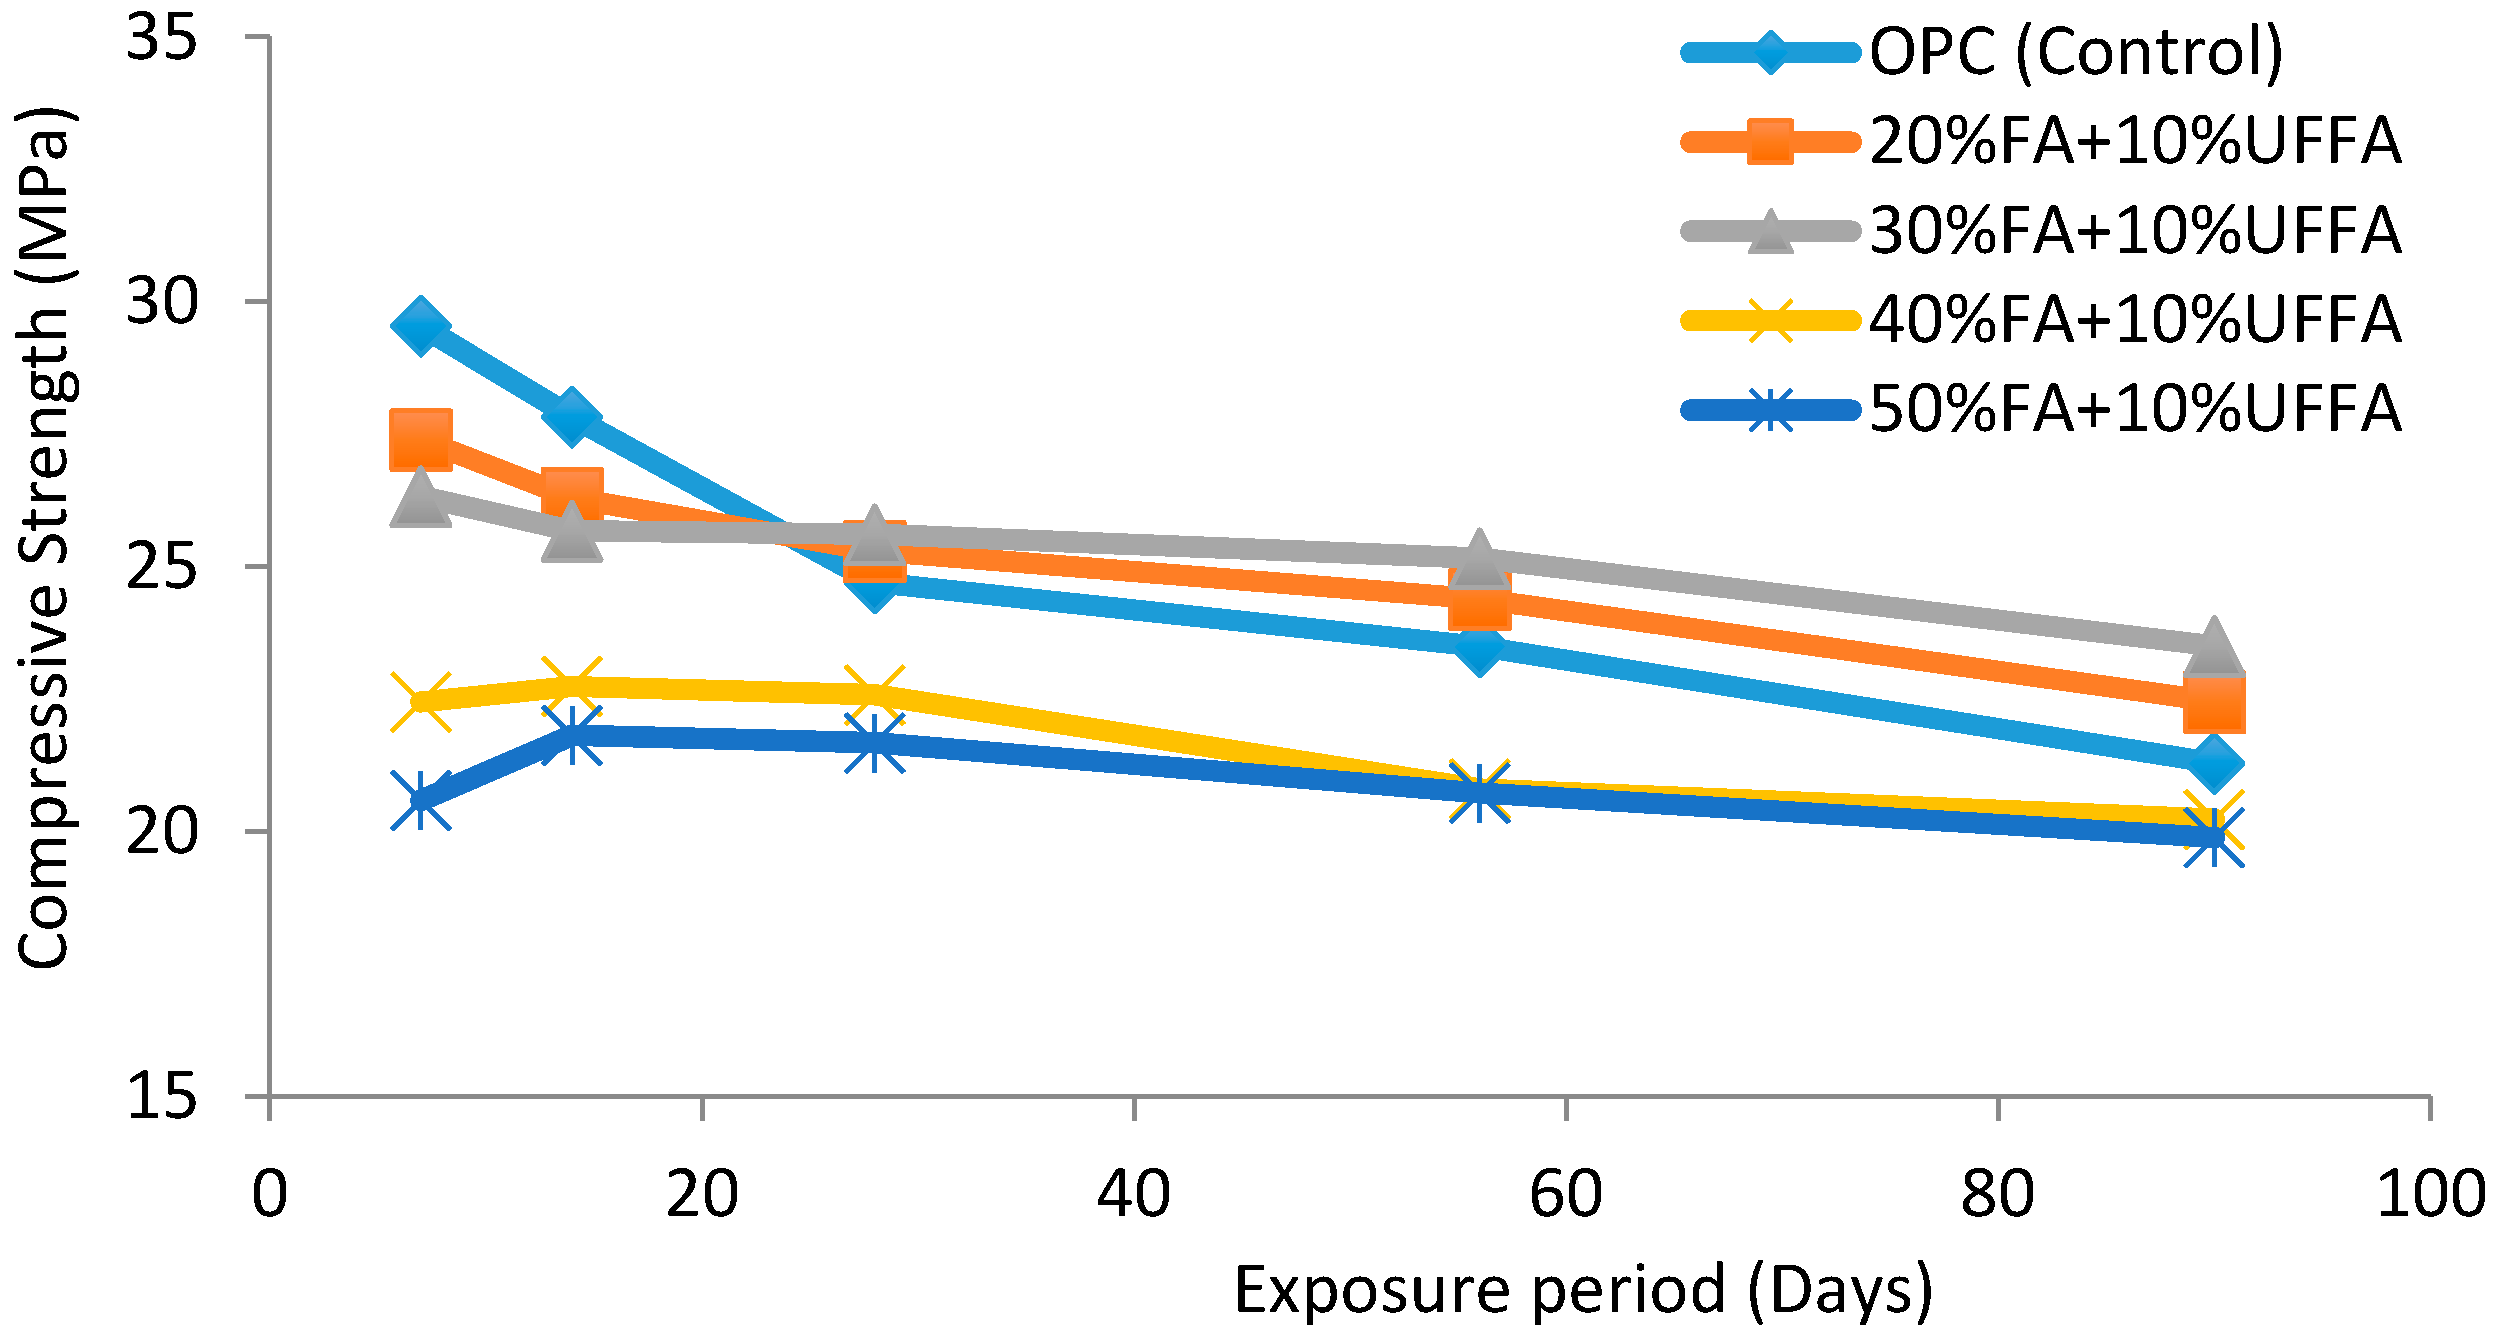
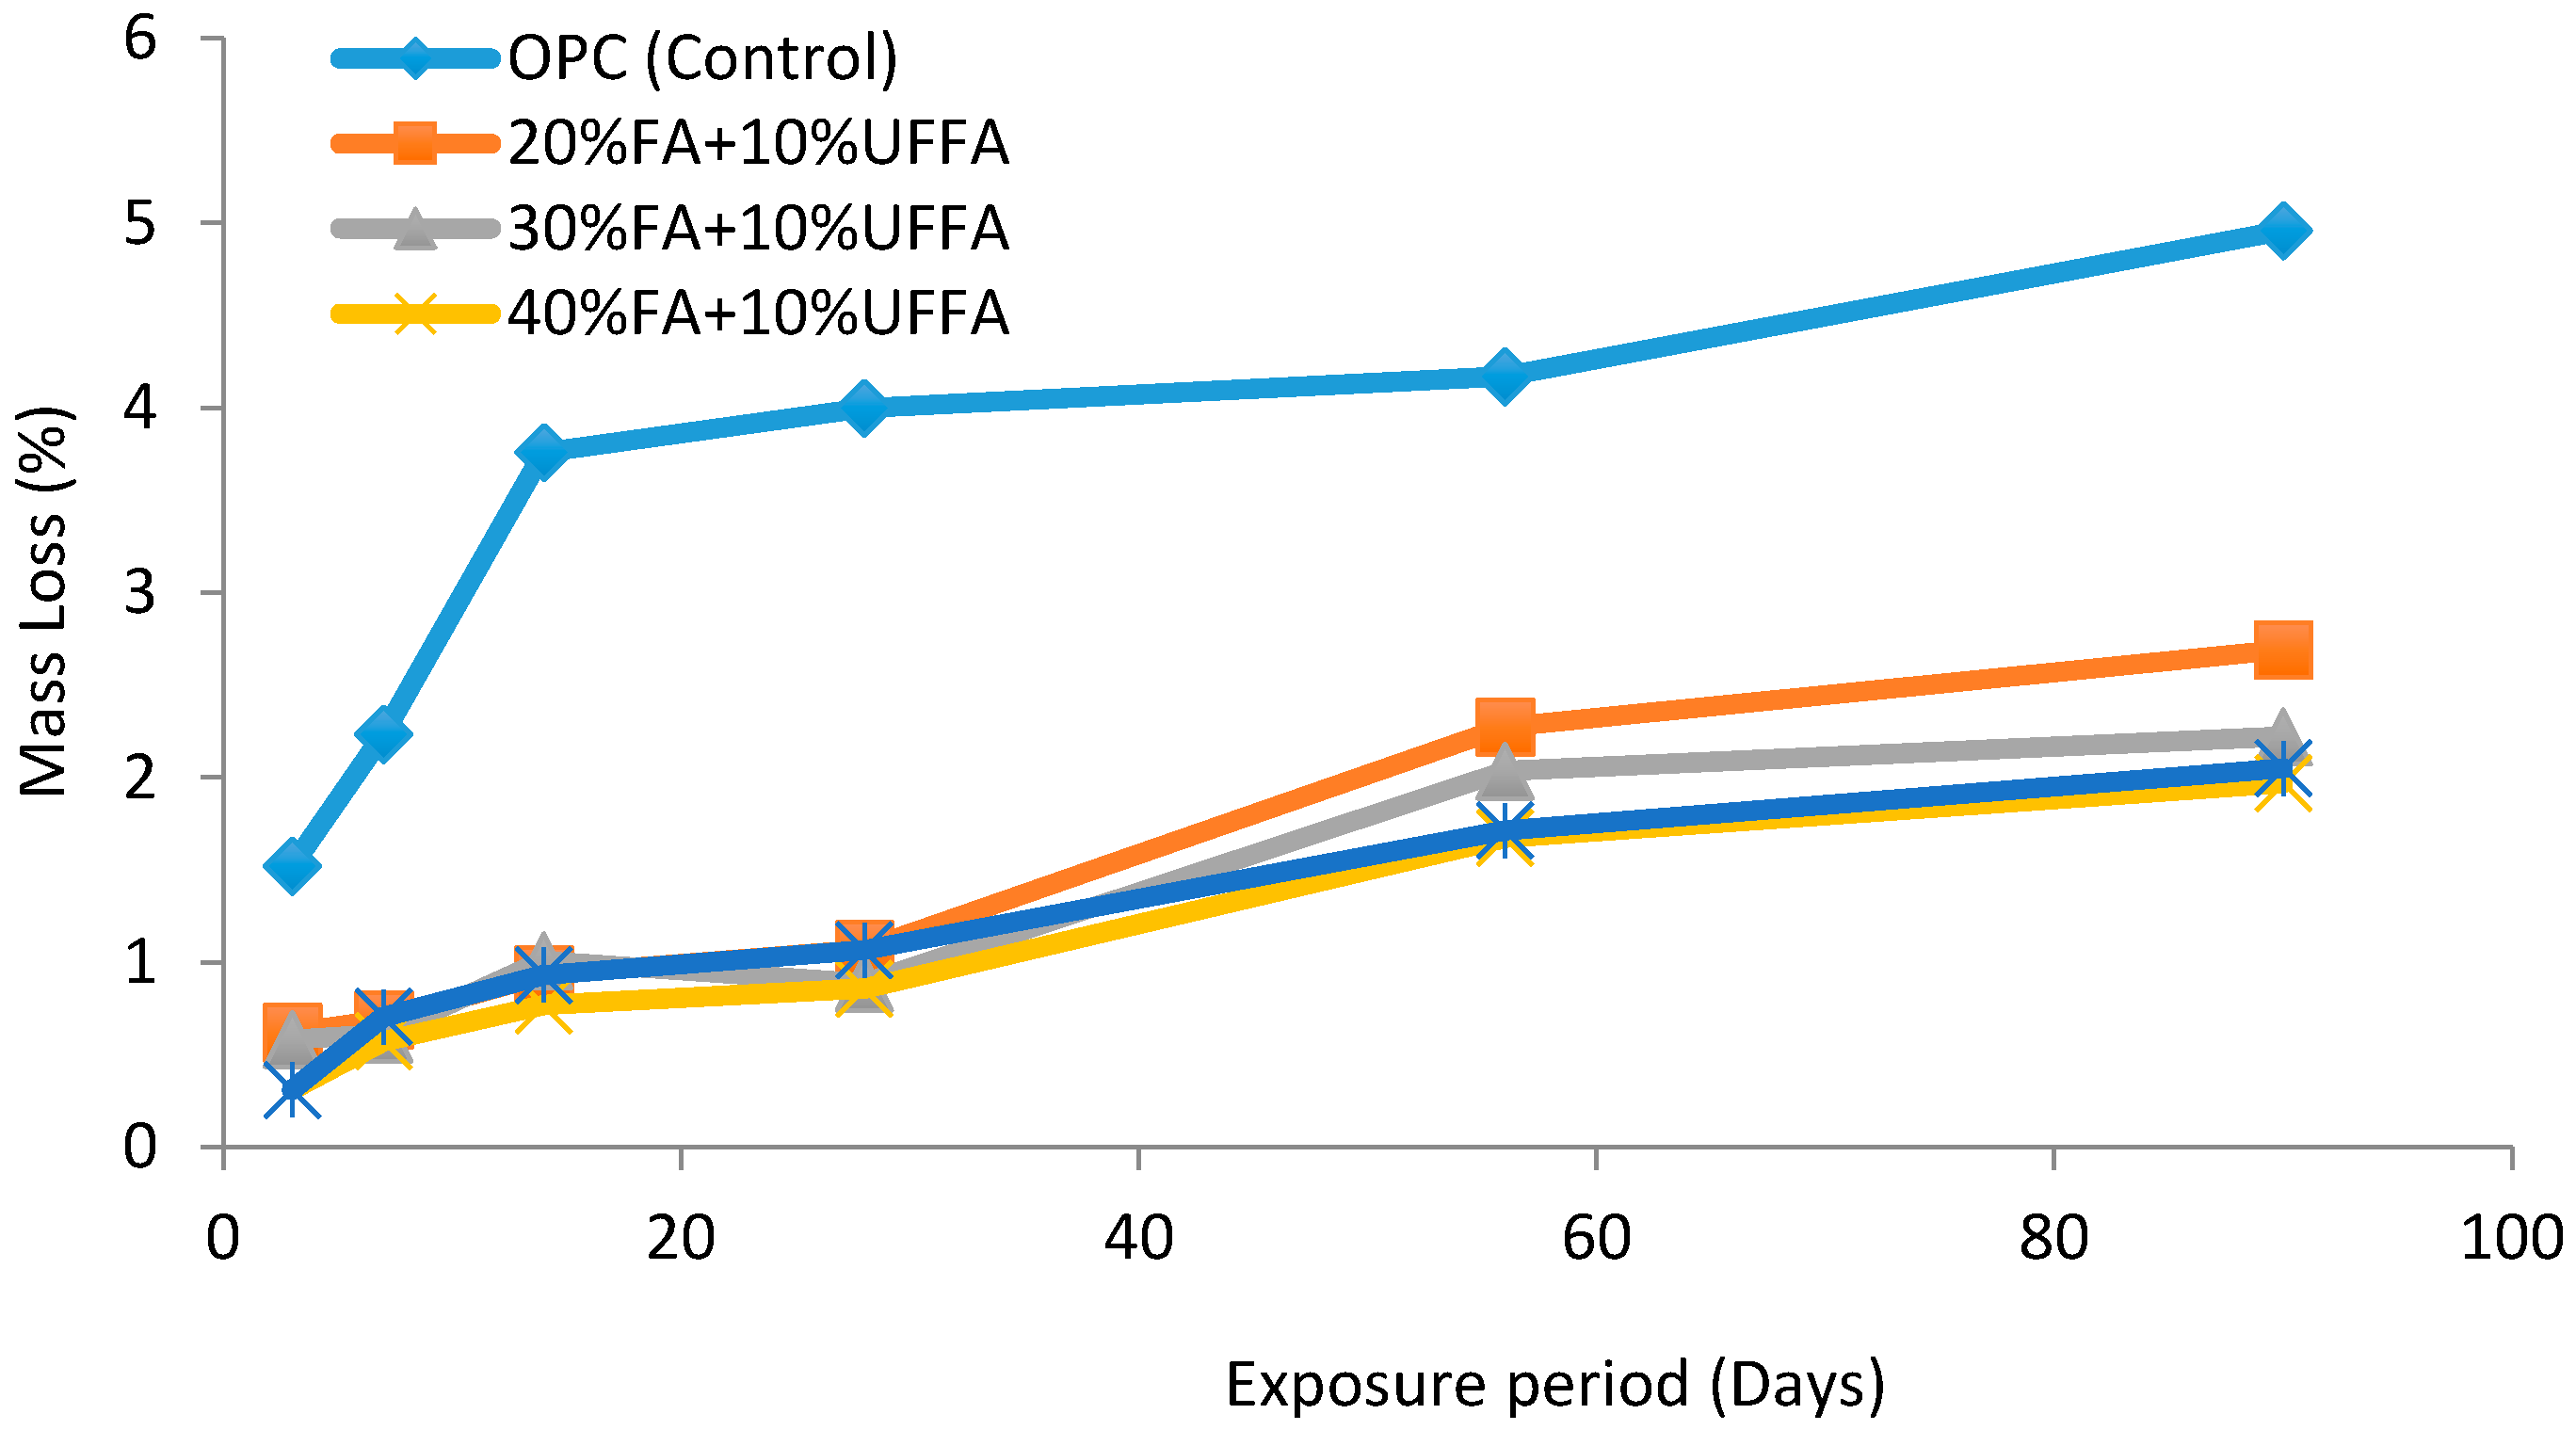
3.3. Behaviour in Nitric Acid Environment

Figure 4 shows the compressive strength loss of concrete immersed in 1.5% nitric acid for a period of up to 90 days. The compressive strength losses are summarised in Table 6 along with standard deviation. In Figure 4, it can be seen that Mix 1 (OPC) had the greatest decline in compressive strength at 90 days, with a compressive strength of 21.3 MPa. Mix 1 (OPC) was only able to retain 72% of its seven-day compressive strength after 90 days. Mix 2 (20% FA + 10% UFFA) showed the second largest variance, with compressive strength of 22.5 MPa compared to 27.4 MPa at seven days. The other mixes showed minimal changes in strength loss, with less than 10% strength loss. Comparing Figure 2 and Figure 4, it can also be observed that the strength loss of concrete in 3% sulphuric acid is much greater than in 1.5% nitric acid.
Figure 5 shows the percentage mass loss of concrete cubes immersed in 1.5% nitric acid for a period of up to 90 days. The mass losses are summarised in Table 7 along with standard deviation. It can be observed in Figure 5 that Mix 1 (OPC) had the most significant loss in mass, from 1.5% at three days, 4% at 28 days and 5% at 90 days. Rest of the mixes showed a much lower rate of loss with less than 0.6% at three days and less than 1% at 28 days. At 90 days, Mix 2 (20% FA + 10% UFFA) reached a mass loss of 2.7% while Mix 3 (30% FA + 10% UFFA) reached 2.2%. Both Mix 4 (40% FA + 10% UFFA) and Mix 5 (50% FA + 10% UFFA) showed a mass loss of 2% at 90 days, indicating the highest resistance. All mixes showed a consistent trend with the mass loss per cent increasing as the exposure period increased. This indicates that the resistance improves as the FA replacement level increases. The reduction of mass loss in mixes containing FA and UFFA can be attributed to the lower traces of CH due to pozzolanic reactions, minimising further reactions from the nitric acid.

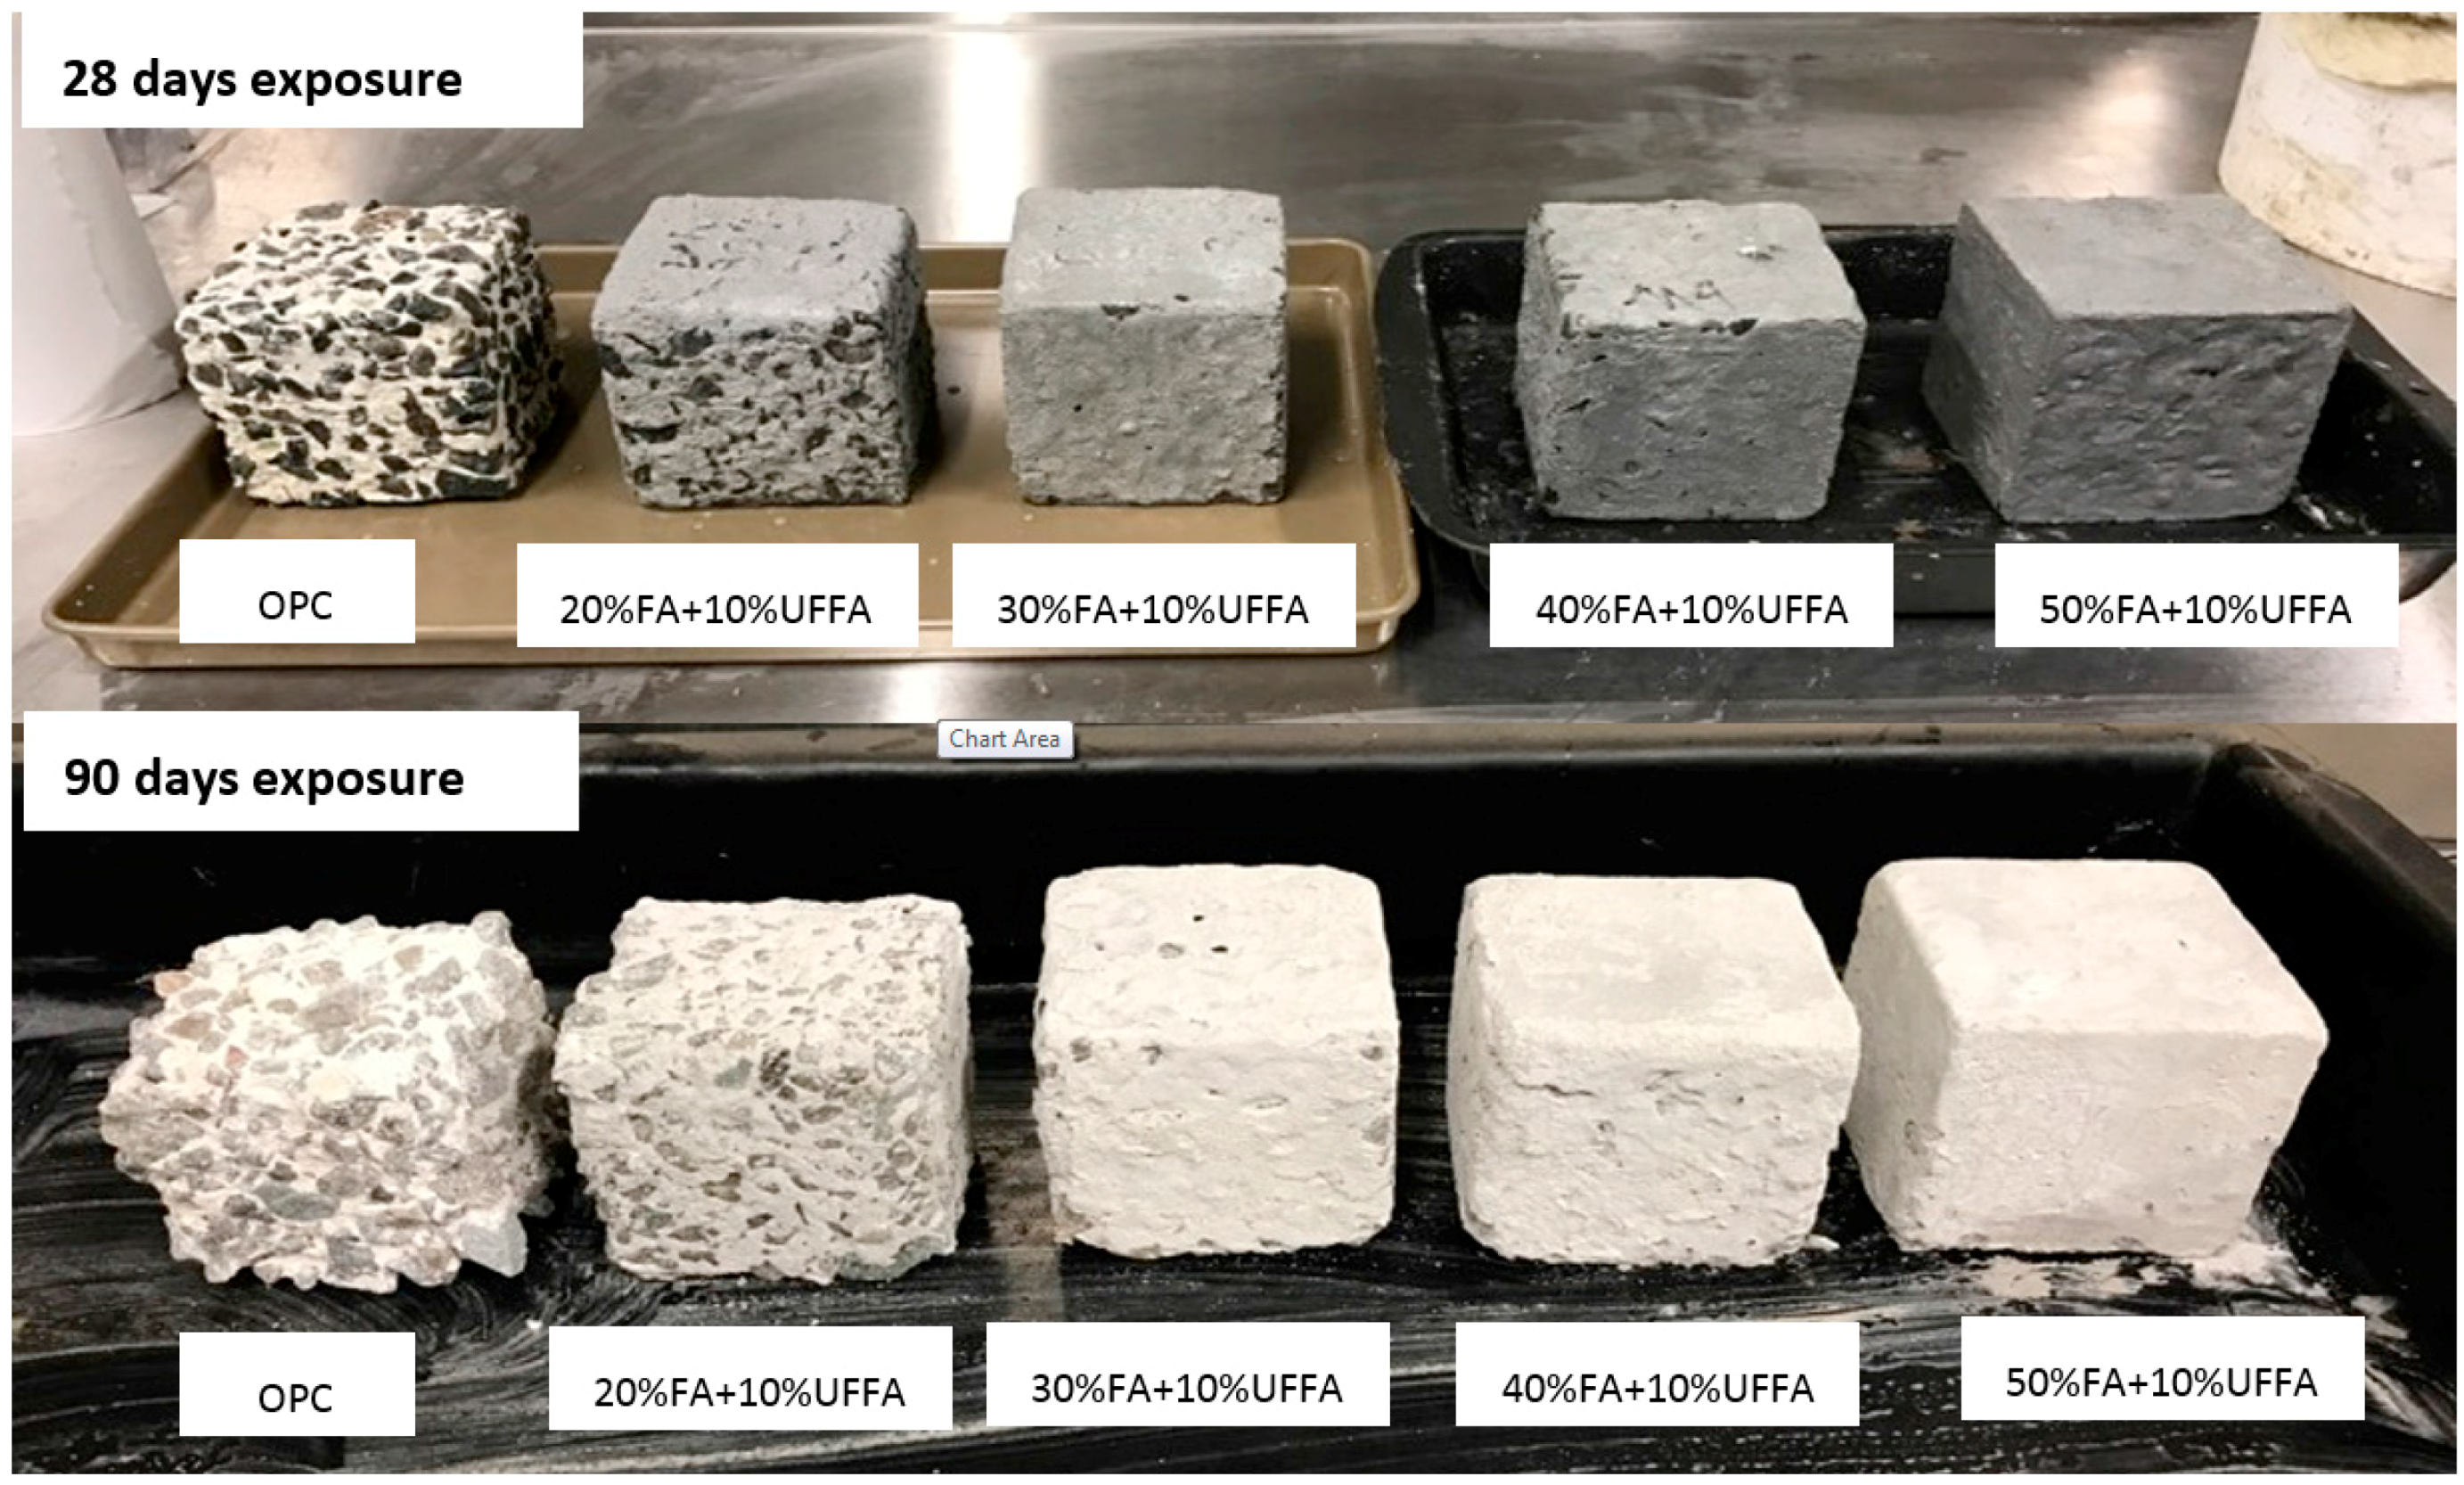
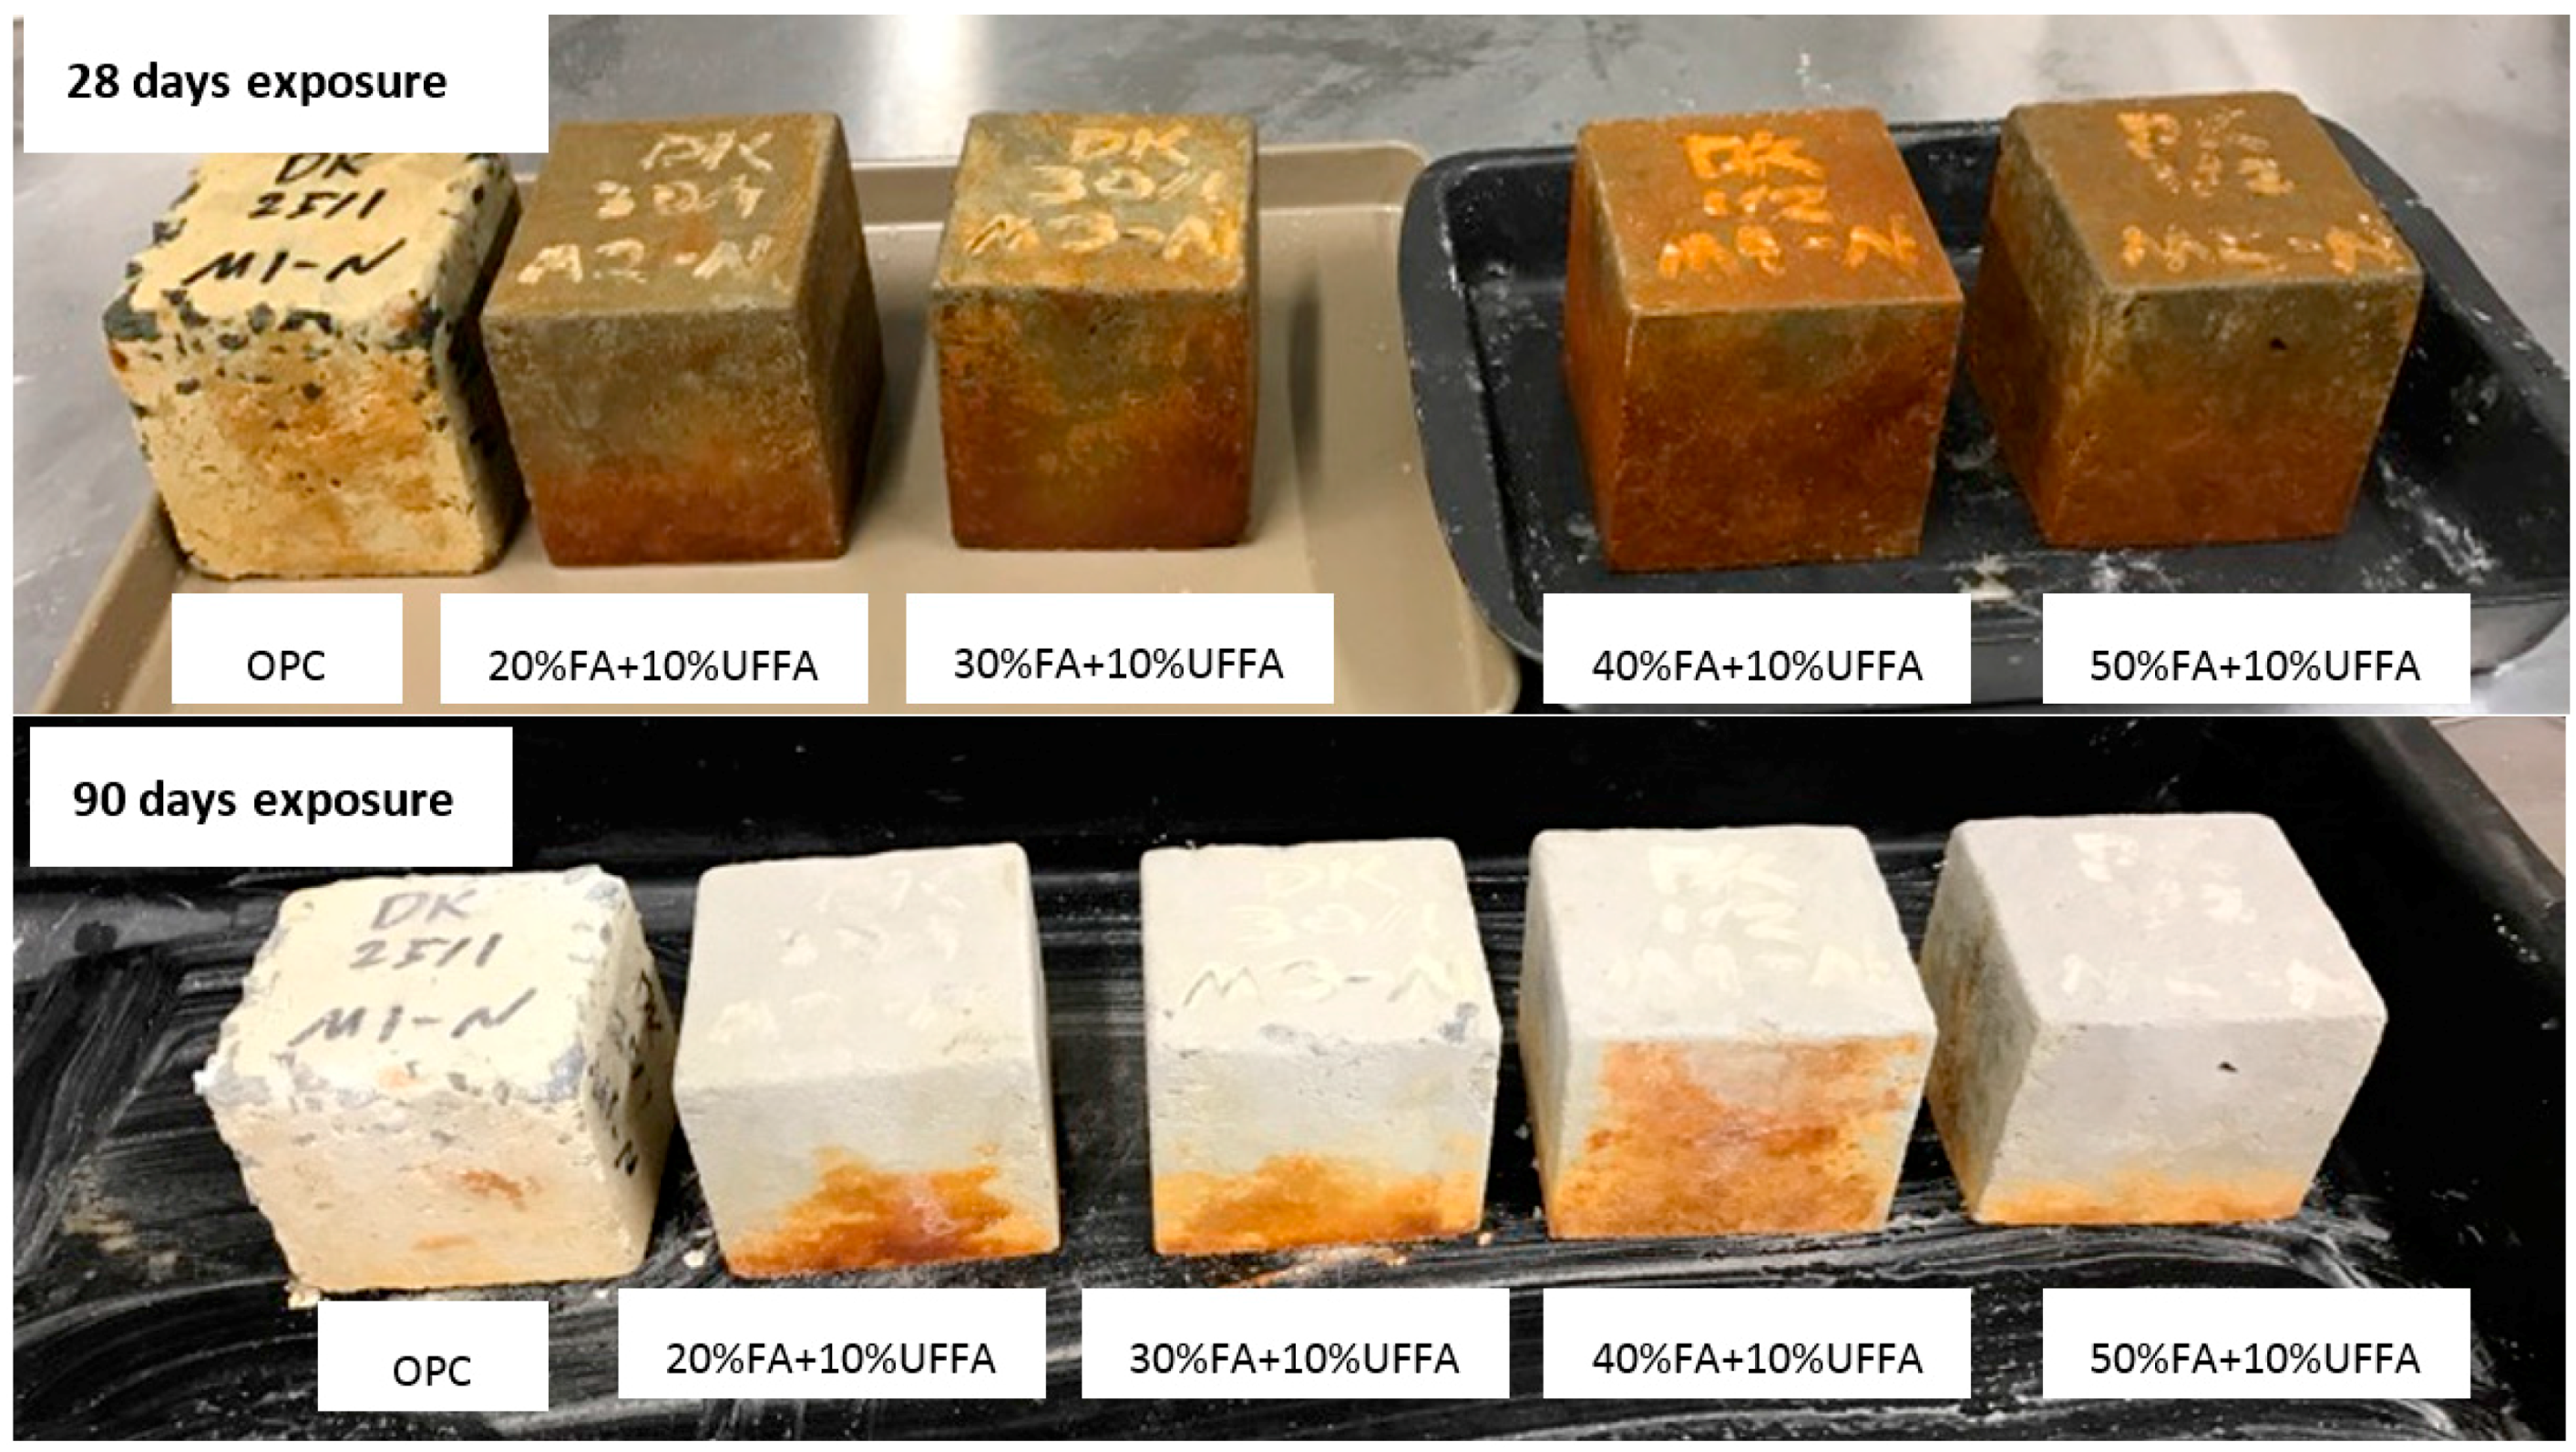
3.4. Visual Inspection

Figure 6 shows the various stages of concrete deterioration in 3% sulphuric acid environment. It can be seen that Mix 1 (OPC) suffered the greatest signs of deterioration at the end of 90 days in compared to the other mixes. Mix 1 (OPC) also showed the signs of peeling and full exposure of the aggregate surface at 28 days. At 90 days, the initial layer was found to be completely disintegrated with some of the initial surface aggregates already falling off. This would also link to the reduction of mass and compressive strength for this mix. Mix 2 (20% FA + 10% UFFA) showed the signs of deterioration, with the formation of gypsum at the surface at 28 days and becoming more porous. It was also observed that the initial layer of the surface started spalling off and exposed aggregates at 90 days. Mix 3 (30% FA + 10% UFFA) and Mix 4 (40% FA + 10% UFFA) showed similar behaviour. However, the deterioration signs were less as the volumes of FA increased. The deterioration was much slower, with the aggregates being slightly exposed at 90 days. The volumes of these two mixes also appeared to have increased at 28 days, which could be as a result of the formation of gypsum. Mix 5 (50% FA + 10% UFFA) appeared to be the most aesthetically resistant, with no major structural changes at the end of 90 days.
Figure 7 shows the various stages of concrete deterioration in 1.5% nitric acid environment. Similar to 3% sulphuric acid environment, Mix 1 (OPC) showed the most serious damage in 1.5% nitric acid, with spalling of the surface beginning already at 28 days. At 90 days, larger surfaces of the aggregates can be observed with more severe spalling of the surface. Mix 2 (20% FA + 10% UFFA) showed the higher resistance compared to Mix 1 (OPC). However, Mix 2 (20% FA + 10% UFFA) showed severe spalling and exposed aggregates at 90 days. Other mixes behaved in a similar fashion with structural changes not as severe as Mix 1 (OPC) or Mix 2 (20% FA + 10% UFFA). All mixes showed a browning of colour at 28 days, turning lighter again at 90 days after disintegration and spalling of the initial layer.

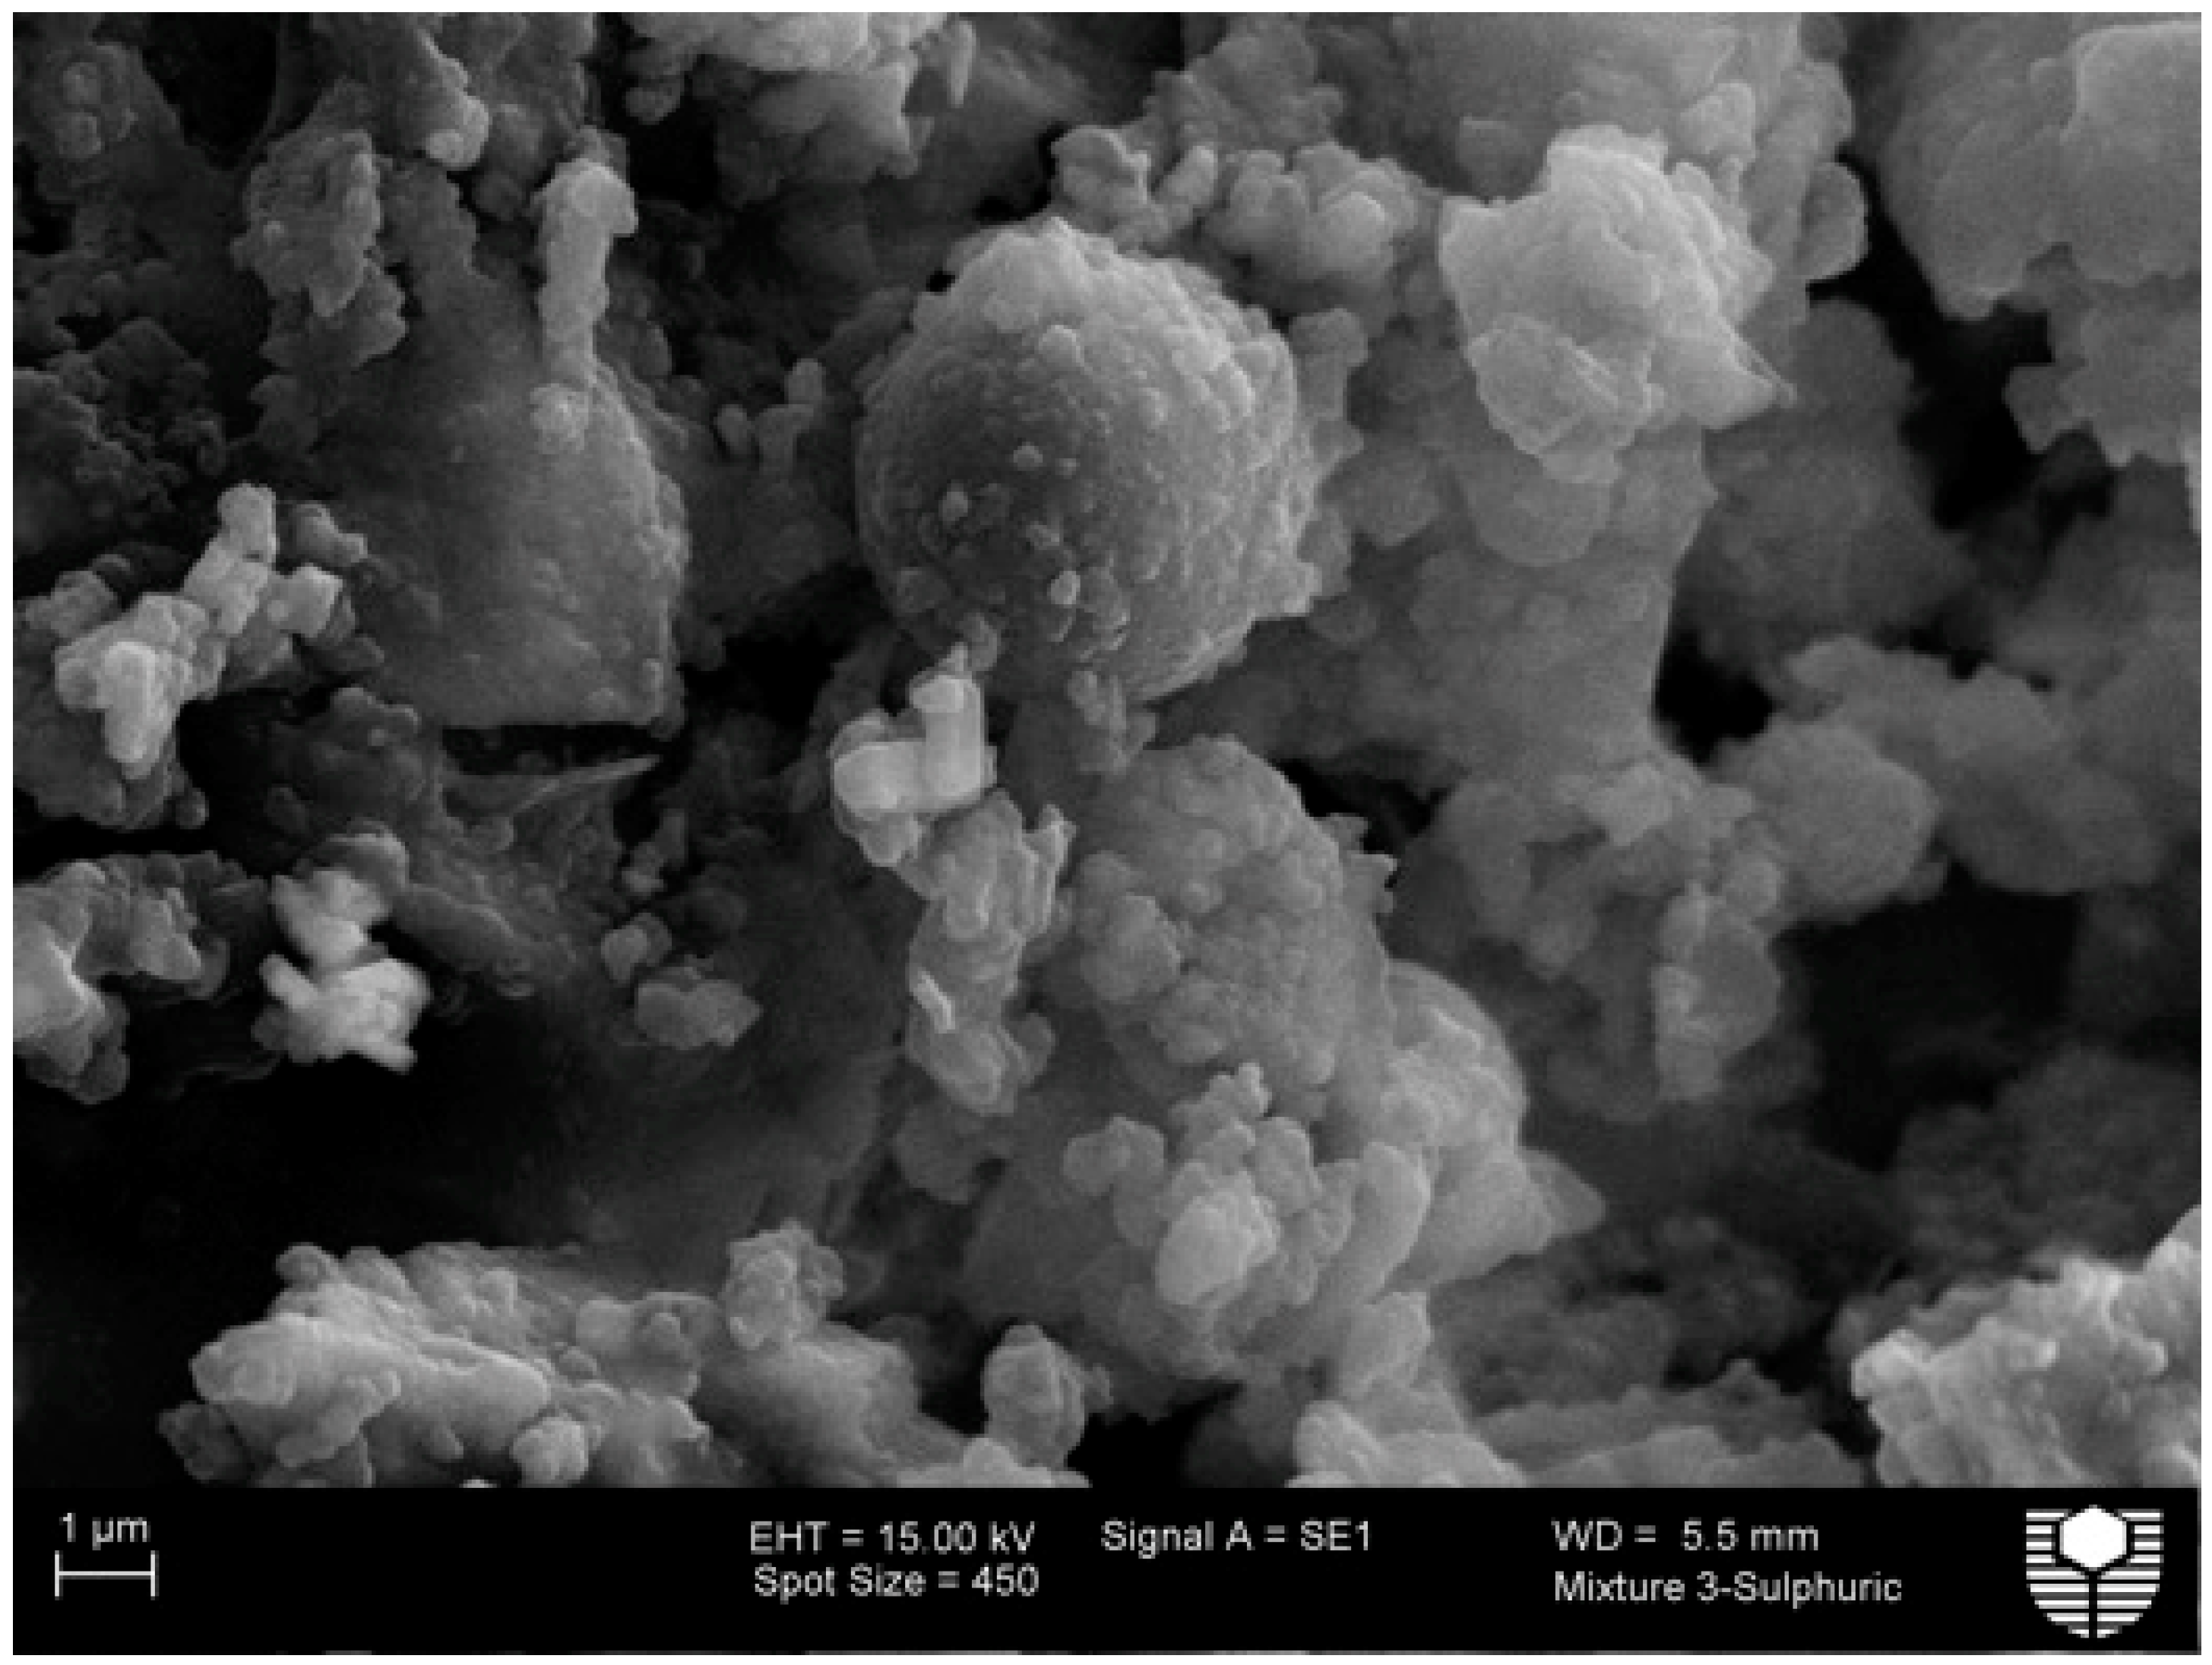
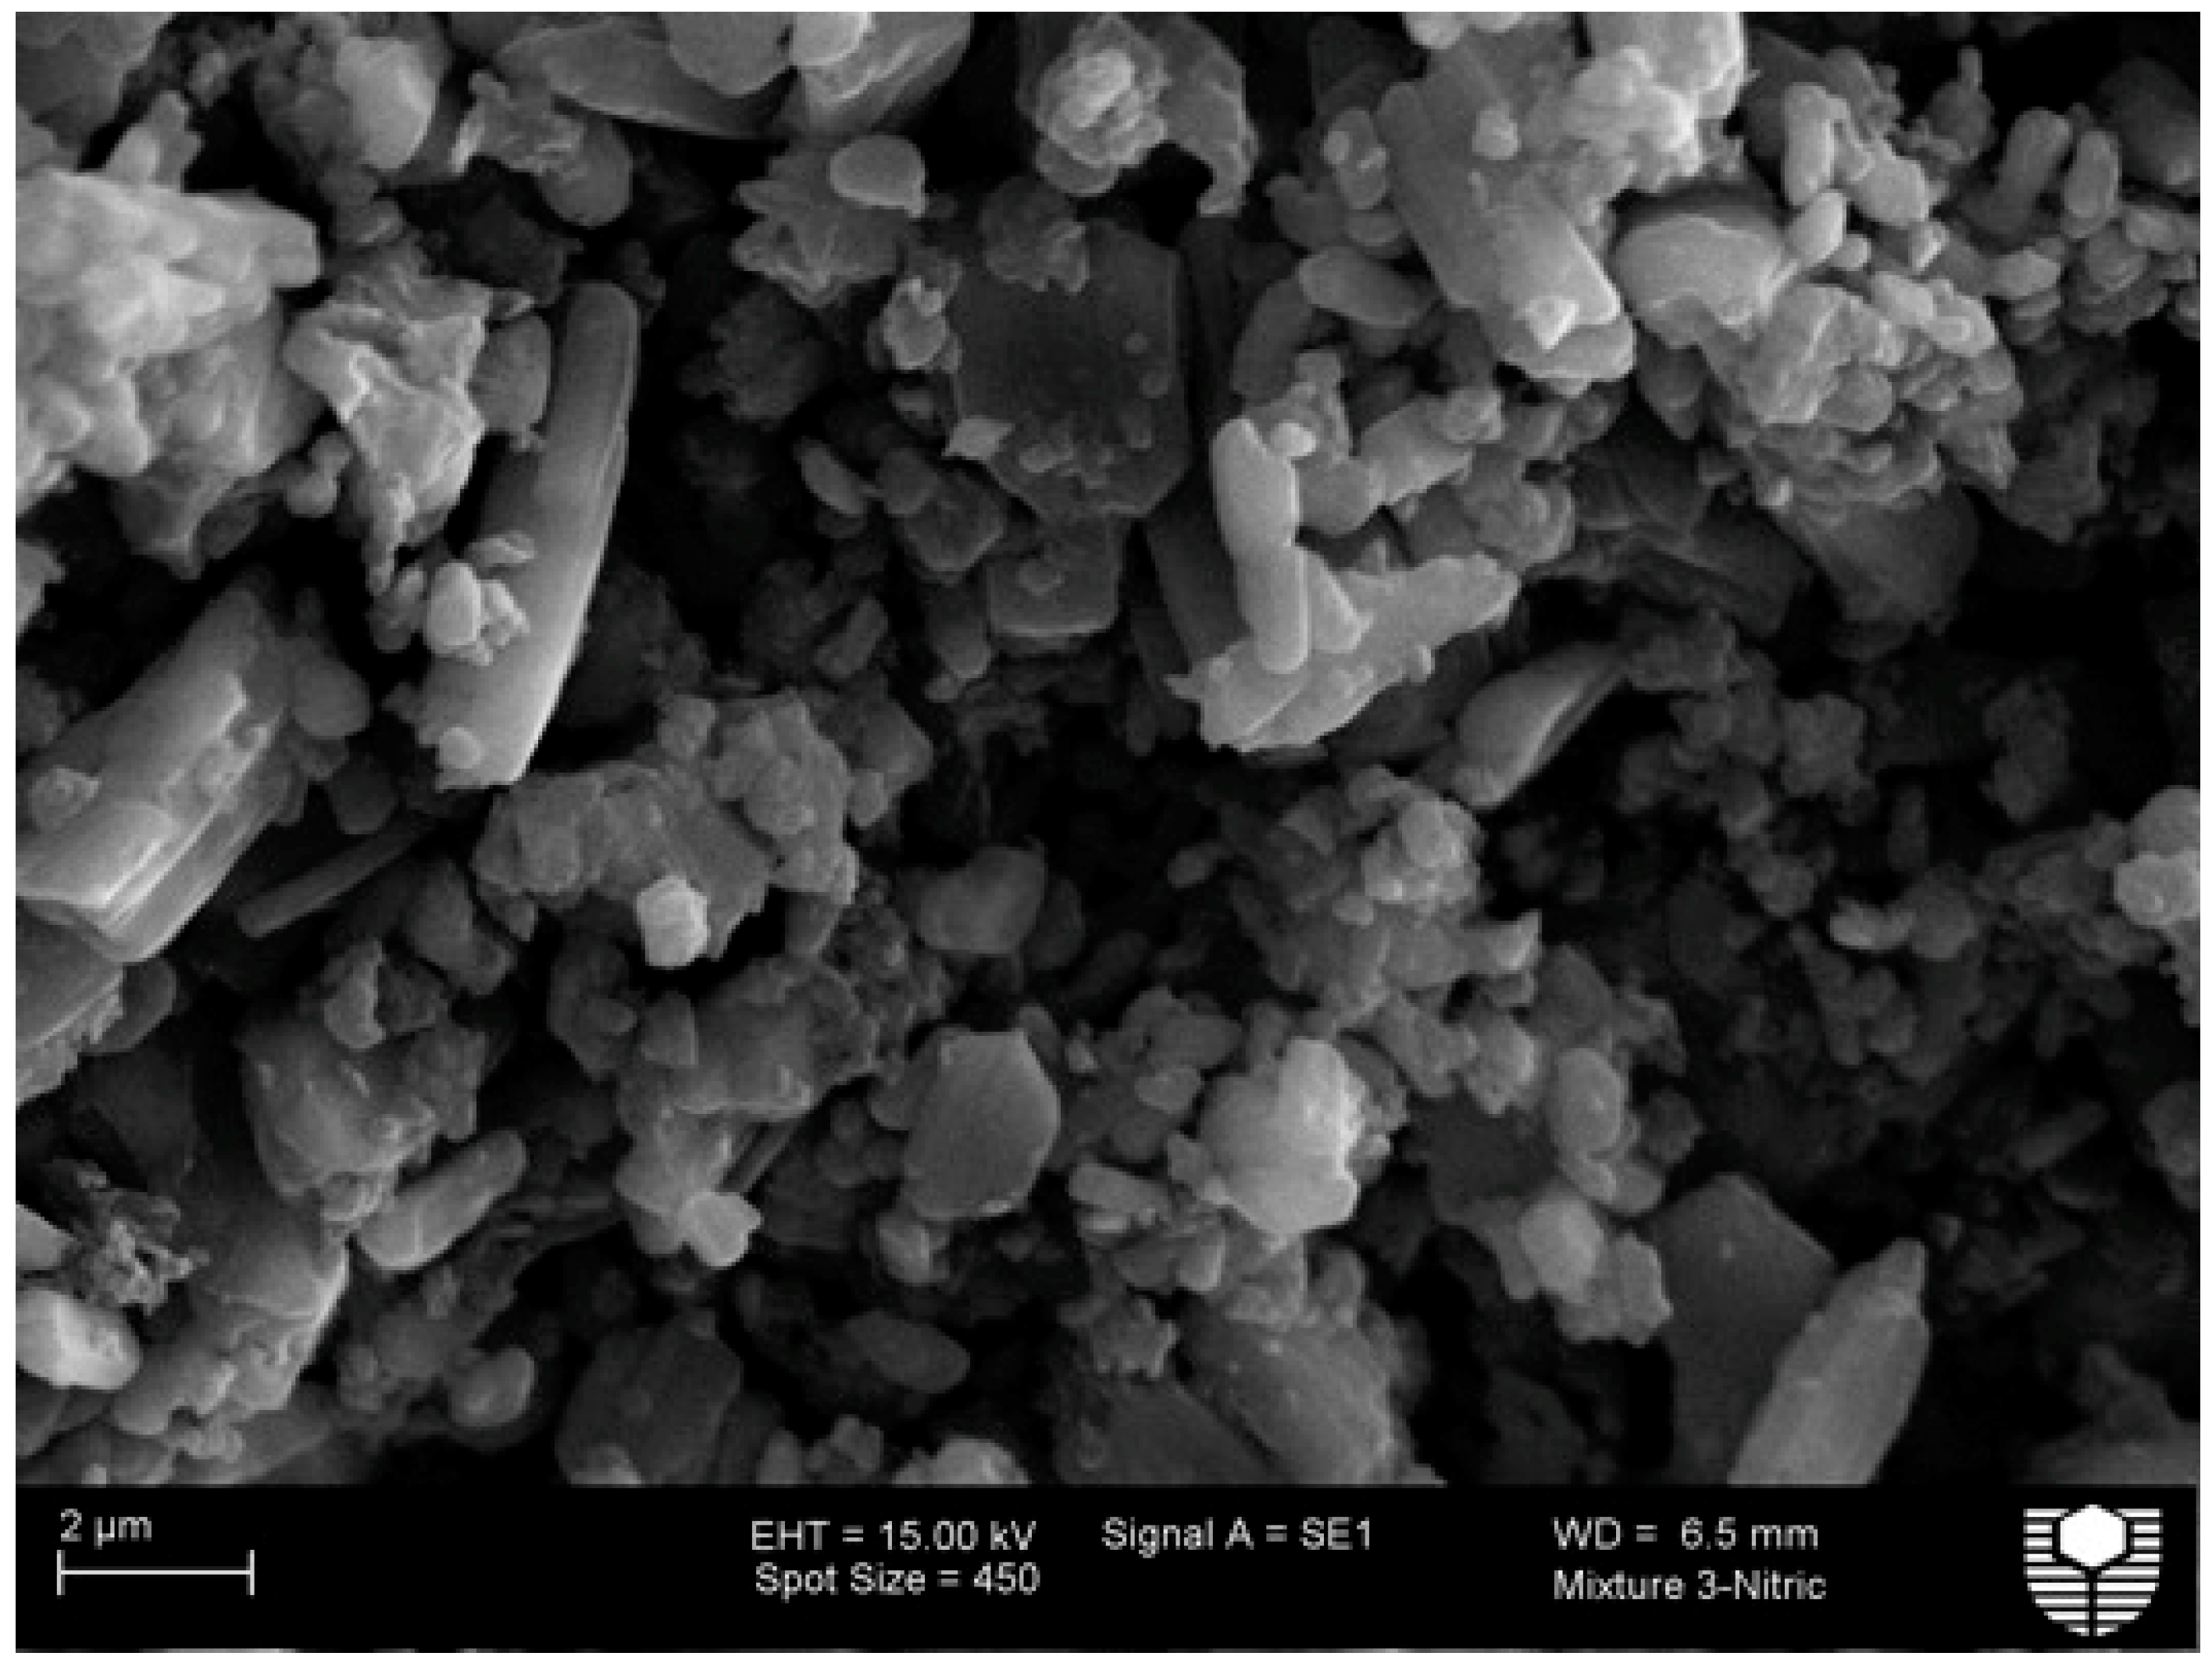
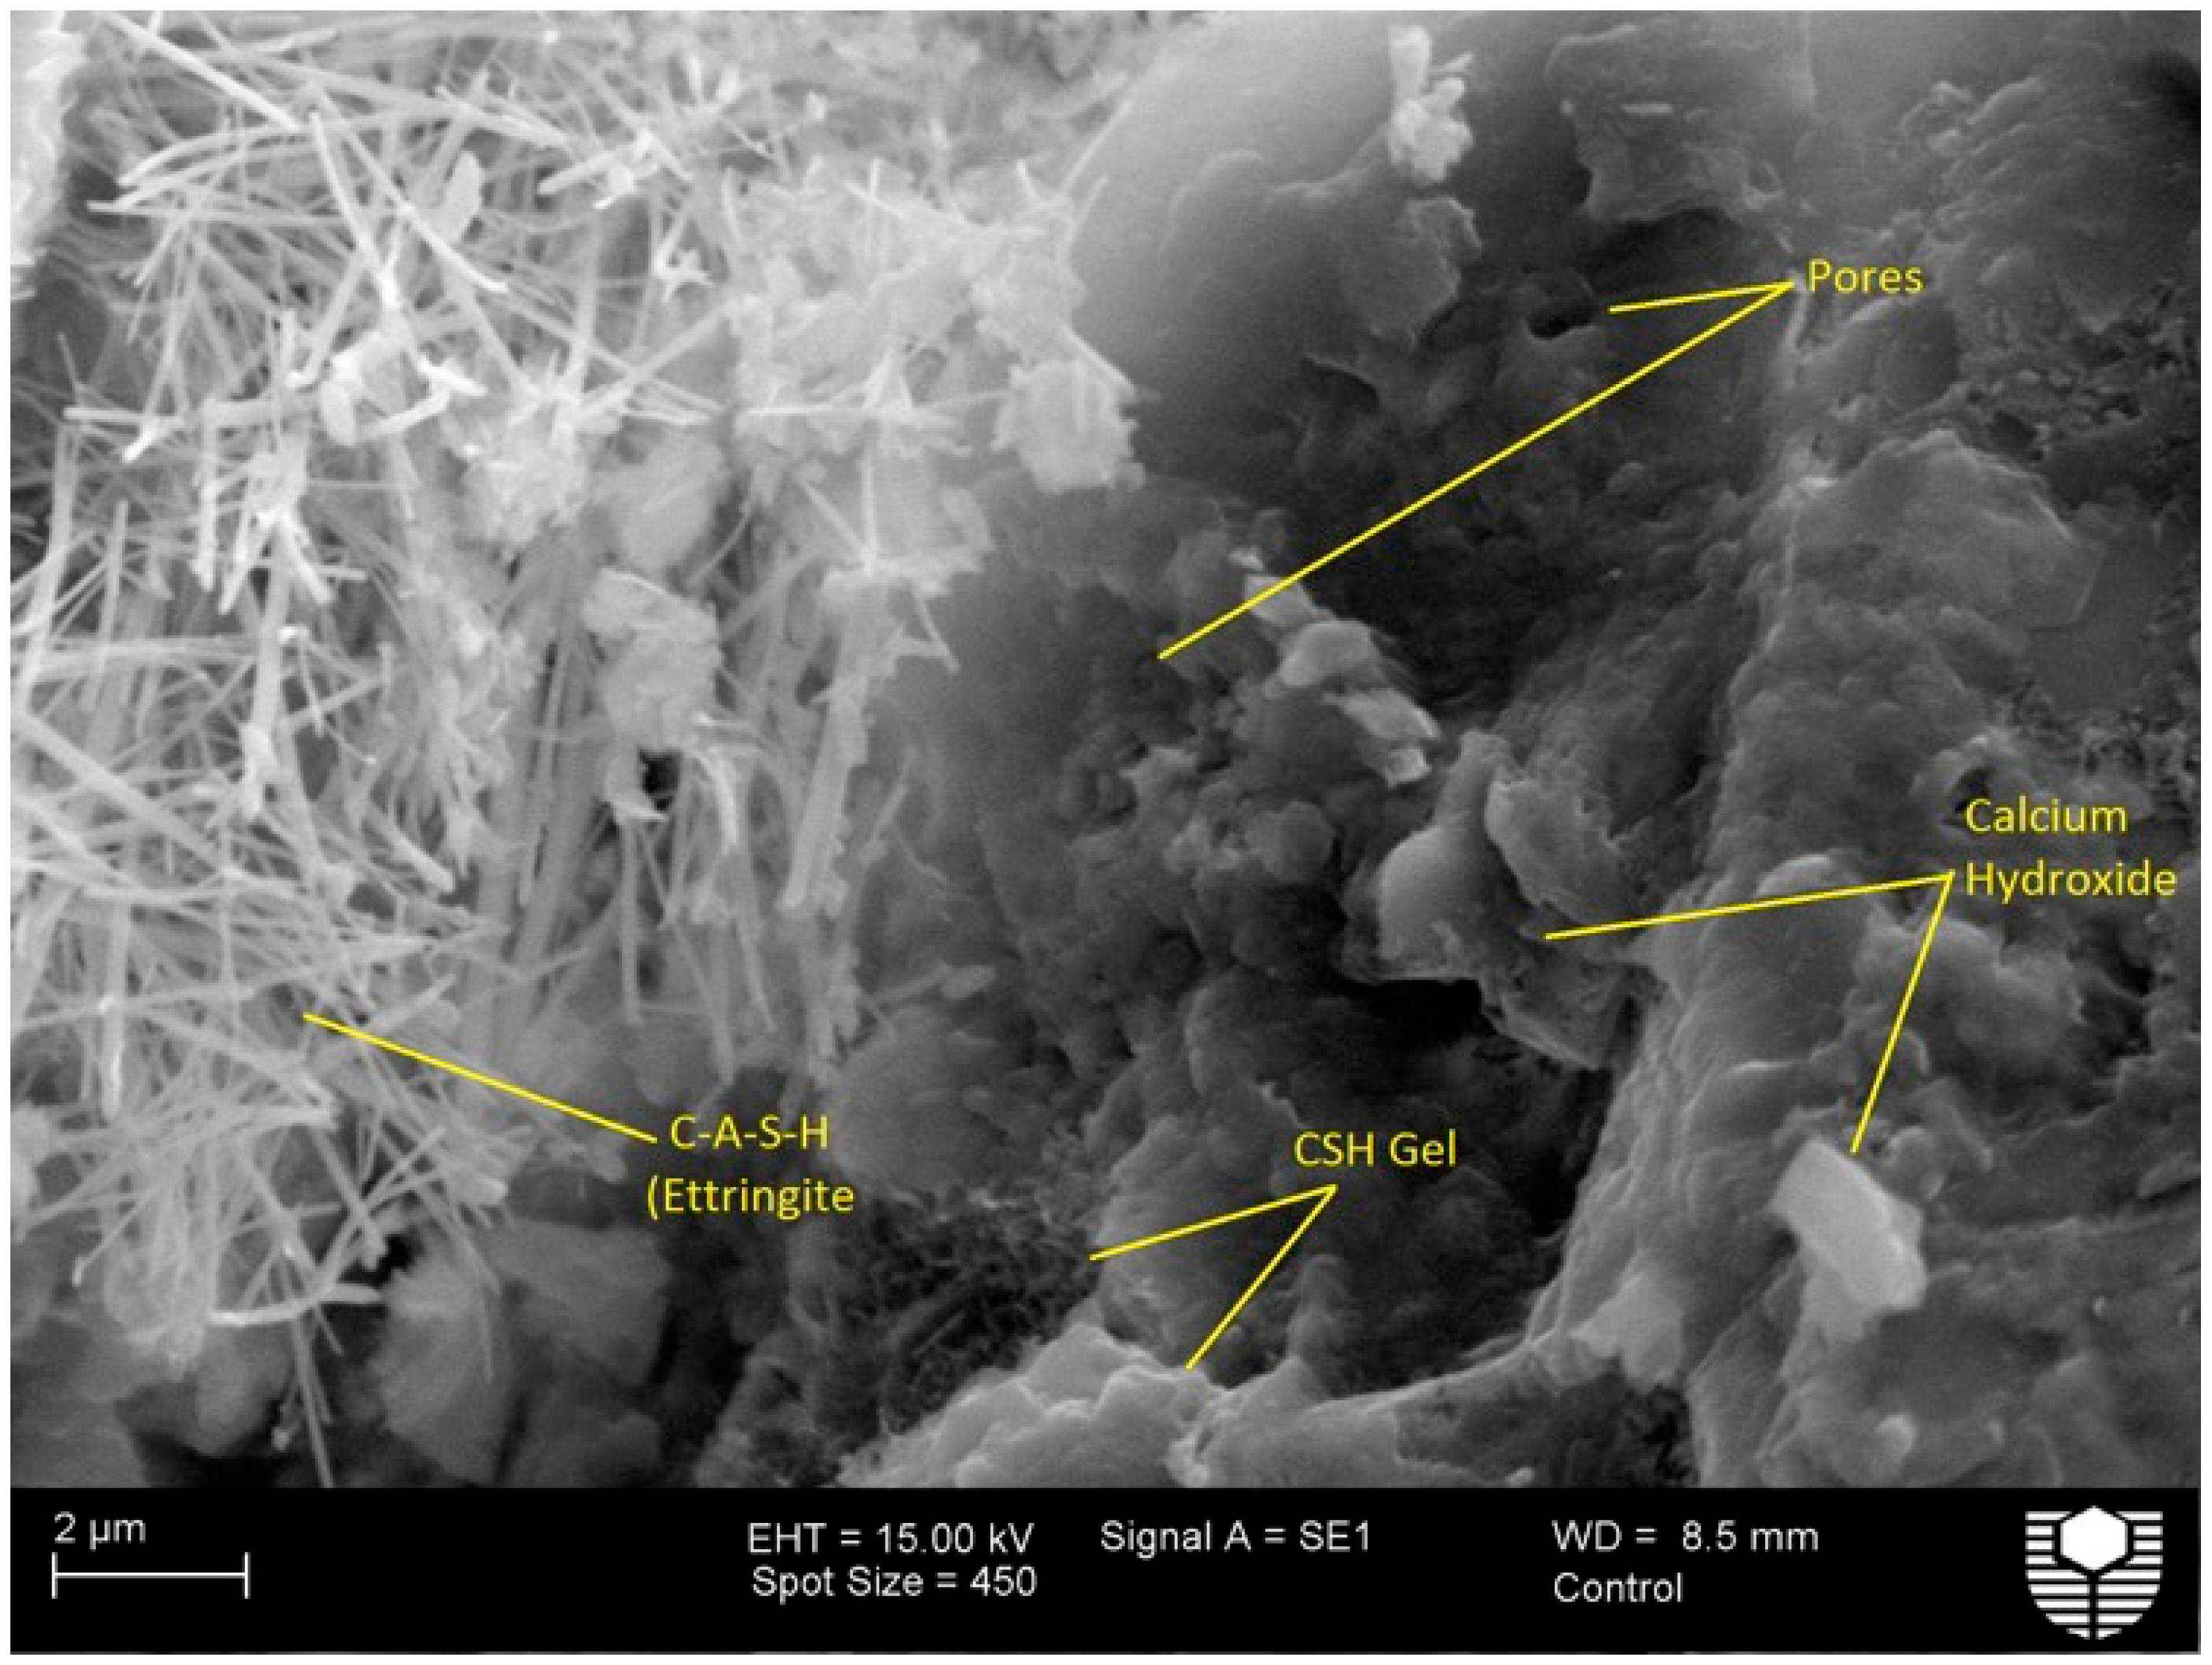
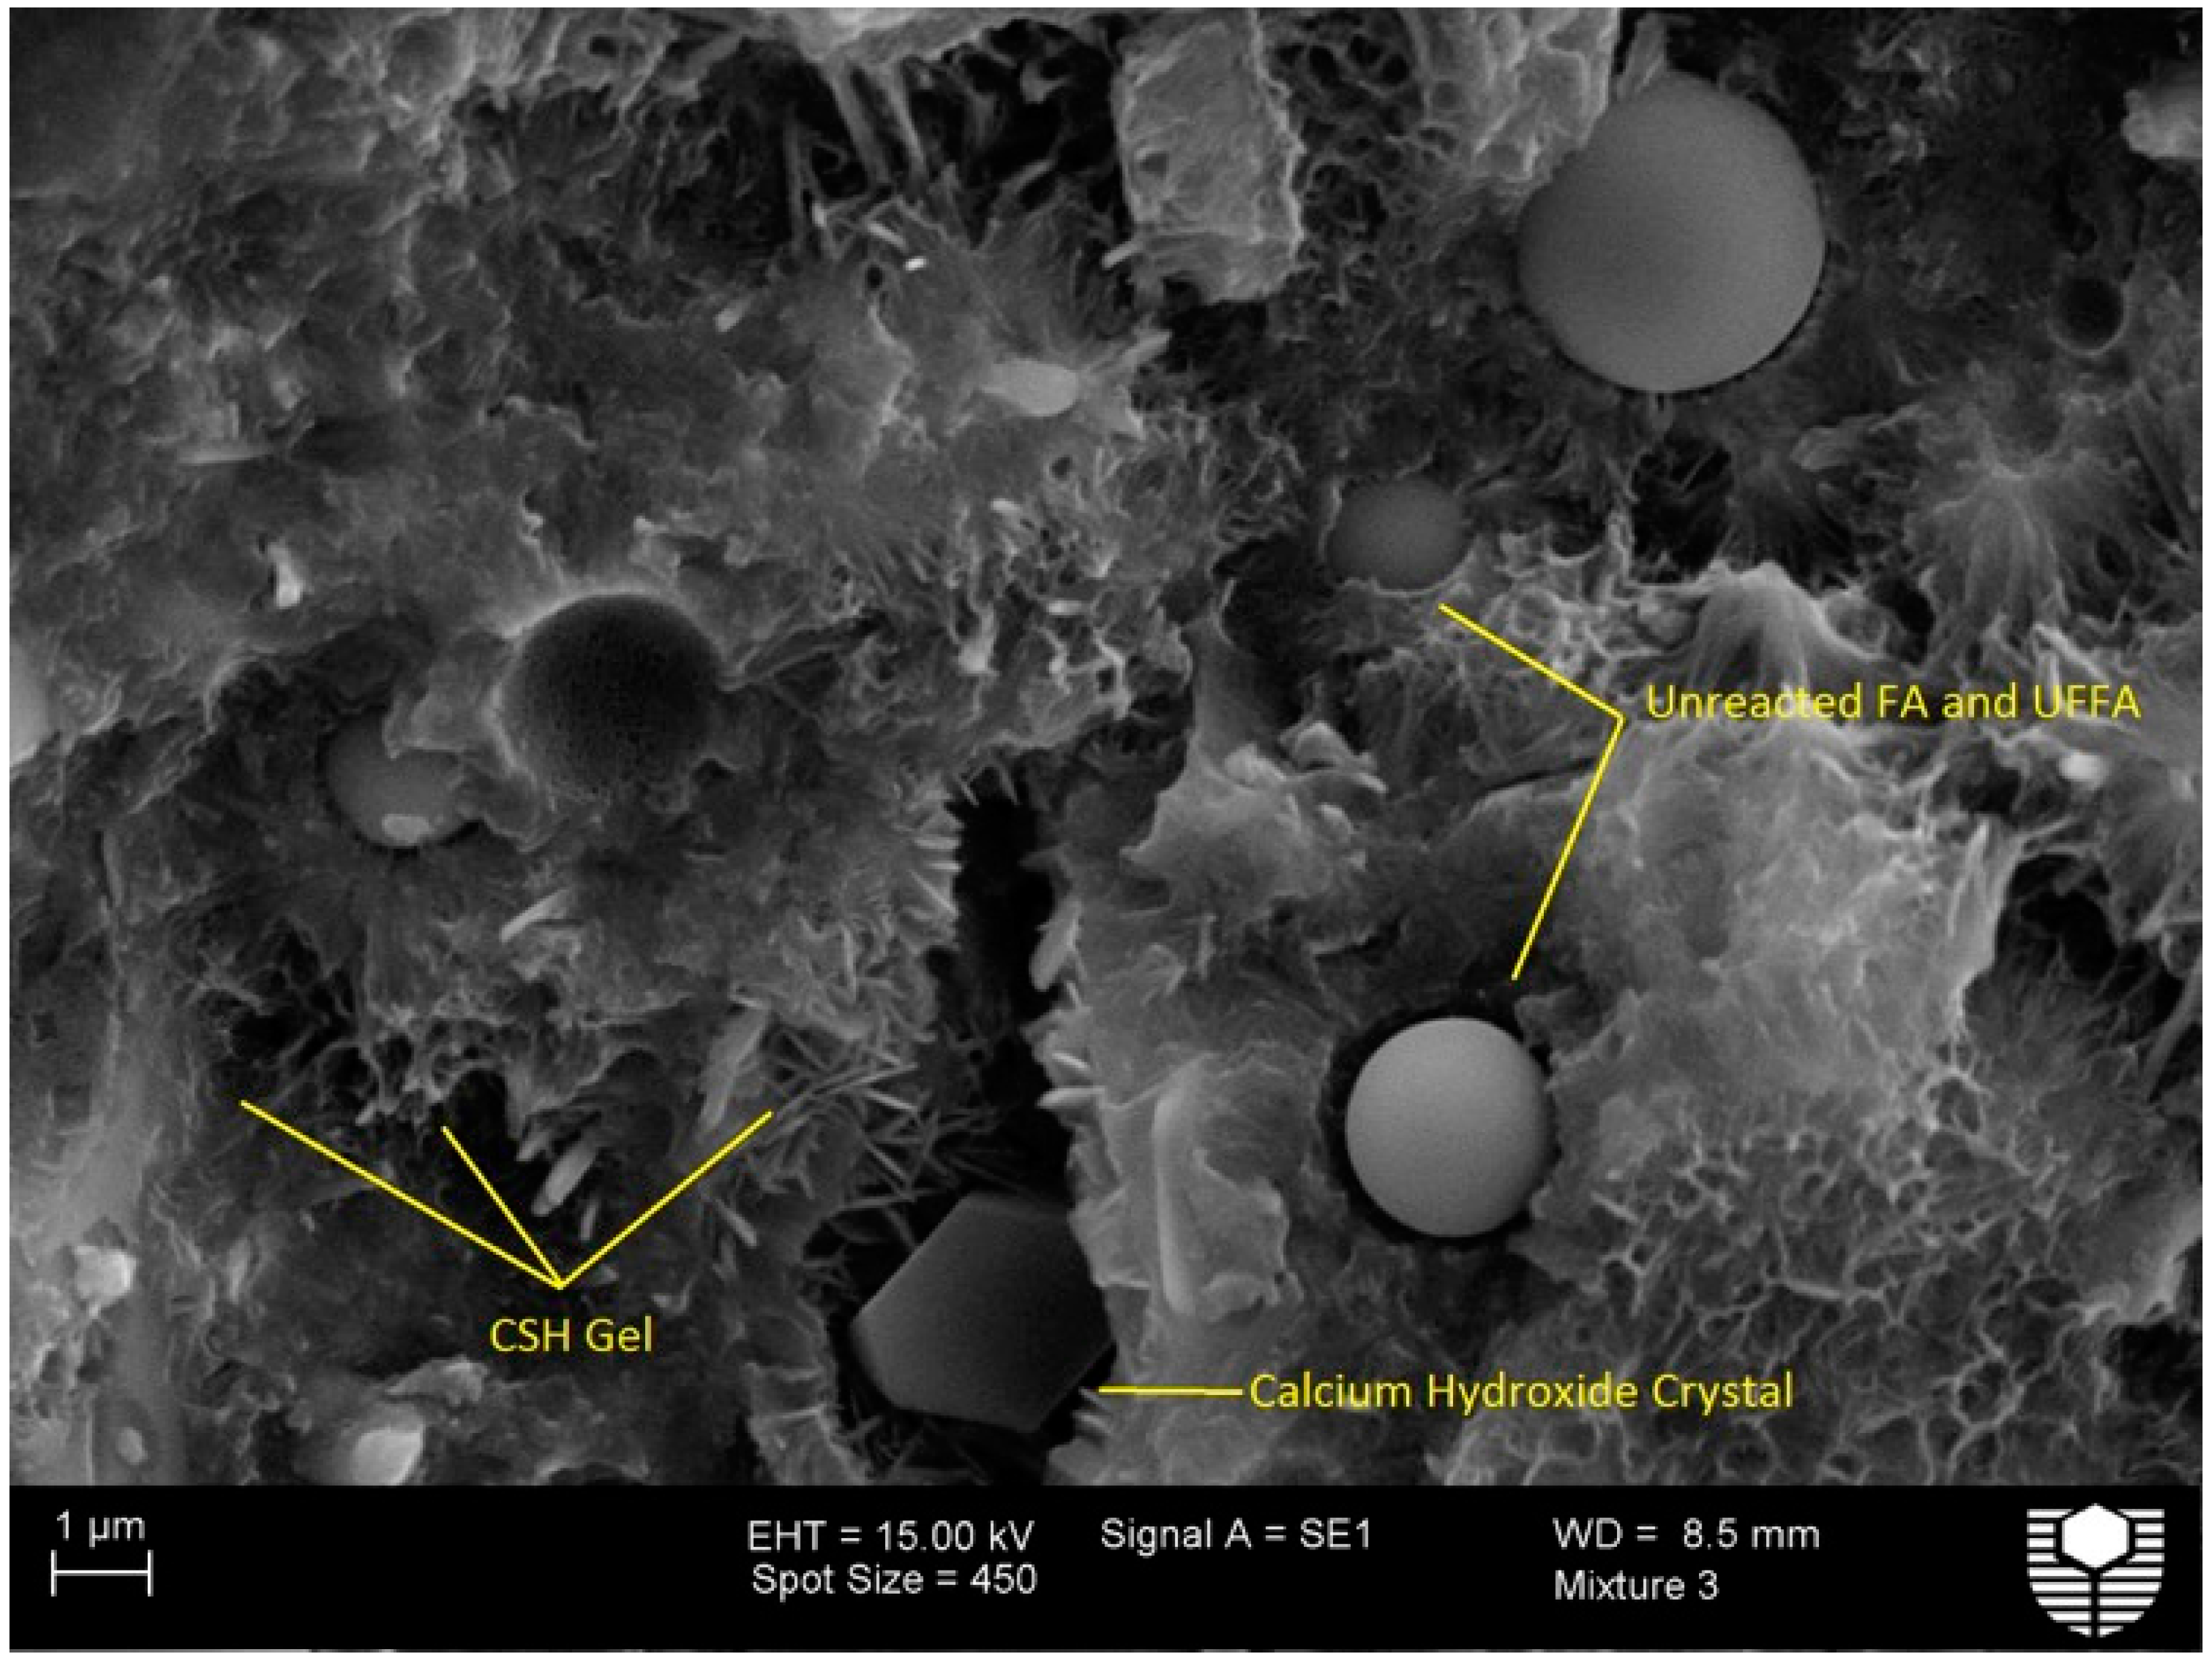
3.5 Microstructural Observation from SEM

The SEM image of a sample from Mix 1 (OPC) at 28 days is shown in Figure 8. The hexagonal plate-shaped crystals of CH and C-S-H gels are clearly visible in the image. The presence of excess hydrous calcium-sulpho-aluminate hydrate (also known as ettringite) characterised by needle-like structures is also evident. Large number of pores and voids can also be seen in the image. The SEM image of a sample from Mix 3 (30% FA + 10% UFFA) at 28 days is shown in Figure 9. The SEM image shows a denser matrix with much lower trace of the CH crystals. It is considered that the majority of CH content might have reacted with the amorphous silica of FA and UFFA to produce secondary C-S-H gel by the pozzolanic reactions. The denser microstructure is likely to be associated with micro-filing effects of UFFA. The UFFA might have filled the pores and voids between the unreacted particles in the hydrated matrix, effectively densifying the pore structure.
Figure 10 shows the SEM image of a sample from Mix 3 (30% FA + 10% UFFA) exposed to 3% sulphuric acid for 28 days. The surface appears to be highly porous in the image. A large scale of possible micro-cracks and voids can also be observed. A noticeable amount of C-S-H gel appears to have been decomposed into finer particles. Remains of calcium hydroxide crystals and unreacted FA and UFFA also appear to be present. Furthermore, the signs of gypsum can be seen to cover the surface area including particles of FA. The extensive formation of gypsum in the surface regions may have caused the disintegration resulting the spalling of the surface. Figure 11 shows the SEM image of sample from Mix 3 (30% FA + 10% UFFA) immersed in 1.5% nitric acid for a period of 28 days. The surface also appears to be very porous, with the salt by-products on the surface caused by the reaction of the acid with the CH. Small round particles appear are the unreacted FA and UFFA. The broken surface pieces are likely to be the traces of calcium nitrate salt and calcium nitro-aluminate hydrate. It also appears that the ions from the nitric acid have completely disintegrated the C-S-H gel on the outer surface of the sample leading to dissolution and deterioration of the surface layer.
Total porosity and the presence of microcracks have significant influence on the permeability of concrete. In general, permeability decreases with an increase in porosity up to a certain level, and then the influence of porosity on permeability is negligible. The presence of microcracks also increases the permeability of concrete, and thus encourages more rapid deterioration.

4. Conclusions

The behaviour of a sustainable concrete containing fly ash and ultra fine fly ash in 3% sulphuric acid and 1.5% nitric acid environment was studied in this research. Based on the results obtained, the following conclusions are made:
  • In sulphuric acid environment, the compressive strength loss was minimum for a concrete mix in which cement was replaced with 30% fly ash and 10% ultra fine fly ash. The mass loss was less in this mix compared to the mix without fly ash. However, mass loss was also less in mixes containing higher amounts of fly ash.
  • In nitric acid environment, concrete mixes containing 20% fly ash and 10% ultra fine fly ash and 30% fly ash and 10% ultra fine fly ash had the minimum compressive strength loss. However, the mass loss in mix containing 30% fly ash and 10% ultra fine fly ash was less than the mix containing 20% fly ash and 10% ultra fine fly ash.
  • The SEM image of concrete mix with 30% fly ash and 10% ultra fine fly ash cured in water for 28 days showed denser microstructure characterised by less amounts of calcium hydride crystals. The SEM image of concrete mix containing 30% fly ash and 10% ultra fine fly ash exposed to sulphuric acid for 28 days showed that the surface is highly porous. A noticeable amount of C-S-H gel appears to have been decomposed into finer particles. When the same mix was exposed to nitric acid for a period of 28 days, the SEM image showed that the surface is very porous, with the salt by-products on the surface caused by the reaction of the acid with the calcium hydroxide.

Author Contributions

Salim Barbhuiya conceived and designed the experiments and wrote the paper. Davin Kumala performed the experiments and analysed the data.

Conflicts of Interest

The authors declare no conflict of interest.

References

  1. Flower, D.; Sanjayan, J.; Baweja, D. Environmental impacts of concrete production and construction. In Proceedings of the Concrete Institute of Australia Biennial Conference, Melbourne, Australia, 17–19 October 2005. [Google Scholar]
  2. Han, S.H.; Kim, J.K.; Park, Y.D. Prediction of compressive strength of fly ash concrete. Cem. Concr. Res. 2003, 33, 965–971. [Google Scholar] [CrossRef]
  3. Malhotra, V.M. Durability of concrete incorporating high-volume of low calcium (ASTM class F) fly ash. Cem. Concr. Compos. 1990, 12, 487–493. [Google Scholar] [CrossRef]
  4. Bilodeau, A.; Malhotra, V.M. High-volume fly ash system: Concrete solution for sustainable development. ACI Mater. J. 2000, 97, 41–48. [Google Scholar]
  5. Langey, W.S.; Carette, G.G.; Malhotra, V.M. Strength development and temperature rise in large concrete blocks containing high-volumes of low-calcium (ASTM class F) fly ash. ACI Mater. J. 1992, 89, 362–368. [Google Scholar]
  6. Standards Australia. Australian Standard AS3582.1, Supplementary Cementitious Materials for Use with Portland and Blended Cement—Part 1: Fly Ash; Standards Australia International: Sydney, Australia, 1998. [Google Scholar]
  7. Standards Australia. Australian Standard AS3972, General Purpose and Blended Cements; Standards Australia International: Sydney, Australia, 2010. [Google Scholar]
  8. Malhotra, V.M.; Zhang, M.H.; Read, P.H.; Ryell, J. Long-term mechanical properties and durability characteristics of high-strength/high-performance concrete incorporating supplementary cementing materials under outdoor exposure conditions. ACI Mater. J. 2000, 97, 518–525. [Google Scholar]
  9. Xu, A.; Sarkar, S.L. Microstructural study of gypsum activated fly ash hydration in cement paste. Cem. Concr. Res. 1991, 21, 1137–1147. [Google Scholar]
  10. Paya, J.; Monzo, J.; Borrachero, M.V. Mechanical treatment of fly ashes: Part III. Studies on strength development of ground fly ashes. Cem. Concr. Res. 1997, 27, 1365–1377. [Google Scholar] [CrossRef]
  11. Katz, A. Microstructure study of alkali-activated fly ash. Cem. Concr. Res. 1998, 28, 197–208. [Google Scholar] [CrossRef]
  12. Barbhuiya, S.; Gbagbo, J.; Russell, M.; Basheer, M. Properties of fly ash concrete modified with hydrated lime and silica fume. Constr. Build. Mater. 2009, 23, 3233–3239. [Google Scholar] [CrossRef]
  13. Nochaiya, T.; Wongkeo, W.; Chaipanich, A. Utilization of fly ash with silica fume and properties of Portland cement fly ash-silica fume concrete. Fuel 2010, 89, 768–774. [Google Scholar] [CrossRef]
  14. Gesoglu, M.; Gunevisi, E.; Ozbav, E. Properties of self-compacting concretes made with binary, ternary, and quaternary cementitious blends of fly ash, blast furnace slag, and silica fume. Constr. Build. Mater. 2009, 23, 1847–1854. [Google Scholar] [CrossRef]
  15. Bingol, A.F.; Tohumcu, I. Effects of different curing regimes on the compressive strength properties of self-compacting concrete incorporating fly ash and silica fume. Mater. Des. 2013, 51, 12–18. [Google Scholar] [CrossRef]
  16. Obla, K.H.; Hill, R.L.; Shashiprakash, S.G.; Perebatova, O. Properties of concrete containing ultra-fine fly ash. ACI Mater. J. 2003, 100, 426–433. [Google Scholar]
  17. Subramaniam, K.V.; Gromotka, R.; Shah, S.P.; Obla, K.; Hill, R. Influence of ultrafine fly ash on the early age response and the shrinkage cracking potential of concrete. J. Mater. Civ. Eng. 2005, 17, 45–53. [Google Scholar] [CrossRef]
  18. Chindaprasirt, P.; Jaturapitakkul, C.; Sinsiri, T. Effect of fly ash fineness on compressive strength and pore size of blended cement paste. Cem. Concr. Compos. 2005, 27, 425–428. [Google Scholar] [CrossRef]
  19. Choi, S.; Lee, S.S.; Monteiro, P.J.M. Effect of Fly ash fineness on temperature rise, setting, and strength development of mortar. J. Mater. Civ. Eng. 2012, 24, 499–505. [Google Scholar] [CrossRef]
  20. Shaikh, F.U.A.; Supit, S.W.M. Compressive strength and durability properties of high volume fly ash (HVFA) concretes containing ultrafine fly ash (UFFA). Constr. Build. Mater. 2015, 82, 192–205. [Google Scholar] [CrossRef]
  21. Shi, C.; Stegemann, J.A. Acid corrosion resistance of different cementing materials. Cem. Concr. Res. 2000, 30, 803–808. [Google Scholar] [CrossRef]
  22. Monteny, J.; Vincke, E.; Beeldeens, A.; De Belie, N.; Taerwe, L.; Gemert, D.; Verstraete, W. Chemical, microbiological, and in situ test methods for biogenic sulfuric acid corrosion of concrete. Cem. Concr. Res. 2000, 30, 623–634. [Google Scholar] [CrossRef]
  23. Monteny, J.; Belie, N.D.; Vincke, E.; Verstraete, W.; Taerwe, L. Chemical and microbiological tests to simulate sulfuric acid corrosion of polymer-modified concrete. Cem. Concr. Res. 2001, 31, 1359–1365. [Google Scholar] [CrossRef]
  24. Lee, S.; Hooton, R.; Jung, H.; Park, D.; Choi, C. Effect of limestone filler on the deterioration of mortars and pastes exposed to sulfate solutions at ambient temperature. Cem. Concr. Res. 2008, 38, 68–76. [Google Scholar] [CrossRef]
  25. Roy, D.M.; Arjunan, P.; Silsbee, M.R. Effect of silica fume, metakaolin and low-calcium fly ash on chemical resistance of concrete. Cem. Concr. Res. 2001, 31, 1809–1813. [Google Scholar] [CrossRef]
  26. Monteny, J.; Belie, N.D.; Taerwe, L. Resistance of different types of concrete mixtures to sulphuric acid. Mater. Struct. 2003, 36, 242–249. [Google Scholar] [CrossRef]
  27. Baret, G.; Poppe, A.M.; Belie, N.D. Strength and durability of high-volume fly ash concrete. Struct. Concr. 2008, 9, 101–108. [Google Scholar]
  28. Standards Australia. AS 1012.9-2014 Methods of Testing Concrete Compressive Strength Tests—Concrete, Mortar and Grout Specimens; Standards Australia: Sydney, Australia, 2014. [Google Scholar]
  29. Hewayde, E.; Nehdi, M.; Allouche, E.; Nakhla, G. Using concrete admixtures for sulphuric acid resistance. Constr. Mater. 2007, 160, 25–35. [Google Scholar] [CrossRef]
  30. Goyal, S.; Kumar, M.; Sidhu, D.S.; Bhattacharjee, B. Resistance of mineral admixture concrete to acid attack. J. Adv. Concr. Technol. 2009, 7, 273–283. [Google Scholar] [CrossRef]
  31. Zivica, V.; Bajza, A. Acidic attack of cement based materials—A review Part 2. Factors of rate of acidic attack and protective measures. Constr. Build. Mater. 2002, 16, 215–222. [Google Scholar] [CrossRef]
  32. Mehta, P.K.; Monteiro, P.J.M. Concrete: Microstructure, Properties, and Materials, 3rd ed.; McGraw-Hill Comapnes Inc.: New York, NY, USA, 2006; p. 659. [Google Scholar]
Figure 1. Compressive strength development of concrete.
Sustainability 09 01556 g001
Figure 2. Compressive strength loss of concrete in sulphuric acid (3%).
Sustainability 09 01556 g002
Figure 3. Mass loss of concrete in sulphuric acid (3%).
Sustainability 09 01556 g003
Figure 4. Compressive strength loss of concrete in nitric acid (1.5%).
Sustainability 09 01556 g004
Figure 5. Mass loss of concrete in nitric acid (1.5%).
Sustainability 09 01556 g005
Figure 6. Concrete deterioration in 3% sulphuric acid solution.
Sustainability 09 01556 g006
Figure 7. Concrete deterioration in 1.5% nitric acid solution.
Sustainability 09 01556 g007
Figure 8. SEM image of Mix 1 (OPC) (28 days of water curing).
Sustainability 09 01556 g008
Figure 9. SEM image of Mix 3 (30% FA + 10% UFFA) (28 days of water curing).
Sustainability 09 01556 g009
Figure 10. SEM image of Mix 3 (30% FA + 10% UFFA) in 3% sulphuric acid (exposure period 28 days).
Sustainability 09 01556 g010
Figure 11. SEM image of Mix 3 (30% FA + 10% UFFA) in 1.5% nitric acid (exposure period 28 days).
Sustainability 09 01556 g011
Table 1. Chemical composition and physical properties of materials.
Chemical Composition
OxidesCement (%)Fly Ash (%)Ultra Fine Fly Ash (%)
SiO221.151.873.4
AI2O34.726.417.7
Fe2O32.813.24.4
CaO63.81.610.9
MgO2.01.1.70.6
MnO-0.100.1
K2O-0.681.03
Na2O-0.310.11
P2O5-1.390.20
TiO2-1.440.70
SO32.40.210.20
Physical Properties
Particle Size25–40% ≤7 μm40% of 10 μmMean Size 3.4 μm
Specific gravity2.7–3.22.62.0–2.55
Surface area (m2/kg)3523402510
Loss of Ignition (%)2.40.500.60
Table 2. Mix proportions.
Mix No.Mix IDkg/m3SP * (%)
OPCFAUFFAWaterFine AggregateCoarse Aggregate
Mix 1OPC (control)4000-14060012500
Mix 220% FA + 10% UFFA280804014060012500.5
Mix 330% FA + 10% UFFA2401204014060012501.0
Mix 440% FA + 10% UFFA2001604014060012501.2
Mix 550% FA + 10% UFFA1602004014060012501.5
* SP: % by mass of total binder.
Table 3. Compressive strength results.
Mix No.Mix ID7 Days (MPa) (Avg ± SD)14 Days (MPa) (Avg ± SD)28 Days (MPa) (Avg ± SD)56 Days (MPa) (Avg ± SD)90 Days (MPa) (Avg ± SD)
Mix 1OPC (control)31.67 ± 0.2533.53 ± 0.5935.37 ± 1.1636.23 ± 2.5940.13 ± 0.15
Mix 220% FA + 10% UFFA28.37 ± 0.3229.60 ± 1.7335.3 ± 2.3140.17 ± 2.4849.00 ± 1.23
Mix 330% FA + 10% UFFA27.60 ± 0.3029.53 ± 1.7633.50 ± 0.5337.30 ± 1.4542.73 ± 0.60
Mix 440% FA + 10% UFFA22.43 ± 0.8525.60 ± 0.3526.53 ± 0.4031.47 ± 0.7433.27 ± 0.91
Mix 550% FA + 10% UFFA20.97 ± 1.7224.03 ± 0.6826.07 ± 1.4229.33 ± 1.6432.50 ± 1.31
Table 4. Compressive strength loss of concrete in sulphuric acid (3%).
Mix No.Mix ID7 Days (MPa) (Avg ± SD)14 Days (MPa) (Avg ± SD)28 Days (MPa) (Avg ± SD)56 Days (MPa) (Avg ± SD)90 Days (MPa) (Avg ± SD)
Mix 1OPC (control)27.93 ± 2.8426.70 ± 1.0822.57 ± 0.4219.53 ± 1.5010.73 ± 3.17
Mix 220% FA + 10% UFFA25.80 ± 1.2524.17 ± 1.0822.40 ± 0.2020.17 ± 1.2518.37 ± 2.37
Mix 330% FA + 10% UFFA25.07 ± 1.6123.97 ± 0.4023.23 ± 0.3222.20 ± 0.1020.77 ± 0.35
Mix 440% FA + 10% UFFA21.37 ± 2.9720.70 ± 2.2919.20 ± 2.0817.67 ± 0.5116.70 ± 0.66
Mix 550% FA + 10% UFFA19.20 ± 0.2619.77 ± 1.0118.07 ± 1.8516.73 ± 1.5616.37 ± 0.32
Table 5. Mass loss of concrete in sulphuric acid (3%).
Mix No.Mix ID3 Days (MPa) (Avg ± SD)7 Days (MPa) (Avg ± SD)14 Days (MPa) (Avg ± SD)28 Days (MPa) (Avg ± SD)56 Days (MPa) (Avg ± SD)90 Days (MPa) (Avg ± SD)
Mix 1OPC (control)1.22 ± 0.085.82 ± 0.248.78 ± 0.1210.35 ± 0.4915.40 ± 0.4522.64 ± 0.35
Mix 220% FA + 10% UFFA0.77 ± 0.050.96 ± 0.121.35 ± 0.082.68 ± 0.364.15 ± 0.178.89 ± 1.04
Mix 330% FA + 10% UFFA0.13 ± 0.140.17 ± 0.060.36 ± 0.150.30 ± 0.070.65 ± 0.040.88 ± 0.08
Mix 440% FA + 10% UFFA0.09 ± 0.080.28 ± 0.050.17 ± 0.080.28 ± 0.060.34 ± 0.030.52 ± 0.07
Mix 550% FA + 10% UFFA0.04 ± 0.030.27 ± 0.090.15 ± 0.080.14 ± 0.030.34 ± 0.050.61 ± 0.08
Table 6. Compressive strength loss of concrete in nitric acid (1.5%).
Mix No.Mix ID7 Days (MPa) (Avg ± SD)14 Days (MPa) (Avg ± SD)28 Days (MPa) (Avg ± SD)56 Days (MPa) (Avg ± SD)90 Days (MPa) (Avg ± SD)
Mix 1OPC (control)29.40 ± 0.2627.60 ± 2.1924.03 ± 1.4023.47 ± 0.4021.23 ± 0.49
Mix 220% FA + 10% UFFA27.30 ± 0.4426.27 ± 0.2124.60 ± 1.5024.53 ± 0.8622.50 ± 0.10
Mix 330% FA + 10% UFFA26.23 ± 0.2525.73 ± 0.3825.53 ± 0.6125.13 ± 0.1523.40 ± 2.01
Mix 440% FA + 10% UFFA22.27 ± 1.7822.70 ± 0.5622.40 ± 0.4620.83 ± 0.2520.13 ± 0.49
Mix 550% FA + 10% UFFA20.60 ± 0.5021.67 ± 1.4221.73 ± 0.3120.73 ± 0.6520.10 ± 0.46
Table 7. Mass loss of concrete in nitric acid (1.5%).
Mix No.Mix ID3 Days (MPa) (Avg ± SD)7 Days (MPa) (Avg ± SD)14 Days (MPa) (Avg ± SD)28 Days (MPa) (Avg ± SD)56 Days (MPa) (Avg ± SD)90 Days (MPa) (Avg ± SD)
Mix 1OPC (control)1.52 ± 0.082.22 ± 0.193.64 ± 0.574.09 ± 0.234.17 ± 0.454.79 ± 0.89
Mix 220% FA + 10% UFFA0.62 ± 0.050.68 ± 0.080.94 ± 0.051.08 ± 0.112.28 ± 0.432.65 ± 0.53
Mix 330% FA + 10% UFFA0.58 ± 0.030.62 ± 0.071.08 ± 0.240.89 ± 0.092.09 ± 0.592.23 ± 0.29
Mix 440% FA + 10% UFFA0.30 ± 0.0200.57 ± 0.080.92 ± 0.040.85 ± 0.061.67 ± 0.221.96 ± 0.67
Mix 550% FA + 10% UFFA0.31 ± 0.040.69 ± 0.081.09 ± 0.231.08 ± 0.171.74 ± 0.242.07 ± 0.43

