Article

Detection of Cypress Canopies in the Florida Panhandle Using Subpixel Analysis and GIS

1
Department of Geography, Geology, and the Environment, 319 Advanced Technology and Science Hall, Slippery Rock University of Pennsylvania, Slippery Rock, PA 16057, USA
2
U.S. Fish and Wildlife Service, Panama City Field Office, 1601 Balboa Avenue, Panama City, FL 32405, USA
*
Author to whom correspondence should be addressed.
Remote Sens. 2009, 1(4), 1028-1042; https://doi.org/10.3390/rs1041028
Submission received: 22 September 2009 / Revised: 27 October 2009 / Accepted: 13 November 2009 / Published: 17 November 2009

Abstract

:
In this study, multitemporal subpixel analysis was used to identify cypress canopies from Landsat 7 ETM+ imagery. One spring and one fall image were selected for each of two sites, an eastern one centered on Tallahassee, FL and a western one centered on Panama City, FL. Signatures derived from the two eastern images were applied on the two western images that served as the control images for accuracy assessment. Results indicated that multitemporal subpixel analysis greatly improved the classification accuracy and signatures developed from one scene could be used to the subpixel classification of another scene with caution.

Graphical Abstract

1. Introduction

Wetland is the transitional habitat between water and dry land, and it supports many fish and wildlife species. In the last decade, increasing development along the coastal regions has led to a rapid net loss in wetland areas. There was an estimated wetland loss of 146,200 ha in the coastal area of the eastern U.S. between 1998 and 2004, an average annual net loss of about 24,300 ha [1]. The coastal watersheds of the Gulf of Mexico experienced a loss rate of six times higher than that in the Atlantic coastal watersheds [1]. Cypress is the most common wetland tree in the coastal area of the Gulf of Mexico. Cypress swamps are forested wetlands dominated by cypress trees, which provide a prime habitat to many wildlife species, including some rare and endangered species, such as limpkins (Aramus guarauna) and wood storks (Mycteria americana) [2]. Some of the cypress trees in this region are 100 to 400 years old, making it the primary old-growth species in the wetlands of the southeastern United States. During the first half of the 20th century, logging removed the majority of the large, old-growth cypress trees in almost all the swamps in Florida for timber harvest and land development. Cypress mulch was just a by-product of lumber mills. Since the 1950s, the cypress industry had experienced small rises and falls. However, starting from 1990s, cypress harvest has risen again because trees on many of the previously harvested old swamps have grown to merchantable size. Different from before, landscape mulch has now become one of the main reasons for cypress harvest [2,3]. In the eight years before a 1995 survey, the annual harvest was 42 million cubic feet, 47% of which was used for landscape mulch [4]. Some new mills have been opened for cypress growing on private lands. There are two closely related species of cypress. Bald cypress (Taxodium distichum) occurs in swamps along flowing rivers, and pond cypress (Taxodium ascendens) is found in still-water swamps. Myers and Ewel [5] contend that these are not different species, because individual trees are indistinguishable and because the difference in variations is designated only by the water inundation levels in which they occur. This project makes no distinction between the two, with any reference to cypress designating both types of cypress. There is currently no basis for evaluating the ecological impact of increased cypress logging. The National Wetlands Inventory (NWI) database includes information on the distribution of some cypress stands. In the NWI classification scheme [6], the forested wetlands category is found under palustrine and estuarine categories. Upon occasion, within forested wetland areas, the category of deciduous needle-leaved trees occurs, and this connotes cypress. However, cypress stands are not always clearly discernable using the aerial photographic interpretation techniques employed in the NWI mapping process. Thus, only a small percentage of the cypress in the study area was mapped at the classification level of NWI database. There is a need to research alternative avenues of information provision.
The detection of ecosystem dynamics using remotely sensed imagery is becoming a new research trend in recent years because it is probably the best way to acquire ecosystem data for large geographic area at reasonable cost, accuracy, and effort. Remote sensing has been widely used to investigate the influence of land use changes on wetland distribution in general [7,8,9,10,11] and to identify the characteristics and spatial extent of different classes or types of wetlands [12,13,14,15,16,17]. One issue in large-area wetland remote sensing has been identified in the literature, which involves the spectral and spatial resolution of multispectral images. The moderate spectral resolution of some commonly used satellite images, such as Landsat TM data, makes it difficult to discriminate different vegetation types [14,18]. At the same time, a great challenge of using medium and coarse spatial resolution images to map wetlands is the mixed pixel problem: the problem that more materials are included within one pixel and therefore the pixel reflectance value is a complex spectral mixture of different materials [19,20,21]. Some efforts have been made to improve wetland classification accuracy by adding ancillary data or texture and context information in classification procedures [12,14,22]. For example, Wright and Gallant [14] used classification trees to combine Landsat TM imagery and ancillary environmental data to identify five types of palustrine wetlands and obtained satisfactory results. Some other studies have centered on advanced classification techniques. Traditional classification methods, such as ISODATA (Iterative Self-Organizing Data Analysis) or MLC (Maximum Likelihood Classification), are called per-pixel classifiers because these algorithms assign one and only one class to each pixel and ignore mixed pixels [20]. Subpixel classification approaches that consider variations within pixels have been developed to overcome the mixed pixel problem. Of the available subpixel classifiers, spectral mixture analysis (SMA) has long been recognized as an effective method [21]. SMA assumes that the spectral value of each pixel is a linear or nonlinear combination of defined spectrally pure materials called endmembers. The output of SMA is a set of fraction images, each of which represents the areal proportions (fraction) of one of the endmembers in each pixel. Shanmygam et al. [20] compared traditional per-pixel classifiers with a linear spectral mixture modeling (LSMM) in classifying wetlands in southern India. Their study indicated that LSMM was a more effective means of mapping mangrove and marsh vegetation and other associated wetland cover types. However, while these studies have improved wetland classifications using Landsat images from different perspectives, most of the work focused on detecting wetland types, instead of individual wetland species. SMA has the potential to differentiate species because it considers more than one material within a pixel. However this method has two limitations. First, the number of endmembers in SMA is limited by the dimensionality of remotely sensed data, not the number of bands [19,23,24]. The bands of multispectral data are usually highly correlated. For example, although Landsat TM or ETM+ data have six spectral bands, only three or four dimensions of data are generally identified in principal component analysis. This means that only four or fewer materials (endmembers) can be detected in a pixel. Due to the high heterogeneity of wetlands, however, there are generally more than four different species within a pixel. Second, SMA requires that the endmembers used in the analysis are constrained to be spectrally different from each other [25]. A typical set of materials could include soil, vegetation, and moisture [20]. It is almost impossible to detect two vegetation classes with similar spectral signatures in SMA. Due to these two limitations, SMA is unable to successfully identify individual wetland species.
A method with great potential to map vegetation species is IMAGINE Subpixel Classifier, an image processing algorithm that allows for a more detailed level of mapping than is generally reached in habitat mapping based upon satellite imagery or even aerial photographic interpretation. IMAGINE Subpixel Classifier allows for the identification of pixels containing a material of interest (MOI) even if the feature comprises as little as 20% of the area within the pixel. Each pixel on a classified image will hold a number from 0 to 1.0 representing the fraction of MOI within the pixel. IMAGINE Subpixel Classifier can consider up to 45 candidate materials within a pixel, including the MOI and background materials. The MOI and background materials can be different from pixel to pixel. This allows a more accurate representation of the spectral properties of each pixel. In addition, IMAGINE Subpixel Classifier is designed to be able to make fine discriminations between similar materials, and thus ideal to detect different vegetative species from each other [26]. The technique has been used in a variety of applications and has received a positive software review [27]. Although examples in the literature of nonclassified applications still remain limited, the approach has a proven track record in urban impervious surface detection [28,29], urban vegetation analysis [30], spruce beetle infestation mapping [31], wetlands species identification [32,33], loblolly pine detection [34], and illegal logging detection [35]. Accuracy assessments were performed for all of the targets listed above except the spruce beetle study and results ranged from 71% to 91%.
The Subpixel Classifier works most effectively when several fairly large tracts of the MOI (whole pixel occurrences) can be used as training data to identify isolated pixels that have the MOI within them. Cypress is one of few wetlands species in which such conditions of homogeneity and heterogeneity occur, making it a suitable “target” for subpixel analysis. Huguenin and others [33] conducted a subpixel analysis in detecting cypress in some test areas in South Carolina and Georgia and they had an overall accuracy of 89%. One of the important requirements of subpixel analysis is that it needs intensive field data to generate signatures for classification. To address this problem, this study was designed to investigate two questions using the cypress forests of the Florida Panhandle as the case study area:
  • Whether multitemporal analysis is able to improve classification accuracies of subpixel detections of cypress?
  • Whether signatures developed in one scene can be used to classify another scene?
In the following sections, we will discuss the major research components, including data acquisition and pre-processing, field data collection, signature derivation and refinement, subpixel analysis, and accuracy assessment.

2. Experimental Section
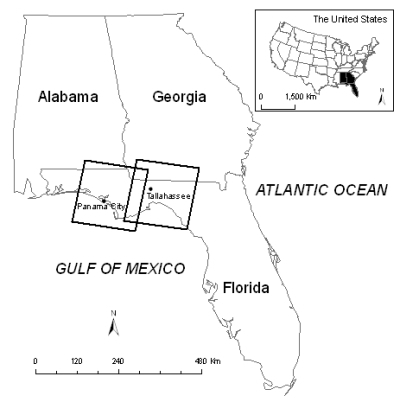
2.1. Study Area

In order to address the above two research questions, two adjacent footprint areas were selected for this project. The east scene would serve as the source for signature derivation data, and the west one would serve as a control image in which the accuracy assessment would be performed. The majority of the two areas are located on the Florida Panhandle that lies between Alabama on the north and the west, Georgia on the north, and the Gulf of Mexico to the south (Figure 1). As the two sites are adjacent to each other, they share many properties in terms of climate, geographic and ecological settings. The study area has a moderate climate. Summers are long, warm, and humid while winters are short and mild. The topography of the entire study area is low rolling hills and slopes downward toward the south, the Gulf of Mexico. The highest elevation point of Florida, about 105 meters, is located within the west scene area. Soils in this region are characterized by a surface layer of loamy sand over red clay [36,37]. The entire study area once consisted of a mosaic of pine forest, hardwood hammocks, natural ponds, lakes, and wetlands. At present, however, forests have become highly fragmented due to changes in fire regimes, timber harvesting, converting to other land uses, and other human activities. The main difference between the east and west areas is related to the population and urban growth of this region. The east area was centered on Tallahassee (30°26'17"N, 84°16'50"W), the capital city of Florida and the central city of Tallahassee metropolitan area. The city had a total area of 254.5 km2 and a total population of 150,624 in 2000. It was estimated that the population had grown to 171,922 by 2008 [38]. Tallahassee has been rapidly growing in the last decade, which has put high pressure on natural covers in this area. The west area was centered on Panama City (30°09'31"N, 85°39'37"W), a small and popular tourist location within the Florida Panhandle. The city limits encompass an area of 69.1 km2. As of the 2000 census, the city population was 36,417. By 2008, the city’s population was 36,644 by estimation [38].
Figure 1. The location of the study area. The two boxes with thick black lines indicate the coverage of the two images.
Remotesensing 01 01028 g001

2.2. Data Acquisition

The two optimal times for identifying cypress were determined to be early spring and late fall. During its initial leafing out between mid-March and late May in Florida, cypress has a distinctive coloration, a brilliant lime green, which was considered to be advantageous for discrimination of cypress from other tree species. This is particularly significant because cypress has so little biomass in its canopy compared to the amount of woody material that would be visible from the nadir perspective, which perhaps contributes to the difficulty associated with mapping cypress in aerial photographic interpretation. A scene search for available imagery under these temporal constraints resulted in two Landsat 7 ETM+ images that were sufficiently cloud-free to utilize. The eastern scene (path 18, row 39) was acquired on April 30, 2000, and the western scene (path 19, row 39) was imaged on April 5, 2000. The late fall timeframe was selected for use in the multitemporal analysis for two reasons. First, the coloration of cypress leaves after senescence is a very distinctive and rich orange color. Second, cypress retains leaves after senescence much longer than many other deciduous wetland tree species do. A scene search was performed for mid-October to mid-December, and two Landsat 7 ETM+ images were identified, an eastern scene (path 18, row 39) acquired on October 23, 2000 and a western scene (path 19, row 39) obtained on November 29, 1999.
The project will rely on IMAGINE Subpixel Classifier to classify satellite images. Complete methodology of this study is presented in Figure 2.
Figure 2. Flowchart of the research methodology.
Remotesensing 01 01028 g002

2.3. Pre-Processing

The four Landsat 7 ETM+ images were geo-referenced with an RMS of 0.5. A nearest neighbor algorithm was employed in the geo-referencing process in order to retain the original spectral values collected by the satellite. The IMAGINE Subpixel Classifier requires that two additional preprocessing steps be performed upon the image to be classified. The first procedure provides a file for internal use to all other IMAGINE Subpixel Classifier routines. The second is an environmental correction program that accounts for the atmospheric conditions in the image. This allows for signature files associated with an MOI generated in one image to be applied on other images having different atmospheric conditions [39].

2.4. Field Data Collecting

Sixteen cypress sites located within the eastern image area were mapped using a GPS unit with individual sites ranging in size from 10 to 40 pixels. Sites having a high degree of cypress canopy closure (90%–100%) were sought for purposes of signature development, and sites having as little as 50% canopy closure were mapped for the purposes of verification. Sampling the full spectrum of background conditions is vital to subpixel analysis. Therefore, three types of cypress sites were sampled in this project, including stands in deep water with no understory vegetation present, sites containing some standing water with patches of understory grasses, and sites with little or no water and extensive grassy or herbaceous understories. Fourteen false alarm sites within the eastern image area were also mapped to represent forested wetland species other than cypress, such as tupelo, tyty, gum, red maples, and bay. These sites were sampled to include a variety of canopy closure and understory conditions. Additional false alarm sites that were sampled included grassy wetlands, open water, deciduous forests, and pine plantations. All sampling sites were digitized into IMAGINE Subpixel Classifier as areas of interest (AOI). These AOIs were divided into three categories, training sites with pixels having the highest canopy closure, validation sites representing the various conditions in which cypress occurred, and false sites for other forested wetland species as well as nonwetland land cover types.

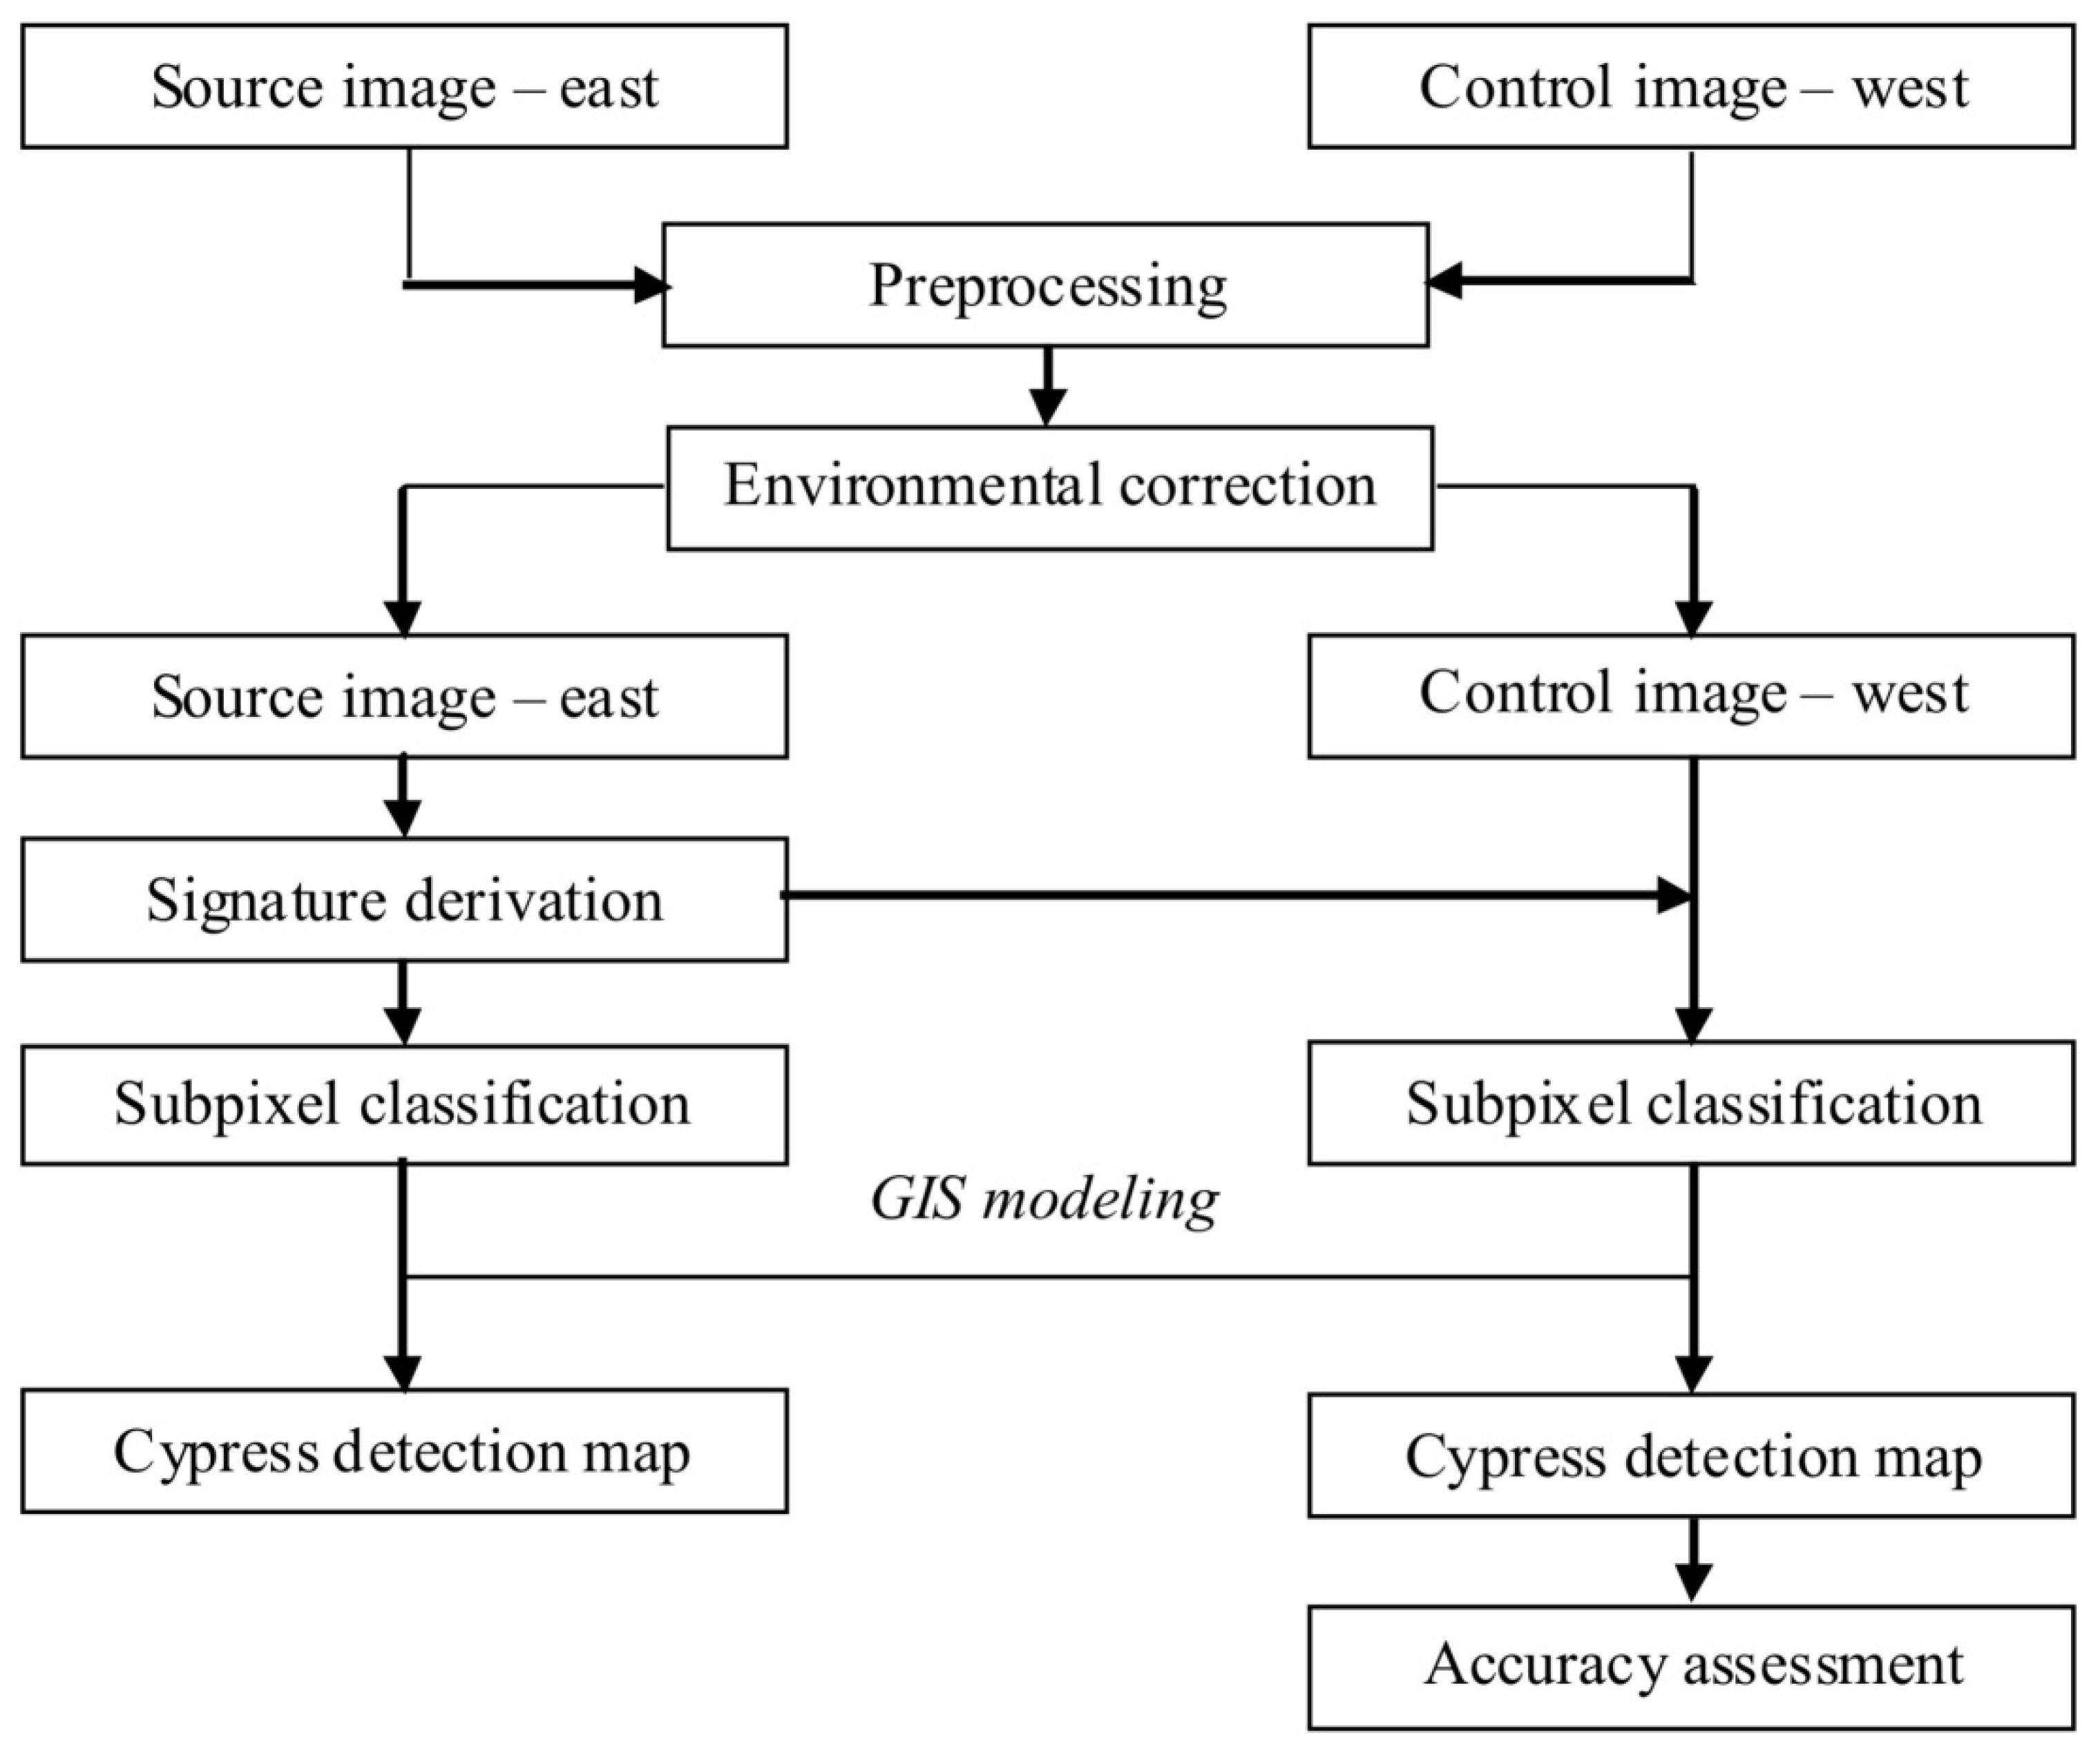
2.5. Signature Derivation and Refinement Using Spring East Imagery

The automated signature development module in the IMAGINE Subpixel Classifier uses pixels from the training, validation, and false sites to generate 96 different signatures and retains the five signatures which score best both in classifying pixels in the training and validation AOIs and in not classifying pixels in the false alarm AOIs. Then a signature from the five best signatures is selected to serve as the “parent” signature and to be refined further using point-digitized files on pixels that are correctly classified, pixels that are missed, and false alarm pixels to generate a child signature. If the child signature is more accurate than the parent signature, it will be used in classification or in further refinement. In this project, the child signature derived from the spring eastern image was not found to be more accurate, so the parent signature (“Parent #S1”) was retained for further processing. During the evaluation of the performance of this parent signature against the various AOIs, it was found that Parent #S1 signature detected well the drier cypress sites and missed some of the wetter cypress sites altogether. To detect wet cypress areas, another round of signature derivation was initiated using the same false alarm data as in the first round, but using only the wet cypress sites for training and validation. The result was a second parent signature that was refined to generate a child signature with more accuracy. Further refinement did not provide higher accuracy, so this child signature (“Child #S2”) was selected for further analysis.

2.6. Subpixel Classification of Spring East Imagery

Both Parent #S1 and Child #S2 signatures were applied separately to classify the spring eastern image. The image output from Subpixel Classifier includes eight categories of detections, ranging from 20% subpixel occurrences (Category One) to 90% subpixel occurrences or whole pixel detections (Category Eight). After evaluating the results, for the classified image using Parent #S1, the detections in Categories Five, Six, Seven, and Eight were retained, which included those pixels having 60% subpixel fraction of cypress or higher. For the classified image resulting from Child #S2, the detections of Categories Six, Seven, and Eight were retained that included the pixels having 70% subpixel fraction of cypress or higher. These two detection images with retained categories were overlaid to produce a cypress probability map of the spring eastern area. Those pixels identified by both Parent #S1 and Child #S2 signatures were given the highest probability of cypress occurrence. Those pixels identified only by Child #S2 signature were ranked second in terms of probability of accuracy because of the low level of commission error. Those pixels associated with only Parent #S1 signature were ranked lowest due to the high level of commission error. To reduce the error of commission, the forested wetland category in the NWI data was used to effectively filter out nonwetland detections.

2.7. Signature Derivation and Subpixel Classification of Fall East Imagery

The entire process employed in the subpixel analysis of the spring eastern imagery was repeated in the classification of the fall eastern imagery with a few variations. Three rounds of signature derivation were initiated to detect various cypress conditions and three complementary signatures were selected for further classification (Parent #F1, Parent #F2, and Parent #F3).
These three signatures were applied to the fall eastern image respectively and resulted in three classified images with eight categories of detections. After evaluating each classification, for Parent #F1 signature, Categories Three to Eight were retained (40% occurrences or more). For Parent #F2, all the detections from Categories One to Eight were retained because this signature was a very tight one with very few errors of commission or omission. For Parent #F3, Categories Five through Eight were retained (60% occurrences or more) for further analysis. These three classified images were overlaid to each other to create a final classification of the fall east imagery.

2.8. Subpixel Classification of West Imagery

Signatures derived from the spring and fall eastern images were applied to classify the spring and fall western images respectively. NWI data were used to mask out nonwetland areas. The resultant classified western images were superimposed to create a single map of spring detection and one of fall detection for accuracy assessment and comparisons.

3. Results and Discussion

3.1. Accuracy Assessment

Accuracy assessments were performed on the western images that served as the control images to evaluate the capacity of signature extension associated with the IMAGINE Subpixel Classifier. Three criteria were used to select samples. First, for ease of convenient access, only detections on public lands were evaluated. In this study area, the public land accounted for about 13% of the total land area. Second, only clusters of pixels containing at least 10 contiguous pixels were used. Third, only clusters located within 500 meters of a road were retained, eliminating the need for boat travel to assessment sites. The assessment approach included two sets of samples. One set contained 10 samples with total pixels of 100 generated by randomly sampling from the classified image in order to identify errors of commission. The other set of samples included 10 well known cypress sites selected by U.S. Fish & Wildlife Service (USFWS) staff to provide an omission examination. Based on this approach, the cypress detection identified using only the fall image was 71% accurate. The cypress detection identified using only the spring image was 81% accurate. To investigate the question whether multitemporal analysis is able to improve classification accuracy, the classified images from the spring and the fall respectively were overlaid to produce a new image with combined detections from both seasons. An accuracy assessment was performed on this new image and yielded an 88% accuracy rate (Figure 3).
Figure 3. Cypress distribution in the Florida Panhandle.
Remotesensing 01 01028 g003

3.2. Comparison with Previous Subpixel Analysis

This study is not directly comparable with the previous work on detecting cypress using subpixel analysis due to different research questions and thus methodologies. In the study of Huguenin et al. [33], both training sites and test sites were selected from the same image scene. And only the presence and absence of MOI in the pixel was considered in the accuracy assessment of cypress detection. In this project, however, the eastern image scenes were used in selecting training sites and deriving signatures. These signatures were then tested using the western scenes. Considering the ability of extending signatures extracted from one scene to another in order to reduce field work efforts, the overall accuracy of 81% for the spring west image was quite encouraging. Furthermore, the combination of the spring and fall detections improved the overall accuracy to 88%, a competitive level to the accuracy of 89% achieved by Huguenin et al. [33].

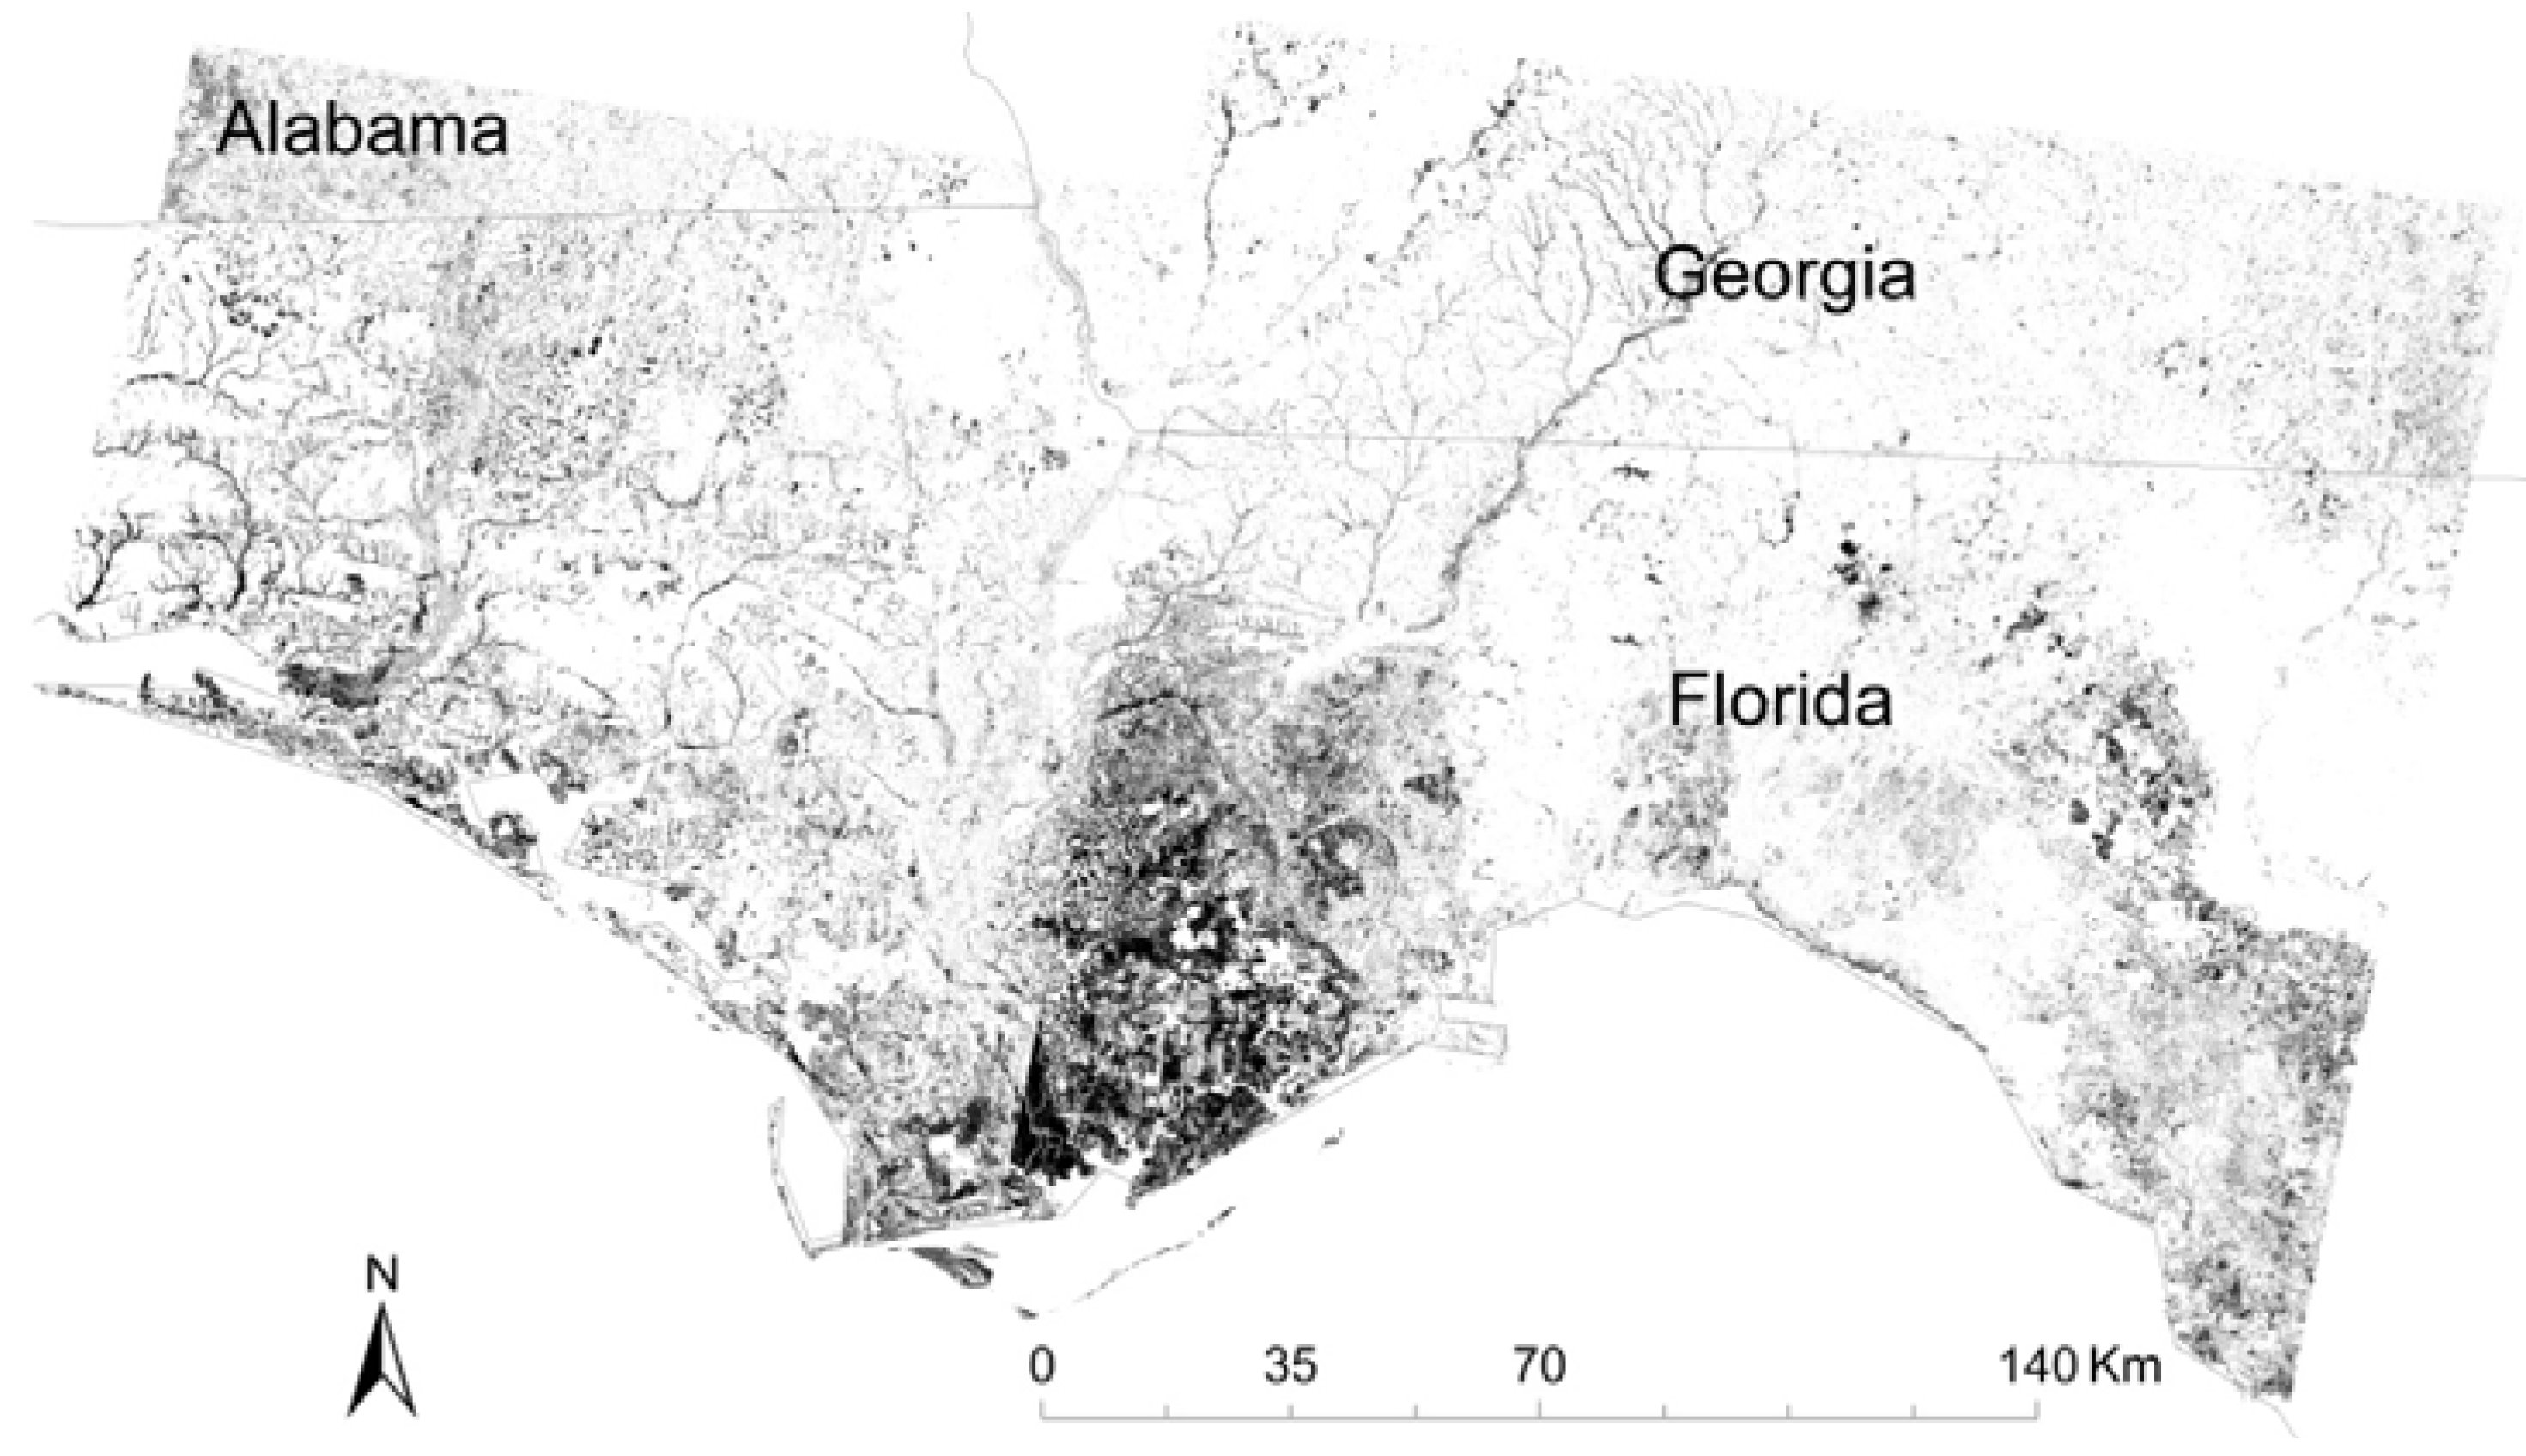
3.3. Qualitative Observations

While performing the quantitative accuracy assessment discussed above, some interesting observations were found that warranted discussion about the detection capability of subpixel analysis. The first observation pertained to the wettest field site that was visited. This site was classified on topographic maps as water (vs. forested wetland), but, it was detected as a large cypress area by subpixel analysis. Upon visitation of the site, cypress was found scattered fairly densely throughout the water body. It was evident that the subpixel analysis detections had correctly identified a large cypress area that otherwise might not have been mapped as such.
The second case pertained to the other extreme of the wetlands gradient, some sites that were very dry. While driving to a site that met the criteria of being at least 10 pixels in size, three small patches of cypress trees were passed that could not have been included in the omission database because of their small sizes. However, the coordinates were captured and checked on the classified images. The results indicated that subpixel detection image did indeed show these cypress patches ranging from 3 to 5 pixels each. Even more interesting, some of the pixels in these detected patches were identified by both the wetter and the drier signatures.
Another feature that was less than 30 meters wide was determined to be too narrow to be included in the omission sample. This was a long stretch of cypress along the edge of a lake. Because of the width constraints associated with the minimum mapping units employed by NWI, it was likely that this site was too small to be included in that database. If the feature were detected by subpixel analysis on satellite images, it was anticipated that it would look like strings of stair-stepped pixels, likely having breaks between them where mixed pixels could be expected to be almost entirely water or upland forest. This was indeed the pattern in the detection image. This case indicated the strength of the subpixel algorithm in detecting features smaller than a given pixel and it also represented the kind of information loss associated with NWI data as well.

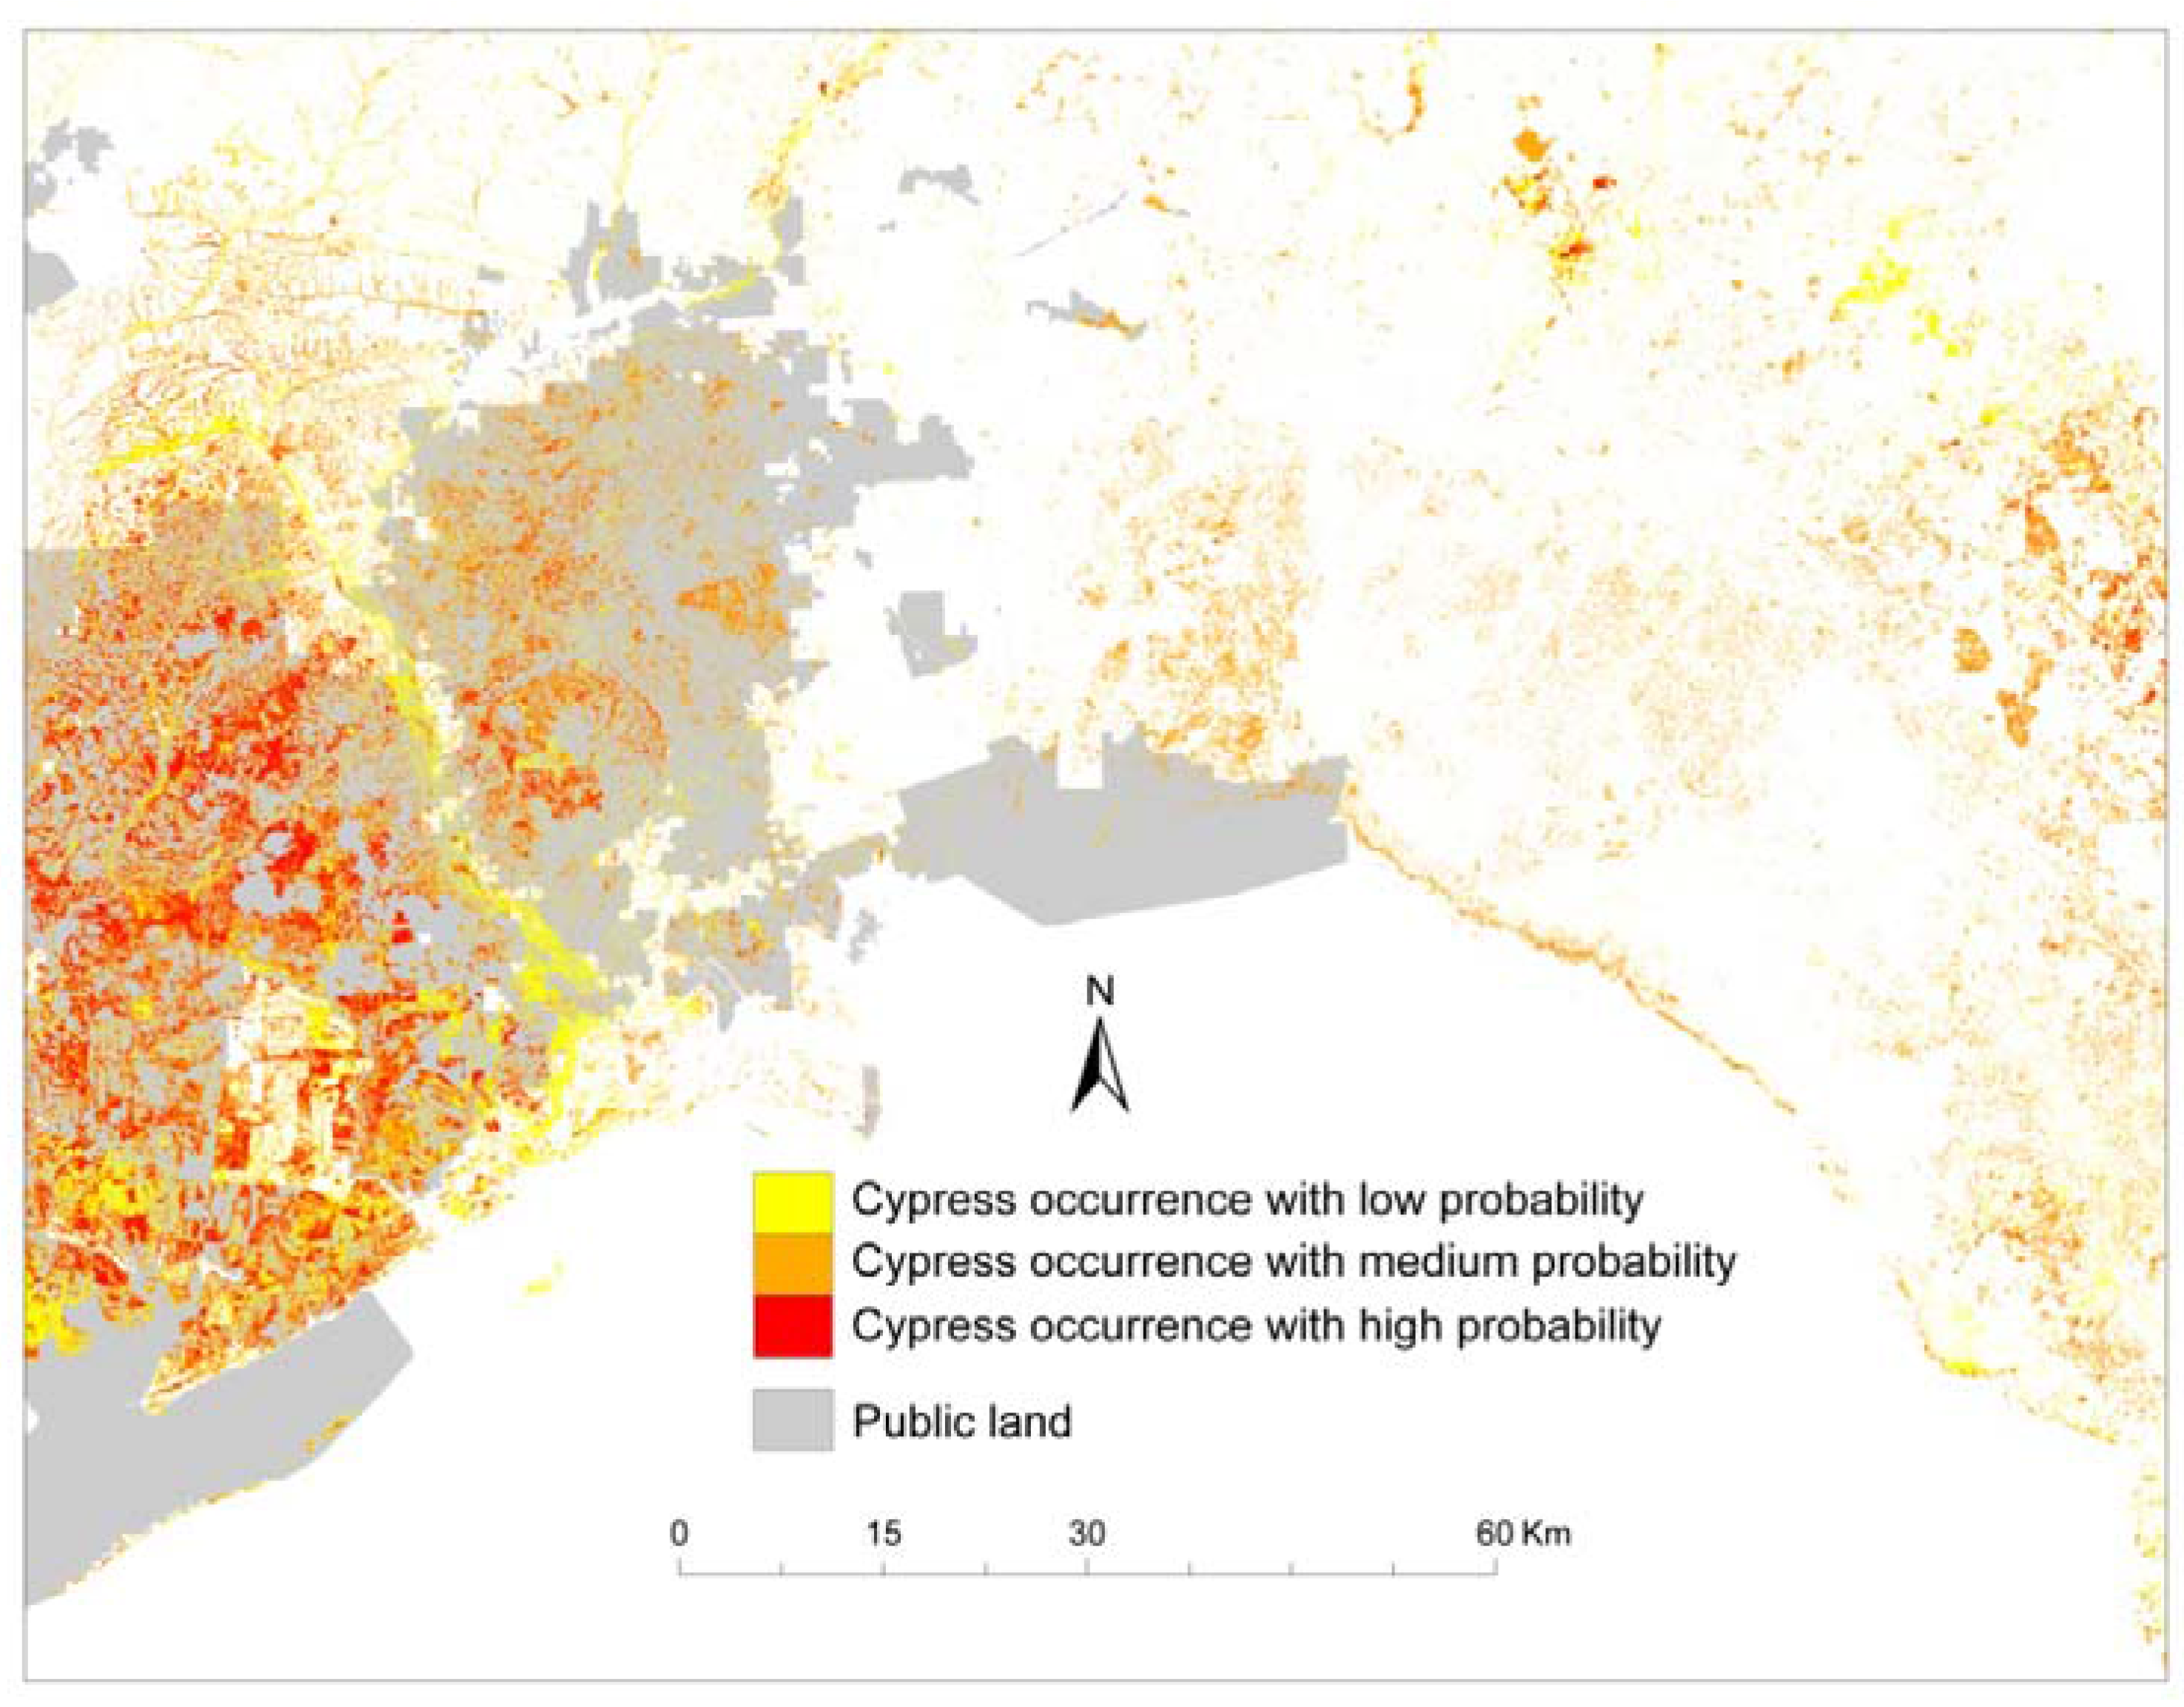
3.4. Probability Map

Based on the two-season cypress detections and the accuracy assessments for the classification of both the spring and fall western images, a probability map can be produced that consists of cypress detections with three probabilities. The pixels with high probability will be those detected as cypress on both the spring and fall images. The pixels with medium probability are detected as cypress only on the spring image. The pixels with low probability are detected as cypress only on the fall image. When overlaying this probability map with the public land map of the study area, it was convenient to identify some cypress sites with high probability of occurrence that were not located on public lands and thus were potentially threatened by converting to other land uses or logging (Figure 4).
Figure 4. Examples of cypress occurrence with three probabilities on public lands.
Remotesensing 01 01028 g004

3.5. Limitations of Subpixel Analysis

Although cypress trees were successfully detected using subpixel analysis in this project, several limitations need to be identified. First, the high accuracy of IMAGINE Subpixel Classifier depends on the use of whole-pixel signatures that are derived from training set pixels containing greater than 90% of the MOI [39]. Therefore, it is critical to collect training sites that have at least 90% of cypress fractions. However, in a real world situation, it is very difficult to determine the fractions of cypress within the area of a pixel. In this project, training sites with a high degree of canopy closure were selected by visually estimating the percent cover of cypress trees. The results could be very different if different training sites were used. Second, part of the accuracy assessment process involved in visiting the sites selected by random points from the detection images. However, it is difficult to decide the starting and ending locations of the sites and to determine whether those sites on the ground have the same boundaries as or completely contain those pixels on the images. In this study, we used GPS to actually find the selected point in the field and then determined whether there were at least 10 pixels of cypress lands surrounding that point by visual estimation. Also, the cypress fractions were ignored in this process although the IMAGINE Subpixel Classifier produced detection images with eight categories ranging from 20% subpixel occurrences to whole pixel occurrences. Third, this work used NWI data to reduce the error of commission. However, NWI data generally have a minimum mapping unit much bigger than the image pixel size of 30 meters. Therefore, this filtering process may mask out some small patches of cypress trees that were not mapped in NWI data but have been detected by subpixel analysis. Furthermore, a potential problem that might rise in the application of subpixel analysis is image registration. Many image processing applications, such as change detection analysis, require an accurate image registration in order to estimate the underlying differences between two or more images acquired by different sensors or at different times. Some algorithms have been developed for performing image registration with subpixel accuracy [40,41]. As IMAGINE Subpixel Classifier and other subpixel classification methods aim to detect materials smaller than one pixel, using these techniques in change detection analysis might need a much higher image registration accuracy than the general subpixel accuracy developed for per-pixel classification methods.

4. Conclusions

This study investigated the capability of the IMAGINE Subpixel Classifier for detecting cypress trees in Western Florida, Southern Georgia, and Southeastern Alabama using Landsat 7 ETM+ data. This research project addressed two research questions regarding the ability of multitemporal analysis to improve classification accuracies of subpixel detections of cypress and the ability of applying signatures developed from one scene to another geographic area. Results from the study reflected that the subpixel analysis combining the spring and the fall detections improved the overall accuracy by 7%, which demonstrated that multitemporal analysis should be worthy of doubling image acquisition and processing costs. In addition, the probability map generated in this project overlaid with public land data provided useful information to facilitate conservation planning of wetlands. As to the signature extension capacity, the result indicated that signatures developed from the eastern scenes could be applied to classify the western scenes. However, cautions should be taken when conducting this analysis. In this study, the signatures derived from the fall east image only produced an overall accuracy of 71%. It was the analysis of the spring western imagery that greatly improved the ability of signature extension. Additional research is required to investigate three questions. The first one is to determine whether the signatures derived in this project can be used to other geographic areas that are not adjacent to this area or that have completely different environmental conditions. The second one is to investigate whether multitemporal analysis is always necessary in signature extension analysis. The third one is to examine the influence of image registration accuracy on the applications of subpixel analysis. In conclusion, this project demonstrated the potential of subpixel analysis in detecting cypress trees. However, there are some limitations or uncertainties associated with this technology and further research is required.

Acknowledgements

This work had been funded by U.S. Fish & Wildlife Service, Panama City Field Office. The authors wish to thank Basil G. Savitsky for his contribution to this project.

References and Notes

  1. Stedman, S.; Dahl, T.E. Status and Trends of Wetlands in the Coastal Watersheds of the Eastern United States 1998 to 2004; National Oceanic and Atmospheric Administration, National Marine Fisheries Service and U.S. Department of the Interior, Fish and Wildlife Service: Portland, OR, USA, 2008.
  2. Duryea, M.L.; Hermansen, L.A. Cypress: Florida’s Majestic and Beneficial Wetlands Tree; Publication CIT 1186, School of Forest Resources and Conservation, Florida Cooperative Extension Service, Institute of Food and Agricultural Sciences: University of Florida Gainesville, FL, USA, 2006. [Google Scholar]
  3. Save Our Cyress-Just Say No To Cypress Mulch. Available online: http://saveourcypress.org (accessed on October 26, 2009).
  4. Brown, M.J. Forest statistics for Florida, 1995; Research Bulletin SRS-6; USDA Forest Service: Asheville, NC, USA, 1996. [Google Scholar]
  5. Myers, R.L.; Ewell, J.J. Ecosystems of Florida; University of Central Florida Press: Orlando, FL, USA, 1990; pp. 286–291. [Google Scholar]
  6. Cowardin, L.M.; Carter, V.; Golet, F.C.; LaRoe, E.T. Classification of Wetlands and Deepwater Habitats of the United States; U.S. Department of the Interior, Fish and Wildlife Service: Washington, DC, USA, 1979.
  7. Turner, B.L., II; Cortina Villar, S.; Foster, D.; Geoghegan, J.; Keys, E.; Klepeis, P.; Lawrence, D.; Macario Mendoza, P.; Manson, S.; Ogneva-Himmelberger, Y.; Plotkin, A.B.; Pérez Salicrup, D.; Roy Chowdhury, R.; Savitsky, B.; Schneider, L.; Schmook, B.; Vance, C. Deforestation in the southern Yucatán peninsular region: an integrative approach. For. Ecol. Manage. 2001, 154, 353–370. [Google Scholar] [CrossRef]
  8. Kashaigili, J.J.; Mbilinyi, B.P.; Mccartney, M.; Mwanuzi, F.L. Dynamics of Usangu plains wetlands: use of remote sensing and GIS as management decision tools. Phys. Chem. Earth. 2006, 31, 967–975. [Google Scholar] [CrossRef]
  9. Carreño, M.F.; Esteve, M.A.; Martinez, J.; Palazón, J.A.; Pardo, M.T. Habitat changes in coastal wetlands associated to hydrological changes in the watershed. Estuar. Coast. Shelf Sci. 2008, 77, 475–483. [Google Scholar] [CrossRef]
  10. Castañeda, C.; Ducrot, D. Land cover zapping of wetland areas in an agricultural landscape using SAR and Landsat imagery. J. Environ. Manage. 2009, 90, 2270–2277. [Google Scholar] [CrossRef] [PubMed]
  11. Xie, Z.; Xu, X.; Yan, L. Analyzing qualitative and quantitative changes in coastal wetland associated to the effects of natural and anthropogenic factors in a part of Tianjin, China. Estuar. Coast. Shelf Sci. [CrossRef]
  12. Bock, M. Remote sensing and GIS-based techniques for the classification and monitoring of biotopes. J. Nat. Conserv. 2003, 11, 145–155. [Google Scholar] [CrossRef]
  13. Hess, L.L.; Melack, J.M.; Novo, E.M.L.M.; Barbosa, C.C.F.; Gastil, M. Dual-season mapping of wetland inundation and vegetation for the central Amazon basin. Remote Sens. Environ. 2003, 87, 404–428. [Google Scholar] [CrossRef]
  14. Wright, C.; Gallant, A. Improved wetland remote sensing in Yellowstone National Park using classification trees to combine TM imagery and ancillary environmental data. Remote Sens. Environ. 2007, 107, 582–605. [Google Scholar] [CrossRef]
  15. Laba, M.; Downs, R.; Smith, S.; Welsh, S.; Neider, C.; White, S.; Richmond, M.; Philpot, W.; Baveye, P. Mapping invasive wetland plants in the Hudson River National Estuarine Research Reserve using quickbird satellite imagery. Remote Sens. Environ. 2008, 112, 286–300. [Google Scholar] [CrossRef]
  16. MacAlister, C.; Mahaxay, M. Mapping wetlands in the Lower Mekong Basin for wetland resource and conservation management using Landsat ETM images and field survey data. J. Environ. Manage. 2009, 90, 2130–2137. [Google Scholar] [CrossRef] [PubMed]
  17. Lee, T.; Yeh, H. Applying remote sensing techniques to monitor shifting wetland vegetation: a case study of Danshui River estuary mangrove communities, Taiwan. Ecol. Eng. 2009, 35, 487–496. [Google Scholar] [CrossRef]
  18. Sader, S.A.; Ahl, D.; Liou, W.S. Accuracy of Landsat-TM and GIS rule-based methods for forest wetland classification in Maine. Remote Sens. Environ. 1995, 53, 133–144. [Google Scholar] [CrossRef]
  19. Song, C. Spectral mixture analysis for subpixel vegetation fractions in the urban environment: how to incorporate endmember variability? Remote Sens. Environ. 2005, 95, 248–263. [Google Scholar] [CrossRef]
  20. Shanmugam, P.; Ahn, Y.H.; Shanmugam, S. A comparison of the classification of wetland characteristics by linear spectral mixture modeling and traditional hard classifiers on multispectral remotely sensed imagery in southern India. Ecol. Model. 2006, 194, 379–394. [Google Scholar] [CrossRef]
  21. Lu, D.; Weng, Q. A survey of image classification methods and techniques for improving classification performance. Int. J. Remote Sens. 2007, 28, 823–870. [Google Scholar] [CrossRef]
  22. Fuller, R.M.; Groom, G.B.; Mugisha, S.; Ipulet, P.; Pomeroy, D.; Katende, A.; Bailey, R.; Ogutu-Ohwayo, R. The integration of field survey and remote sensing for biodiversity assessment: a case study in the tropical forests and wetlands of Sango Bay, Uganda. Biol. Conserv. 1998, 86, 379–391. [Google Scholar] [CrossRef]
  23. Mustard, J.F. Relationships of soil, grass, and bedrock over the Kaweah Serpentinite Melange through spectral mixture analysis of AVIRIS data. Remote Sens. Environ. 1993, 44, 293–308. [Google Scholar] [CrossRef]
  24. Radeloff, V.C.; Mladenoff, D.J.; Boyce, M.S. Detecting Jack Pine budworm defoliation using spectral mixture analysis: Separating effects from determinants. Remote Sens. Environ. 1999, 69, 156–169. [Google Scholar] [CrossRef]
  25. Small, C. The Landsat ETM+ spectral mixing space. Remote Sens. Environ. 2004, 93, 1–17. [Google Scholar] [CrossRef]
  26. ERDAS White Paper. IMAGINE Subpixel ClassifierTM vs. Linear Spectral Unmixing. Available online: http://www.erdas.com/Resources/WhitePapers/tabid/118/Default.aspx (accessed on October 23, 2009).
  27. Flanagan, M.; Civco, D.L. Imagine Subpixel Classifier Version 8.4. Photogramm. Eng. Rem. S. 2001, 67, 23–28. [Google Scholar]
  28. Ji, M.; Jensen, J.R. Effectiveness of Subpixel Analysis in Detecting and Quantifying Urban Imperviousness from Landsat Thematic Mapper Imagery. Geocarto Int. 1999, 14, 33–41. [Google Scholar] [CrossRef]
  29. Flanagan, M.; Civco, D.L. Subpixel Impervious Surface Mapping. In Proceedings of ASPRS 2001 Annual Convention, St. Louis, MO, USA, April 2001.
  30. Myint, S.W. Urban Vegetation Mapping Using Sub-pixel Analysis and Expert System Rules: A Critical Approach. Int. J. Remote Sens. 2006, 27, 2645–2665. [Google Scholar] [CrossRef]
  31. Johnson, J.; Greenfield, P.; Munson, A.S. An Evaluation of the Utility of Sub-Pixel Analysis of Thematic Mapper Imagery for the Spruce Beetle Outbreak on the Manti-LaSal National Forest; USDA Forest Service Forest Health Technology Enterprise Team: Fort Collins, CO, USA, 2001. [Google Scholar]
  32. Karaska, M.A.; Huguenin, R.L.; van Blaricom, D.; Savitsky, B. Subpixel Classification of Cypress and Tupelo Trees in TM Imagery. In Proceedings of the 1995 ACSM/ASPRS Annual Convention and Exposition, Charlotte, NC, USA, February 1995; pp. 856–865.
  33. Huguenin, R.; Karaska, M.A.; Blaricom, D.V.; Jensen, J.R. Subpixel Classification and Bald Cypress and Tupelo Gum Trees in Thematic Mapper Imagery. Photogramm. Eng. Rem. S. 1997, 63, 717–725. [Google Scholar]
  34. Boudreau, E.; Huguenin, R.; Karaska, M. Nonparametric classification of subpixel materials in multispectral imagery. SPIE 1996, 2758, 31. [Google Scholar]
  35. Bhandari, S.P.; Hussin, Y.A. A comparison of sub-pixel and maximum likelihood classification of landsat etm+ images to detect illegal logging in the tropical rain forest of Berau, east Kalimantan, Indonesia. In Proceedings of Map Asia 2003 Conference, Kuala Lumpur, Malaysia, October 2003; Available online: http://gisdevelopment.net/proceedings/mapasia/2003/nrm/index.htm (accessed on July 7, 2009).
  36. Wolfe, S.H.; Reidenauer, J.A.; Bruce Means, D. An ecological characterization of the Florida panhandle; U.S. Department of the Interior, Fish and Wildlife Service: Washington, DC, USA; Minerals Management Service: New Orleans, LA, USA, 1988. [Google Scholar]
  37. Gatewood, S.; Johnson, K.W.; McWilliams, R.G. A Comprehensive Study of A Portion of The Red Hills Region of Georgia; The Thomas College Regional Resource Center: Thomasville, GA, USA, 1994. [Google Scholar]
  38. U.S. Census Bureau. Population and household economic topics. Available online: http://www.census.gov/population/www/popdata.html (accessed on October 26, 2009).
  39. Applied Analysis Inc. IMAGINE Subpixel ClassifierTM: User’s Guide; Applied Analysis Inc.: Billerica, MA, USA, 2000. [Google Scholar]
  40. Humblot, F.; Collin, B.; Mohammad-Djafari, A. Evaluation and practical issues of subpixel image registration using phase correlation methods. In Proceedings of PSIP2005, Toulouse, France, January 31–February 2, 2005.
  41. Karybali, I.G.; Psarakis, E.Z.; Berberidis, K.; Evangelidis, G.D. An efficient spatial domain technique for subpixel image registration. Signal Process.-Image 2008, 23, 711–724. [Google Scholar] [CrossRef]

