Merging Satellite Retrievals and Reanalyses to Produce Global Long-Term and Consistent Surface Incident Solar Radiation Datasets


College of Global Change and Earth System Science, Beijing Normal University, Beijing 100875, China
*
Author to whom correspondence should be addressed.
Remote Sens. 2018, 10(1), 115; https://doi.org/10.3390/rs10010115
Submission received: 11 November 2017
/
Revised: 12 January 2018
/
Accepted: 13 January 2018
/
Published: 16 January 2018
(This article belongs to the Special Issue Remote Sensing of Land-Atmosphere Interactions)
Abstract
:Surface incident solar radiation (Rs) is a key parameter in many climatic and ecological processes. The data from satellites and reanalysis have been widely used. However, for reanalysis, Rs data has been shown to have substantial spatial bias, and the time span of reliable satellite Rs is too short for climatic and ecological studies. Combining reanalysis and satellite data would be an effective method for generating long-term and consistent Rs datasets. Here, we apply a cumulative probability density function-based (CPDF) method to merge eight reanalyses with the latest available satellite Rs data from Clouds and Earth’s Radiant Energy System Energy Balanced and Filled (CERES EBAF) surface retrievals. The CPDF method not only reduces the spatial bias of the reanalysis Rs data, but also makes the Rs datasets in a global, long-term and consistent way. The observed Rs data collected at 54 Baseline Surface Radiation Network (BSRN) stations from 1992 to 2016 are used to evaluate the method. Results show that the CPDF method could reduce the mean absolute biases (MAB) of the reanalysis Rs effectively by 21.24–64.36%. The European Centre for Medium-Range Weather Forecasts Re-Analysis interim (ERA-interim) reanalysis Rs data, which are available for 1979 onward, perform the best before MAB = 13.20 W·m−2 and after MAB = 10.40 W·m−2 merging. This small post-merging MAB of the ERA-interim reanalysis is caused by the MAB of 9.90 W·m−2 in the satellite Rs retrievals. The Japanese 55-year reanalysis provides Rs values back to 1958, and CPDF can reduce its MAB by 32.87%, to 11.17 W·m−2. The National Oceanic and Atmospheric Administration (NOAA)-CIRES twentieth-century reanalysis (CIRES) and the ECMWF twentieth-century reanalysis (ERA20CM) provide century-long Rs estimates. CIRES performs better after merging. The MAB of CIRES can be reduced by 32.10%, to 12.99 W·m−2, while ERA20CM’s can be reduced by 12.51%, to 16.40 W·m−2.
1. Introduction
Surface Incident solar radiation (Rs), which is also often referred to as the downward solar irradiance, is a key parameter in many climate and ecological processes, such as evapotranspiration [1,2,3], canopy photosynthesis [4], net primary production [5,6], crop growth management [7], and so on. Long-term Rs datasets with global coverage and reasonable accuracy have a great value these days. Globally-distributed ground observations of Rs began in 1958, and provide solid evidence for global dimming and brightening [8,9,10]. However, there are recent studies showing that such observations have poor performance in quantifying the decadal variability in Rs [10,11,12], indicating that accuracy estimation of long-term trends should depend on the measurement methods and instrument maintenance [13]. Therefore, several long-term observation networks were developed under the high-quality control. The Baseline Surface Radiation Network (BSRN) [14] which provides high-quality Rs observations, has been widely used in the assessment of Rs variation at local sites [15] and the evaluation of Rs derived by satellite data and reanalyses [16,17]. The Surface Radiation Budget Network (SURFRAD), the U.S. component of BSRN, was developed by the National Oceanic and Atmospheric Administration (NOAA) to provide accurate, continuous, and long-term Rs data for the United States [18]. There are also studies [19,20,21,22,23,24,25] suggesting that sunshine duration records can be used to reconstruct long-term Rs with reliable accuracy. However, both ground-based observations and sunshine duration records are spatially sparse.
Satellite Rs retrievals provide global coverage. Many satellite-based Rs products have been developed, such as the Global Energy and Water Cycle Experiment Surface Radiation Budget (GEWEX-SRB) [26]. Rs values calculated based on satellite cloud observations, i.e., the International Satellite Cloud Climatology Project (ISCCP) [27,28], have been shown to be inhomogeneous in depicting long-term variability [29,30]. Inhomogeneities in cloud products, caused by the different capabilities of geostationary and polar-orbiting satellites for the detection of low-level clouds from ISCCP, have introduced significant inhomogeneity in the Rs data from the GEWEX-SRB. Another satellite Rs product, Clouds and Earth’s Radiant Energy System (CERES) Energy Balanced and Filled (EBAF) product, is also widely used. Different from the GEWEX-SRB product, inhomogeneity issues have been corrected in the CERES EBAF data, by merging the cloud amount data from polar-orbiting satellites and the mean diurnal cycle of cloud cover from the geostationary satellite data [31]. Studies have shown that the CERES EBAF surface product has a better performance than other Rs products [10,32,33] due to the top of the atmosphere (TOA) observation constraint. Nevertheless, the temporal coverage of the recently developed high-accuracy satellite Rs product is relatively short, and limits the application of these products in climate change studies.
Global Rs data is provided in the reanalysis systems as well. Current reanalysis systems calculate cloud properties based on the assimilation of water vapor and temperature profiles from radiosonde and satellite observations. However, spatial biases in these data have been found, by comparing Rs data derived from reanalysis datasets with field observations and satellite data in numerous validation studies [10,34,35,36]. Wang et al. [10] find that the Rs data derived from the Modern Era Retrospective-analysis for Research and Applications (MERRA) reanalysis data and ERA-interim (ERAI) products have a large spatial bias of 29.8 W·m−2 and 19.1 W·m−2 in China, respectively. Boilley and Wald [35] conclude that overestimations of Rs by MERRA are probably due to the underestimation of cloudy conditions. Jia et al. [37] find that Rs from the National Centers for Environmental Prediction and National Center for Atmospheric Research Reanalysis (NCEP1) has a poor correlation with field observations, showing a root mean square error of 56.5 W·m−2 over East Asia.
The latest satellite Rs retrievals from the CERES EBAF surface product can be used to improve the reanalysis Rs estimates. However, the CERES EABF-surface product is only available after the year 2000. Direct bias correction can be performed for the reanalysis Rs data for this period. To produce long-term and consistent values of Rs, a new method is needed to correct the reanalysis Rs data before 2000.
Here, we apply a cumulative probability density function-based method (CPDF) to merge Rs satellite retrievals and reanalysis data. One can use the probability density distribution curves of Rs from the CERES EBAF surface to adjust the Rs values from reanalyses after 2000. Accordingly, Rs data from reanalyses before 2000 can also be adjusted, using the derived distribution curves. We used the CPDF method to merge the monthly distribution of satellite Rs data and the reanalysis Rs data. After that, merged Rs data before and after the year 2000 were evaluated by Rs observations from 1992 to 2016, collected at globally-distributed BSRN stations [14].
2. Materials and Methods
2.1. Ground Observations of Surface Solar Radiation
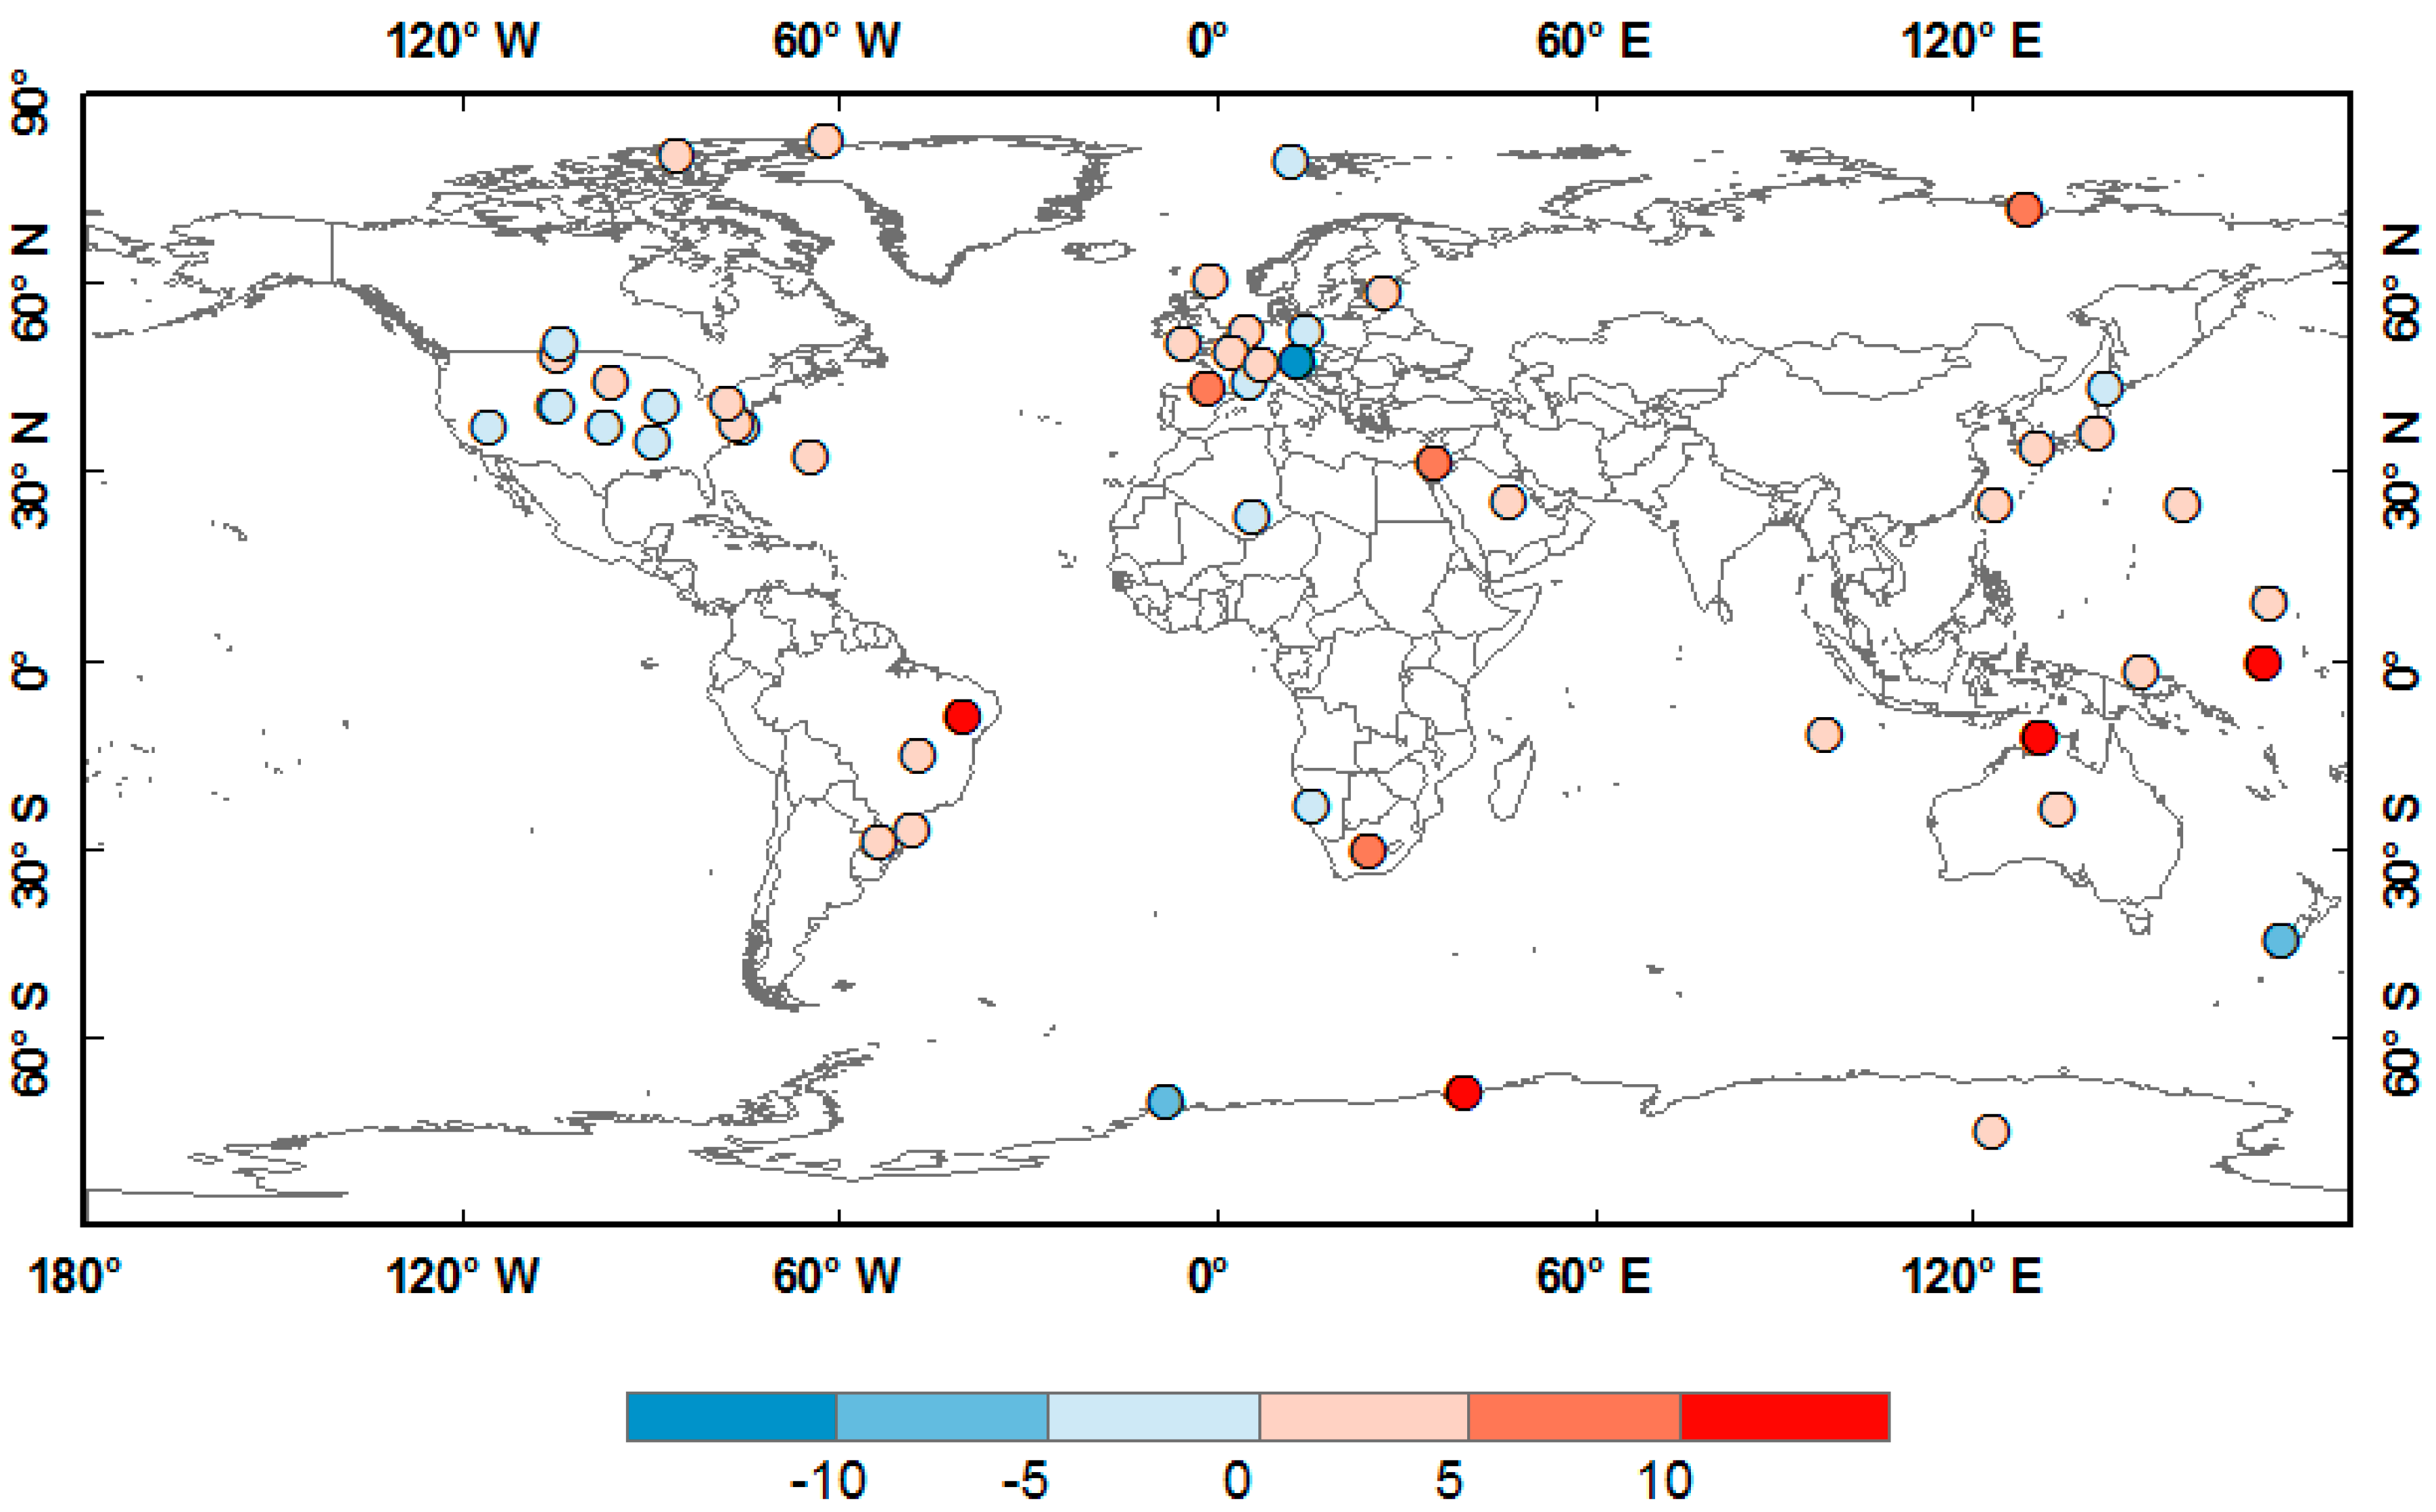
The BSRN was established by the World Climate Research Programme (WCRP), to provide high-quality surface radiation measurements with high temporal resolution [14]. Rs data from the BSRN are available for 1992 onward, and cover the major global climate zones. Each BSRN site has an independent principle investigator, and the data from each BSRN site undergo strict quality control. The Rs measurement instruments at BSRN sites are calibrated every six months, regularly maintaining an Rs uncertainty of less than 5% [12,38,39]. In this study, we used Rs data from 54 BSRN stations (Figure 1). We strictly followed the criterion described in [40], that all 24-hourly values must be present in order to compute a monthly mean.
2.2. Satellite Surface Solar Radiation Retrievals
Here we used monthly mean satellite Rs retrievals from the CERES EBAF surface data. CERES is a three-channel (0.3–5 µm, 8–12 µm, and 0.3–200 µm) radiometer that is equipped on the Tropical Rainfall Measuring Mission satellite (TRMM), Terra, Aqua, and Suomi National Polar-orbiting Partnership (S-NPP) satellites. The goal of the CERES instrument is to measure solar-reflected and Earth-emitted radiation from the top atmosphere to the surface Earth. TOA fluxes from CERES are energy-balanced, and serve as a constraint to the surface fluxes. To achieve this, the input datasets were adjusted within their range of uncertainty. To be specific, the cloud property data were then adjusted, using cloud profiling radar and Cloud-Aerosol Lidar and Infrared Pathfinder Satellite Observations (CALIPSO) detectors [41], and the temperature and humidity profiles are adjusted using the Atmospheric Infrared Sounder. Based on a modified Lagrange multiplier method, these adjustments of input parameters were then used to calculate the Rs adjustment and add these values to the original estimations of Rs to produce a final monthly mean Rs dataset [42]. The CERES EBAF surface product provided accurate Rs data, using adjusted input data. The cloud property retrievals primarily came from observations of the Moderate Resolution Imaging Spectroradiometer (MODIS) instrument. Atmospheric parameters, such as temperature and humidity profiles, were derived from the MERRA reanalysis.
Previous studies [10,36] have shown that the CERES EBAF surface product provides relatively accurate estimations of Rs. Ma et al. [12] find that the CERES EBAF surface Rs had a homogeneous distribution of bias of Rs, compared with 446 field observations. These findings are confirmed by Figure 1 in this study.
Compared with the observations at 54 BSRN stations, the CERES EBAF surface Rs data have an MAB of 9.9 W·m−2 (5.4%). Previous studies have shown that the CERES EBAF surface Rs data product is among the best of the currently available global satellite Rs retrievals [10,12,36]. Hence, CERES EBAF surface Rs data were used as references to correct the reanalyses in this study. Linear nearest-neighbor interpolations were applied, to make the spatial resolution of the reanalyses consistent with that of the CERES EBAF surface satellite retrievals with 1° spatial resolution.
2.3. Reanalysis
The reanalysis products used in this study include the ERAI [43], MERRA2 (MERRA Version 2) [44], Climate Forecast System Reanalysis (CFSR) [45], Japanese 55-year Reanalysis (JRA55) [46], National Centers for Environmental Prediction/Department of Energy reanalysis (NCEP2) [47], National Center for Environmental Prediction/National Center for Atmospheric Research reanalysis (NCEP1) [48], European Center for Medium-Range Weather Forecasting 20th-Century Reanalysis dataset (ERA20CM) [49], and the National Oceanic and Atmospheric Administration/Cooperative Institute for Research in Environmental Sciences (CIRES) Twentieth Century Global reanalysis [50] (see Table 1). These reanalyses include four third-generation reanalysis datasets (ERAI, MERRA2, CFSR, and JRA55), one second-generation reanalysis dataset (NCEP2), one first-generation reanalysis dataset (NCEP1), and two reanalysis datasets for the 20th century (ERA20CM and CIRES).
The shortwave radiation parameterization schemes of the eight reanalyses are different from one another, except for CFSR and CIRES, which are both based on a modified version of the Rapid Radiative Transfer Model for GCMs (RRTMG) (Table 1). However, most of the uncertainties in the calculated Rs stem from model inputs, including cloud and aerosol parameters, rather than the radiative transfer models themselves [51]. The maximum–random overlap method is used to describe the cloud overlap between the different vertical layers for the eight reanalyses, except for NCEP1 and NCEP2, which both used the random overlap method. Climatological aerosol values are used in most reanalyses except for NCEP1 and NCEP2. Among these reanalyses, only the MERRA2 assimilates transient aerosol information [52], including the inter-annual variations of atmospheric aerosols.
Conventional data, such as pressure, temperature, humidity profiles from weather stations, radiosondes, balloons, aircraft, and buoys were assimilated, except for ERA20CM and CIRES. ERA20CM only incorporates sea-surface temperature and sea-ice cover data in its boundary conditions. CIRES assimilates sea-ice concentrations, surface pressure, and sea-surface temperatures. The satellite data, including information of atmospheric temperature and humidity profiles, were assimilated in the eight reanalyses, except for ERA20CM and CIRES.
Satellite cloud motion winds, derived from geostationary meteorological satellites (Meteosat) operated by EUMETSAT, were only assimilated in ERAI, JRA55, and MERRA2. The TRMM Microwave Imager (TMI) radiance and its Total Column Water Vapor (TCWV) and rain rate satellite data were only used in JRA55, although JRA55 does not assimilate the data from the Atmospheric Infrared Sounder (AIRS), which are used by most reanalyses.
2.4. Method
The time span of the CERES satellite EBAF-surface estimated Rs data is short, but can provide realistic Rs values. The long-term Rs records in the reanalyses exhibit substantial spatial bias. Merging satellite and reanalysis Rs would be an effective way to generate long-term Rs data with high accuracy. Here, we applied a CPDF method to the reanalysis Rs data, a method that has been proposed to correct the bias in satellite precipitation retrievals using ground-based gauge data [53]. The basic idea of the CPDF is to match the distribution of the reference data. Its fusion method combines the value distribution of Rs data from satellite and Rs records from the reanalyses [53]. For example, when the 65 percentile values at the cumulative probability density function curve for the reanalysis estimates is 25 W·m−2, the two nearest-neighbor satellite estimates for the 65 percentile values are 13 W·m−2 and 14 W·m−2. Reanalysis estimates of 25 W·m−2 will be reduced to 13.5 W·m−2, so that the cumulative probability density function of the bias-corrected reanalysis estimates will be the same as for the satellite data.
Figure 2 illustrates how the CPDF methods result in a specific grid point of the ERAI reanalysis. The data from the CERES EBAF surface product and the ERAI products over the same period were used to draw curves of the cumulative probability density function (PDF) for each grid point. Afterwards, a merging procedure was performed, by adjusting the PDF of the ERAI for the whole time period based on the CERES EBAF surface data after 2000. This procedure was conducted for each grid point. The PDF of monthly mean Rs from satellite data can be used to correct the bias of reanalysis Rs for the whole period, including the period with reference data available and that without reference data. This is the key advantage of the cumulative probability density function based method, compared to the simple correction method.
The performance of the CPDF method was evaluated using the Rs observations collected at 54 BSRN stations from 1992 to 2016. The coefficient of determination (R2), MAB, and standard deviation (Std) were also calculated, to assess the merge results. The MAB values were calculated as the mean of the absolute value of the difference between the reference values and the obtained data. MAB was used instead of bias because its mean bias, which is commonly used, has the disadvantage of the positive and negative values cancelling each other out when summarizing all the sites results. The Std here means the standard deviation of the difference between the reference values and the obtained data.
3. Results
3.1. Comparisons of the Reanalyses and CERES EBAF Surface Product
Figure 3 illustrates the mean bias of the Rs from the eight reanalyses from 2000 to 2010, compared with the CERES EBAF surface satellite Rs. The period of 2000 to 2010 was selected to cover a common period of all the estimates of Rs (see Table 1). All the reanalyses contain significant negative and positive biases on a global scale, except for NCEP1, which exhibits a systematic bias of up to 50 W·m−2 for most areas.
Regionally, all reanalyses showed a positive bias in North America (2.82~39.11 W·m−2) and East Asia (15.21~53.92 W·m−2). On the western coast of South America, all reanalyses showed a positive bias (0.90~37.10 W·m−2), except for CFSR (−36.51 W·m−2). MERRA2 (−27.00 W·m−2), JRA55 (−2.53 W·m−2) and NCEP2 (−13.11 W·m−2) had a negative bias over Indonesia. CFSR and CIRES showed a positive bias (29.63 W·m−2 and 22.74 W·m−2). Substantial biases in the reanalysis Rs data were found at most marine strato-cumulus regions, particularly off the western coasts of the continents, which is likely due to bias in the cloud properties from the reanalysis systems. Moreover, the reanalyses applied a convection parameterization scheme to estimate marine strato-cumulus clouds, because of their coarse model spatial resolution [54,55]. In contrast, the CERES EBAF surface product integrated the cloud observation data from CALIPSO–CloudSat merged cloud profiles and MODIS data, to improve its cloud detection accuracy.
The globally-averaged MAB values, which were calculated by averaging the absolute values of the differences between the reanalyses and the CERES EBAF surface product, were 12.62 W·m−2 (7.70% in relative value) for ERAI, 16.15 W·m−2 (10.09%) for MERRA2, 15.27 W·m−2 (9.15%) for JRA55, 17.80 W·m−2 (10.69%) for CFSR, 23.13 W·m−2 (13.63%) for NCEP2, 27.15 W·m−2 (14.61%) for NCEP1, 15.04 W·m−2 (9.03%) for ERA20CM, and 19.39 W·m−2 (11.05%) for CIRES (Table 1).
3.2. Evaluation of the Merged Surface Solar Radiation Data
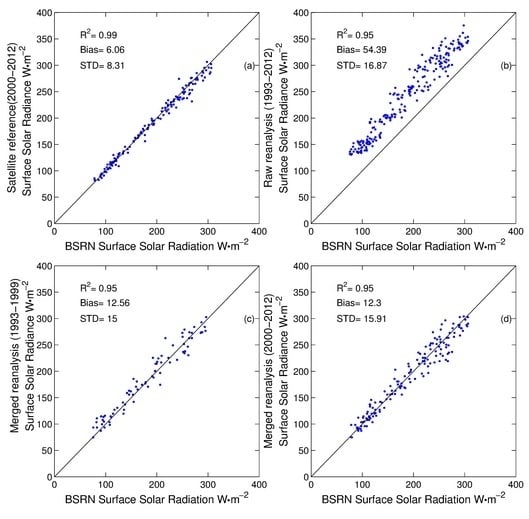
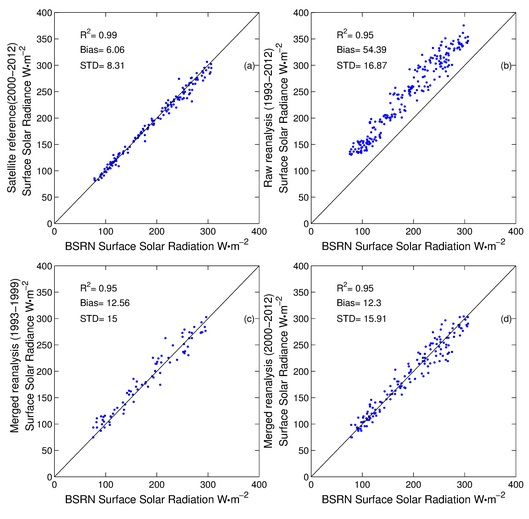
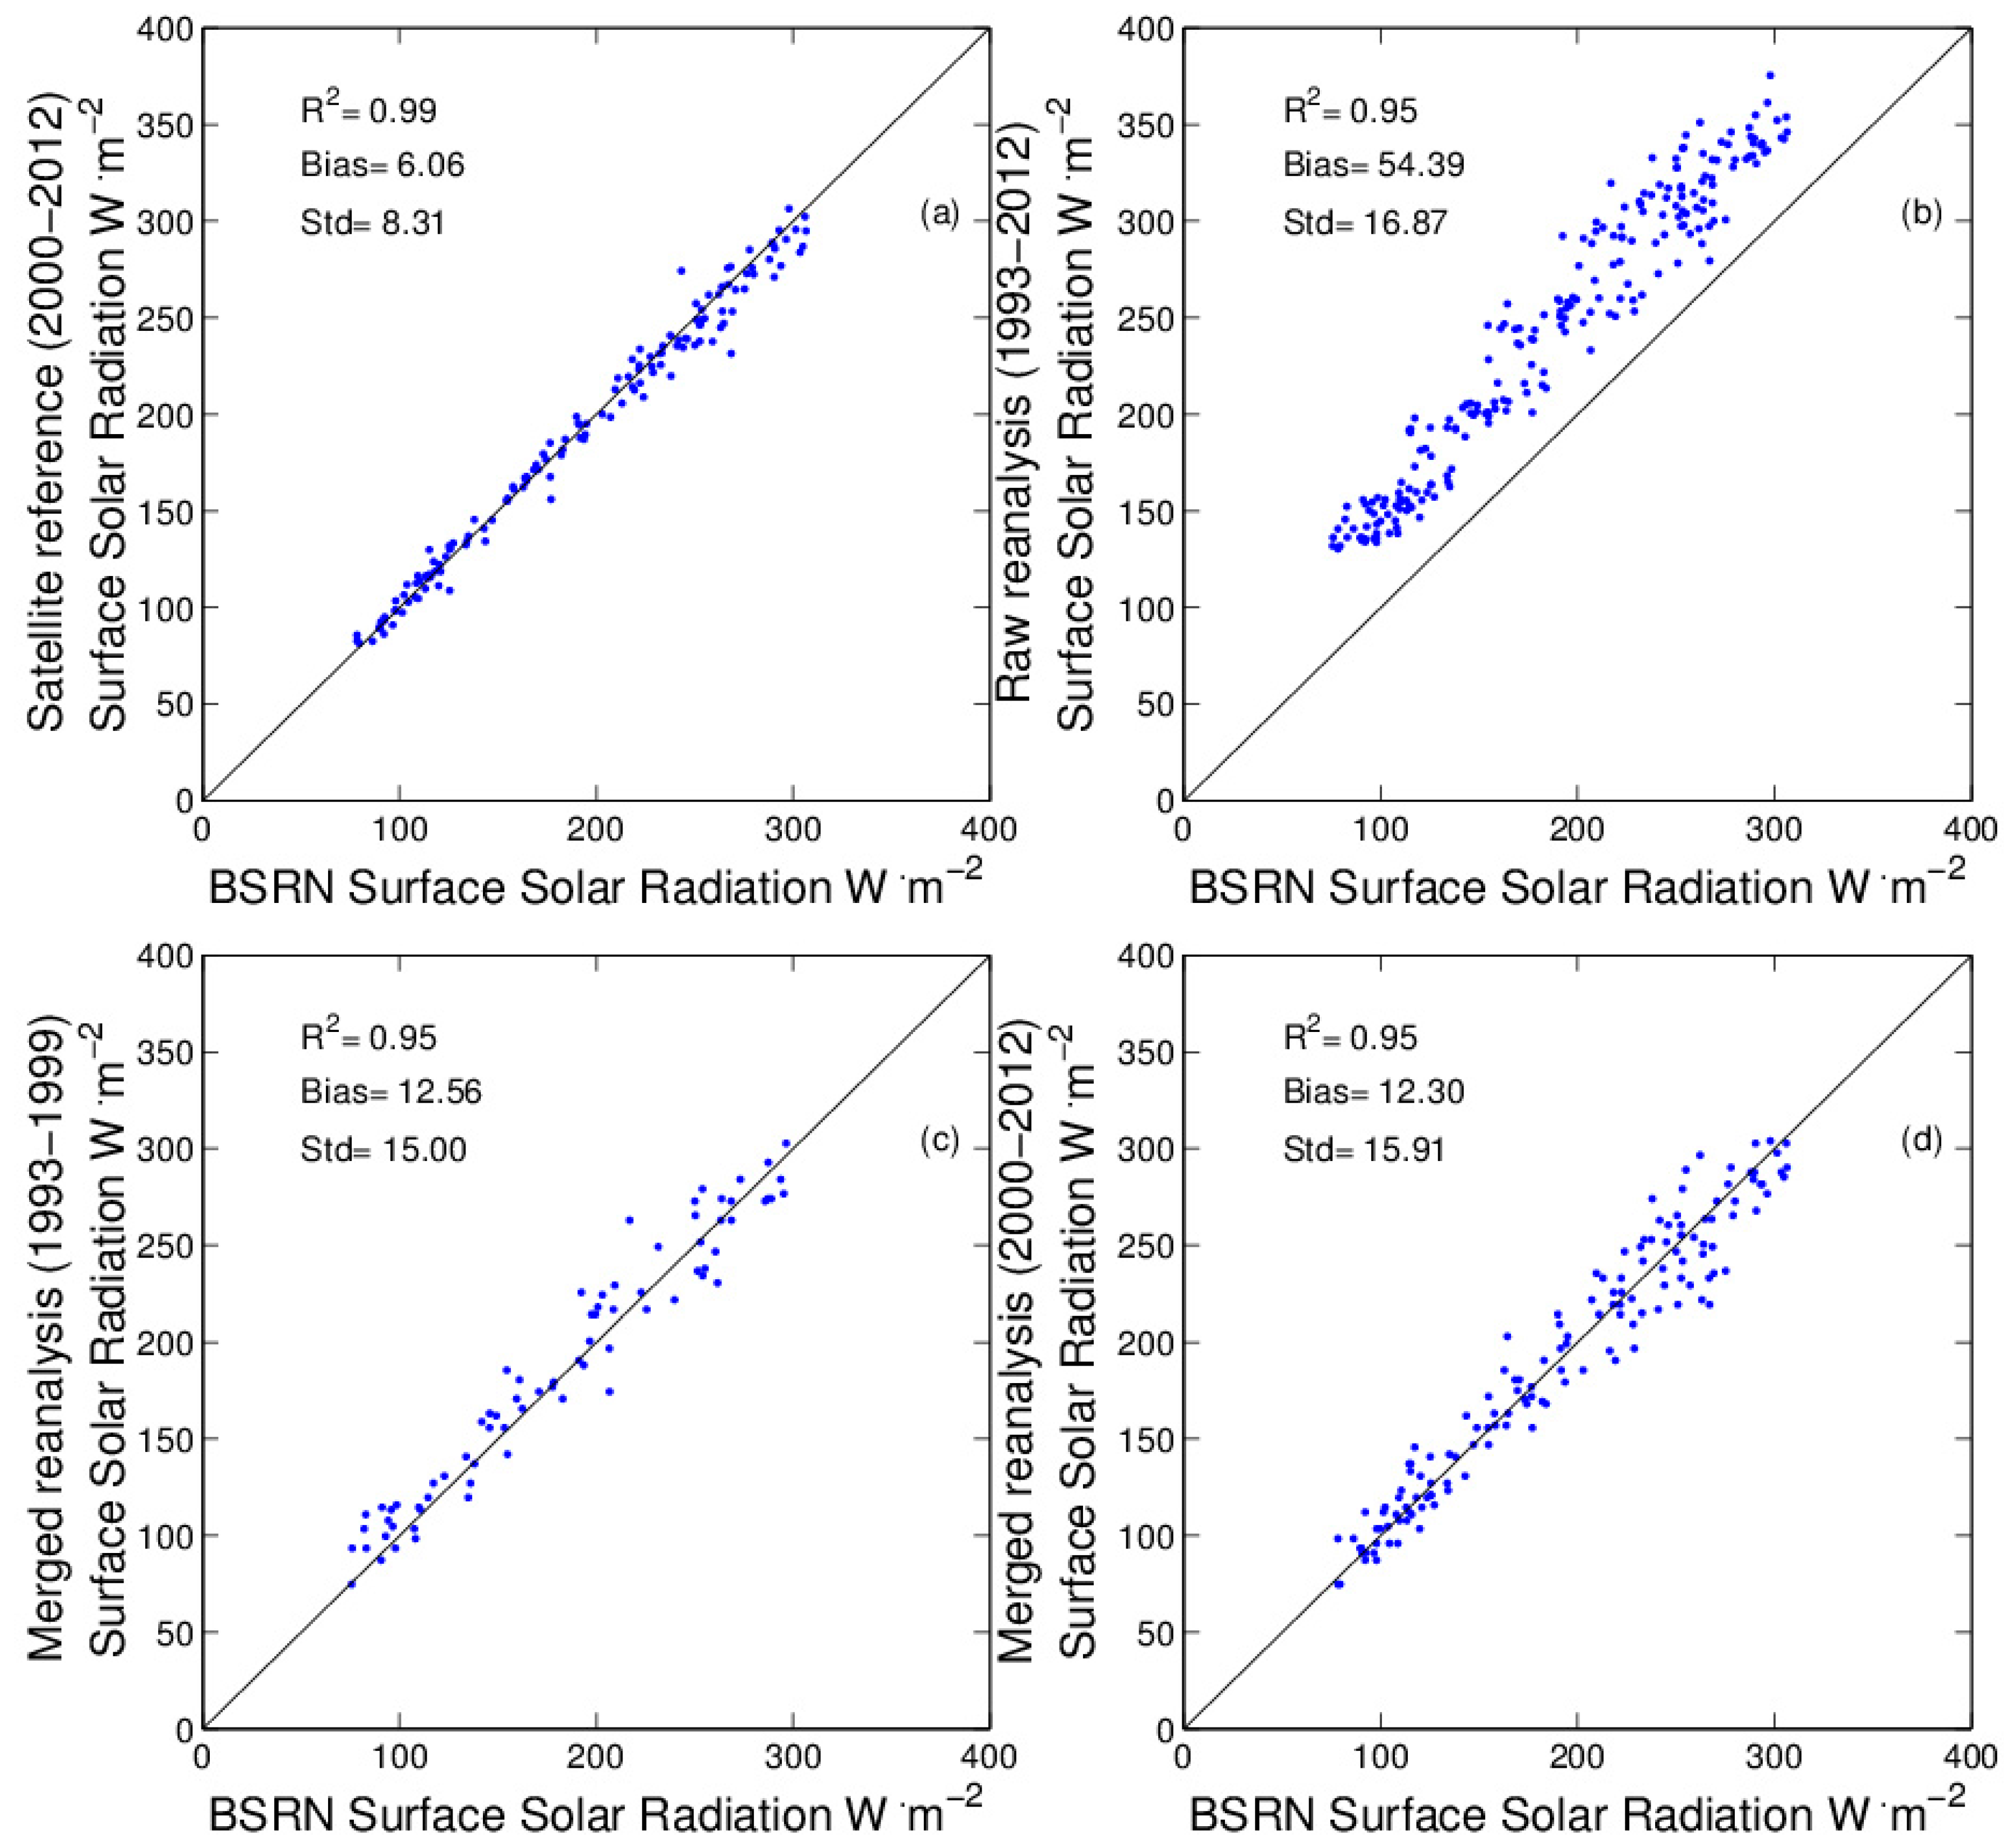
Figure 4 shows a single site example of the comparison of the merged and raw NCEP1 data. This BSRN Billings site (latitude: 36.6N, longitude: 97.51W) is located in the Southern Great Plains of the United States, and the observation period was from 1993 to 2012. CERES EBAF surface data, raw NCEP1, and merged NCEP1 data are all highly correlated with the BSRN field observations, with an R2 value of 0.95, due to the monthly records including seasonality well-simulated in the data. Compared with the CERES EBAF surface data, the raw NCEP1 data showed poor performance, with an MAB of 54.39 W·m−2 and a Std of 16.87 W·m−2. However, the merged NCEP1 data performed better, with a lower MAB (12.30–12.56 W·m−2) and Std (15.00–15.91 W·m−2), for both the period after the year 2000 with the reference data and the period before 2000 without the reference data.
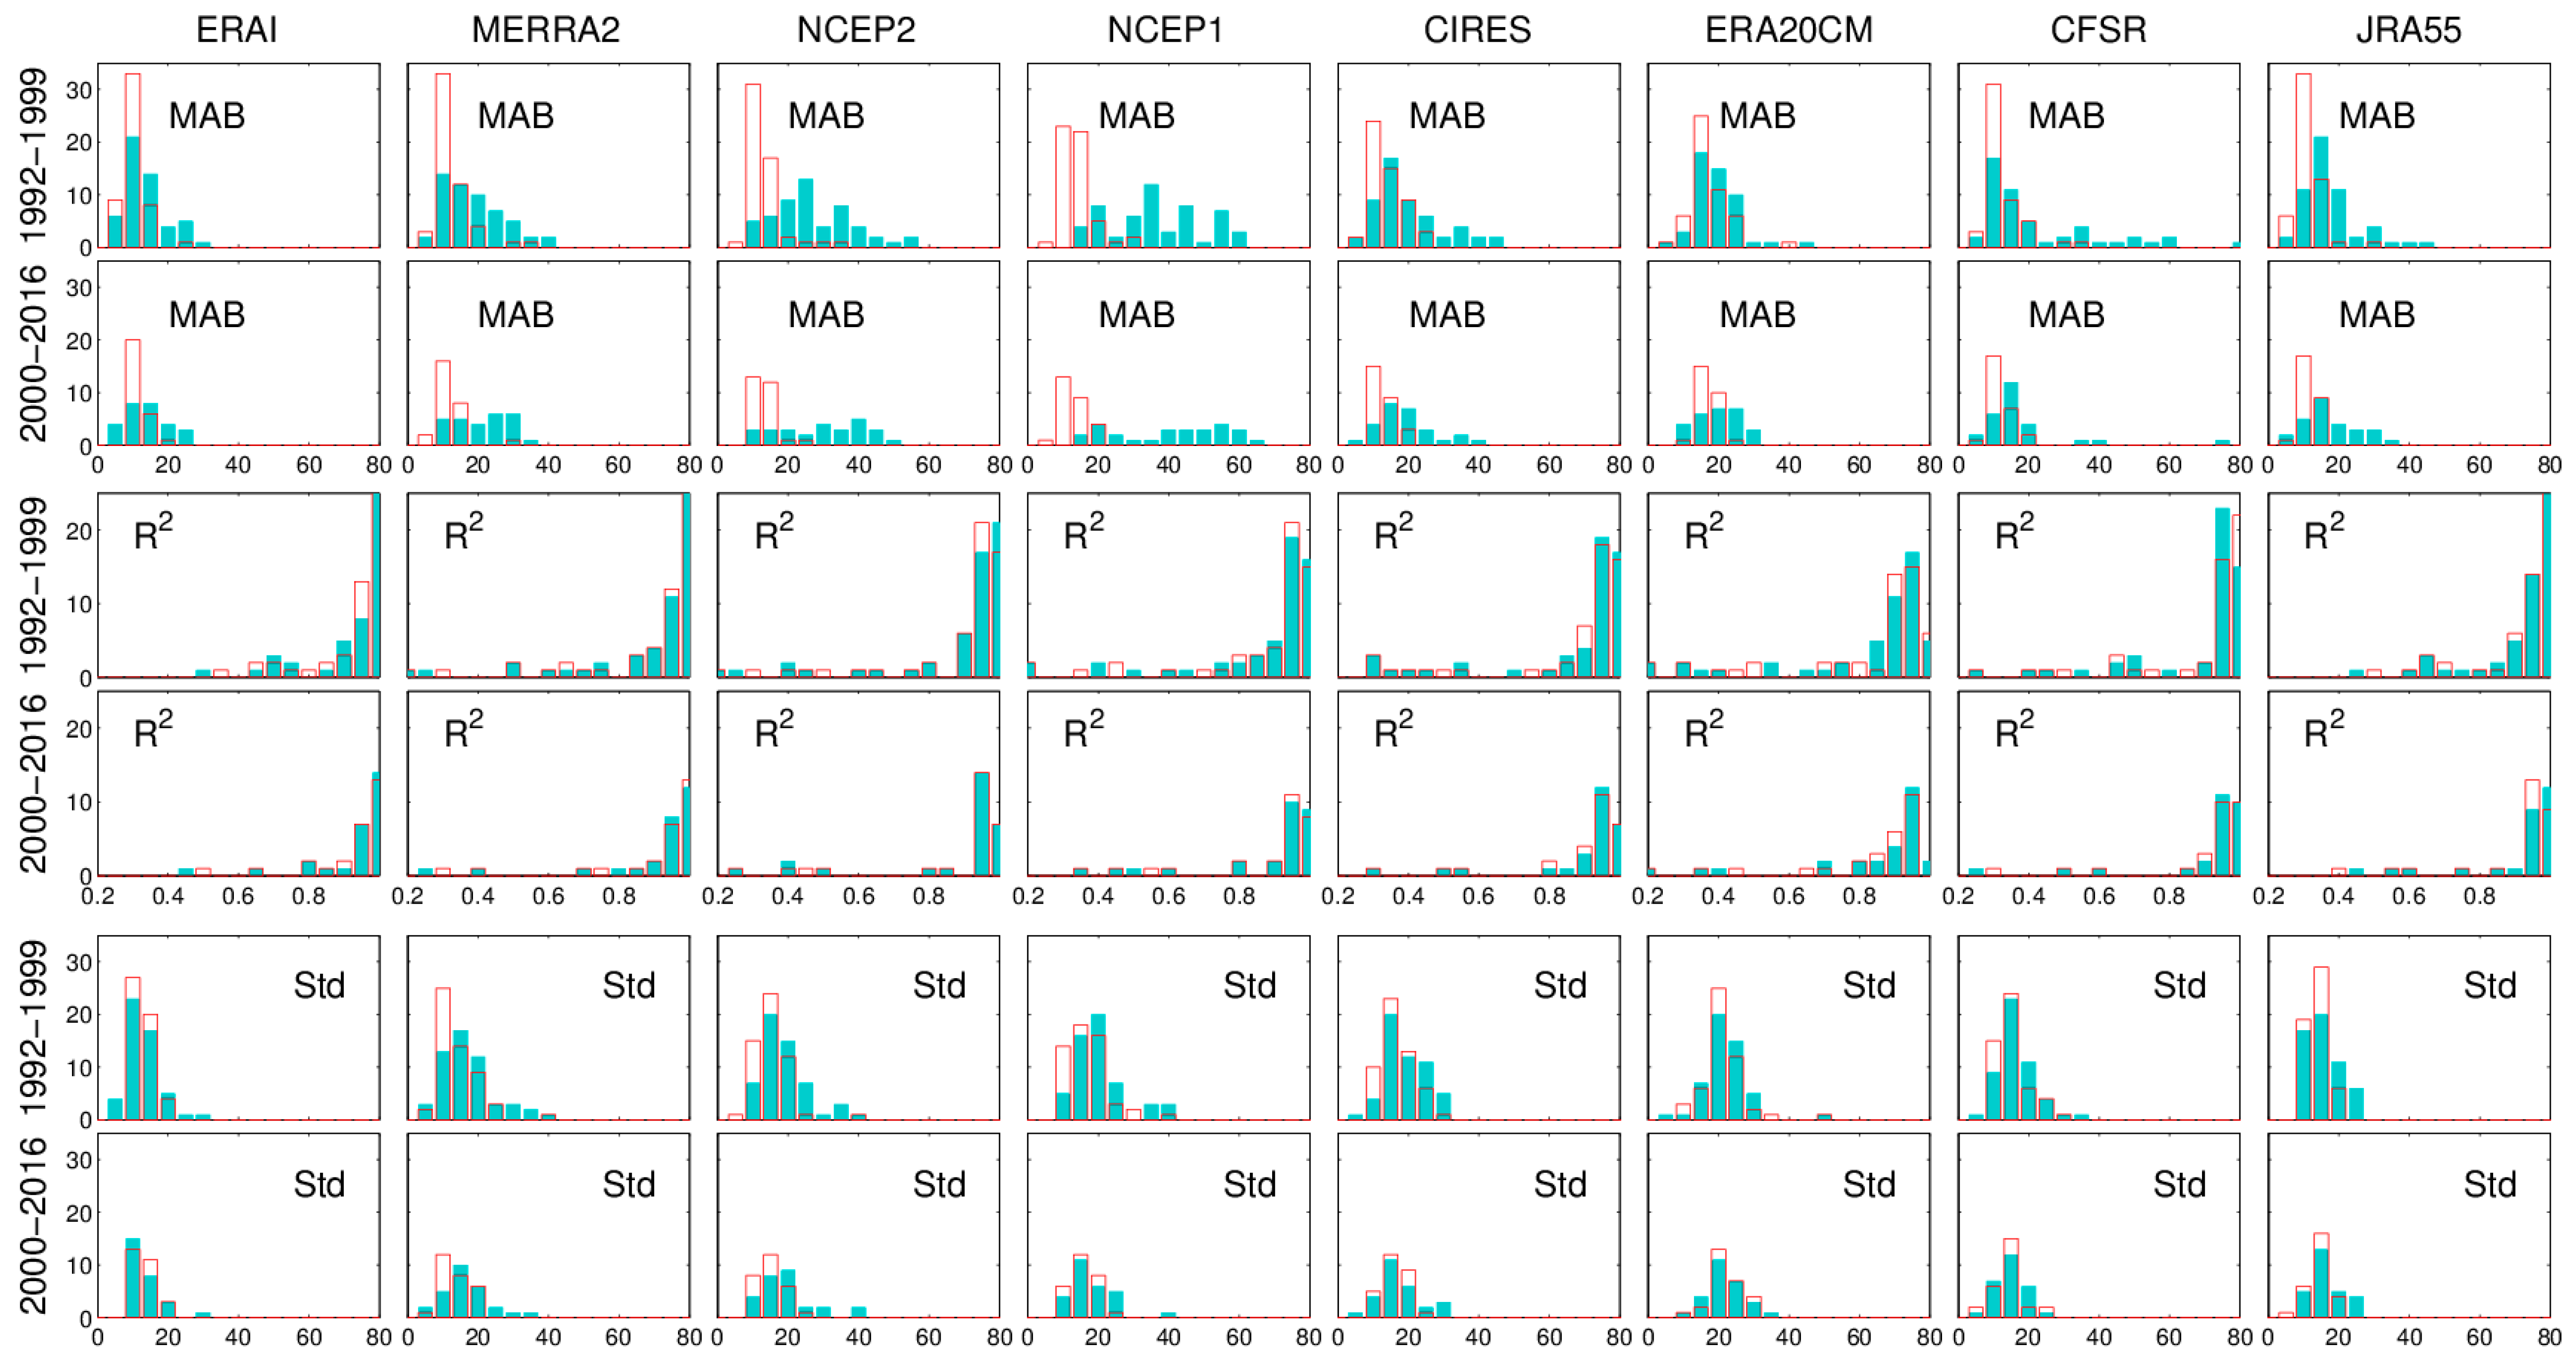
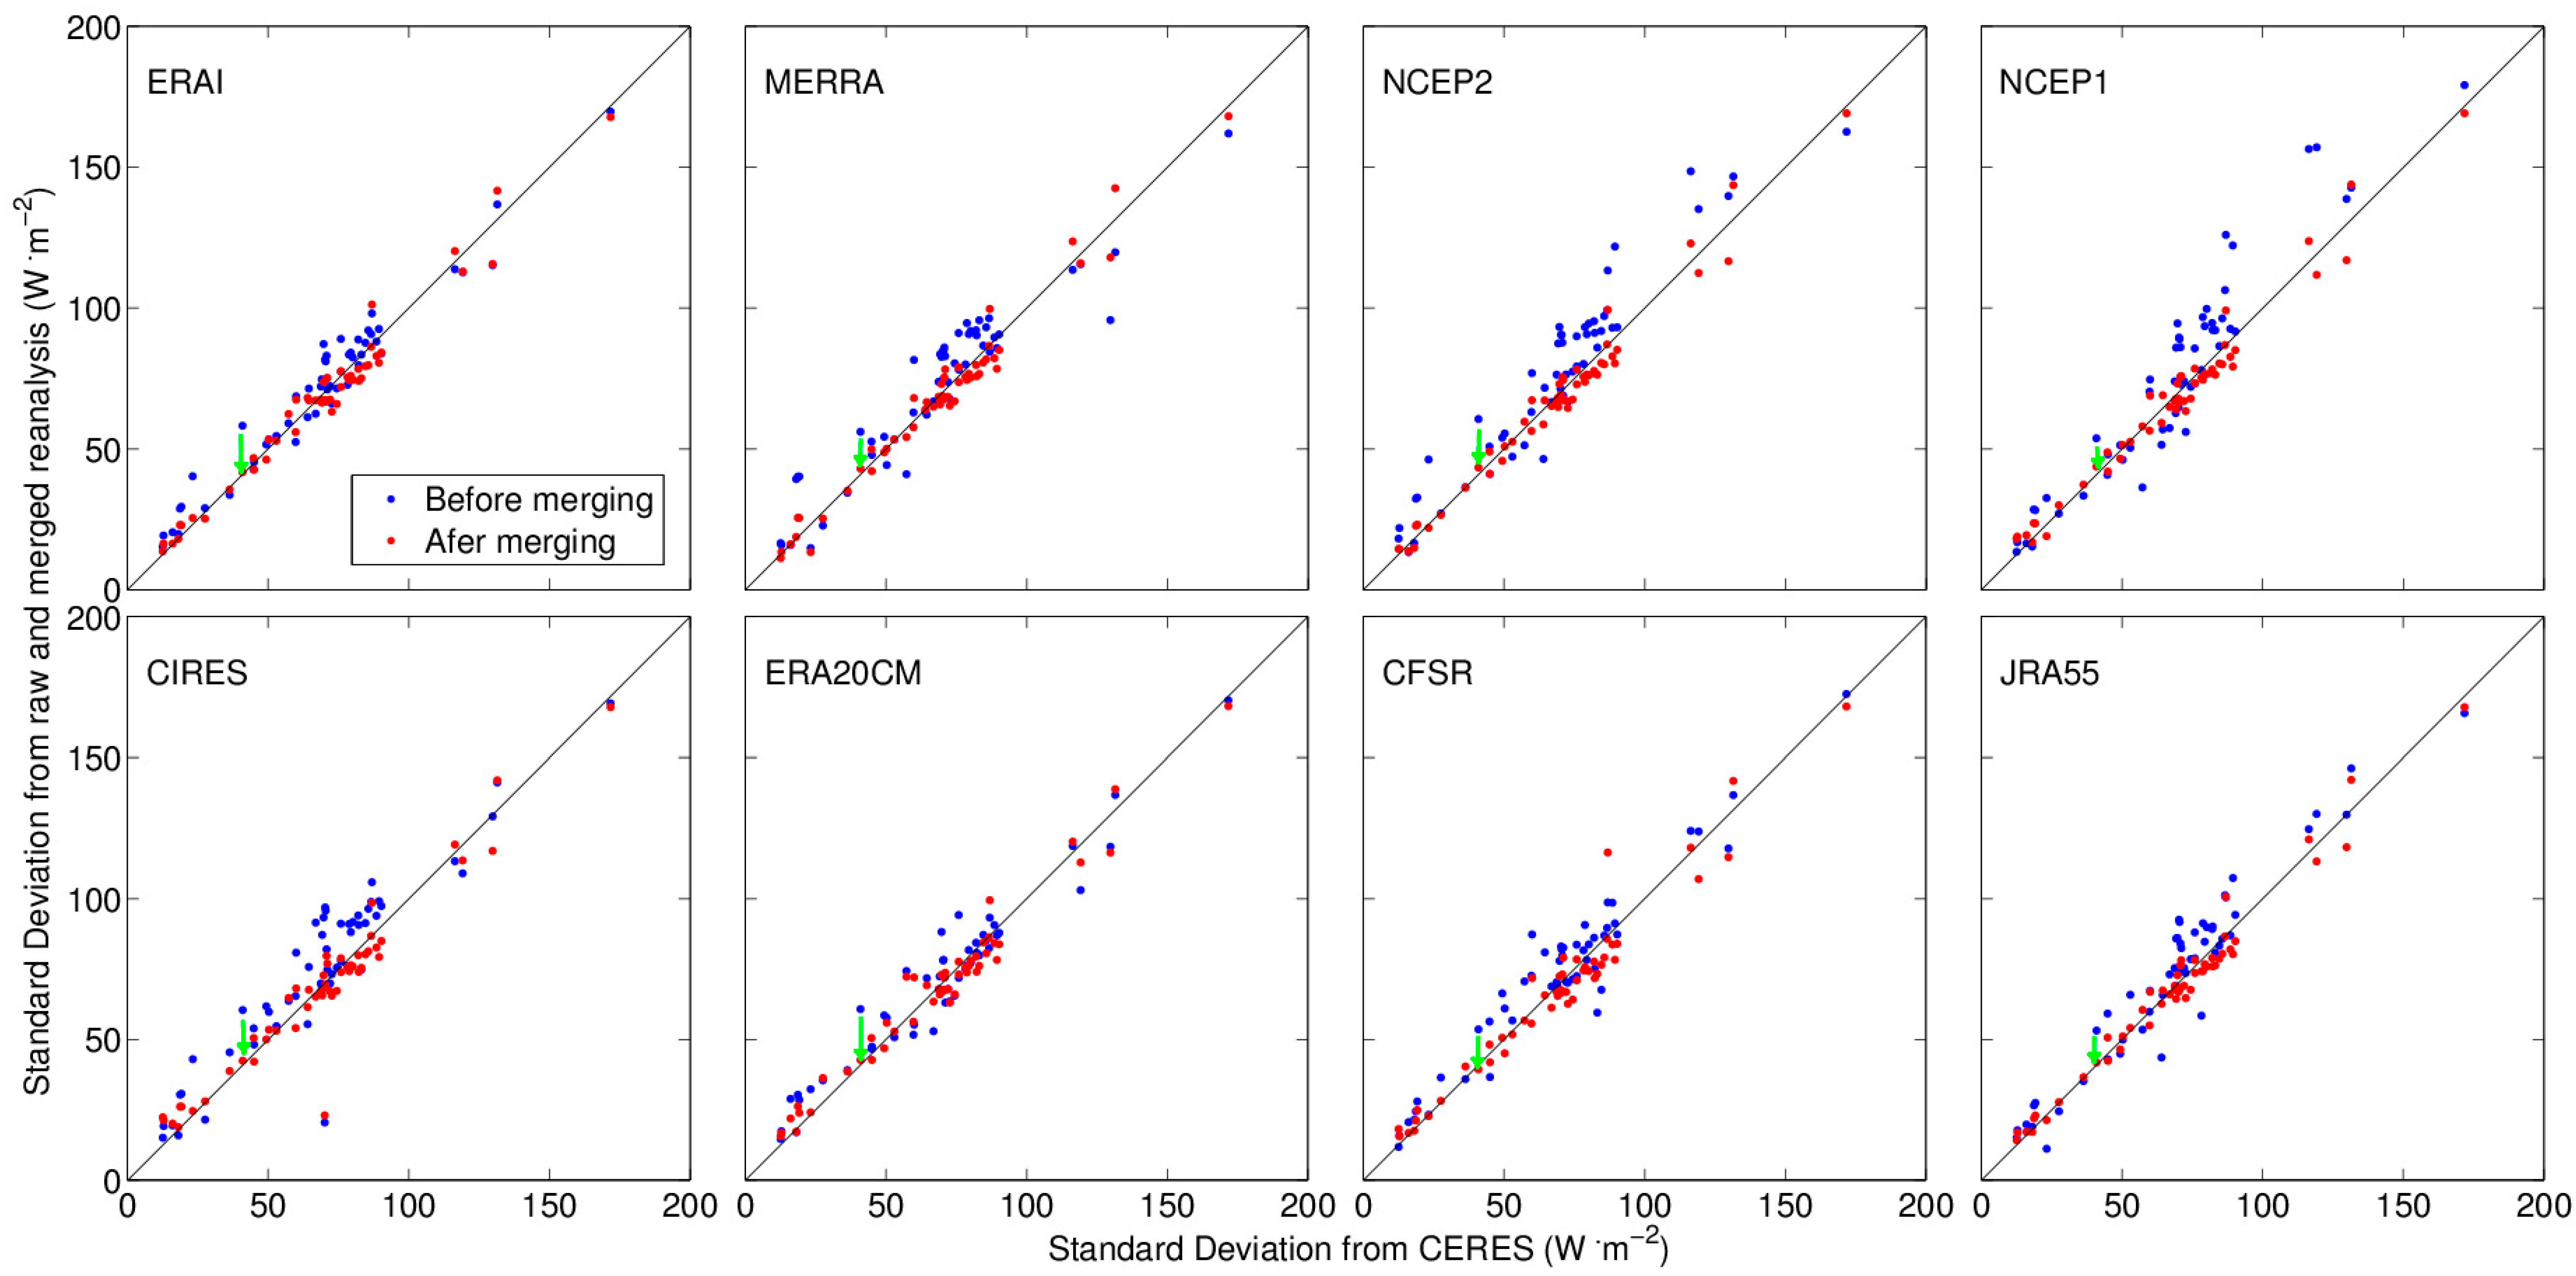
Merged reanalyses generally are better quality than raw reanalyses when comparing CERES EBAF surface data and BSRN data (Table 2). The MAB in merged renalyses were reduced by 21.62–72.74% using CERES EBAF surface data as reference, and 12.51–64.36% using BSRN as reference, compared with the raw reanalyses. The mean bias was significantly reduced in merged renalyses, and the Std was also improved by 13.14–56.22%, using CERES EBAF surface data as reference, and 6.12–42.92% using BSRN data as reference. Further analyzing the performance of CPDF for the time period without CERES EBAF surface data, Figure 5 presents histograms of the statistics (i.e., MAB, R2 and Std) of eight reanalyses, using all 54 BSRN stations as reference. These statistical results are divided into two time periods (the period from 1992 to 1999 and the period from 2000 to 2016). For periods 2000–2016 and 1992–1999, the merged reanalyses all show lower MAB than the raw reanalyses. MAB less than 10 W·m−2 are increased by 6.00–50.30% after 2000 and 37.01–51.90% before 2000 in merged reanalyses, compared with raw reanalyses. What is more, the merged reanalyses have almost same R2 and Std compared with the raw reanalyses. Although satellite data for the period of 1992–1999 are not available, the CPDF method improves reanalysis data based on the satellite data available after 2000.
3.3. Seasonal Variations in Rs
In this section, we evaluate whether the CPDF method could improve the seasonal variations in the Rs data. An example site with seasonal variations in Rs in both the raw and merged reanalyses is shown in Figure 6. The BSRN Tateno site, used as an example to illustrate the effect of the fusion procedure on the seasonal variation in Rs data, has data available from 1996 to 2016, and is located in Japan. Before the merging procedure, all reanalyses (except for CFSR) show positive Rs biases, especially the NCEP2 and NCEP1 reanalyses in May, while positive Rs biases from these reanalyses were eliminated after the merging procedure. The high Rs values in summer from the NCEP1 and NCEP2 indicated that the Rs variations in these reanalyses had inaccurate estimations of clouds. The biases from these reanalyses were reduced and the seasonal variations of Rs were more consistent with the observations after the merging procedure. Moreover, we calculated the mean absolute bias (MAB) of the ratio of each seasonal Rs mean to annual mean Rs (Table 3), using BSRN as a reference; the results showed that the merged reanalyses have lower MAB of the ratio of each seasonal mean Rs to annual mean Rs, and indicated that CPDF can mostly reduce relative bias of seasonal mean Rs to annual mean Rs, except for the ERA20CM, whose MAB remained the same.
Here we used standard deviation (Std) to evaluate Rs reanalyses data’s ability to simulate the seasonal variations in the reference of the CERES EBAF surface monthly data. Using Rs data from all 54 BSRN sites, we further compared the Std of the multiyear monthly mean Rs for the raw and merged reanalyses. From Figure 7, one can infer that the coefficient of determination of the seasonal variations of Rs between reanalysis and CERES EBAF surface data improved by 1.0–8.9%. This means the merged reanalysis are consistent with the CERES EBAF surface data in Std, which indicates that the CPDF method improves the seasonal variations in Rs.
3.4. Annual Variations in Rs
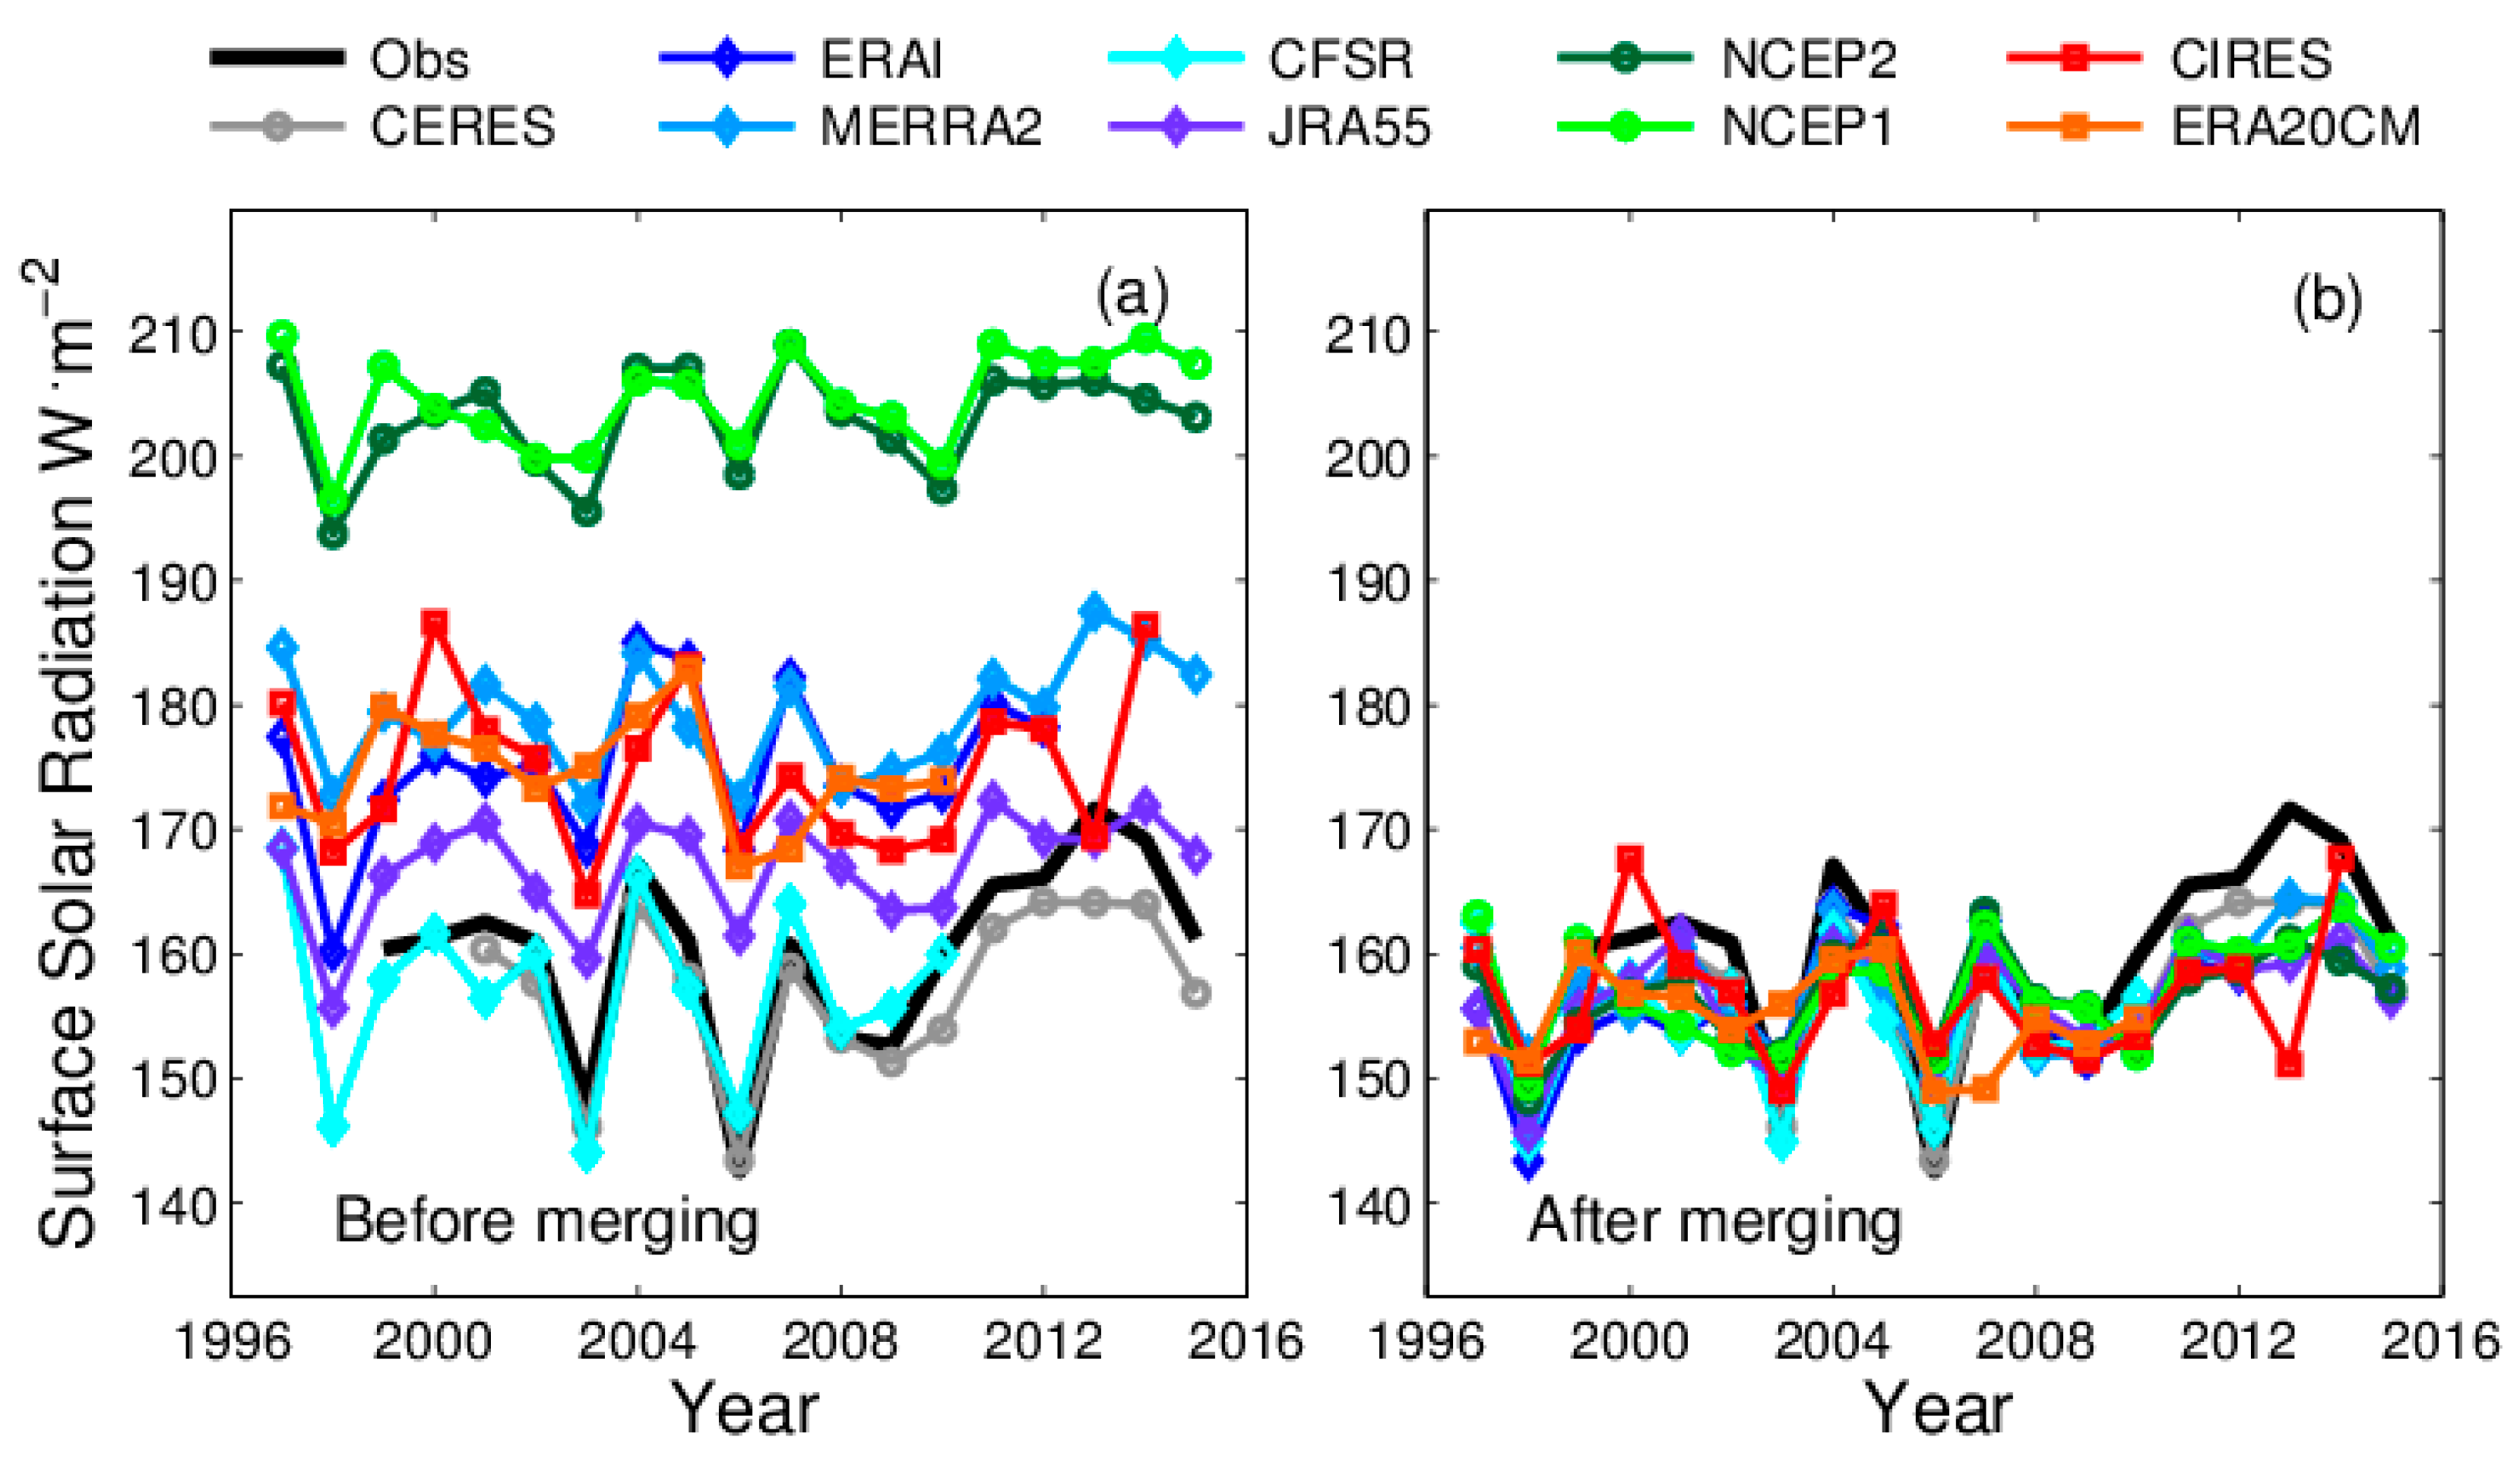
Further examination of the annual variation in Rs from the merged and raw reanalyses in Figure 8 shows the time series at Tateno for each of the datasets. The raw CFSR data agree well with the observation data for annual variation of Rs. We found that the merging procedure almost entirely maintains the raw CFSR variation pattern, and that the overestimations of Rs (bias) in the reanalyses are eliminated by the CPDF method, especially for NCEP1 and NCEP2.
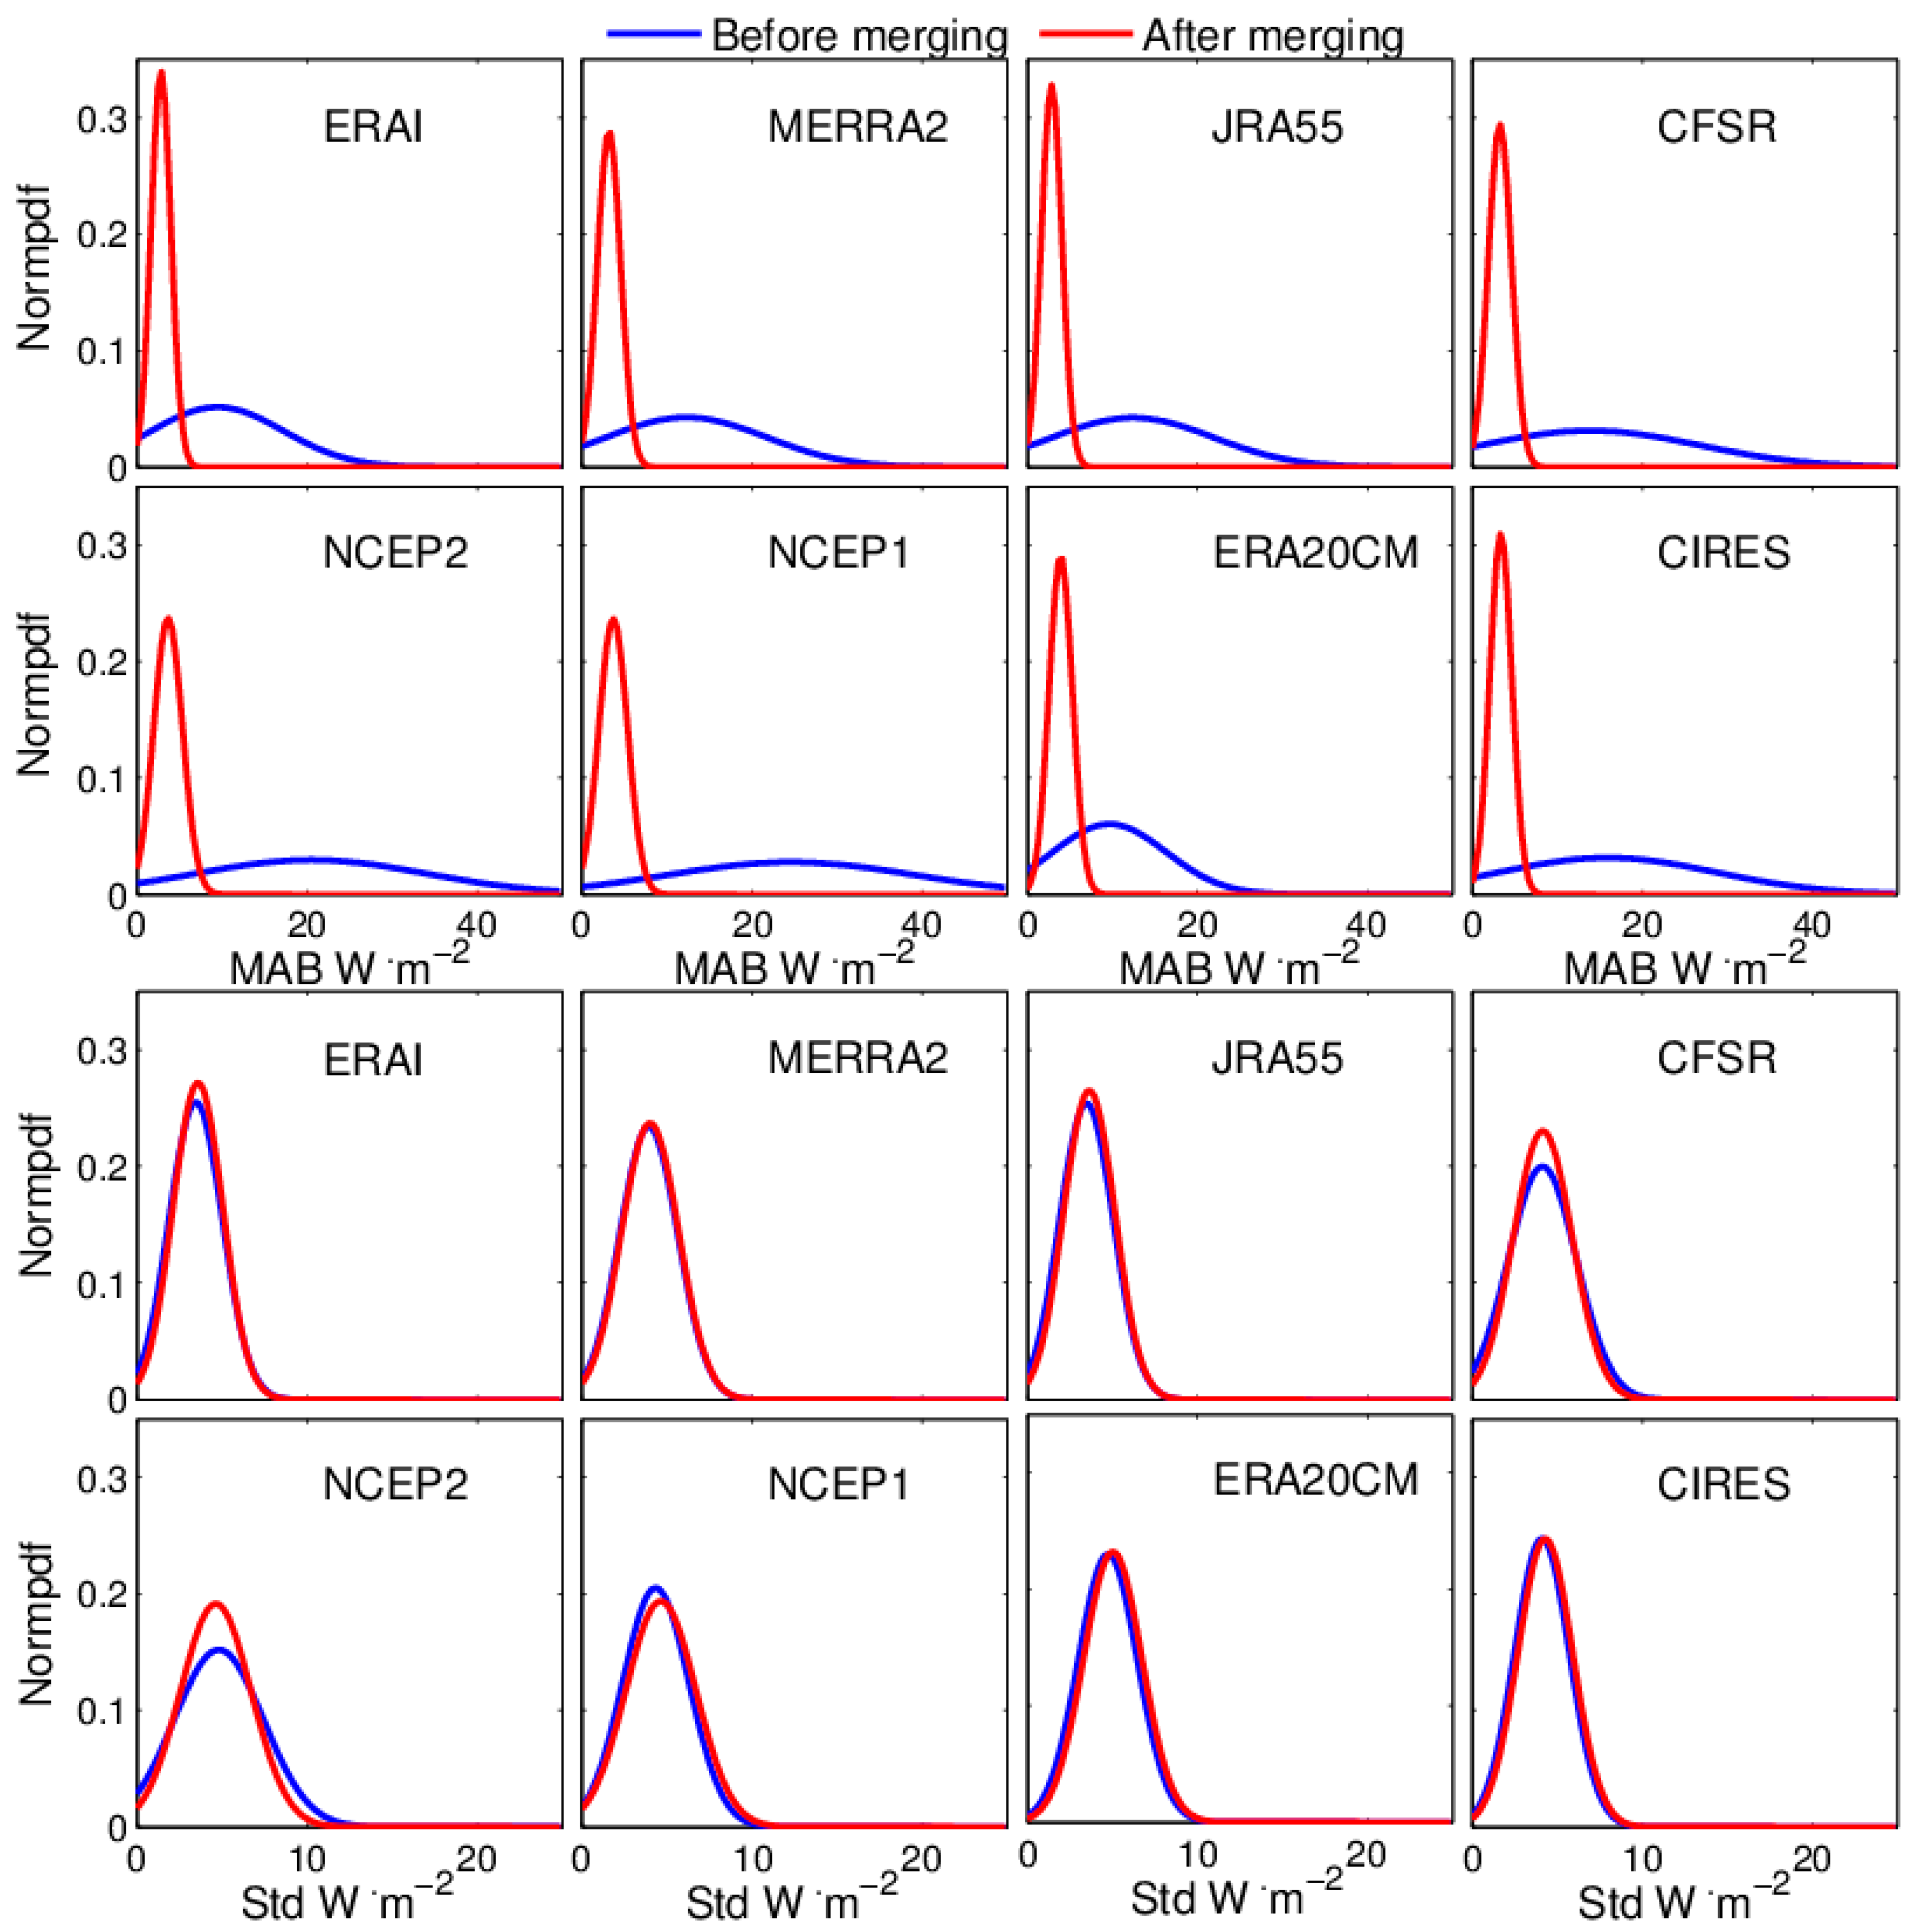
To validate the performance of the CPDF method for long-term annual Rs data, a pixel-by-pixel validation was conducted for each reanalysis product at the annual scale (Figure 9). The MAB and standard deviation were calculated for each pixel, using the CERES EBAF surface data as a reference. After the merging procedure, the MAB generally decreased by 59.10–85.10%, and the standard deviations remain nearly the same. This finding shows that the merged reanalysis reduced the bias at the annual scale, with the annual variation for each merged reanalysis remaining nearly unchanged.
4. Discussion
4.1. Different Performance of Reanalyses
Different spatial biases in the reanalyses are mainly attributed to the quality and amount of cloud data, aerosol data, and atmospheric data in each reanalysis data. The reasons for the high biases in the first and second generations of reanalyses, such as NCEP1 and NCEP2 [56], are complex. Li [57] notice that the Lacis and Hansen parameterization used in the NCEP1 dataset produced an obvious error in water vapor absorption that resulted in an error in Rs of approximately 5–40 W·m−2. Moreover, the directly-assimilated satellite data used in NCEP1 and NCEP2 introduced a large uncertainty in Rs for the error propagation and the underutilization of the observational data in the early assimilated system. Additionally, the impacts of aerosol are not taken into account in either the NCEP1 or NCEP2 products. These factors above lead to a high MAB in the NCEP1 and NCEP2.
Given these pitfalls, the third generation of reanalyses improves the shortwave parameterization methods, and provides accurate input data to generate realistic estimations of clouds properties, aerosols, and atmospheric conditions. For instance, the ERAI added an improved absorption coefficient, increased the number of spectral bands to 6, and used an hourly calculation of radiance. CFSR adopted a rapid radiative transfer model (RRTM). JRA55 updated O2, O3, and CO2 absorption coefficients. CFSR, JRA55, ERAI, and MERRA2 all apply variational satellite bias correction (VarBC) to reduce biases in the assimilated satellite observations. Climatological aerosol data are also used in these reanalyses (Table 1). In addition, the improved assimilated system is used in these third-generation reanalyses. The joint efforts of these improvements produce low MAB values in these latest reanalyses. The differences among the third generation of reanalyses’ MAB might be due to the different assimilated data and the shortwave schemes. The reason for the outperformance of ERAI might be related to the improvements in the cloud scheme, with the relatively accurate water vapor data by 1D + 4D-Var rain assimilation methods [43]. These water vapor data provide relatively accurate cloud values in ERAI, compared to those of other reanalyses. A few observations, which only use sea surface temperature and sea ice cover data as boundary conditions and forcing, assimilated in ERA20CM and CIRES might be attributed to the poor constraints in the Rs parameterization to obtain accurate cloud data.
The differences of post-merging MAB values are mainly attributed to the ability of each reanalysis to simulate the spatial-temporal distribution of clouds, and the impact of the variation of aerosols [58] on Rs. For instance, the ERA20CM data assimilated fewer observations and produced a high Std, which indicates a limited ability to simulate the spatial–temporal patterns of clouds. Therefore, the post-merging MAB values are large for ERA20CM. NCEP2, which refines the cloud algorithms that are produced, has a lower post-merging MAB than NCEP1 [47]. The current reanalyses, except for MERRA2, primarily used climatology aerosols. Thus, another reason for the post-merging MAB results might be the impact of aerosols on long-term trends in Rs values [59]. Focusing on the impact of aerosols in this issue will be our subject of future work.
4.2. Comparison with Other Fusion Methods
Over the past few decades, researchers have focused on generating high-quality Rs datasets, especially using the fusion method. Journée and Bertrand [60] merge the surface solar radiation product from the Meteosat Second Generation (MSG) and the solar measurements network of the Royal Meteorological Institute of Belgium. These authors find that kriging with the external drift method performs best compared with the mean bias correction, the interpolated bias correction, and ordinary kriging. However, long-term trends in Rs cannot be derived by these methods, because of the short time span of the observation and satellite data. Moreover, these methods depend heavily on the selection of training observations, and have inhomogeneity problems due to different instruments in the record. Using these methods may be a good choice on a regional scale.
Another commonly used approach is regression [61,62,63]. However, the regression method suffers from the regression dilution effect, which means that the regression slope tends to be biased toward zero, which causes an underestimated scaling factor [64]. The underestimated scaling factor will in turn produce a “flat” time series. Erickson et al. [65] find that the CPDF method performs better than the linear regression method, because the latter overcorrects the warmest temperatures, due to the lower weight applied to the scaling factor and the higher weight applied to the intercept parameter. The regression dilution effect causes the model data to shift closer to the average value (i.e., reduces the variance), which is also found in [66]. Moreover, Alvarez-Garreton et al. [67] find that the CPDF method performs better than the regression method, because the latter ignores extreme values and underestimates the peak values, while the CPDF method can maintain the information provided by extreme values in the observations by assuming a non-linear relationship between the datasets.
Previous studies [33,62] have developed bias correction methods for Rs, which are primarily dependent on the cloudiness to clear-sky ratio. Zhao et al. [68] provides a bias correction method using the error ratio. However, the bias in clear-sky radiation would be high, and the empirical coefficients in these algorithms only work well in the small regions where the Rs observations are acquired. Additionally, the stability of the coefficients is unclear without the support of field observations. Thus, the CPDF method can provide reliable Rs values, without empirical coefficients and other additional data that reduce error propagation.
4.3. Advantages and Uncertainties
The proposed CPDF can generate long-term Rs data, by merging long-term reanalysis Rs and high-quality satellite data. In this study, we assumed that the distribution of Rs from satellite is true and that the distribution of Rs did not change both before 2000 and after 2000. Therefore the biases in reanalyses can be reflected by the different Rs distributions, compared with that of the satellite. The results show that the merged reanalyses show lower MAB than the raw renalyses. The merged Rs reanalyses before 2000 were generated by using the distribution of Rs from CERES EBAF surface data. CPDF also showed a good performance for the time period before 2000. This is because the CPDF method reduces the system bias in the raw reanalyses, and the trend in the Rs data is maintained during the fusion process. The CPDF only changed the distribution of Rs values, but kept the sequence of Rs values from the original dataset. The results also showed that seasonal variability in the raw reanalysis is improved by the CPDF method; however, the improvement in annual variability is not significant compared with the results of the seasonal variability. Moreover, the MAB of the CERES EBAF surface product, compared with the BSRN stations, was 9.9 W·m−2, and this bias still exists in the merged results. More work needs to be done to further reduce the bias of the satellite and merged Rs data.
The validation is based on a direct comparison with field observations, which might lead to uncertainties. The site-specific observations used to validate the coarse Rs grid would lead to potential errors. Hakuba et al. [69] notice that either a site-specific correction factor or increasing the number of sites in a grid box would reduce the sampling bias. Huang et al. [70] find that the sampling error for a 5 × 5 km2 area ranged from 1.4 to 8.1% on monthly to “instantaneous” timescales, respectively. This finding indicates that the sampling error would be small on a monthly timescale. Li et al. [71] also noted that the sampling error decreases when averaged over periods greater than 5 days. Although the observation representativeness error is small on a monthly time scale, it cannot be entirely neglected. Applying the CPDF method at on different temporal and spatial scales needs to be further investigated.
5. Conclusions
In this study, we compared the Rs values from eight reanalyses, including ERAI, MERRA2, CFSR, JRA55, NCEP2, NCEP1, ERA20CM, and CIRES, to those of the CERES EBAF surface product. A CPDF method was developed to merge the eight reanalyses with the CERES EBAF surface product. Comparisons of the raw and merged reanalyses were performed for the periods before 2000 and after 2000, using BSRN surface observations.
Our results show that the “new generation” of reanalysis data, including ERAI, MERRA2, CFSR, and JRA55 perform better, especially ERAI. Previous studies also confirm that these latest-generation reanalyses [17,36,72,73,74] have good performances. The reason can be mainly attributed to the assimilation of new satellite data and atmospheric sounding data. Moreover, enhanced radiation transfer models have improved cloud parameterization schemes, which can reduce the cloud estimation random errors in these latest generation reanalyses.
Substantial spatial Rs biases exist in the eight reanalyses when compared to the CERES EBAF surface data. After using the CPDF method, the MAB values in theses eight reanalyses were reduced by 21.24–64.36%, for both after 2000 and before 2000. For the period of 1979 to the present, the merged ERAI data showed the best results (MAB = 10.40 W·m−2, standard deviation = 14.46 W·m−2 and R2 = 0.97). For the period of 1958 to present, the merged JRA55 data showed a reduction in the MAB of 32.87% to 11.17 W·m−2. For the century-long period, the merged CIRES would be a better choice. The merged Rs products can be obtained by contacting the corresponding author (Kaicun Wang, Email: [email protected]).
Acknowledgments
This study is funded by National Key Research and Development Program of China (2017YFA06036001), the National Natural Science Foundation of China (41525018), and the youth talent support program (312231103). We would like to thank Shi Chen, Runze Li, Qian Ma, Guocan Wu, and Chunlüe Zhou for their insightful comments. The BSRN data can be downloaded from http://bsrn.awi.de/.
Author Contributions
Fei Feng collected data, designed the study, analyzed the data, and prepared the manuscript. Kaicun Wang contributed to the main research ideas and manuscript organization. All of the authors thoroughly reviewed and edited this paper.
Conflicts of Interest
The authors declare no conflict of interest.
References
- Wang, K.; Dickinson, R.E.; Wild, M.; Liang, S. Evidence for decadal variation in global terrestrial evapotranspiration between 1982 and 2002: 1. Model development. J. Geophys. Res. Atmos. 2010, 115. [Google Scholar] [CrossRef]
- Roderick, M.L.; Rotstayn, L.D.; Farquhar, G.D.; Hobbins, M.T. On the attribution of changing pan evaporation. Geophys. Res. Lett. 2007, 34, 251–270. [Google Scholar] [CrossRef]
- Mahmood, R.; Hubbard, K.G. Assessing bias in evapotranspiration and soil moisture estimates due to the use of modeled solar radiation and dew point temperature data. Agric. For. Meteorol. 2005, 130, 71–84. [Google Scholar] [CrossRef]
- Yang, X.; Tang, J.; Mustard, J.F.; Lee, J.E.; Rossini, M.; Joiner, J.; Munger, J.W.; Kornfeld, A.; Richardson, A.D. Solar-induced chlorophyll fluorescence that correlates with canopy photosynthesis on diurnal and seasonal scales in a temperate deciduous forest. Geophys. Res. Lett. 2015, 42, 2977–2987. [Google Scholar] [CrossRef]
- Zhao, M.; Running, S.W. Drought-induced reduction in global terrestrial net primary production from 2000 through 2009. Science 2010, 329, 940–943. [Google Scholar] [CrossRef] [PubMed]
- Piao, S.; Fang, J.; He, J. Variations in vegetation net primary production in the qinghai-xizang plateau, china, from 1982 to 1999. Clim. Chang. 2006, 74, 253–267. [Google Scholar] [CrossRef]
- Kim, Y.-U.; Lee, B.-W. Effect of high temperature, daylength, and reduced solar radiation on potato growth and yield. Korean J. Agric. For. Meteorol. 2016, 18, 74–87. [Google Scholar] [CrossRef]
- Wild, M.; Gilgen, H.; Roesch, A.; Ohmura, A.; Long, C.N.; Dutton, E.G.; Forgan, B.; Kallis, A.; Russak, V.; Tsvetkov, A. From dimming to brightening: Decadal changes in solar radiation at earth's surface. Science 2005, 308, 847–850. [Google Scholar] [CrossRef] [PubMed]
- Wild, M. Global dimming and brightening: A review. J. Geophys. Res. Atmos. 2009, 114. [Google Scholar] [CrossRef]
- Wang, K.; Ma, Q.; Li, Z.; Wang, J. Decadal variability of surface incident solar radiation over China: Observations, satellite retrievals, and reanalyses. J. Geophys. Res. Atmos. 2015, 120, 6500–6514. [Google Scholar] [CrossRef]
- Wang, K. Measurement biases explain discrepancies between the observed and simulated decadal variability of surface incident solar radiation. Sci. Rep. 2014, 4. [Google Scholar] [CrossRef] [PubMed]
- Ma, Q.; Wang, K.; Wild, M. Impact of geolocations of validation data on the evaluation of surface incident shortwave radiation from earth system models. J. Geophys. Res. Atmos. 2015, 120, 6825–6844. [Google Scholar] [CrossRef]
- Wang, K.; Augustine, J.; Dickinson, R.E. Critical assessment of surface incident solar radiation observations collected by surfrad, uscrn and ameriflux networks from 1995 to 2011. J. Geophys. Res. Atmos. 2012, 117. [Google Scholar] [CrossRef]
- Ohmura, A.; Gilgen, H.; Hegner, H.; Müller, G.; Wild, M.; Dutton, E.G.; Forgan, B.; Fröhlich, C.; Philipona, R.; Heimo, A. Baseline surface radiation network (bsrn/wcrp): New precision radiometry for climate research. Bull. Am. Meteorol. Soc. 1998, 79, 2115–2136. [Google Scholar] [CrossRef]
- Long, C.N.; Dutton, E.G.; Augustine, J.; Wiscombe, W.; Wild, M.; McFarlane, S.A.; Flynn, C.J. Significant decadal brightening of downwelling shortwave in the continental united states. J. Geophys. Res. Atmos. 2009, 114, 1291–1298. [Google Scholar] [CrossRef]
- Dolinar, E.K.; Dong, X.; Xi, B. Evaluation and intercomparison of clouds, precipitation, and radiation budgets in recent reanalyses using satellite-surface observations. Clim. Dyn. 2016, 46, 2123–2144. [Google Scholar] [CrossRef]
- Zib, B.J.; Dong, X.; Xi, B.; Kennedy, A. Evaluation and intercomparison of cloud fraction and radiative fluxes in recent reanalyses over the arctic using bsrn surface observations. J. Clim. 2012, 25, 2291–2305. [Google Scholar] [CrossRef]
- Augustine, J.A.; DeLuisi, J.J.; Long, C.N. Surfrad—A national surface radiation budget network for atmospheric research. Bull. Am. Meteorol. Soc. 2000, 81, 2341–2357. [Google Scholar] [CrossRef]
- Yang, K.; Koike, T.; Ye, B. Improving estimation of hourly, daily, and monthly solar radiation by importing global data sets. Agric. For. Meteorol. 2006, 137, 43–55. [Google Scholar] [CrossRef]
- Sanchezlorenzo, A.; Calbó, J.; Brunetti, M.; Deser, C. Dimming/brightening over the iberian peninsula: Trends in sunshine duration and cloud cover and their relations with atmospheric circulation. J. Geophys. Res. Atmos. 2009, 114, 195–200. [Google Scholar]
- Wang, K.C.; Dickinson, R.E.; Wild, M.; Liang, S. Atmospheric impacts on climatic variability of surface incident solar radiation. Atmos. Chem. Phys. 2012, 12, 9581–9592. [Google Scholar] [CrossRef] [Green Version]
- Sanchezlorenzo, A.; Wild, M. Decadal variations in estimated surface solar radiation over switzerland since the late 19th century. Atmos. Chem. Phys. 2012, 12, 8635–8644. [Google Scholar] [CrossRef] [Green Version]
- Sanchezromero, A.; Sanchezlorenzo, A.; Calbó, J.; González, J.A.; Azorin-Molina, C. The signal of aerosol-induced changes in sunshine duration records: A review of the evidence. J. Geophys. Res. Atmos. 2014, 119, 4657–4673. [Google Scholar] [CrossRef]
- Sanchezlorenzo, A.; Calbó, J.; Martinvide, J. Spatial and temporal trends in sunshine duration over western europe (1938-2004). J. Clim. 2008, 21, 6089–6098. [Google Scholar] [CrossRef]
- Tang, W.J.; Yang, K.; Qin, J.; Cheng, C.C.K.; He, J. Solar radiation trend across china in recent decades: A revisit with quality-controlled data. Atmos. Chem. Phys. 2011, 11, 393–406. [Google Scholar] [CrossRef]
- Pinker, R.; Laszlo, I. Modeling surface solar irradiance for satellite applications on a global scale. J. Appl. Meteorol. 1992, 31, 194–211. [Google Scholar] [CrossRef]
- Rossow, W.B.; Schiffer, R.A. Advances in understanding clouds from isccp. Bull. Am. Meteorol. Soc. 1999, 80, 2261–2287. [Google Scholar] [CrossRef]
- Stubenrauch, C.; Rossow, W.; Kinne, S.; Ackerman, S.; Cesana, G.; Chepfer, H.; Di Girolamo, L.; Getzewich, B.; Guignard, A.; Heidinger, A. Assessment of global cloud datasets from satellites: Project and database initiated by the gewex radiation panel. Bull. Am. Meteorol. Soc. 2013, 94, 1031–1049. [Google Scholar] [CrossRef]
- Evan, A.T.; Heidinger, A.K.; Vimont, D.J. Arguments against a physical long-term trend in global isccp cloud amounts. Geophys. Res. Lett. 2007, 34, 290–303. [Google Scholar] [CrossRef]
- Dai, A.; Karl, T.R.; Sun, B.; Trenberth, K.E. Recent trends in cloudiness over the united states: A tale of monitoring inadequacies. Bull. Am. Meteorol. Soc. 2006, 87, 597–606. [Google Scholar] [CrossRef]
- Doelling, D.R.; Loeb, N.G.; Keyes, D.F.; Nordeen, M.L.; Morstad, D.; Nguyen, C.; Wielicki, B.A.; Young, D.F.; Sun, M. Geostationary enhanced temporal interpolation for ceres flux products. J. Atmos. Ocean. Technol. 2013, 30, 1072–1090. [Google Scholar] [CrossRef]
- Zhang, X.; Liang, S.; Wild, M.; Jiang, B. Analysis of surface incident shortwave radiation from four satellite products. Remote Sens. Environ. 2015, 165, 186–202. [Google Scholar] [CrossRef]
- Slater, A.G. Surface solar radiation in north america: A comparison of observations, reanalyses, satellite, and derived products. J. Hydrometeorol. 2016, 17, 401–420. [Google Scholar] [CrossRef]
- Kim, C.K.; Holmgren, W.F.; Stovern, M.; Betterton, E.A. Toward improved solar irradiance forecasts: Comparison of downwelling surface shortwave radiation in arizona derived from satellite with the gridded datasets. Pure Appl. Geophys. 2016, 173, 2929–2943. [Google Scholar] [CrossRef]
- Boilley, A.; Wald, L. Comparison between meteorological re-analyses from era-interim and merra and measurements of daily solar irradiation at surface. Renew. Energy 2015, 75, 135–143. [Google Scholar] [CrossRef] [Green Version]
- Zhang, X.; Liang, S.; Wang, G.; Yao, Y.; Jiang, B.; Cheng, J. Evaluation of the reanalysis surface incident shortwave radiation products from ncep, ecmwf, gsfc, and jma using satellite and surface observations. Remote Sens. 2016, 8, 225. [Google Scholar] [CrossRef]
- Jia, B.; Xie, Z.; Dai, A.; Shi, C.; Chen, F. Evaluation of satellite and reanalysis products of downward surface solar radiation over east asia: Spatial and seasonal variations. J. Geophys. Res. Atmos. 2013, 118, 3431–3446. [Google Scholar] [CrossRef]
- Wang, K.; Dickinson, R.E.; Ma, Q.; Augustine, J.A.; Wild, M. Measurement methods affect the observed global dimming and brightening. J. Clim. 2013, 26, 4112–4120. [Google Scholar] [CrossRef]
- Driemel, A.; Koenig-Langlo, G.; Long, C. Bsrn Station Requirements Overview, Status 20170401. Available online: http://epic.awi.de/44345/ (accessed on 11 November 2017).
- Roesch, A.; Wild, M.; Ohmura, A.; Dutton, E.G.; Long, C.N.; Zhang, T. Assessment of bsrn radiation records for the computation of monthly means. Atmos. Meas. Tech. 2011, 4, 339–354. [Google Scholar] [CrossRef] [Green Version]
- Winker, D.; Pelon, J.; Coakley Jr, J.; Ackerman, S.; Charlson, R.; Colarco, P.; Flamant, P.; Fu, Q.; Hoff, R.; Kittaka, C. The calipso mission: A global 3d view of aerosols and clouds. Bull. Am. Meteorol. Soc. 2010, 91, 1211–1229. [Google Scholar] [CrossRef]
- Kato, S.; Loeb, N.G.; Rose, F.G.; Doelling, D.R.; Rutan, D.A.; Caldwell, T.E.; Yu, L.; Weller, R.A. Surface irradiances consistent with ceres-derived top-of-atmosphere shortwave and longwave irradiances. J. Clim. 2013, 26, 2719–2740. [Google Scholar] [CrossRef]
- Dee, D.; Uppala, S.; Simmons, A.; Berrisford, P.; Poli, P.; Kobayashi, S.; Andrae, U.; Balmaseda, M.; Balsamo, G.; Bauer, P. The era-interim reanalysis: Configuration and performance of the data assimilation system. Q. J. R. Meteorol. Soc. 2011, 137, 553–597. [Google Scholar] [CrossRef]
- Molod, A.; Takacs, L.; Suarez, M.; Bacmeister, J. Development of the geos-5 atmospheric general circulation model: Evolution from merra to merra2. Geosci. Model Dev. 2015, 8, 1339–1356. [Google Scholar] [CrossRef]
- Saha, S.; Moorthi, S.; Pan, H.-L.; Wu, X.; Wang, J.; Nadiga, S.; Tripp, P.; Kistler, R.; Woollen, J.; Behringer, D. The ncep climate forecast system reanalysis. Bull. Am. Meteorol. Soc. 2010, 91, 1015–1057. [Google Scholar] [CrossRef]
- Kobayashi, S.; Yukinari, O.; Harada, Y.; Ebita, A.; Moriya, M.; Onoda, H.; Onogi, K.; Kamahori, H.; Kobayashi, C.; MIYAOKA, K. The jra-55 reanalysis: General specifications and basic characteristics. J. Meteorol. Soc. Jpn. 2015, 93, 5–48. [Google Scholar] [CrossRef]
- Kanamitsu, M.; Ebisuzaki, W.; Woollen, J.; Yang, S.-K.; Hnilo, J.; Fiorino, M.; Potter, G. Ncep–doe amip-ii reanalysis (r-2). Bull. Am. Meteorol. Soc. 2002, 83, 1631–1643. [Google Scholar] [CrossRef]
- Kalnay, E.; Kanamitsu, M.; Kistler, R.; Collins, W.; Deaven, D.; Gandin, L.; Iredell, M.; Saha, S.; White, G.; Woollen, J. The ncep/ncar 40-year reanalysis project. Bull. Am. Meteorol. Soc. 1996, 77, 437–471. [Google Scholar] [CrossRef]
- Hersbach, H.; Peubey, C.; Simmons, A.; Berrisford, P.; Poli, P.; Dee, D. Era-20cm: A twentieth-century atmospheric model ensemble. Q. J. R. Meteorol. Soc. 2015, 141, 2350–2375. [Google Scholar] [CrossRef]
- Compo, G.P.; Whitaker, J.S.; Sardeshmukh, P.D.; Matsui, N.; Allan, R.J.; Yin, X.; Gleason, B.E.; Vose, R.S.; Rutledge, G.; Bessemoulin, P. The twentieth century reanalysis project. Q. J. R. Meteorol. Soc. 2011, 137, 1–28. [Google Scholar] [CrossRef]
- Oreopoulos, L.; Mlawer, E. Modeling: The continual intercomparison of radiation codes (circ) assessing anew the quality of gcm radiation algorithms. Bull. Am. Meteorol. Soc. 2010, 91, 305–310. [Google Scholar] [CrossRef]
- Randles, C.; da Silva, A.; Buchard, V.; Colarco, P.; Darmenov, A.; Govindaraju, R.; Smirnov, A.; Holben, B.; Ferrare, R.; Hair, J. The merra-2 aerosol reanalysis, 1980–onward, part i: System description and data assimilation evaluation. J. Clim. 2017, 21, 6089–6098. [Google Scholar] [CrossRef]
- Xie, P.; Xiong, A.Y. A conceptual model for constructing high-resolution gauge-satellite merged precipitation analyses. J. Geophys. Res. Atmos. 2011, 116. [Google Scholar] [CrossRef]
- Shimpo, A.; Kanamitsu, M.; Iacobellis, S.F.; Hong, S.-Y. Comparison of four cloud schemes in simulating the seasonal mean field forced by the observed sea surface temperature. Mon. Weather Rev. 2008, 136, 2557–2575. [Google Scholar] [CrossRef]
- Mapes, B.E.; Warner, T.T.; Xu, M.; Gochis, D.J. Comparison of cumulus parameterizations and entrainment using domain-mean wind divergence in a regional model. J. Atmos. Sci. 2004, 61, 1284–1295. [Google Scholar] [CrossRef]
- Xia, X.A.; Wang, P.C.; Chen, H.B.; Liang, F. Analysis of downwelling surface solar radiation in china from national centers for environmental prediction reanalysis, satellite estimates, and surface observations. J. Geophys. Res. Atmos. 2006, 111, 2105–2117. [Google Scholar] [CrossRef]
- Li, Z. Intercomparison between two satellite-based products of net surface shortwave radiation. J. Geophys. Res. Atmos. 1995, 100, 3221–3232. [Google Scholar] [CrossRef]
- Li, J.; Carlson, B.E.; Dubovik, O.; Lacis, A.A. Recent trends in aerosol optical properties derived from aeronet measurements. Atmos. Chem. Phys. 2014, 14, 12271–12289. [Google Scholar] [CrossRef]
- Che, H.Z.; Shi, G.Y.; Zhang, X.Y.; Arimoto, R.; Zhao, J.Q.; Xu, L.; Wang, B.; Chen, Z.H. Analysis of 40 years of solar radiation data from china, 1961–2000. Geophys. Res. Lett. 2005, 1029, 2341–2352. [Google Scholar] [CrossRef]
- Journée, M.; Bertrand, C. Improving the spatio-temporal distribution of surface solar radiation data by merging ground and satellite measurements. Remote Sens. Environ. 2010, 114, 2692–2704. [Google Scholar] [CrossRef]
- Polo, J.; Wilbert, S.; Ruiz-Arias, J.; Meyer, R.; Gueymard, C.; Suri, M.; Martin, L.; Mieslinger, T.; Blanc, P.; Grant, I.; et al. Integration of Ground Measurements to Model-Derived Data: A Report of IEA SHC Task 46 Solar Resource assessment and Forecasting; International Energy Agency: Paris, France, 2015. [Google Scholar]
- Polo, J.; Wilbert, S.; Ruiz-Arias, J.A.; Meyer, R.; Gueymard, C.; Suri, M.; Martín, L.; Mieslinger, T.; Blanc, P.; Grant, I. Preliminary survey on site-adaptation techniques for satellite-derived and reanalysis solar radiation datasets. Sol. Energy 2016, 132, 25–37. [Google Scholar] [CrossRef]
- Mieslinger, T.; Ament, F.; Chhatbar, K.; Meyer, R. A new method for fusion of measured and model-derived solar radiation time-series. Energy Procedia 2014, 48, 1617–1626. [Google Scholar] [CrossRef]
- Pitkänen, M.R.; Mikkonen, S.; Lehtinen, K.E.; Lipponen, A.; Arola, A. Artificial bias typically neglected in comparisons of uncertain atmospheric data. Geophys. Res. Lett. 2016, 43, 10003–10011. [Google Scholar] [CrossRef]
- Erickson, M.J.; Colle, B.A.; Charney, J.J. Impact of bias-correction type and conditional training on bayesian model averaging over the northeast united states. Weather Forecast. 2012, 27, 1449–1469. [Google Scholar] [CrossRef]
- Hamill, T.M. Comments on “calibrated surface temperature forecasts from the canadian ensemble prediction system using bayesian model averaging”. Mon. Weather Rev. 2007, 135, 4226–4230. [Google Scholar] [CrossRef]
- Alvarez-Garreton, C.; Ryu, D.; Western, A.; Crow, W.; Robertson, D. The impacts of assimilating satellite soil moisture into a rainfall–runoff model in a semi-arid catchment. J. Hydrol. 2014, 519, 2763–2774. [Google Scholar] [CrossRef]
- Zhao, L.; Lee, X.; Liu, S. Correcting surface solar radiation of two data assimilation systems against fluxnet observations in north america. J. Geophys. Res. Atmos. 2013, 118, 9552–9564. [Google Scholar] [CrossRef]
- Hakuba, M.Z.; Folini, D.; Sanchezlorenzo, A.; Wild, M. Spatial representativeness of ground-based solar radiation measurements. J. Geophys. Res. Atmos. 2013, 118, 8585–8597. [Google Scholar] [CrossRef]
- Huang, G.; Li, X.; Huang, C.; Liu, S.; Ma, Y.; Chen, H. Representativeness errors of point-scale ground-based solar radiation measurements in the validation of remote sensing products. Remote Sens. Environ. 2016, 181, 198–206. [Google Scholar] [CrossRef]
- Li, Z.; Cribb, M.; Chang, F.L.; Trishchenko, A.; Luo, Y. Natural variability and sampling errors in solar radiation measurements for model validation over the atmospheric radiation measurement southern great plains region. J. Geophys. Res. Atmos. 2005, 110. [Google Scholar] [CrossRef]
- Lindsay, R.; Wensnahan, M.; Schweiger, A.; Zhang, J. Evaluation of seven different atmospheric reanalysis products in the arctic*. J. Clim. 2014, 27, 2588–2606. [Google Scholar] [CrossRef]
- Wang, A.; Zeng, X. Evaluation of multireanalysis products with in situ observations over the tibetan plateau. J. Geophys. Res. Atmos. 2012, 117. [Google Scholar] [CrossRef]
- Decker, M.; Brunke, M.A.; Wang, Z.; Sakaguchi, K.; Zeng, X.; Bosilovich, M.G. Evaluation of the reanalysis products from gsfc, ncep, and ecmwf using flux tower observations. J. Clim. 2012, 25, 1916–1944. [Google Scholar] [CrossRef]
Figure 1.
Mean surface incident solar radiation (Rs) bias value among data for 54 Baseline Surface Radiation Network (BSRN) and Clouds and Earth’s Radiant Energy System Energy Balanced and Filled (CERES EBAF) surface sites. Unit: W·m−2. The biases exhibit a nearly homogeneous spatial distribution ranging from −10 to 10 W·m−2.

Figure 2.
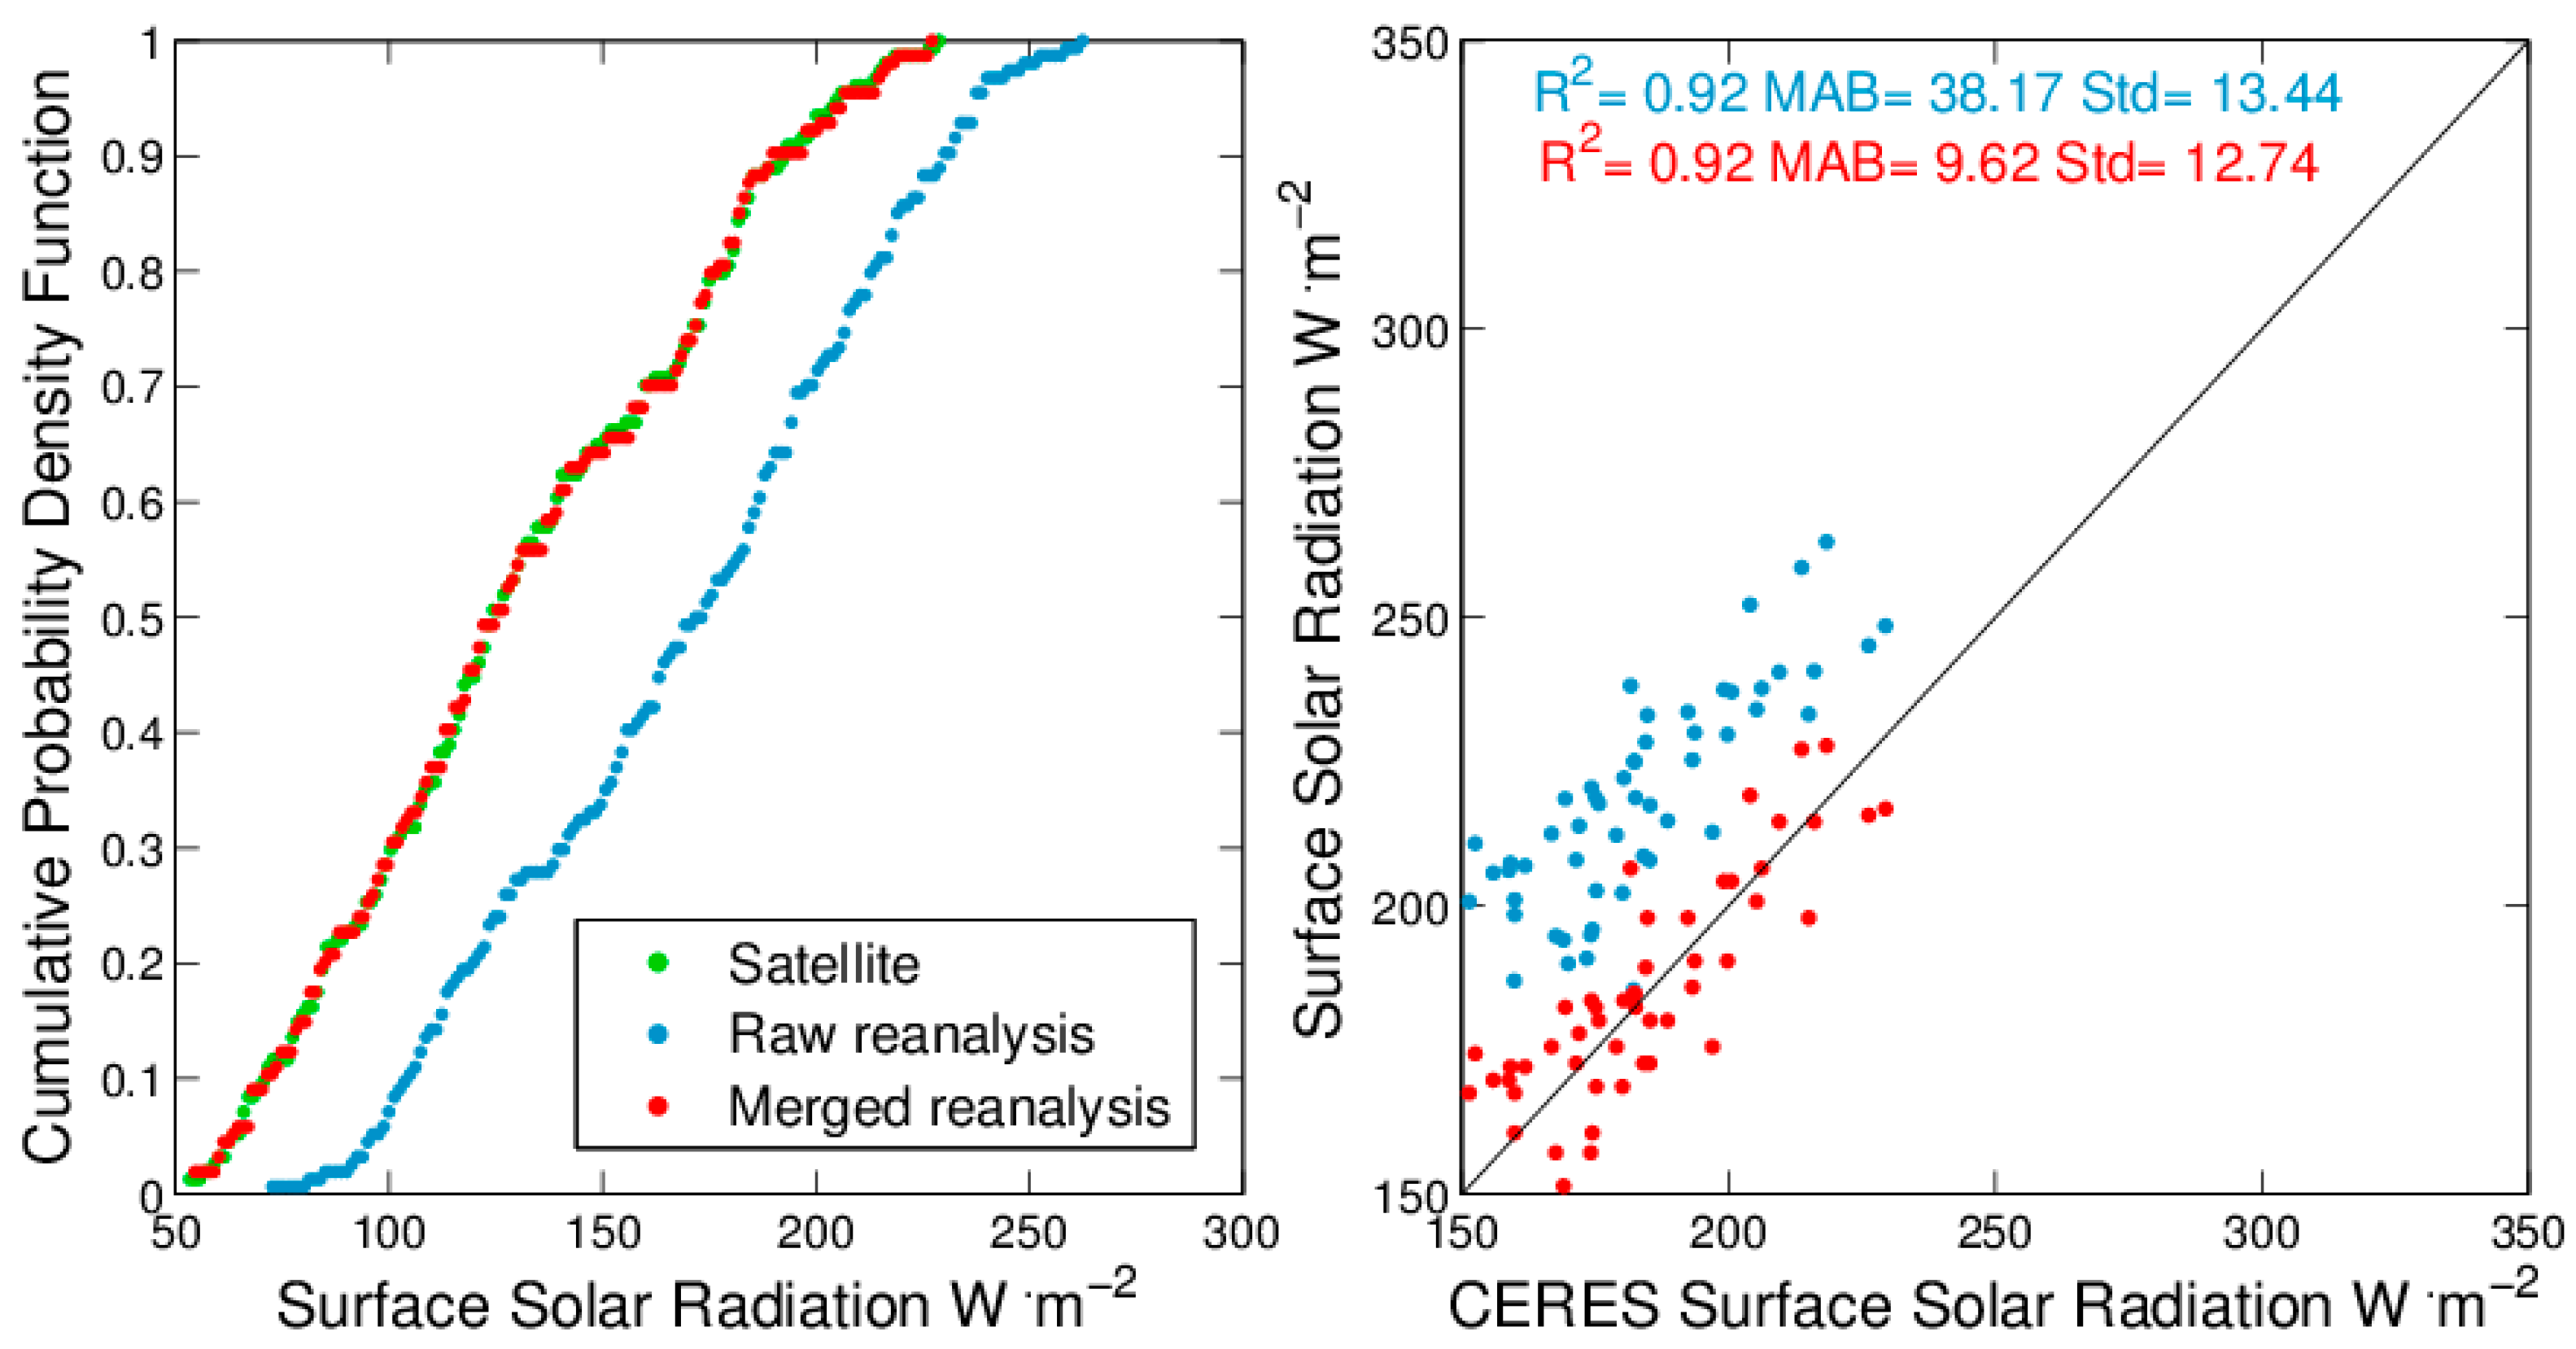
European Reanalysis Interim (ERAI) data for one grid box, merged by the cumulative probability density function-based (CPDF) method. The grid box was randomly selected. The probability density function curves of original ERAI reanalysis, merged ERAI reanalysis, and CERES EBAF surface (CERES) are in blue, red, and green, respectively. A comparison of raw ERAI (blue), merged ERAI (red) and CERES EBAF surface data is on the right. MAB values were calculated using the mean of the absolute value of difference between the reference and observed data. The Std represents the standard deviation of the difference between the reference and data. The reference data is CERES EBAF surface data. Each point in the right subplot is monthly surface solar radiation values.
Figure 2.
European Reanalysis Interim (ERAI) data for one grid box, merged by the cumulative probability density function-based (CPDF) method. The grid box was randomly selected. The probability density function curves of original ERAI reanalysis, merged ERAI reanalysis, and CERES EBAF surface (CERES) are in blue, red, and green, respectively. A comparison of raw ERAI (blue), merged ERAI (red) and CERES EBAF surface data is on the right. MAB values were calculated using the mean of the absolute value of difference between the reference and observed data. The Std represents the standard deviation of the difference between the reference and data. The reference data is CERES EBAF surface data. Each point in the right subplot is monthly surface solar radiation values.

Figure 3.
Differences between the reanalysis data and the CERES EBAF surface data. Rs data were computed by averaging the monthly mean Rs for 2000–2010, at a spatial resolution of 1° for each dataset.
Figure 3.
Differences between the reanalysis data and the CERES EBAF surface data. Rs data were computed by averaging the monthly mean Rs for 2000–2010, at a spatial resolution of 1° for each dataset.
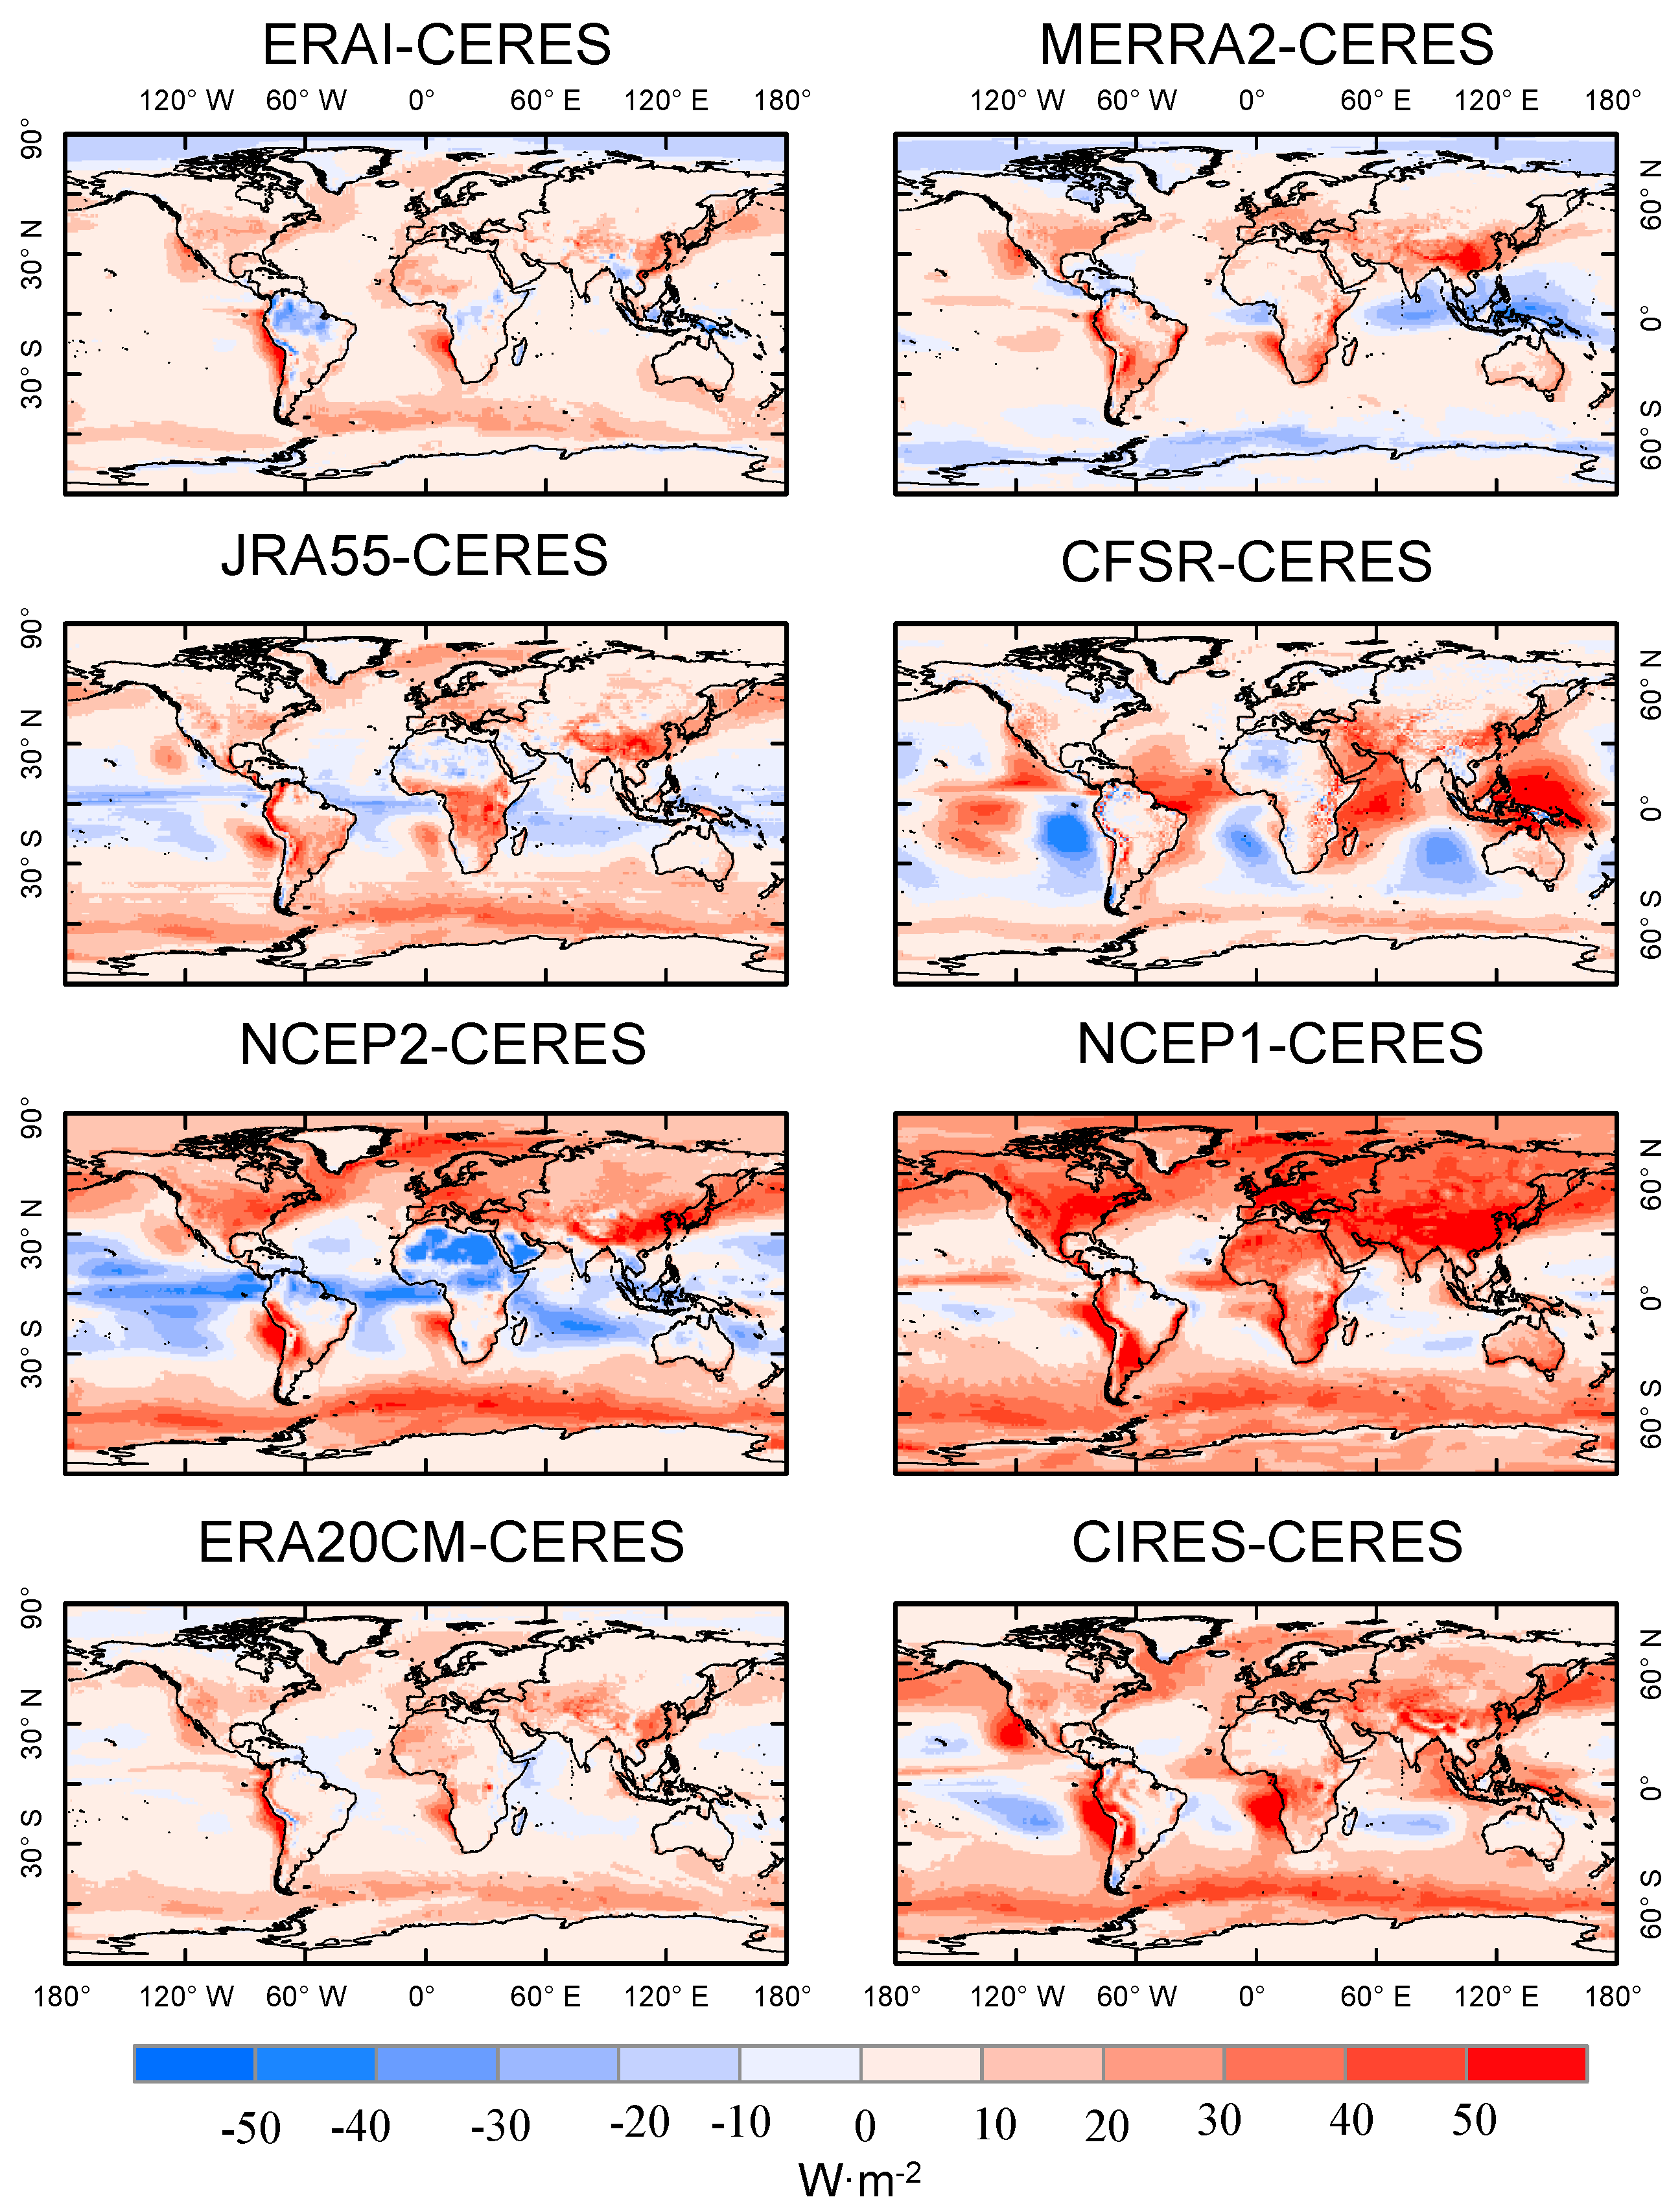
Figure 4.
Validation of CERES EBAF surface data (CERES), raw reanalysis National Center for Atmospheric Research Reanalysis (NCEP1) data, and merged reanalysis (merged NCEP1) data using BSRN data at the Billings site (latitude: 36.6N, longitude: 97.51W). (a,b) raw CERES EBAF surface and NCEP1 data; (c,d) merged NCEP1 data before 2000 (without reference) and after 2000 (with reference). MAB values are calculated using the mean of the absolute value of the difference between the reference and observed data. The Std represents the standard deviation of the differences between the reference and observed data.

Figure 5.
Histograms of the statistical parameters of the comparisons between merged and original reanalyses. In each sub-histogram, the horizontal axis represents statistical values, and the number of station is recorded on the vertical scale. The hollow red column represents the results merged using CPDF, and the light blue column is original results for each reanalyses. The MAB, R2 (determination coefficient), and Std (stand deviation) at each station are calculated from monthly Rs data. Each column represents different reanalyses. The first and second row represent histograms of MAB with the reference (after 2000) and without the reference (before 2000) data. The third and fourth rows are the same, but for the histograms of R2 at each site. The fifth and sixth rows are the histograms of Std at each site.

Figure 6.
Seasonal variation of the Rs at Tateno (36.06N, 140.13E). Obs is the BSRN estimation, and CERES represents the CERES EBAF surface estimation. Seasonal variations of Rs were computed by the multiyear average of the Rs for each month.
Figure 6.
Seasonal variation of the Rs at Tateno (36.06N, 140.13E). Obs is the BSRN estimation, and CERES represents the CERES EBAF surface estimation. Seasonal variations of Rs were computed by the multiyear average of the Rs for each month.
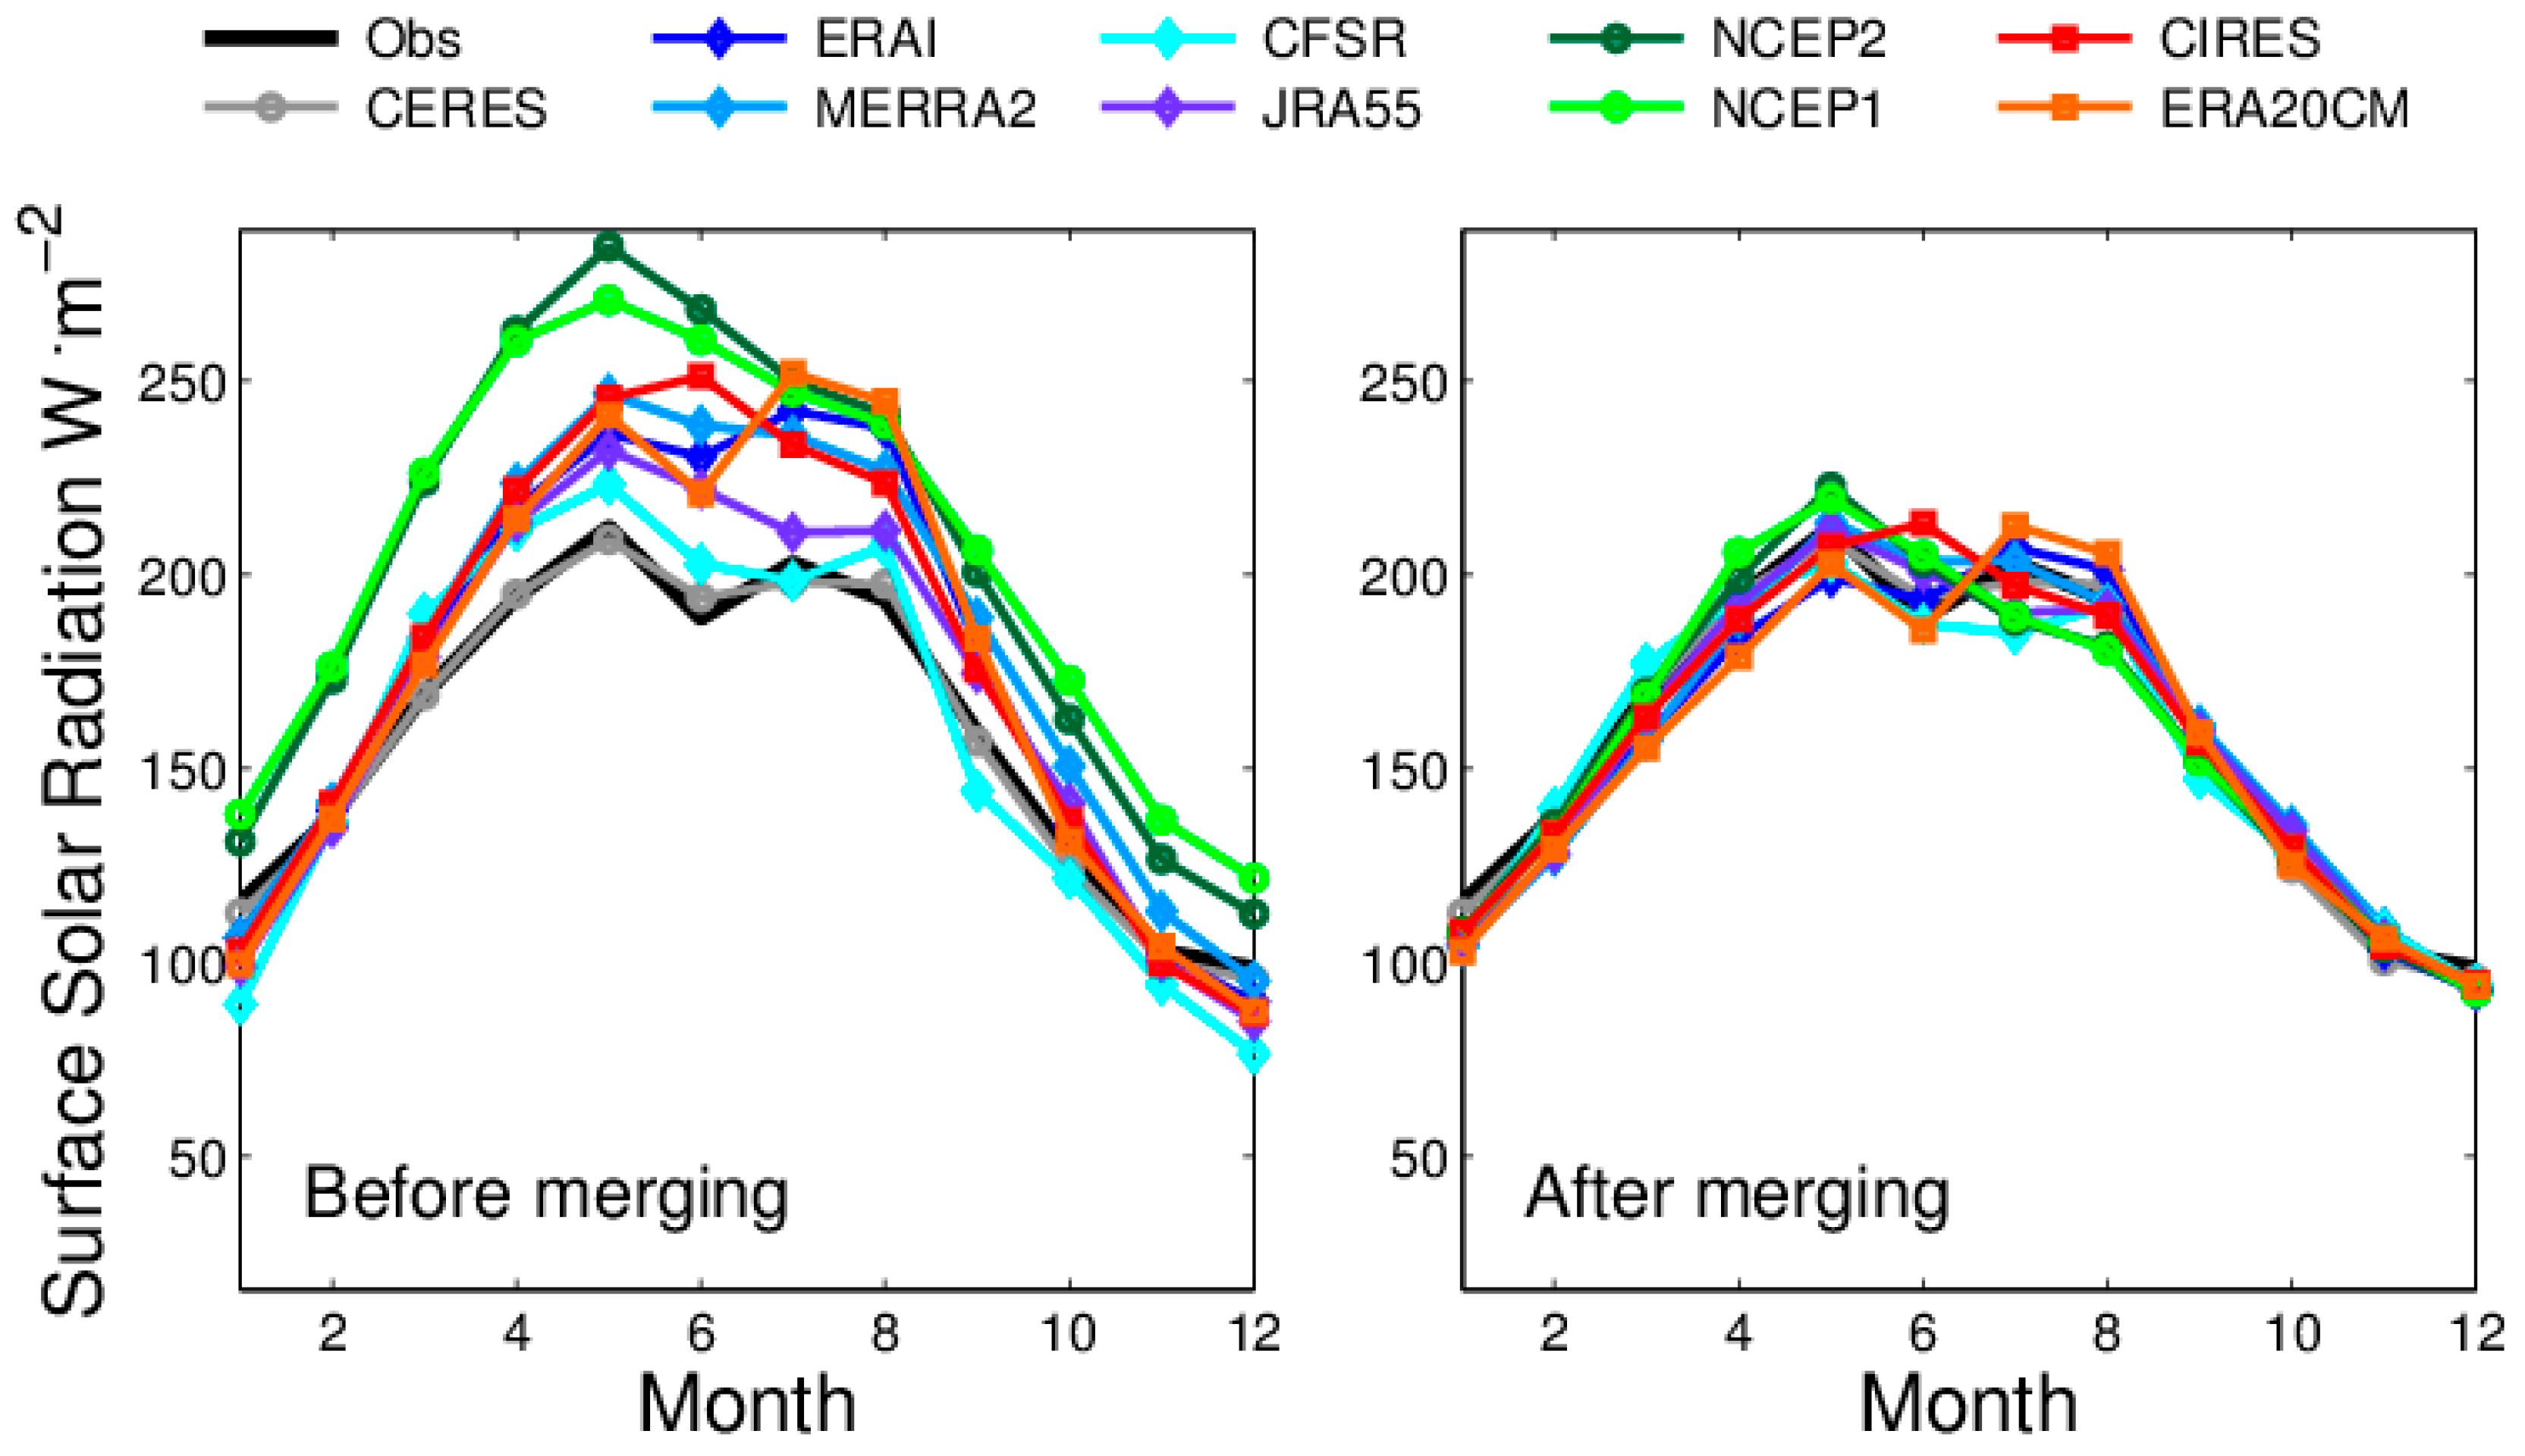
Figure 7.
Comparison of the seasonal variability in the merged and raw reanalyses. Seasonal variability is described in using standard deviation (Std) of the multiyear mean monthly Rs from merged and raw reanalyses. In each scatterplot, the horizontal axis represents the Std from the CERES EBAF surface product, and the vertical axis represents the Std from the merged and original reanalyses. The red dots denote merged results using CPDF, and the blue dots denote original reanalyses. Each point in the figures corresponds to each BSRN site.

Figure 8.
Annual variation in Rs at Tateno (36.06N, 140.13E). Obs represents the BSRN estimation, and CERES represents the CERES EBAF-surface estimation. Annual variations in Rs were computed using the average of the Rs for each year. The left subplot represents the raw reanalyses before merging (a), and the right subplot represents the merged reanalyses (b).

Figure 9.
Mean absolute bias (MAB) and standard deviation (Std) between each reanalysis and the CERES EBAF surface product for annual mean Rs. In each subplot, the horizontal axis represents statistical values, and the vertical axis represents the normal probability density distribution function (Normpdf). The red line denotes the merged results using CPDF, and the blue line denotes the raw reanalysis.

Table 1.
Reanalysis data used in this study.
| Name | Spatial Resolution | Analysis Period | Cloud Overlap | Aerosols | Reference | MAB (W·m−2) |
|---|---|---|---|---|---|---|
| ERAI | 0.75° × 0.75° | 1979–2012 | Maximum-random | climatology | Dee et al. [43] | 12.62 |
| MERRA2 | 0.5° × 0.625° | 1980–2016 | Maximum-random | analyzed | Molod et al. [44] | 16.15 |
| CFSR | 0.3125° × 0.3125° | 1979–2010 | Maximum-random | climatology | Saha et al. [45] | 17.80 |
| JRA55 | 1.25° × 1.25° | 1958–2016 | Random | climatology | Kobayashi et al. [46] | 15.27 |
| NCEP2 | T62 1 | 1979–2016 | Random | - | Kanamitsu et al. [47] | 23.13 |
| NCEP1 | T62 1 | 1948–2016 | Random | - | Kalnay et al. [48] | 27.15 |
| ERA20CM | 1° × 1° | 1900–2010 | Maximum-random | climatology | Hersbach et al. [49] | 15.04 |
| CIRES | T62 1 | 1851–2014 | Maximum-random | climatology | Compo et al. [50] | 19.39 |
1 T62 (approximately 210 km). Globally averaged the mean absolute biases (MAB) before merging process are calculated using BSRN data as reference.
Table 2.
Summary of statistics of all 54 BSRN sites using CERES EBAF surface (CERES) and BSRN as reference.
Table 2.
Summary of statistics of all 54 BSRN sites using CERES EBAF surface (CERES) and BSRN as reference.
| CERES EBAF | BSRN | |||||||
|---|---|---|---|---|---|---|---|---|
| R2 | MAB | Bias | Std | R2 | MAB | Bias | Std | |
| ERAI | 0.97 | 13.16 | 7.89 | 16.21 | 0.97 | 13.20 | 6.96 | 16.79 |
| MERRA2 | 0.93 | 19.54 | 8.61 | 24.43 | 0.93 | 18.90 | 7.16 | 24.22 |
| NCEP2 | 0.88 | 28.14 | 16.68 | 31.28 | 0.89 | 26.89 | 16.36 | 29.97 |
| NCEP1 | 0.90 | 37.70 | 34.15 | 29.33 | 0.91 | 36.40 | 33.71 | 27.53 |
| CIRES | 0.94 | 19.03 | 12.33 | 23.24 | 0.94 | 19.12 | 12.10 | 23.83 |
| 20CM | 0.94 | 17.87 | 9.51 | 22.51 | 0.93 | 18.75 | 8.74 | 24.07 |
| CFSR | 0.93 | 18.16 | 7.14 | 25.51 | 0.92 | 18.74 | 5.76 | 27.04 |
| JRA55 | 0.94 | 16.92 | 8.18 | 21.56 | 0.95 | 16.64 | 7.62 | 21.43 |
| C-ERAI | 0.99 | 7.23 | −0.25 | 10.27 | 0.97 | 10.40 | −1.28 | 14.46 |
| C-MERRA2 1 | 0.98 | 8.43 | 0.15 | 12.54 | 0.97 | 11.59 | −0.45 | 16.48 |
| C-NCEP2 1 | 0.98 | 9.45 | −0.19 | 13.69 | 0.96 | 12.27 | −0.76 | 17.10 |
| C-NCEP1 1 | 0.97 | 10.28 | −0.16 | 14.84 | 0.96 | 12.97 | −0.86 | 18.25 |
| C-CIRES 1 | 0.97 | 10.07 | 0.14 | 14.32 | 0.96 | 12.99 | −0.82 | 18.15 |
| C-20CM 1 | 0.95 | 14.01 | −0.17 | 19.55 | 0.94 | 16.40 | −0.94 | 22.60 |
| C-CFSR 1 | 0.98 | 8.90 | −0.12 | 12.86 | 0.97 | 11.90 | −1.57 | 16.57 |
| C-JRA55 1 | 0.98 | 7.96 | −0.09 | 11.25 | 0.97 | 11.17 | −0.82 | 15.45 |
1 The prefix ‘C-’ means CPDF merged reanalysis data; MAB the mean of the absolute value of the differences.
Table 3.
Summary of the mean absolute bias (MAB) of the ratio of each seasonal Rs mean to annual mean Rs of all 54 BSRN sites, using BSRN as reference.
Table 3.
Summary of the mean absolute bias (MAB) of the ratio of each seasonal Rs mean to annual mean Rs of all 54 BSRN sites, using BSRN as reference.
| Spring | Summer | Autumn | Winter | |
|---|---|---|---|---|
| ERAI | 3.60% | 3.03% | 3.07% | 3.87% |
| MERRA2 | 7.48% | 5.77% | 5.50% | 6.81% |
| CFSR | 4.68% | 3.92% | 4.75% | 4.48% |
| JRA55 | 4.52% | 3.41% | 3.41% | 4.14% |
| NCEP2 | 5.35% | 3.78% | 3.58% | 4.70% |
| NCEP1 | 7.88% | 5.79% | 5.67% | 6.76% |
| CIRES | 4.94% | 3.70% | 4.01% | 5.18% |
| ERA20CM | 3.95% | 3.90% | 4.10% | 4.82% |
| C-ERAI | 3.24% | 2.63% | 2.84% | 3.31% |
| C-MERRA2 | 5.58% | 3.95% | 3.80% | 5.76% |
| C-CFSR | 3.24% | 3.56% | 3.38% | 3.18% |
| C-JRA55 | 3.92% | 3.05% | 3.26% | 3.98% |
| C-NCEP2 | 4.39% | 3.40% | 3.08% | 4.16% |
| C-NCEP1 | 4.23% | 3.37% | 3.16% | 4.30% |
| C-CIRES | 4.28% | 3.18% | 3.39% | 4.46% |
| C-ERA20CM | 3.97% | 3.71% | 3.80% | 4.61% |
The prefix ‘C-’ means CPDF merged reanalysis data; MAB the mean of the absolute value of the differences.
© 2018 by the authors. Licensee MDPI, Basel, Switzerland. This article is an open access article distributed under the terms and conditions of the Creative Commons Attribution (CC BY) license (http://creativecommons.org/licenses/by/4.0/).
Share and Cite
MDPI and ACS Style
Feng, F.; Wang, K. Merging Satellite Retrievals and Reanalyses to Produce Global Long-Term and Consistent Surface Incident Solar Radiation Datasets. Remote Sens. 2018, 10, 115. https://doi.org/10.3390/rs10010115
AMA Style
Feng F, Wang K. Merging Satellite Retrievals and Reanalyses to Produce Global Long-Term and Consistent Surface Incident Solar Radiation Datasets. Remote Sensing. 2018; 10(1):115. https://doi.org/10.3390/rs10010115
Chicago/Turabian StyleFeng, Fei, and Kaicun Wang. 2018. "Merging Satellite Retrievals and Reanalyses to Produce Global Long-Term and Consistent Surface Incident Solar Radiation Datasets" Remote Sensing 10, no. 1: 115. https://doi.org/10.3390/rs10010115
Note that from the first issue of 2016, this journal uses article numbers instead of page numbers. See further details here.