Figure 1.
Diagram of the SPARK satellite.
Figure 1.
Diagram of the SPARK satellite.
Figure 2.
Central spectral wavelengths of various SPARK-01 and -02 bands.
Figure 2.
Central spectral wavelengths of various SPARK-01 and -02 bands.
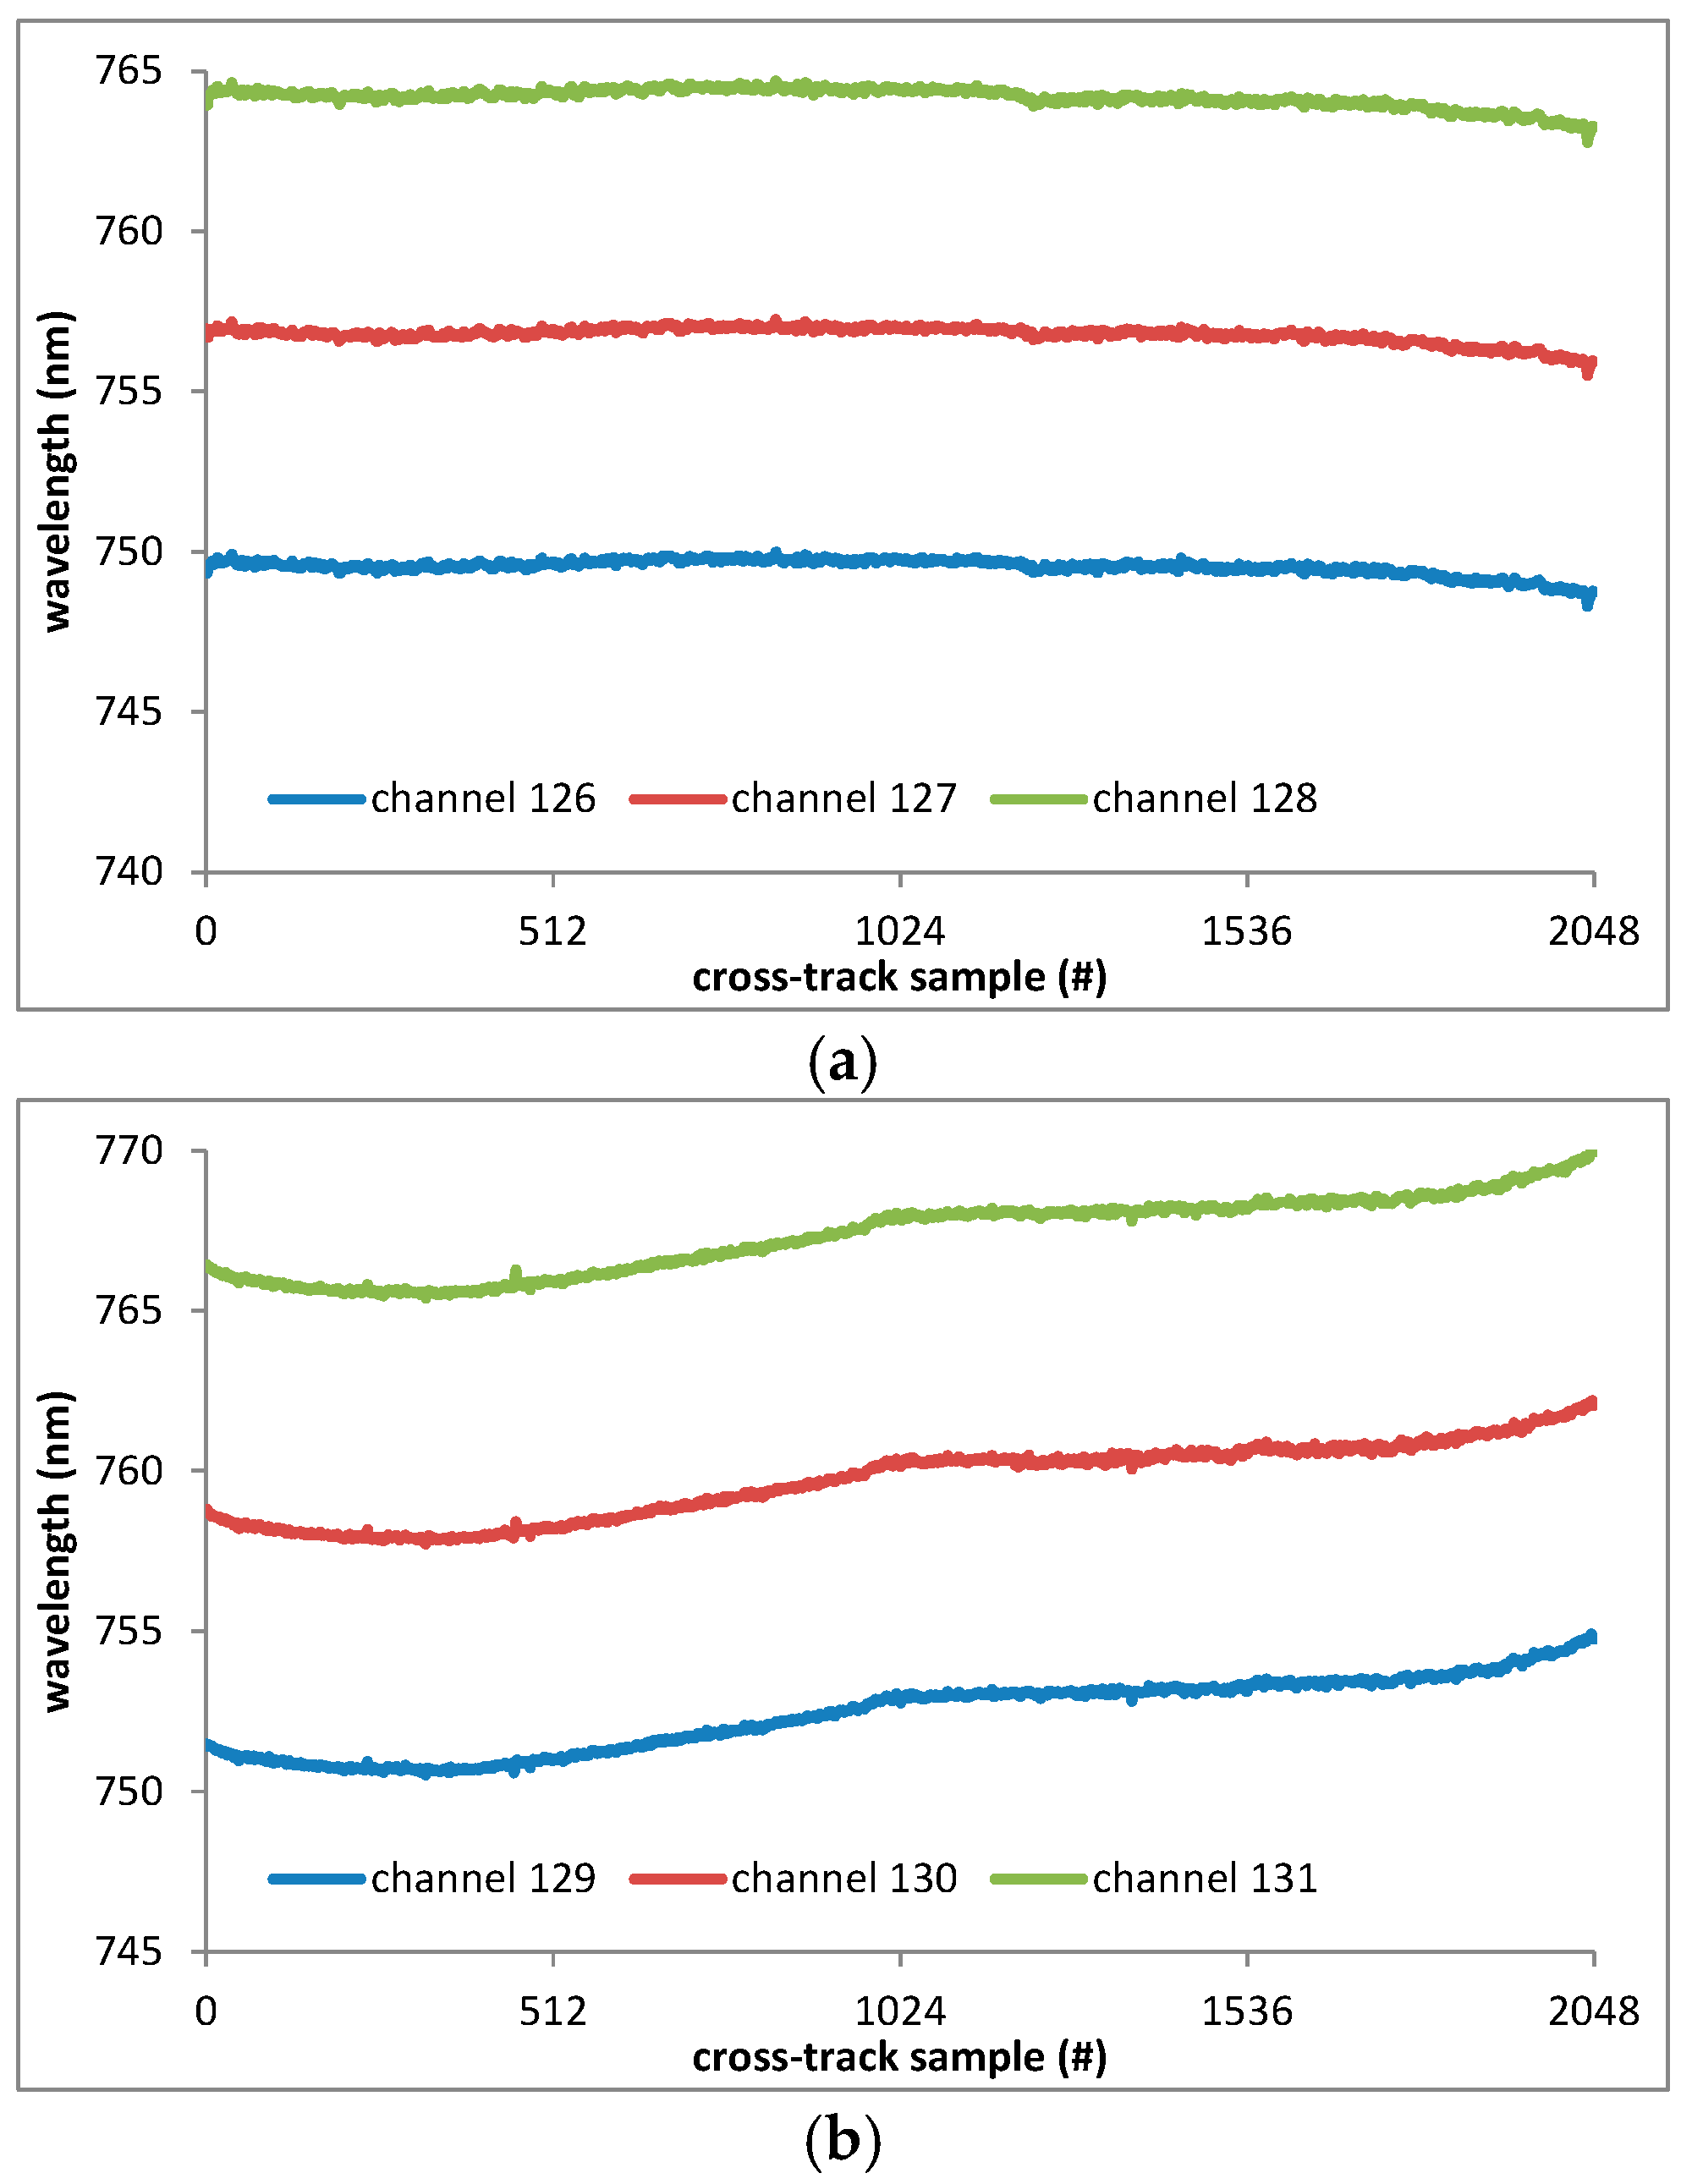
Figure 3.
Cross-track central spectral wavelengths for channels centered near 760 nm for SPARK-01 (a) and -02 (b), respectively.
Figure 3.
Cross-track central spectral wavelengths for channels centered near 760 nm for SPARK-01 (a) and -02 (b), respectively.
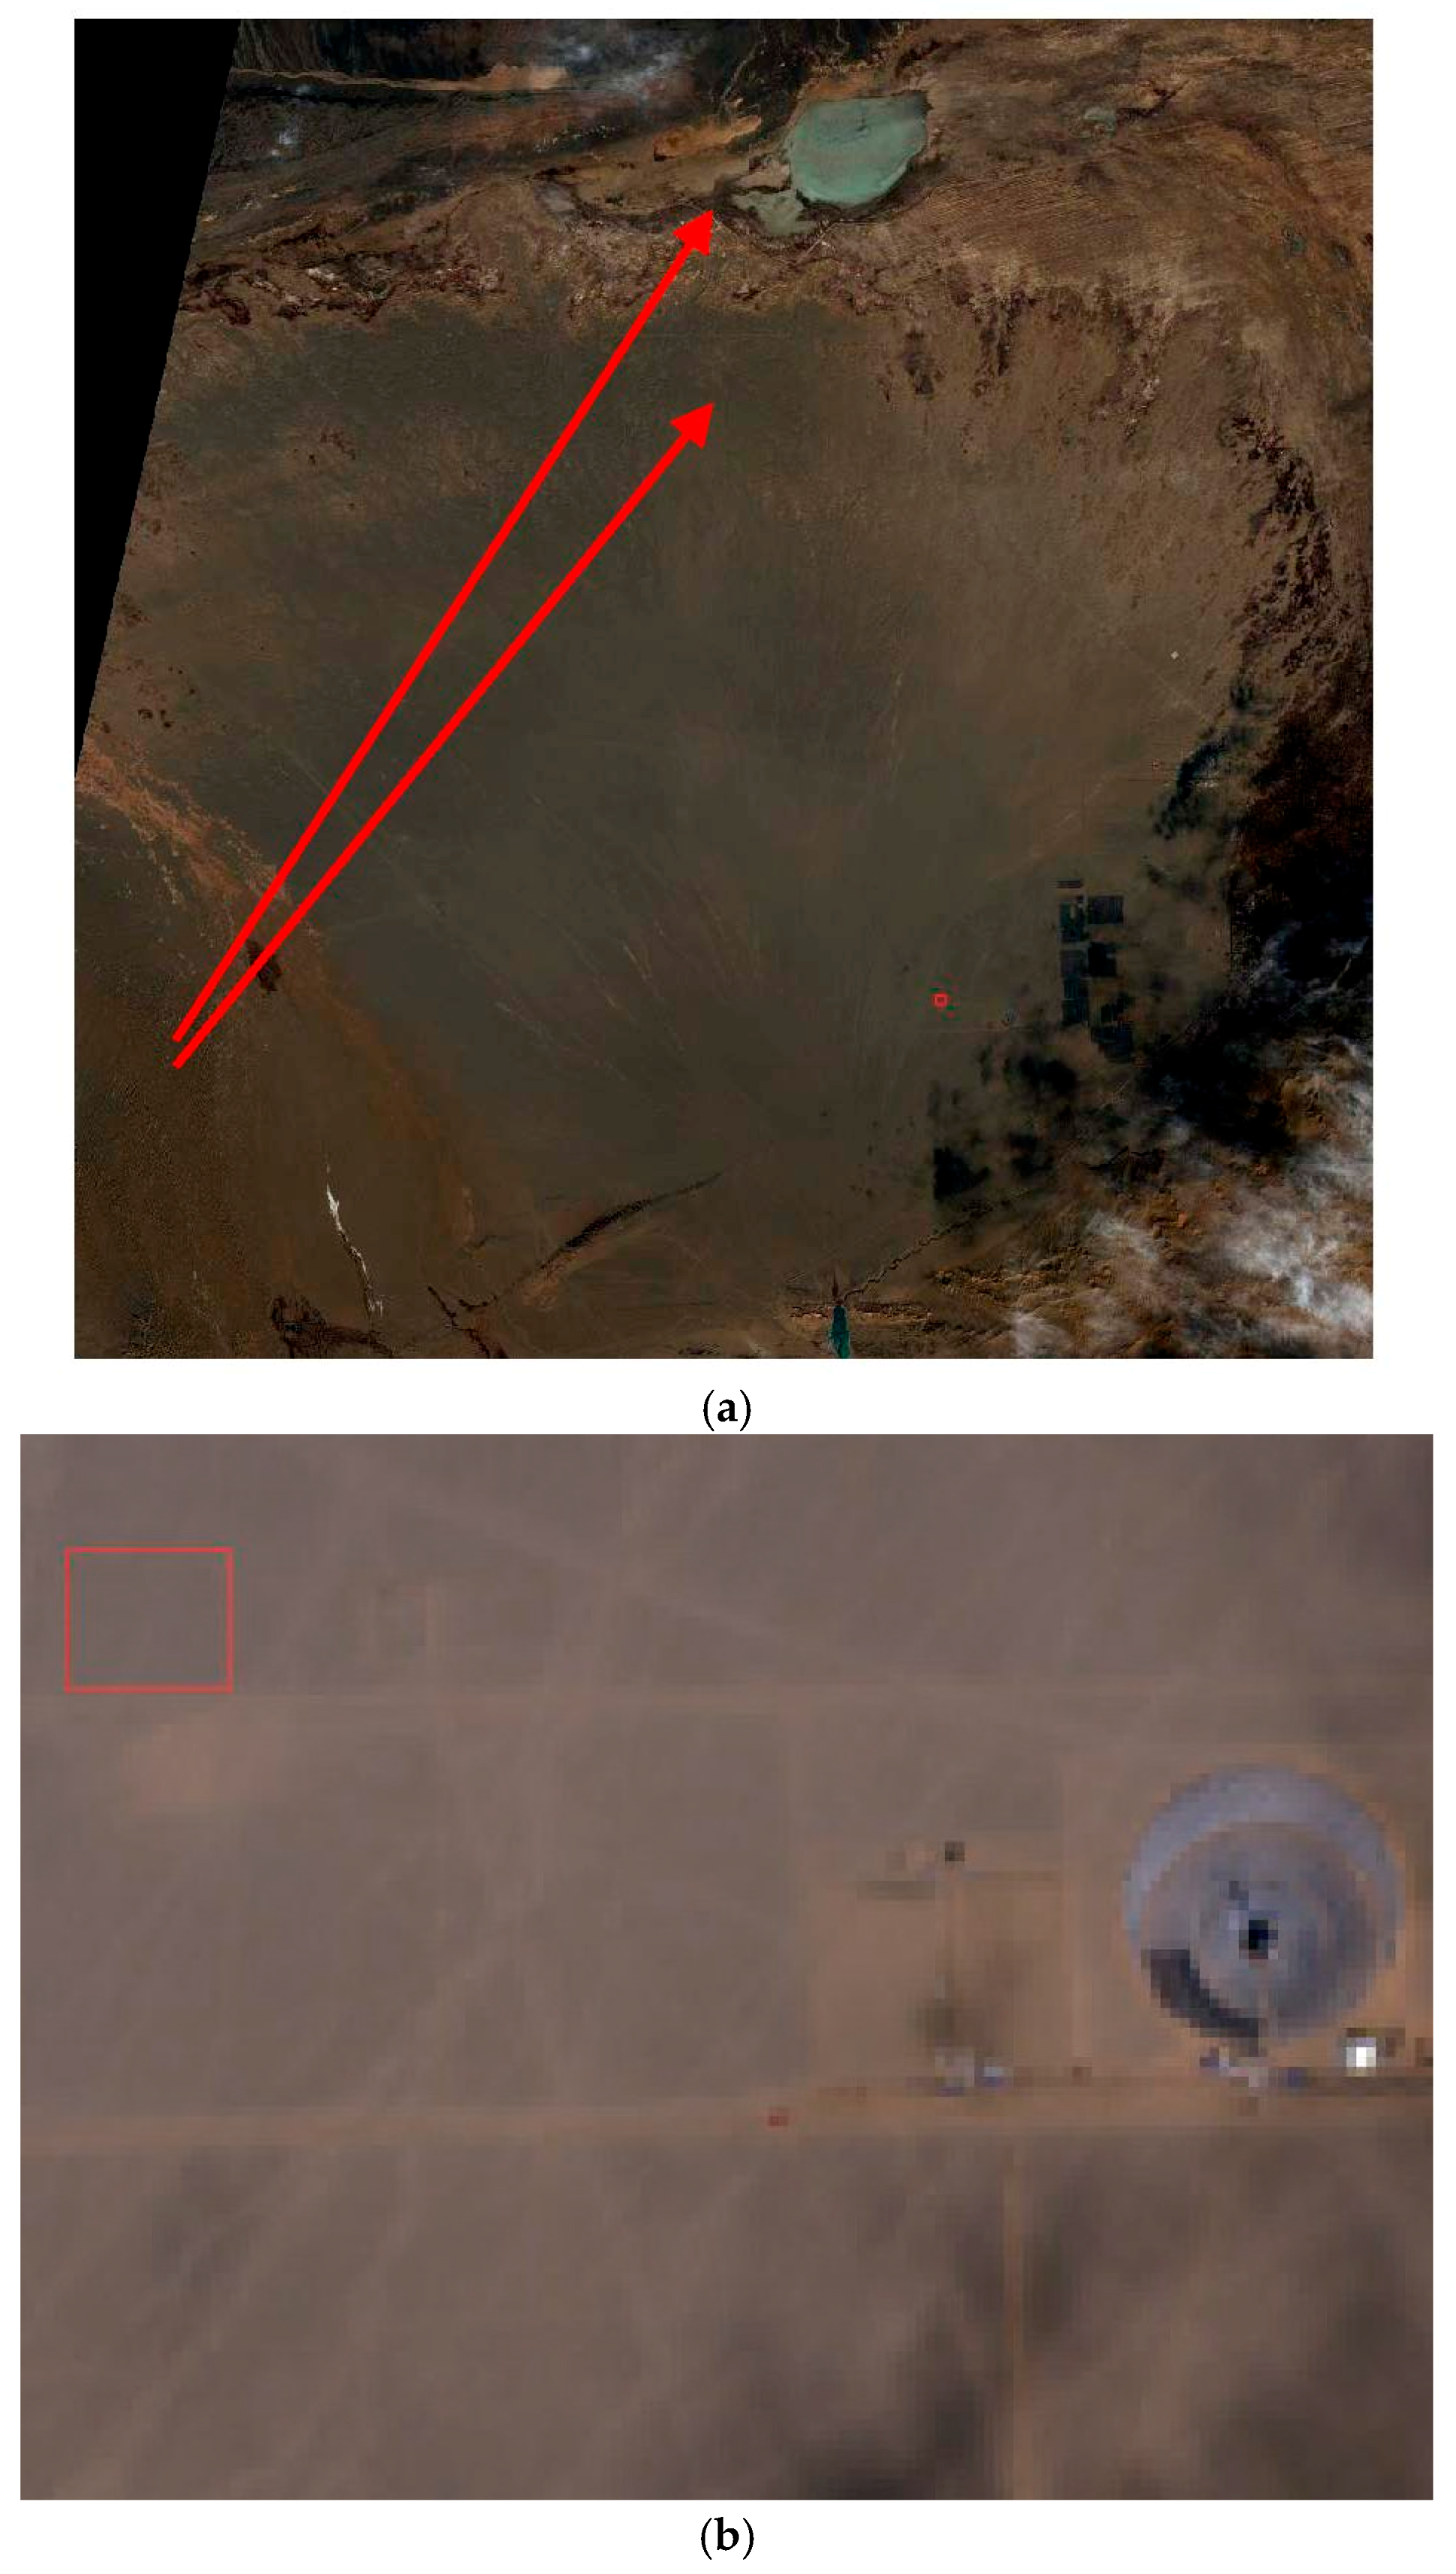
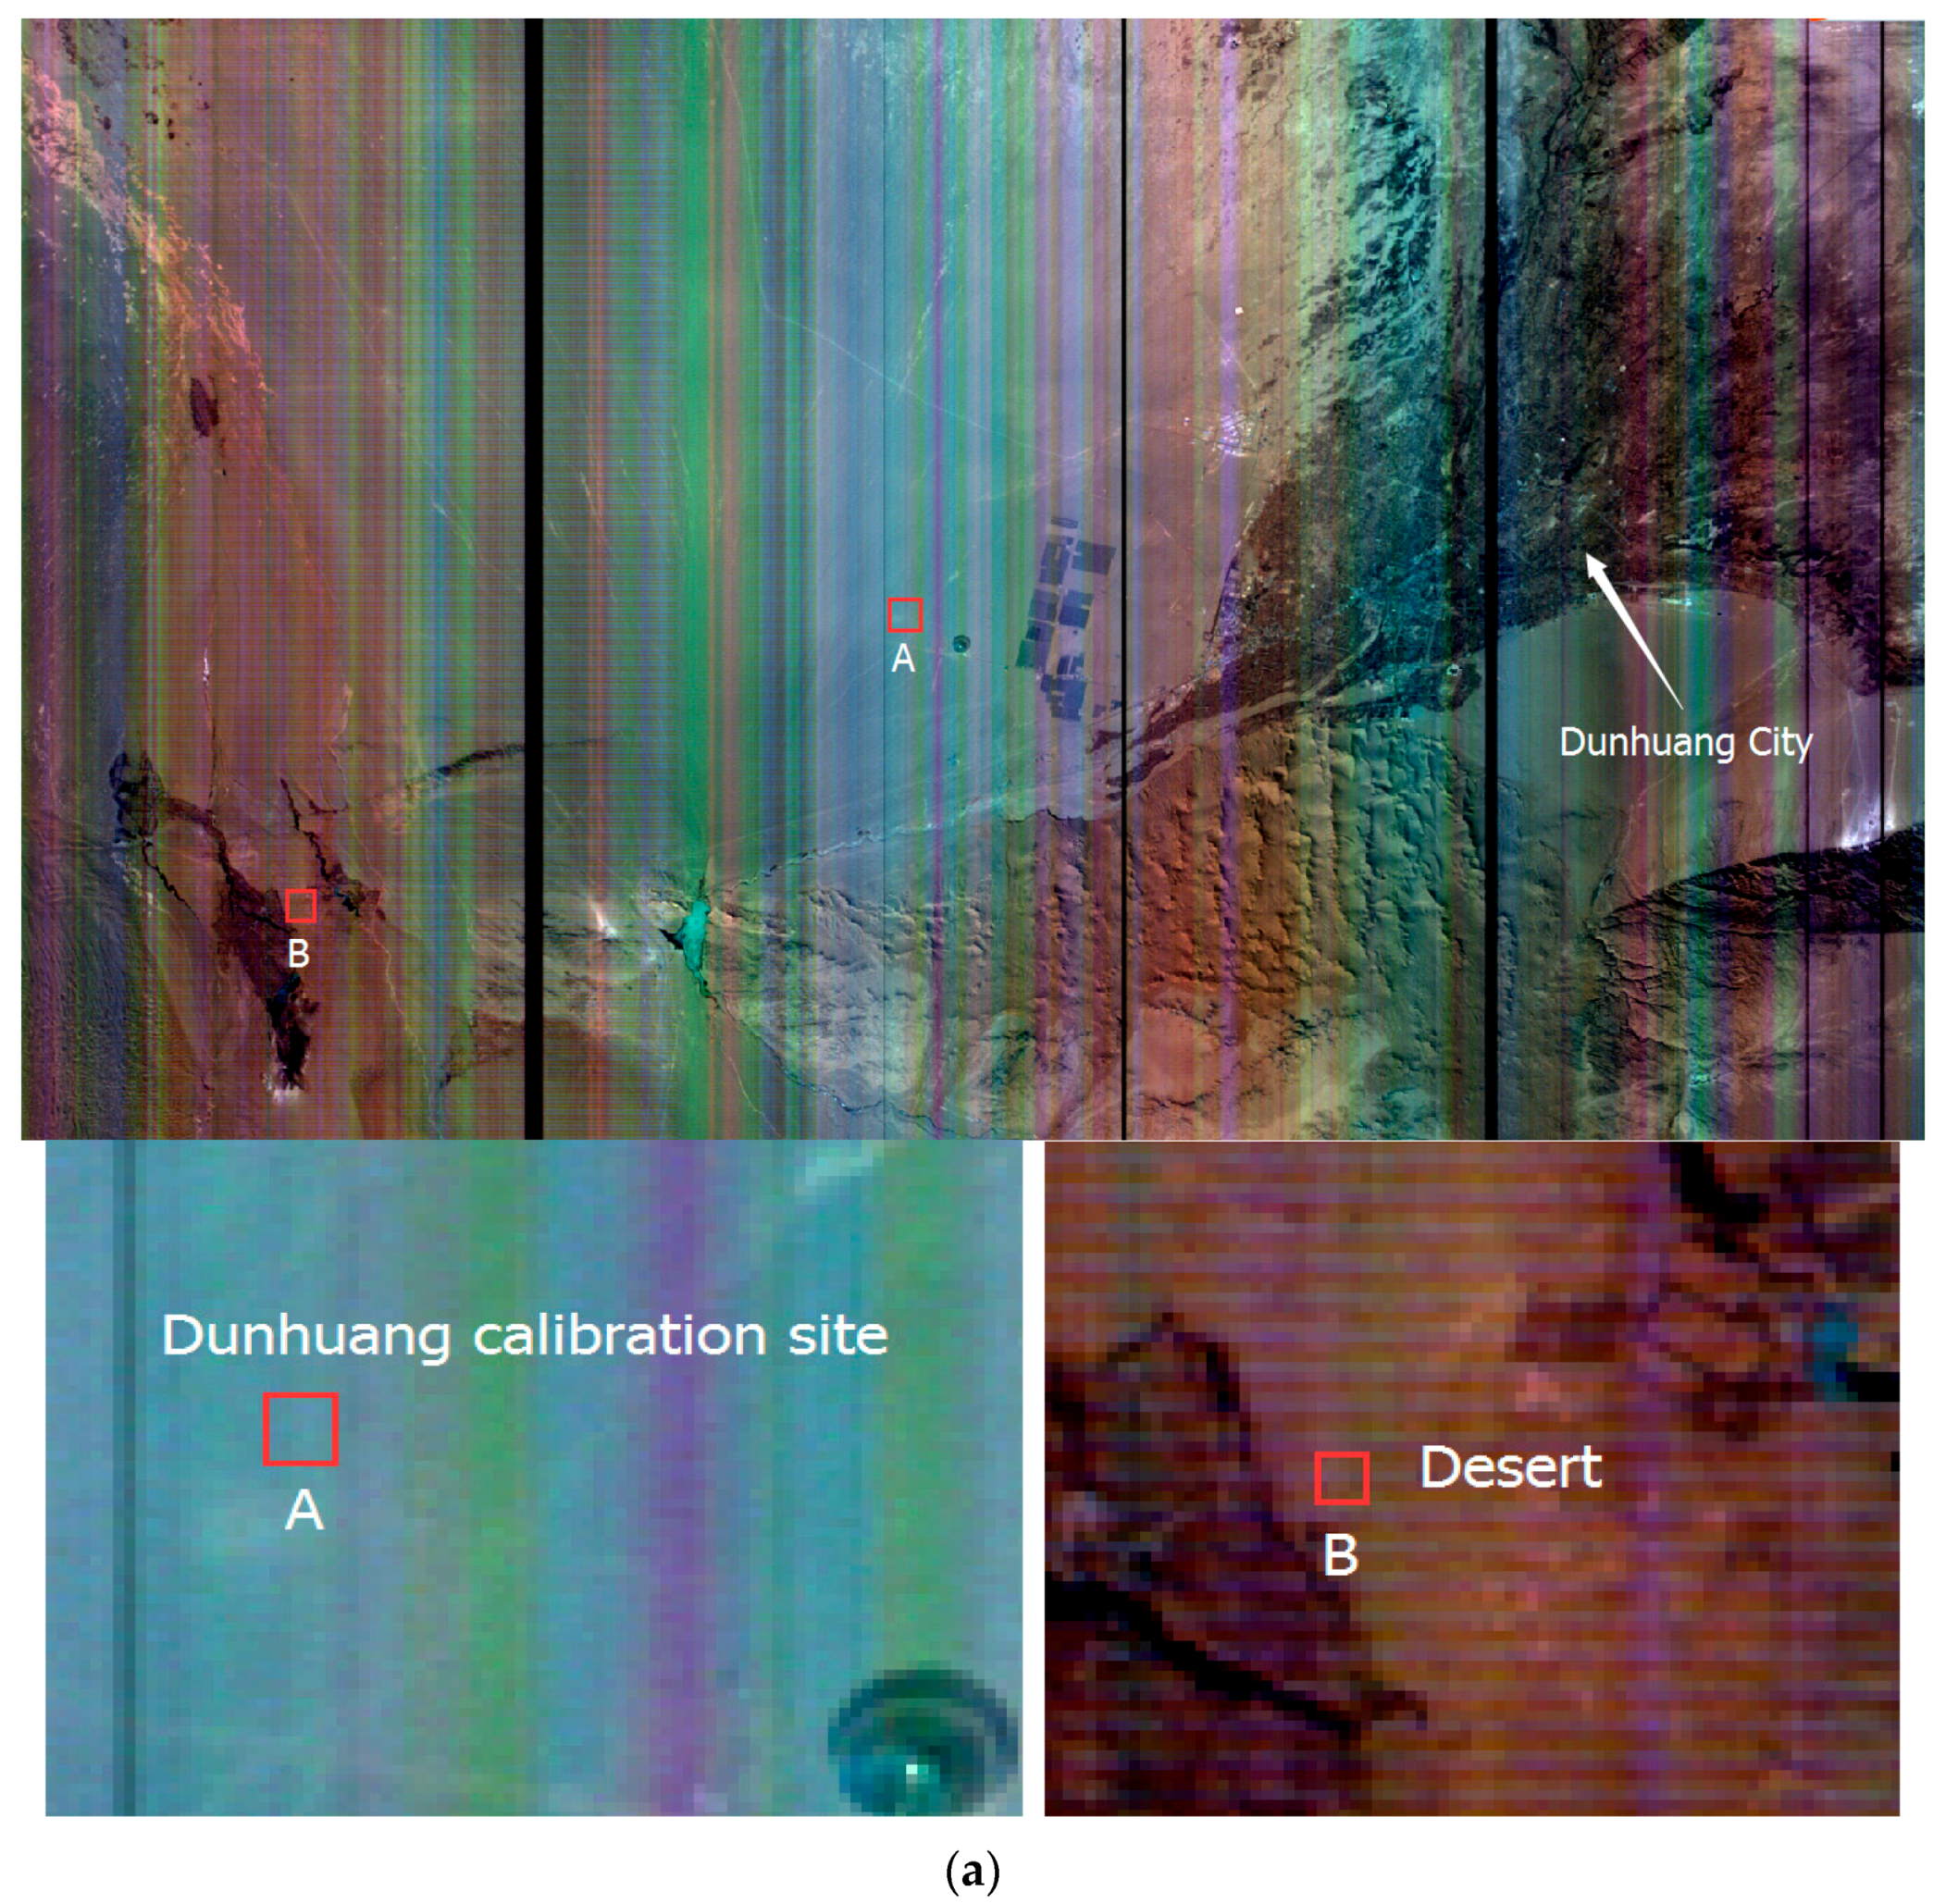
Figure 4.
Dunhuang calibration site for medium-high resolution satellites, as illustrated in a Landsat 8/OLI image acquired on 2 February 2017. (a) Scaled subset image; (b) 5× magnification of a portion of the original image, where the red rectangle is the outline of the calibration site.
Figure 4.
Dunhuang calibration site for medium-high resolution satellites, as illustrated in a Landsat 8/OLI image acquired on 2 February 2017. (a) Scaled subset image; (b) 5× magnification of a portion of the original image, where the red rectangle is the outline of the calibration site.
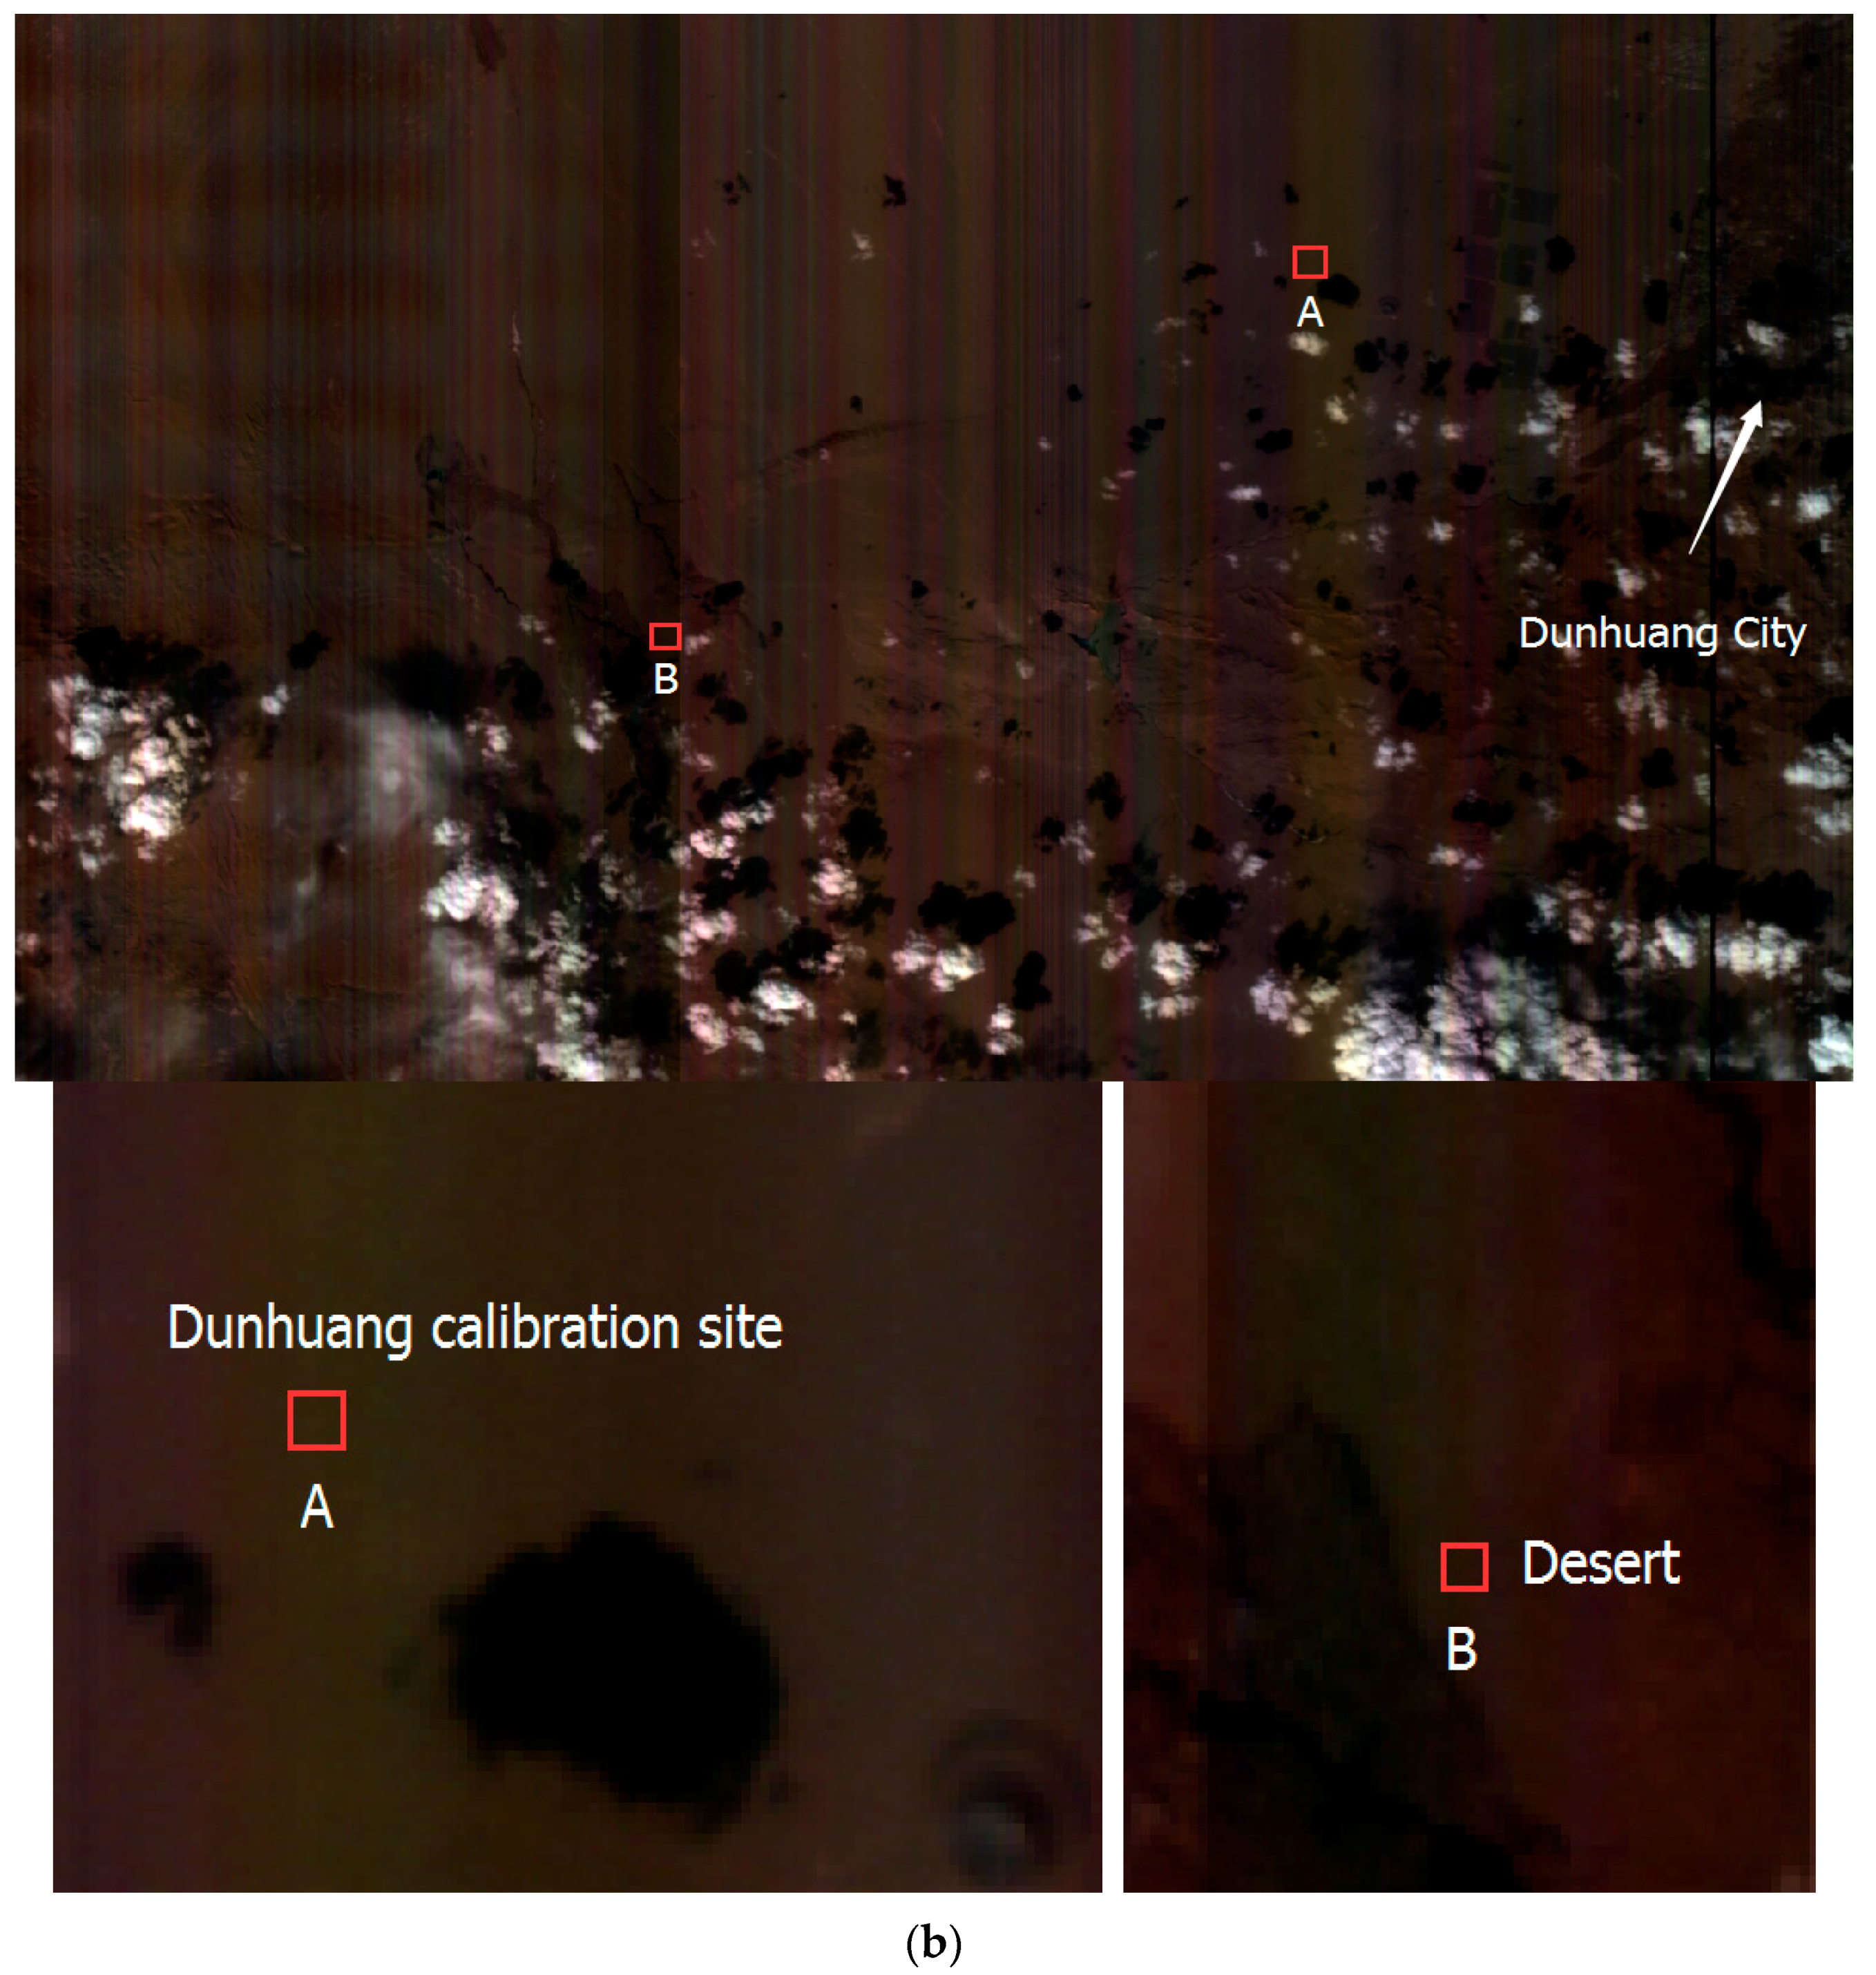
Figure 5.
Subsets of SPARK-01 and -02 data acquired over the Dunhuang calibration site featuring pseudo color composited from the 141 (856.60 nm), 111 (648.60 nm) and 84 (550.30 nm) bands. (a) SPARK-01 data acquired on 7 March 2017 at 06:48:30 UTC; (b) SPARK-02 data acquired on 28 February 2017 at 06:52:32 UTC. These images were 180° rotated from the original raw data to maintain the northern and eastern directions on the top and the right hand, respectively.
Figure 6.
(a) Photo of the calibration site; (b) Schematic of the surface measurement route.
Figure 6.
(a) Photo of the calibration site; (b) Schematic of the surface measurement route.
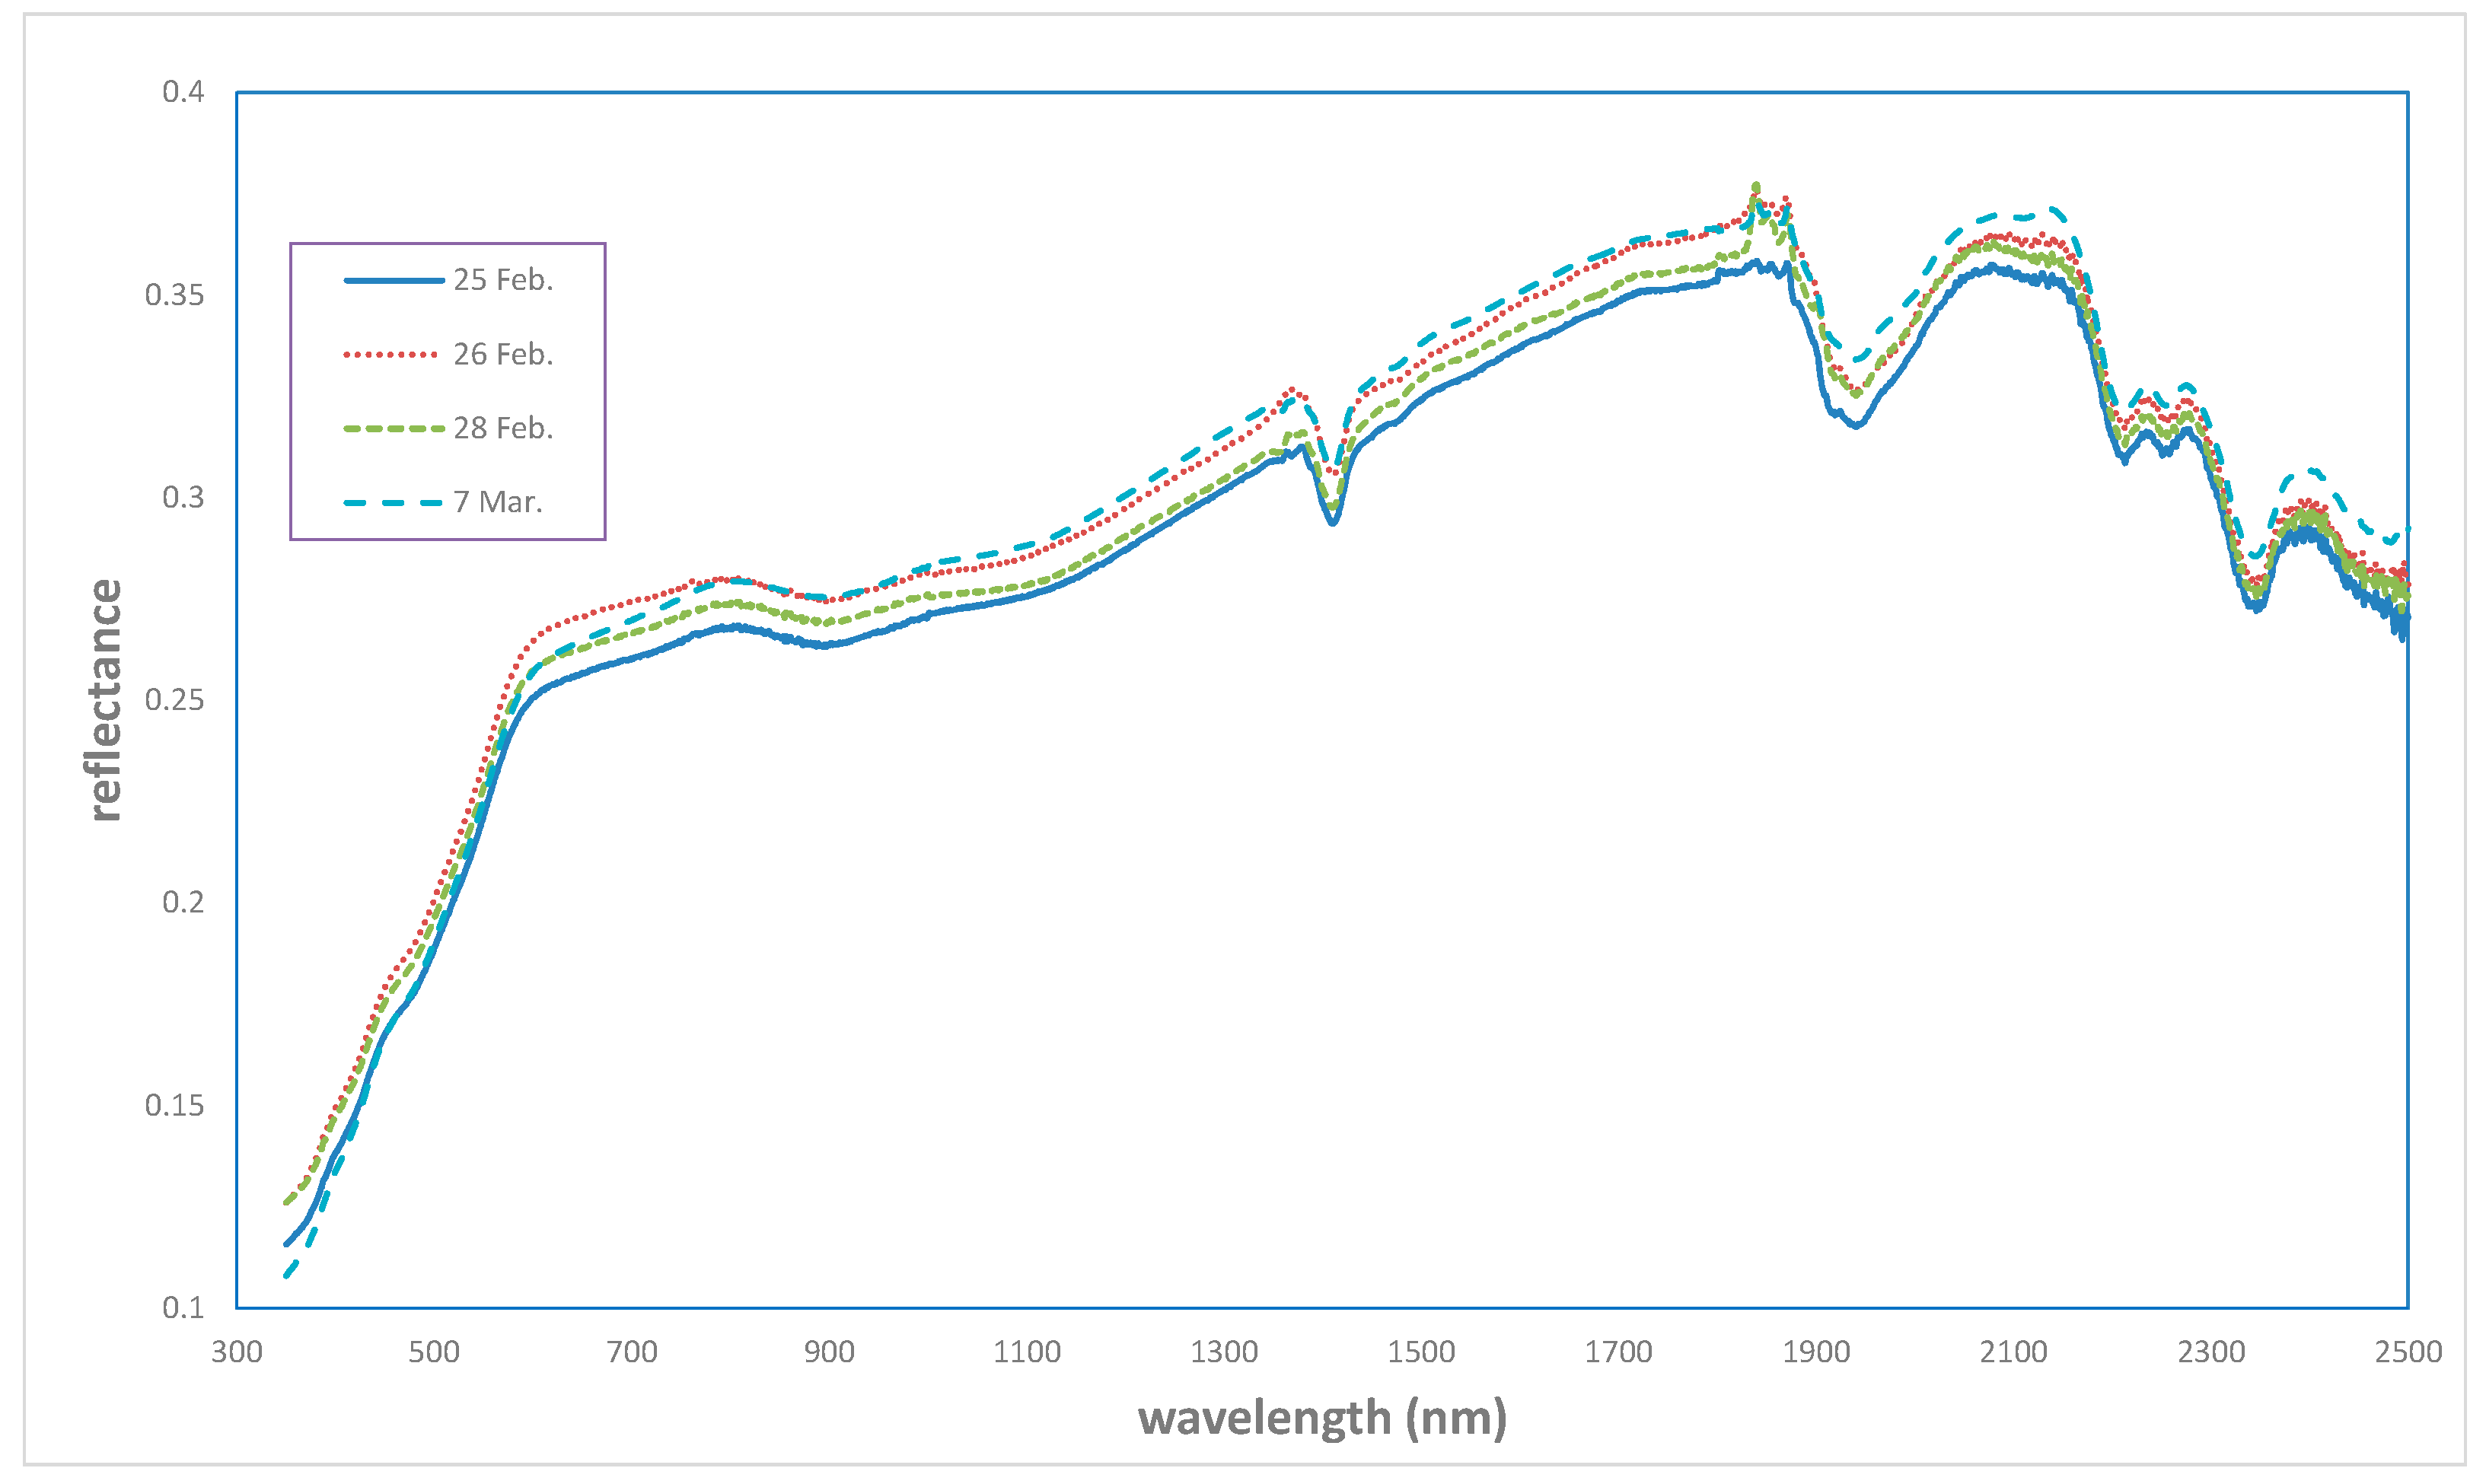
Figure 7.
Ground reflectance at the Dunhuang calibration site on different dates. Measurements on 7 March and 28 February 2017 correspond to SPARK-01 and SPARK-02, respectively.
Figure 7.
Ground reflectance at the Dunhuang calibration site on different dates. Measurements on 7 March and 28 February 2017 correspond to SPARK-01 and SPARK-02, respectively.
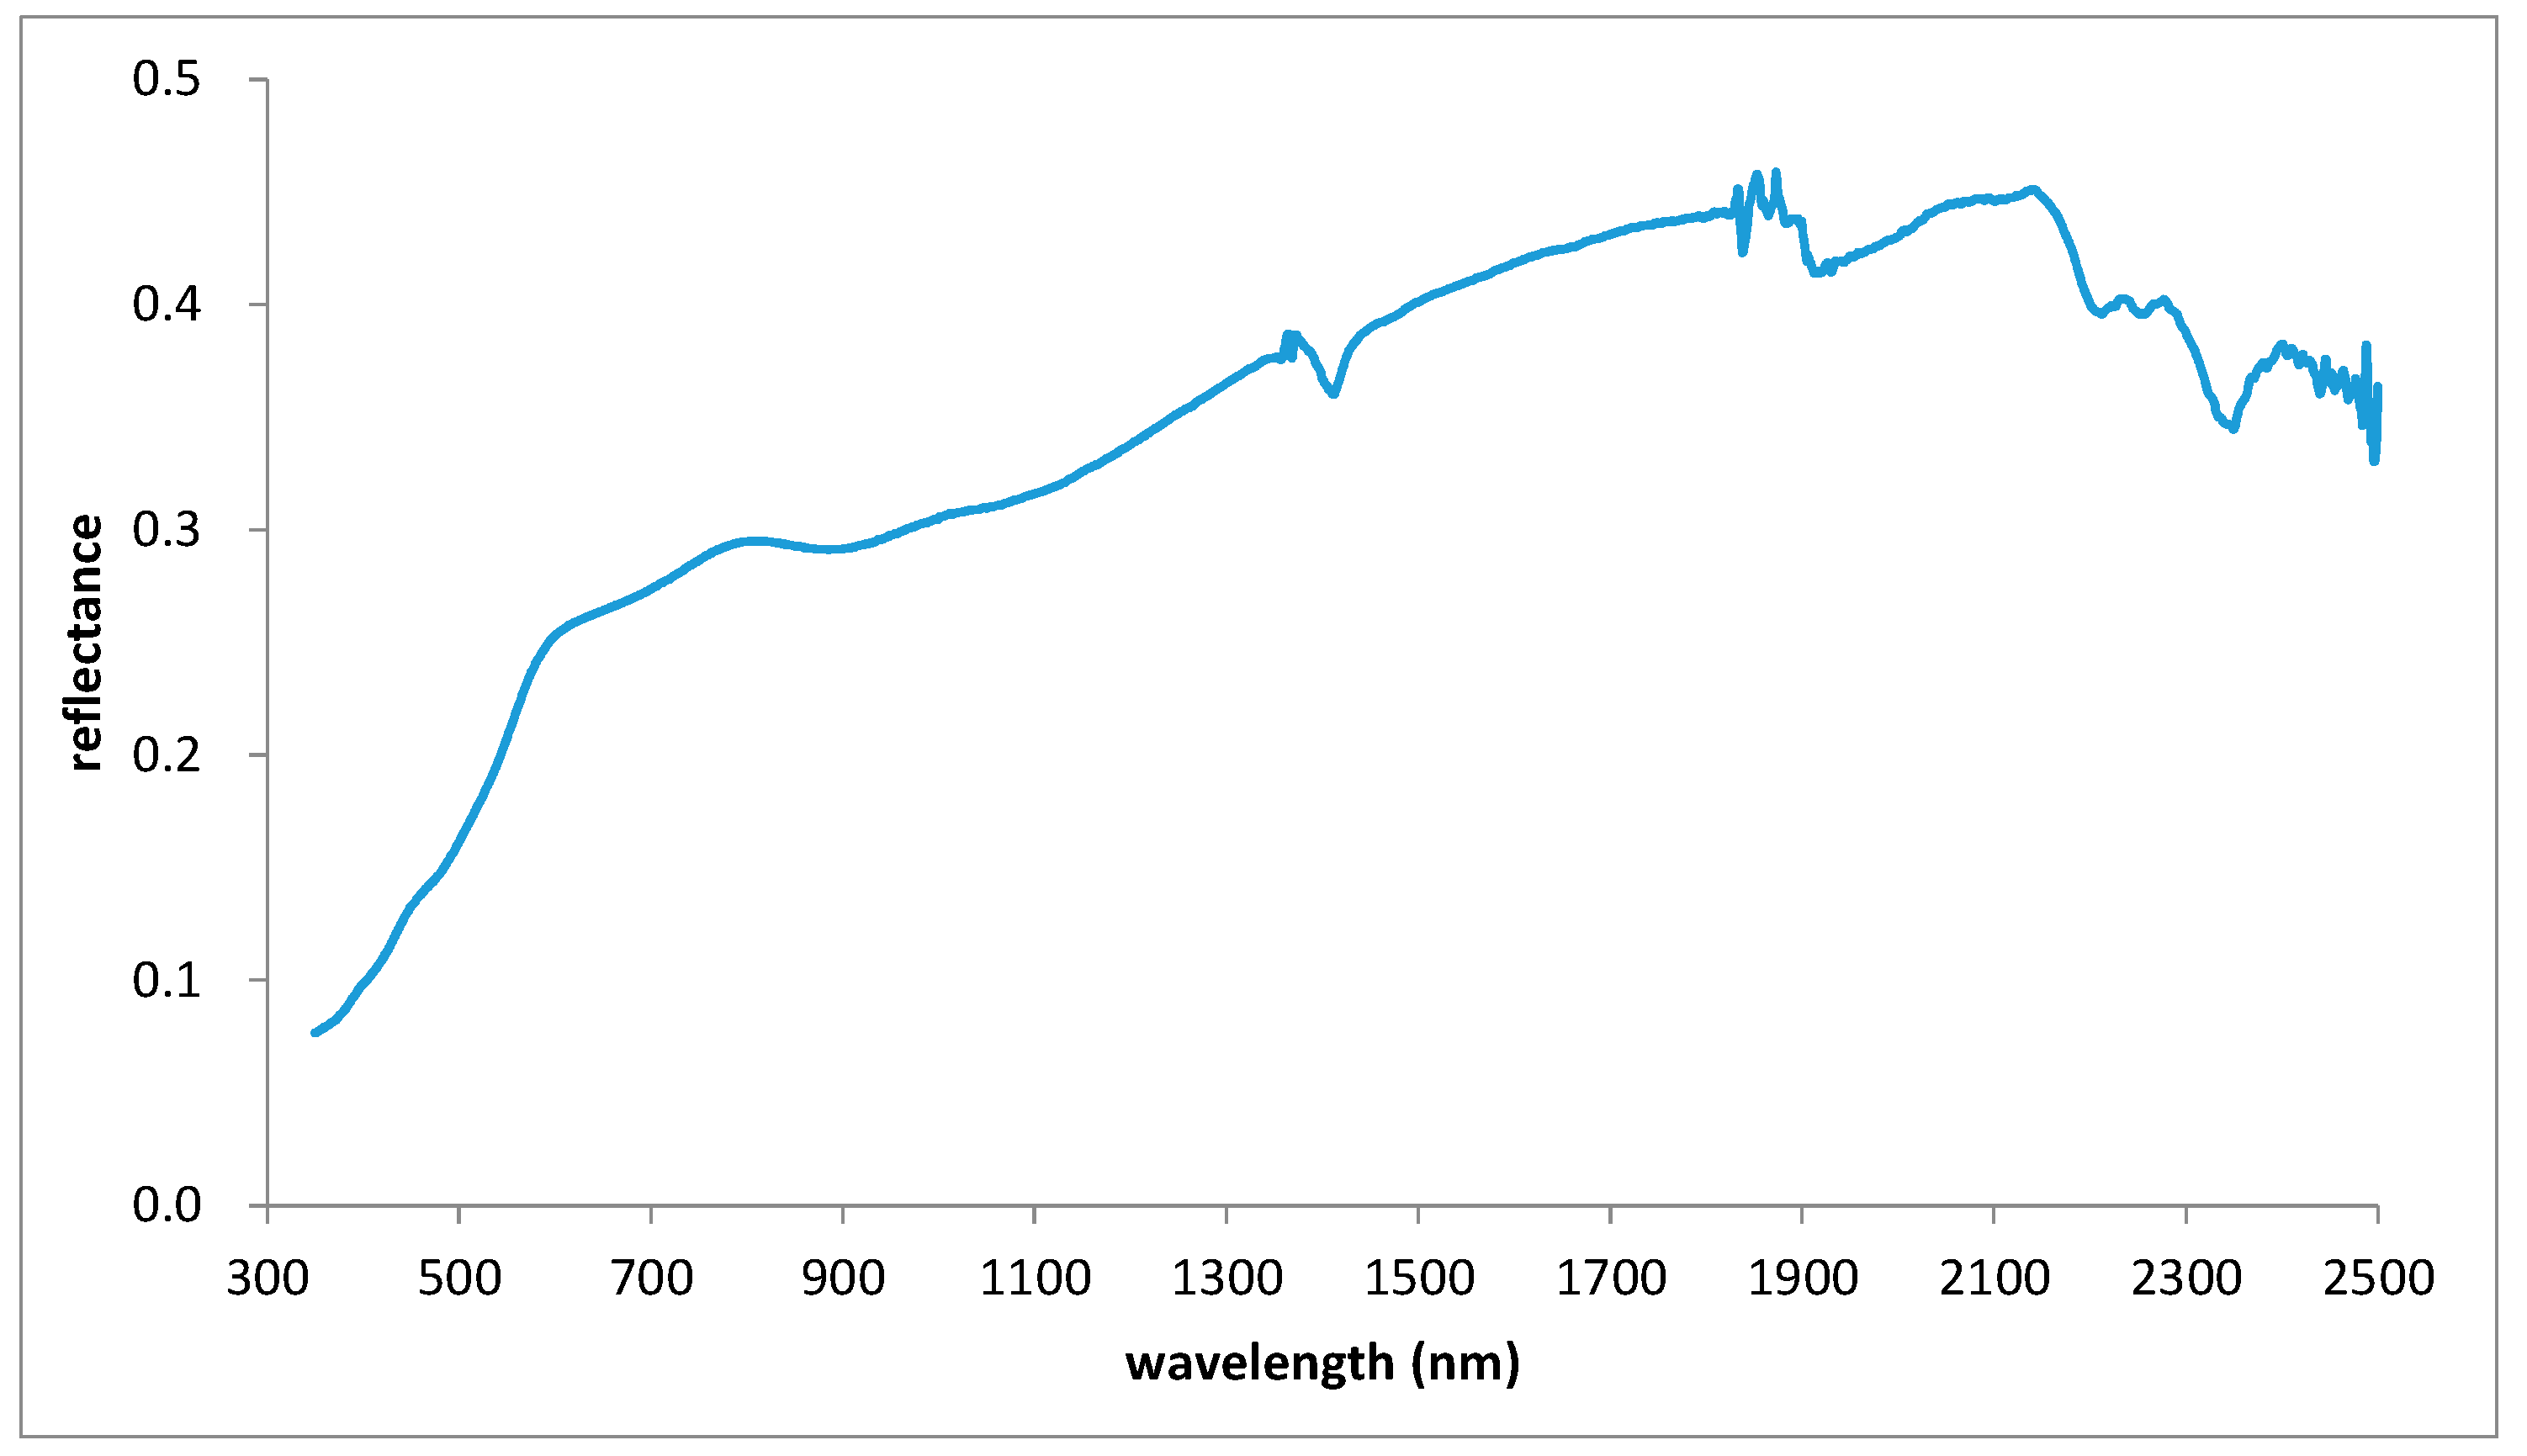
Figure 8.
Ground reflectance measured on 7 March 2017 over the desert area south of the Dunhuang calibration site.
Figure 8.
Ground reflectance measured on 7 March 2017 over the desert area south of the Dunhuang calibration site.
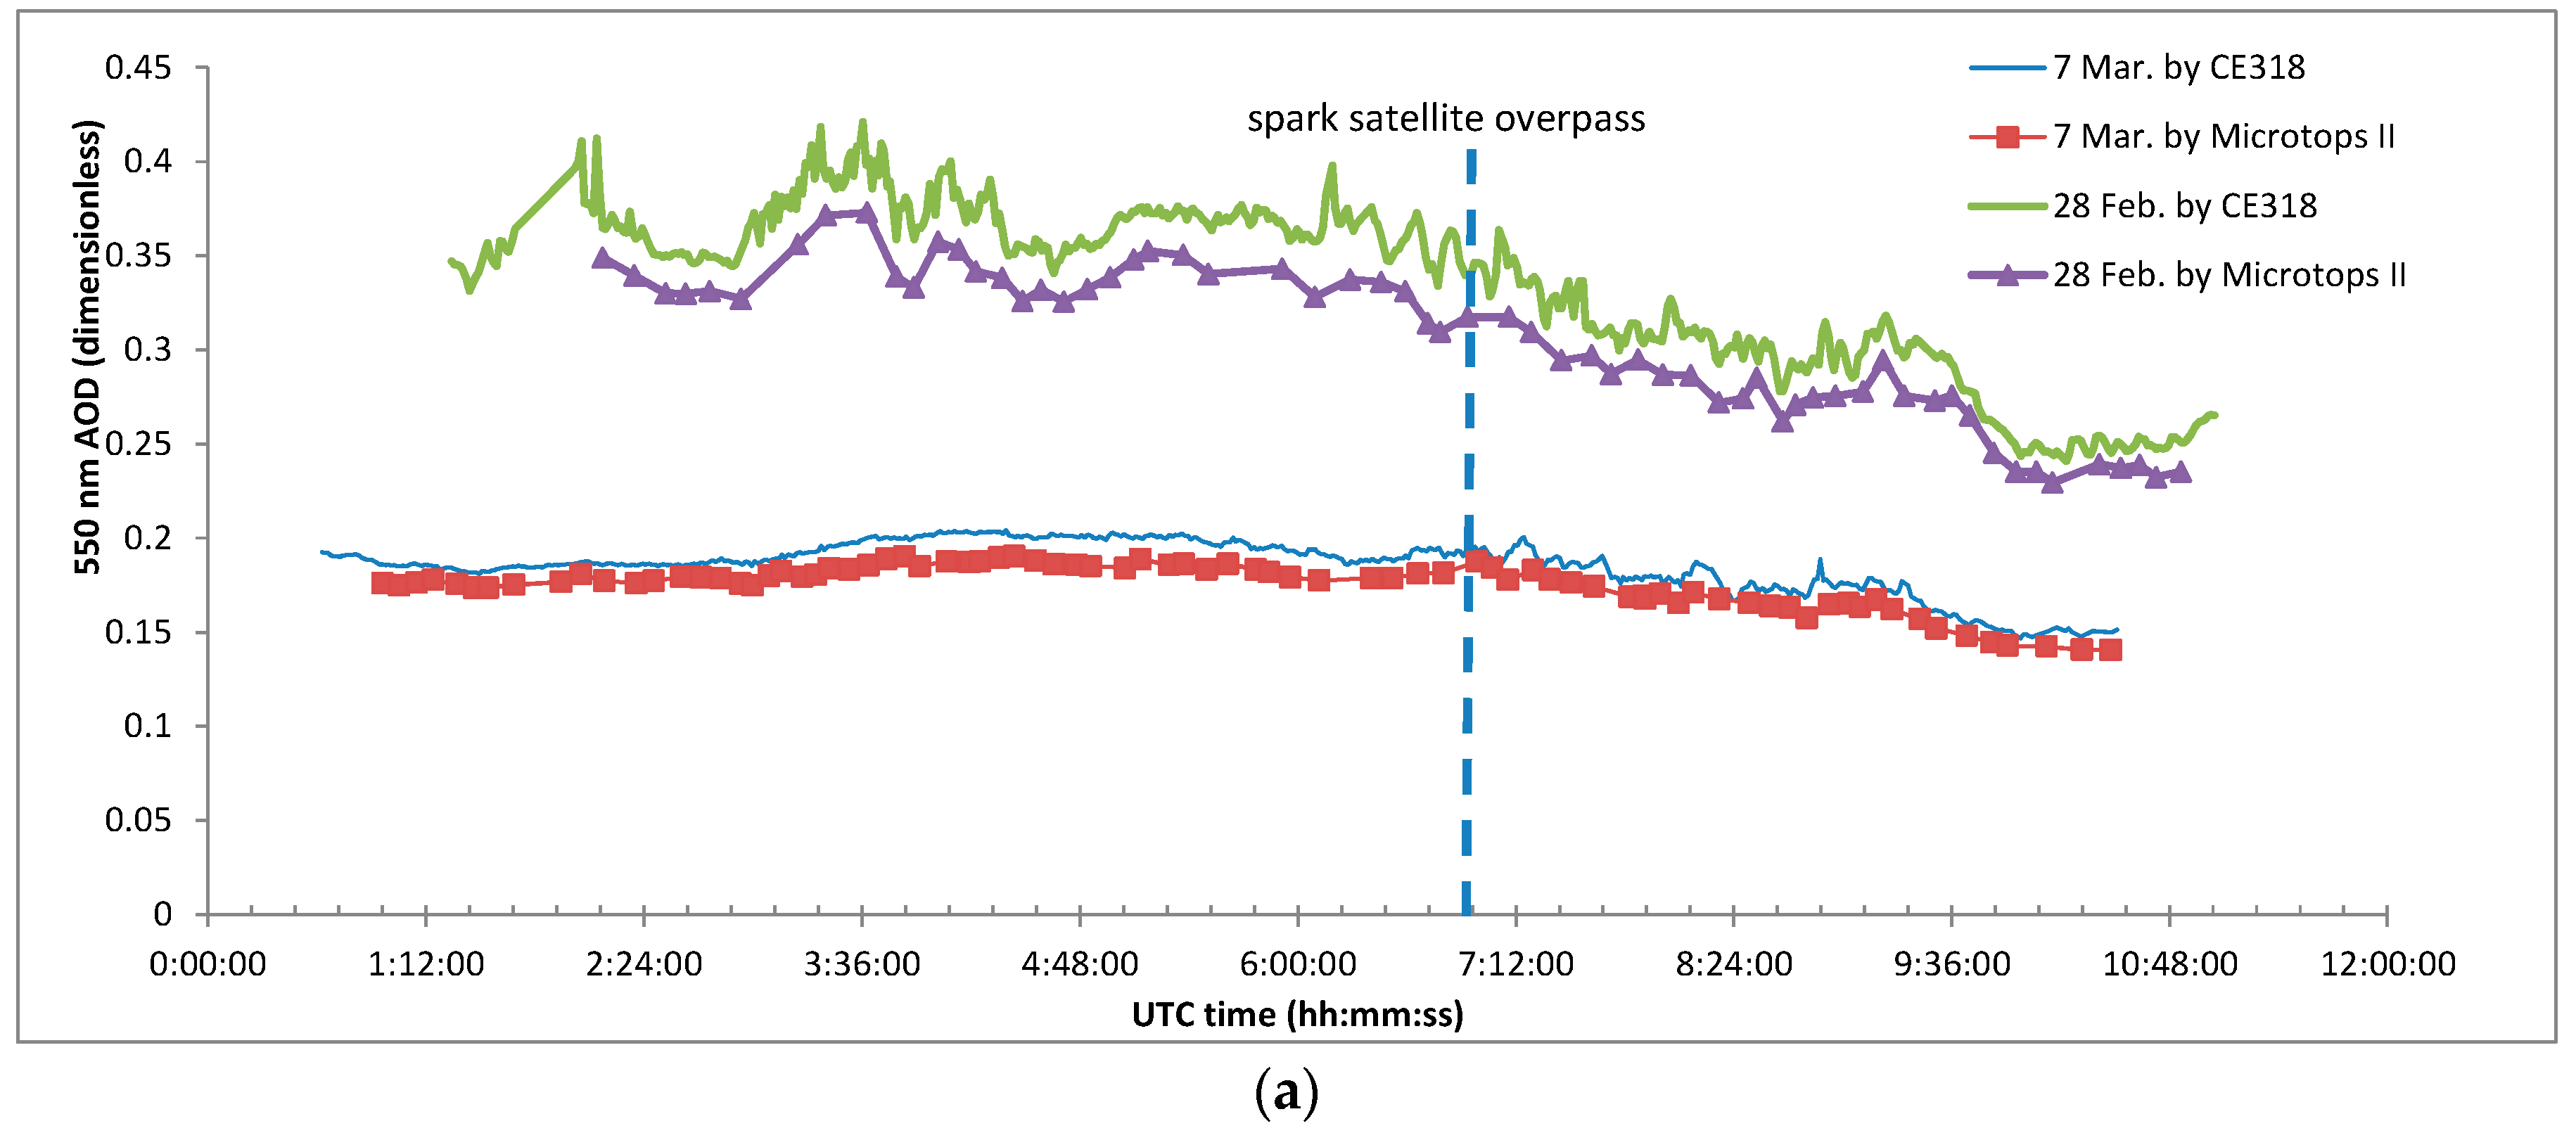
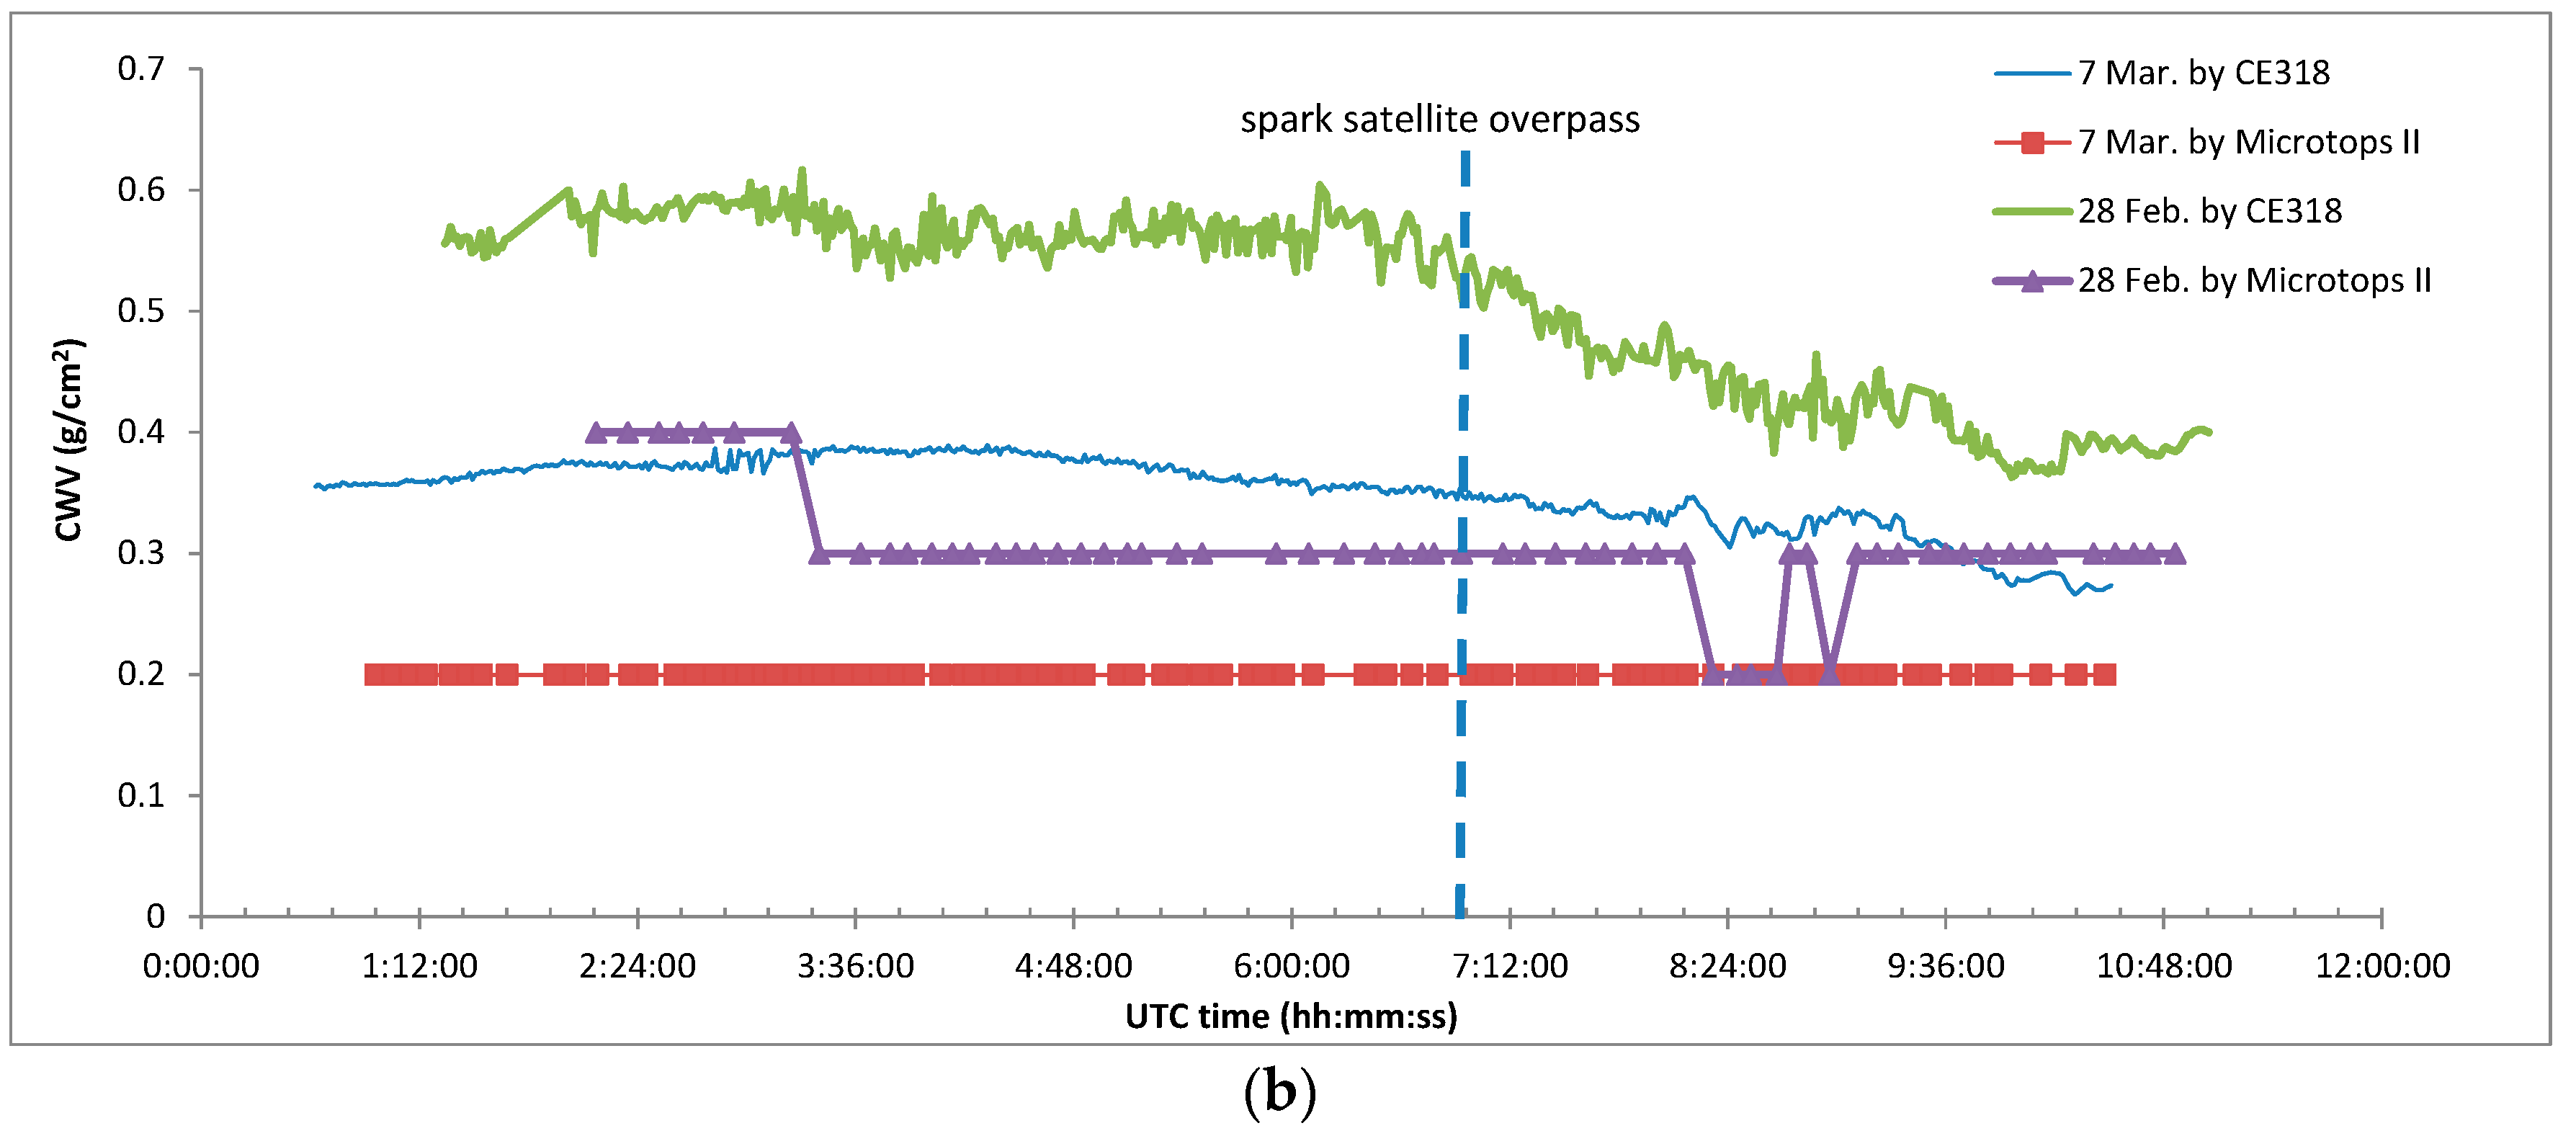
Figure 9.
550 nm AOD (a) and CWV (b) retrieved from CE318 measurements and Microtops II measurements on 7 March and 28 February 2017, respectively.
Figure 9.
550 nm AOD (a) and CWV (b) retrieved from CE318 measurements and Microtops II measurements on 7 March and 28 February 2017, respectively.
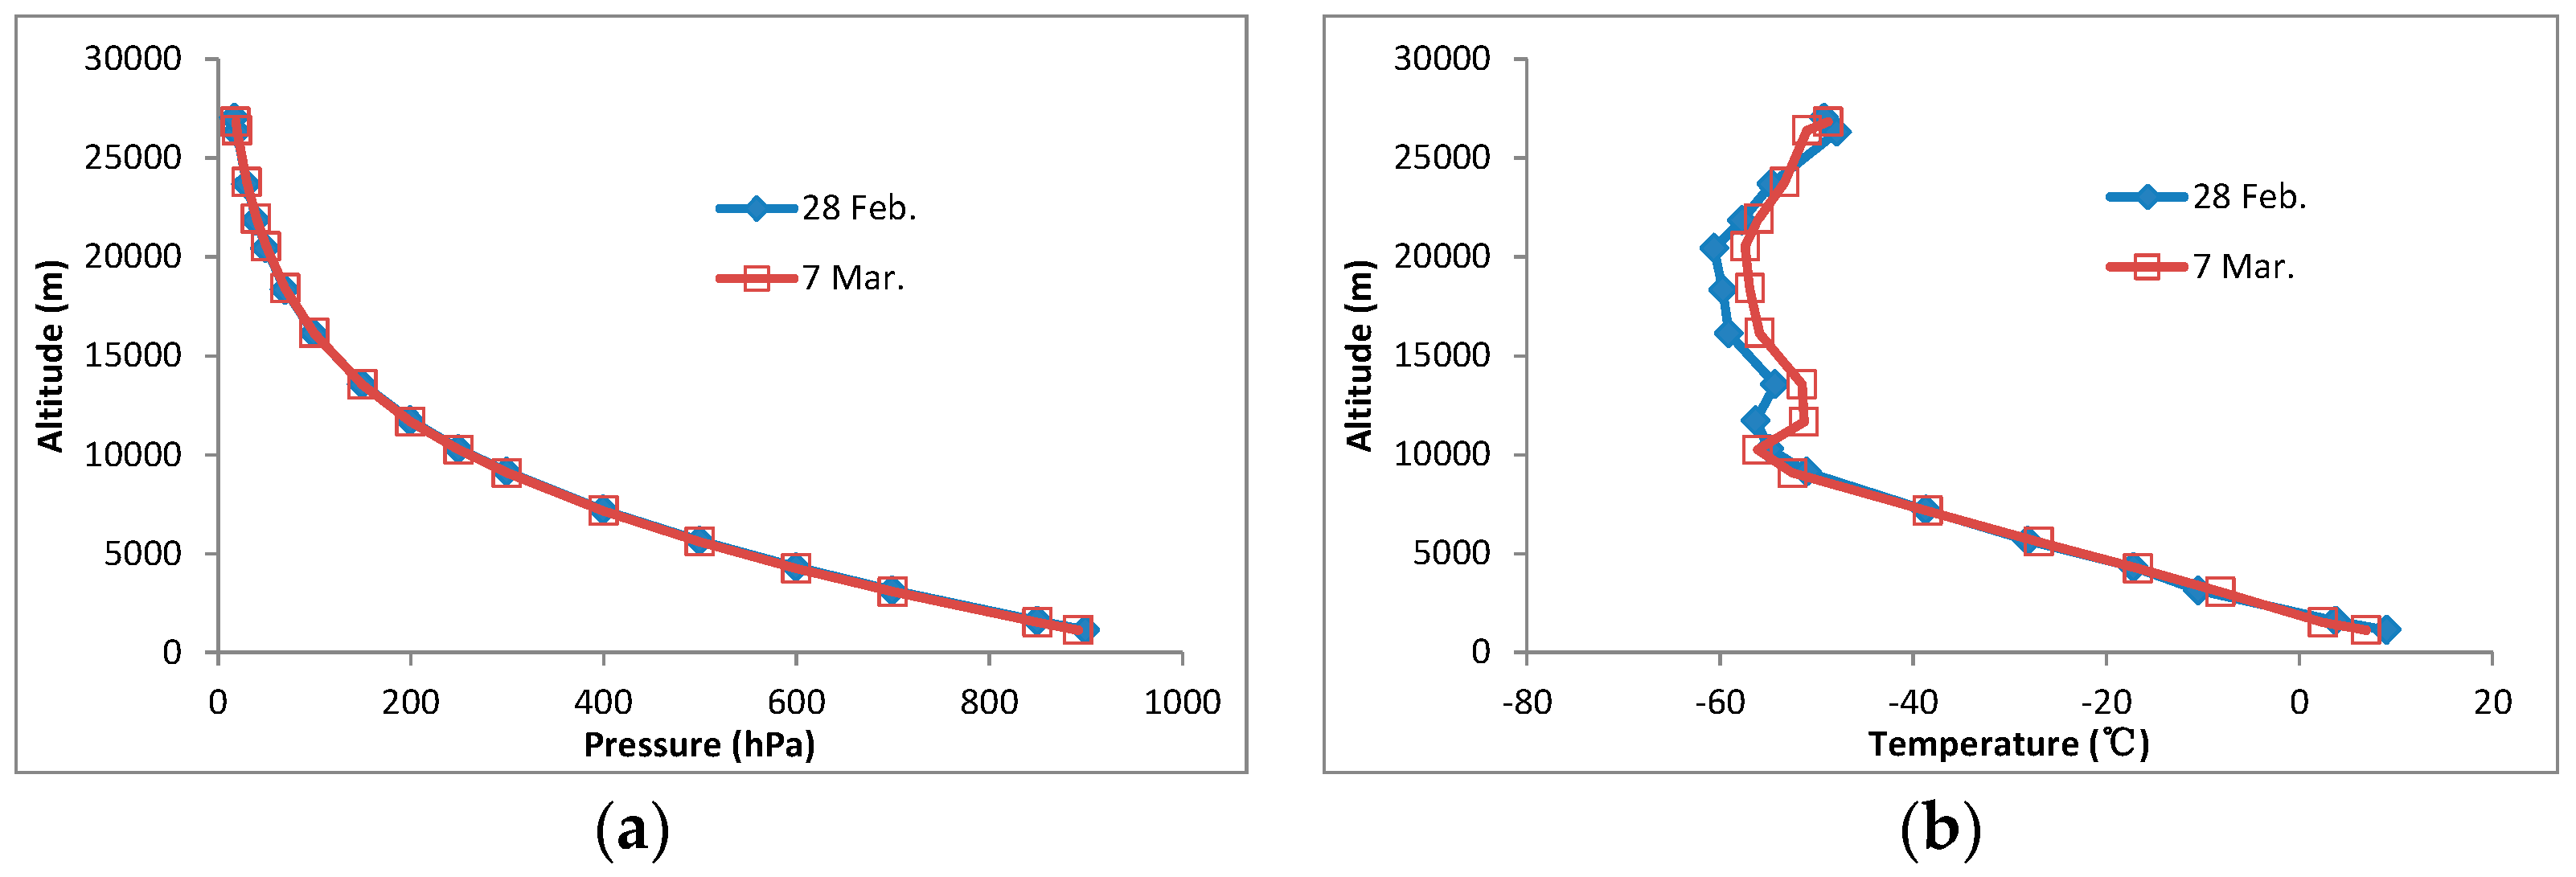
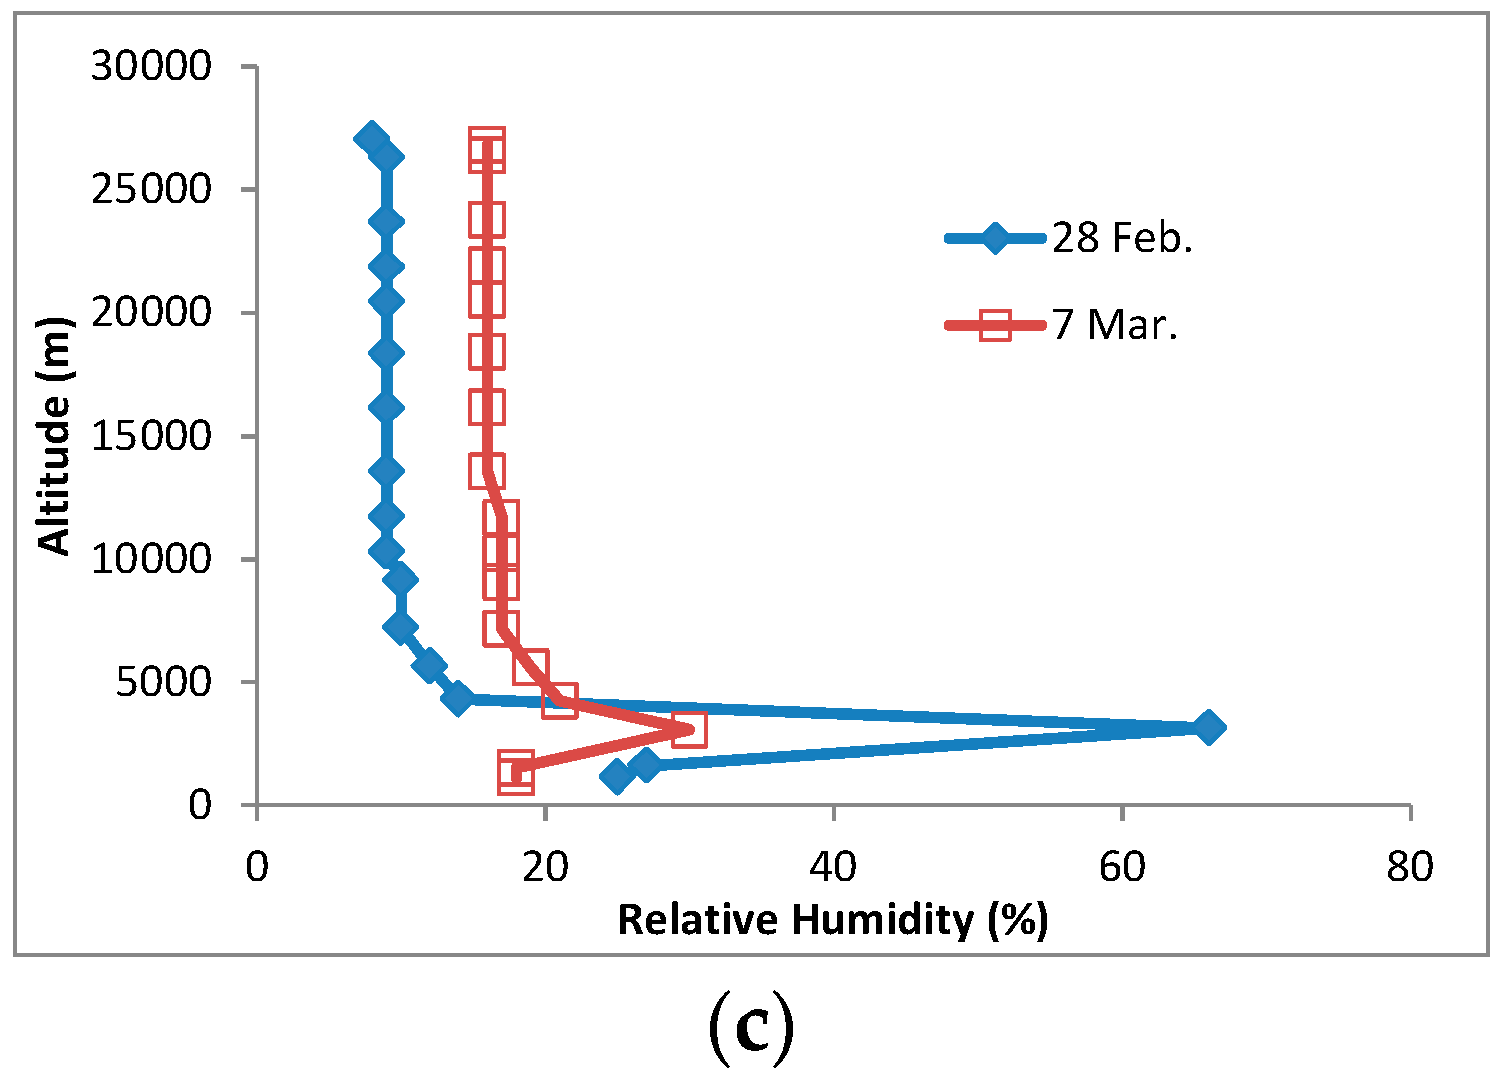
Figure 10.
Vertical profiles of (a) pressure; (b) temperature; and (c) relative humidity measured using radiosondes released on 7 March and 28 February 2017.
Figure 10.
Vertical profiles of (a) pressure; (b) temperature; and (c) relative humidity measured using radiosondes released on 7 March and 28 February 2017.
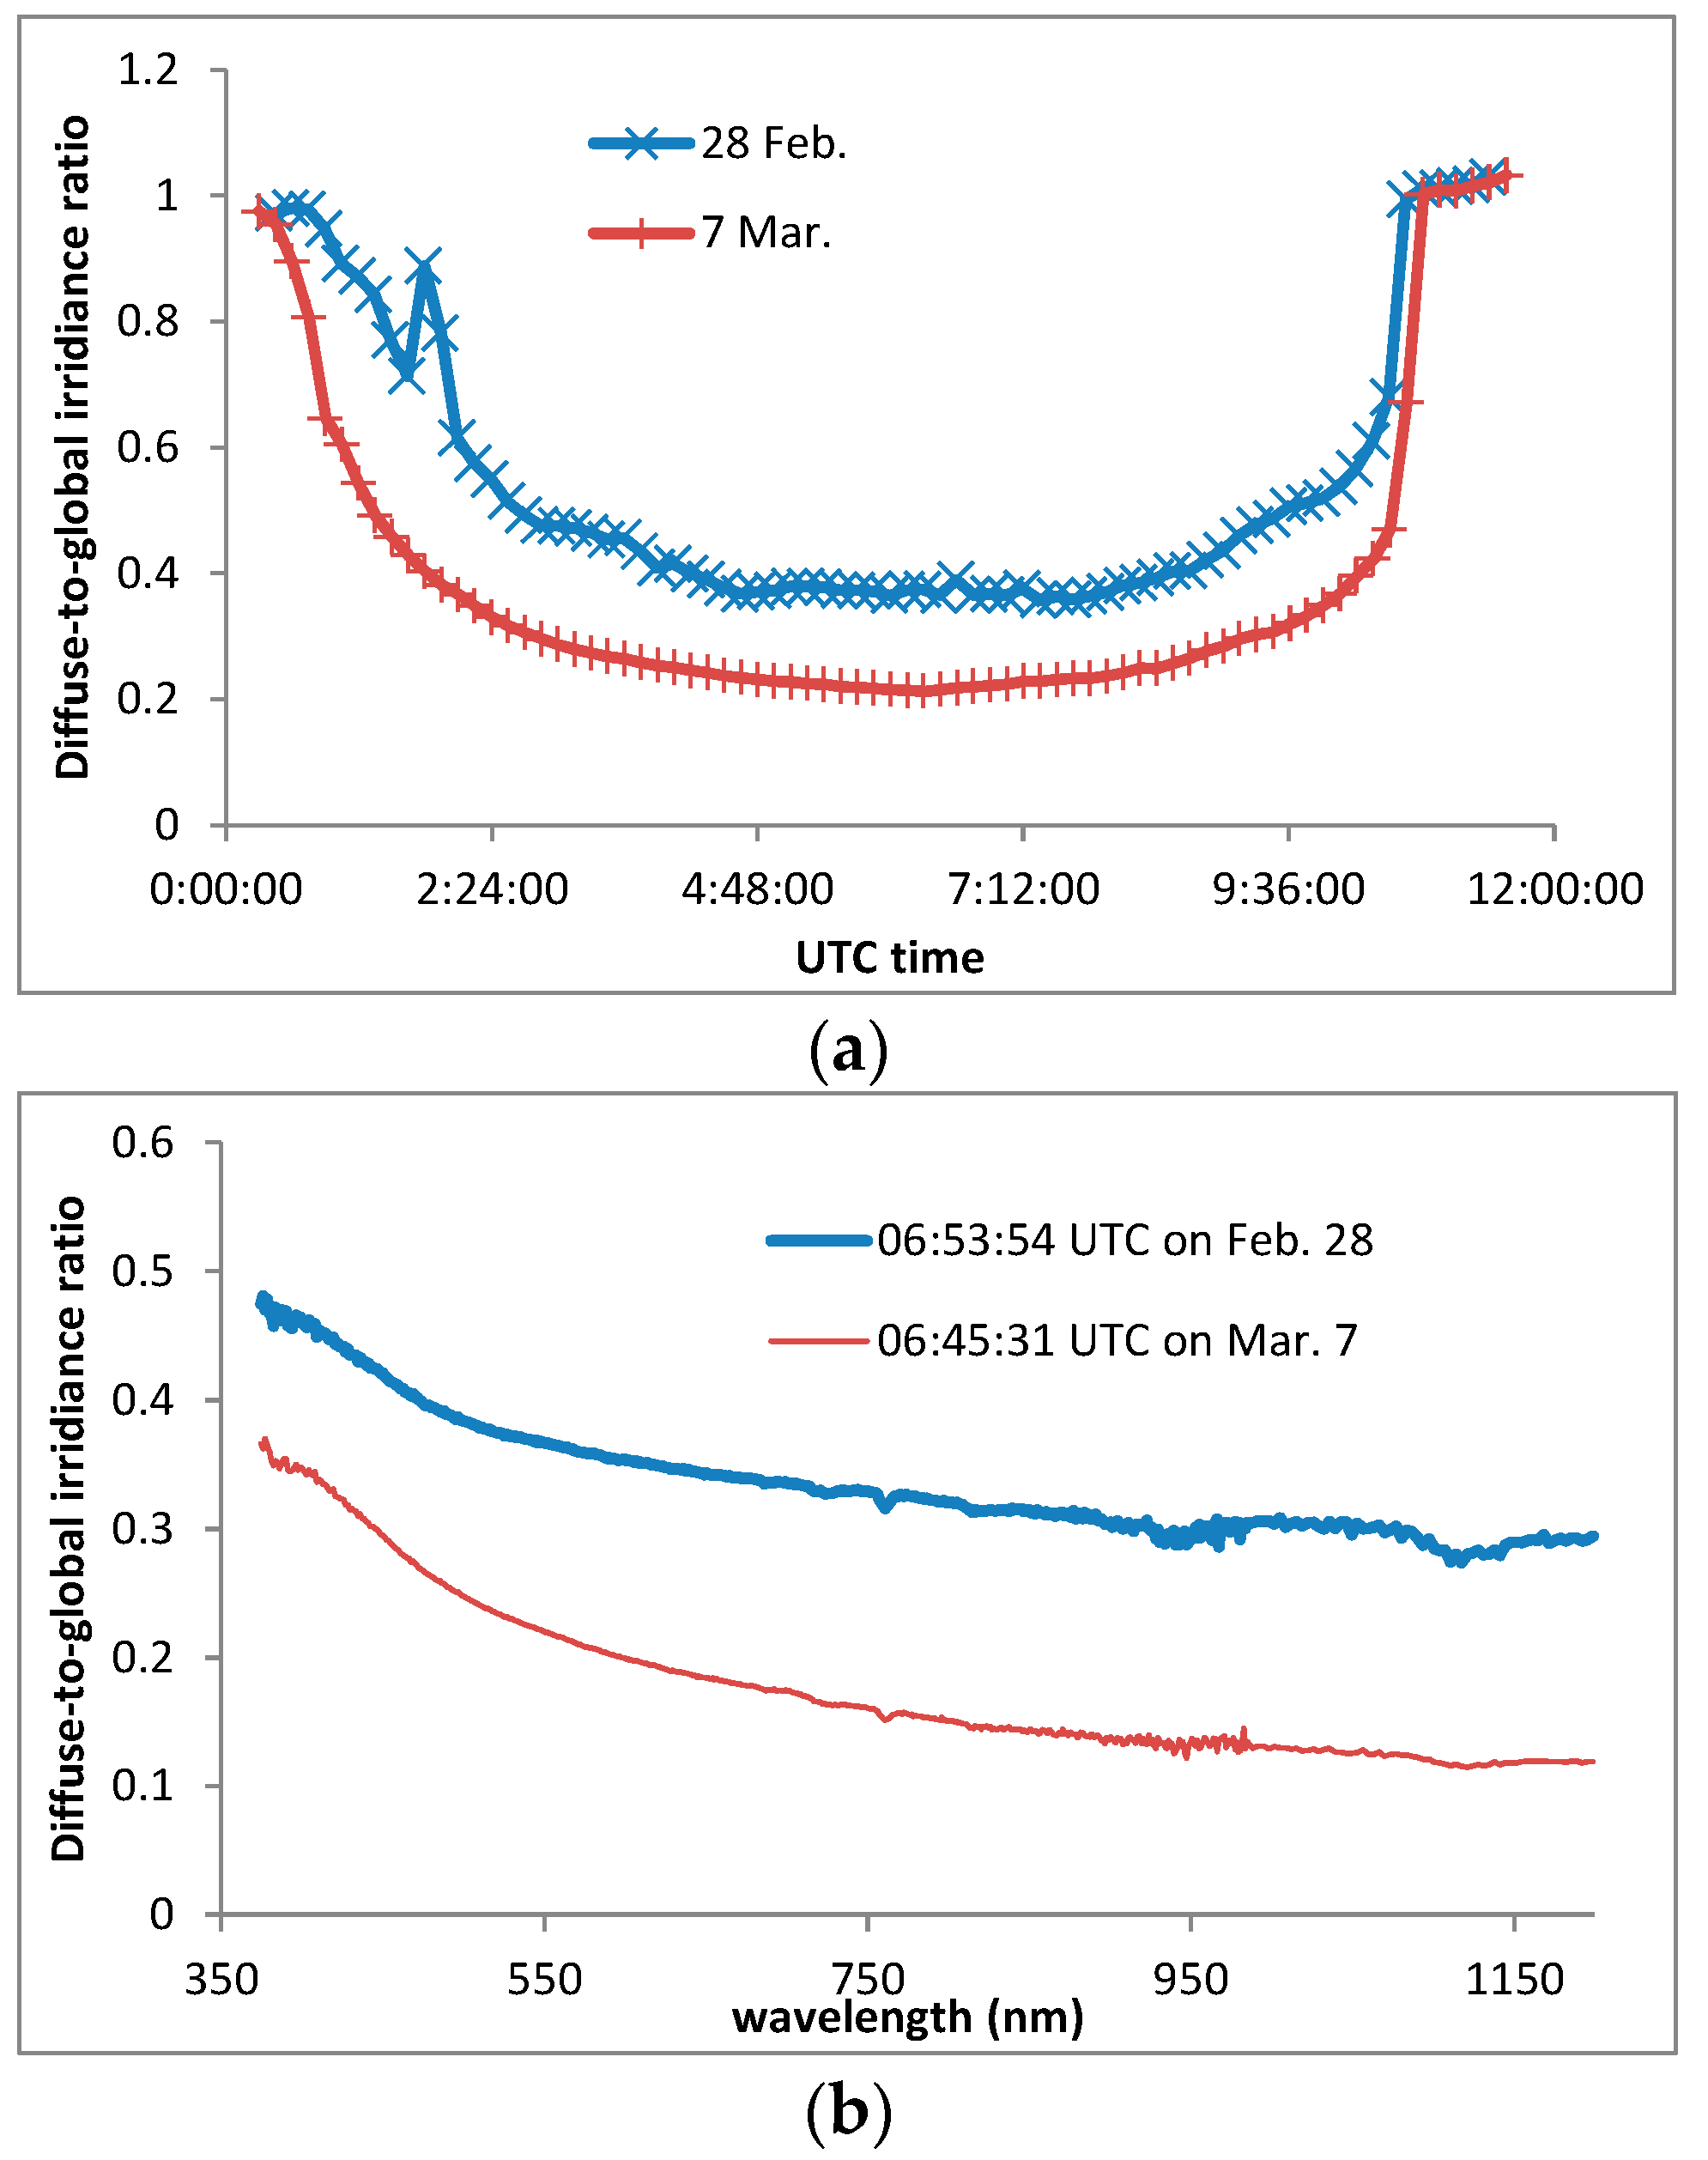
Figure 11.
Diffuse-to-global irradiance ratios measured (a) at 550 nm on the date of the SPARK satellite overpass during the Dunhuang experiment, and (b) for the entire spectrum at the time of the SPARK satellite overpass.
Figure 11.
Diffuse-to-global irradiance ratios measured (a) at 550 nm on the date of the SPARK satellite overpass during the Dunhuang experiment, and (b) for the entire spectrum at the time of the SPARK satellite overpass.
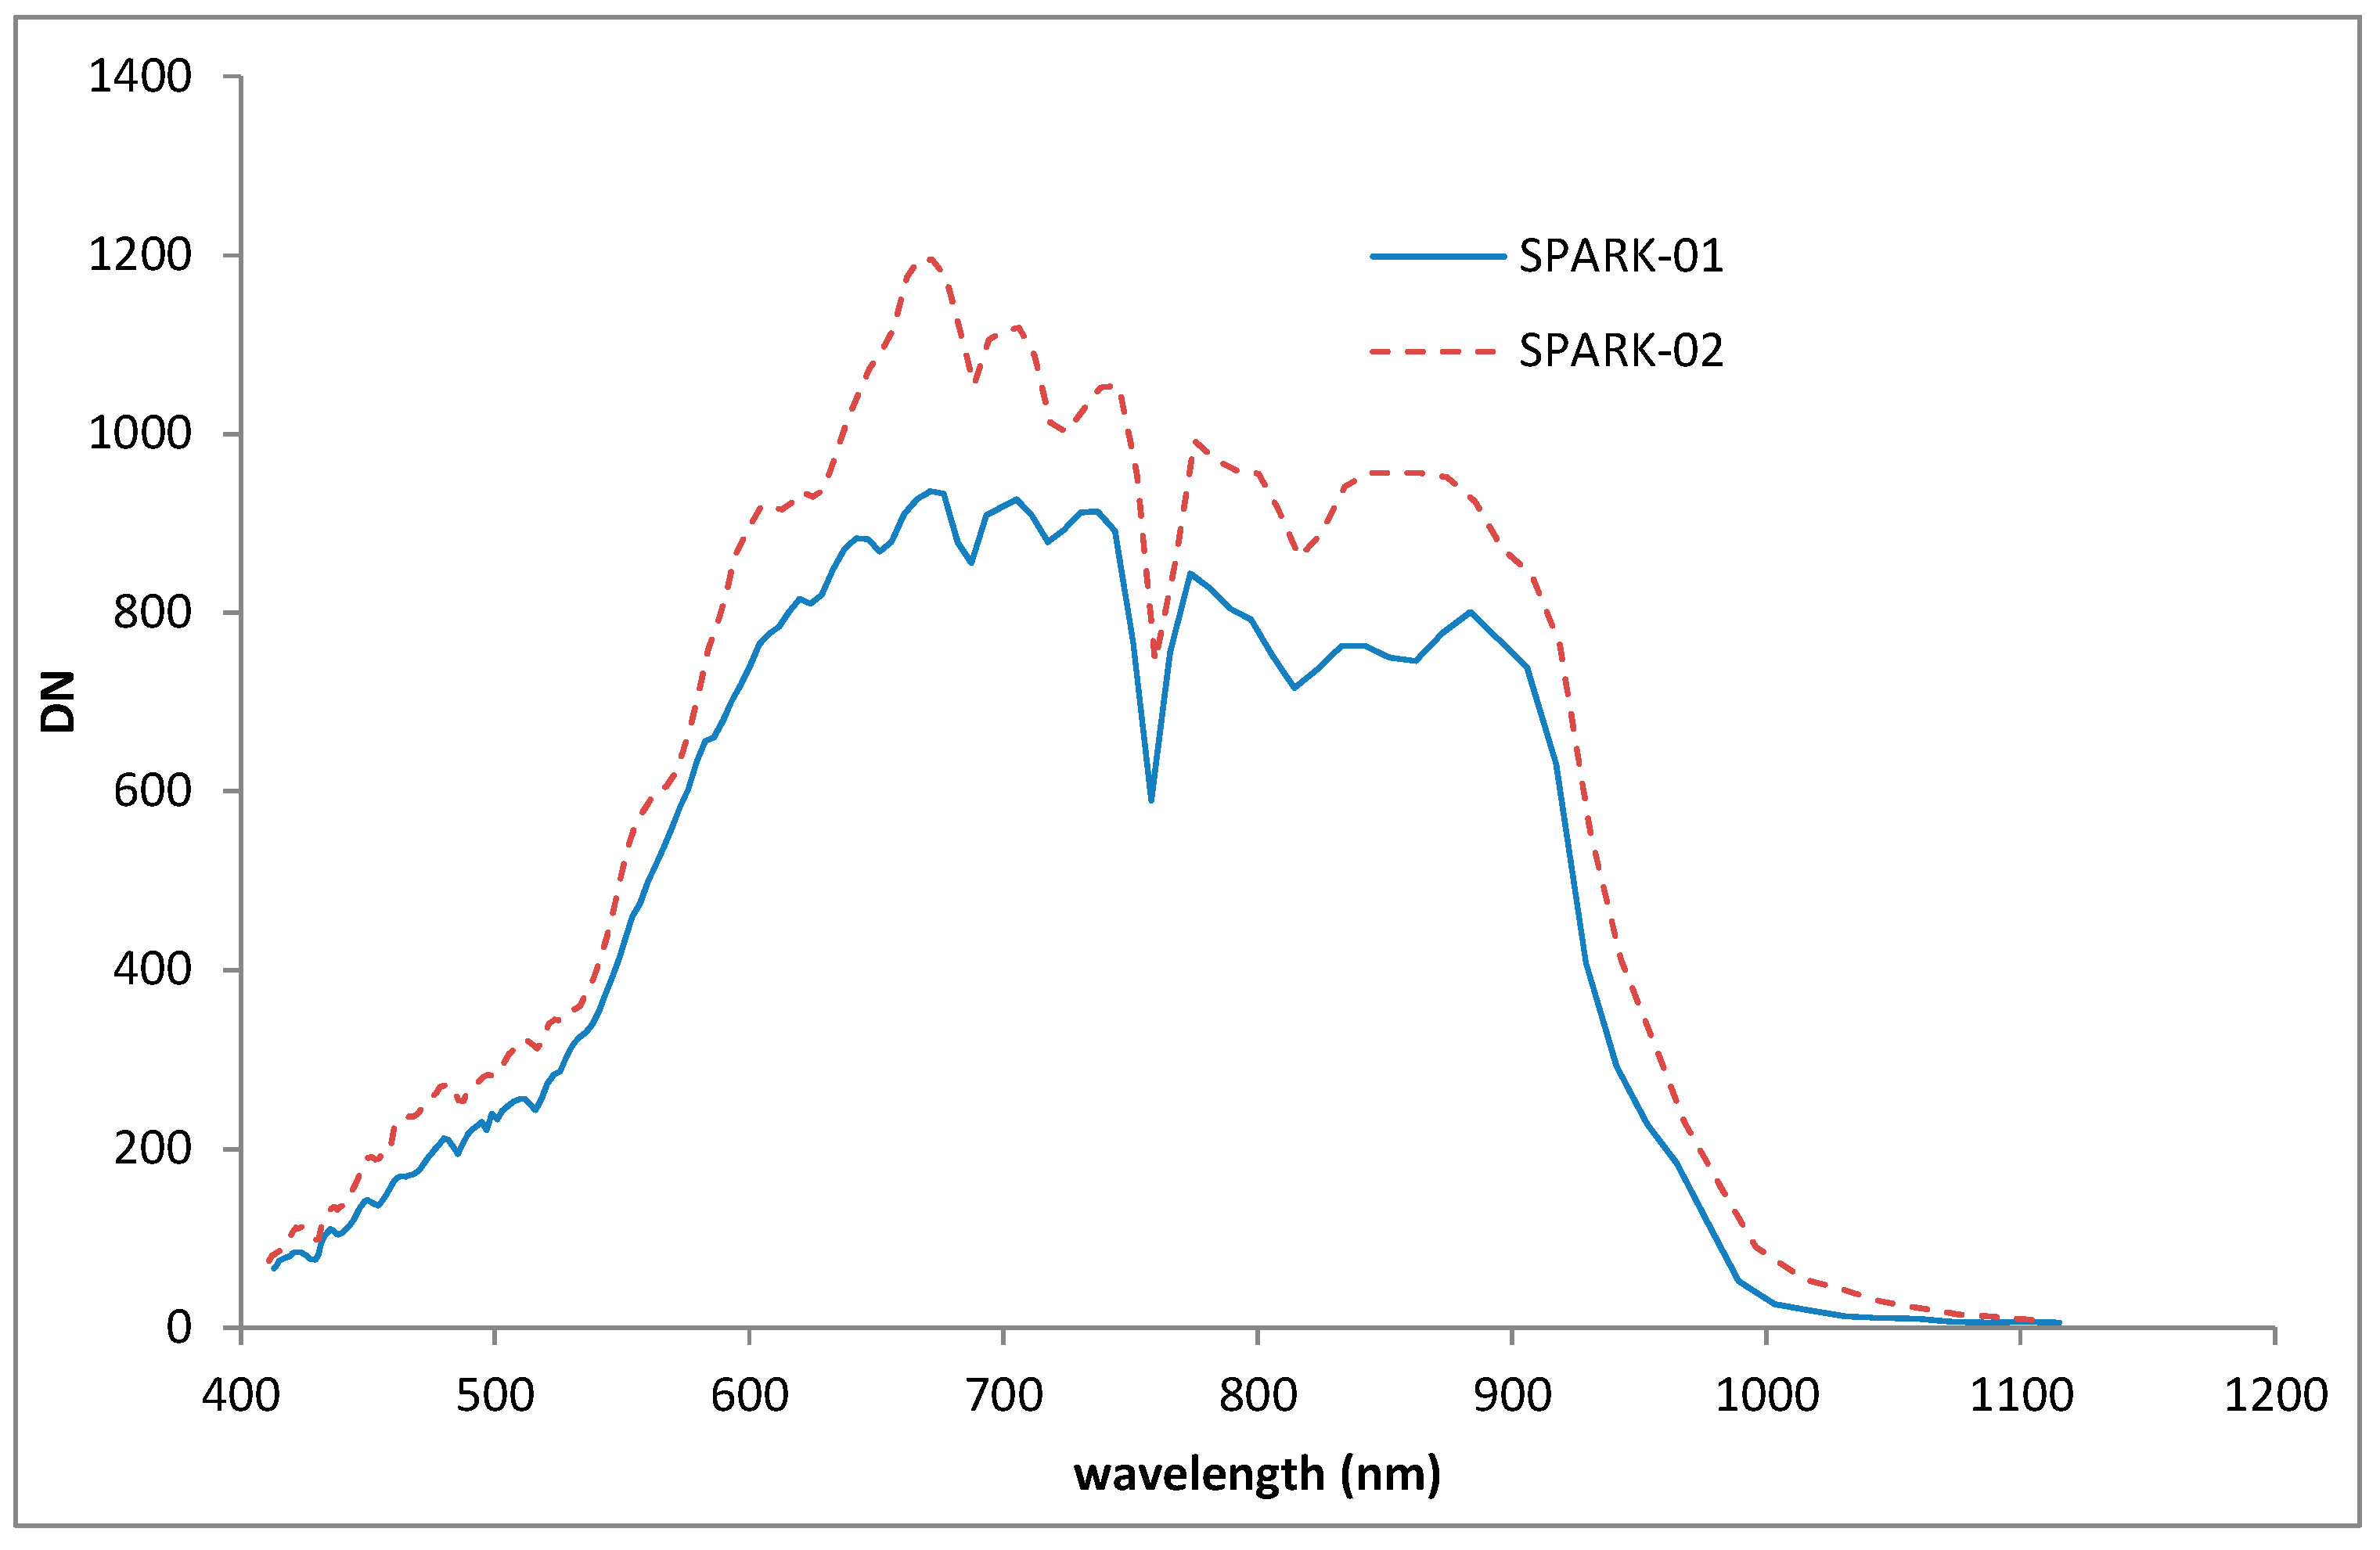
Figure 12.
DN curves from SPARK-01 and -02 at the Dunhuang calibration site, averaged over 6 × 6 pixels.
Figure 12.
DN curves from SPARK-01 and -02 at the Dunhuang calibration site, averaged over 6 × 6 pixels.
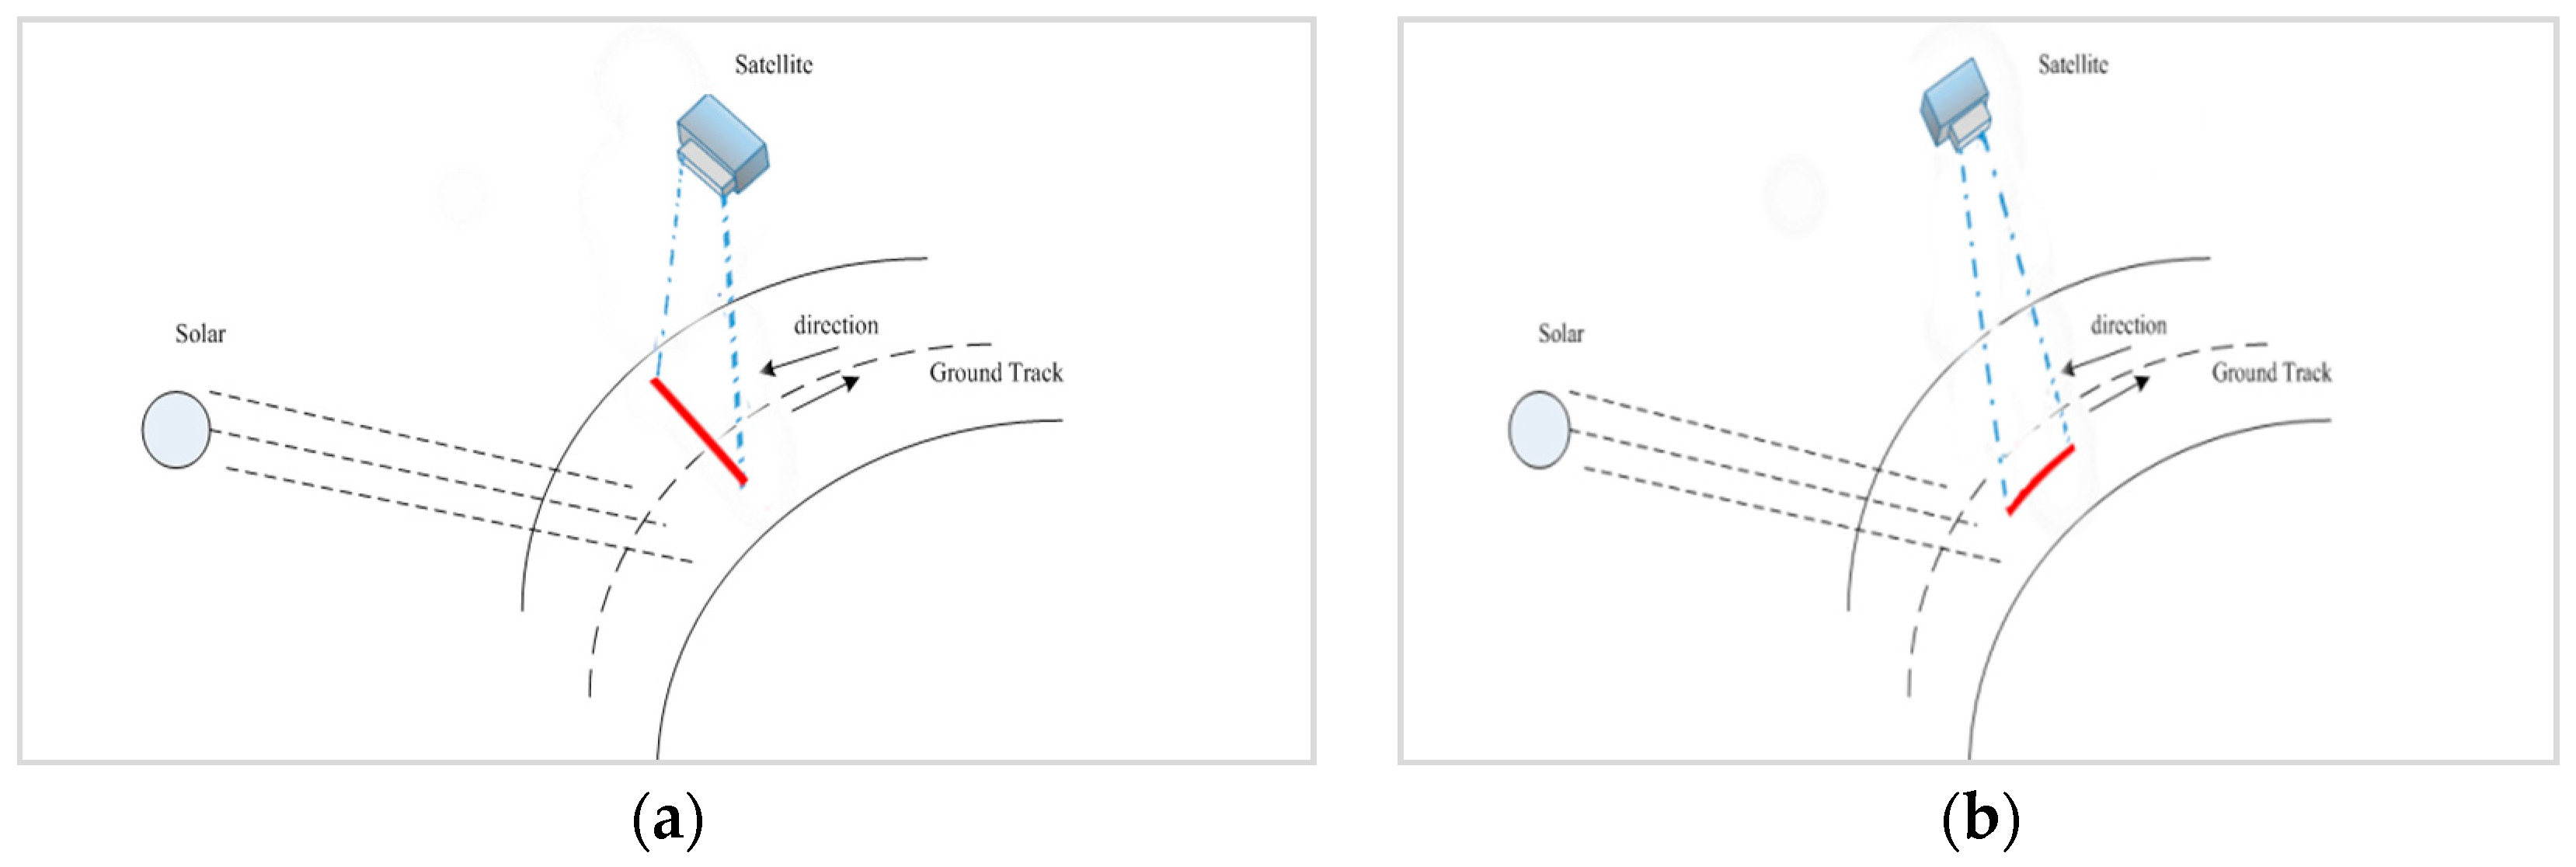
Figure 13.
Schematics of (a) normal and (b) 90° yaw imaging methods in the SPARK satellite.
Figure 13.
Schematics of (a) normal and (b) 90° yaw imaging methods in the SPARK satellite.
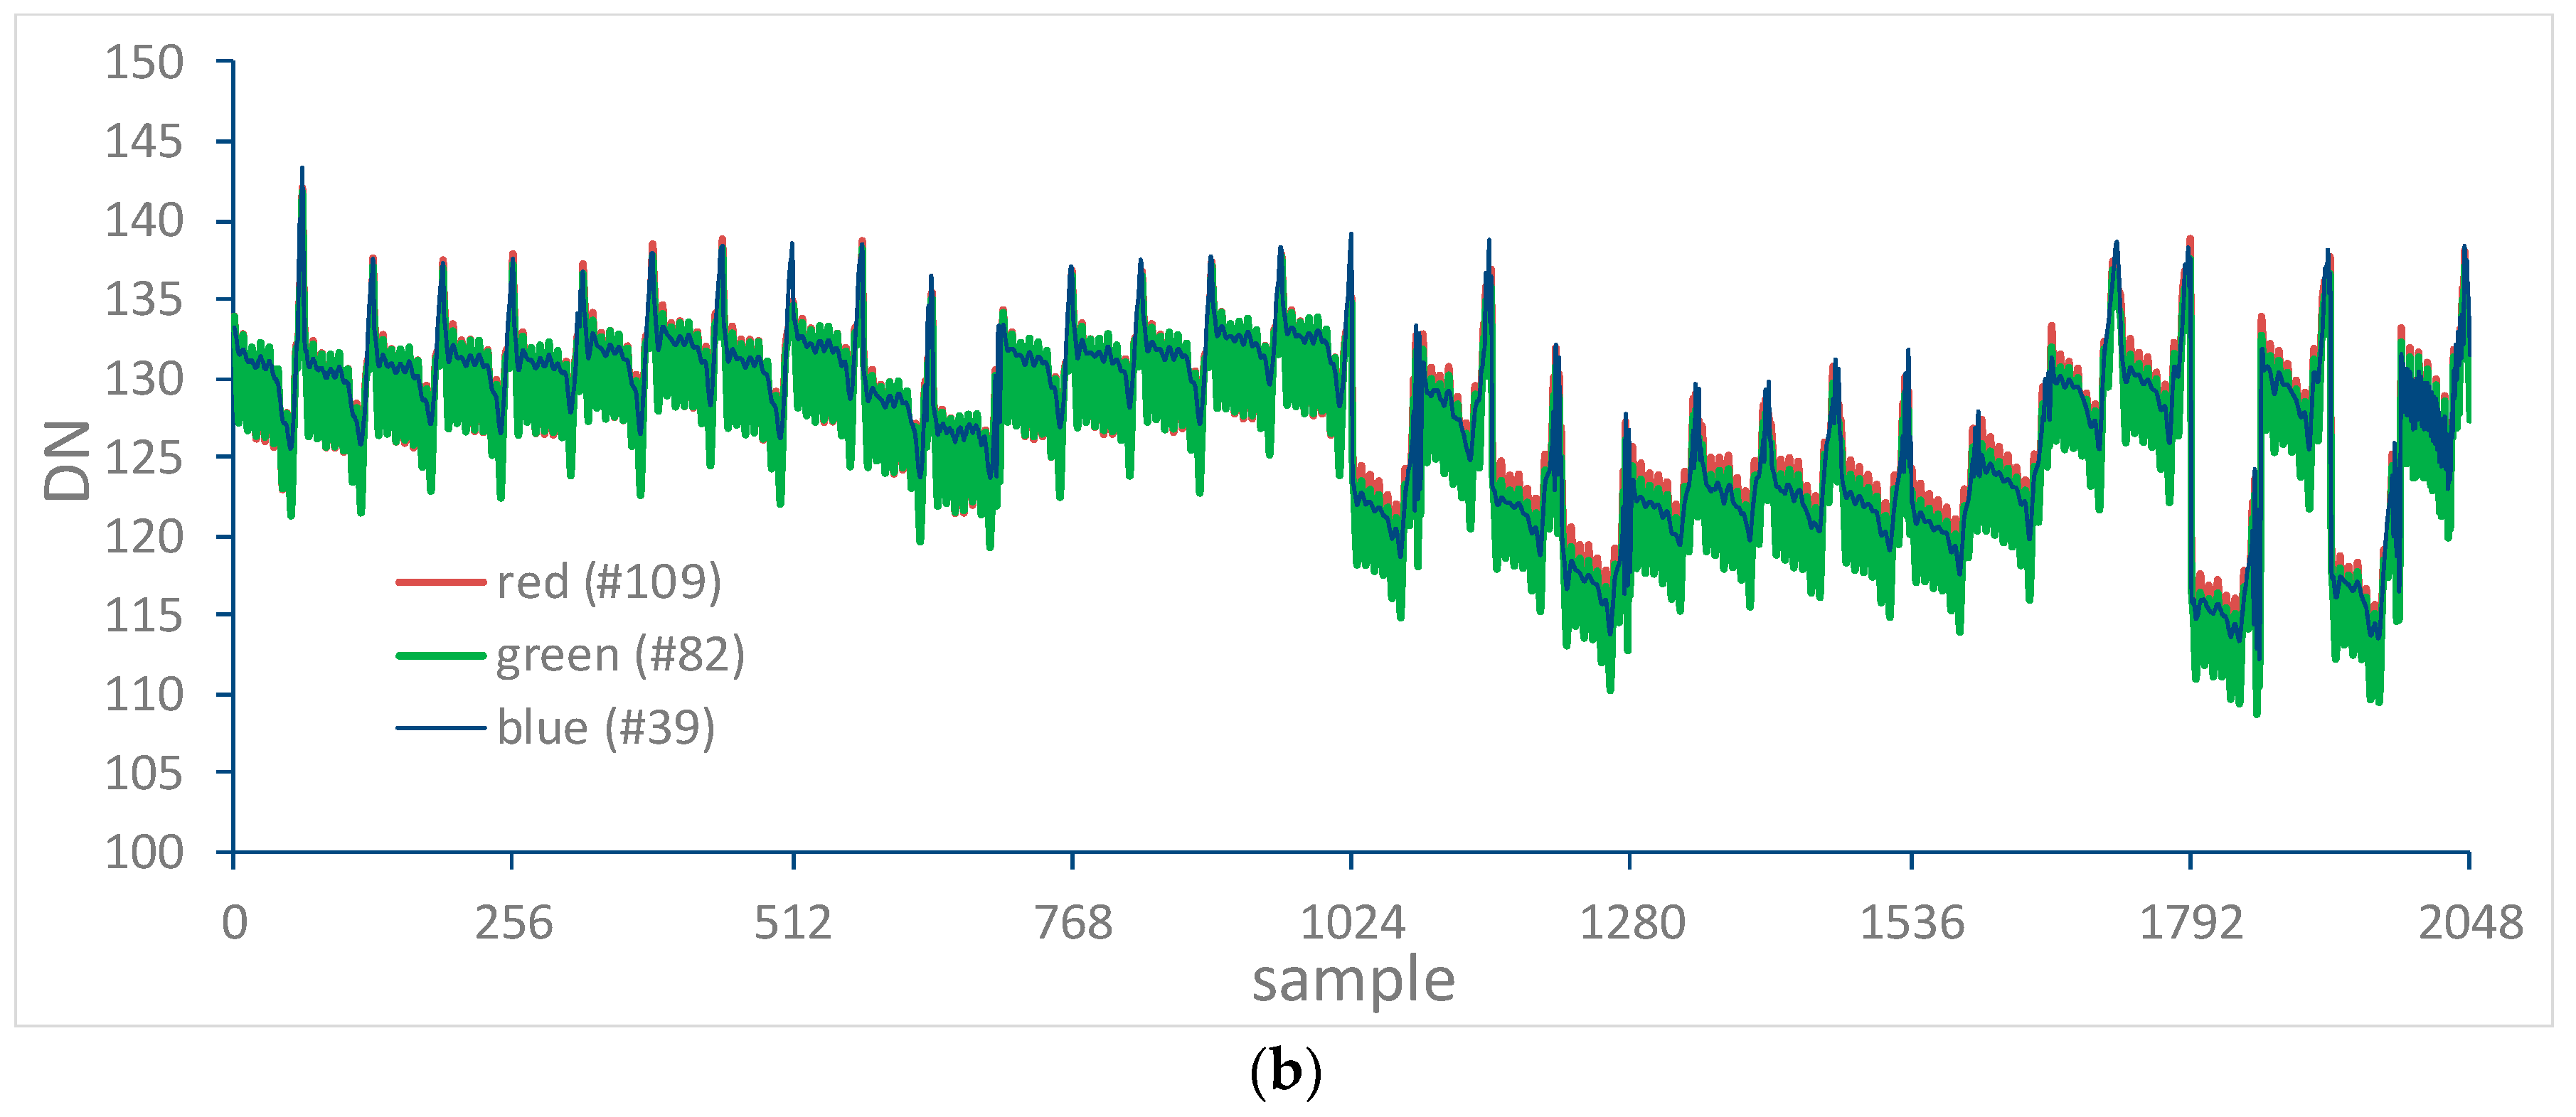
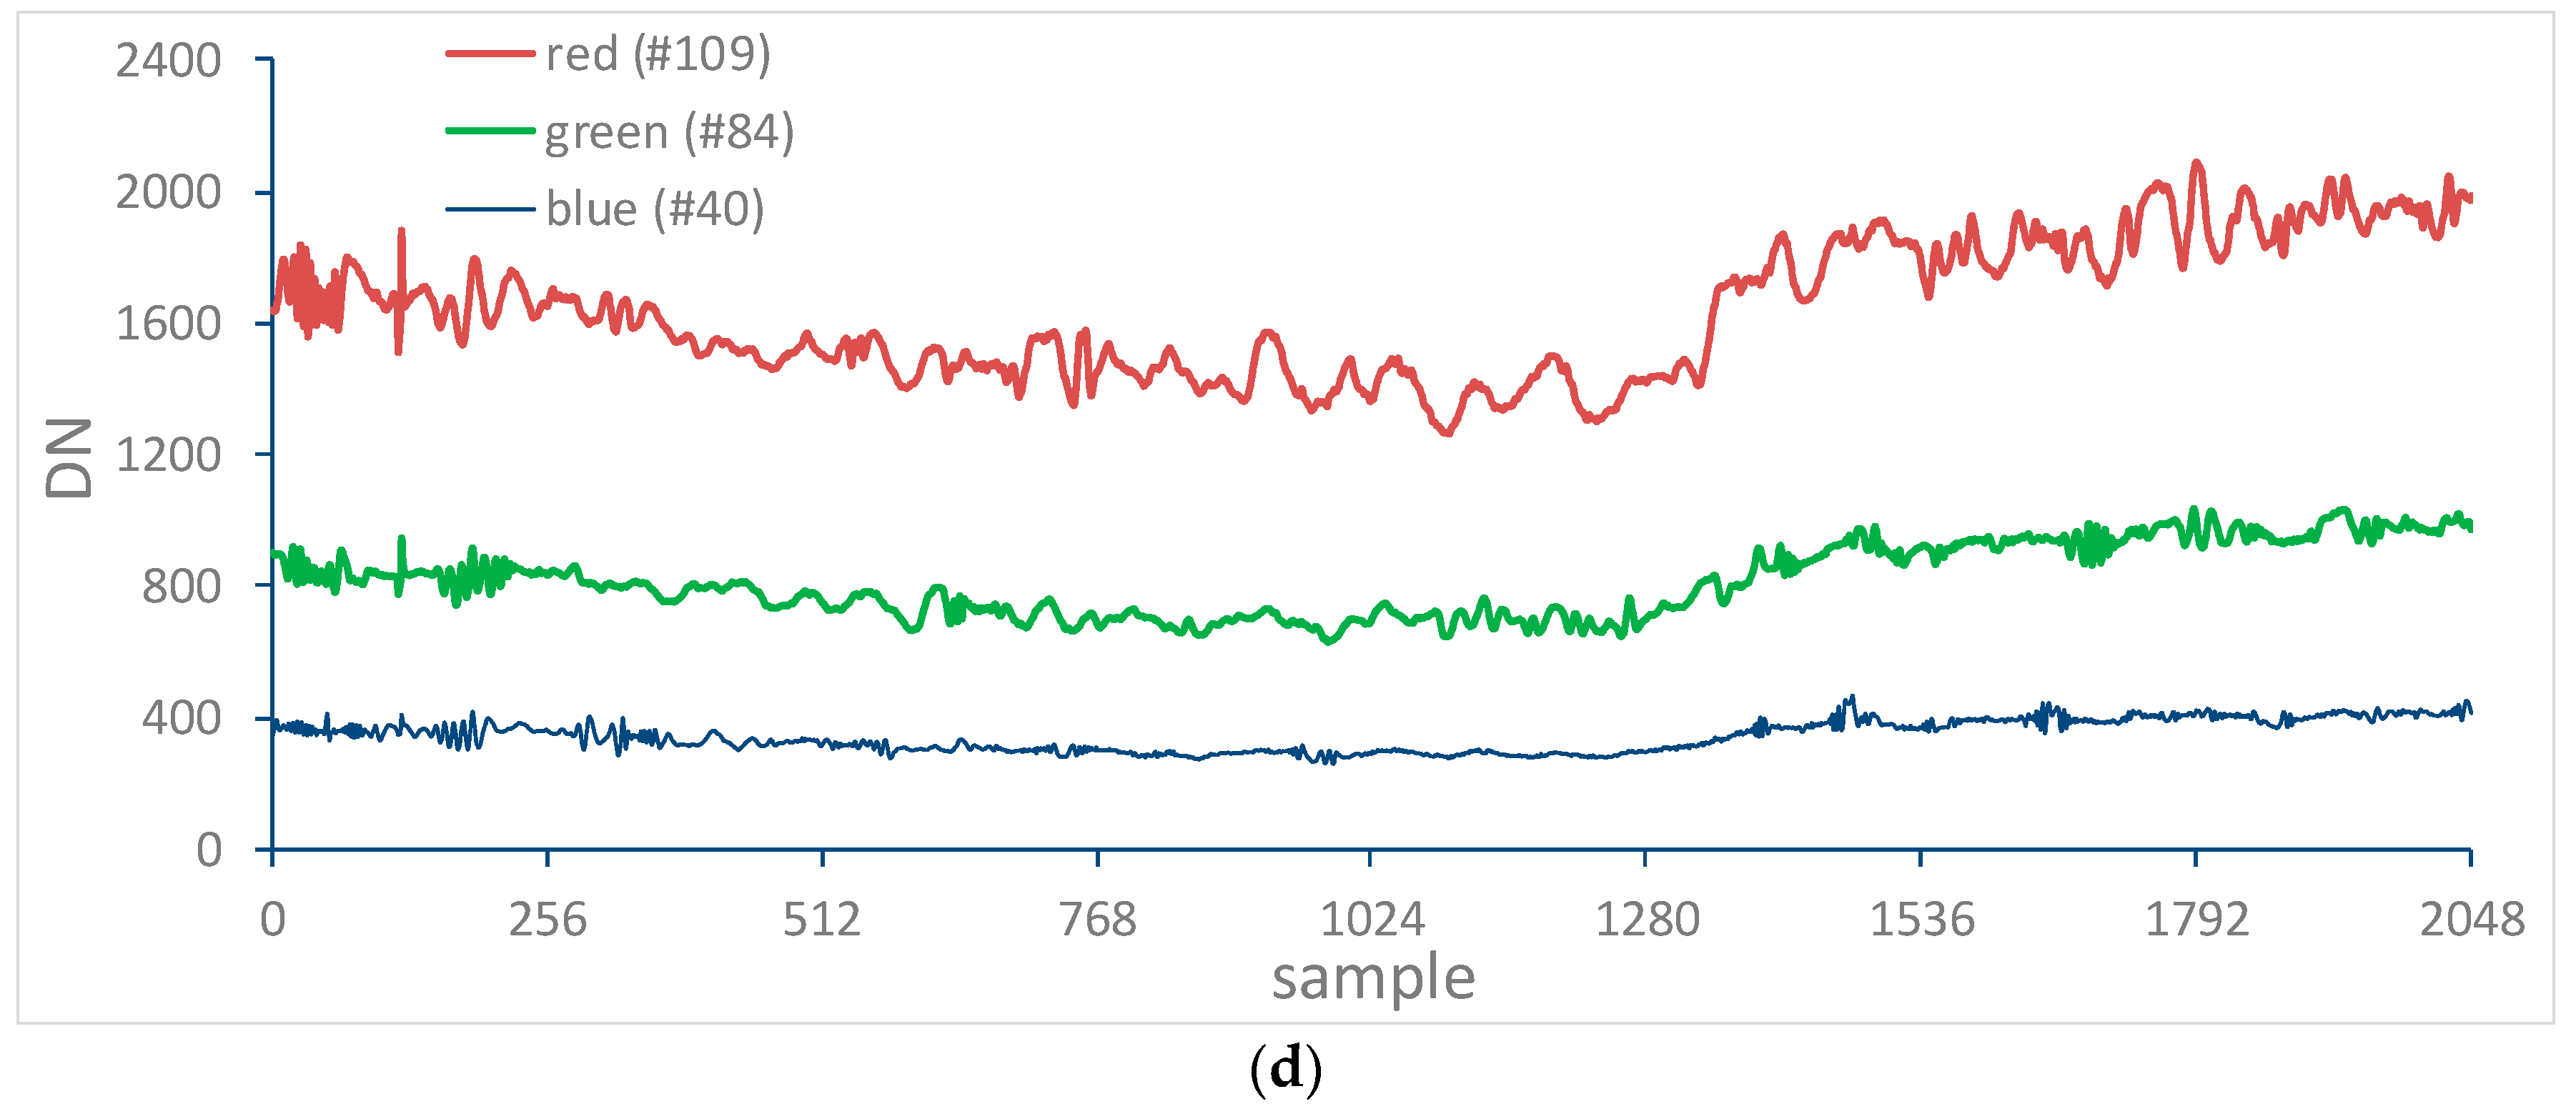
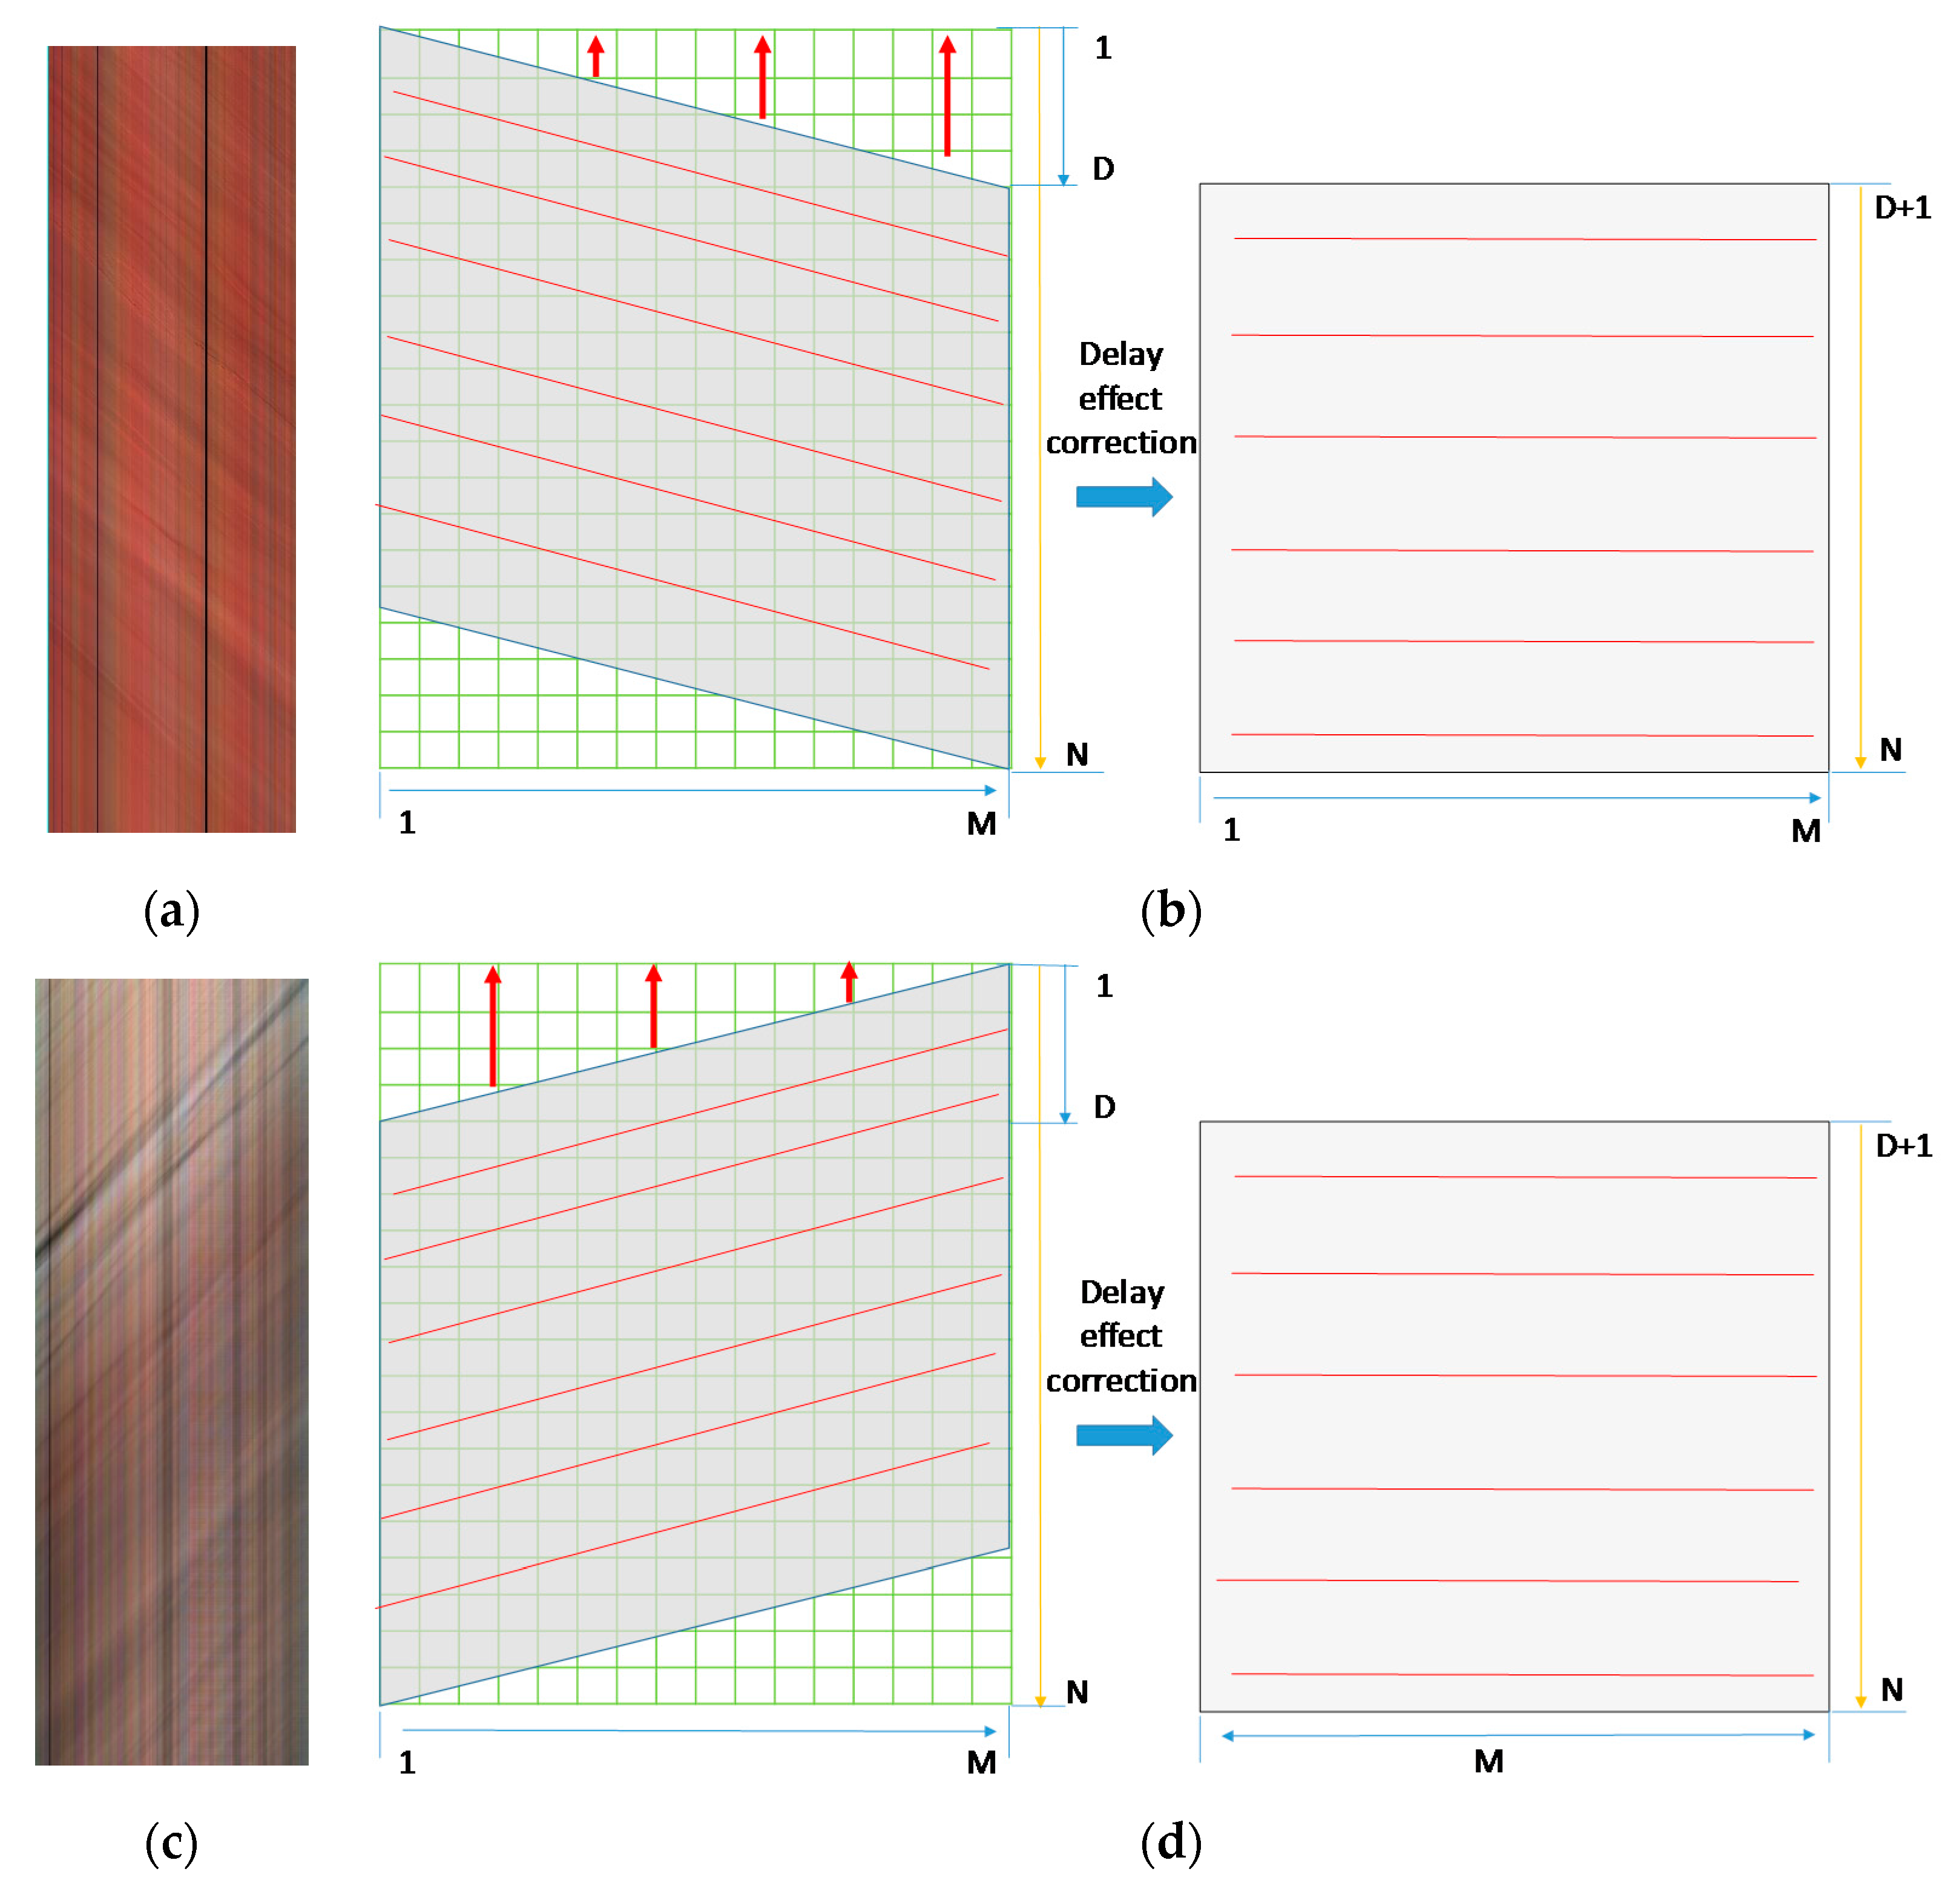
Figure 14.
90° yaw images and delay lines in different columns, including the (a) subset image and (b) delay effect correction scheme for SPARK-01 satellite images and the (c) subset image and (d) delay effect correction scheme for SPARK-02 satellite images.
Figure 14.
90° yaw images and delay lines in different columns, including the (a) subset image and (b) delay effect correction scheme for SPARK-01 satellite images and the (c) subset image and (d) delay effect correction scheme for SPARK-02 satellite images.
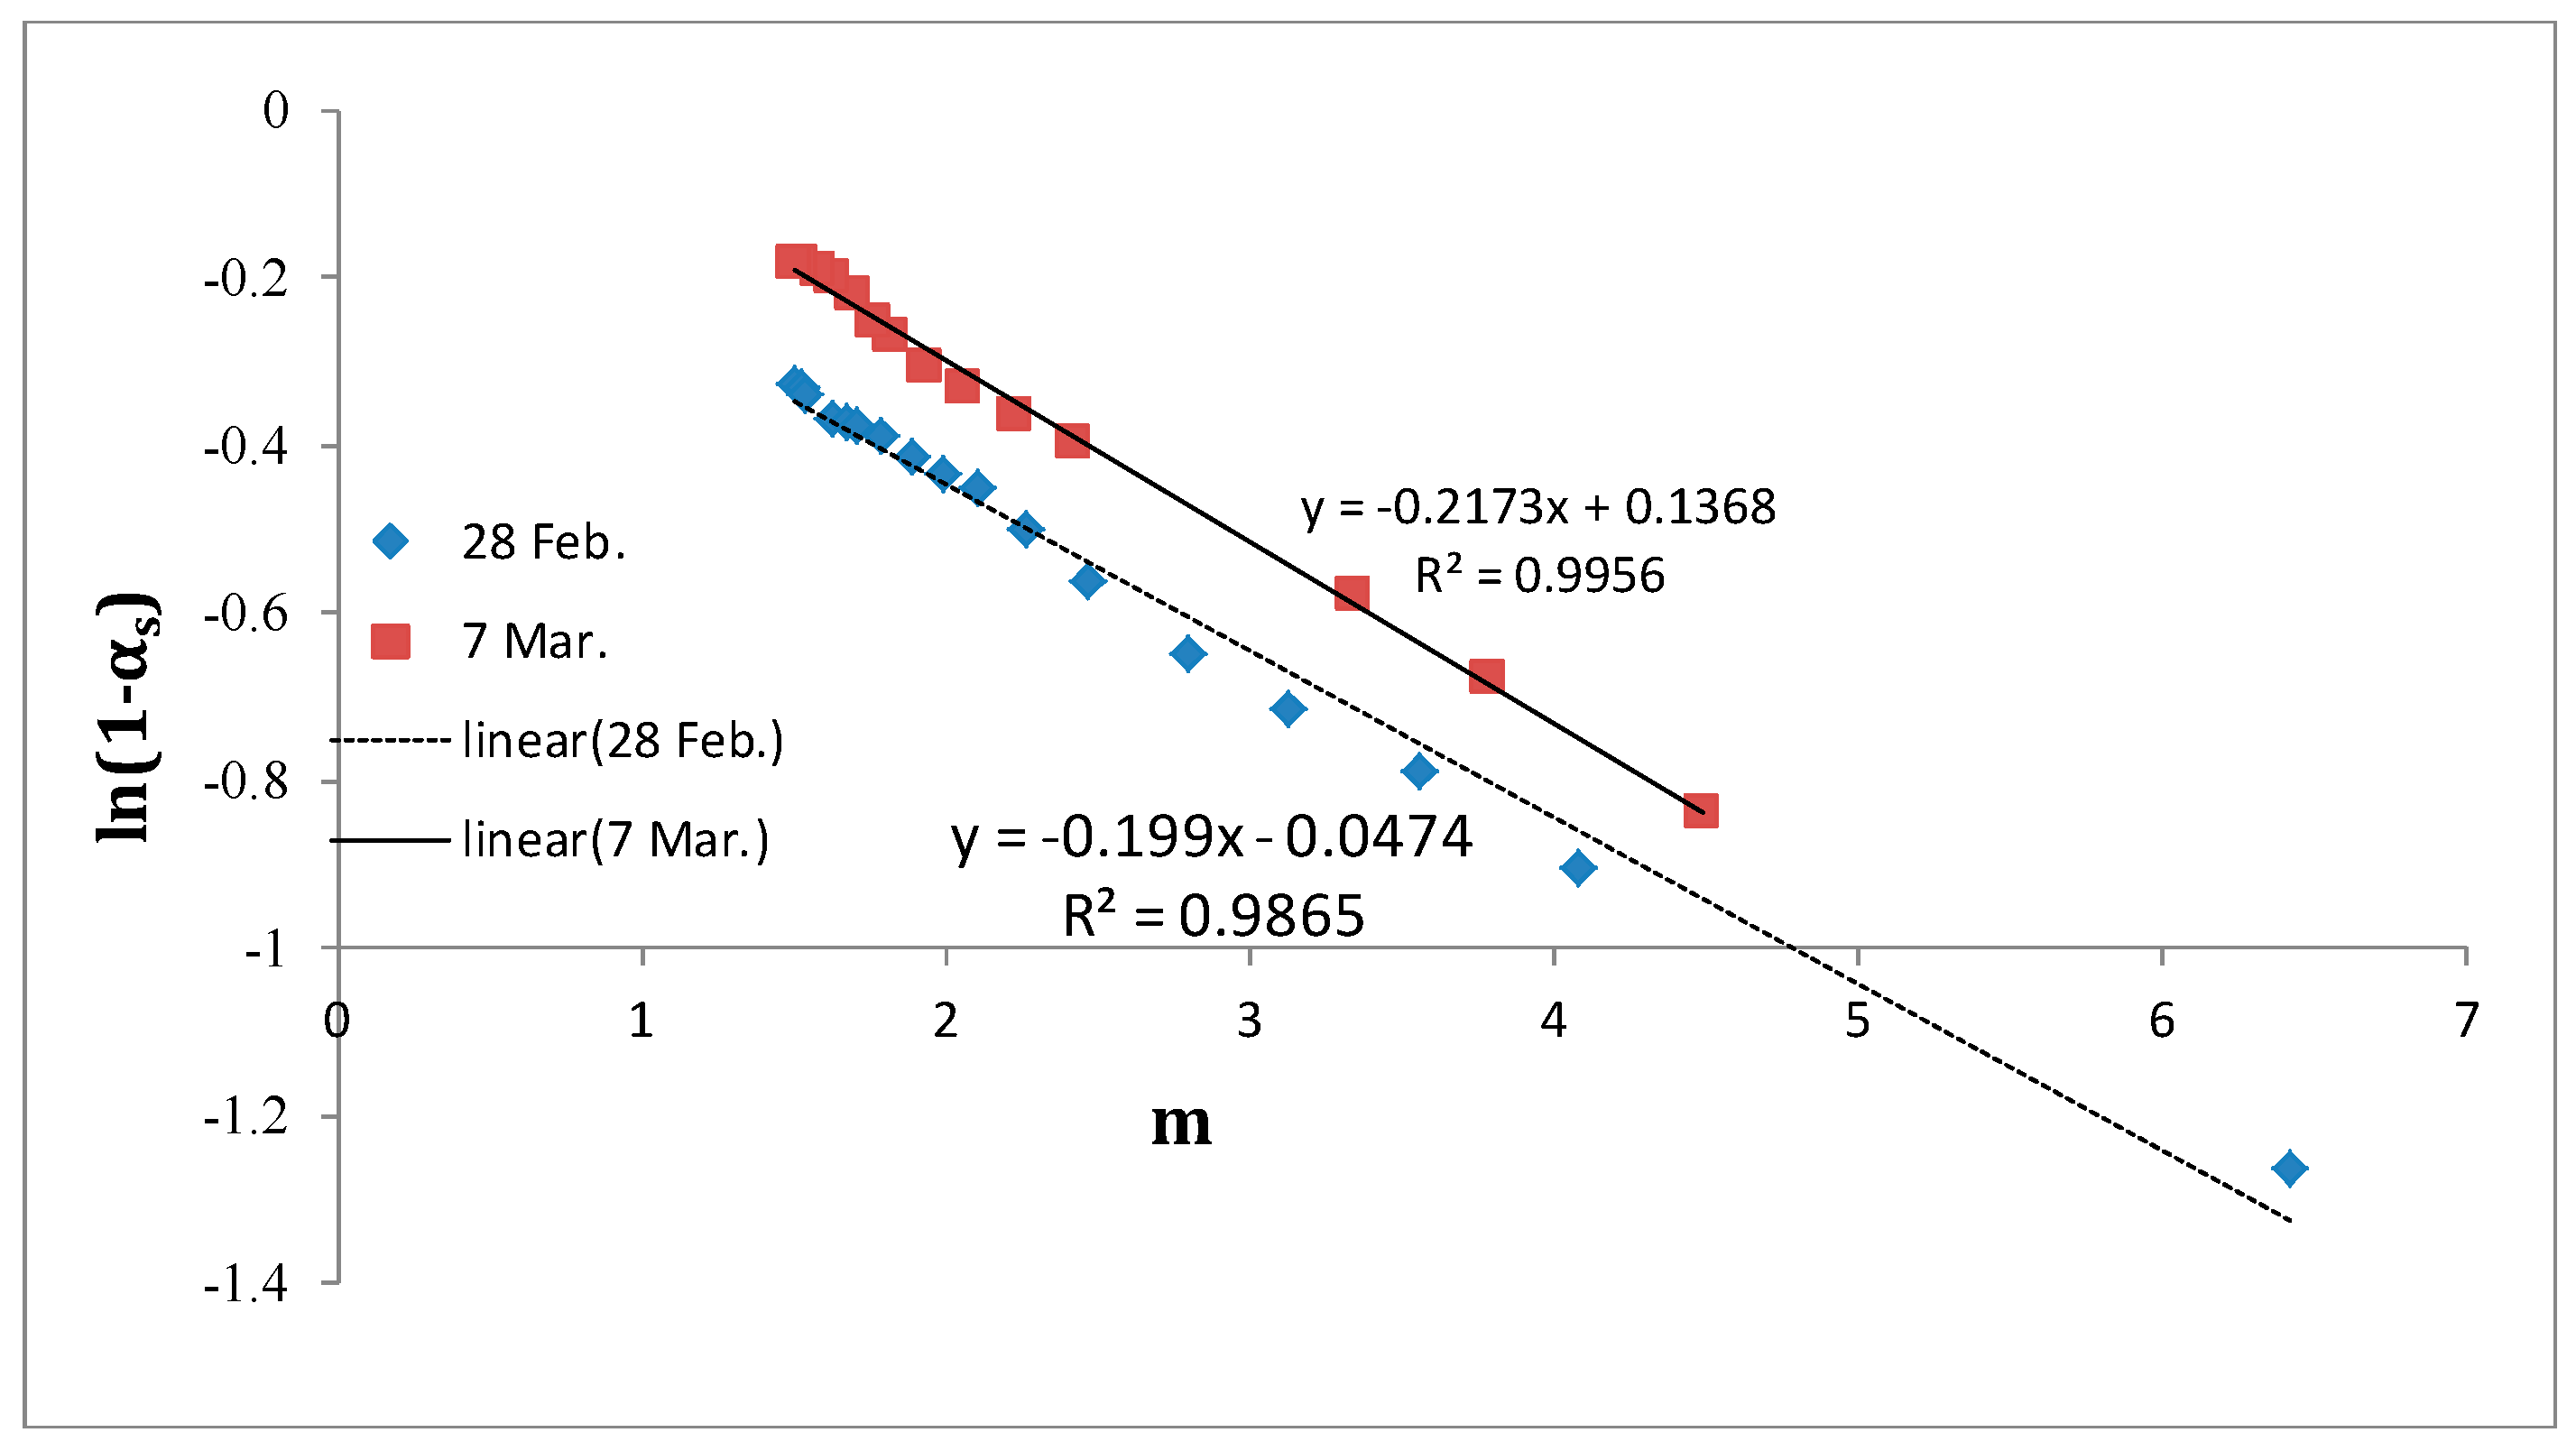
Figure 15.
A scatter plot of ln(1 − ) versus m at 549.89 nm.
Figure 15.
A scatter plot of ln(1 − ) versus m at 549.89 nm.
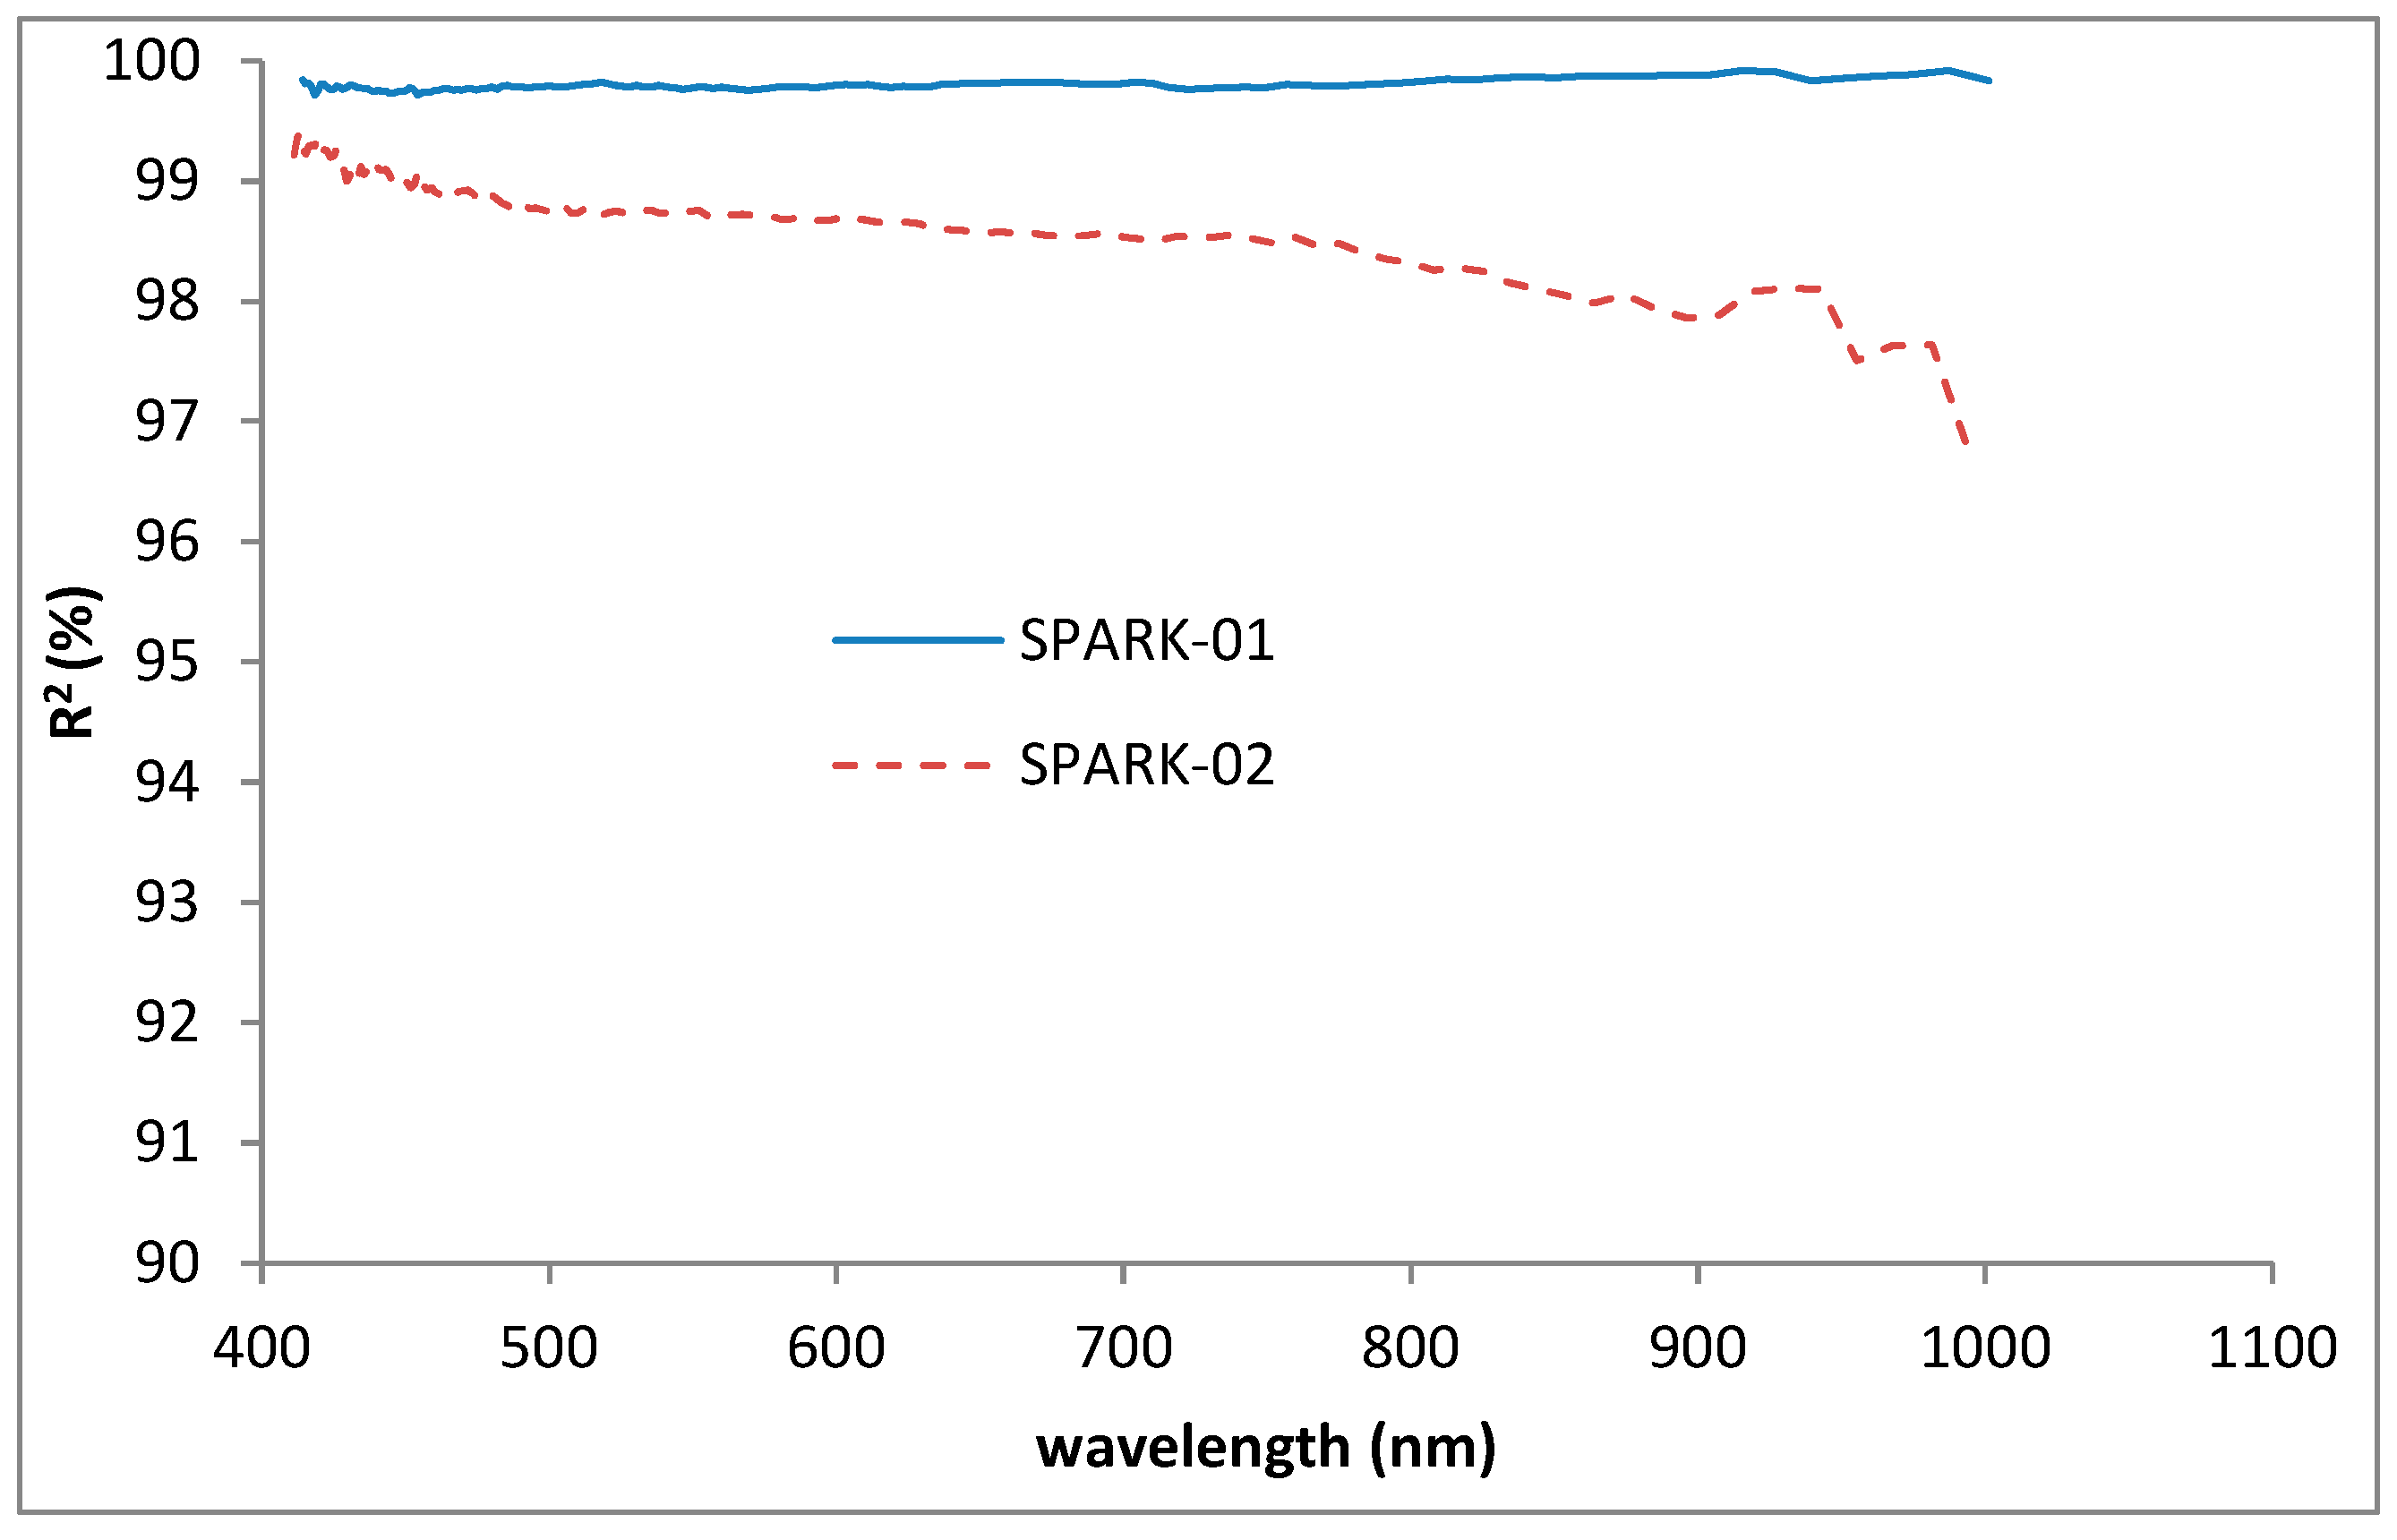
Figure 16.
Goodness-of-fit statistics for diffuse-to-global irradiance ratio measurements according to Equation (8).
Figure 16.
Goodness-of-fit statistics for diffuse-to-global irradiance ratio measurements according to Equation (8).
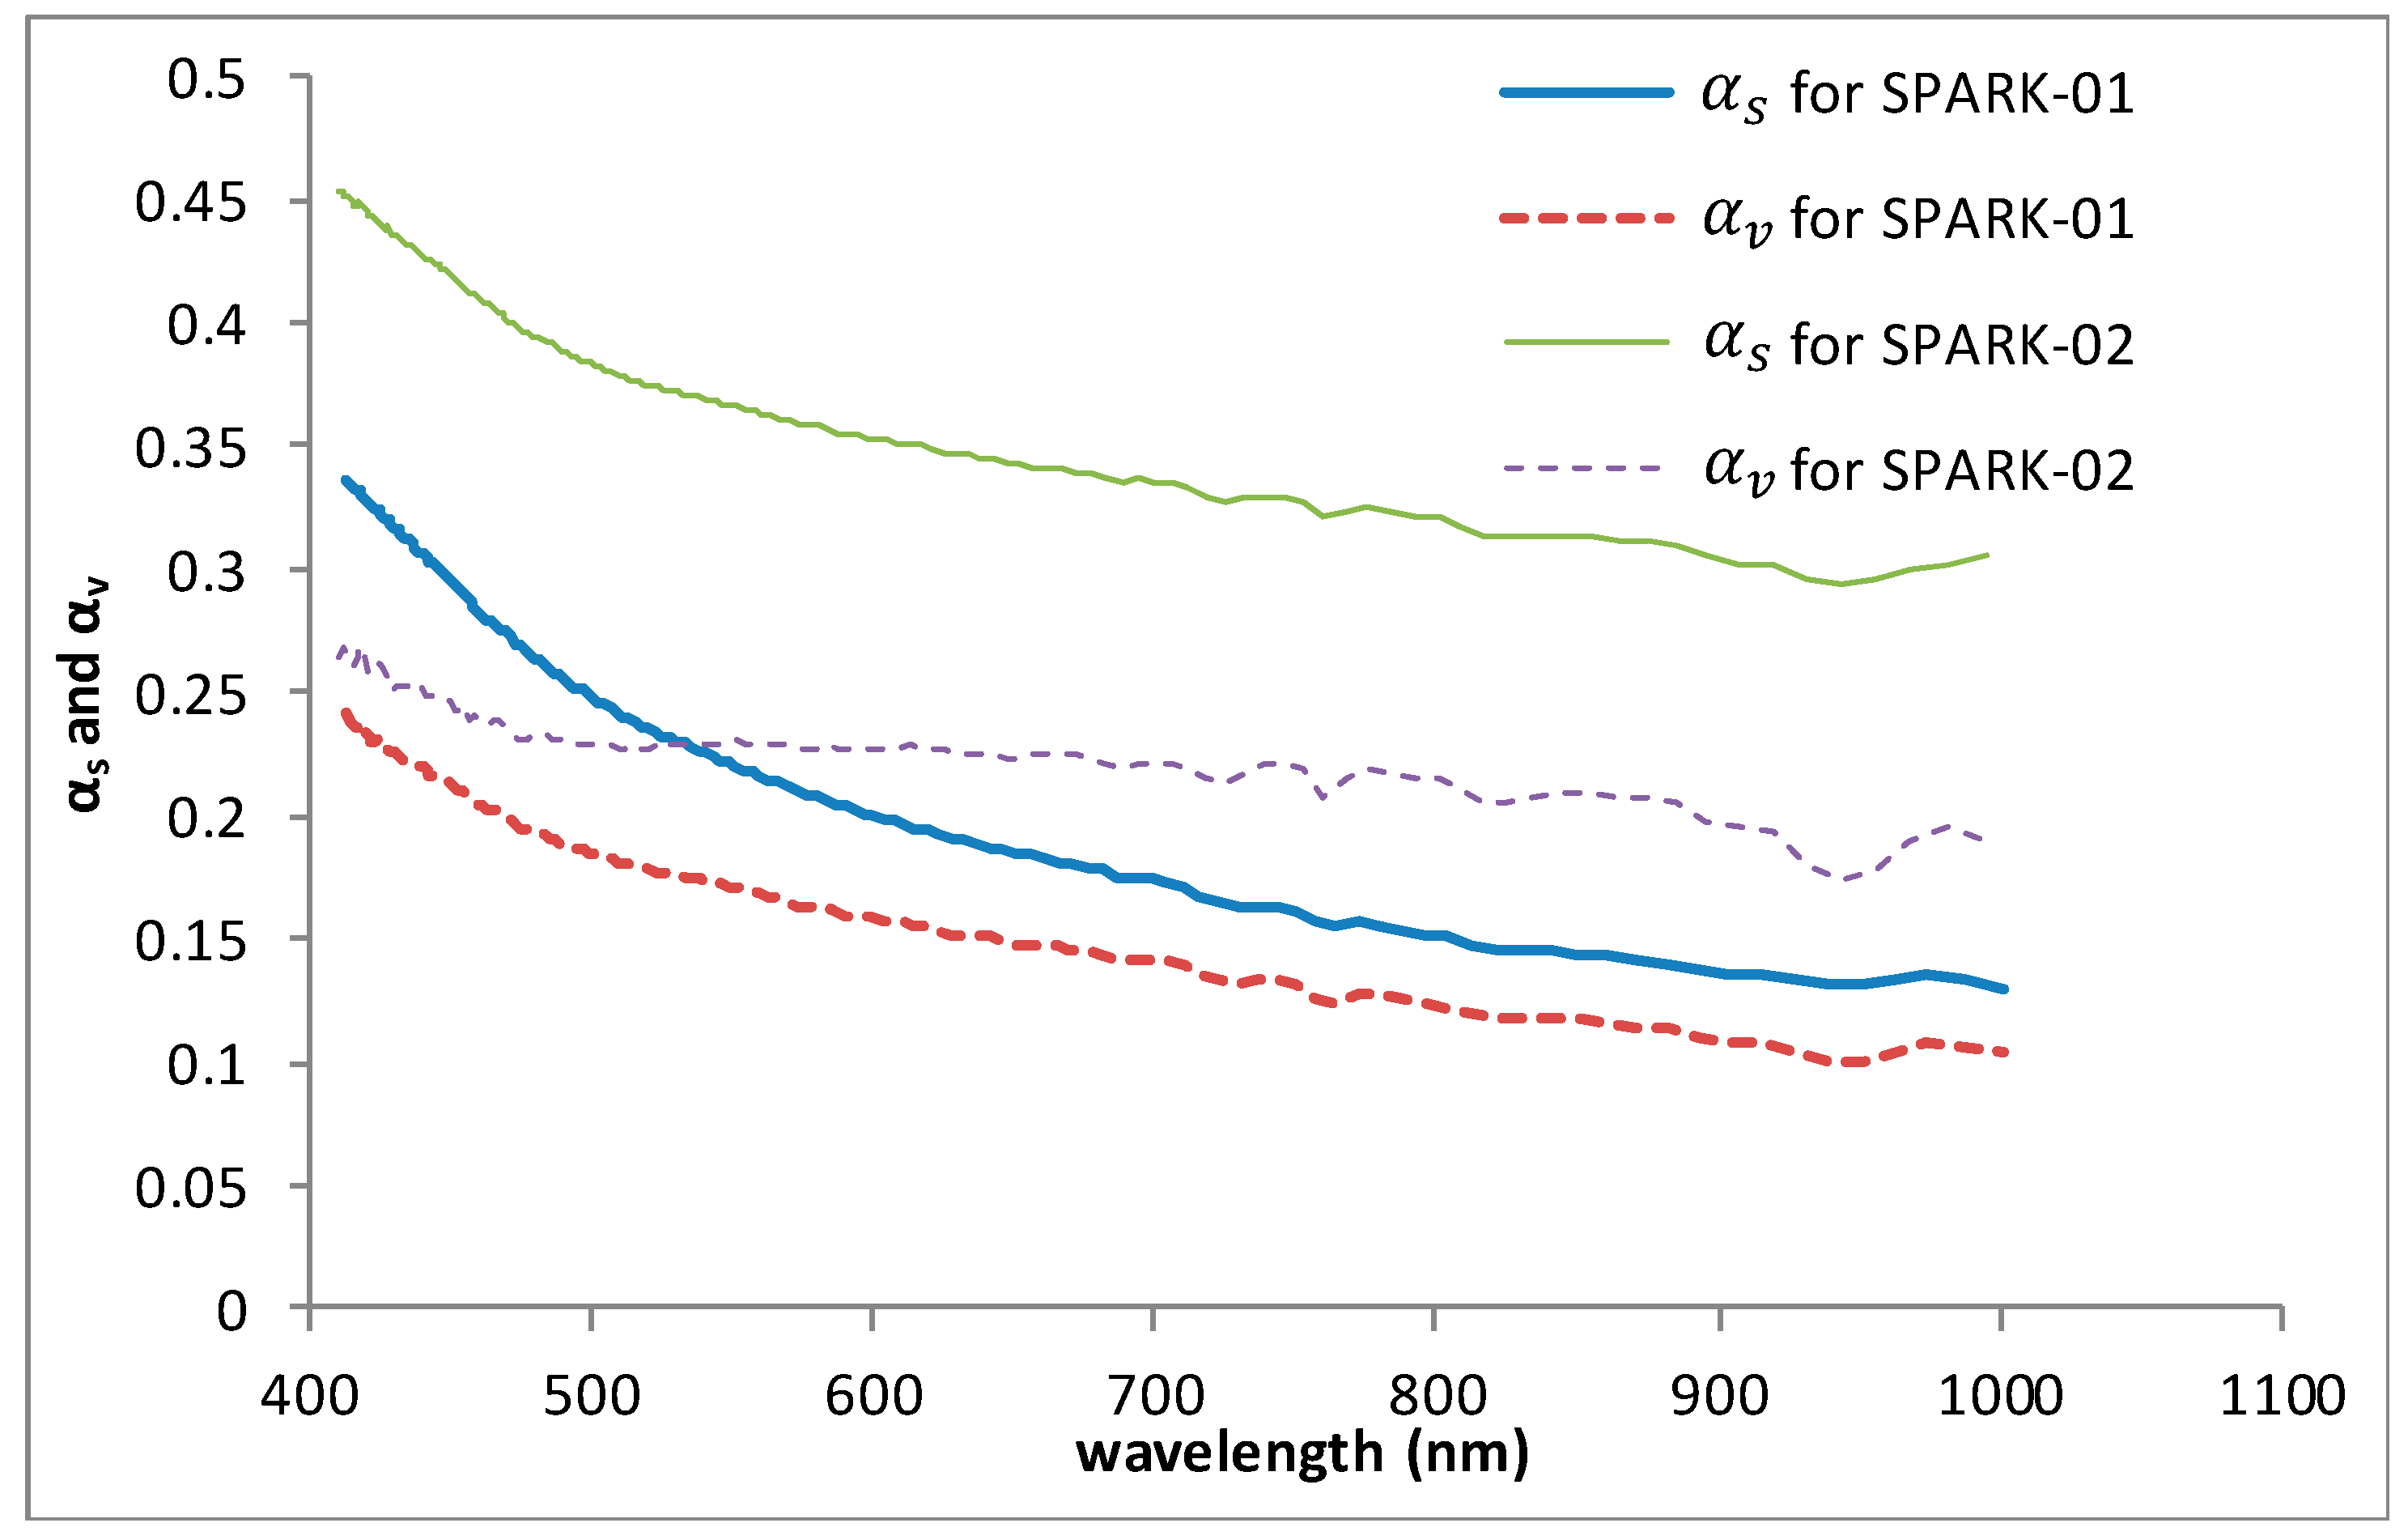
Figure 17.
Diffuse-to-global irradiance ratio extrapolated and interpolated to the solar direction () and viewing direction () during the satellite overpasses.
Figure 17.
Diffuse-to-global irradiance ratio extrapolated and interpolated to the solar direction () and viewing direction () during the satellite overpasses.
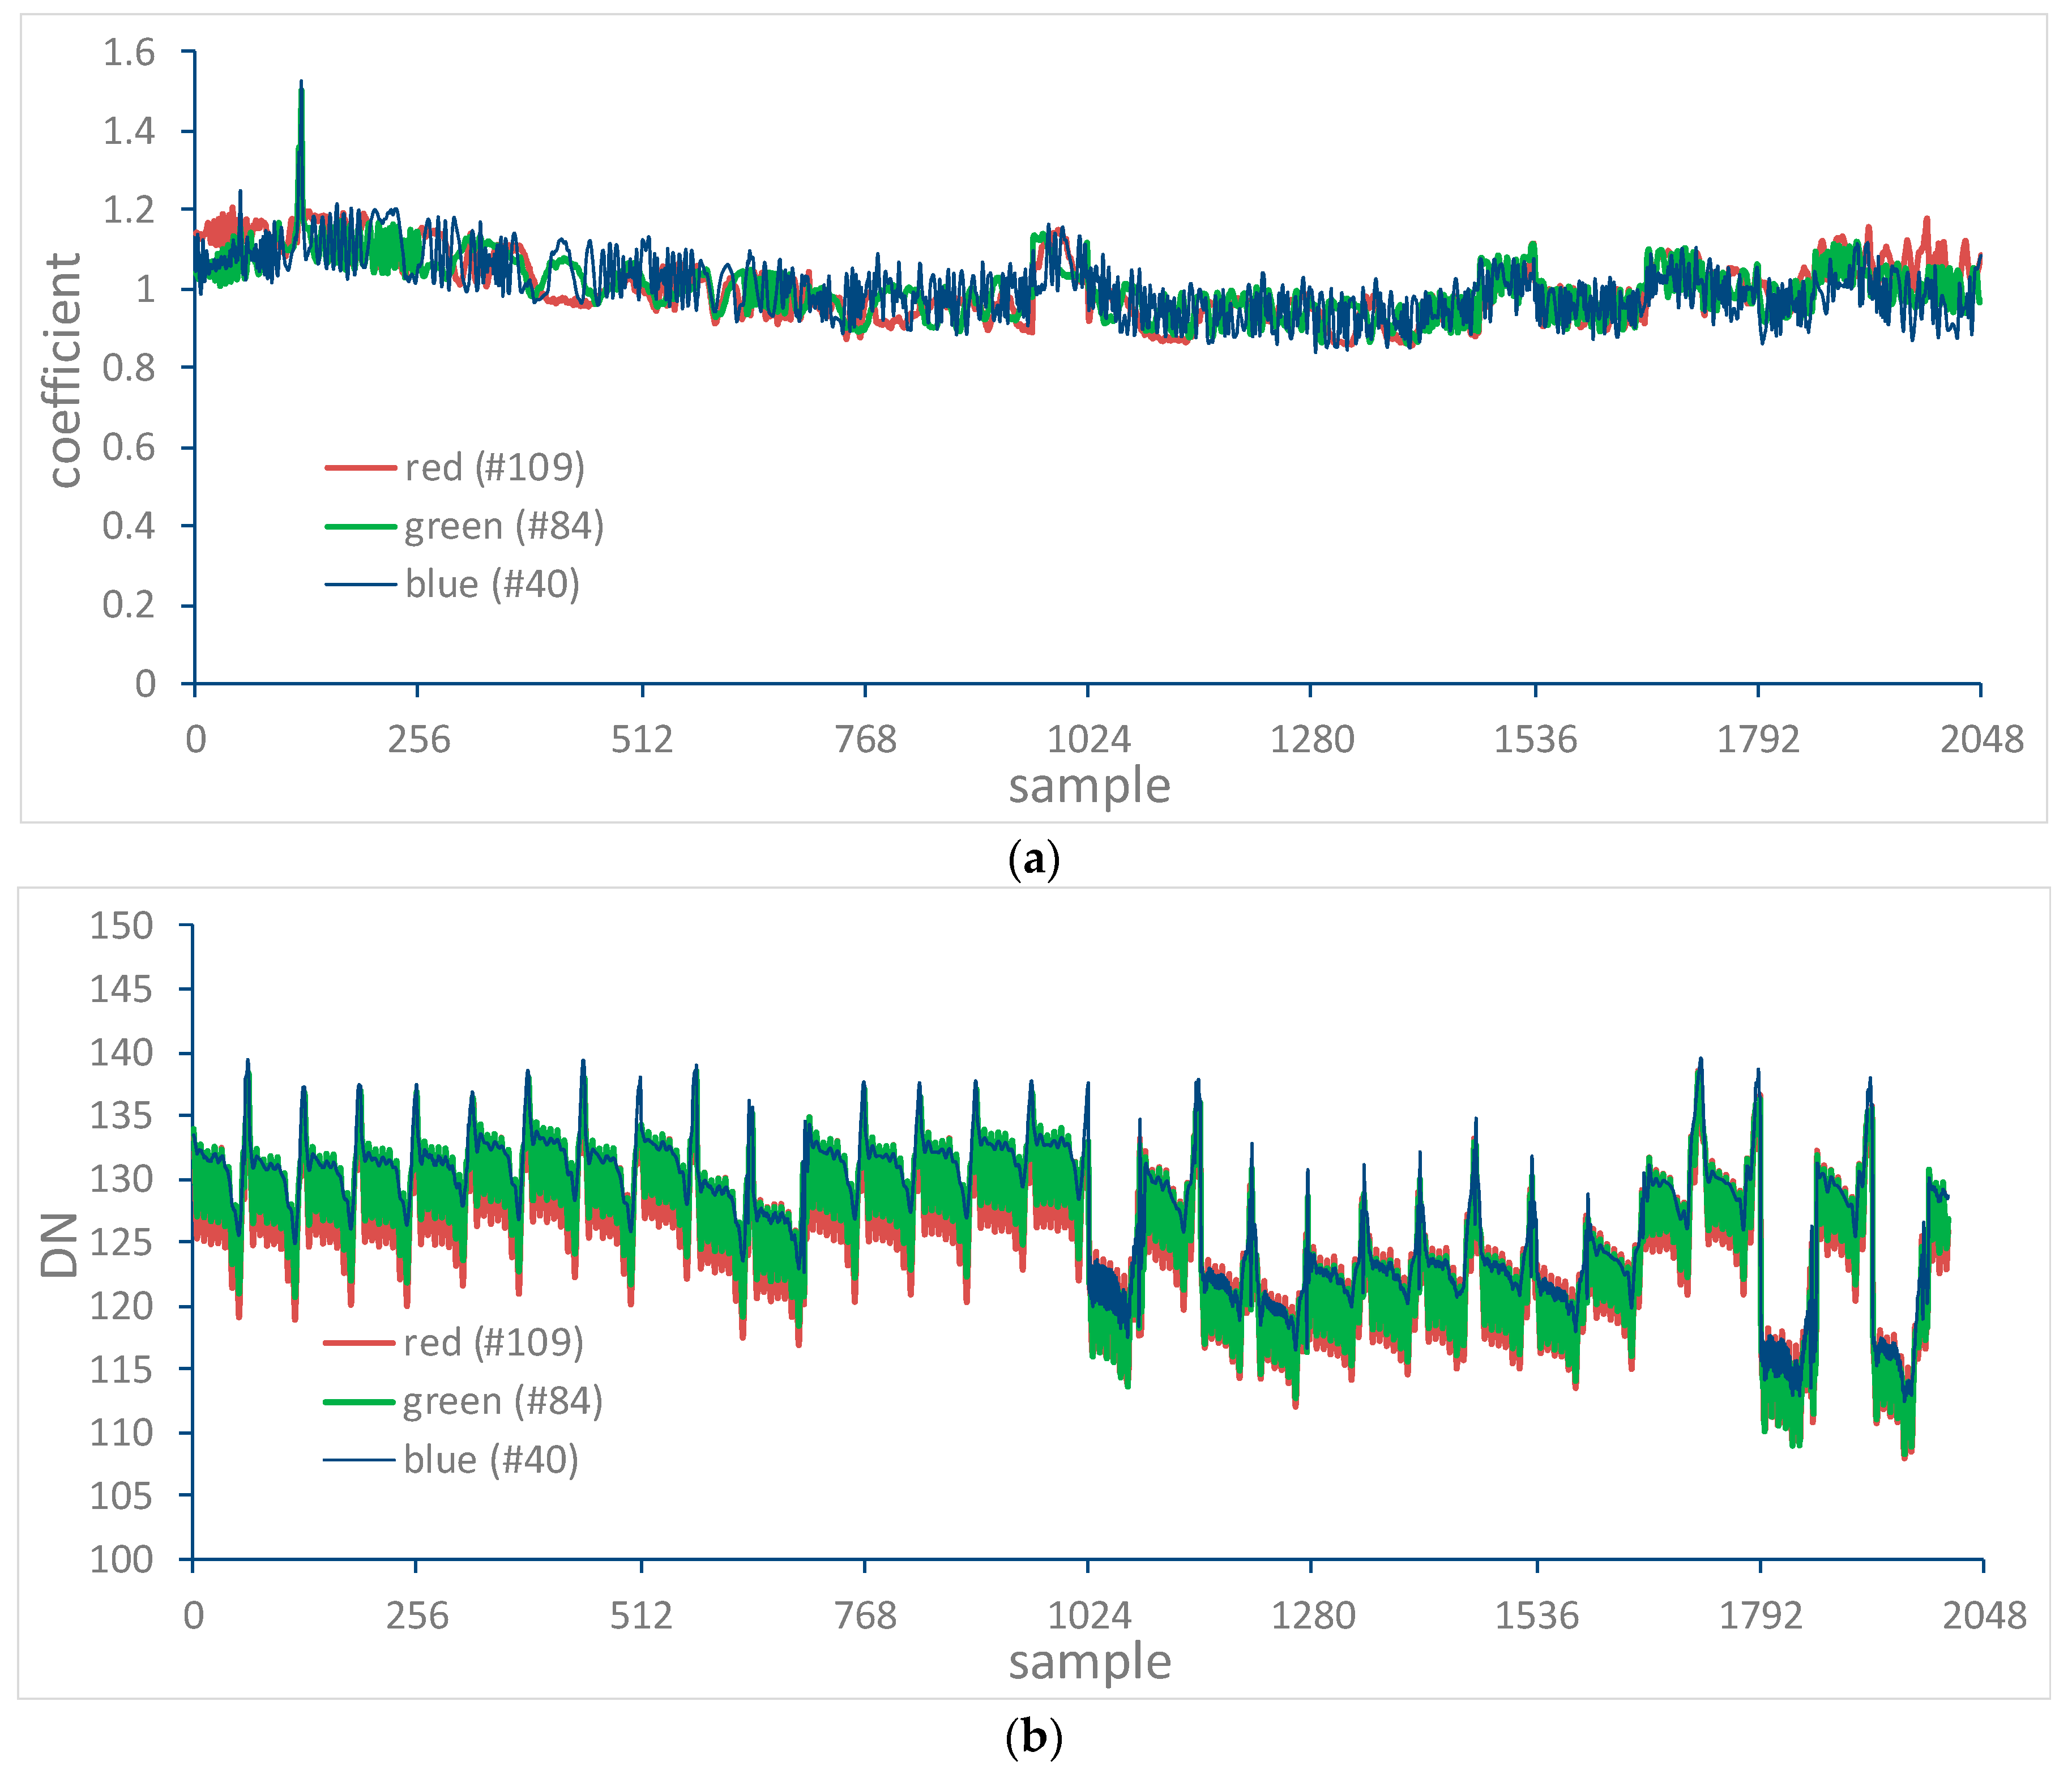
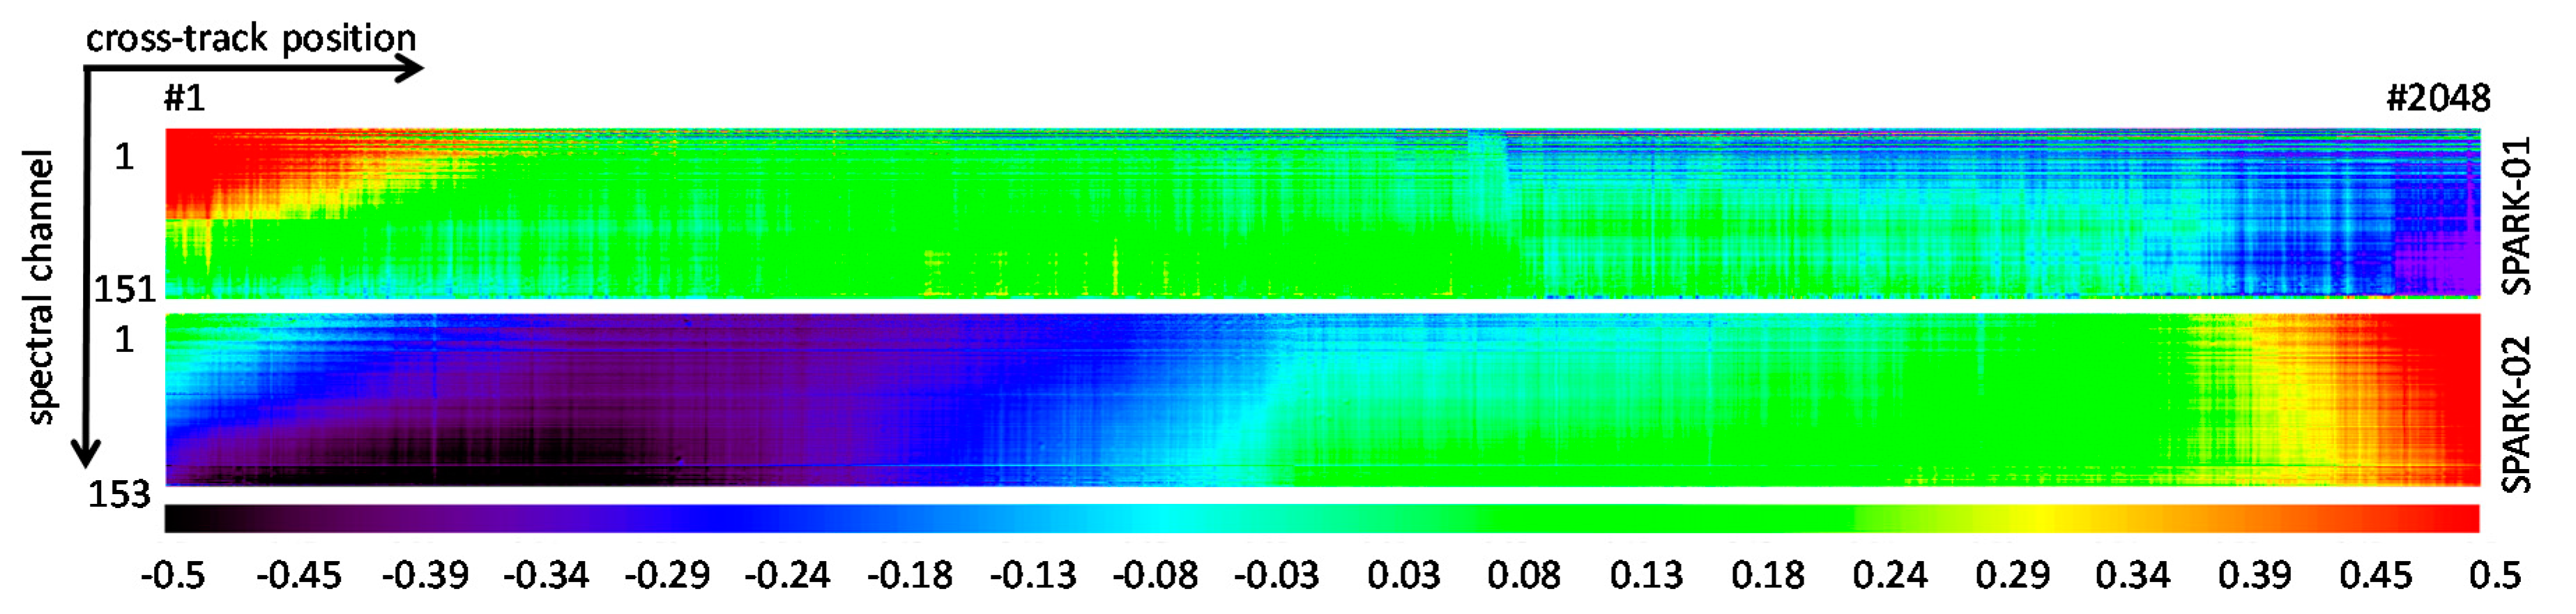
Figure 18.
Relative radiometric correction coefficients for SPARK-01 satellite images at 650.4 nm, 551.5 nm, and 461.7 nm showing (a) gain curves (non-uniform correction coefficients) and (b) offset curves (dark current).
Figure 18.
Relative radiometric correction coefficients for SPARK-01 satellite images at 650.4 nm, 551.5 nm, and 461.7 nm showing (a) gain curves (non-uniform correction coefficients) and (b) offset curves (dark current).
Figure 19.
Relative radiometric correction coefficients for SPARK-02 satellite images at 638.0 nm, 549.5 nm, and 459.0 nm showing (a) gain curves (non-uniform correction coefficients) and (b) offset curves (dark current).
Figure 19.
Relative radiometric correction coefficients for SPARK-02 satellite images at 638.0 nm, 549.5 nm, and 459.0 nm showing (a) gain curves (non-uniform correction coefficients) and (b) offset curves (dark current).
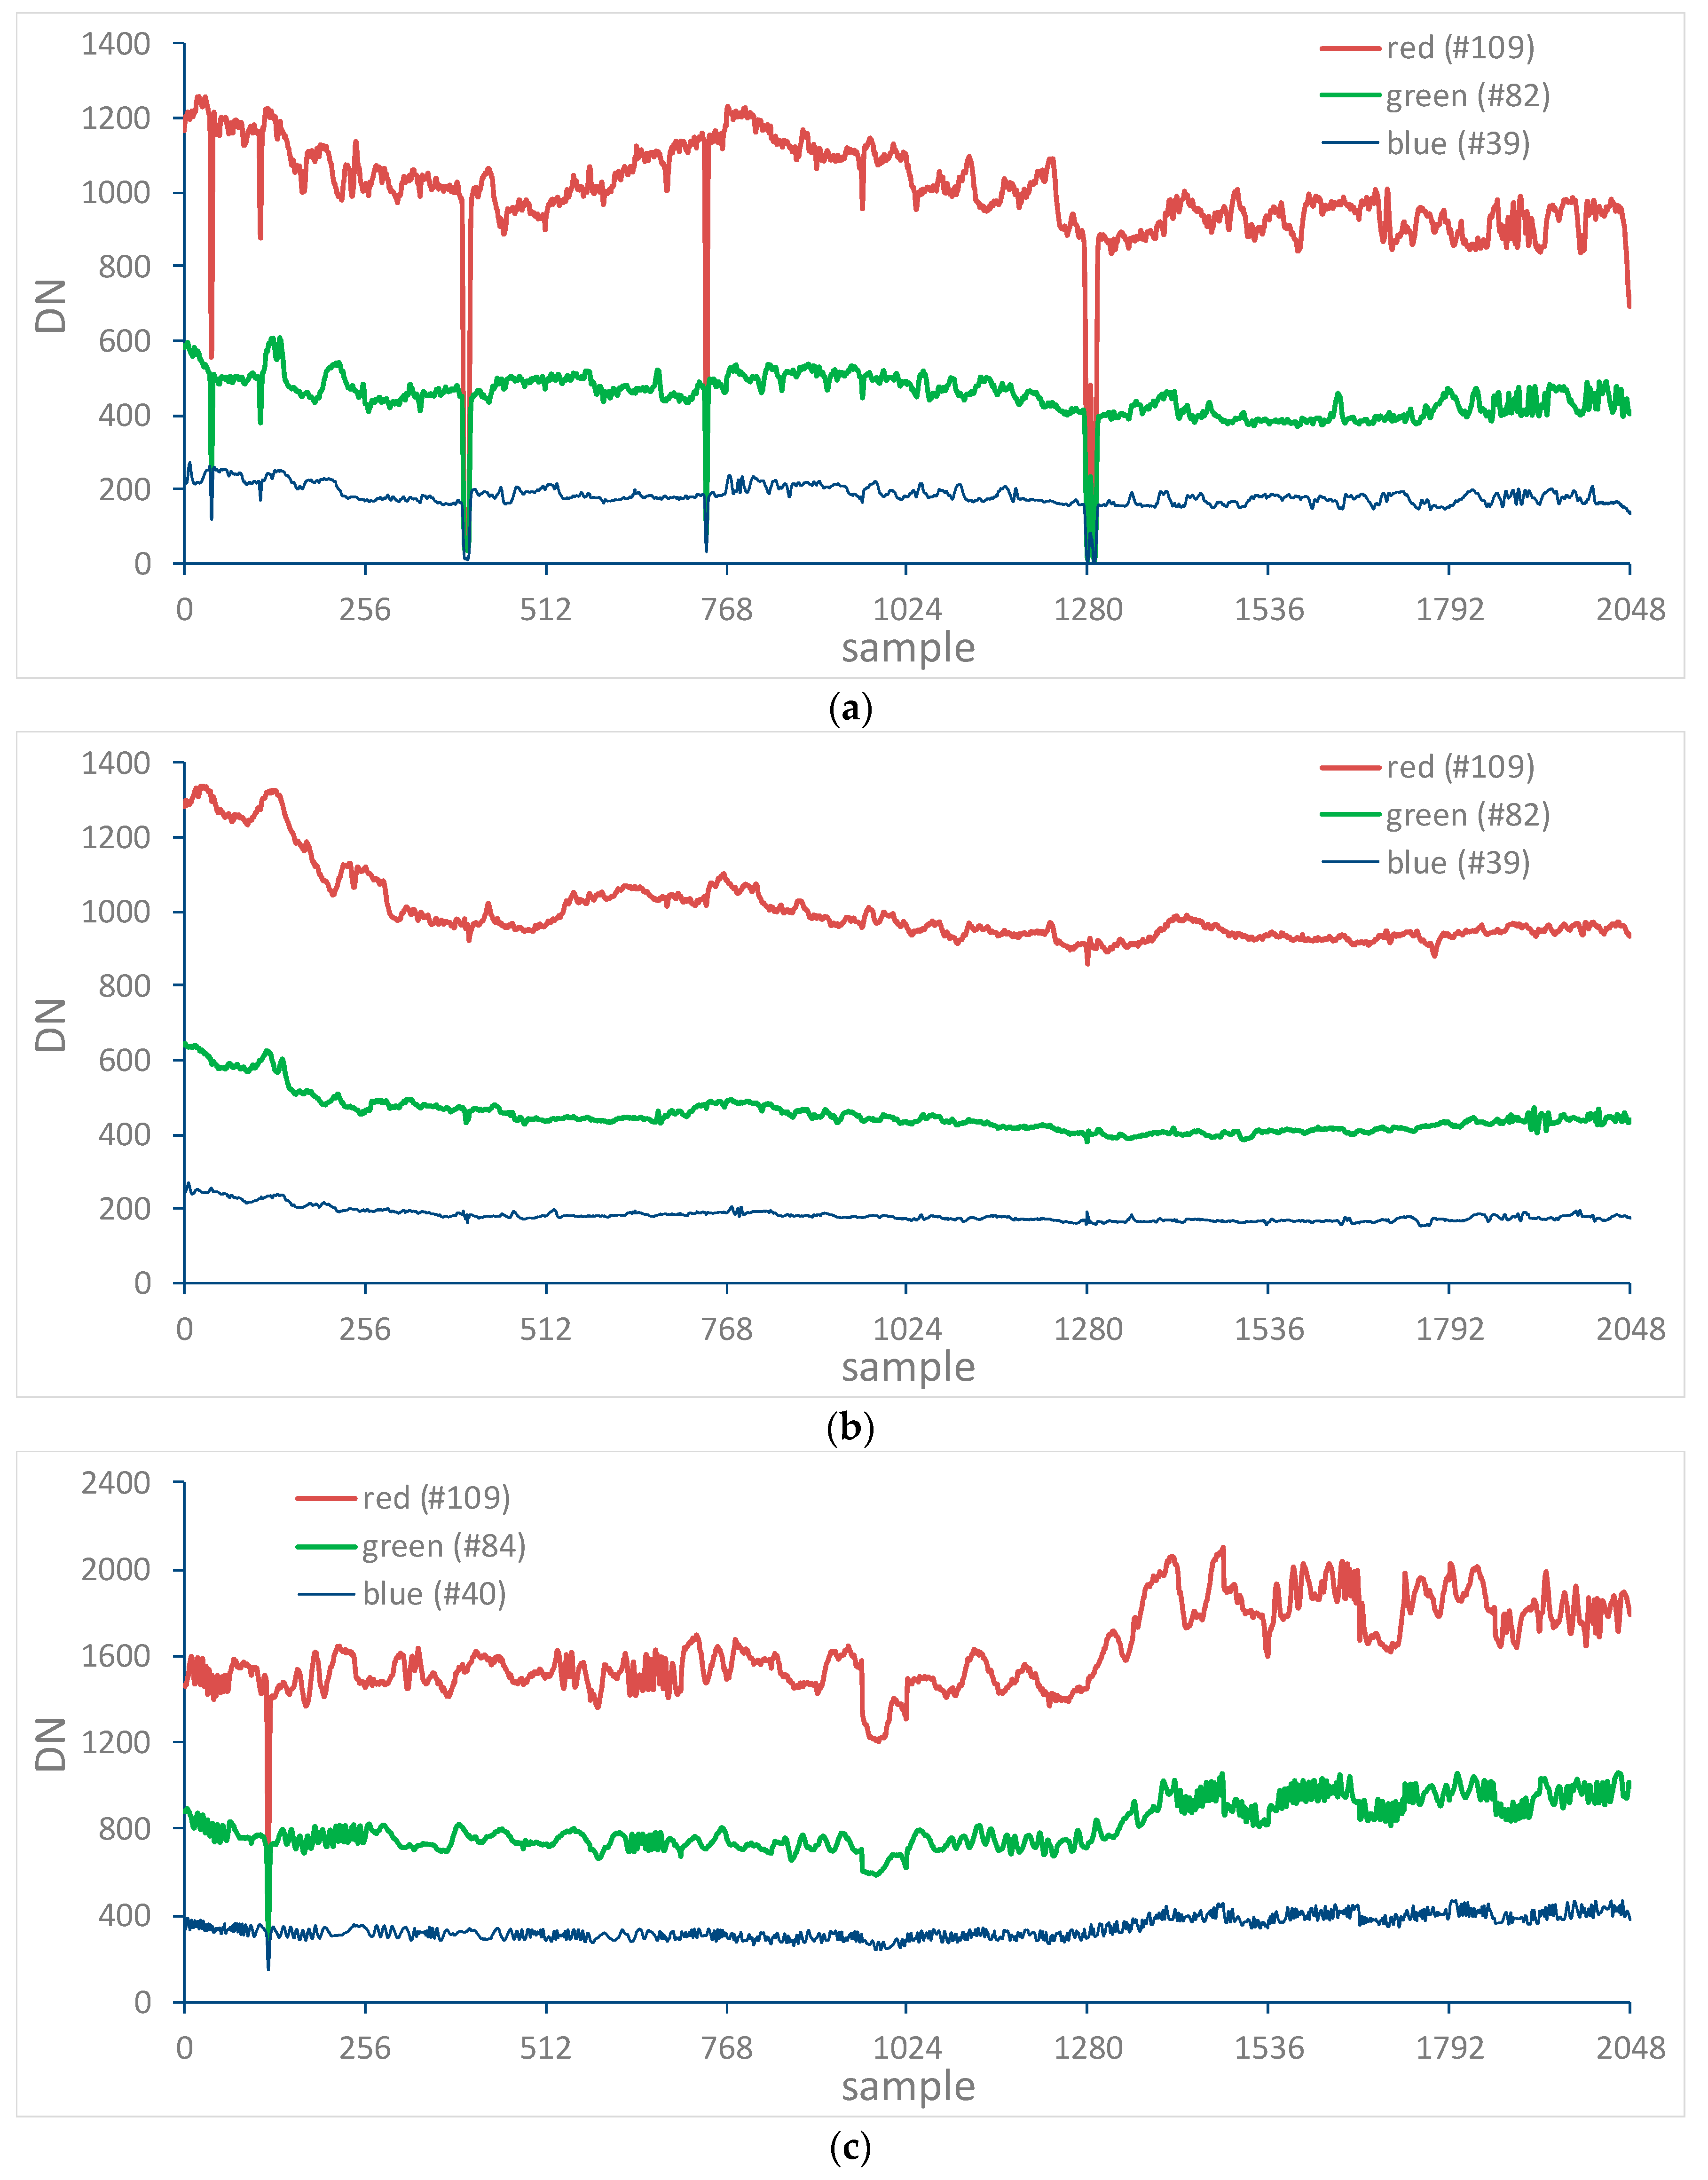
Figure 20.
Row-averaged values at 650.4 nm, 551.5 nm, and 461.7 nm from images acquired over the calibration site on 7 March and 28 February 2017 using SPARK-01 (a) before and (b) after relative calibration, and at 638.0 nm, 549.5 nm, and 459.0 nm using SPARK-02 (c) before and (d) after relative calibration.
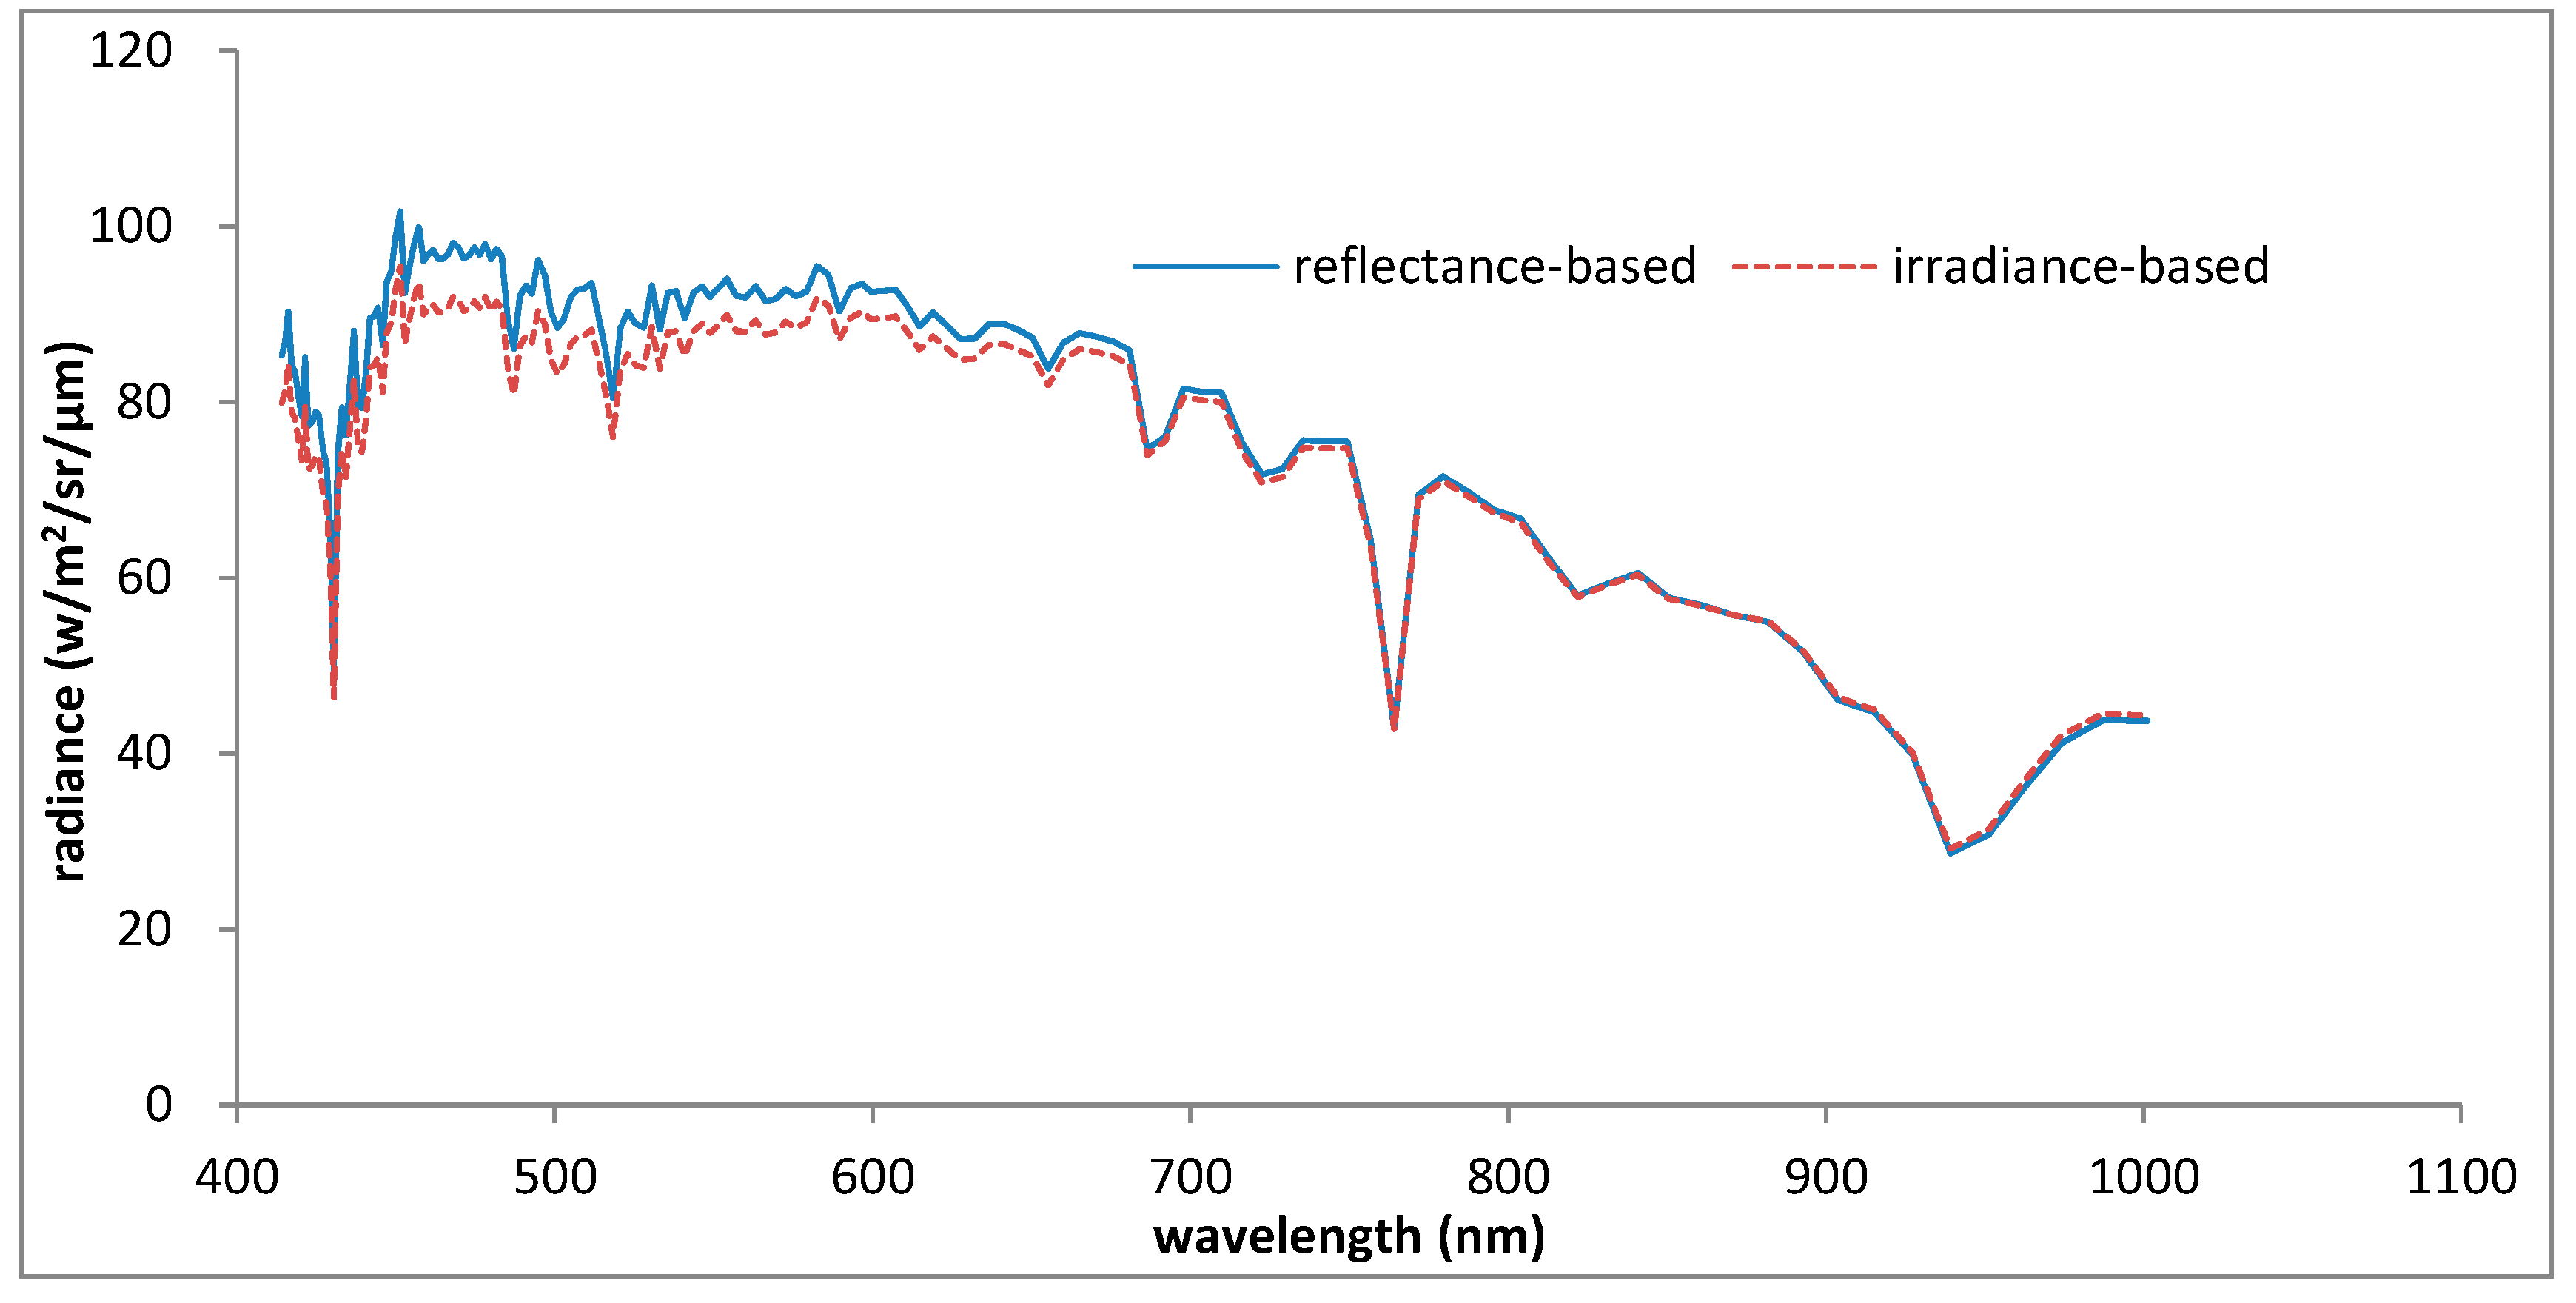
Figure 21.
MODTRAN-simulated radiance for the SPARK-01 satellite calculated using both reflectance- and irradiance-based methods.
Figure 21.
MODTRAN-simulated radiance for the SPARK-01 satellite calculated using both reflectance- and irradiance-based methods.
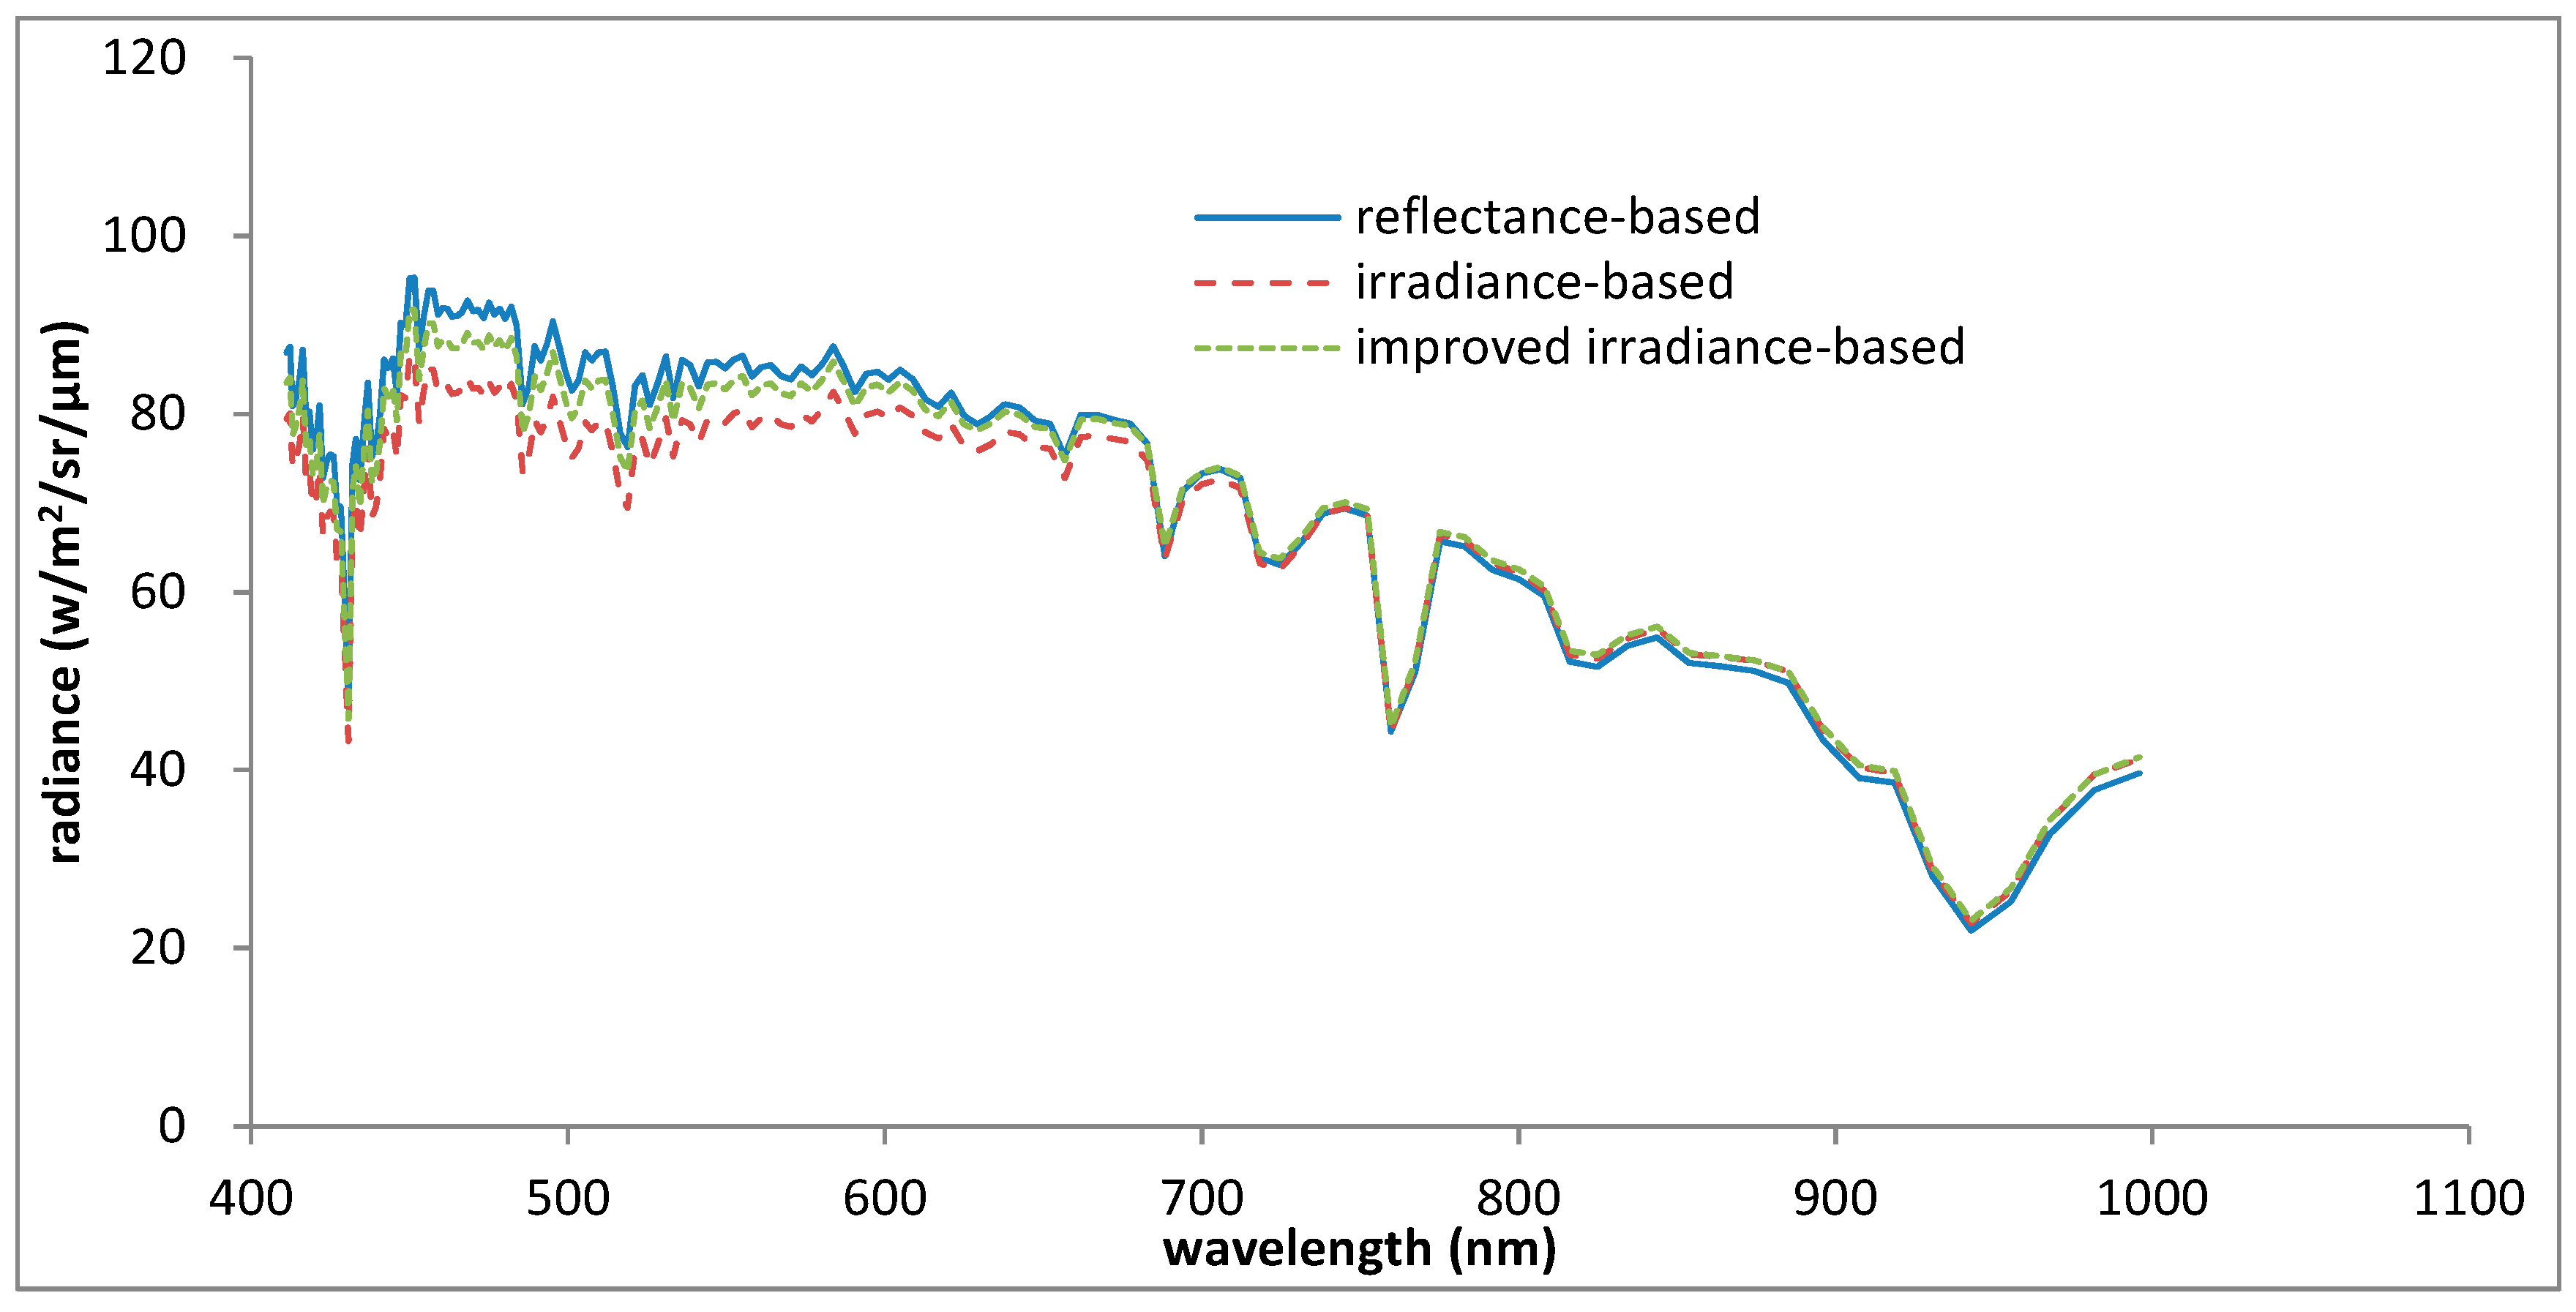
Figure 22.
MODTRAN-simulated radiance for the SPARK-02 satellite calculated using reflectance-, irradiance-, and improved irradiance-based methods.
Figure 22.
MODTRAN-simulated radiance for the SPARK-02 satellite calculated using reflectance-, irradiance-, and improved irradiance-based methods.
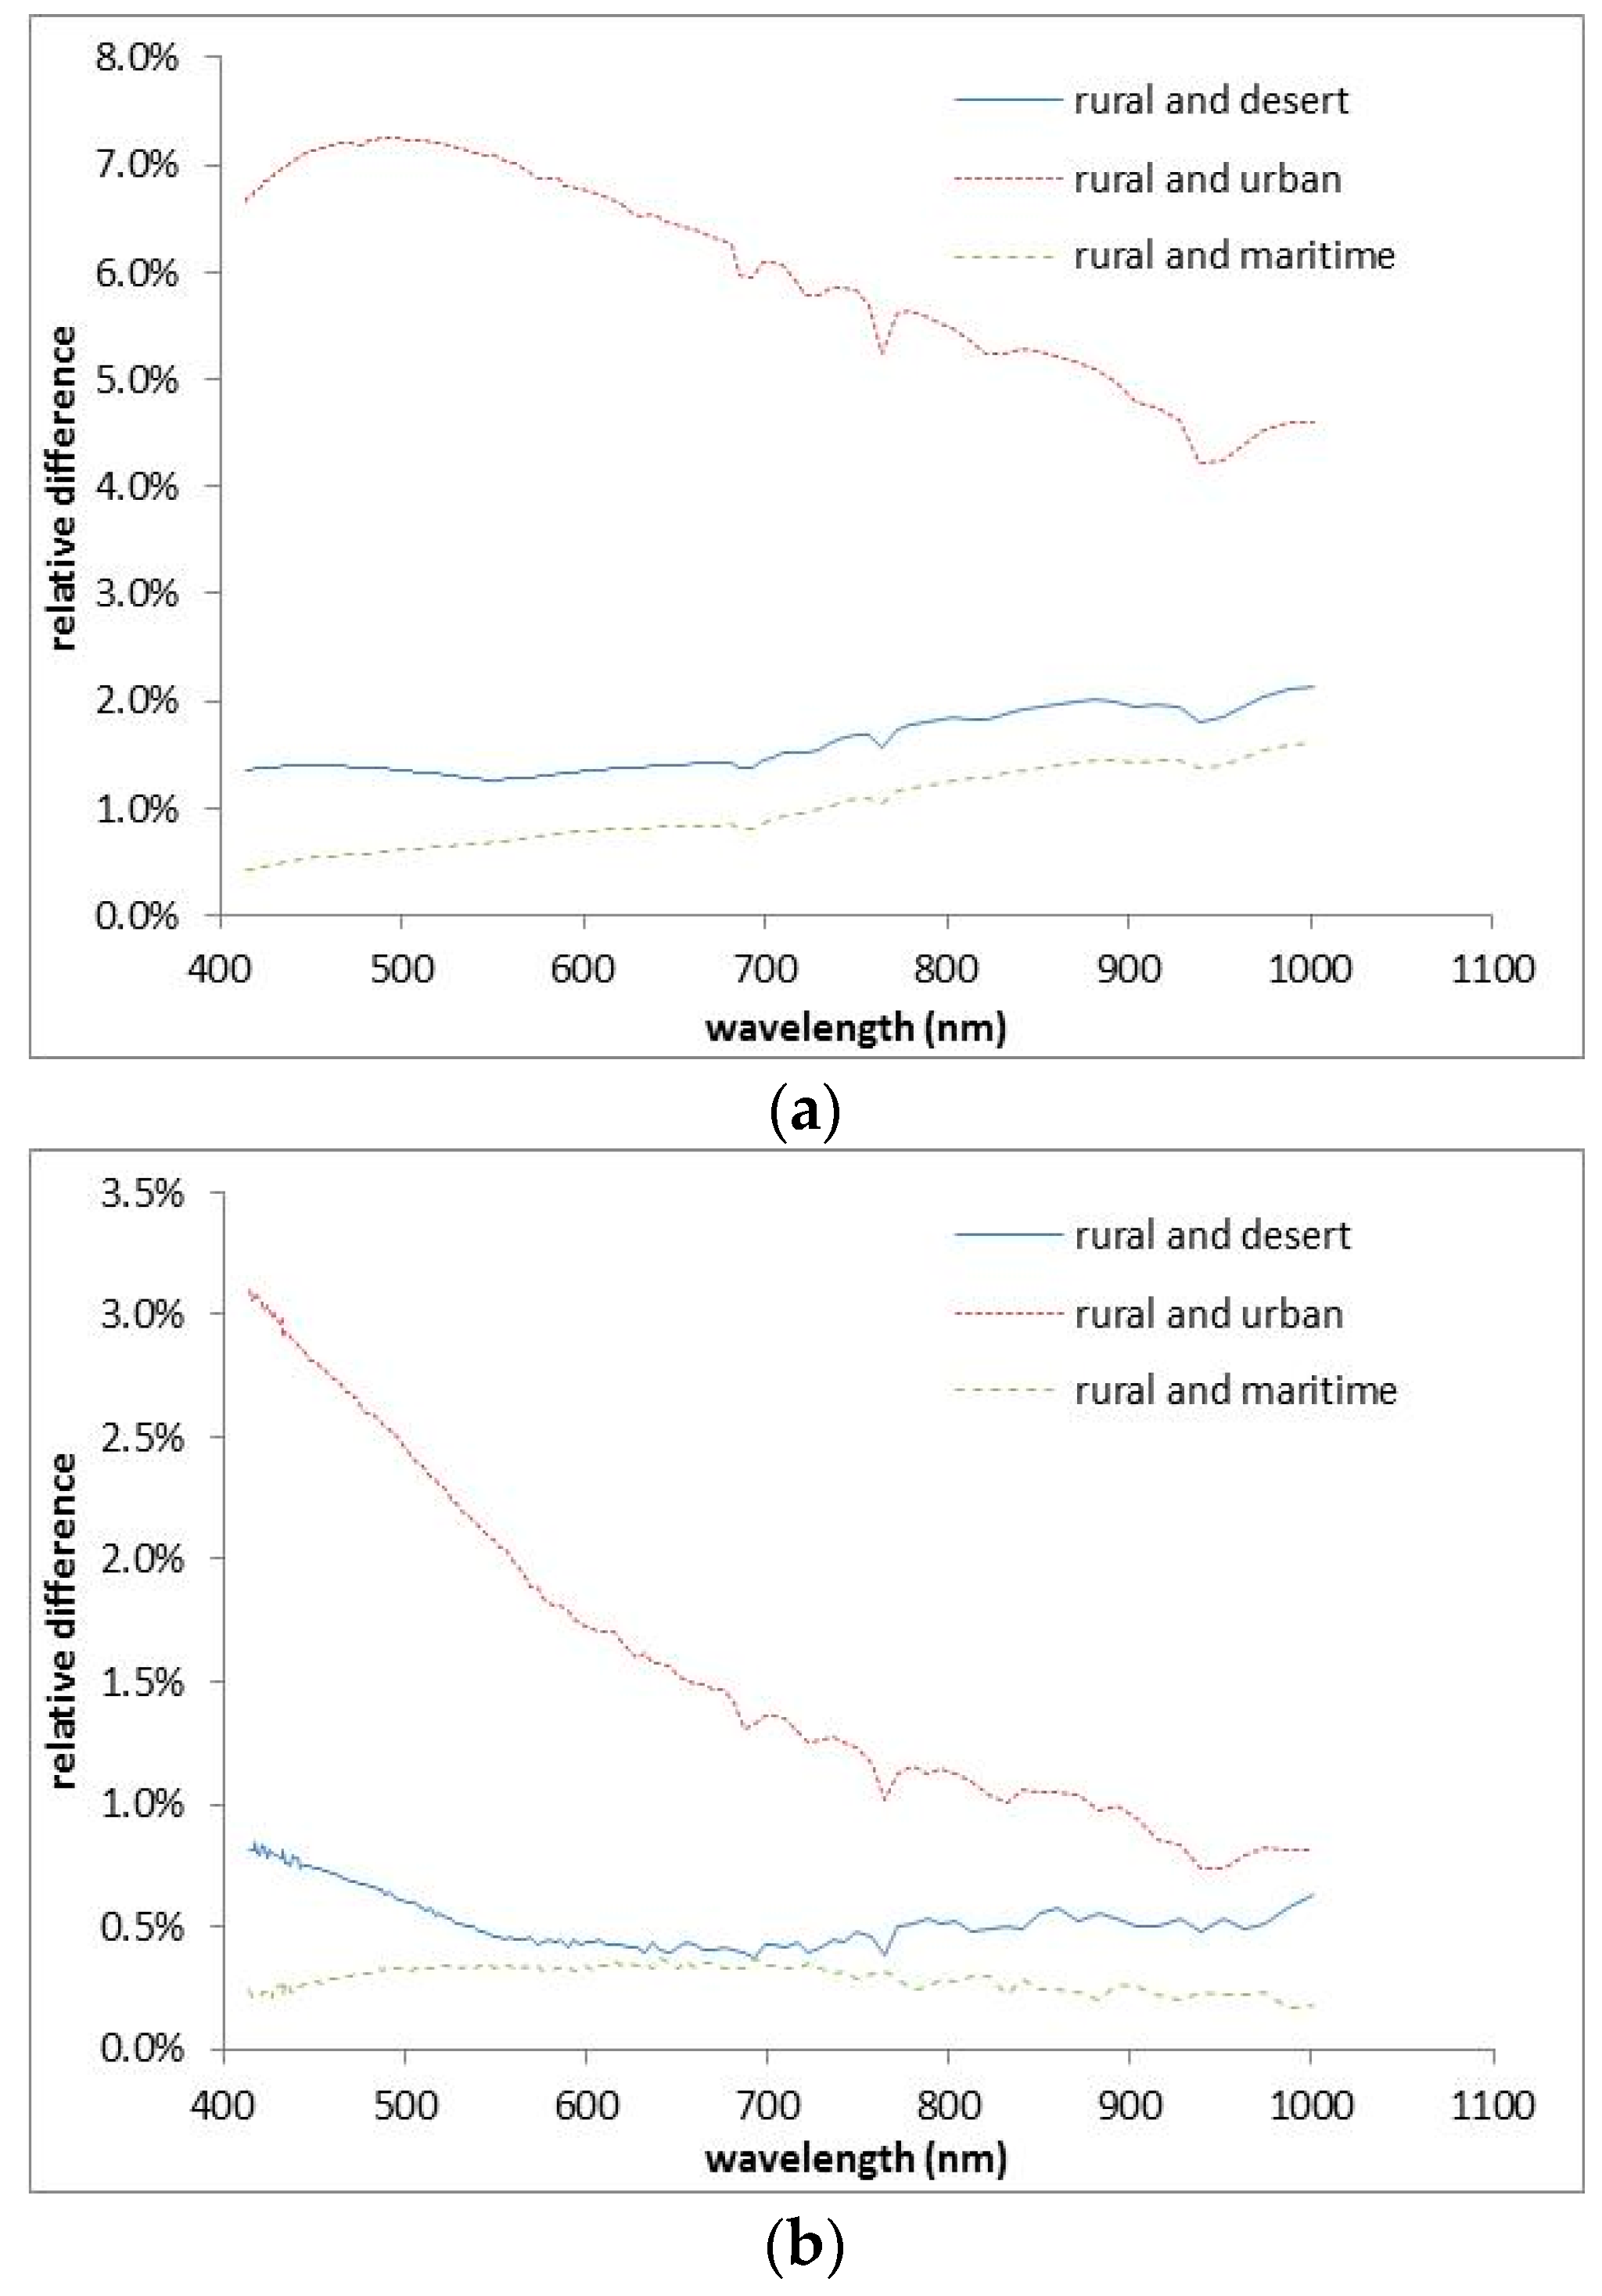
Figure 23.
Relative differences in radiance using different aerosol types for the SPARK-01 calibration for 7 March 2017 using (a) the reflectance-based method and (b) the irradiance-based method.
Figure 23.
Relative differences in radiance using different aerosol types for the SPARK-01 calibration for 7 March 2017 using (a) the reflectance-based method and (b) the irradiance-based method.
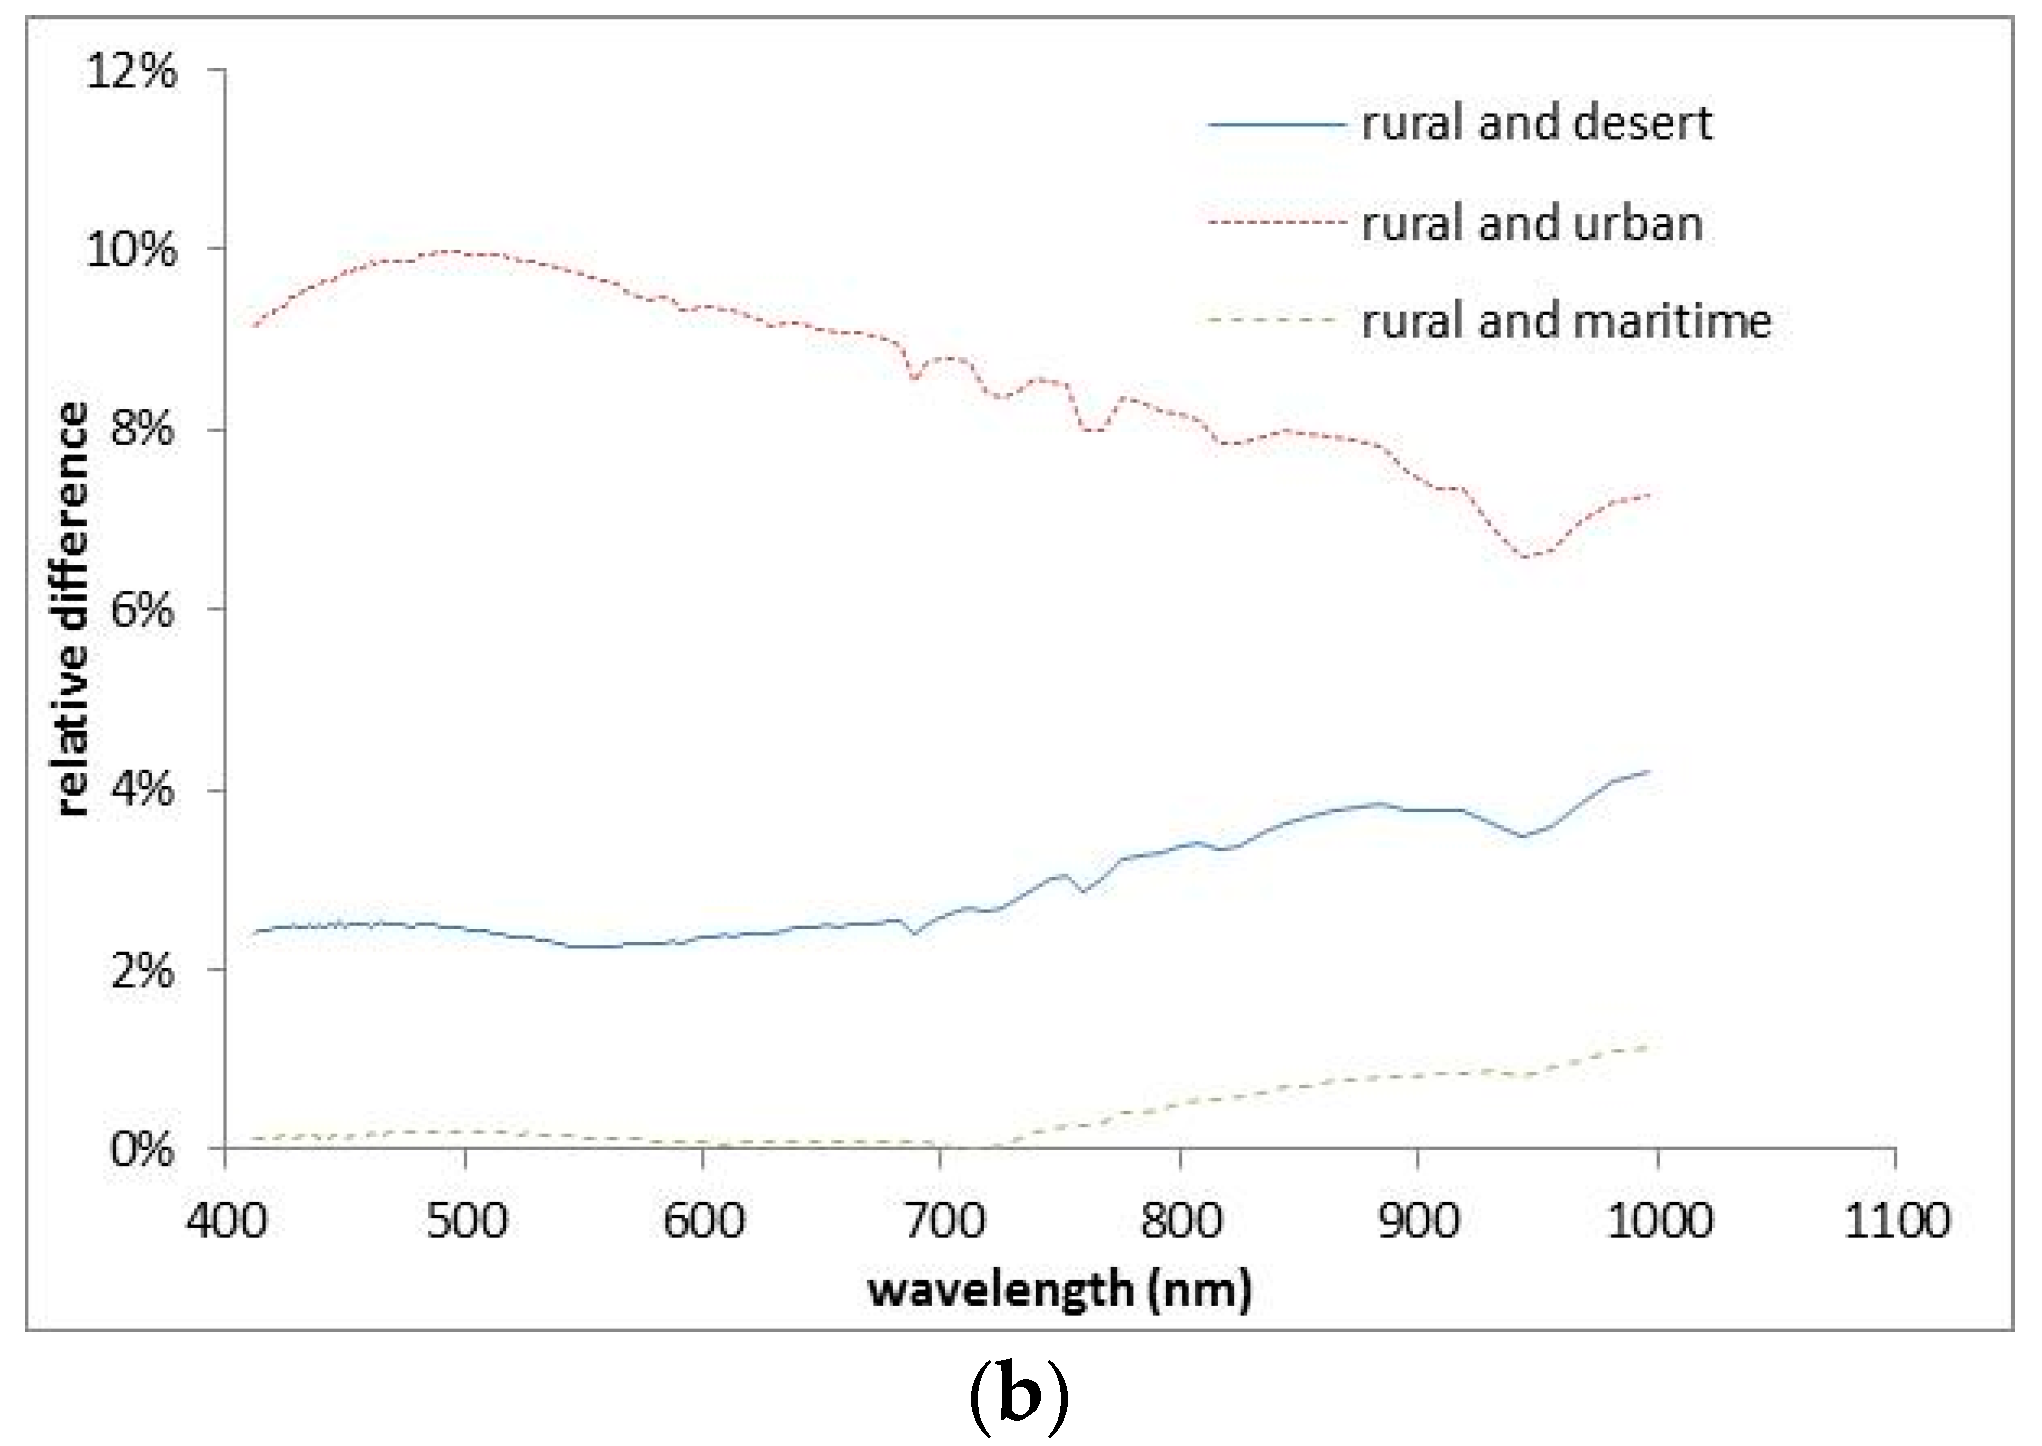
Figure 24.
Relative differences in radiance using different aerosol types for the SPARK-02 calibration for 28 February 2017 using (a) the reflectance-based method and (b) the irradiance-based method.
Figure 24.
Relative differences in radiance using different aerosol types for the SPARK-02 calibration for 28 February 2017 using (a) the reflectance-based method and (b) the irradiance-based method.
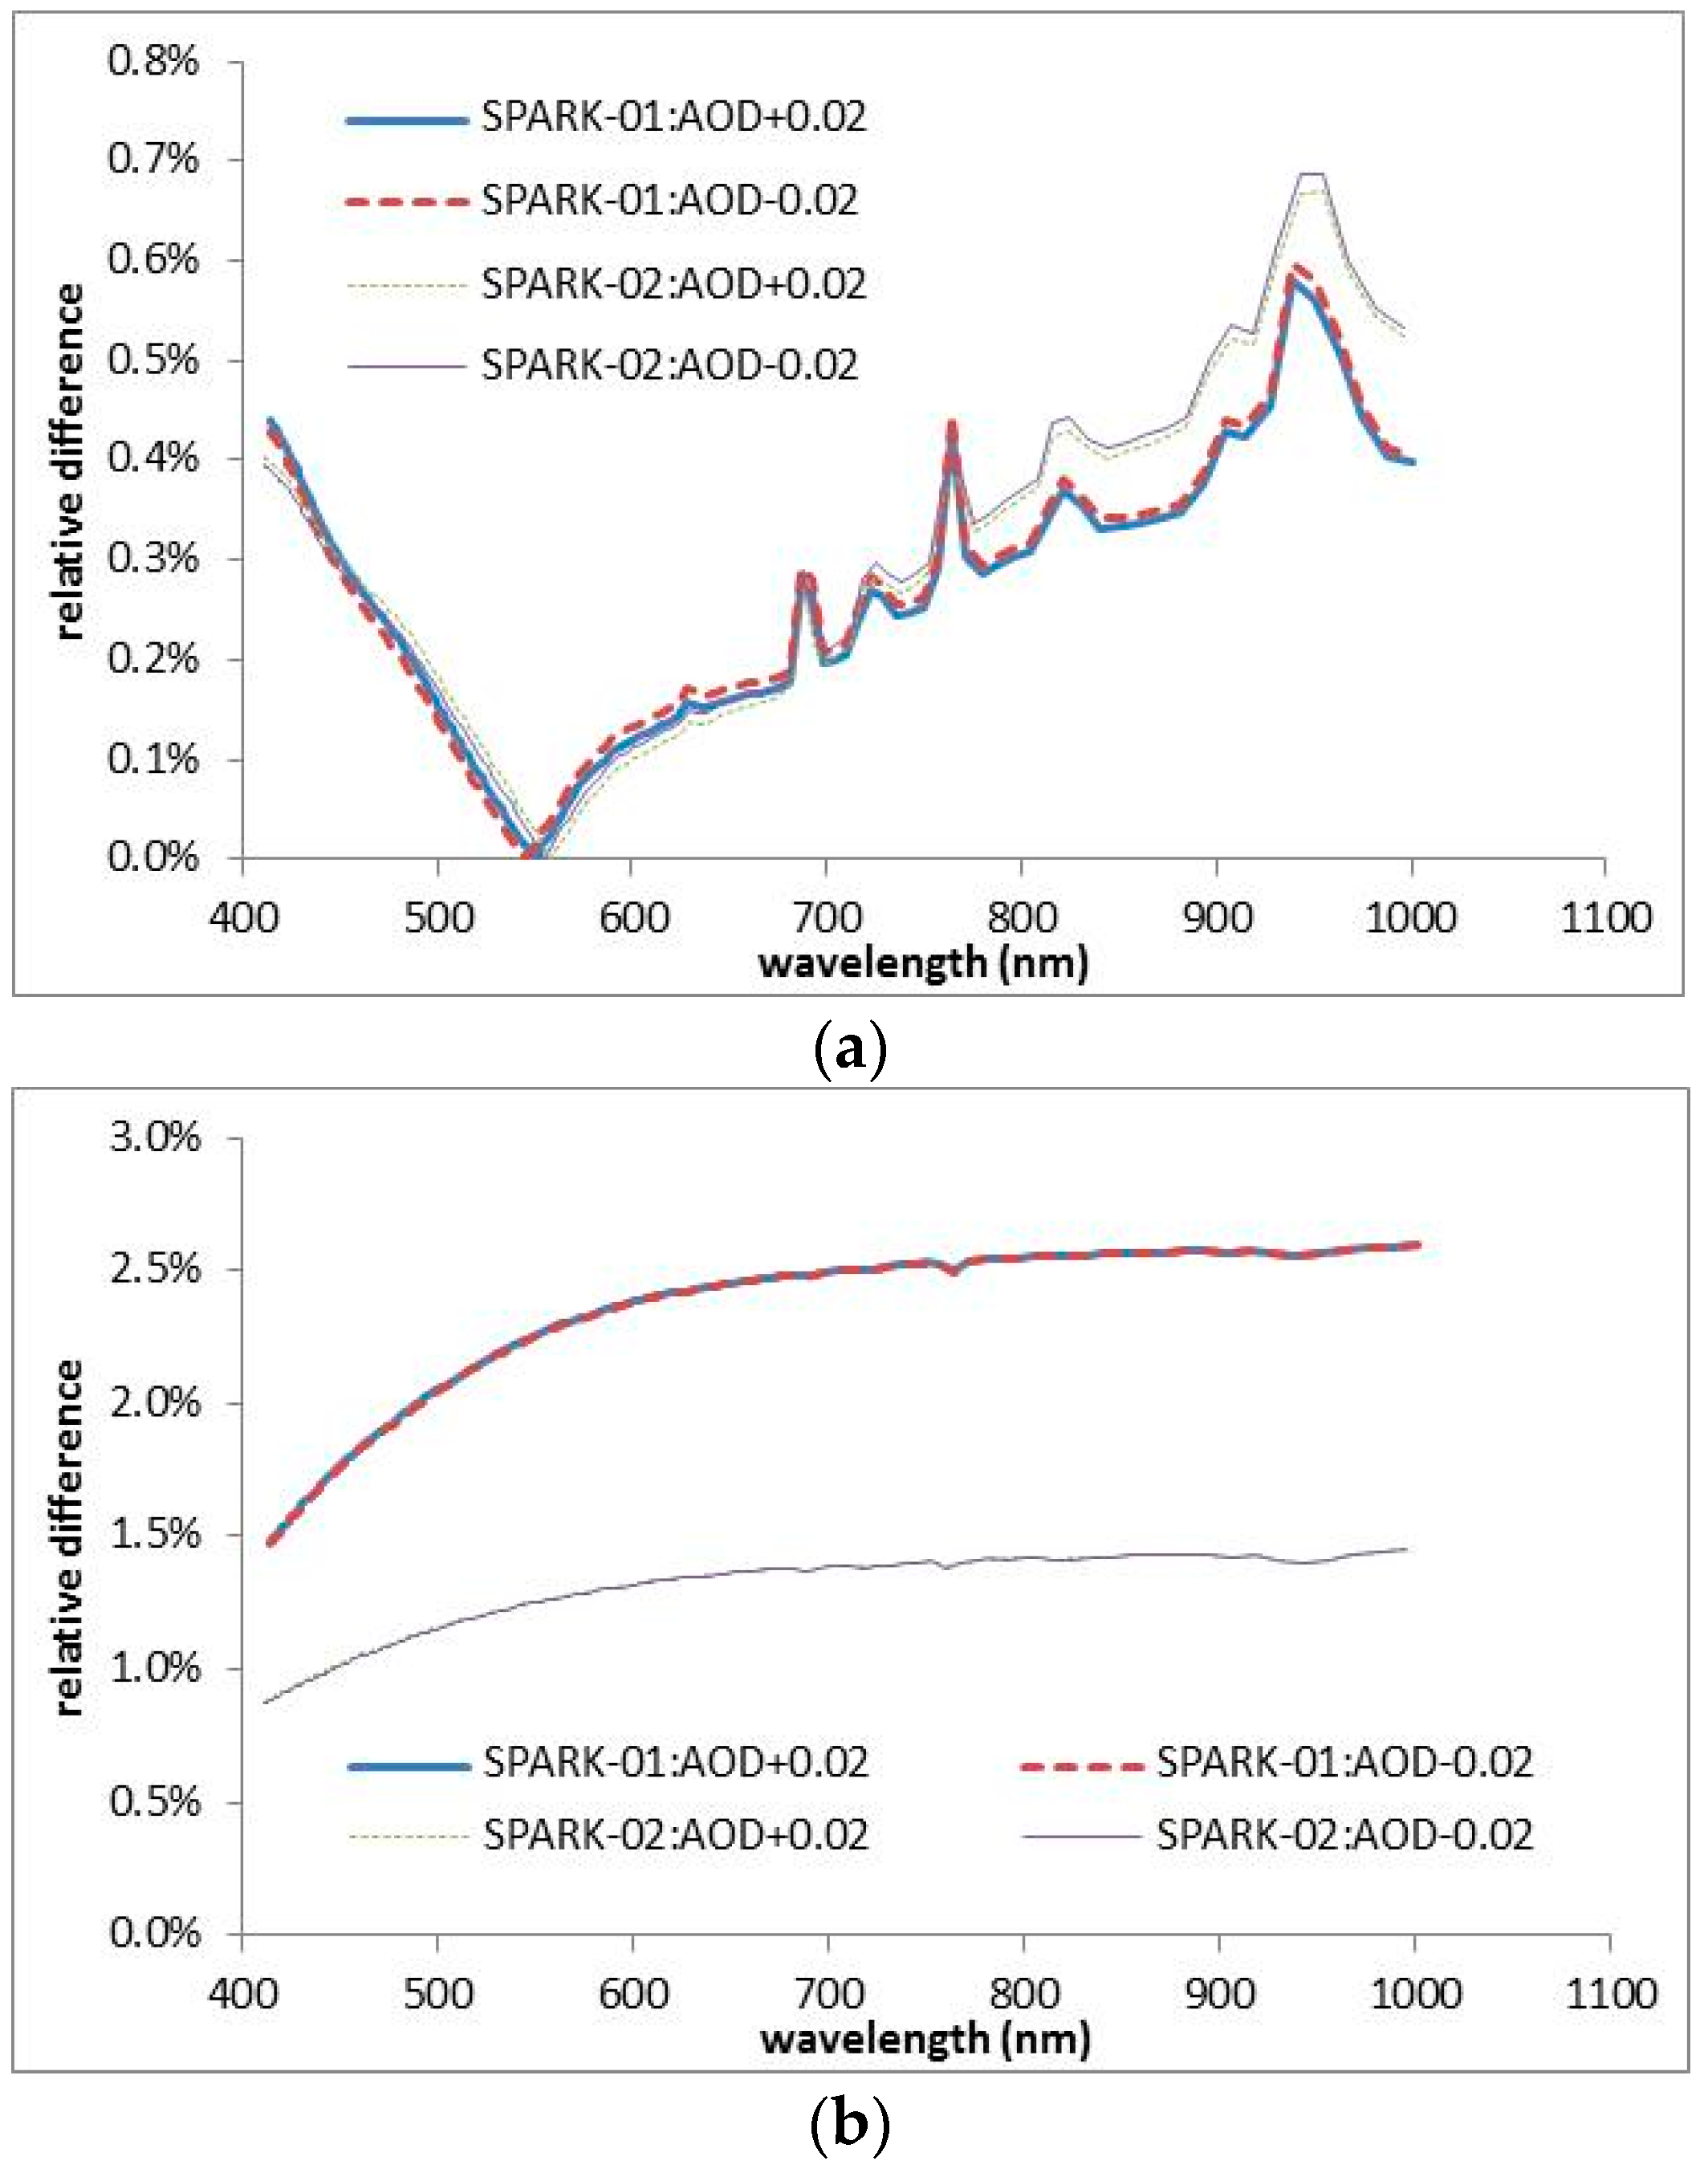
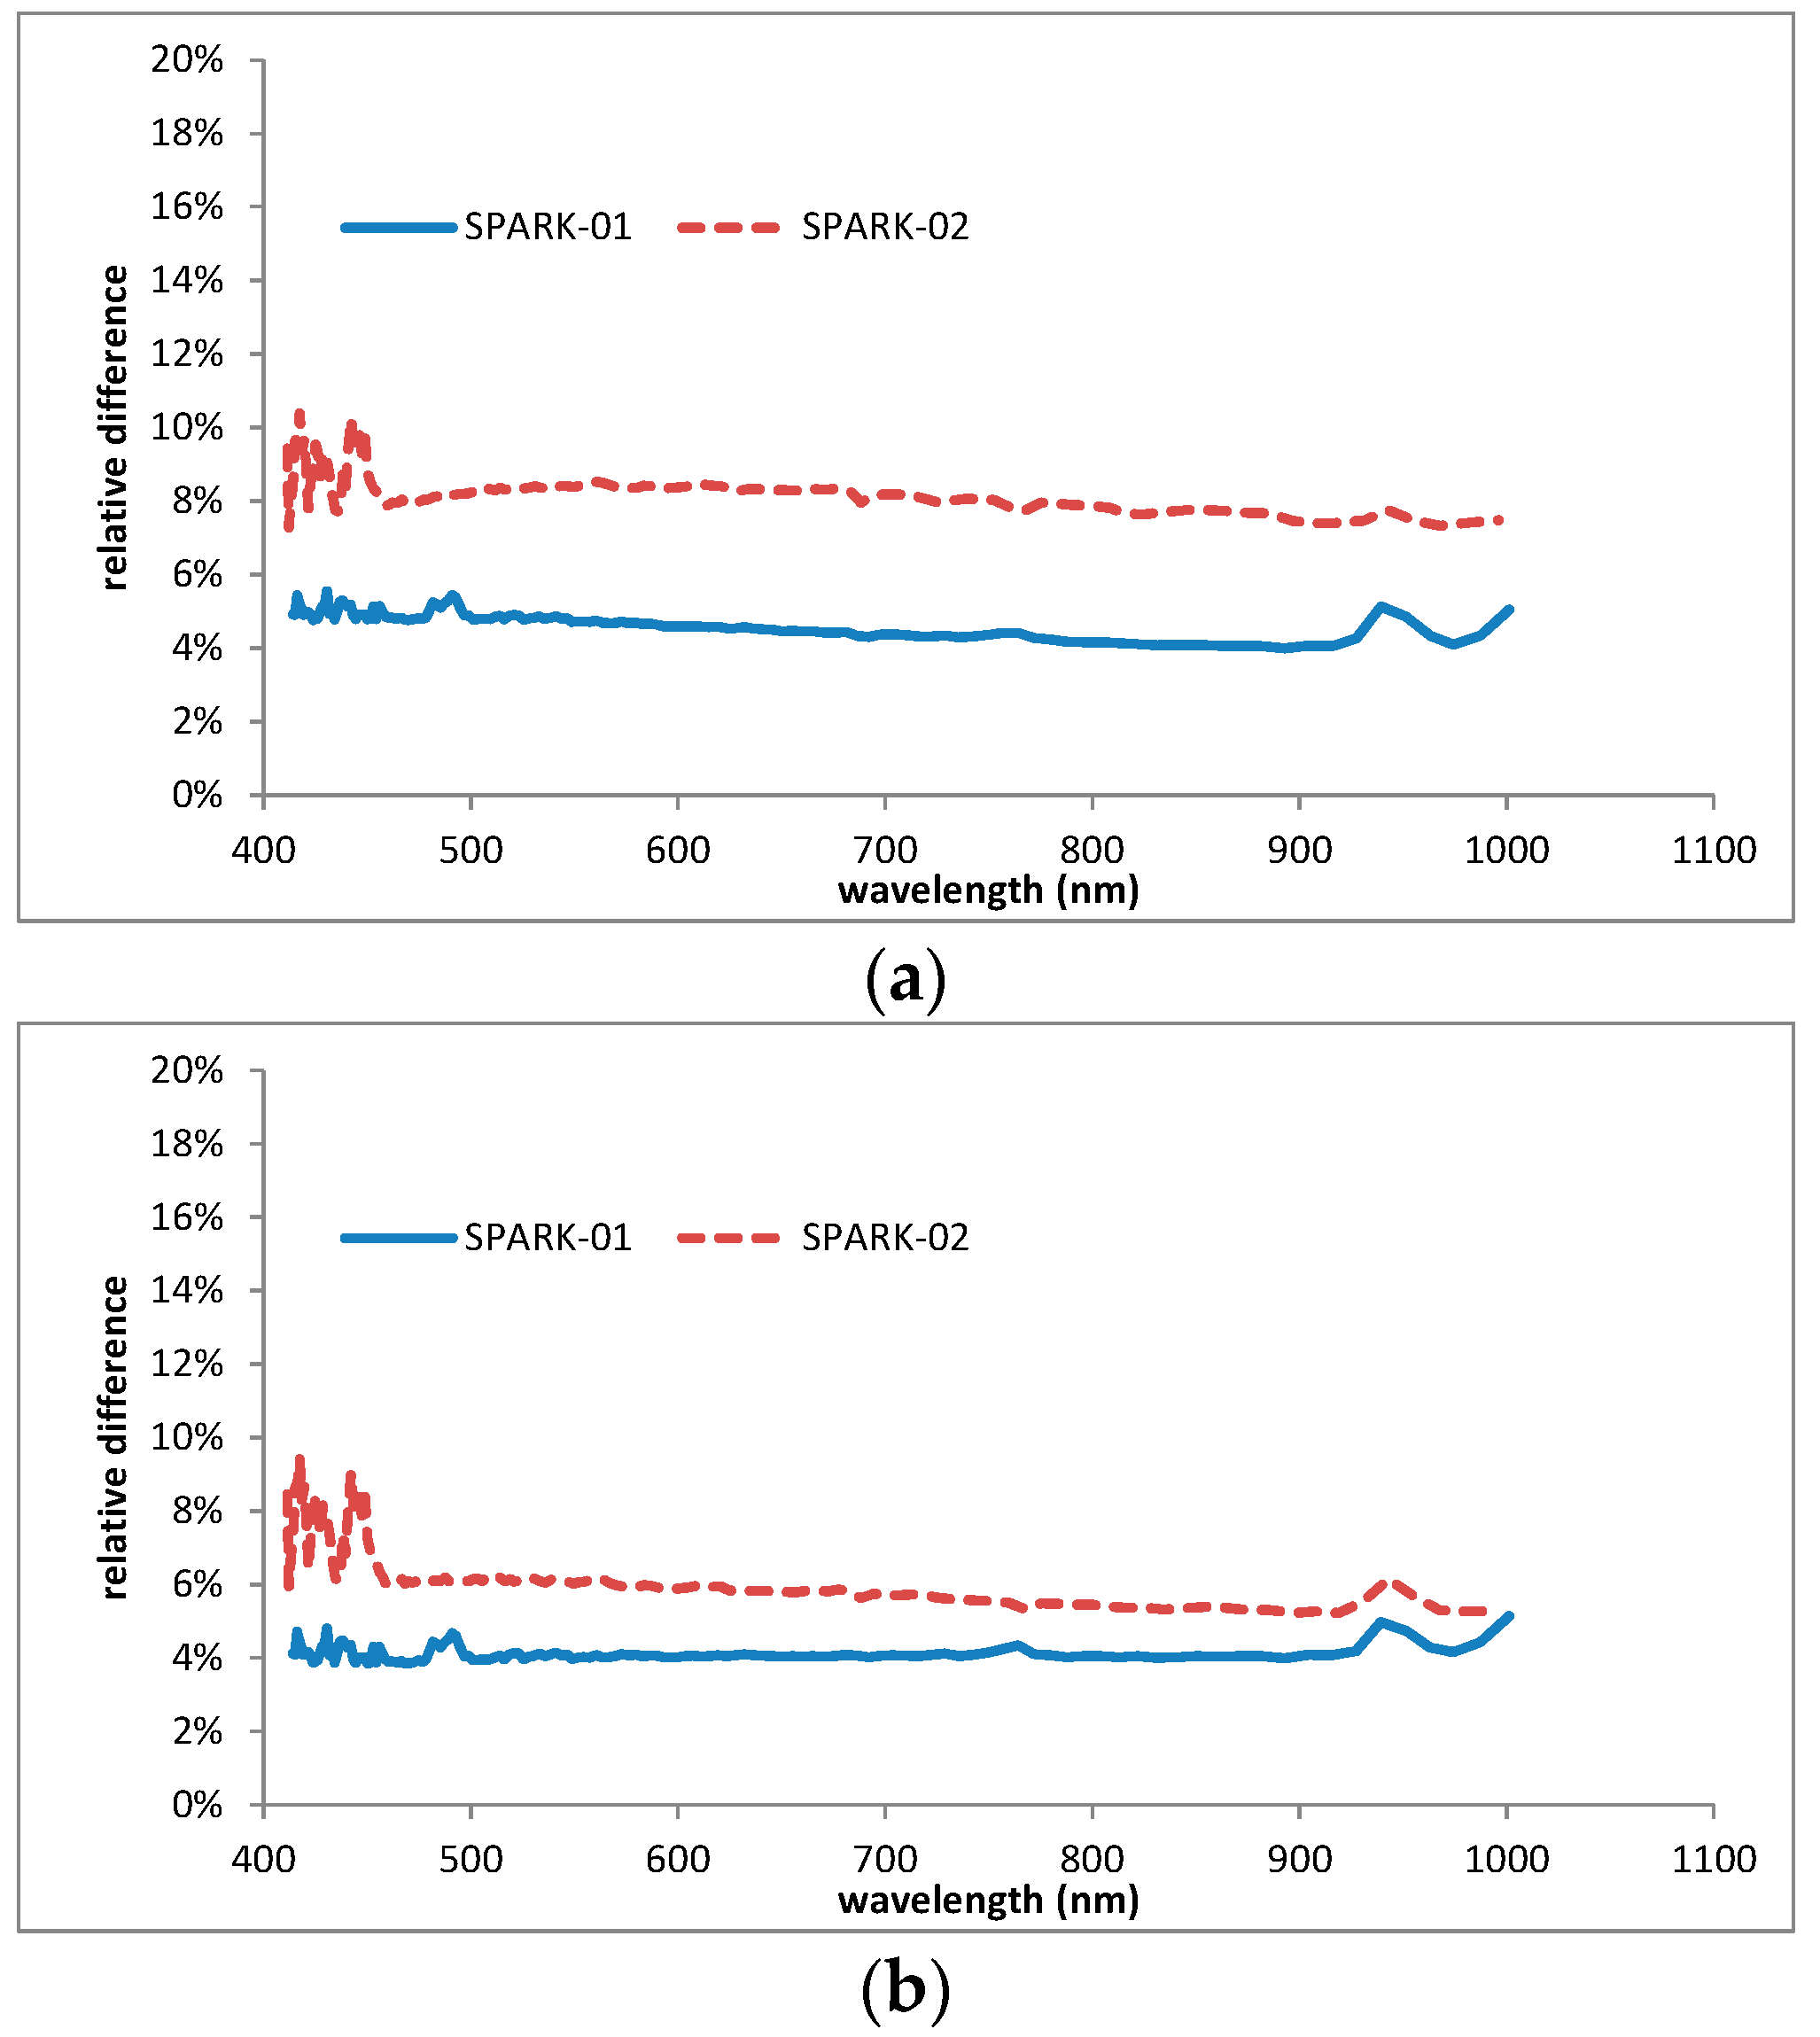
Figure 25.
Calibration uncertainties caused by the AOD measurements for SPARK-01 and -02 using the (a) reflectance- and (b) irradiance- based (or improved irradiance-based) methods, respectively.
Figure 25.
Calibration uncertainties caused by the AOD measurements for SPARK-01 and -02 using the (a) reflectance- and (b) irradiance- based (or improved irradiance-based) methods, respectively.
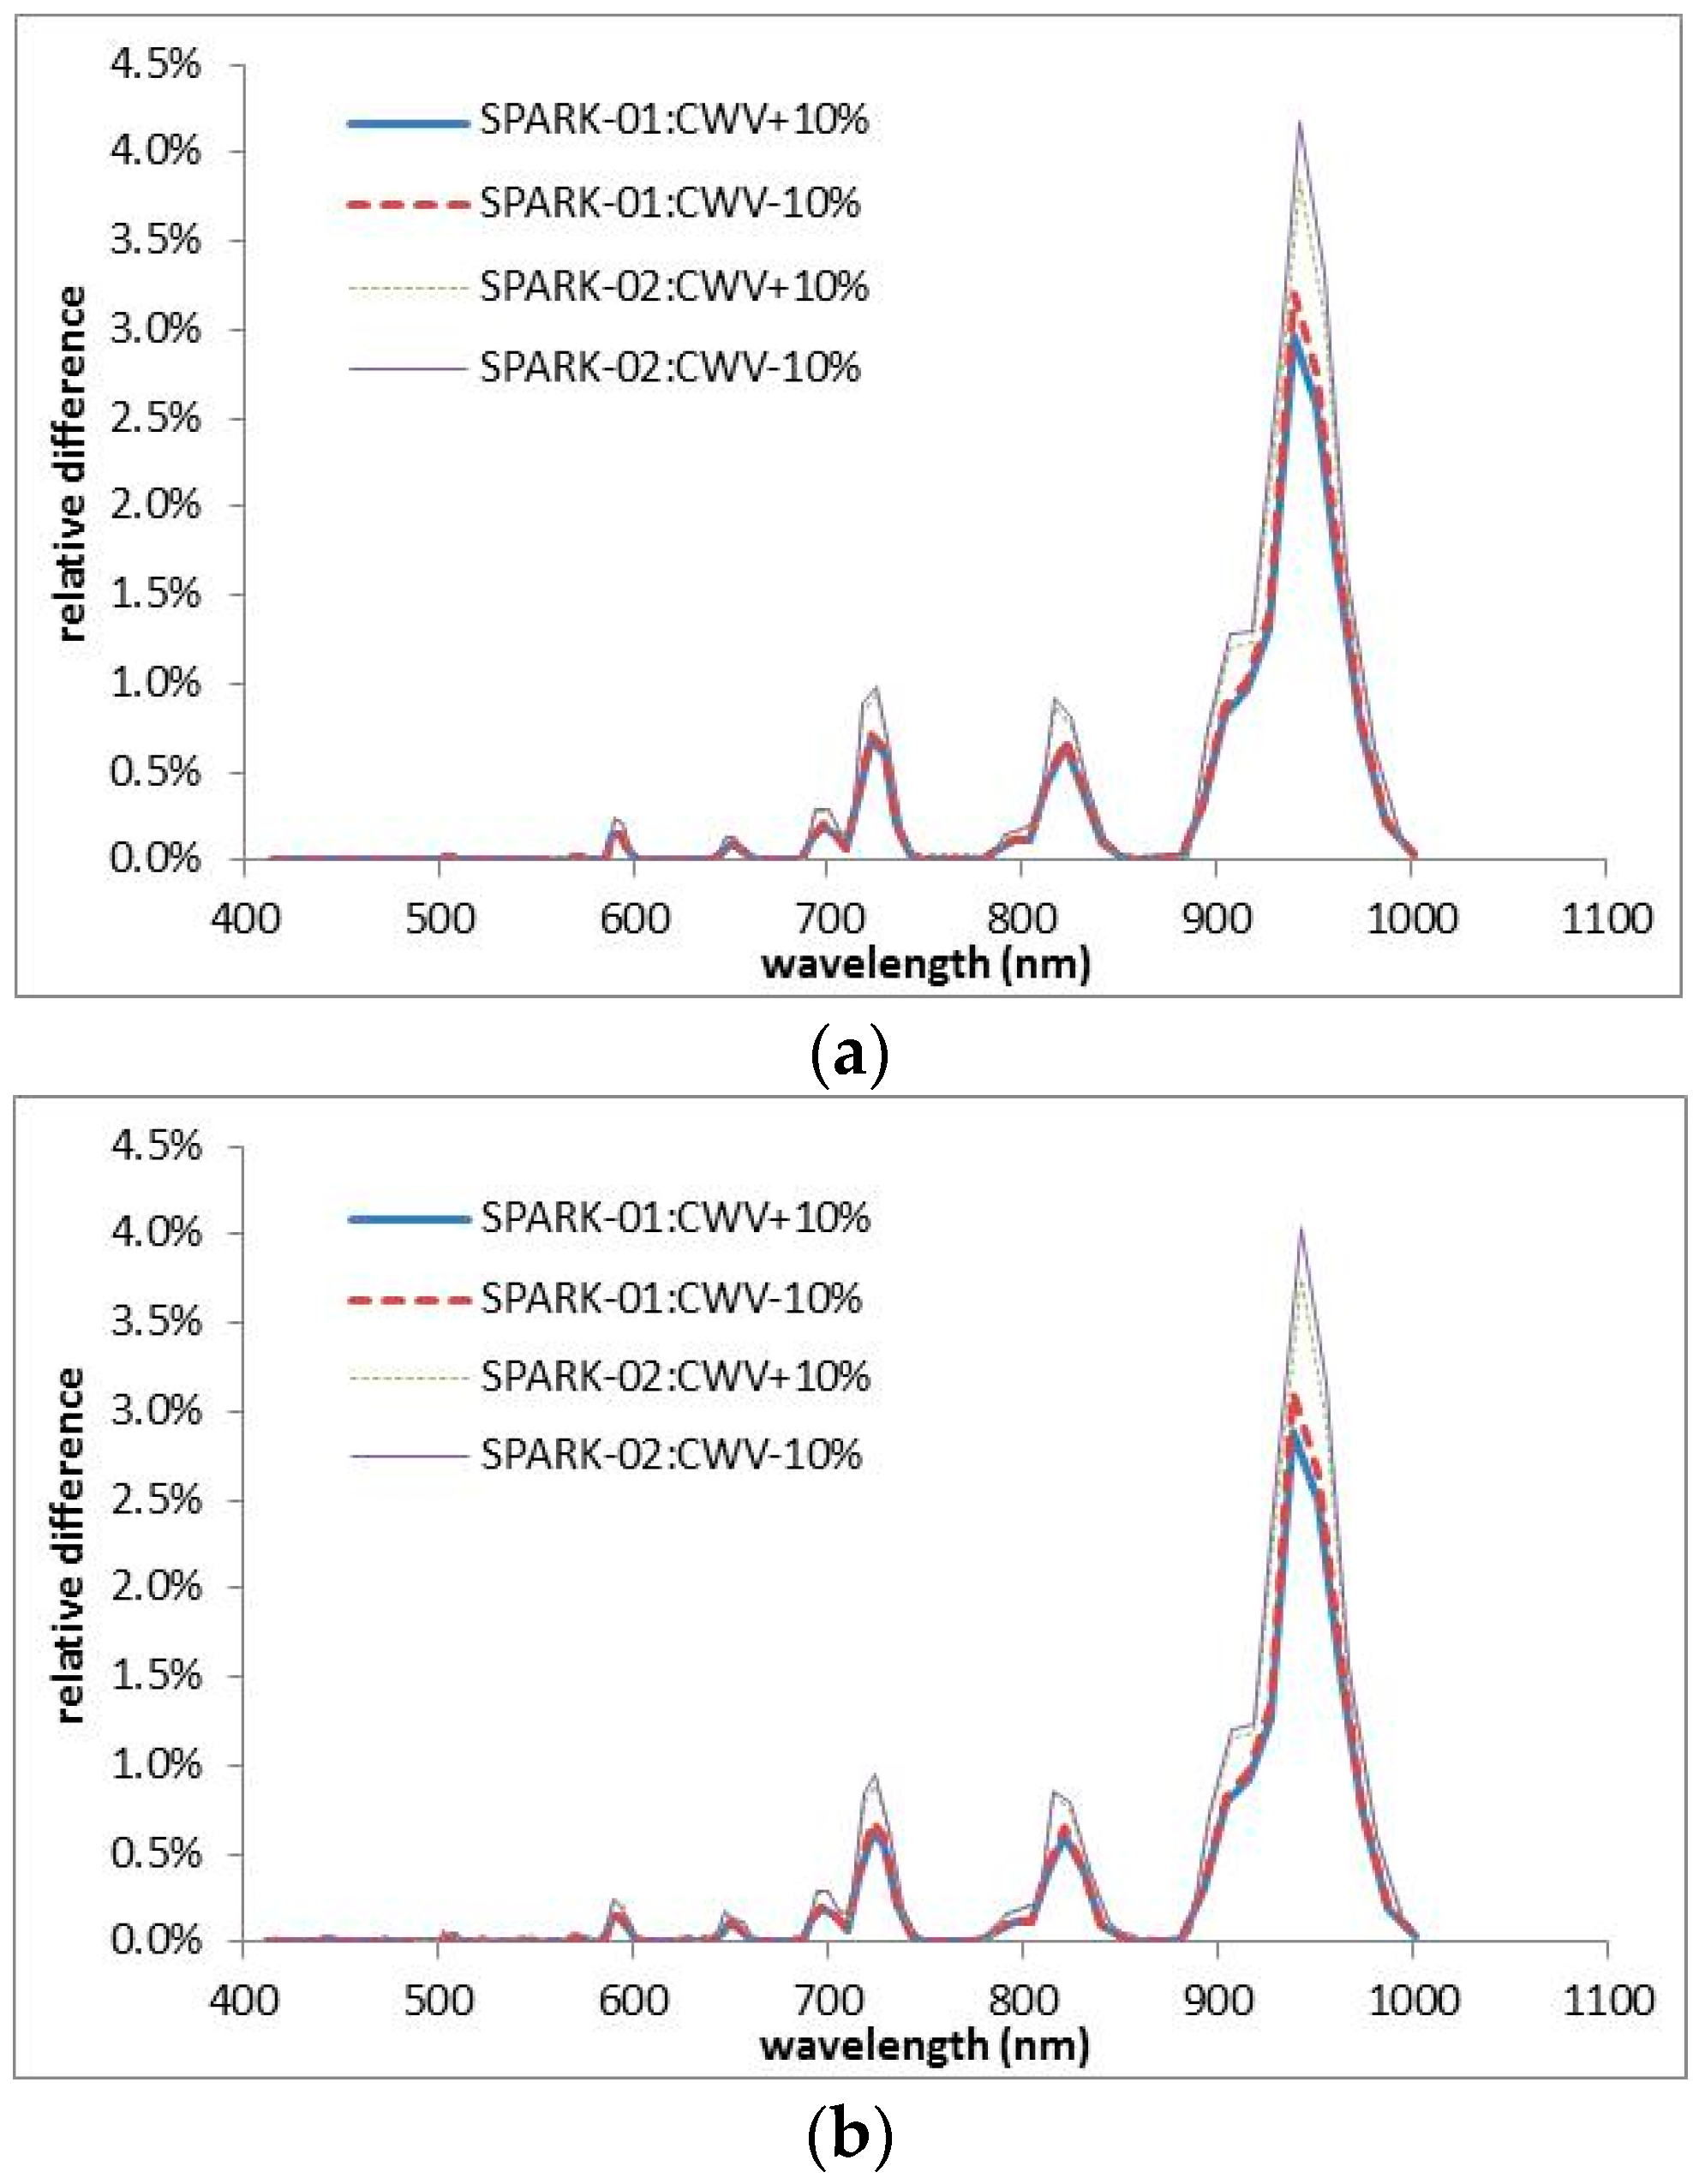
Figure 26.
Calibration uncertainties caused by the water vapor content measurements for SPARK-01 and -02 using the (a) reflectance- and (b) irradiance- based (or improved irradiance-based) methods, respectively.
Figure 26.
Calibration uncertainties caused by the water vapor content measurements for SPARK-01 and -02 using the (a) reflectance- and (b) irradiance- based (or improved irradiance-based) methods, respectively.
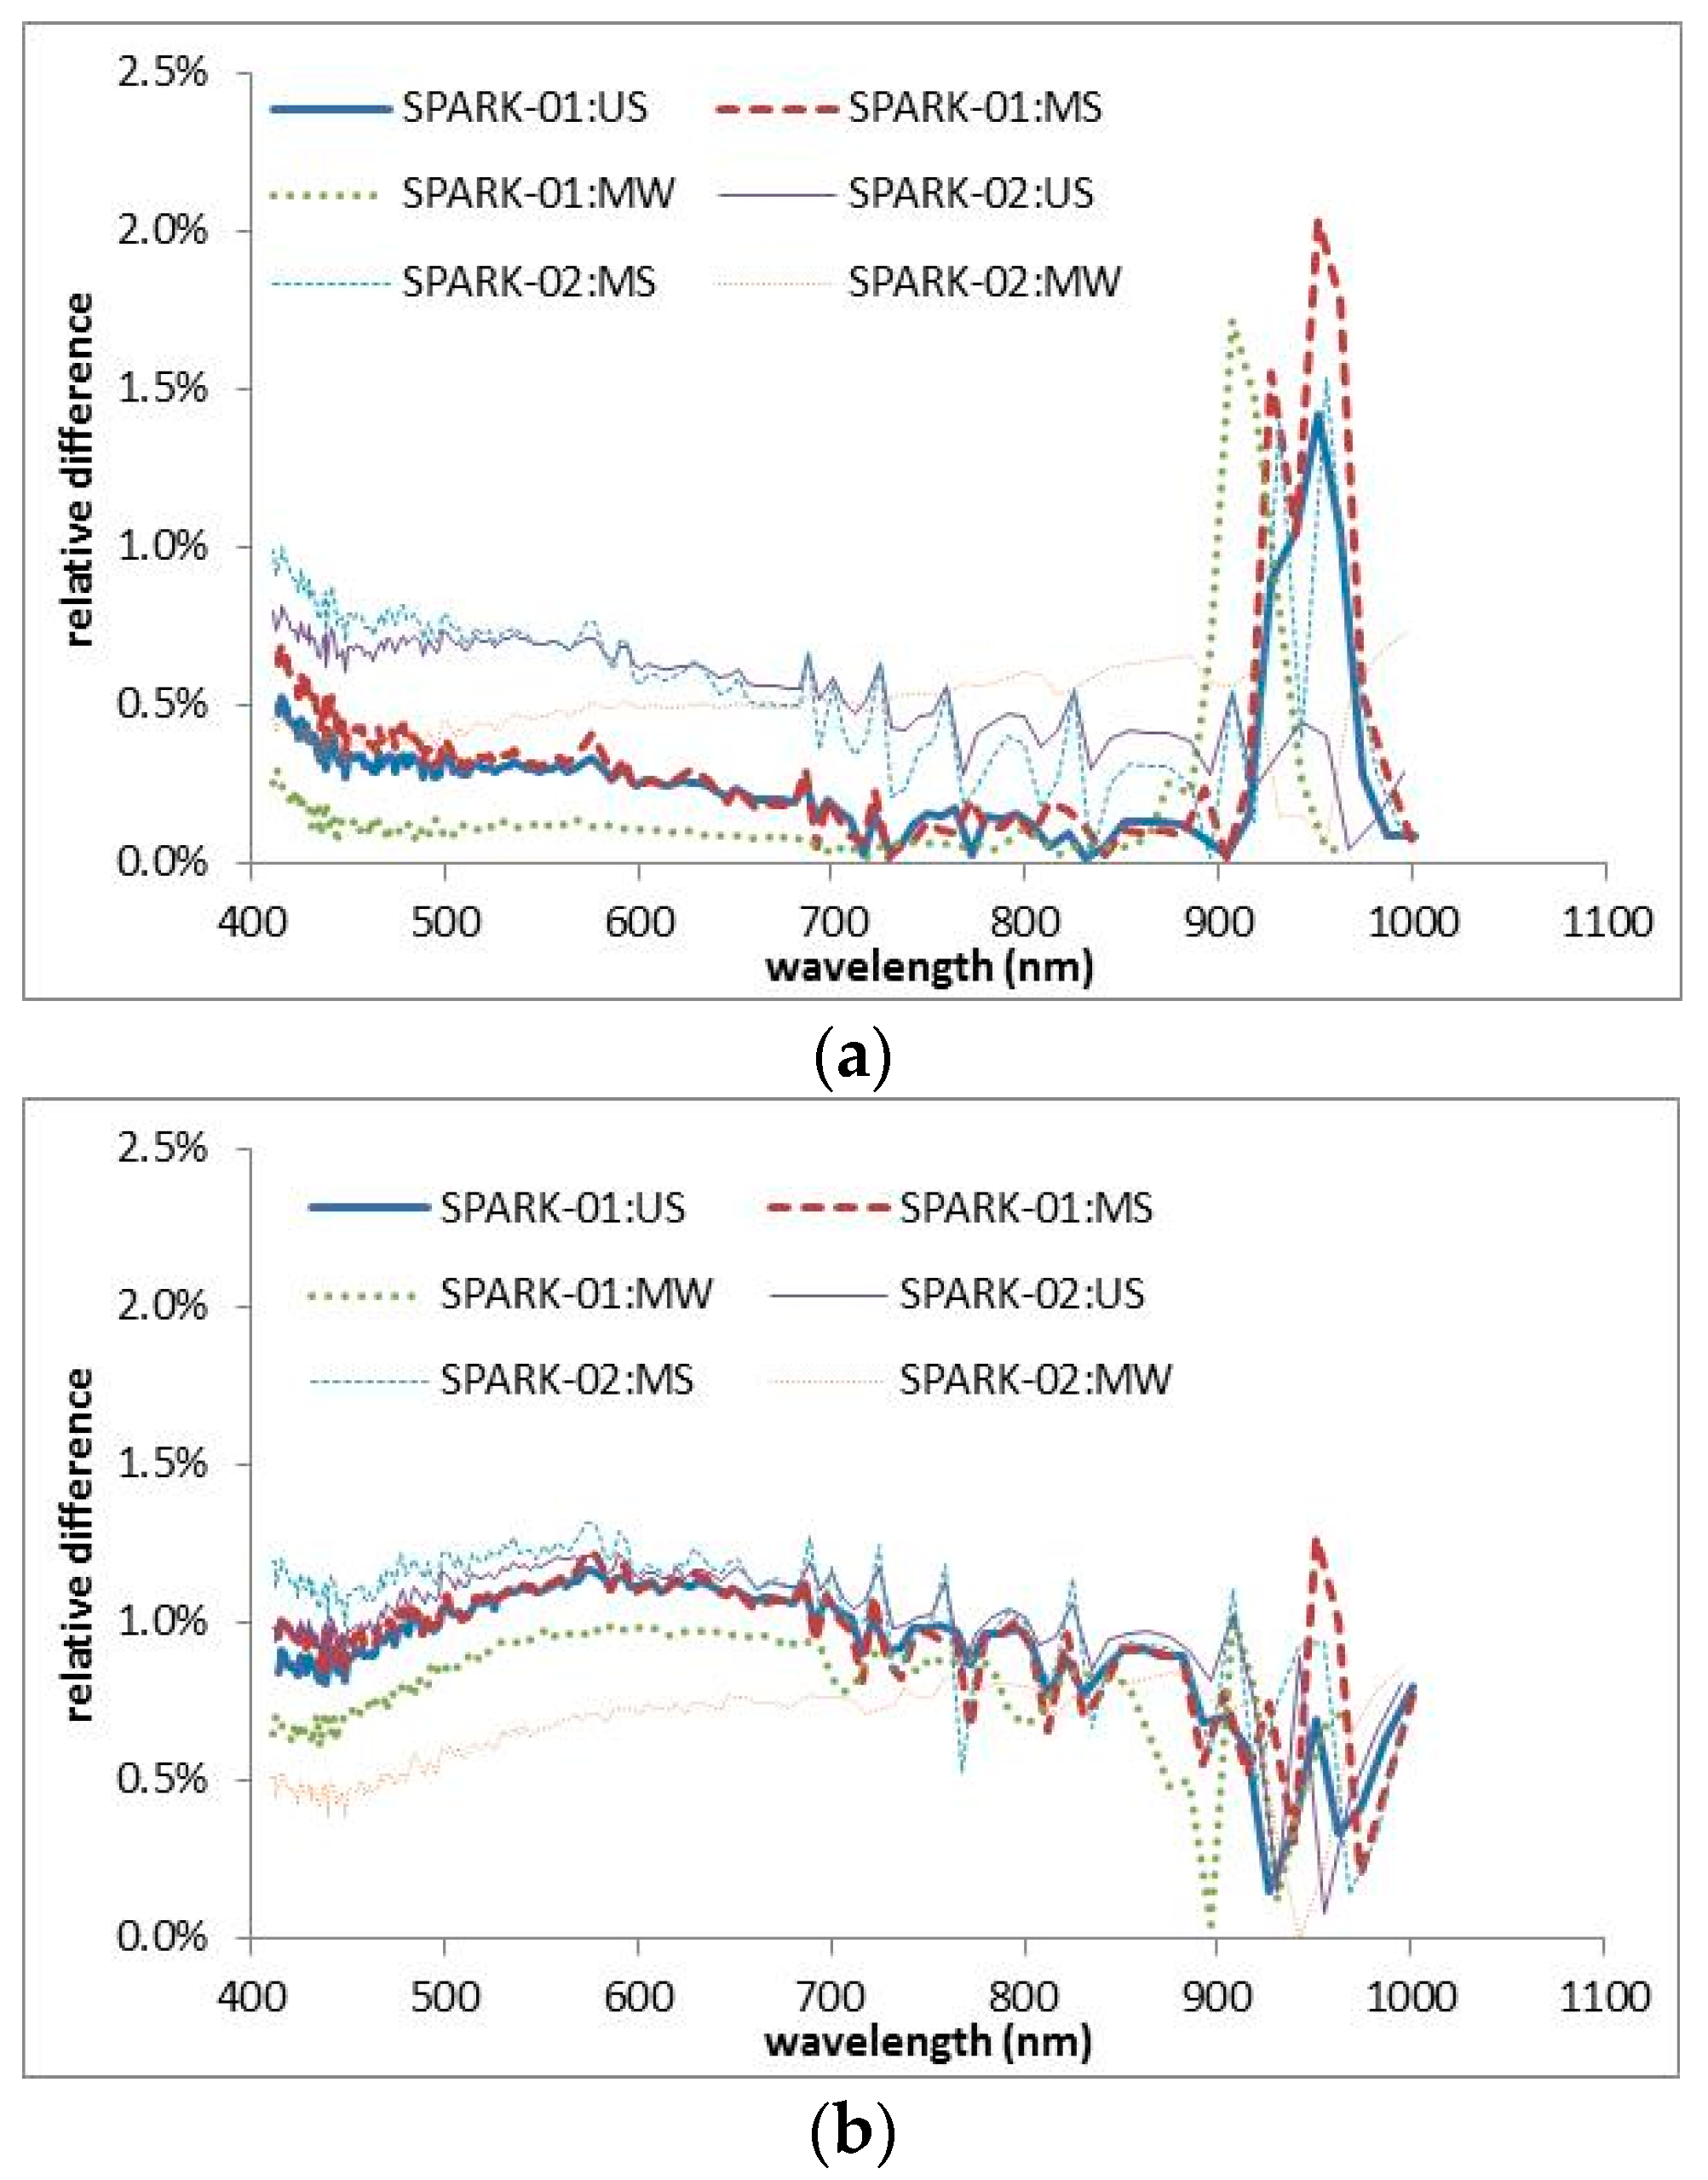
Figure 27.
Calibration uncertainties caused by the vertical atmospheric profile measurements for SPARK-01 and -02 using the (a) reflectance- and (b) irradiance-based methods, respectively. “US”, “MS”, and “MW” refer to the relative difference in predicted radiance derived from replacing radiosonde measurements with these three atmospheric models.
Figure 28.
Averaged DNs from 6 × 6 pixel areas in the calibration site and DNs calculated by shifting the 6 × 6 pixel area by up to two pixels in all directions for SPARK-01 and -02.
Figure 28.
Averaged DNs from 6 × 6 pixel areas in the calibration site and DNs calculated by shifting the 6 × 6 pixel area by up to two pixels in all directions for SPARK-01 and -02.
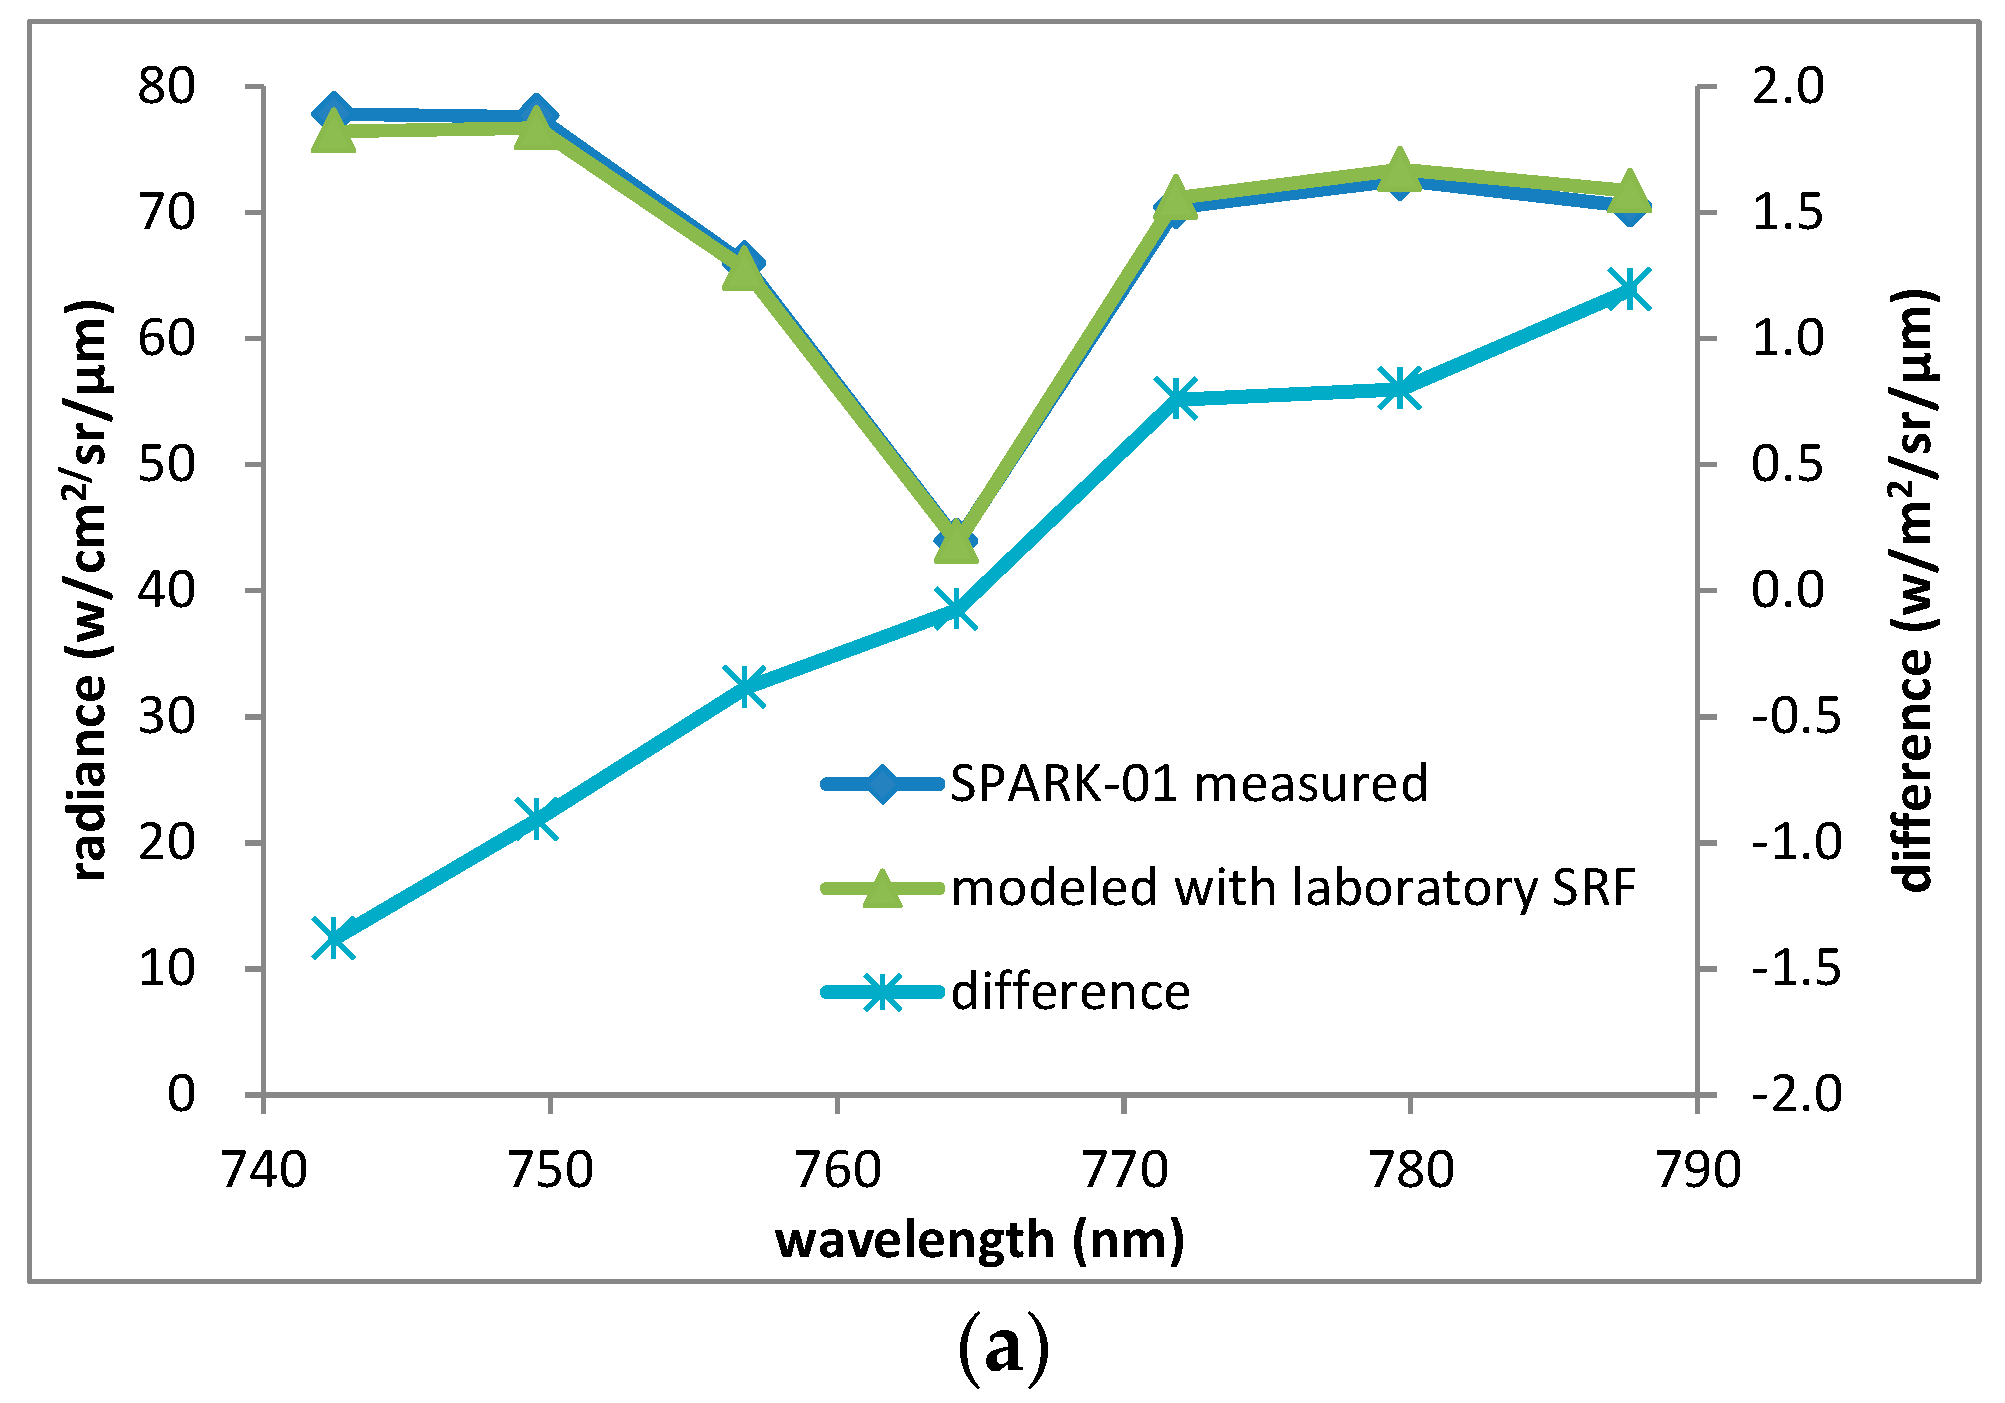
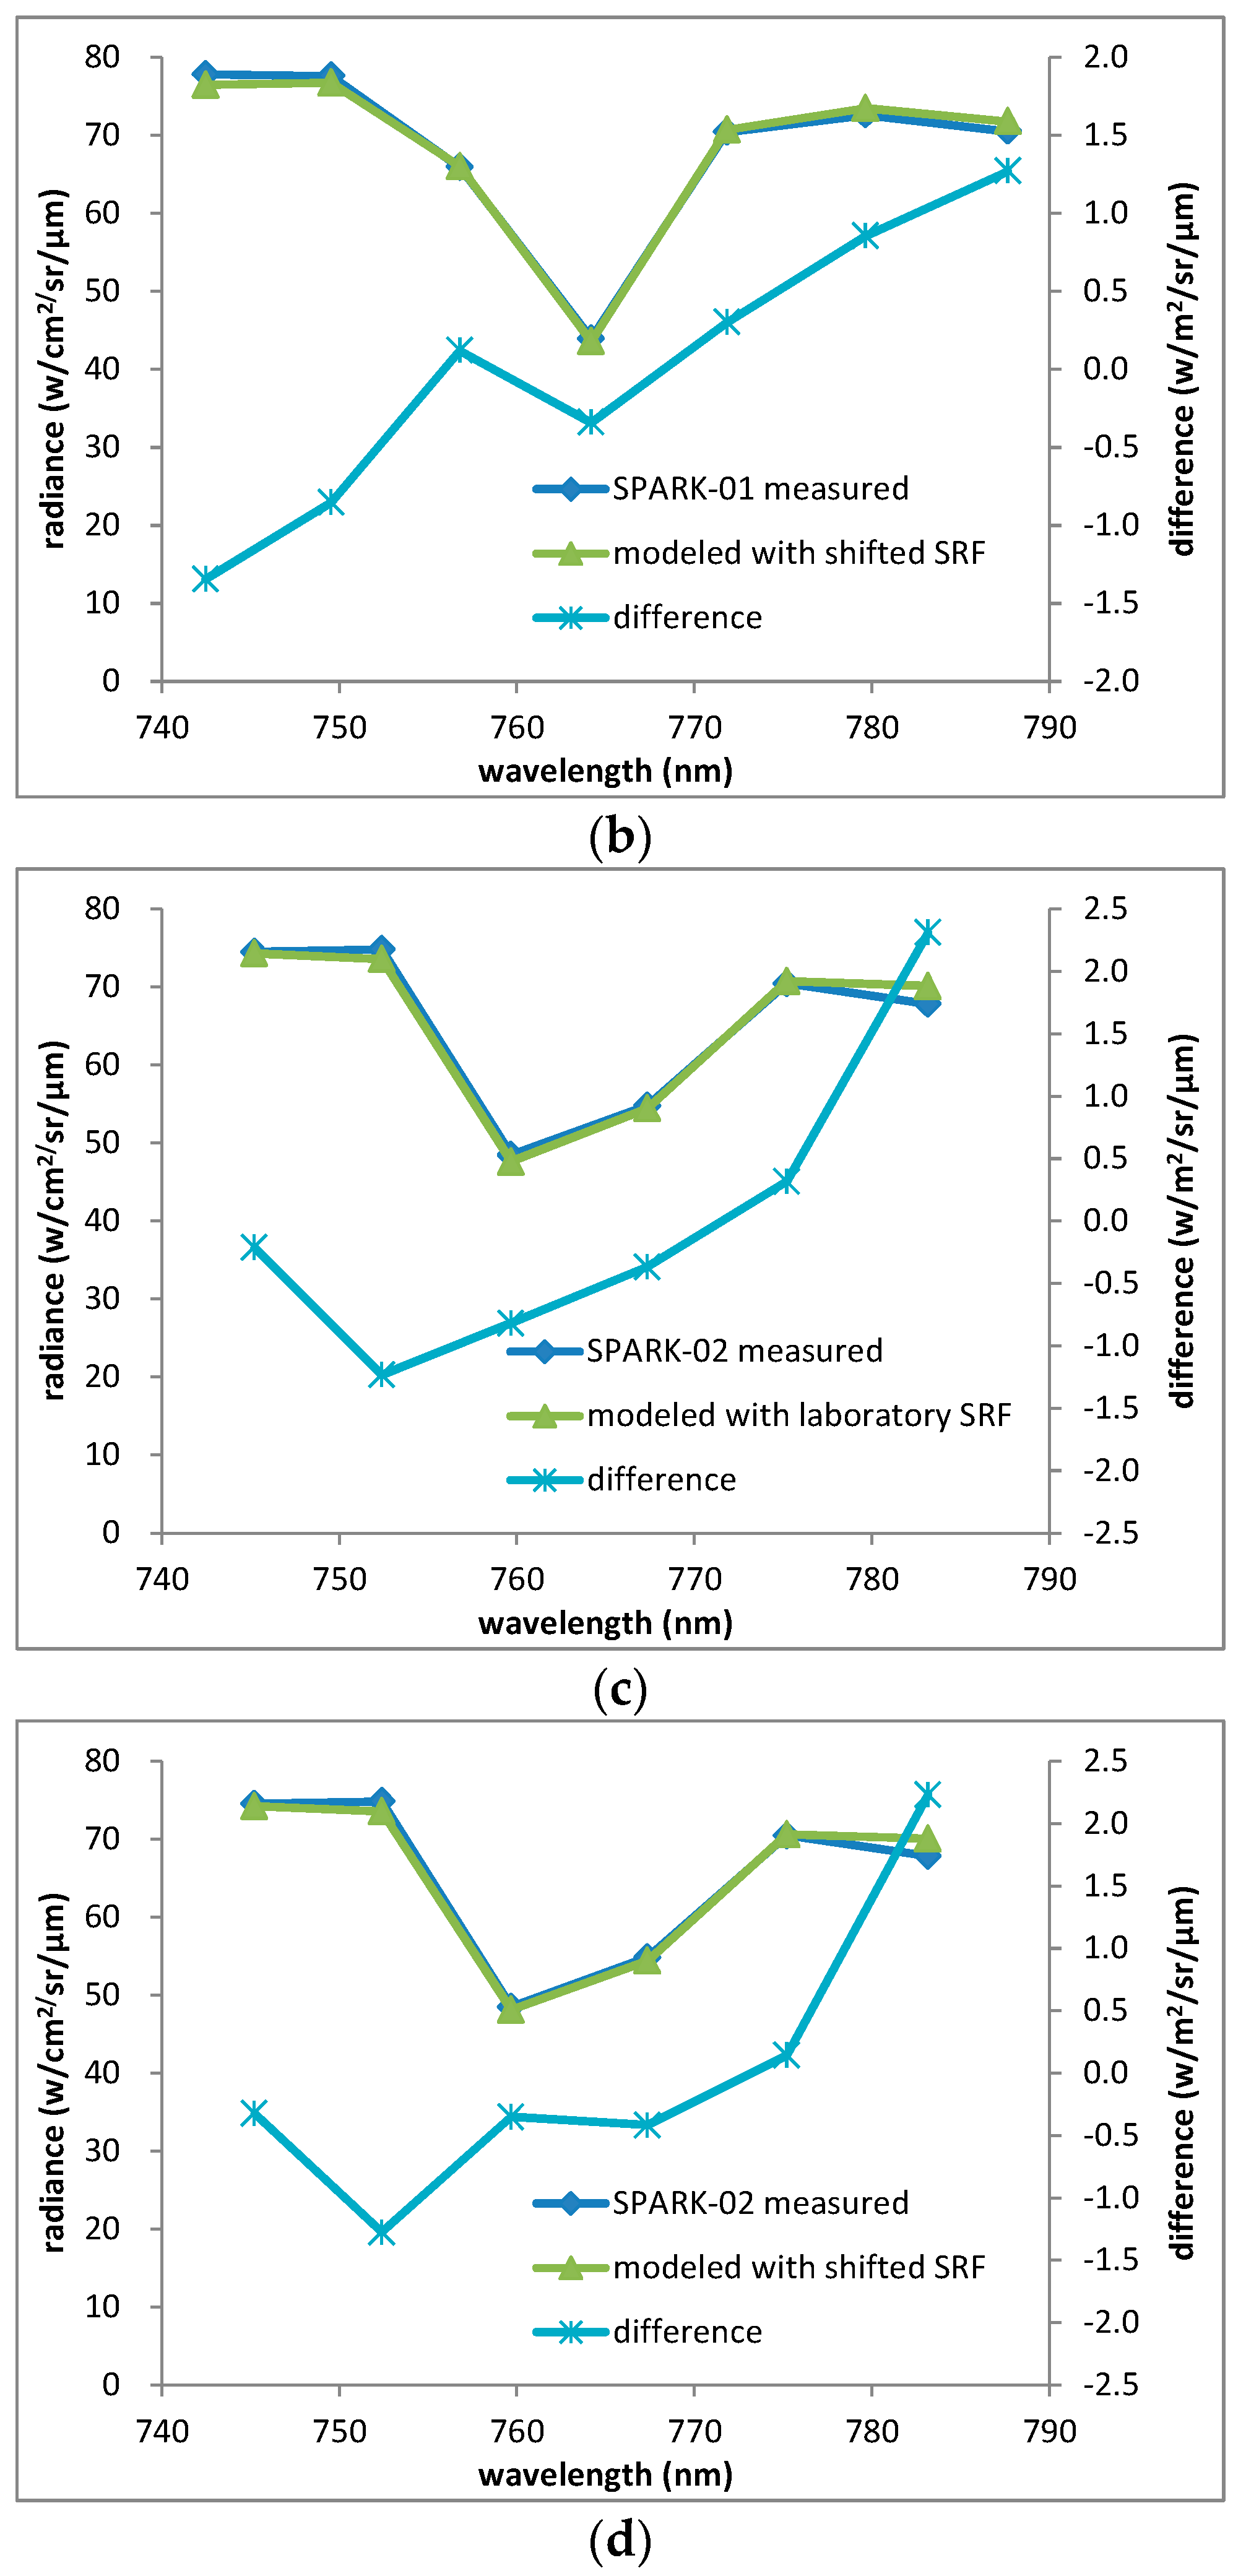
Figure 29.
Spectral fit result and optimal spectral calibration result with an –0.1 nm shift at the desert in Dunhuang (
Figure 5). (
a,
c) are for SPARK-01 before and after spectral shifting; and (
b,
d) are for SPARK-02 before and after spectral shifting.
Figure 29.
Spectral fit result and optimal spectral calibration result with an –0.1 nm shift at the desert in Dunhuang (
Figure 5). (
a,
c) are for SPARK-01 before and after spectral shifting; and (
b,
d) are for SPARK-02 before and after spectral shifting.
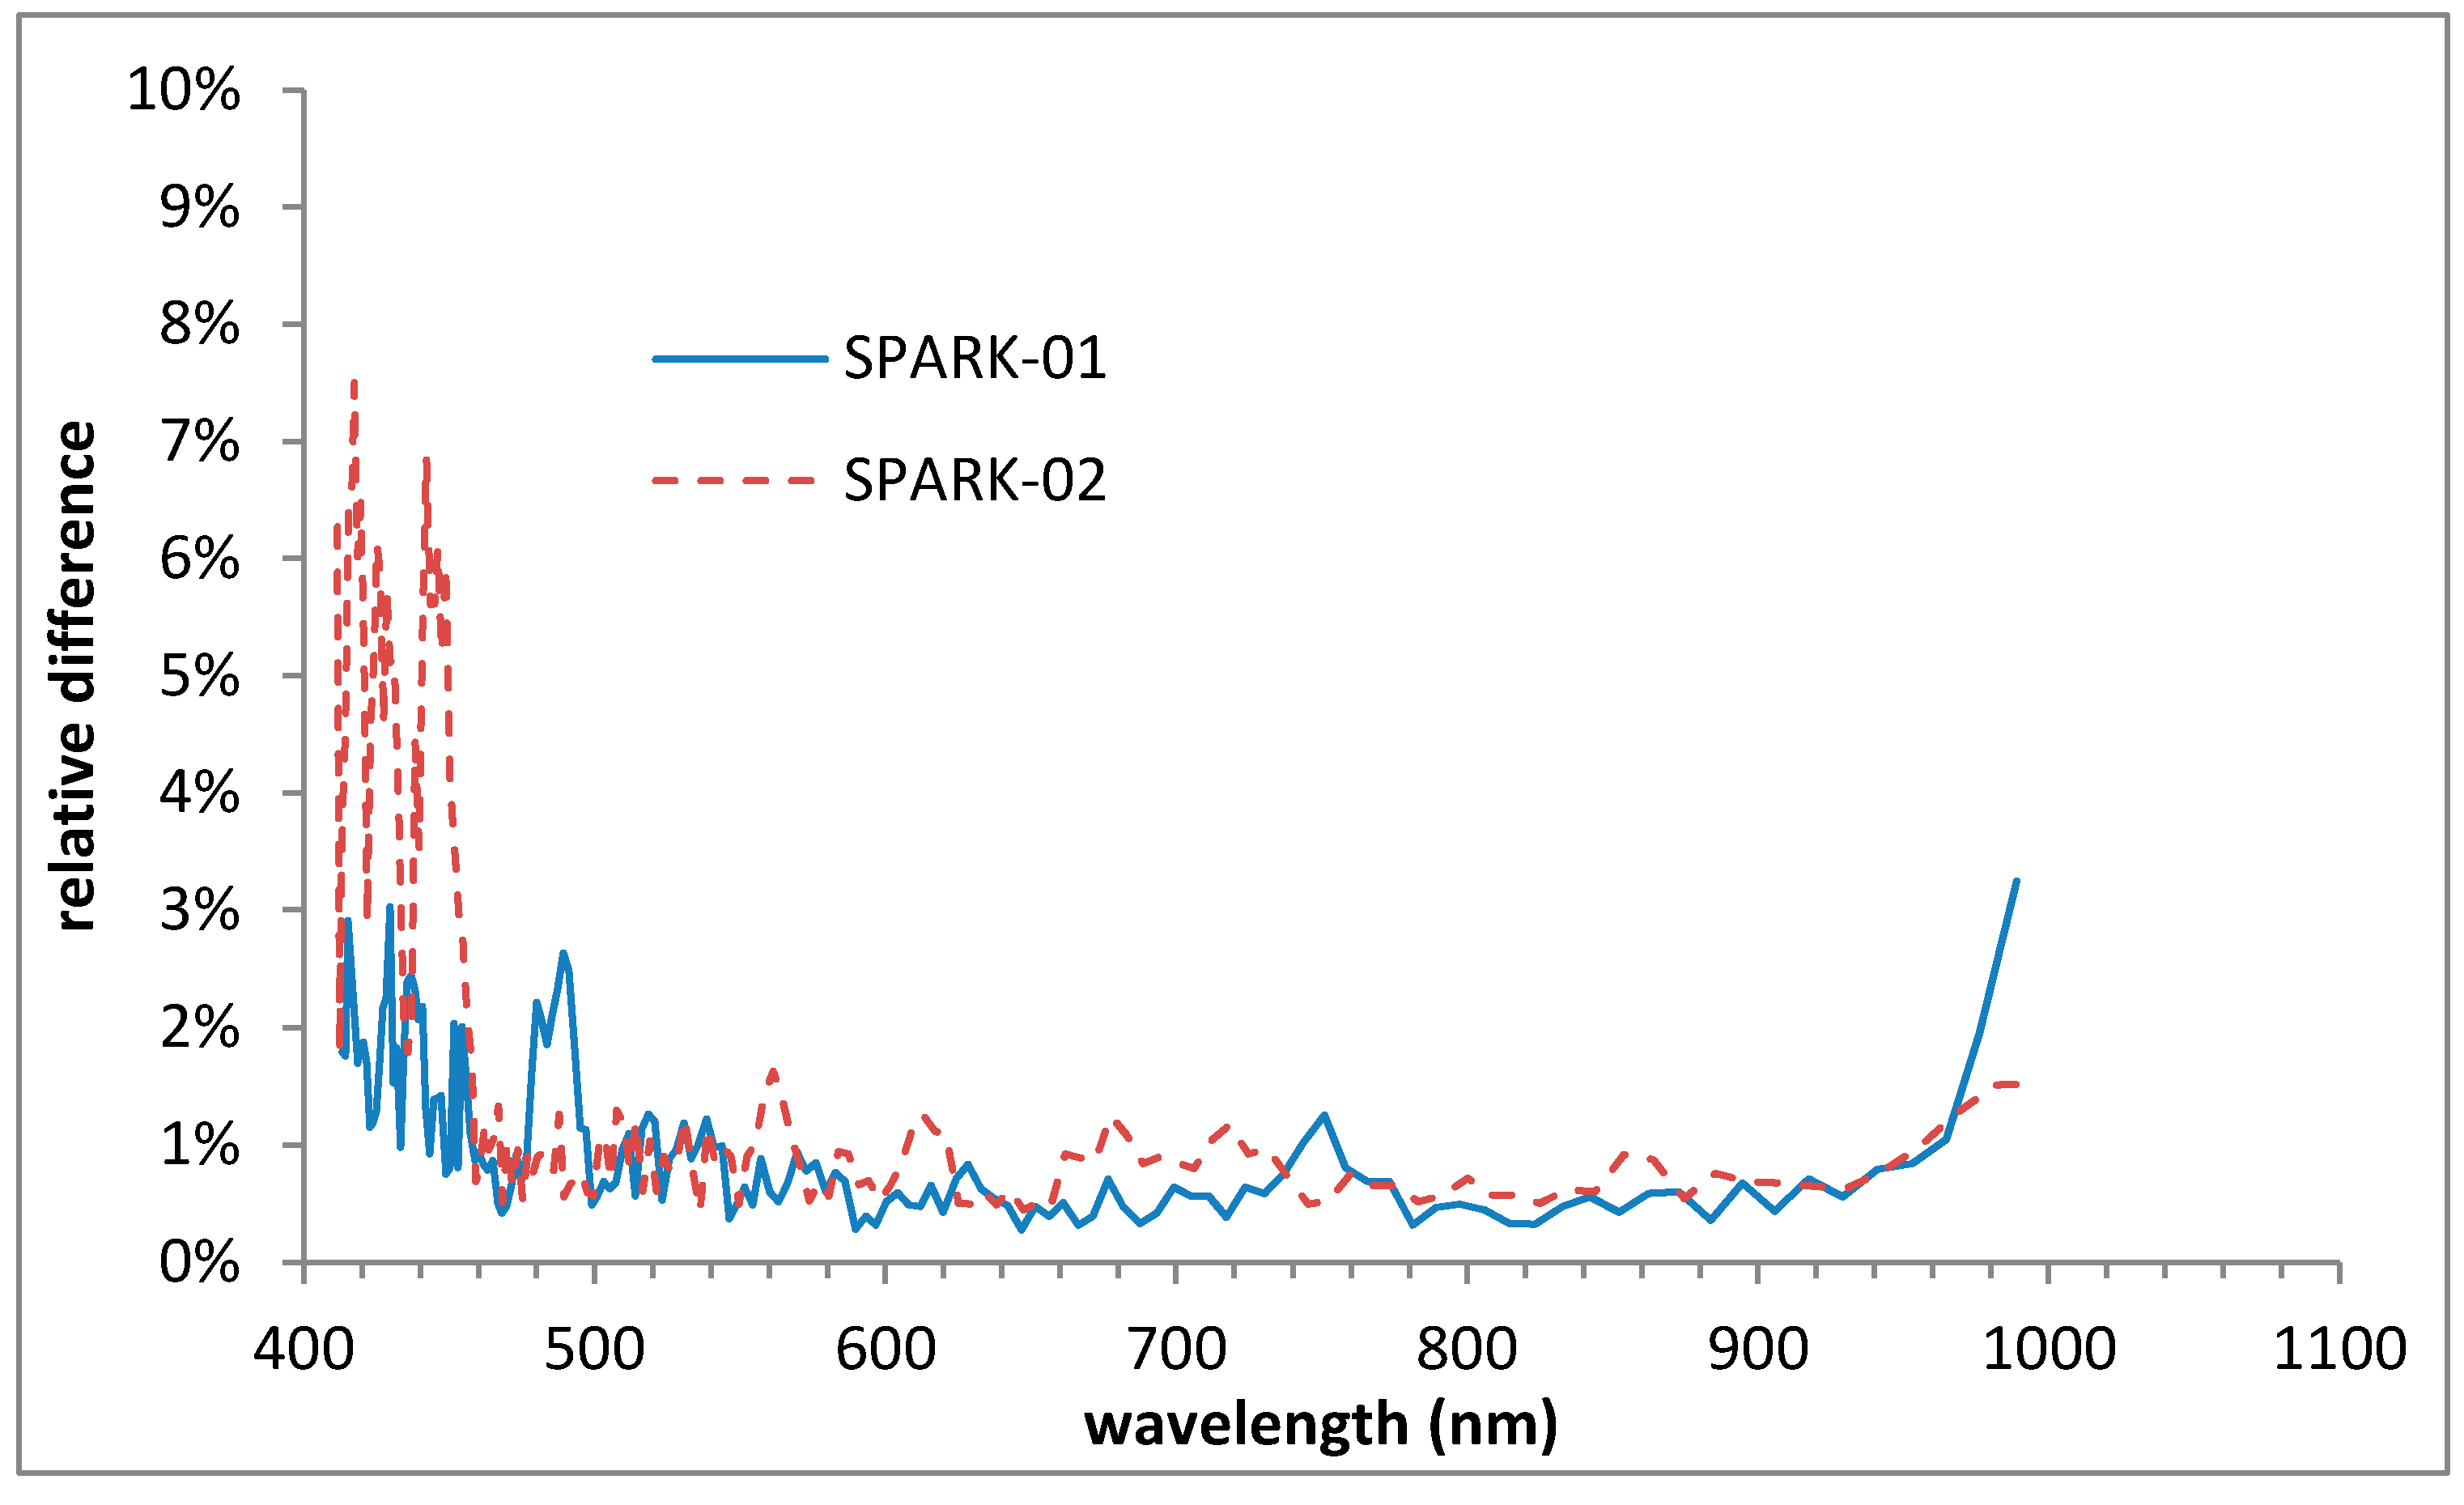
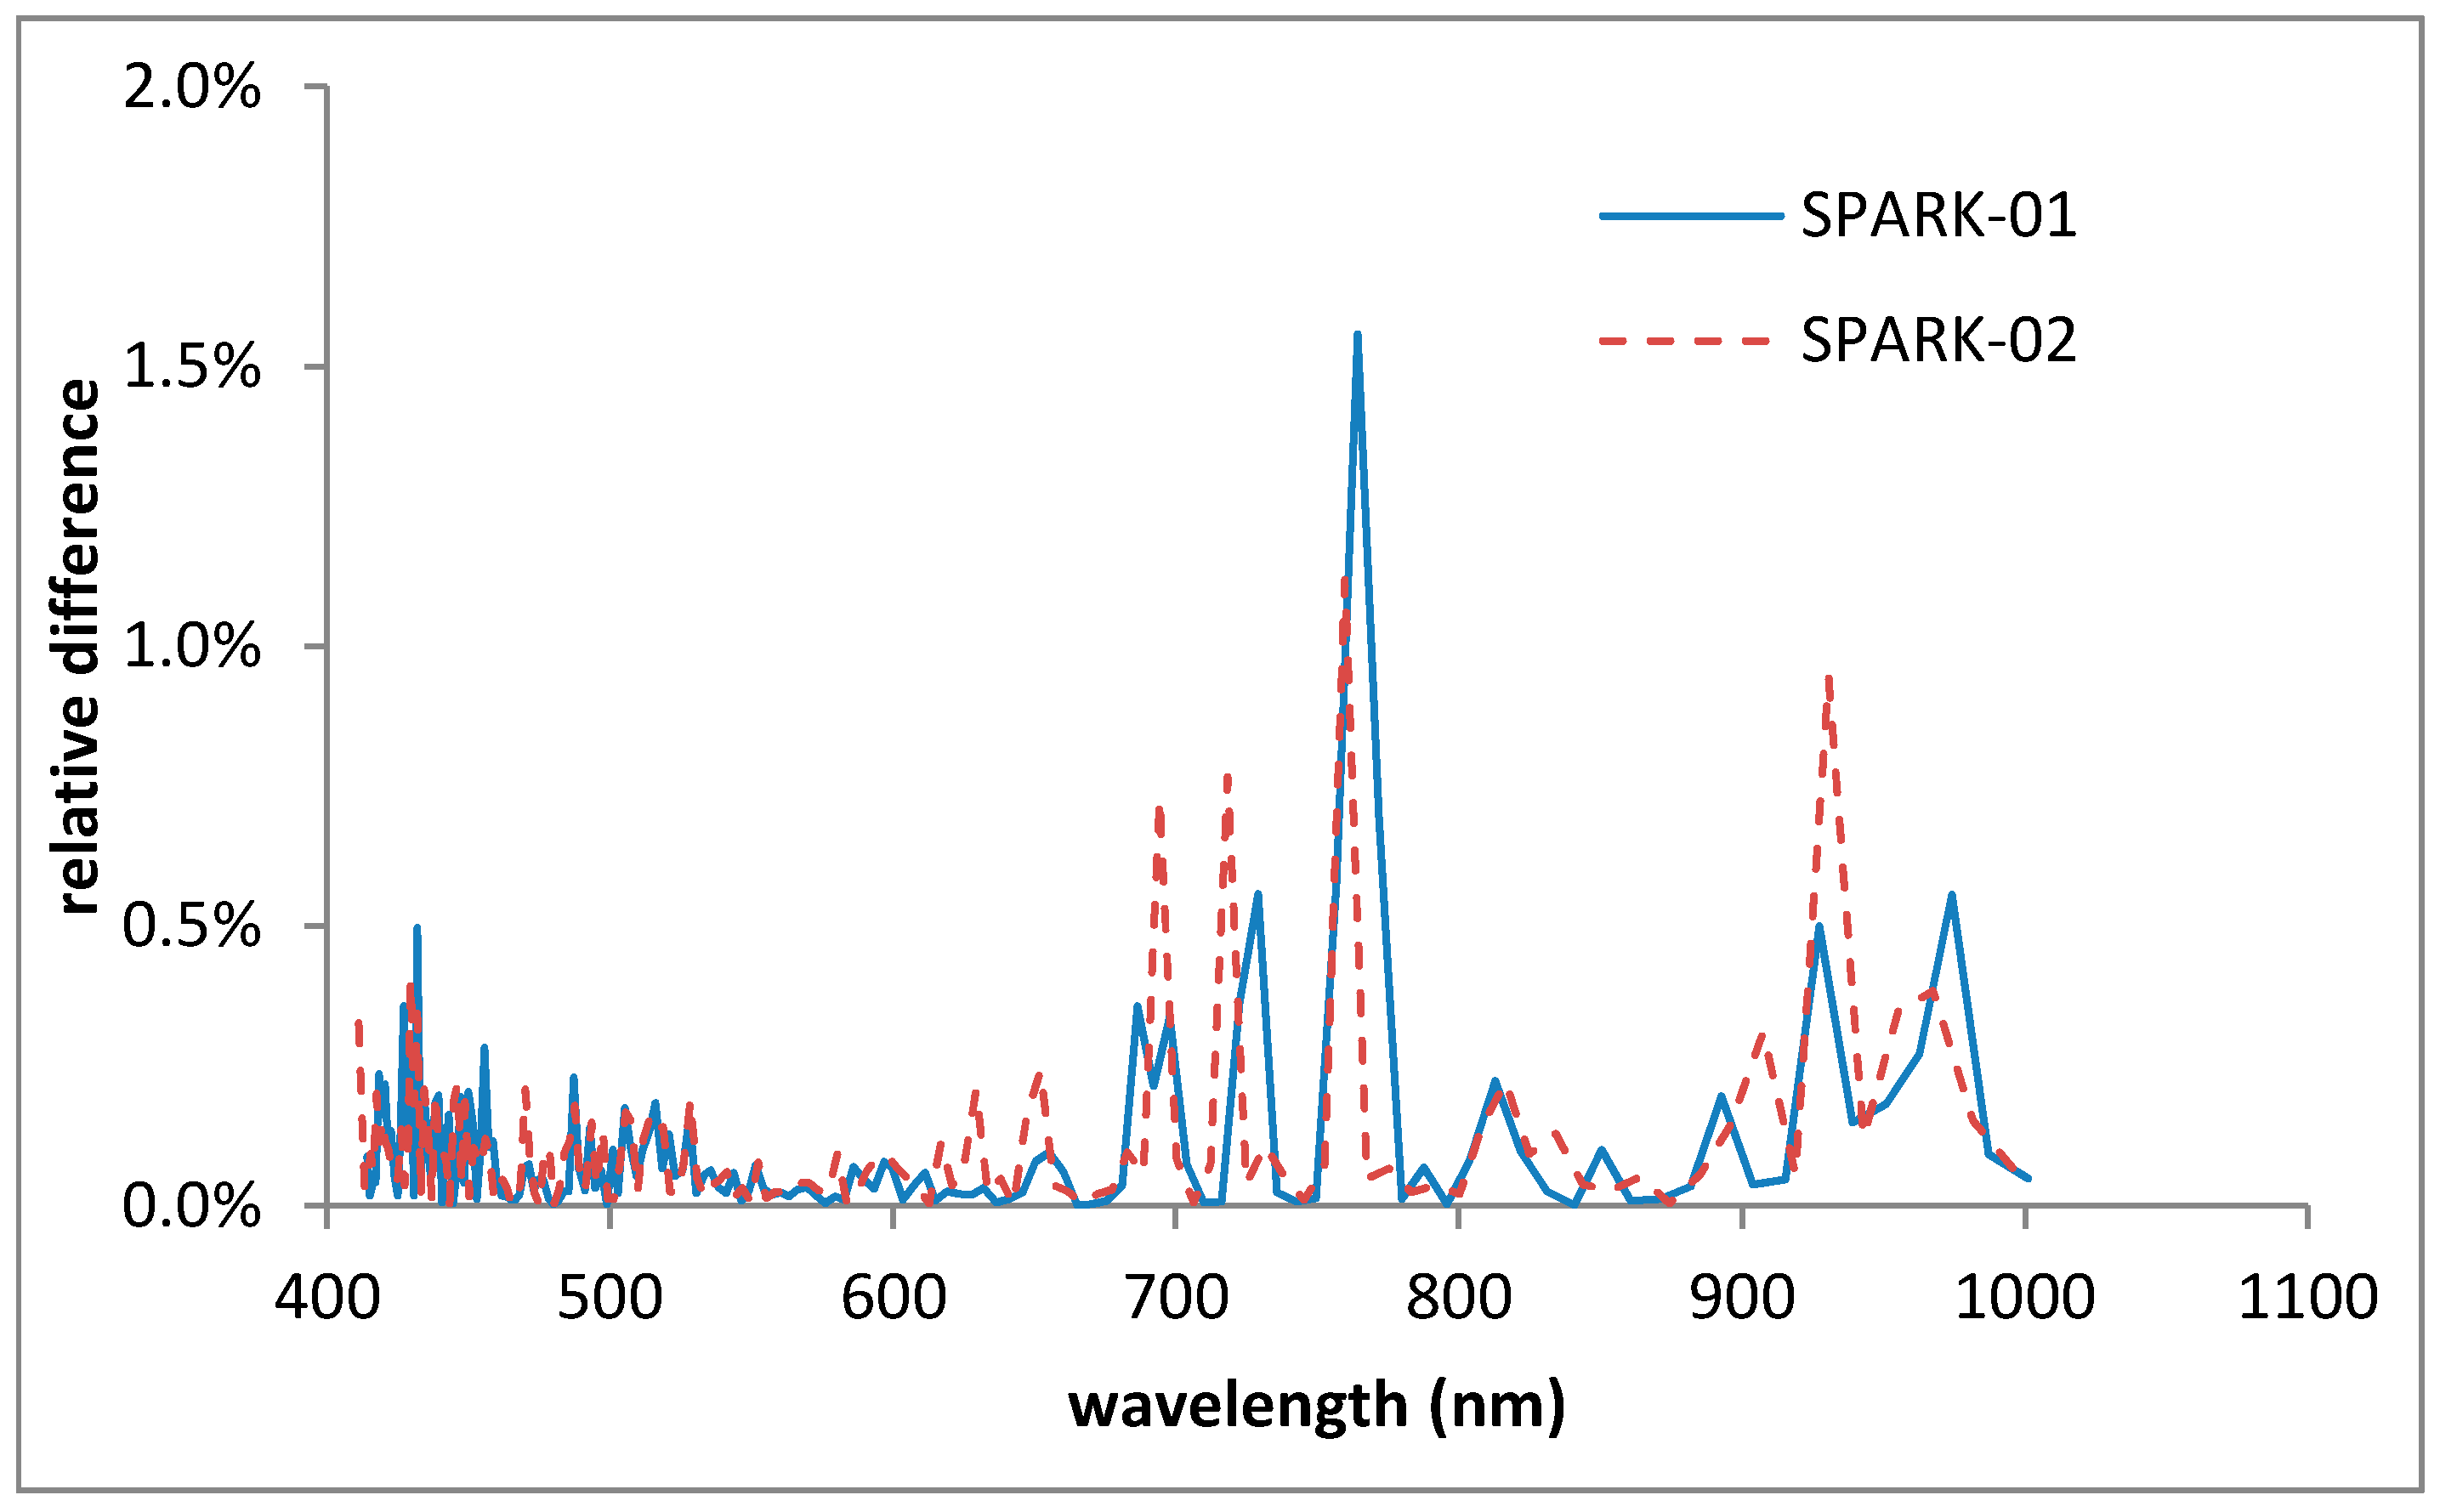
Figure 30.
Calibration uncertainties caused by spectral shift of −0.1 nm for SPARK-01 and -02.
Figure 30.
Calibration uncertainties caused by spectral shift of −0.1 nm for SPARK-01 and -02.
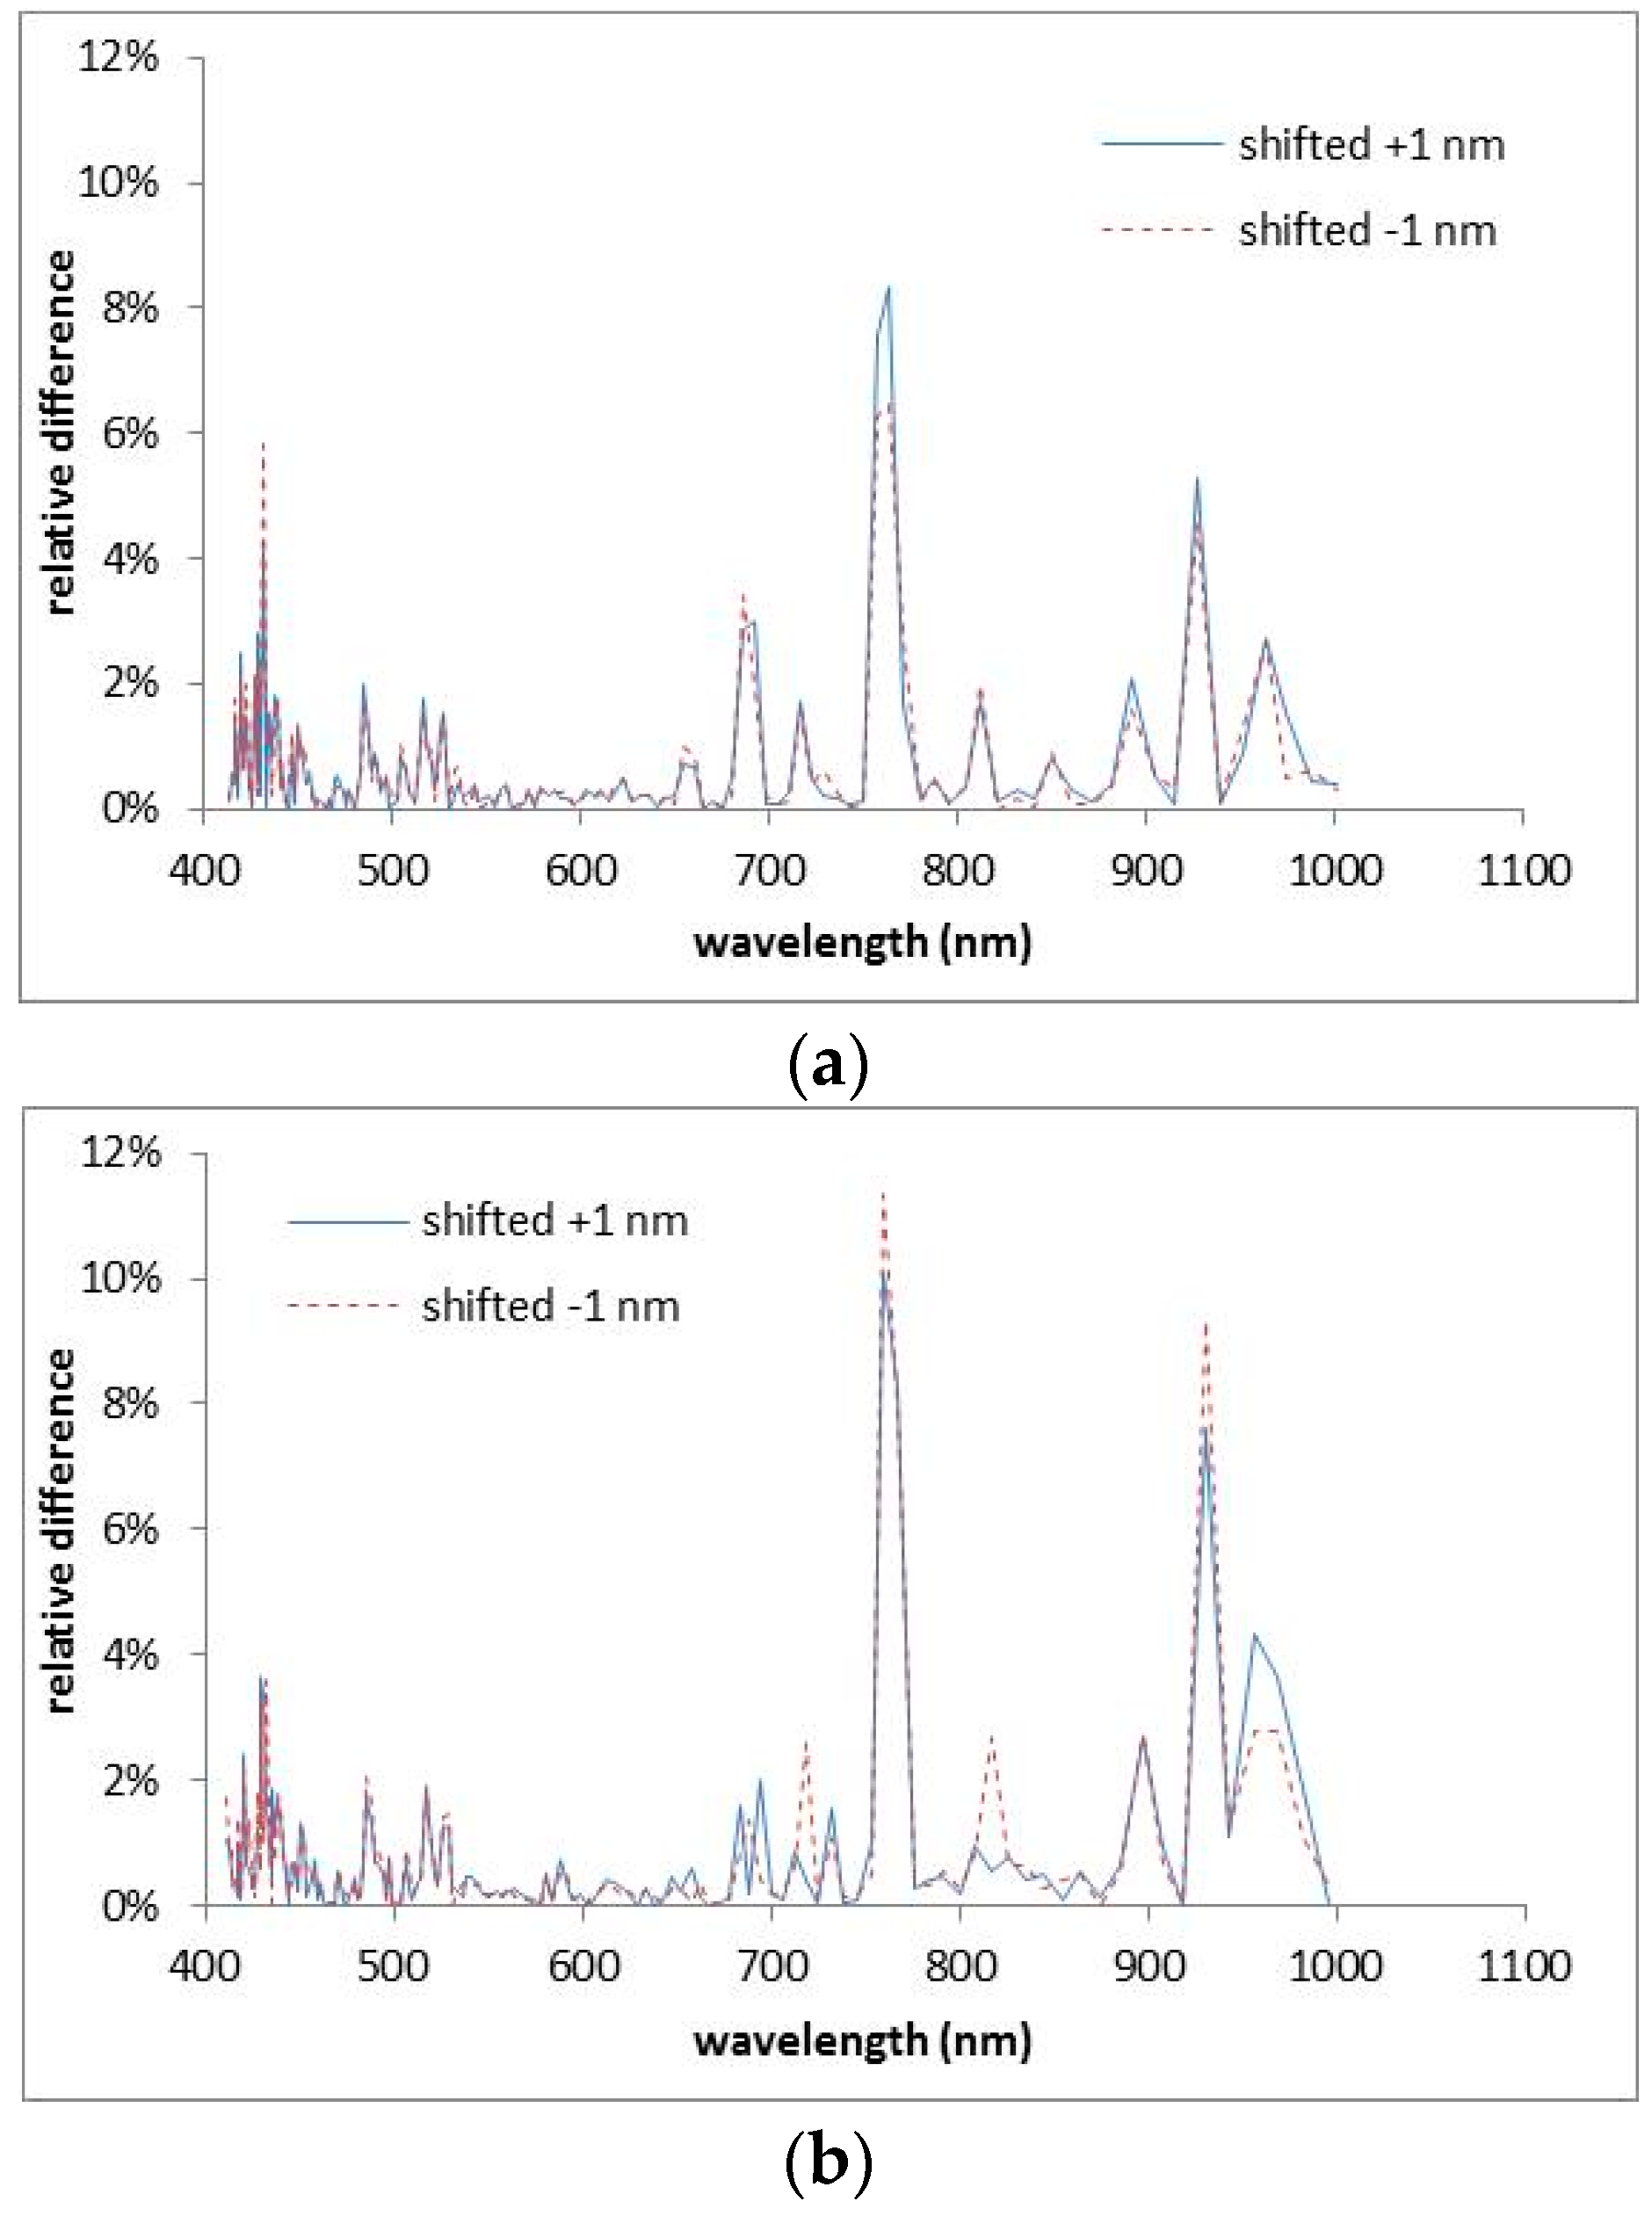
Figure 31.
Calibration uncertainties caused by spectral shift of ±1 nm for SPARK-01 (a) and -02 (b).
Figure 31.
Calibration uncertainties caused by spectral shift of ±1 nm for SPARK-01 (a) and -02 (b).
Figure 32.
Total calibration uncertainty estimated for SPARK-01 and -02 using (a) the reflectance-based method and (b) the irradiance-based method.
Figure 32.
Total calibration uncertainty estimated for SPARK-01 and -02 using (a) the reflectance-based method and (b) the irradiance-based method.
Figure 33.
Central wavelength positions measured pre-launch in laboratory for SPARK-01 and -02.
Figure 33.
Central wavelength positions measured pre-launch in laboratory for SPARK-01 and -02.
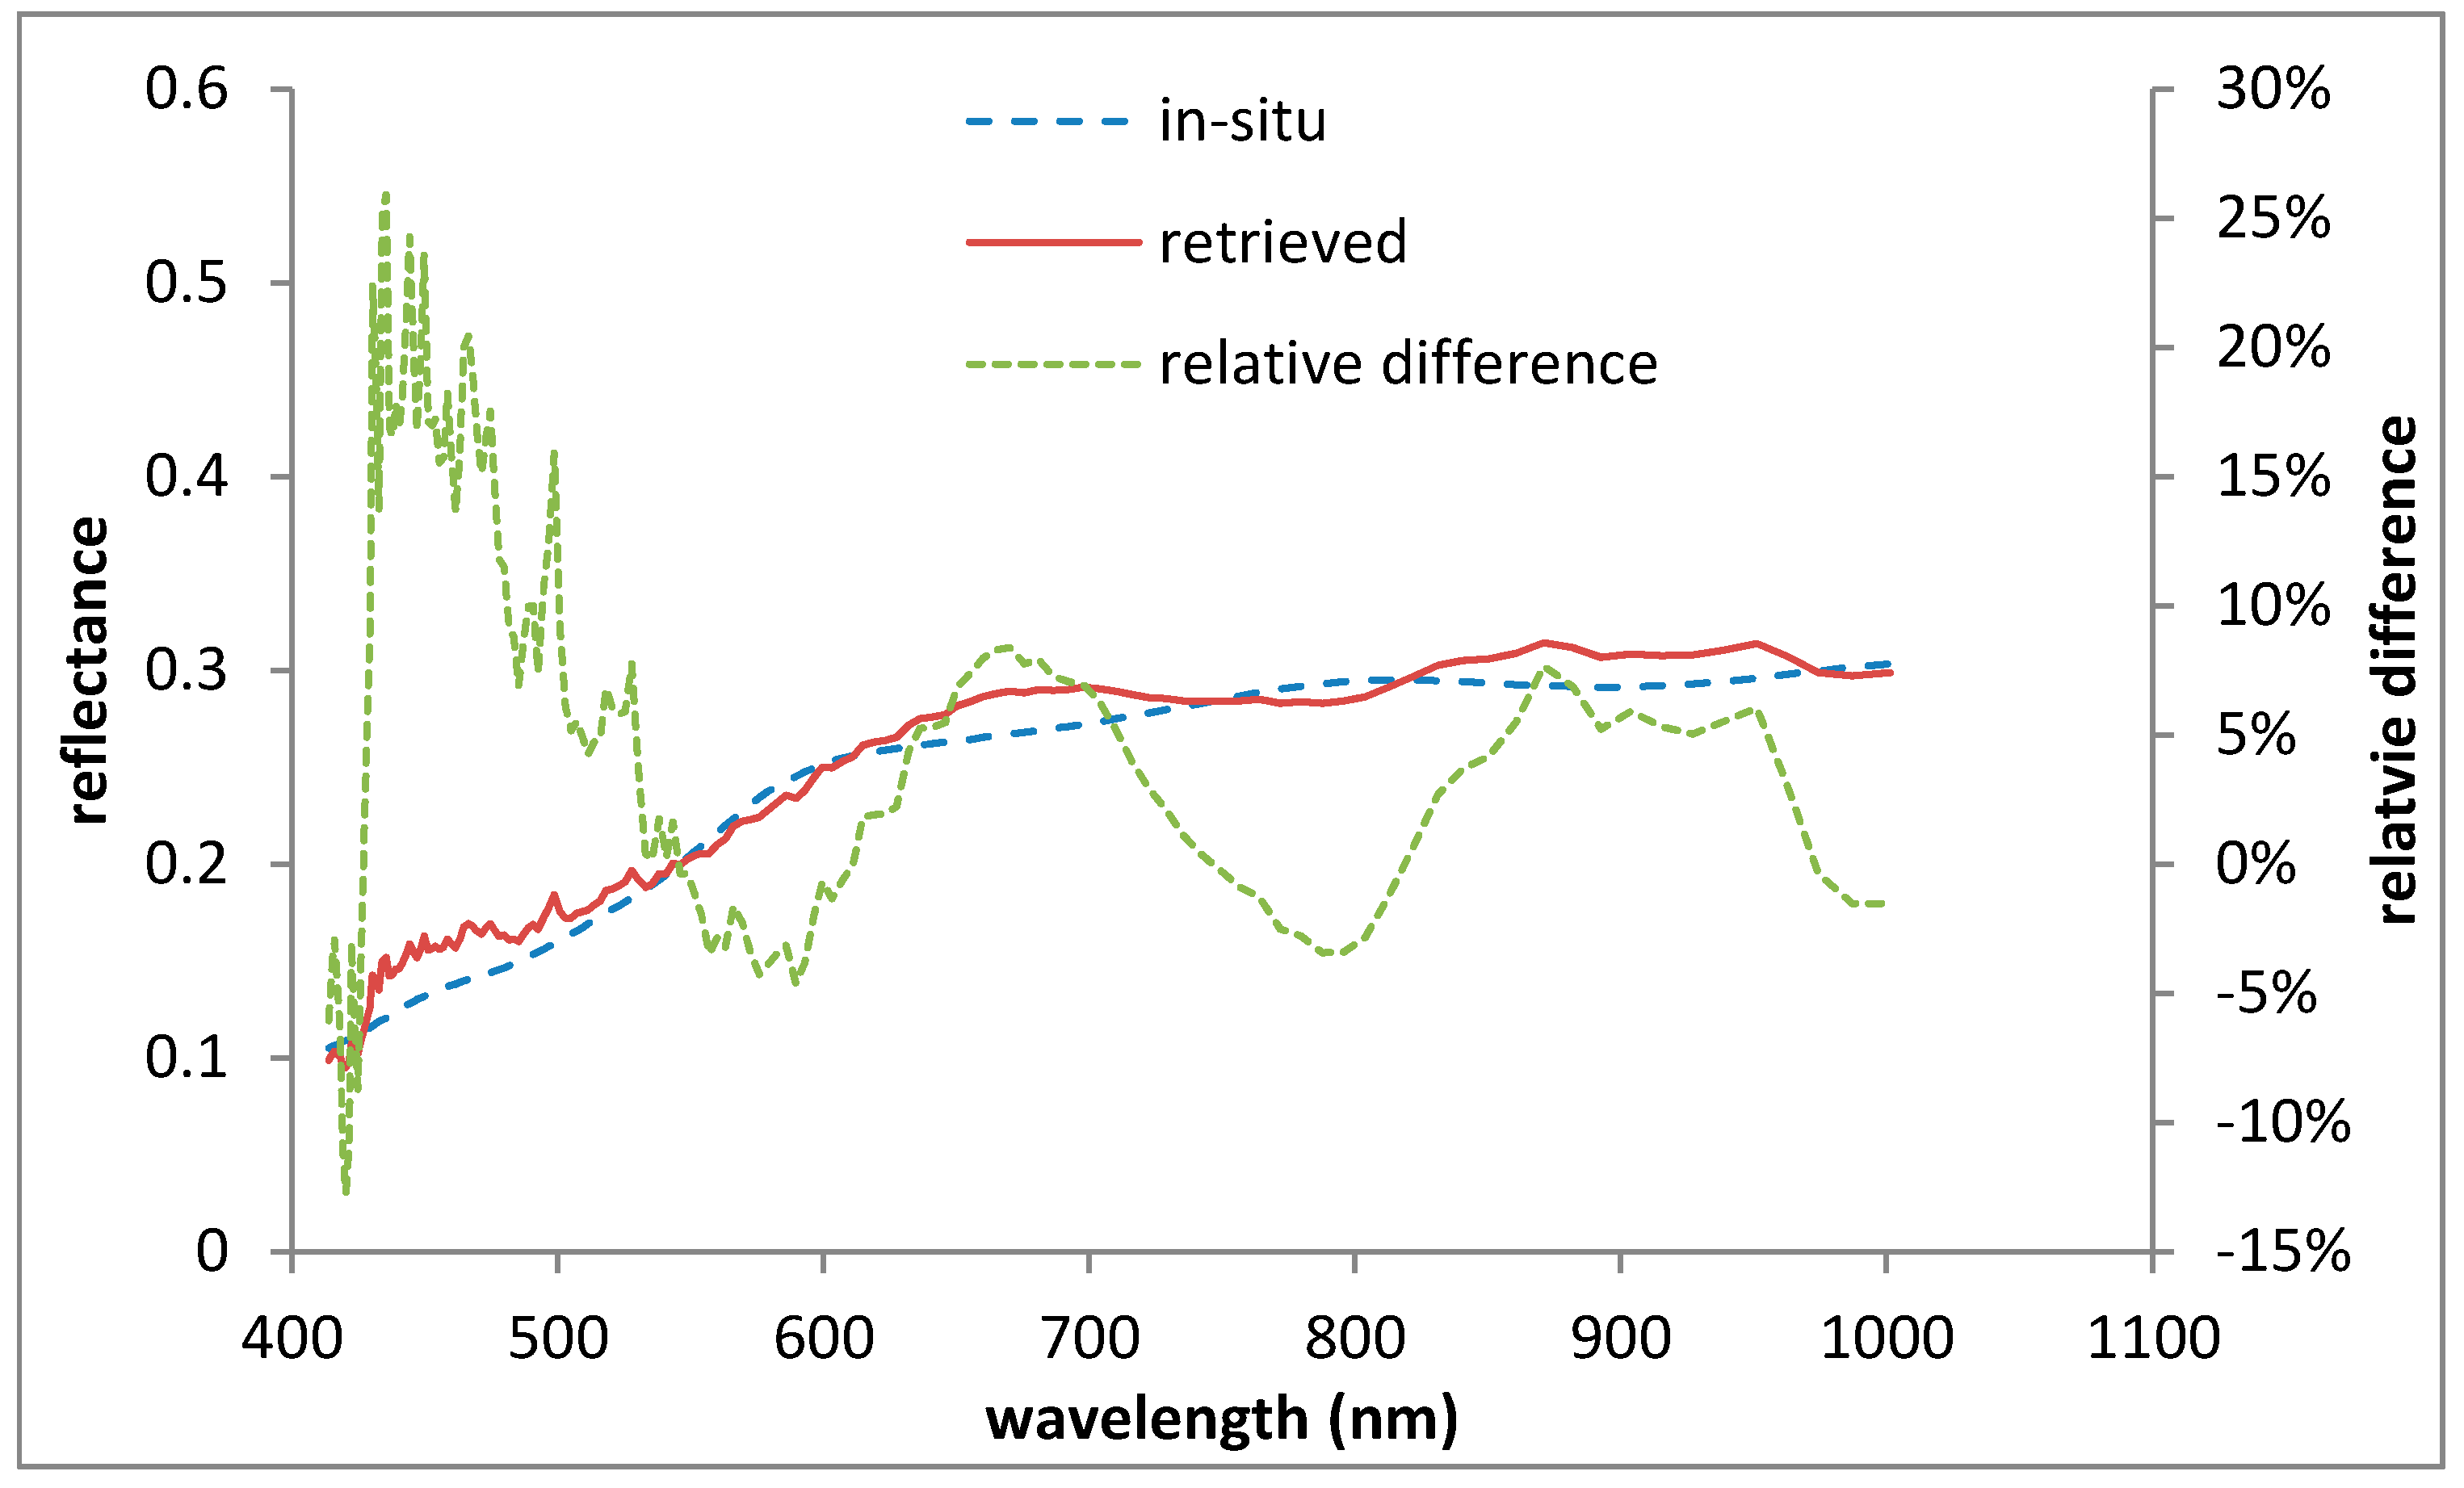
Figure 34.
Comparison of in-situ desert reflectance measurements with retrieved reflectance from the SPARK-01 image acquired on 7 March 2017.
Figure 34.
Comparison of in-situ desert reflectance measurements with retrieved reflectance from the SPARK-01 image acquired on 7 March 2017.
Table 1.
Main characteristics of SPARK satellite and imaging sensor.
Table 1.
Main characteristics of SPARK satellite and imaging sensor.
| Satellite Characteristic | Description |
|---|
| Spectral bands | 160 bands ranging from 400 to 1000 nm
(151 and 153 valid bands for SPARK-01 and -02, respectively) |
| Swath and spatial resolution | 100 km with a resolution of 50 m at nadir viewing |
| Signal-to-noise ratio (SNR) | ≥100:1 on average with conditions: solar zenith = 45°, ground reflectance = 0.3, and visibility = 23 KM. |
| Revisit period | 13–25 days |
| Observation area | 2500 km × 6000 km per day |
| Mass | 50 kg |
| Dimensions | 300 mm × 300 mm × 450 mm |
| Cost | US$ 3 million per satellite |
| Production cycle | 1 year |
| Lifetime | Over 1 year |
Table 2.
SPARK image acquisition information at the Dunhuang calibration site.
Table 2.
SPARK image acquisition information at the Dunhuang calibration site.
| Date | Satellite | Pass Time (UTC) | Solar Zenith (°) | Solar Azimuth (°) | Viewing Zenith (°) | Viewing Azimuth (°) |
|---|
| 7 March | SPARK-01 | 6:48 | 47.0579 | 198.5470 | 5.0 | 93.101 |
| 28 Febraury | SPARK-02 | 6:52 | 49.8249 | 198.4959 | 1.9 | 88.011 |
Table 3.
SPARK image acquisition information for the relative calibration.
Table 3.
SPARK image acquisition information for the relative calibration.
| Date | Satellite | Imaging Time (UTC) | Lines | Location | Imaging Manner |
|---|
| 13 March | SPARK-01 | 19:29 | 79,640 | 26.335°N, 160.668°E (Coral Sea) | Normal |
| 11 March | SPARK-01 | 21:12 | 39,911 | 12.352°N, 29.810°E (Sudan) | 90° yaw |
| 27 Febraury | SPARK-02 | 12:04 | 42,645 | 60.634°N, 22.301°W (Labrador Sea) | Normal |
| 11 Febraury | SPARK-02 | 20:36 | 22,960 | 13.849°N, 12.874°E (Niger) | 90° yaw |
Table 4.
Average relative differences in radiance for the SPARK-01 and -02 satellites.
Table 4.
Average relative differences in radiance for the SPARK-01 and -02 satellites.
| Satellite | SPARK-01 | SPARK-02 |
|---|
| Method | Rural and Urban | Rural and Maritime | Rural and Desert | Rural and Urban | Rural and Maritime | Rural and Desert |
|---|
| Reflectance-based | 6.58% | 0.76% | 1.46% | 14.46% | 1.77% | 3.78% |
| Irradiance-/improved irradiance-based | 2.07% | 0.30% | 0.58% | 9.23% | 0.23% | 2.63% |
Table 5.
Estimated uncertainty associated with the reflectance-based method.
Table 5.
Estimated uncertainty associated with the reflectance-based method.
| Source of Uncertainty | SPARK-01 Uncertainty (%) | SPARK-02 Uncertainty (%) |
|---|
| Ground reflectance measurement | 2.0 | 2.0 |
| Non-Lambertian ground properties | 2.0 | 2.0 |
| AOD retrieval | 0–0.6 | 0–0.7 |
| Water vapor retrieval | 0–3.0 | 0–3.8 |
| Ozone absorption computation | 0.6 | 0.6 |
| Assumption of aerosol type | 2.1–3.6 | 5.9–7.8 |
| Assumption of atmospheric model | 0–1.7 | 0.3–0.8 |
| Radiative transfer code accuracy | 1 | 1 |
| Spectral wavelength shift | 0–1.6 | 0–1.1 |
| Image uncertainty errors | 0.3–3.3 | 0.4–7.5 |
| Total uncertainty (root sum of squares) | 4.0–5.5 | 7.3–10.4 |
Table 6.
Estimated uncertainty associated with the irradiance-based method used for SPARK-01 and the improved irradiance-based method used for SPARK-02.
Table 6.
Estimated uncertainty associated with the irradiance-based method used for SPARK-01 and the improved irradiance-based method used for SPARK-02.
| Source of Uncertainty | SPARK-01 Uncertainty (%) | SPARK-02 Uncertainty (%) |
|---|
| Ground reflectance measurement | 2.0 | 2.0 |
| AOD retrieval | 1.5–2.6 | 0.9–1.4 |
| Water vapor retrieval | 0–2.9 | 0–3.8 |
| Ozone absorption computation | 0.6 | 0.6 |
| Assumption of aerosol type | 0.4–1.5 | 3.3–5.0 |
| Assumption of atmospheric model | 0.2–1.2 | 0.2–1.2 |
| Radiative transfer code accuracy | / | 1.0 |
| Spectral wavelength shift | 0–1.6 | 0–1.1 |
| Image uncertainty errors | 0.3–3.3 | 0.4–7.5 |
| Ratio of diffuse-to-global irradiance measurement | 2.0 | 2.0 |
| Total uncertainty (root sum of squares) | 3.9–5.1 | 5.2–9.4 |
Table 7.
Average relative differences for various wavelength ranges.
Table 7.
Average relative differences for various wavelength ranges.
| Wavelength Range (nm) | Reflectance-Based Method (SPARK-01) | Irradiance-Based Method (SPARK-01) | Wavelength Range (nm) | Reflectance-Based Method (SPARK-02) | Improved Irradiance-Based Method (SPARK-02) |
|---|
| - | - | - | 411–454 | 8.90 ± 0.75% | 7.60 ± 0.90% |
| - | - | - | >456 | 8.12 ± 0.29% | 5.86 ± 0.29% |
| All bands | 4.71 ± 0.34% | 4.11 ± 0.21% | All bands | 8.31 ± 0.56% | 6.28 ± 0.90% |
Table 8.
Differences between the TOA radiance predicted by the vicarious methods (i.e., the Reflectance-, Irradiance-, and Improved irradiance-based methods) and that from MODIS image radiance.
Table 8.
Differences between the TOA radiance predicted by the vicarious methods (i.e., the Reflectance-, Irradiance-, and Improved irradiance-based methods) and that from MODIS image radiance.
| MODIS Band | Central Wavelength (nm) | 28 February | 7 March |
|---|
| Reflectance | Improved Irradiance | Reflectance | Irradiance |
|---|
| 1 | 646 | −4.41% | −5.54% | 1.18% | −1.85% |
| 2 | 856 | −10.35% | −8.41% | −3.57% | −3.95% |
| 3 | 466 | −1.24% | −4.84% | 2.37% | −4.30% |
| 4 | 554 | −2.56% | −5.33% | 2.39% | −2.68% |
| 5 | 1242 | −15.47% | −10.94% | −6.60% | −2.74% |
| 6 | 1629 | −13.84% | −7.48% | −5.10% | 1.65% |
| 7 | 2114 | −9.89% | 3.58% | −3.63% | 7.97% |


