Article

Identification of Leveled Archeological Mounds (Höyük) in the Alluvial Plain of the Ceyhan River (Southern Turkey) by Satellite Remote-Sensing Analyses

1
Dipartimento di Scienze della Terra, Università di Pisa, Pisa 56126, Italy
2
Istituto Nazionale di Geofisica e Vulcanologia, Pisa 56126, Roma, Italy
3
Consiglio Nazionale delle Ricerche, Istituto di Geoscienze e Georisorse, Pisa 56124, Italy
4
Dipartimento di Scienze della Terra e Geoambientali, Università di Bari, Bari 70125, Italy
5
Consiglio Nazionale delle Ricerche, Istituto di Studi sul Mediterraneo Antico, Roma 00015, Italy
*
Author to whom correspondence should be addressed.
Remote Sens. 2018, 10(2), 241; https://doi.org/10.3390/rs10020241
Submission received: 22 December 2017 / Revised: 26 January 2018 / Accepted: 4 February 2018 / Published: 5 February 2018
(This article belongs to the Special Issue Advances in Remote Sensing for Archaeological Heritage)

Abstract

:
The alluvial plain of the Ceyhan River (SE Turkey) has been populated since the Neolithic. In 1954, Marjory Veronica Seton-Williams described for this area several archeological mounds (höyük), which are the remains of ancient settlements. Today, according to the archeological research carried out in the area, some of these mounds result to have been leveled by agricultural activities. In this work, we identified many color anomalies by low-cost remote-sensing analyses of satellite images. We checked the nature of these anomalies in a dedicated survey and we found a good correspondence between color anomalies and archeological remains consistent with leveled höyük. We compared the grain size and chemical characteristics of the soil collected inside the color anomalies with the soil collected in other areas of the alluvial plain. We found irrelevant differences in grain-size characteristics, but a higher content of CaCO3 in soils collected inside the anomalies with respect to those collected outside. Therefore, the content of CaCO3 could be considered the feature that makes the color anomalies visible. The reason for this higher content of CaCO3 is related to the anthropogenic material used in the different phases of höyük growth. This work suggests a low-cost analysis useful for rapid identification and preservation of archeological information on the history of Mediterranean settlement.

Graphical Abstract

1. Introduction

Satellite Remote-Sensing (RS) analysis has been effectively used in archeological research since the second half of the last century [1,2].
In the last decades, the availability of high-resolution satellite images has made remote-sensing analysis one of the most powerful tools for low-cost investigations in the archeological context [3,4,5,6,7,8]. One of the most commonly used RS products in archeological study is represented by CORONA satellite photography [9,10,11]. CORONA imagery was acquired by an American espionage satellite between 1960 and 1972 with variable spatial resolution (~2–12 m) and in black and white. Other, more recent, techniques such as multispectral analysis (i.e., different combinations of spectral bands from Landsat satellite images) have been employed to explore the presence of buried remains [12,13,14]. Today, RS techniques are inexpensive, fast and reliable methods that can help to retrieve data over wide areas. The launch of the Sentinel-2 sensors has opened new paths for applications based on multispectral imagery. Sentinel-2 mission has been developed within the ESA Copernicus initiative [15]. The mission is made up of a constellation of two twin satellites, Sentinel-2A (launched on 23 July 2015) and Sentinel-2B (launched on 7 March 2017), which share the same orbital plane covering all the Earth surface every five days. The constellation is equipped with a multispectral sensor having 13 spectral bands with spatial resolution of 10 m (four visible and near-infrared bands). Given this higher resolution combined with rapid and repeated coverage, the Sentinel-2 constellation places RS techniques a step ahead with respect to Landsat imagery in many fields of research such as geoarcheological studies. On the other hand, the main advantage of Landsat imagery is represented by the availability of a very long-lasting archive (since 1972).
In a landscape that is rapidly changing due to the strong human impact [16,17,18], archeological evidence is erased and/or buried very quickly. In particular, the Mediterranean alluvial plains, where an enduring synergic relationship occurs among landscape, ancient cultures and society evolution [19,20,21,22,23,24,25,26,27,28,29], may represent critical areas for investigation.
Like many other alluvial plains, the lower plain of the Ceyhan River, located in Southern Turkey within the Çukurova region (ancient Cilicia, Figure 1,) experienced rapid agricultural development after the Second World War [30,31,32], with a severe impact on the archeological remains.
One of the most important archeological features of this area is represented by the höyük (tells, tepe), which are artificial mounds formed by the remains of human settlements built on the same site for a long period of time (several millennia). These artificial mounds can be found in the Near and Middle East and in the Balkans [33,34]. The strong reclamation and change in land use, facilitated by mechanical means, have destroyed several archeological sites, leveling their original raised shapes to the ground. As a result, the almost complete absence of the peculiar artificial low hills makes it useless to study microreliefs for the identification of ancient sites in this area. Before the beginning of the described accelerated phase of land reclamation, Marjory Veronica Seton-Williams (1954), in her masterful archeological survey, mapped more than 20 höyük in the study area, the majority of which have been destroyed. The scale of the map reported in her work (ca. 1:57,000) prevents any precise location of the ancient mounds. For this reason, precious information on the ancient Cilicia settlement has been or is at risk of being lost. In this context, undertaking new field archeological surveys would be extremely difficult, costly and time-consuming, as documented by the work of Salmeri [30] for a selected area of the plain.
The aim of this work is to propose a low-cost and rapid methodology based on RS data to plan a preliminary archeological survey over wide areas aimed at identifying the location of destroyed archeological sites. The results of this undertaking may relevantly contribute to the preservation of the cultural heritage and of the invaluable archeological information on this archeological area, which is crucial for the understanding of the history of Mediterranean settlement.

2. Materials and Methods
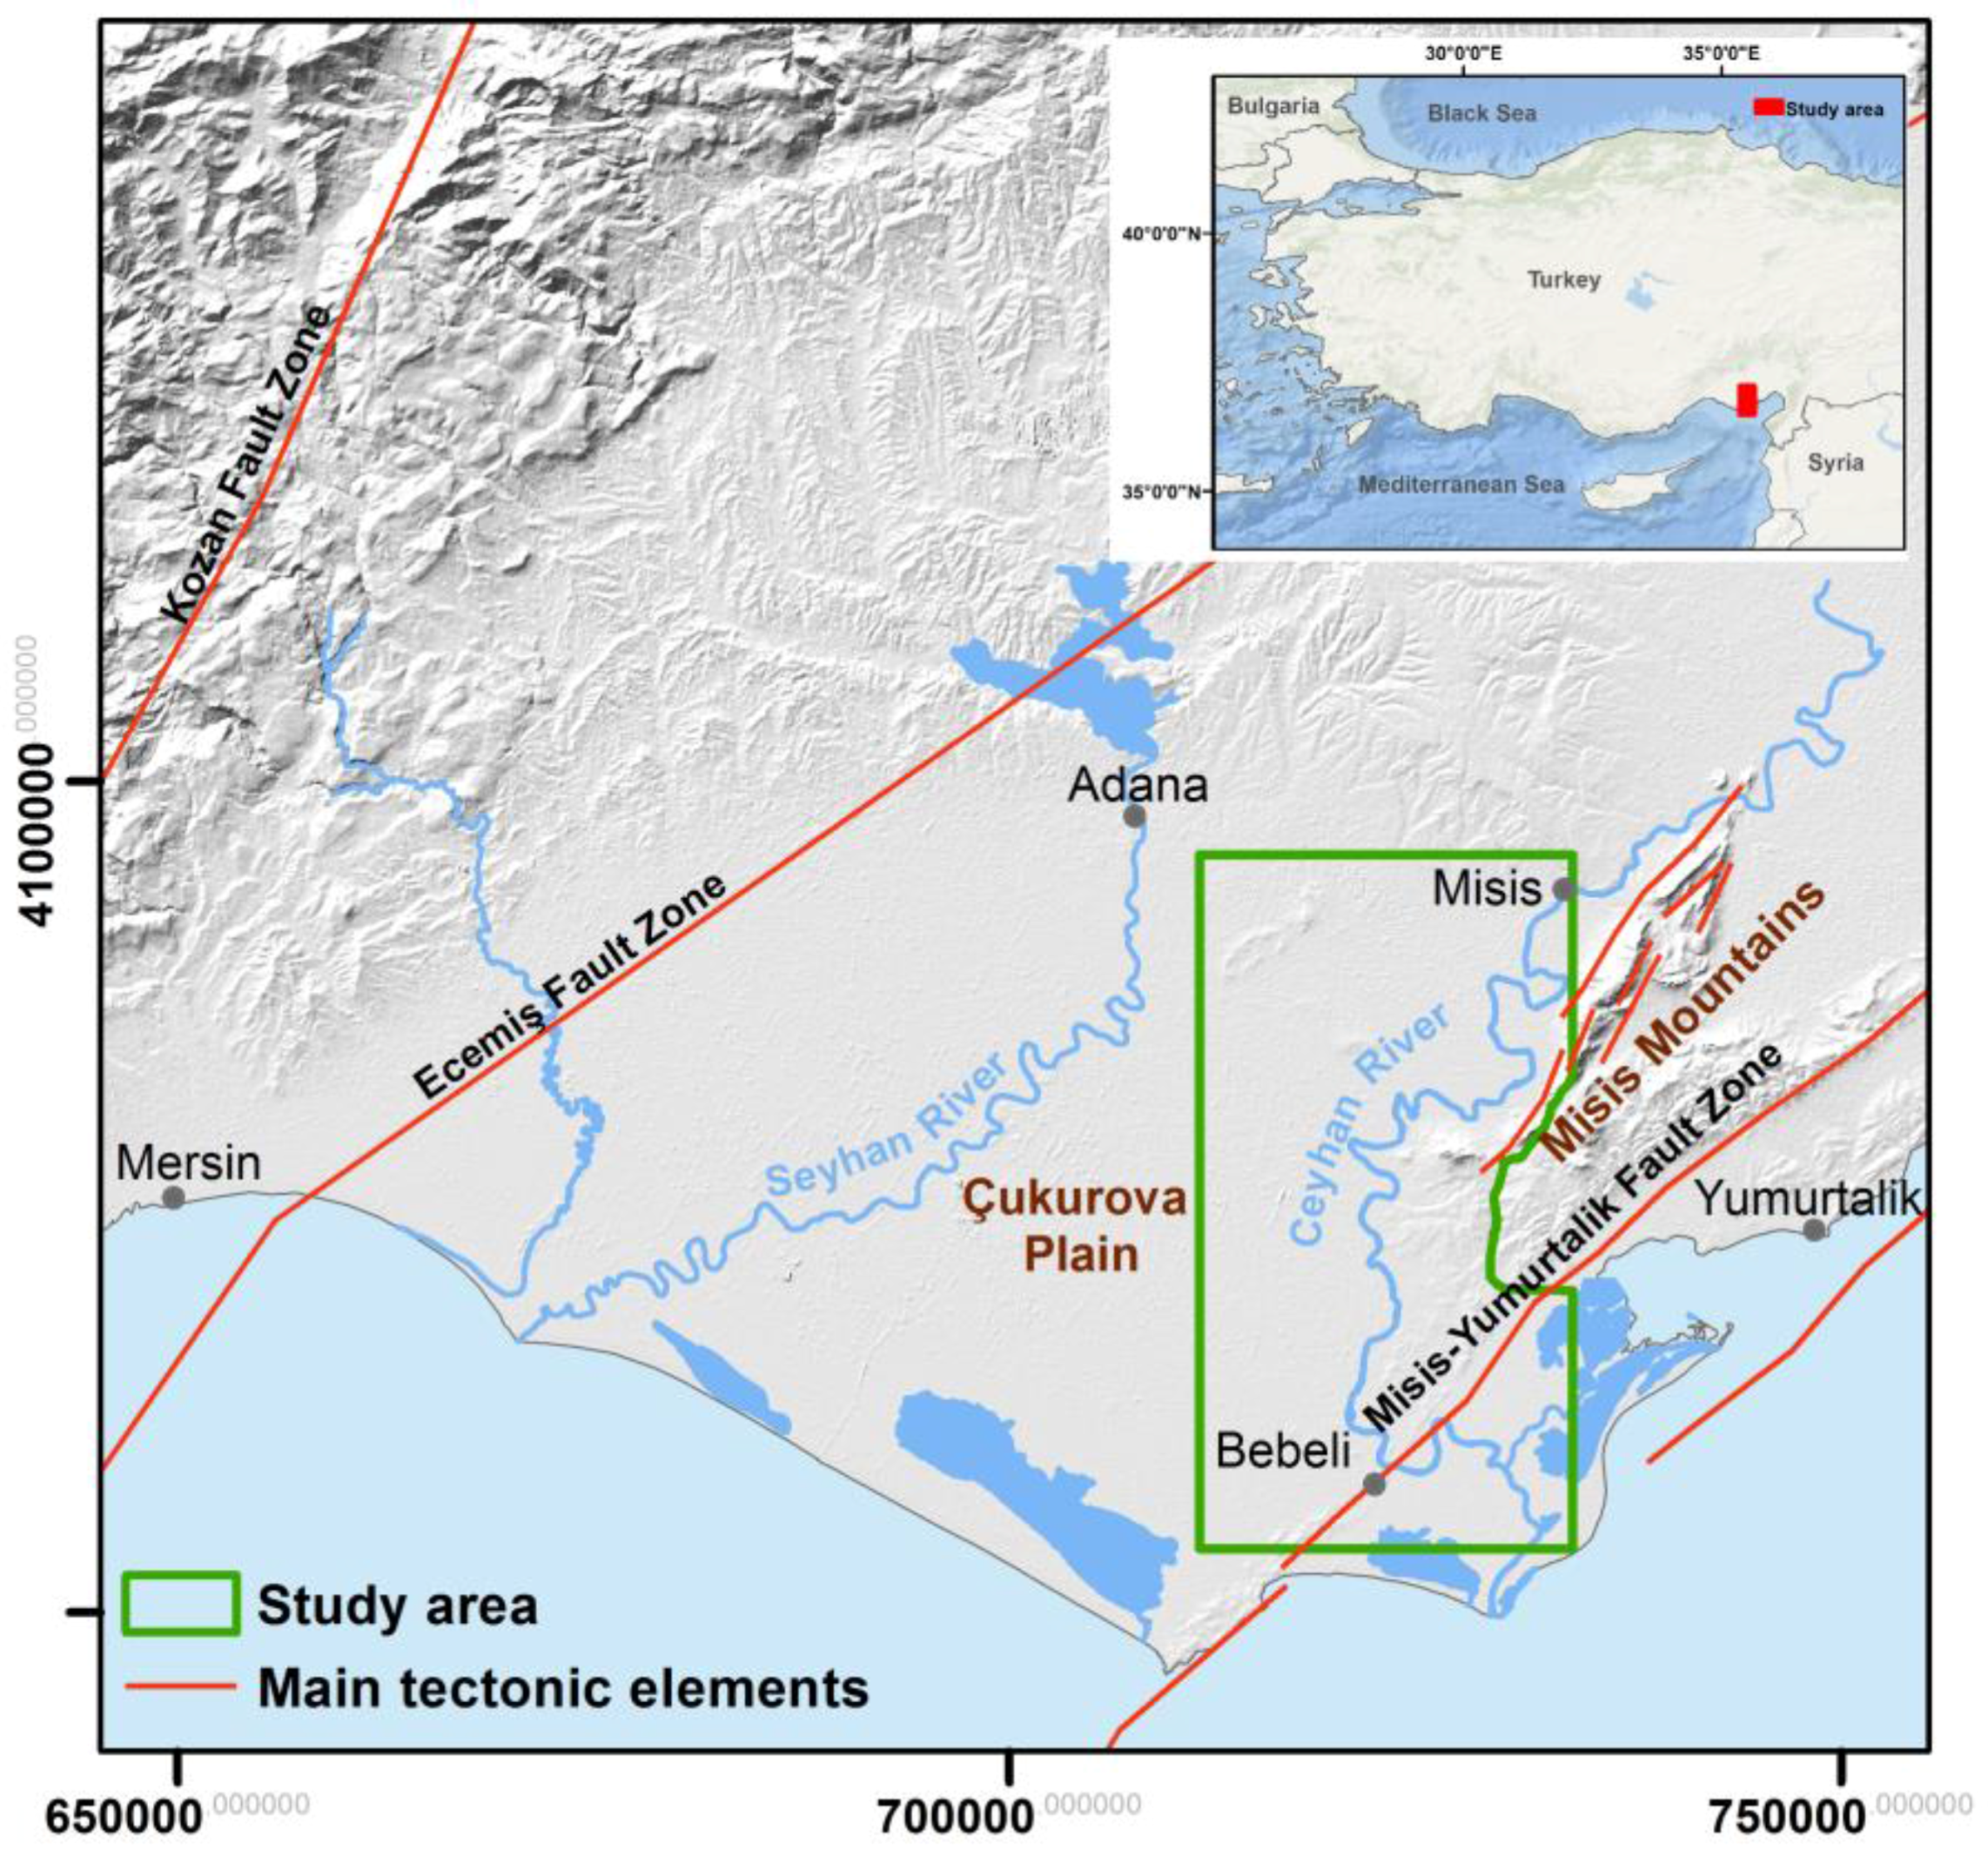
2.1. Study Area

The study area is located in the lower part of the alluvial plain of the Ceyhan River, between the village of Misis (ancient Mopsouhestia) and the Bebeli village (Figure 1). The Ceyhan plain corresponds to the easternmost part of the Çukurova plain, bordered to the east by the Misis Mountains and to the west by a poorly defined watershed with the Seyhan River alluvial plain. This plain corresponds to the southern part of a large tectonic depression (the so-called Adana Basin) filled with Neogene deltaic-to-fluvial sediments [35], bound by the Kozan and Ecemiş fault zones in the NW, and by the Misis-Yumurtalik fault zones in the SE [36,37] (Figure 1). A thick infilling of Quaternary deposits formed by fluvial sediments (gravel, sand, silt and clay layers) unevenly overlies the Neogene formations.
The plain was densely populated in antiquity, as documented by the presence of human settlements starting from the Neolithic [30,31,32]. A fundamental role in settlement distribution was probably associated with drainage network evolution and alluvial plain aggradation, as stated by classical authors (Strabo and Ptolemy), and later by Ramsay [38] and Russel [39], and currently by evidence in other areas of the Mediterranean [16,20,21,22,25,26,27,28,29,40,41]. The mutations in the drainage network of the Ceyhan River plain are documented by old maps, and by old channel traces highlighted by means of remote-sensing analysis [42].
Changes in the drainage network and in the sedimentary supply have had a significant impact on coastal morphology, as in the recent case of the Aslantaş Dam. After the construction of the dam in 1984, the annual sediment load of the Ceyhan River dramatically decreased and the important coastal progradation in the mouth area [43], with nested coastal dunes, lagoons, swamps and marshes, was replaced by erosive phenomena [44].

2.2. Data and Methodology

Taking the lead from the survey reported by Salmeri [30], who identified significant remains of leveled artificial mounds, in 2011, a preliminary remote-sensed analysis was performed over a relatively small area around the village of Misis. This analysis was undertaken by using different satellite images. A multispectral analysis was performed by using a Landsat acquired on 8 May 2011 and a Sentinel-2 acquired on 18 October 2017. Google Earth© (SPOT images) imagery was used to support the visual interpretation of the multispectral analysis given its very high resolution (1.5–6 m). An interesting relation was observed between the leveled höyük identified by Salmeri [30] and the areas characterized by a color different from that of the surrounding alluvial plain (color anomalies hereafter). Since then, it has been hypothesized that a similar approach could allow to promptly identify other color anomalies to be targeted for direct field surveys. The approach was extended to an area of about 900 km2 (study area in Figure 1). To understand whether the color anomalies identified from SPOT images (Figure 2a) are related to vegetation state or soil humidity, we processed different combinations of spectral bands from Landsat satellite images: (i) near infrared-red-green, 432 (Figure 2b), useful for vegetation studies [45], drainage monitoring, soil patterns and various stages of crop growth; (ii) near infrared-medium infrared-red, 453 (Figure 2c) (this combination highlights moisture differences and is useful for the analysis of soil and vegetation conditions [46]; generally, the wetter the soil, the darker it appears, because of its infrared absorption by water); and (iii) shortwave infrared, near infrared, green, 742 (Figure 2d), a combination used in fire studies [47], allows locating burned areas.
For each of the described combinations, we used band 8 (15 m spatial resolution) to generate panchromatic image sharpening and to increase the geometric resolution of the RGB composites. As shown in Figure 2, the color anomalies detected with SPOT images are not highlighted by Landsat composites. A similar approach was applied using the most recent European multispectral sensor Sentinel-2. The selected False Color Composites (FCC) were chosen after an iterative procedure where all the available spectral bands were combined to produce different FCCs. Each composite was evaluated by an accurate visual inspection. Attention was focused on the 10 m resolution bands (2, 3, 4 and 8) to detect the presence of color anomalies in the same area. The best results, in terms of höyük detection, were obtained with FCC 432 and 843 in RGB, respectively, which clearly highlight the presence of the same anomalies detected by the SPOT images (Figure 3).
Different kinds of color anomalies were identified based on color and shape by analyzing SPOT images. To prioritize the inspection of the detected color anomalies for the field survey, each color anomaly was checked by comparing the results obtained with SPOT, Landsat and Sentinel-2 with a visual inspection of the CORONA imagery. Between 1960 and 1972 (the period of CORONA), some of the höyük might not have been leveled yet, and therefore it would have been possible to distinguish their profile. The complete database of CORONA imagery can be consulted on the website of the United States Geographical Service [48] , where only some of the images can be freely downloaded. Furthermore, to fully exploit the potentiality of CORONA, a 3D dedicated software, which allows a stereoscopic view, is needed since the images were acquired with two cameras [49,50]. Due to the strong distortion caused by the stereographic mode of acquisition, CORONA imagines cannot be used individually to locate archeological remains with sufficient geographic accuracy. For this reason, the location of the höyük were detected with Landsat, Sentinel-2 and SPOT, whereas CORONA images were used only to compare the shape of those color anomalies recognized in the more recent multispectral images.
The most evident and easily accessible color anomalies were then selected for a direct and rapid check on field to verify the actual presence of archeological evidence. In particular, field observations in this work were only undertaken to identify the presence/absence of concentrations of archeological remains, such as pottery fragments, worked stones, and bricks, in the areas recognized as color anomalies by remote-sensing analyses. No specific study or sampling of the material identified (except for field notes) was undertaken. Successively, the location of the identified color anomalies was compared with the höyük locations reported in the Seton-Williams [31] map (manually georeferenced with Global Mapper Software, using 10 Ground Control Points) and in the work of Salmeri [30], aimed at identifying any possible correspondences. Finally, to methodologically understand the origin of the observed color anomalies in the context of the alluvial plain, we sampled and analyzed the deposits belonging to both the color anomalies and the alluvial plain for sedimentological and geochemical characterization. Grain-size analyses were conducted by using a multi-method approach. The size fraction coarser than 3 φ (125 µm) was analyzed by means of standard sieves at half φ intervals, with φ = −log2d, where d is the diameter in mm. The fractions from 3.5 φ (90 µm) to 9 φ (2 µm) were analyzed by means of a Beckman Coulter Multisizer 4. The data from the two methods were matched by comparing the overlapping size classes (between 3 and 4 φ), and the data were represented as weight percentage at half-φ intervals. Grain size parameters (median size, sorting, Skewness and Kurtosis [51]) were calculated using GRADISTAT software [52].
Concentrations of total carbon (TC) were measured with a Carlo Erba 1108 elemental analyzer, with measurements calibrated against an Acetanilide standard (precision generally <0.1%). The carbonate content (CaCO3%) of the samples was determined by a gasometric method (with calibration to pure Ca-carbonate) [53]. Replicate analyses showed a mean reproducibility of ±0.5%. Total organic carbon (TOC) was calculated by the difference between the TC and the total inorganic carbon (TIC), derived from carbonate contents.

3. Results and Discussion

3.1. Remote-Sensing Analyses
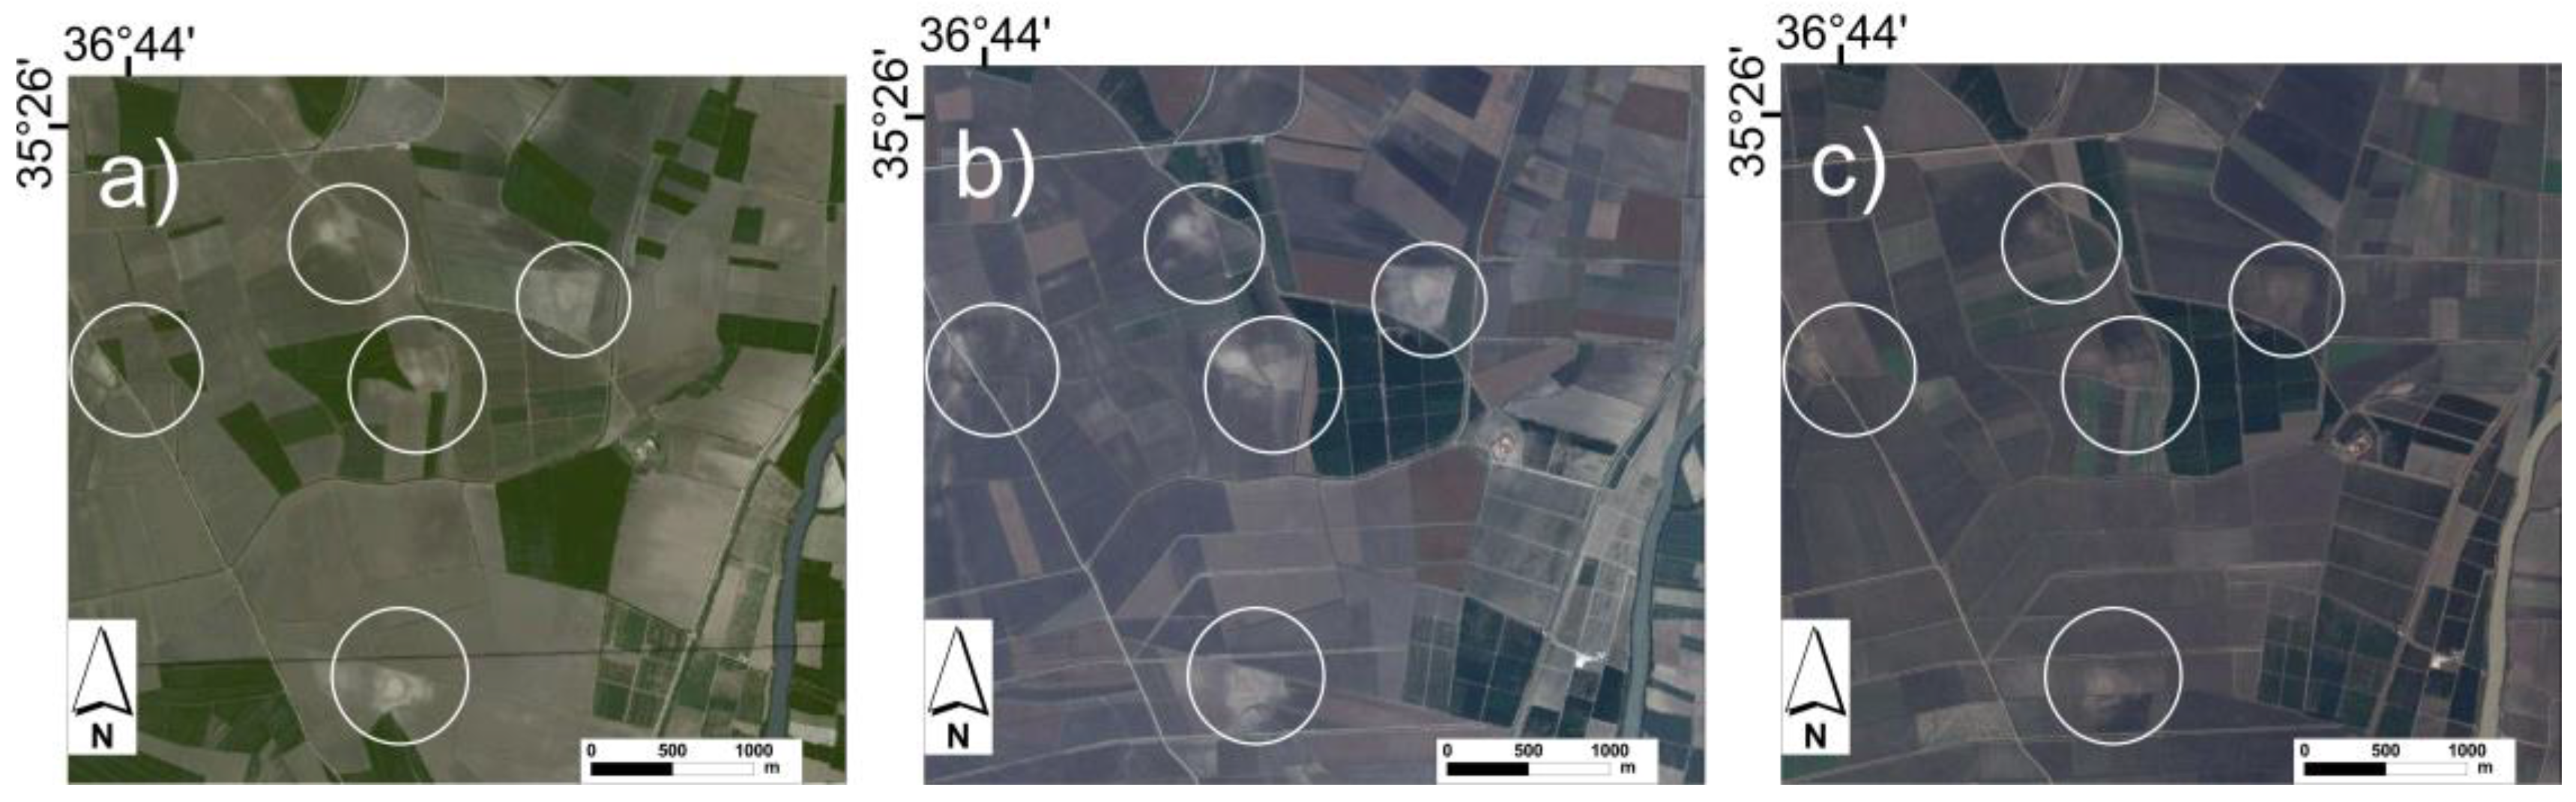
Different types of color anomalies were identified (e.g., linear, irregular, sub-circular and complex) by using SPOT 6 and SPOT 7 images (Figure 4) as well as with Sentinel-2 (Figure 5). These anomalies can be grouped into two main categories.
(i)
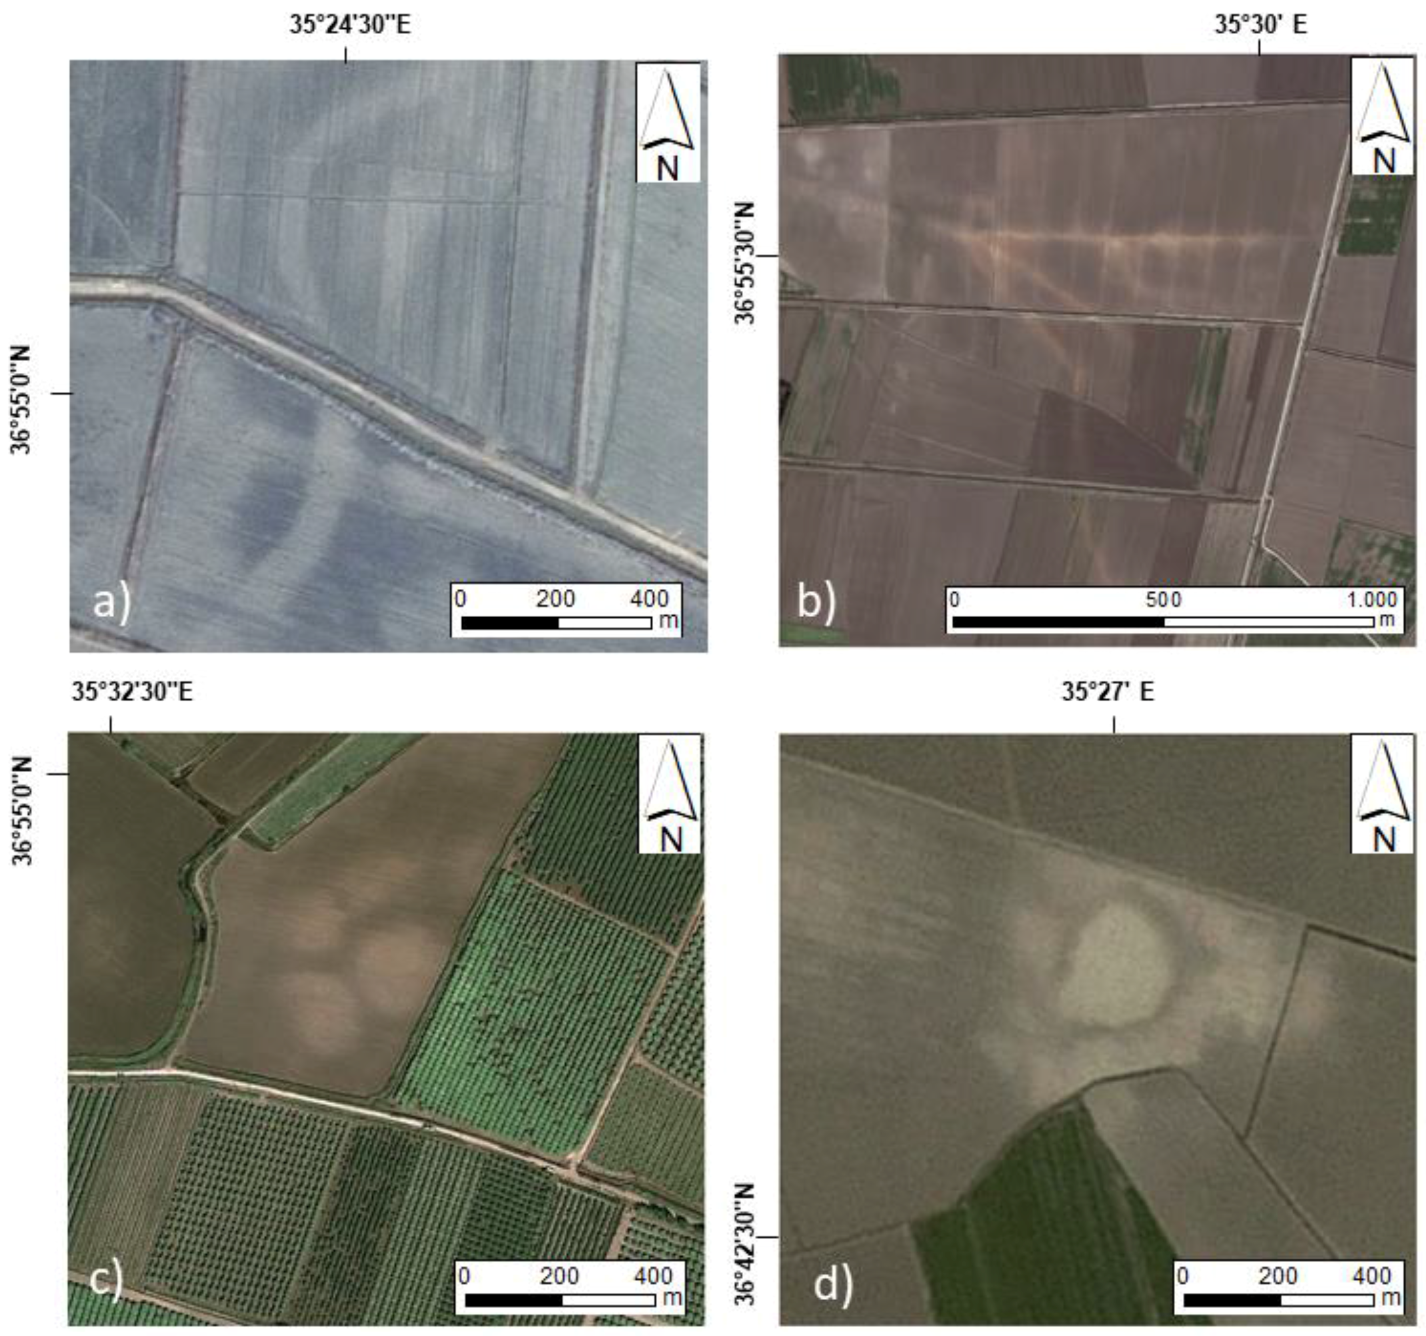
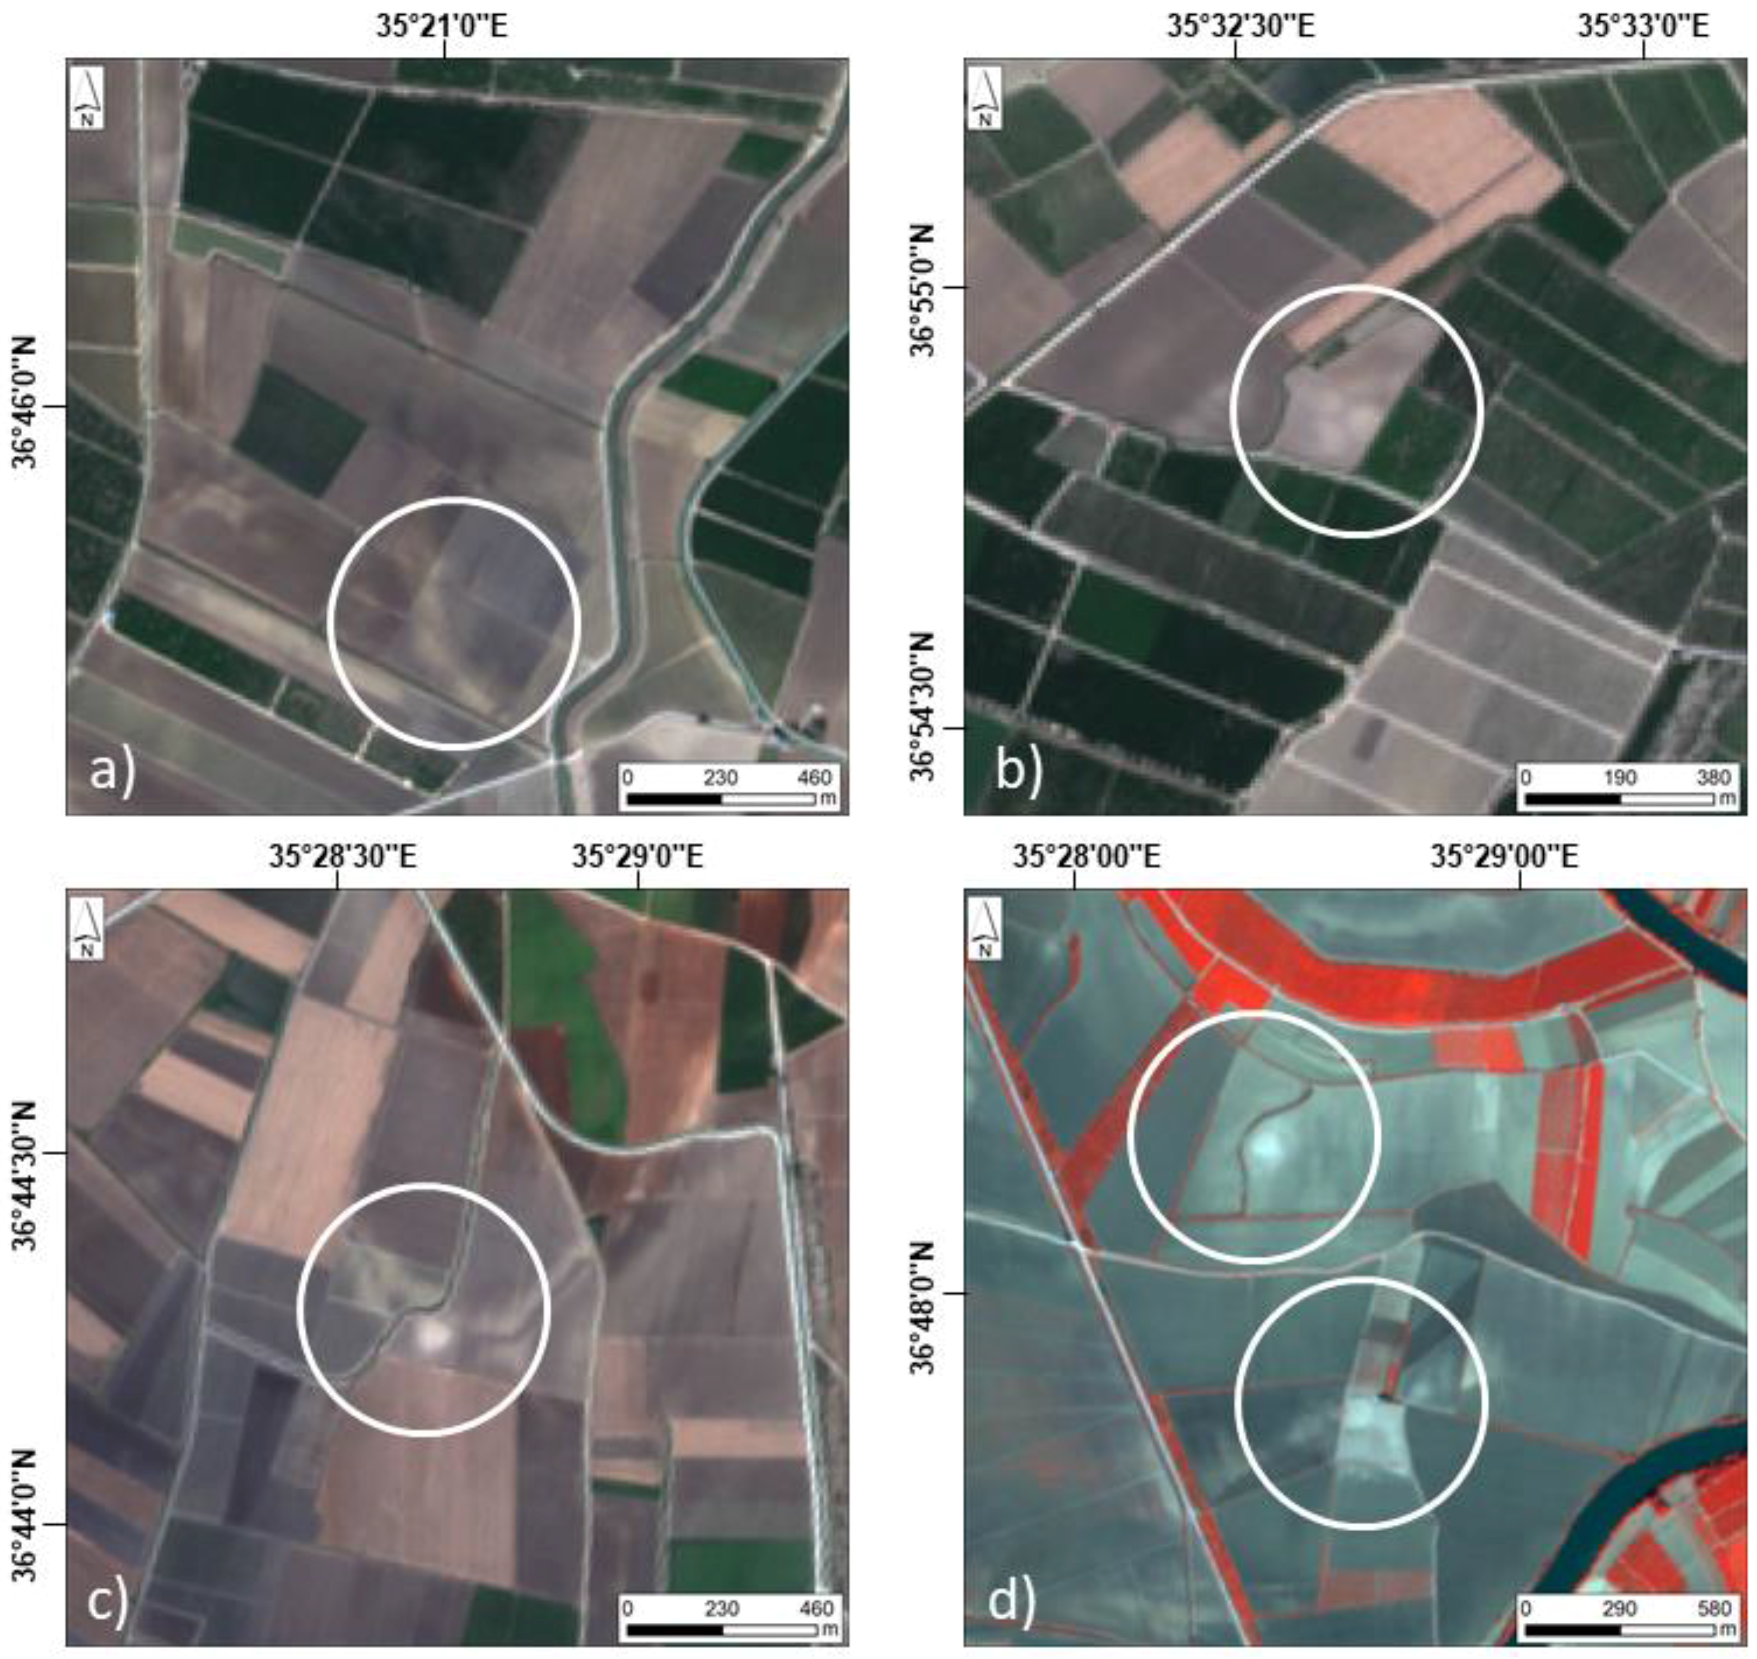
The first category of color anomalies is composed by whitish color strips of various lengths with straight or curved trends. They span all the plain and, for the most part, they can be easily ascribed to paleo-traces of river channels or gullies (Figure 4a and Figure 5b). Only one correspondence with archeological remains has been locally recognized, and consists in a semi-buried ancient road (Figure 4b).
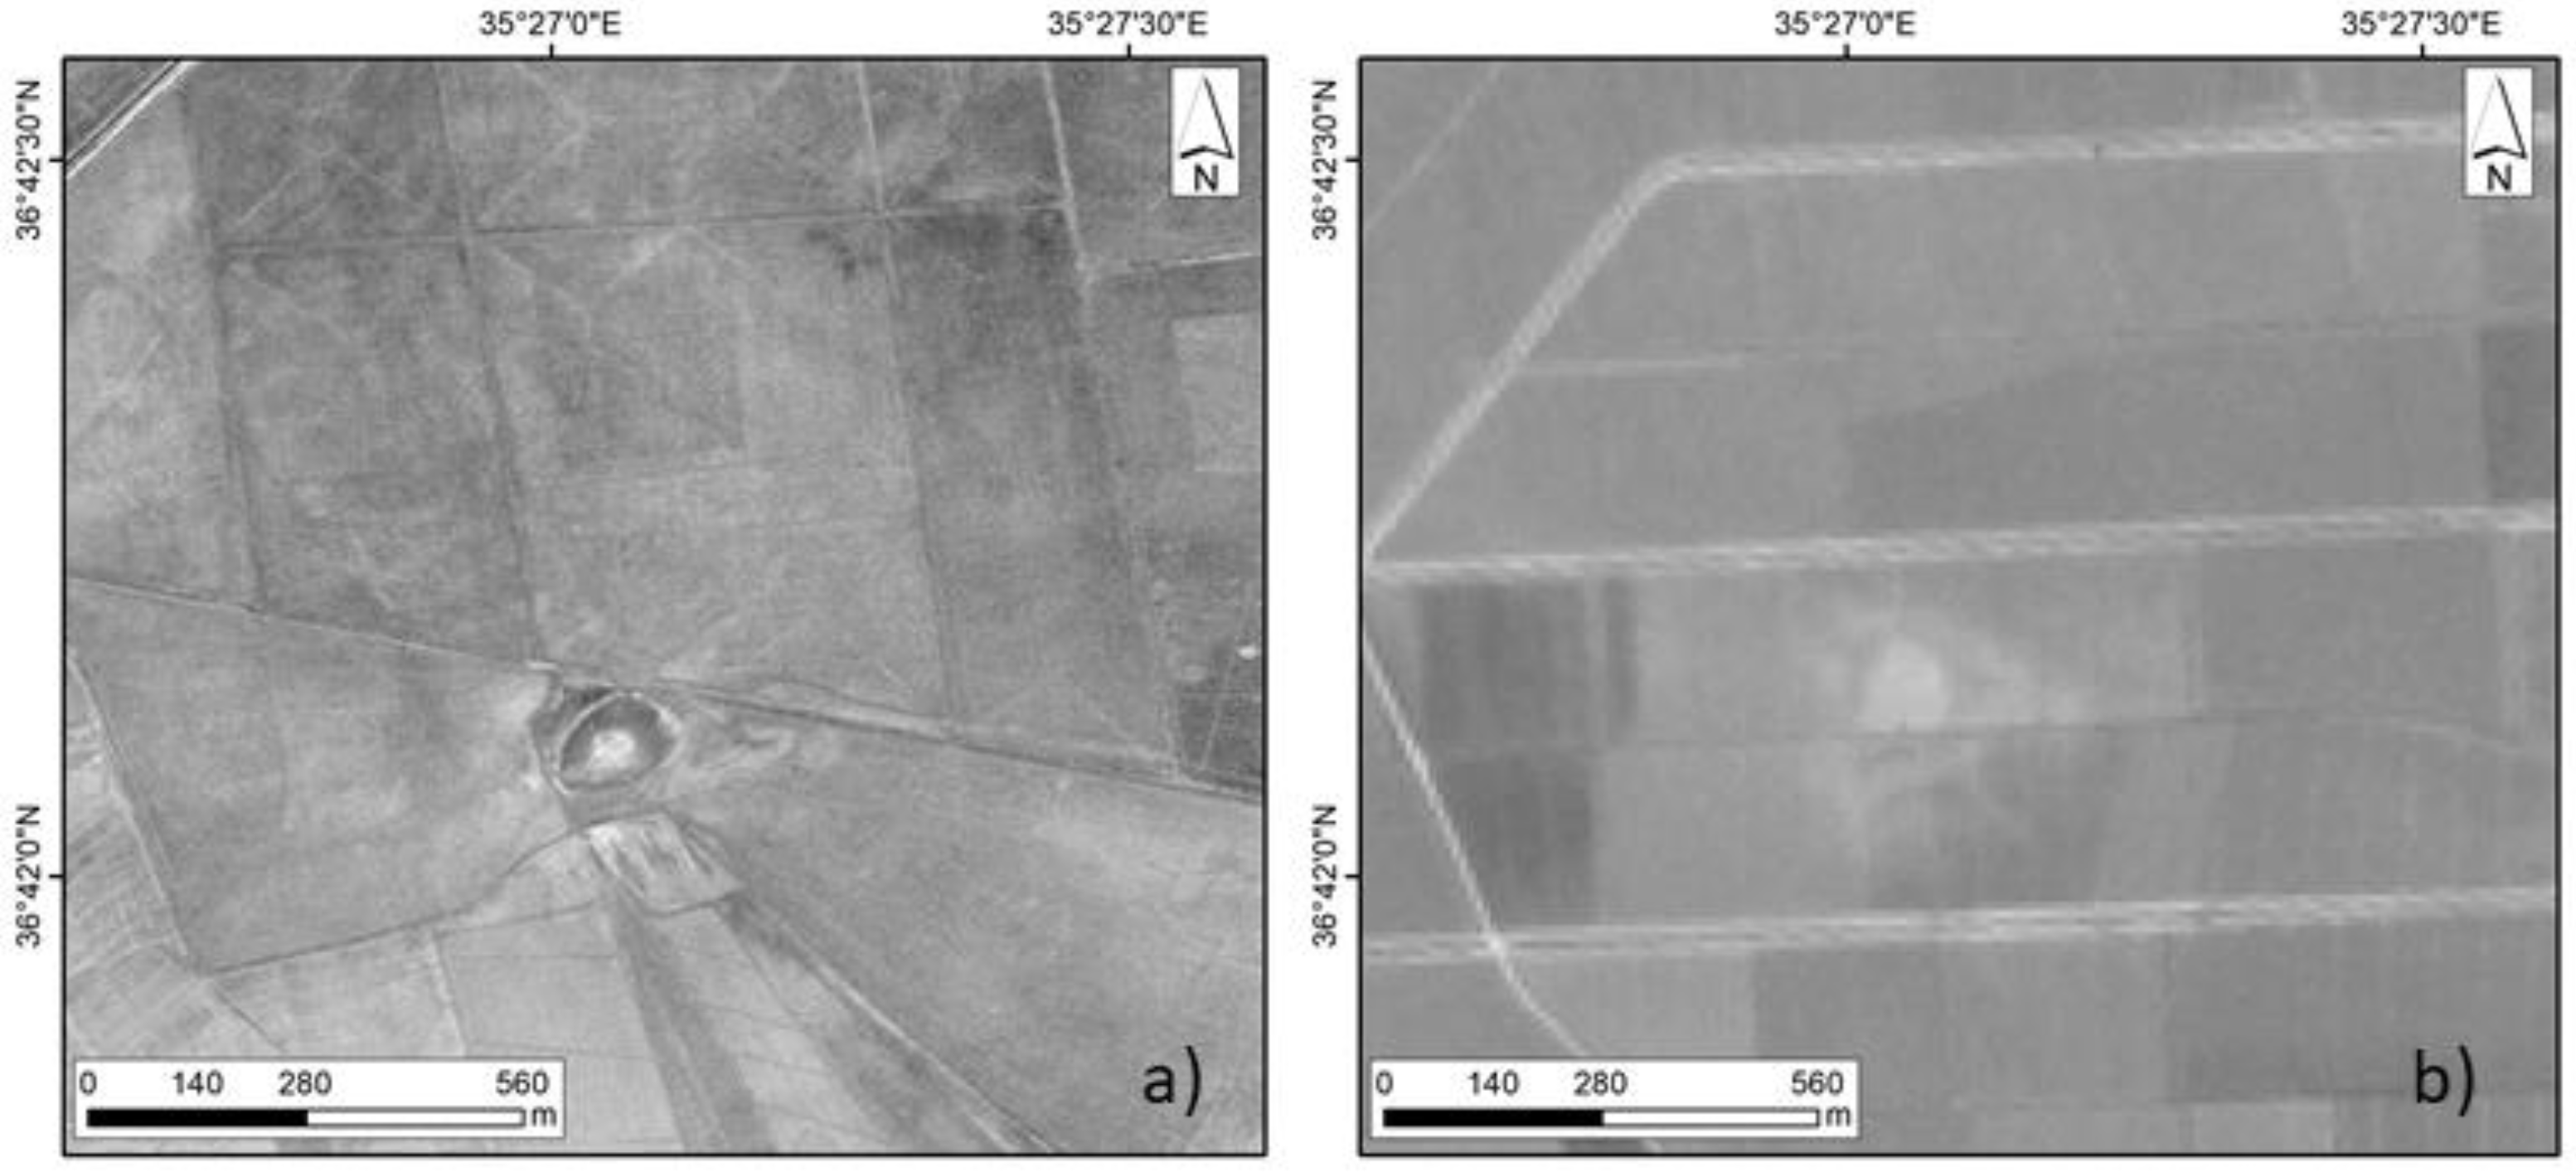
(ii)
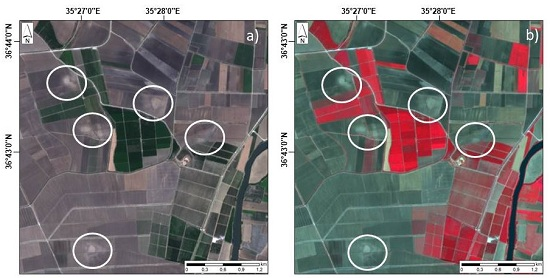
The second group is characterized by widespread whitish color anomalies, usually with irregular shapes, which in some cases become regular and well-rounded (Figure 4c and Figure 5c,d). The anomalies are generally formed by a single element, but in some cases by more than one element assuming a circular or sub-circular general shape (Figure 4d and Figure 5a).
The results obtained using Landsat, Sentinel-2 and SPOT were compared to the available CORONA imagery, especially for the second category of color anomalies (Figure 6).
By using remote-sensing analyses in the area, we identified 50 anomalies belonging to this second category, most of which are visible in all the historic images available on the Google Earth platform (from 2011 to 2017; SPOT Images, Figure 7). We focused our attention on this typology of anomalies by checking about 32% on the field.
The field survey was performed visiting 19 anomalies detected with SPOT (6, 7) and Sentinel-2 to validate the remote-sensing data (Table 1).
Even in the absence of a dedicated systematic archeological survey, we found a strong correlation between checked anomalies and presence of archeological remains. Indeed, more than 94% of the checked anomalies yielded the presence of archeological remains. The percentage of archeological material found on the field in correspondence with color anomalies gradually increased as we moved from the margins to the center of each checked anomaly. The archeological remains found in most of the studied anomalies resulted strongly diachronic, spanning from the Bronze age to the Islamic period. These data indicate that most of the anomalies are almost horizontal sections of höyük leveled by agricultural machineries during the second half of the twentieth century.
Each anomaly visited during the field survey was observed using the imagery available (SPOT, Landsat, Sentinel-2 and CORONA).
To analyze very wide areas, as in this case, very high resolution optical imagery can be extremely expensive. Free of charge Landsat ETM+ are routinely used to map geological units, mineralization, ore deposits, faults and other geomorphological/geological features characterized by remarkable size (usually several hundreds of meters [54]). Archeological remains such as the höyük are reduced in size (maximum 100 m of diameter). This dimension is hardly detectable with 30 m resolution images. Owing to its higher resolution (10 m), the use of the new ESA satellite Sentinel-2 improves the possibility to detect smaller structures, thus allowing to perform a detailed analysis over wide areas without costs. Another important advantage of Sentinel-2 is represented by the regular acquisition over the same area. Reflectance can vary during the year because of soil moisture, organic matter content, land use (especially in cultivated areas). The availability of free images during the whole year makes it possible to observe the study area in different climatic conditions and during the plowing period when the visibility of the Earth surface is not affected by the presence of cultivations. According to the acquisition period, the CORONA imagery was used to observe whether the höyük had not yet been leveled. However, only one of the 19 höyük visited had not yet been leveled in 1967 (Table 1). This höyük also appears not leveled in SPOT and Sentinelle-2. Furthermore, nine out of the 19 anomalies were not visible using CORONA and another nine anomalies appeared to be already-leveled sites (Table 1). Thus, Sentinel-2 resulted more efficient than CORONA and Landsat. However, since CORONA is the oldest imagery available for the study area, it allowed us to define a chronological constraint for the period of höyük destruction.

3.2. Historical Map Analyses

A comparison between these kinds of color anomalies and the georeferenced map of Seton-Williams [31] suggests a correspondence between the höyük that appear in ancient maps (Figure 8a) and the anomalies mapped in this work (Figure 8b). The correspondence is confirmed by local witness accounts, findings of archeological remains (pottery) and CORONA imagery by observing the typical features of the höyük that had not yet been leveled in the sixties. However, some color anomalies may correspond not to a leveled höyük but to a flat archeological site.
Indeed, the accuracy of Seton-Williams’s map makes it difficult to establish a precise correspondence between a specific höyük and a specific anomaly, even if this correspondence can be hypothesized in some cases (e.g., Domuz II and Domuz tepe; Figure 9a). Generally, we can identify three areas of anomalies corresponding to the three groups of höyük mapped by Seton-Williams [31]: the area corresponding to Domuz (Figure 9a), the area between Pekmezli I and Mizil Tahta (Figure 9b), and the area around Canarkci (Figure 9c). Interestingly, in this last case, both the identified anomalies and the höyük mapped by Seton-Williams are located to the west of the current course of the Ceyhan River, while all other tells are more strictly connected to the current position of the river course.
The highest concentration of anomalies is between the villages of Develiaren and Kesik (Figure 9a), where field evidence has confirmed the presence of six sub-circular areas with artifacts. This sector confidently fits with the sites Domuz tepe described by Seton-Williams [31].
These preliminary results should be used to guide future detailed archeological research in the Ceyhan alluvial plain, in an attempt to identify the exact location of leveled höyük as well as the chronology of archeological remains located inside the anomalies.
The validation of the employed method allows a more precise localization of the archeological sites already described by Seton-Williams, which are however difficult to detect on the field according to the scale and geographic information of the map. Moreover, it is worth noting that we identified some anomalies likely to correspond to höyük (Figure 8 and Figure 9), but not reported in the old map. These höyük may have been destroyed before Seton-Williams’s survey, or some areas may not have been explored owing to the presence of inaccessible wetlands at the survey time, as described by Seton-Williams herself [31]. However, if even the fluvial dynamics cannot be excluded, höyük destruction seems to be much more correlated to agricultural activities, considering that the höyük appear already leveled in the CORONA imagery dated back to 1967. Indeed, the large number of höyük described by Seton-Williams [31] were still emerging above the alluvial plain in 1950, highlighting great damage of archeological heritage occurred in a very narrow time interval.
To understand the origin of the color differences between the anomalies and the surrounding alluvial plain deposits, we compared the grain size and the organic and inorganic carbon content analysis of the sediments collected inside and outside the color anomaly areas.

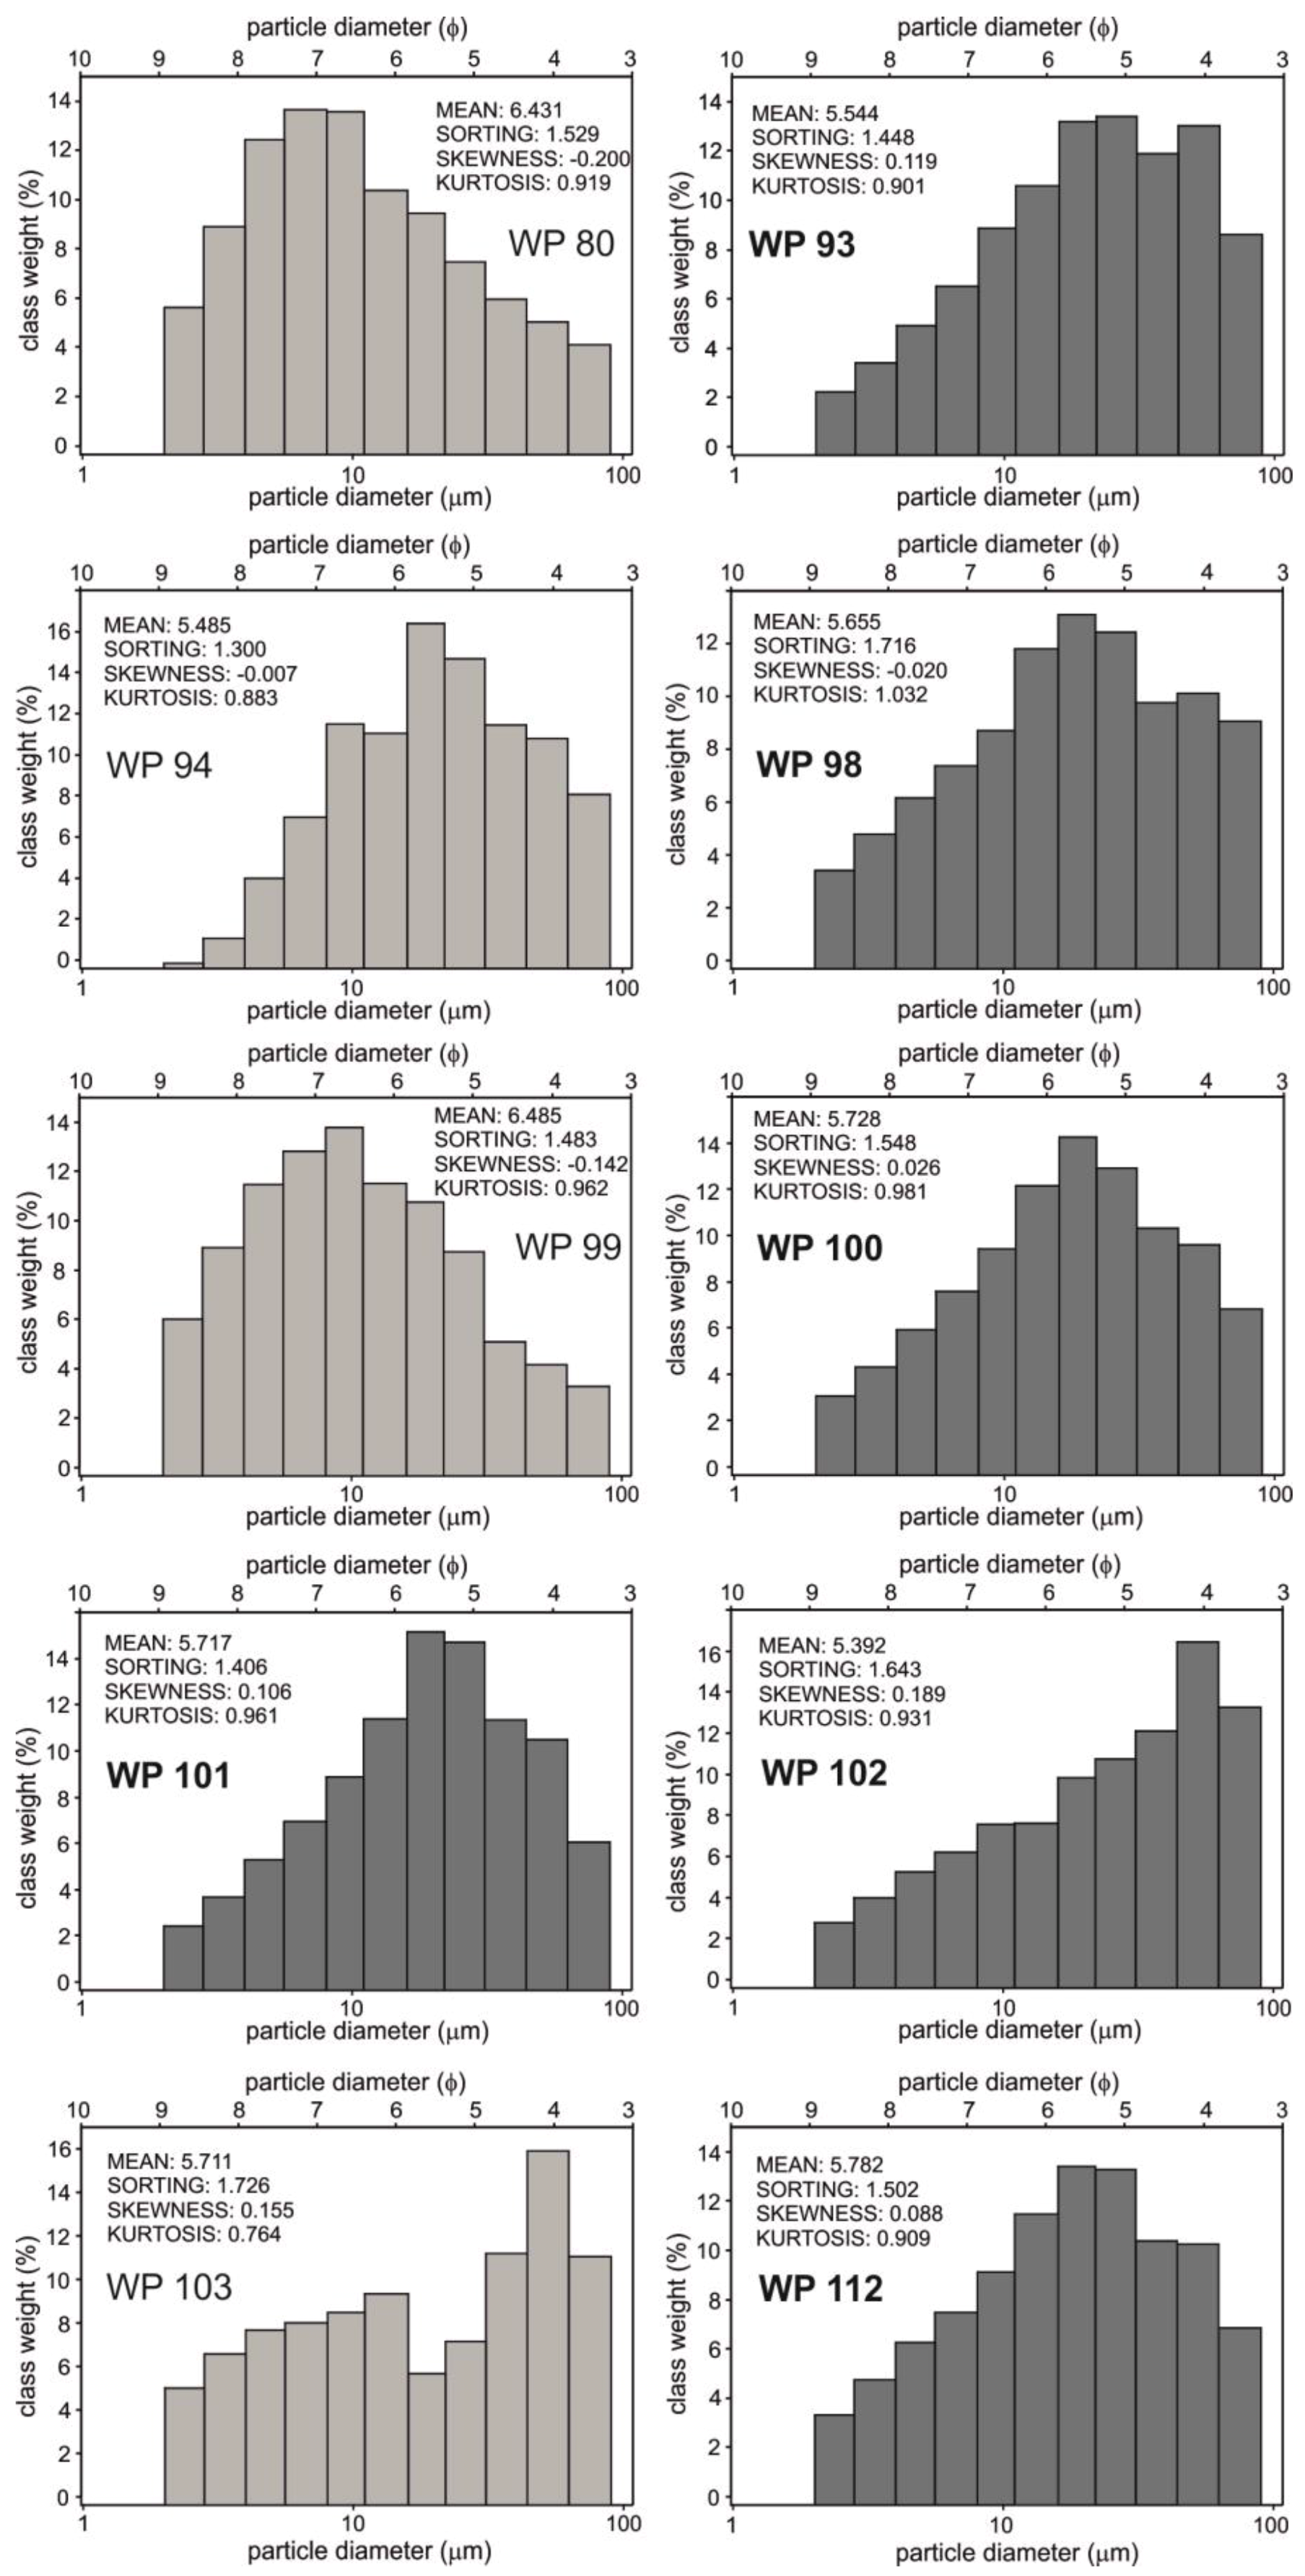
3.3. Grain-Size Analyses

The grain-size results are summarized in Figure 10. They show that all grain-sizes on the fields are coarse-medium silt or very find sand. In particular, all sediments belonging to the color anomaly areas exhibit coarse silt grain-size, poor sorting, skewness from fine-to-symmetric and mesokurtic kurtosis. The sediments collected outside the color anomaly areas are from medium-to-coarse silt sized, poorly sorted, from fine-to-coarse skewed and with mesokurtic to platykurtic kurtosis. Summing up, no actual grain-size differences are evident among the samples belonging to the color anomaly areas and those of the neighboring alluvial plain.

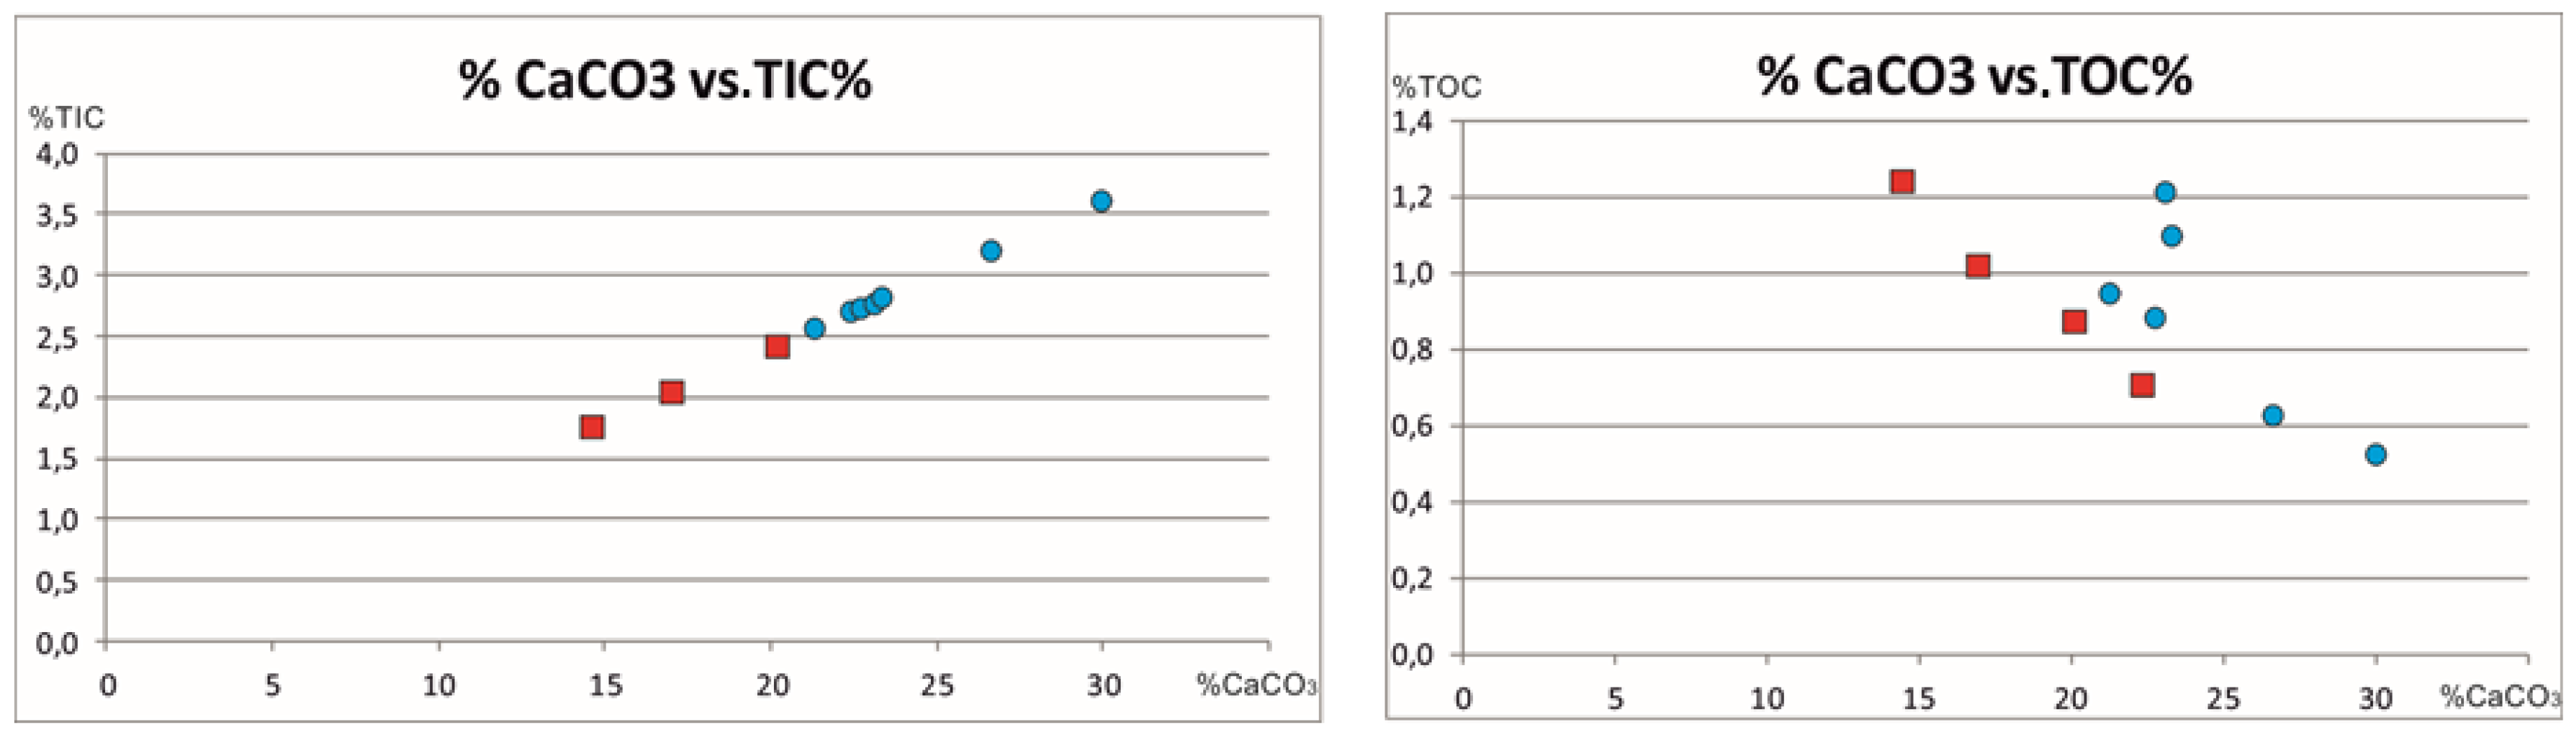
3.4. Chemical Analyses

The results of chemical analyses are summarized in Figure 11.
Figure 8 shows that there is, on average, a higher CaCO3 content in the sediment collected inside the anomaly (mean value 25.0 ± 3.2%) than in the soils collected outside (18.2 ± 3.5%).
This difference could be related to the presence of some specific anthropogenic material used in the different phases of höyük construction and settlement (e.g., plaster, mortar, etc.), which might have caused the lighter color that makes the anomalies in the context of the alluvial plain visible.
In Figure 11, CaCO3 vs. TOC% indicate that inner and outer soil samples reside in a different field, suggesting that, for the same content of TOC, anomalies are enriched in CaCO3. From these geochemical measurements, it seems reasonable to assume that most of the color anomalies are more related to CaCO3 than to organic matter content.

4. Conclusions

In this paper, we propose a rapid method for the identification of leveled archeological mounds using accessible and free of charge data, GIS modeling and remote-sensing analyses carefully tested on the field, compared with historical sources, and validated by laboratory analyses.
Sedimentological analyses show that there is no significant difference in grain size between the soil collected inside the anomalies and the soil collected in other areas of the alluvial plain, whereas geochemical analyses show that there is a higher CaCO3 content in soils collected inside the anomalies with respect to those collected outside. This characteristic is probably responsible for the change in color, so that the leveled höyük are made visible by remote-sensing analyses.
The reason for this higher content in CaCO3 is probably related to the anthropogenic material used in the different phases of höyük growth. It is worth noting that this feature makes the anomalies visible in the SPOT 6, SPOT 7 and Sentinel-2 images, claiming for a similar approach in other alluvial plains as well. This approach can offer a powerful and inexpensive method for exploring vast areas for the preservation of cultural heritage and for the reconstruction of the settlement history.

Acknowledgments

The fieldwork at the basis of this research was funded by grants from the University of Pisa, Dipartimento di Scienze Storiche del Mondo Antico and Consiglio Nazionale delle Ricerche, Rome.

Author Contributions

For research articles with several authors, a short paragraph specifying their individual contributions must be provided. The following statements should be used “M.B., I.I., A.R., G.Z, A.L.D., conceived and realized the paper and the field activities; I.B. conceived and designed the chemical analyses; I.I. and A.C. performed the remote-sensing analyses; D.M. conceived and designed the grain-size analyses; M.B. wrote the paper. All the authors conceived and designed the manuscript with the general conclusions.

Conflicts of Interest

The authors declare no conflict of interest. The founding sponsors had no role in the design of the study; in the collection, analyses, or interpretation of data; in the writing of the manuscript, and in the decision to publish the results.

References

  1. Scollar, I. International colloquium on air archaeology. Antiquity 1963, 23, 296–297. [Google Scholar]
  2. Gumerman, G.J.; Lyons, T.R. Archaeological methodology and remote sensing. Science 1971, 72, 126–132. [Google Scholar] [CrossRef] [PubMed]
  3. Lasaponara, R.; Masini, N. Detection of archaeological crops marks by using satellite QuickBird multispectral imagery. J. Archaeol. Sci. 2007, 34, 214–221. [Google Scholar] [CrossRef]
  4. Agapiou, A.; Alexakis, D.D.; Sarris, A.; Hadjimitsis, D.G. Orthogonal equations of multispectral satellite imagery for the identification of un-excavated archaeological sites. Remote Sens. 2013, 5, 6560–6586. [Google Scholar] [CrossRef]
  5. Cerra, D.; Plank, S.; Lysandrou, V.; Tian, J. Cultural heritage sites in danger—Toward automatic damage detection from space. Remote Sens. 2016, 8, 781. [Google Scholar] [CrossRef]
  6. Masini, N.; Capozzoli, L.; Chen, P.; Chen, F.; Romano, G.; Lu, P.; Tang, P.; Sileo, M.; Ge, Q.; Lasaponara, R. Towards an operational use of geophysics for archaeology in Henan (China): Methodological approach and results in Kaifeng. Remote Sens. 2017, 9, 809. [Google Scholar] [CrossRef]
  7. Pan, Y.; Nie, Y.; Watene, C.; Zhu, J.; Liu, F. Phenological observation on classical prehistoric sites in the middle and lower reaches of the yellow river based on landsat NDVI time series. Remote Sens. 2017, 9, 374. [Google Scholar] [CrossRef]
  8. Agapiou, A.; Lysandrou, V.; Sarris, A.; Papadopuolos, N.; Hadjimitsis, D.G. Fusion of satellite multispectral images based on ground-penetrating radar (GPR) data for the investigation of buried concealed archaeological remains. Geosciences 2017, 7, 40. [Google Scholar] [CrossRef]
  9. Kennedy, D. Declassified satellite photographs and archaeology in the Middle East: Case studies from Turkey. Antiquity 1998, 72, 553–561. [Google Scholar] [CrossRef]
  10. Philip, G.; Donoghue, D.; Beck, A.; Galiastos, N. CORONA satellite photography: An archaeological application from the Middle East. Antiquity 2002, 76, 109–118. [Google Scholar] [CrossRef]
  11. Ur, J.A. CORONA satellite photography and ancient road networks: A Northern Mesopotamia case study. Antiquity 2003, 77, 102–115. [Google Scholar] [CrossRef]
  12. Flower, N.T.S. Satellite image processing for archaeologists. Archeo. Comput. Newsl. 1997, 39, 2–8. [Google Scholar]
  13. Elbaz, F. Space age archaeology. Sci. Am. 1997, 27, 40–45. [Google Scholar]
  14. Parcak, S.H. Satellite remote sensing methods for monitoring archaeological tells in the Middle East. J. Filed Archaeol. 2007, 32, 65–81. [Google Scholar] [CrossRef]
  15. Showstack, R. Sentinel Satellites initiate new Era in Earth Observation. Eos 2014, 26, 239–240. [Google Scholar] [CrossRef]
  16. Anthony, E.J.; Marriner, N.; Morhange, C. Human influence and the changing geomorphology of Mediterranean deltas and coasts over the last 6000 years: From progradation to destruction phase? Earth-Sci. Rev. 2014, 139, 336–361. [Google Scholar] [CrossRef]
  17. Butzer, K.W. Geoarchaeology, climate change, sustainability: A Mediterranean perspective. Geol. Soc. Am. Spec. Pap. 2011, 476, 1–14. [Google Scholar]
  18. Zanchetta, G.; Bini, M.; Cremaschi, M.; Magny, M.; Sadori, L. The transition from natural to anthropogenic-dominated environmental change in Italy and the surrounding regions since the Neolithic: An introduction. Quat. Int. 2013, 303, 1–9. [Google Scholar] [CrossRef]
  19. Arnaud-Fassetta, G.; De Beaulieu, J.L.; Suc, J.P.; Provansal, M.; Williamson, D.; Leveau, P.; Aloïsi, J.C.; Gadel, F.; Giresse, P.; Oberlin, C.; et al. Evidence for an early land use in the Rhône delta (Mediterranean France) as recorded by late Holocene fluvial paleoenvironments (1640–100 BC). Geodin. Acta 2000, 13, 377–389. [Google Scholar] [CrossRef]
  20. Bini, M.; Rossi, V.; Amorosi, A.; Pappalardo, M.; Sarti, G.; Noti, V.; Capitani, M.; Fabiani, F.; Gualandi, M.L. Palaeoenvironments and palaeotopography of a multilayered city during the Etruscan and Roman periods: Early interaction of fluvial processes and urban growth at Pisa (Tuscany, Italy). J. Archaeol. Sci. 2015, 59, 197–210. [Google Scholar] [CrossRef]
  21. Bini, M.; Pappalardo, M.; Rossi, V.; Noti, V.; Amorosi, A.; Sarti, G. Deciphering the effects of human activity on urban areas through morphostratigraphic analysis: The case of Pisa, Northwest Italy. Geaoarchaeology 2017. [Google Scholar] [CrossRef]
  22. Brückner, H.; Vött, A.; Schriever, A.; Handl, M. Holocene delta progradation in the eastern Mediterranean—Case studies in their historical context. Méditerranée 2005, 104, 95–106. [Google Scholar] [CrossRef]
  23. Bruno, L.; Amorosi, A.; Curina, R.; Severi, P.; Bitelli, R. Human-landscape interactions in the Bologna area (Northern Italy) during the middle–late Holocene with focus on the Roman period. Holocene 2013, 23, 1558–1569. [Google Scholar] [CrossRef]
  24. Bruneton, H.; Arnaud-Fassetta, G.; Provansal, M.; Sistach, D. Geomorphological evidence for fluvial change during the Roman period in the lower Rhone valley (southern France). Catena 2001, 45, 287–312. [Google Scholar] [CrossRef]
  25. Casana, J. Mediterranean valleys revisited: Linking soil erosion, land use and climate variability in the Northern Levant. Geomorphology 2008, 101, 429–442. [Google Scholar] [CrossRef]
  26. Dusar, B.; Verstraeten, G.; Dhaen, K.; Bakker, J.; Kaptijn, E.; Waelkens, M. Sensitivity of the Eastern Mediterranean geomorphic system towards environmental change during the Late Holocene: A chronological perspective. J. Quat. Sci. 2012, 27, 371–382. [Google Scholar] [CrossRef]
  27. Knox, J.C. Sensitivity of modern and Holocene floods to climate change. Quat. Sci. Rev. 2000, 19, 439–457. [Google Scholar] [CrossRef]
  28. Macklin, M.G.; Fuller, I.C.; Lewin, J.; Maas, G.S.; Passmore, D.G.; Rose, J.; Woodward, J.C.; Black, S.; Hamlin, R.H.B.; Rowan, J.S. Correlation of fluvial sequences in the Mediterranean basin over the last 200 ka and their relationship to climate change. Quat. Sci. Rev. 2002, 21, 1633–1641. [Google Scholar] [CrossRef]
  29. Marriner, N.; Gambin, T.; Djamali, M.; Morhange, C.; Spiteri, M. Geoarchaeology of the Burmarrad ria and early Holocene human impacts in western Malta. Palaeog. Palaeoclim. Palaeoecol. 2012, 339–341, 52–65. [Google Scholar] [CrossRef]
  30. Salmeri, G.; D’Agata, A.L.; Falesi, L.; Oliva, C.; Martorano, F.; Venoso, S.M. Cilicia survey 2003. Stud. Ellenistici 2003, 16, 513–520. [Google Scholar]
  31. Seton-Williams, M.V. Cilician survey. Anatol. Stud. 1954, 4, 131–133. [Google Scholar] [CrossRef]
  32. Rutishauser, S.; Erasmi, S.; Rosenbauer, R.; Buchbach, R. SARacheology-detecting palaeochannels based on high resolution radar data and their impact of changes in the settlement pattern in Cilicia (Turkey). Geosciences 2017, 74, 109. [Google Scholar] [CrossRef]
  33. Menze, B.H.; Ur, J.A.; Sherrat, A.G. Detection of ancient settlement mounds: Archaeological survey based on SRTM terrain model. Photogramm. Eng. Remote Sens. 2006, 72, 321–327. [Google Scholar] [CrossRef]
  34. Ur, J.A. Settlement and landscape in Northern Mesopotamia: The tell Hamourak survey 2000–2001. Akkadica 2002, 123, 57–88. [Google Scholar]
  35. Yetiş, C. Reorganization of the Tertiary stratigraphy in the Adana Basin, southern Turkey. Stratigr. Newsl. 1988, 20, 43–58. [Google Scholar] [CrossRef]
  36. Over, S.; Ozden, S.; Can Unlugenc, U. Late Cenozoic stress distribution along the Misis Range in the Anatolian, Arabian, and African plate intersection region, SE Turkey. Tectonics 2004, 23. [Google Scholar] [CrossRef]
  37. Duman, T.Y.; Emre, Ö. The East Anatolian Fault: Geometry, segmentation and jog characteristics. Geol. Soc. Lond. Spec. Publ. 2013, 372, 495–529. [Google Scholar] [CrossRef]
  38. Ramsay, W.M. Cilicia, tarsus and the great tarsus pass. Geogr. J. 1903, 22, 357–413. [Google Scholar] [CrossRef]
  39. Russel, R.J. Alluvial morphology and Anatolian rivers. Ann. Assoc. Amer. Geogr. 1954, 44, 363–391. [Google Scholar] [CrossRef]
  40. Bini, M.; Brückner, H.; Chelli, A.; Pappalardo, M.; Da Prato, S.; Gervasini, L. Palaeogeographies of the Magra Valley coastal plain to constrain the location of the Roman harbour of Luna (NW Italy). Palaeog. Palaeoclim. Palaeoecol. 2012, 337–338, 37–51. [Google Scholar] [CrossRef]
  41. Butzer, K.W. Challenges for a cross-disciplinary geoarchaeology: The intersection between environmental history and geomorphology. Geomorphology 2008, 101, 402–411. [Google Scholar] [CrossRef]
  42. Isola, I.; Bini, M.; Ribolini, A.; Zanchetta, G.; D’Agata, A.L. Geomorphology of the Ceyhan River lower plain (Adana Region, Turkey). J. Maps 2017, 13, 133–141. [Google Scholar] [CrossRef]
  43. Aksu, A.E.; Ulug, A.; Piper, D.J.W.; Konuk, Y.T.; Turgut, S. Quaternary sedimentary history of Adana, Cilicia and Iskenderun Basins: Northeast Mediterranean Sea. Mar. Geol. 1992, 104, 55–71. [Google Scholar] [CrossRef]
  44. Çetin, H.; Bal, Y.; Demirkol, C. Engineering and environmental effects of coastline changes in Turkey. Northeastern Mediterranean. Environ. Eng. Geosci. 1999, 5, 315–330. [Google Scholar] [CrossRef]
  45. Meng, Q.; Cieszewski, C.; Madden, M. Large area forest inventory using Landsat ETM+: A geoastatistical approach. ISPRS J. Photogr. Remote Sens. 2009, 64, 27–36. [Google Scholar] [CrossRef]
  46. Kuri, F.; Murwira, A.; Murwira, K.S.; Masocha, M. Predicting maize yield in Zimbabwe using dry dekads derived from remotely sensed vegetation condition index. Int. J. Appl. Earth Oserv. Geoinf. 2014, 33, 39–46. [Google Scholar] [CrossRef]
  47. Vogeler, J.C.; Yang, Z.; Cohen, W.B. Mapping post-fire habitat characteristics through the fusion of remote sensing tolls. Remote Sens. Environ. 2016, 173, 294–303. [Google Scholar] [CrossRef]
  48. United States Geographical Service. Available online: https://earthexplorer.usgs.gov (accessed on 8 January 2018).
  49. Gossens, R.; De Wulf, A.; Bourgeois, J.; Gheyle, W.; Willems, T. Satellite imagery and archaeology: The example of CORONA in the Altai Mountains. J. Archaeol. Sci. 2006, 33, 745–755. [Google Scholar] [CrossRef]
  50. Bitelli, G.; Girelli, V.A. Metrical use of declassified satellite imagery for an area of archaeological interest in Turkey. J. Cult. Heritage 2009, 10S, e35–e40. [Google Scholar] [CrossRef]
  51. Folk, R.L.; Ward, W.C. Brazos River bar: A study in the significance of grain size parameters. J. Sedim. Petrol. 1957, 27, 3–26. [Google Scholar] [CrossRef]
  52. Blott, S.J.; Pye, K. GRADISTAT: A grain size distribution and statistics package for the analysis of unconsolidated sediments. Earth Surf. Proc. Landf. 2001, 26, 1237–1248. [Google Scholar] [CrossRef]
  53. Leone, G.; Leoni, L.; Sartori, F. Revisione di un metodo gasometrico per la determinazione di calcite e dolomite. Atti Soc. Tosc. Sci. Nat. Mem. Serie A 1988, 95, 7–20. [Google Scholar]
  54. Ciampalini, A.; Garfagnoli, F.; Antonielli, B.; Del Ventisette, C.; Moretti, S. Photo-lithological map of the southern flank of the Tindouf Basin (Western Sahara). J. Maps 2012, 8, 453–464. [Google Scholar] [CrossRef]
Figure 1. Geographic location of the Ceyhan alluvial plain. Study area is in the green box. Red lines represent the main tectonic elements (i.e., fault and fault zone), named or unnamed according to the geological literature.
Remotesensing 10 00241 g001
Figure 2. (a) SPOT images; (b) 432 combinations of spectral bands from Landsat images; (c) 453 combinations of spectral bands from Landsat images; and (d) 742 combinations of spectral bands from Landsat images. White circles correspond to the color anomaly areas identified in the SPOT images.
Remotesensing 10 00241 g002
Figure 3. Examples of multispectral analysis performed by using Sentinel-2 satellite: (a) FCC 432 (bands 432 in RGB); and (b) FCC 843 (bands 843 in RGB respectively).
Remotesensing 10 00241 g003
Figure 4. Types of color anomalies detected on satellite images: (a) whitish color strips of various lengths with curved trend consistent with a paleochannel; (b) with straight trend in most cases inconsistent with the archeological remains; (c) whitish color anomalies with irregular/regular rounded shapes, composed elements; and (d) single element. These last two types of color anomalies are often consistent with leveled höyük.
Remotesensing 10 00241 g004
Figure 5. Types of color anomalies detected on Sentinel-2 satellite images: (a) type 1 anomaly, paleochannel traces; and (bd) type 2 anomalies (archeological remains with regular and/or rounded shapes).
Remotesensing 10 00241 g005
Figure 6. Comparison between CORONA and Sentinel-2 images: (a) well preserved höyük detected in the CORONA image; and (b) the same höyük with the same tell recognized by Sentinel-2.
Remotesensing 10 00241 g006
Figure 7. SPOT images available from Google Earth platform: (a) acquisition of images 2011; (b) acquisition of images 2013; and (c) acquisition of images 2017. Color anomalies (yellow circles) are clearly visible in all images.
Remotesensing 10 00241 g007
Figure 8. Comparison at the same scale between: the höyük mapped by Seton-Williams [31] (a); and the anomalies mapped in this work (b). During her archeological survey in 1951, Seton-Williams mapped several höyük that have been destroyed by human impact, in particular by agricultural activities. Nowadays, the alluvial plain of the Ceyhan River is marked by many color anomalies possibly corresponding to the archeological sites.
Remotesensing 10 00241 g008
Figure 9. On the georeferenced map by Seton-Williams, we reported the color anomalies only identified by remote-sensing (blue circles); the color anomalies identified by remote-sensing and verified on the field (green circles); and the höyük mapped by Seton-Williams (red circles). We can observe that in area “a” there is a very good correspondence between höyük and the detected anomalies, while a minor degree of correspondence is observed in sectors “b” and “c”. Finally, in sector “d” we found color anomalies also verified on the field where Seton-William did not report any höyük.
Remotesensing 10 00241 g009
Figure 10. Grain-size distribution of samples collected inside (dark gray) and outside (light grey) the color anomalies. The sample code is reported. Statistics obtained using GRADISTAT [52].
Remotesensing 10 00241 g010
Figure 11. TIC percentages vs. CaCO3 and TOC vs. CaCO3 analyses. Red squares correspond to soils sampled outside the anomalies, while blue circles correspond to soils sampled inside the anomalies. An increase in CaCO3 content is documented for the soils collected inside the anomalies.
Remotesensing 10 00241 g011
Table 1. Results of the comparison among the three images that were used, based on the höyük recognized during the field survey. Landsat images were not considered since they were not useful for detecting höyük given their lower spatial resolution. The column “höyük” indicates if the anomaly corresponds to a höyük after the field survey.
LatitudeLongitudeSPOTSentinel-2CORONAHöyükNote
VisibleLeveledVisibleLeveledVisibleLeveled
36°58′9.77″N35°30′55.70″Eyesnoyesnoyesnoyes
36°54′48.94″N35°32′39.08″Eyesyesyesyesno yes
36°56′5.03″N35°29′8.70″Eyesyesyesyesyesyesyes
36°55′36.02″N35°29′41.46″Eyesyesyesyesno noroad?
36°46′36.76″N35°29′20.97″Eyesyesno yesyesno
36°42′5.54″N35°27′4.17″Eyesyesyesyesyesyesyes
36°37′46.37″N35°26′12.03″Eyesyesyesyesno yes
36°53′48.11″N35°31′44.31″Eyesyesyesyesyesyesyes
36°53′14.13″N35°27′0.86″Eyesyesyesyesyesyesyes
36°53′43.05″N35°30′32.21″Eyesyesno no yes
36°52′53.99″N35°22′42.27″Eyesyesyesyesyesyesyes
36°52′57.04″N35°22′39.30″Eyesyesyesyesyesyesyes
36°43′34.99″N35°25′37.75″Eyesyesyesyesno yes
36°43′12.86″N35°25′51.60″Eyesyesyesyesno yes
36°43′12.86″N35°25′51.66″Eyesyesyesyesno yes
36°43′40.90″N35°26′52.92″Eyesyesyesyesyesyesyes
36°43′23.41″N35°27′47.46″Eyesyesyesyesyesyesyes
36°43′24.63″N35°27′17.30″Eyesyesyesyesno yes
36°44′8.23″N35°27′5.21″Eyesyesyesyesno yes

