Prediction of Chlorophyll Content in Different Light Areas of Apple Tree Canopies based on the Color Characteristics of 3D Reconstruction

1
College of Electrical and Information, Heilongjiang Bayi Agricultural University, DaQing 163319, China
2
Key Laboratory of Modern Precision Agriculture System Integration Research, Ministry of Education, China Agricultural University, Beijing 100083, China
*
Authors to whom correspondence should be addressed.
Remote Sens. 2018, 10(3), 429; https://doi.org/10.3390/rs10030429
Submission received: 12 January 2018
/
Revised: 16 February 2018
/
Accepted: 8 March 2018
/
Published: 10 March 2018
(This article belongs to the Special Issue Estimation of Crop Phenotyping Traits using Unmanned Ground Vehicle and Unmanned Aerial Vehicle Imagery)
Abstract
:Improving the speed and accuracy of chlorophyll (Ch1) content prediction in different light areas of apple trees is a central priority for understanding the growth response to light intensity and in turn increasing the primary production of apples. In vitro assessment by wet chemical extraction is the standard method for leaf chlorophyll determination. This measurement is expensive, laborious, and time-consuming. Over the years, alternative methods—both rapid and nondestructive—were explored, and many vegetation indices (VIs) were developed to retrieve Ch1 content at the canopy level from meter- to decameter-scale reflectance observations, which have lower accuracy due to the possible confounding influence of the canopy structure. Thus, the spatially continuous distribution of Ch1 content in different light areas within an apple tree canopy remains unresolved. Therefore, the objective of this study is to develop methods for Ch1 content estimation in areas of different light intensity by using 3D models with color characteristics acquired by a 3D laser scanner with centimeter spatial resolution. Firstly, to research relative light intensity (RLI), canopies were scanned with a FARO Focus3D 120 laser scanner on a calm day without strong light intensity and then divided into 180 cube units for each canopy according to actual division methods in three-dimensional spaces based on distance information. Meanwhile, four different types of RLI were defined as 0–30%, 30–60%, 60–85%, and 85–100%, respectively, according to the actual division method for tree canopies. Secondly, Ch1 content in the 180 cubic units of each apple tree was measured by a leaf chlorophyll meter (soil and plant analyzer development, SPAD). Then, color characteristics were extracted from each cubic area of the 3D model and calculated by two color variables, which could be regarded as effective indicators of Ch1 content in field crop areas. Finally, to address the complexity and fuzziness of relationships between the color characteristics and Ch1 content of apple tree canopies (which could not be expressed by an accurate mathematical model), a three-layer artificial neural network (ANN) was constructed as a predictive model to find Ch1 content in different light areas in apple tree canopies. The results indicated that the mean highest and mean lowest value of Ch1 content distributed in 60–85% and 0–30% of RLI areas, respectively, and that there was no significant difference between adjacent RLI areas. Additionally, color characteristics changed regularly as the RLI rose within canopies. Moreover, the prediction of Ch1 content was strongly correlated with those of actual measurements (R = 0.9755) by the SPAD leaf chlorophyll meter. In summary, the color characteristics in 3D apple tree canopies combined with ANN technology could be used as a potential rapid technique for predicting Ch1 content in different areas of light in apple tree canopies.
1. Introduction
Photosynthesis is one of the most important biochemical processes on the planet, allowing life to survive on Earth through the production of light carbon reactions under visible light irradiation [1]. Chlorophyll (Ch1) contributes to the absorption of photosynthetically-active radiation [2]. Chlorophyll content is a major indicator of the physiological status of plants [3], and is also an essential pigment for the transformation of solar radiation energy into chemical energy stored in leaves. Thus, Ch1 content is directly related not only to photosynthetic potential, but also to primary yield. In addition, chlorophyll indirectly reflects nutrient status because nitrogen is the primary constituent element of chlorophyll pigments [4].
The study of Ch1 content in different areas of light in apple trees has attracted much attention from researchers in pomology and other agricultural fields due to its efficacy in assessing the growth status of an entire tree [5]. Leaf Ch1 content is conventionally measured directly through wet chemical methods, such as pigment extraction in an organic solvent and spectrophotometric determination of absorbance in the chlorophyll solution [6]. Although these laboratory-based methods are accurate in obtaining Ch1 content, they also have limitations. The main shortcoming is that leaves must be ground for Ch1 content measurement, thus impacting the growth of the plant over all life stages. In addition, specialty equipment is required. Finally, the very high price and time-consuming nature of these methods have prevented their widespread application. Handheld devices such as SPAD [7] are some of the most useful contact sensors for rapid and non-destructive determination of Ch1 content in many plants. Even though these meters are very portable, they are not suitable for measuring the Ch1 content of trees like apple trees due to the tall plant height. Moreover, another restriction on measuring Ch1 content using contact sensors lies in the fact that the canopy structure of an apple tree consists of branches, leaves, and fruits, which are much more complex than that of plants such as corn and rice. These traits make it difficult for researchers to measure large canopy spaces. Finally, from a fruit science perspective, different areas of light intensity should be traditionally taken into account when canopy parameters (including Ch1 content) of an apple tree are measured. Poles and wires are used in the conventional layered slicing method to divide canopy space into many different areas to establish light intensity, which is also laborious and time-consuming. Therefore, new approaches are highly desirable for determining Ch1 content with non-invasive measurements of apple trees under different light intensities within canopies [8].
Color information in leaves is a natural qualitative vegetation index indicator in plants. An imaging system with color characteristics capable of recording red, green, and blue (RGB) band data has been emphasized for potential use in the rapid and non-invasive prediction of chlorophyll content in field crops. Numerous studies have reported the use of color image analysis to assess chlorophyll content. Yadav et al. [9] indicated that R and G band values negatively correlated with the chlorophyll content of potato plants. Additionally, Baresel et al. [10] used color information to estimate the leaf chlorophyll content of wheat, and the result showed that digital image analysis is a valuable method for the determination of the chlorophyll content. It further showed that visible band vegetation indices and their combination with plant height could be potentially used for biomass estimation in early growth stages [11]. Moreover, Hunt et al. [12] adopted the triangular greenness index (TGI) to study leaf Ch1 content based on the area of a triangle surrounding the spectral features of Ch1, and the value obtained by the approach of TGI was consistently correlated with plot-averaged Ch1-meter reading. Besides the research achievements based on RGB color space above, Hue, Saturation, Value(HSV) and hue, saturation, and intensity (HSI) color spaces could also be used for calculating Ch1 content. A protocol was developed to convert the RGB values of a color image into HSV color space, and the resultant hue value was correlated to the Ch1 content estimated by a destructive method [13]. The spectral properties of an image (e.g., hue, saturation, and intensity) were modeled as linear correlation functions for the chlorophyll content of paan in India [14].
Although the previous research indicates the possibility of studying Ch1 content in apple trees according to color formation, it is inconvenient for a camera to acquire data in different areas within a canopy: other objects such as soil and branches would be included in an image along with leaves, which increases the difficulty of image segmentation.
The 3D reconstruction of tree canopies has become a significant research topic in modern agriculture. This technique explores accurate spatial information about canopy geometrical morphology [15,16], which provides a favorable means to divide a canopy into different areas in 3D space. Among several available techniques, ground-based laser scanning has proven to be a feasible option for accurately reconstructing the geometrical features of tree crops [17]. Ground-based 3D laser scanning technology has been applied to acquire tree measurements, especially focusing on crown projection area and crown volume based on point-cloud data or the improvement of algorithms for 3D modeling. However, until now, no research related to the Ch1 content in 3D tree modeling of canopies has been conducted; it will therefore be challenging to calculate the Ch1 content of different light areas based on 3D apple tree reconstructions in orchards.
Motivated by the desire to overcome the drawbacks mentioned above, we demonstrate in this study that it is viable to assess the Ch1 content using color information in different areas of light intensity divided according to the 3D distance values based on the reconstruction of 3D morphological characteristics of apple trees in an orchard environment. Finally, Ch1 content will be predicted using an artificial neural network. The approaches in our research offer a new option for fast large-scale characterization of the Ch1 content of apple trees under natural conditions.
2. Materials and Methods
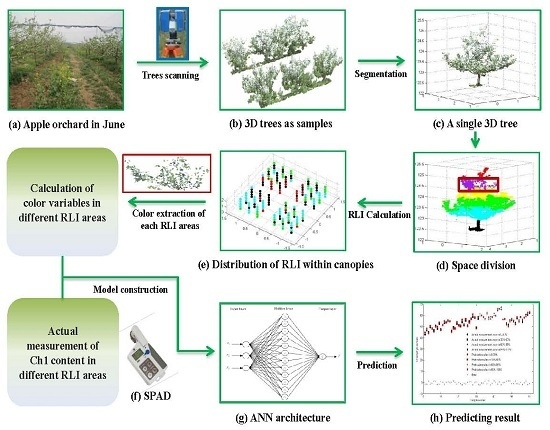
In this section, we describe the overall process flow and methods required for the calculation of Ch1 content in order to explain our work. Figure 1 highlights the overall processing framework. First, apple trees were scanned and reconstructed by a laser scanner combined with scene software. Second, canopies were divided into different spaces, and then color information was extracted and further calculated by two color variables to predict Ch1 content. Finally, a three-layer artificial neural network (ANN) was established as a model to seek the relationship between color variables and Ch1 content and predict Ch1 content in different light areas in apple tree canopies.
2.1. Canopy Division
Measurement experiments of Ch1 content and relative light intensity (RLI) were conducted on 6 June 2015, under leaf conditions on a calm day without strong light intensity (549 lux). This kind of weather was beneficial for color imaging, which is impacted by strong sunlight. The study area was located in an apple orchard with good irrigation conditions in Beijing, China. The orchard was oriented in an east–west direction, and its row spacing was 2.5 m. Trees were planted in this orchard in 2009, and varieties in this study were free spindle-shaped apple trees at an average height of 3.5 m. Six trees with similar growth and potential were selected from the dataset collected from this orchard for testing. According to pomology theory, different light intensities distribute through the canopy due to the trees’ architecture and growth, which in turn impacts yield.
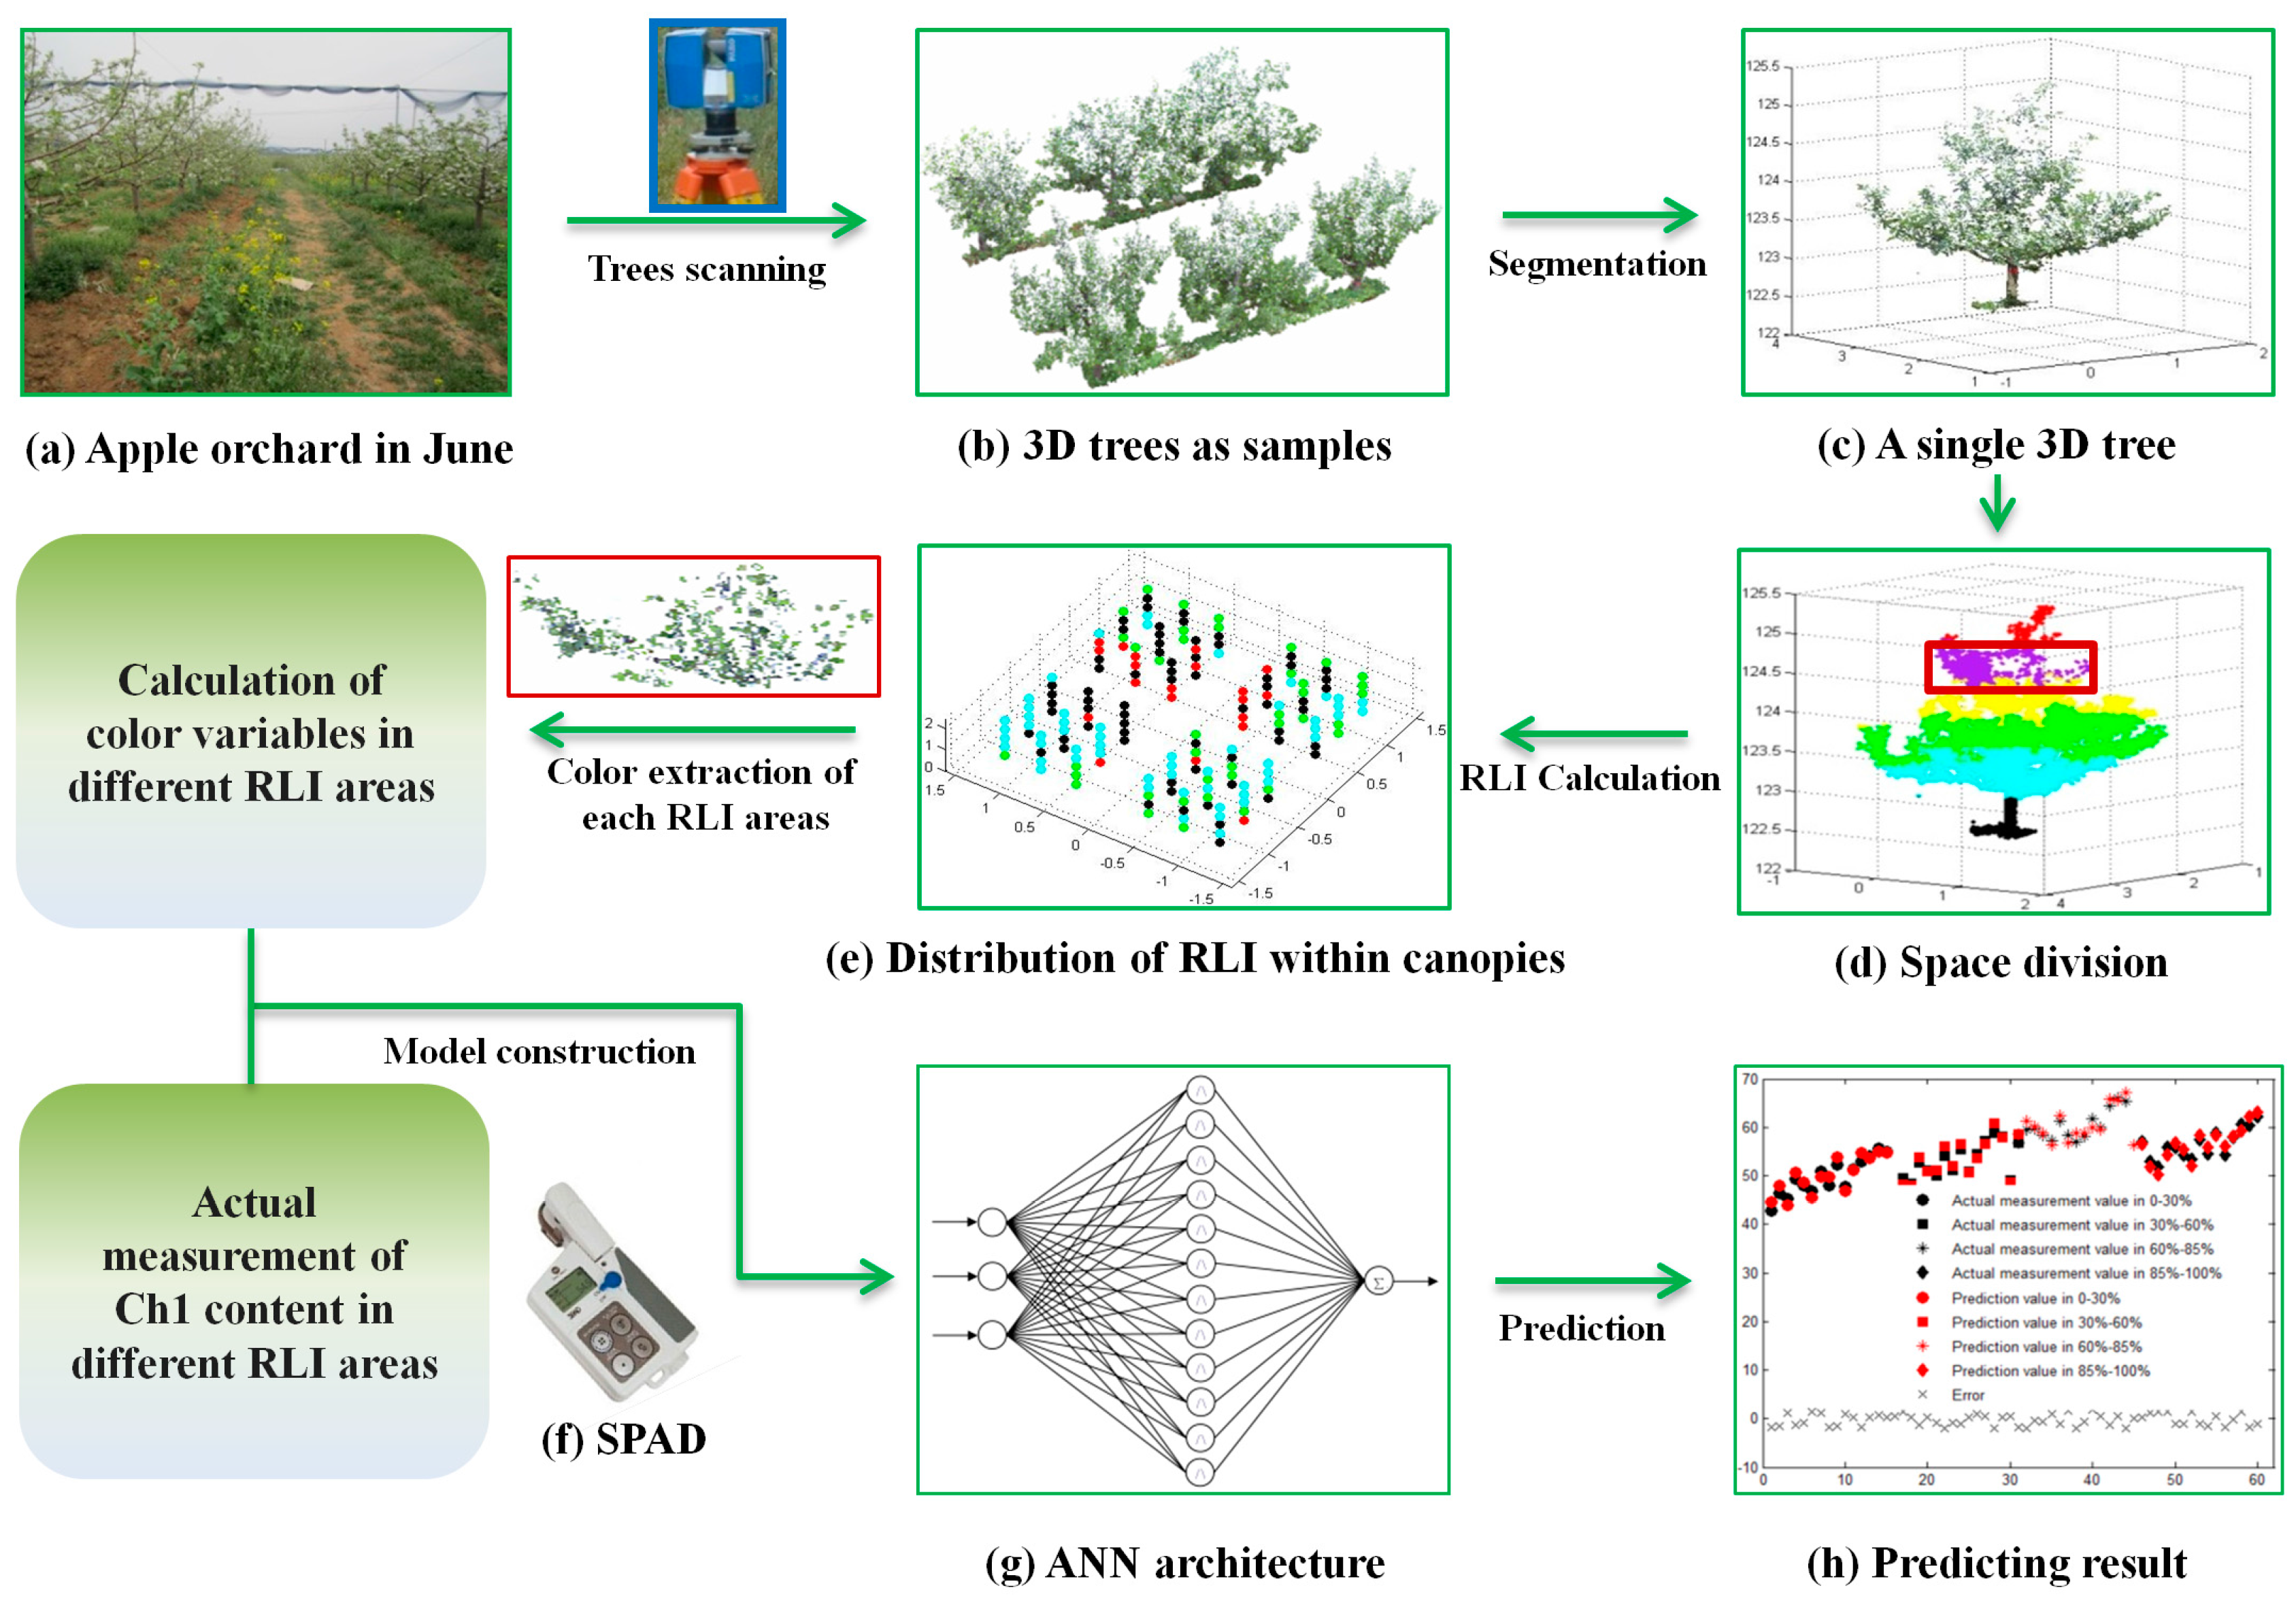
Relative light intensity (RLI) is defined as the ratio of light intensity in a canopy area to external natural light intensity [18]. The RLI in an apple tree canopy can be summarized into four types, including RLI higher than 85%, between 65% and 85%, between 35% and 65%, and lower than 30%. The areas with light intensity between 65% and 85% are defined as the best lighting conditions that are beneficial to yield. Areas with light intensity lower than 30% are known as invalid light areas, which are not expected in a canopy. As visible in Figure 2, an ideal light distribution within a canopy includes light intensity that gradually increases from inside to outside and from bottom to top, which is a general tendency for free spindle-shaped apple trees. Although the realistic counterpart in free spindle-shaped apple trees generally follows the rule above, the actual measurement of RLI should still be performed due to the necessity of knowing the true light distribution.
Canopy division was performed on April 2015, and was the first step in understanding the distribution of RLI and researching the Ch1 content in different RLI areas within an apple tree canopy. Canopy space could be regarded as a cube in order to partition a canopy reasonably. Poles and iron wires were utilized to divide the cubic canopy space into five layers in light of the traditional partitioning method in pomology. The height of each layer was equal to one-fifth of the canopy height. It is worth noting that the number of layers could be adjusted in accordance with canopy height and complexity. In addition, each layer was further sectioned off in six rows by six columns. Thus, there were total 180 small stereoscopic areas in a canopy space. The division effect could be observed in Figure 3a.
2.2. Relative Light Intensity Measurement
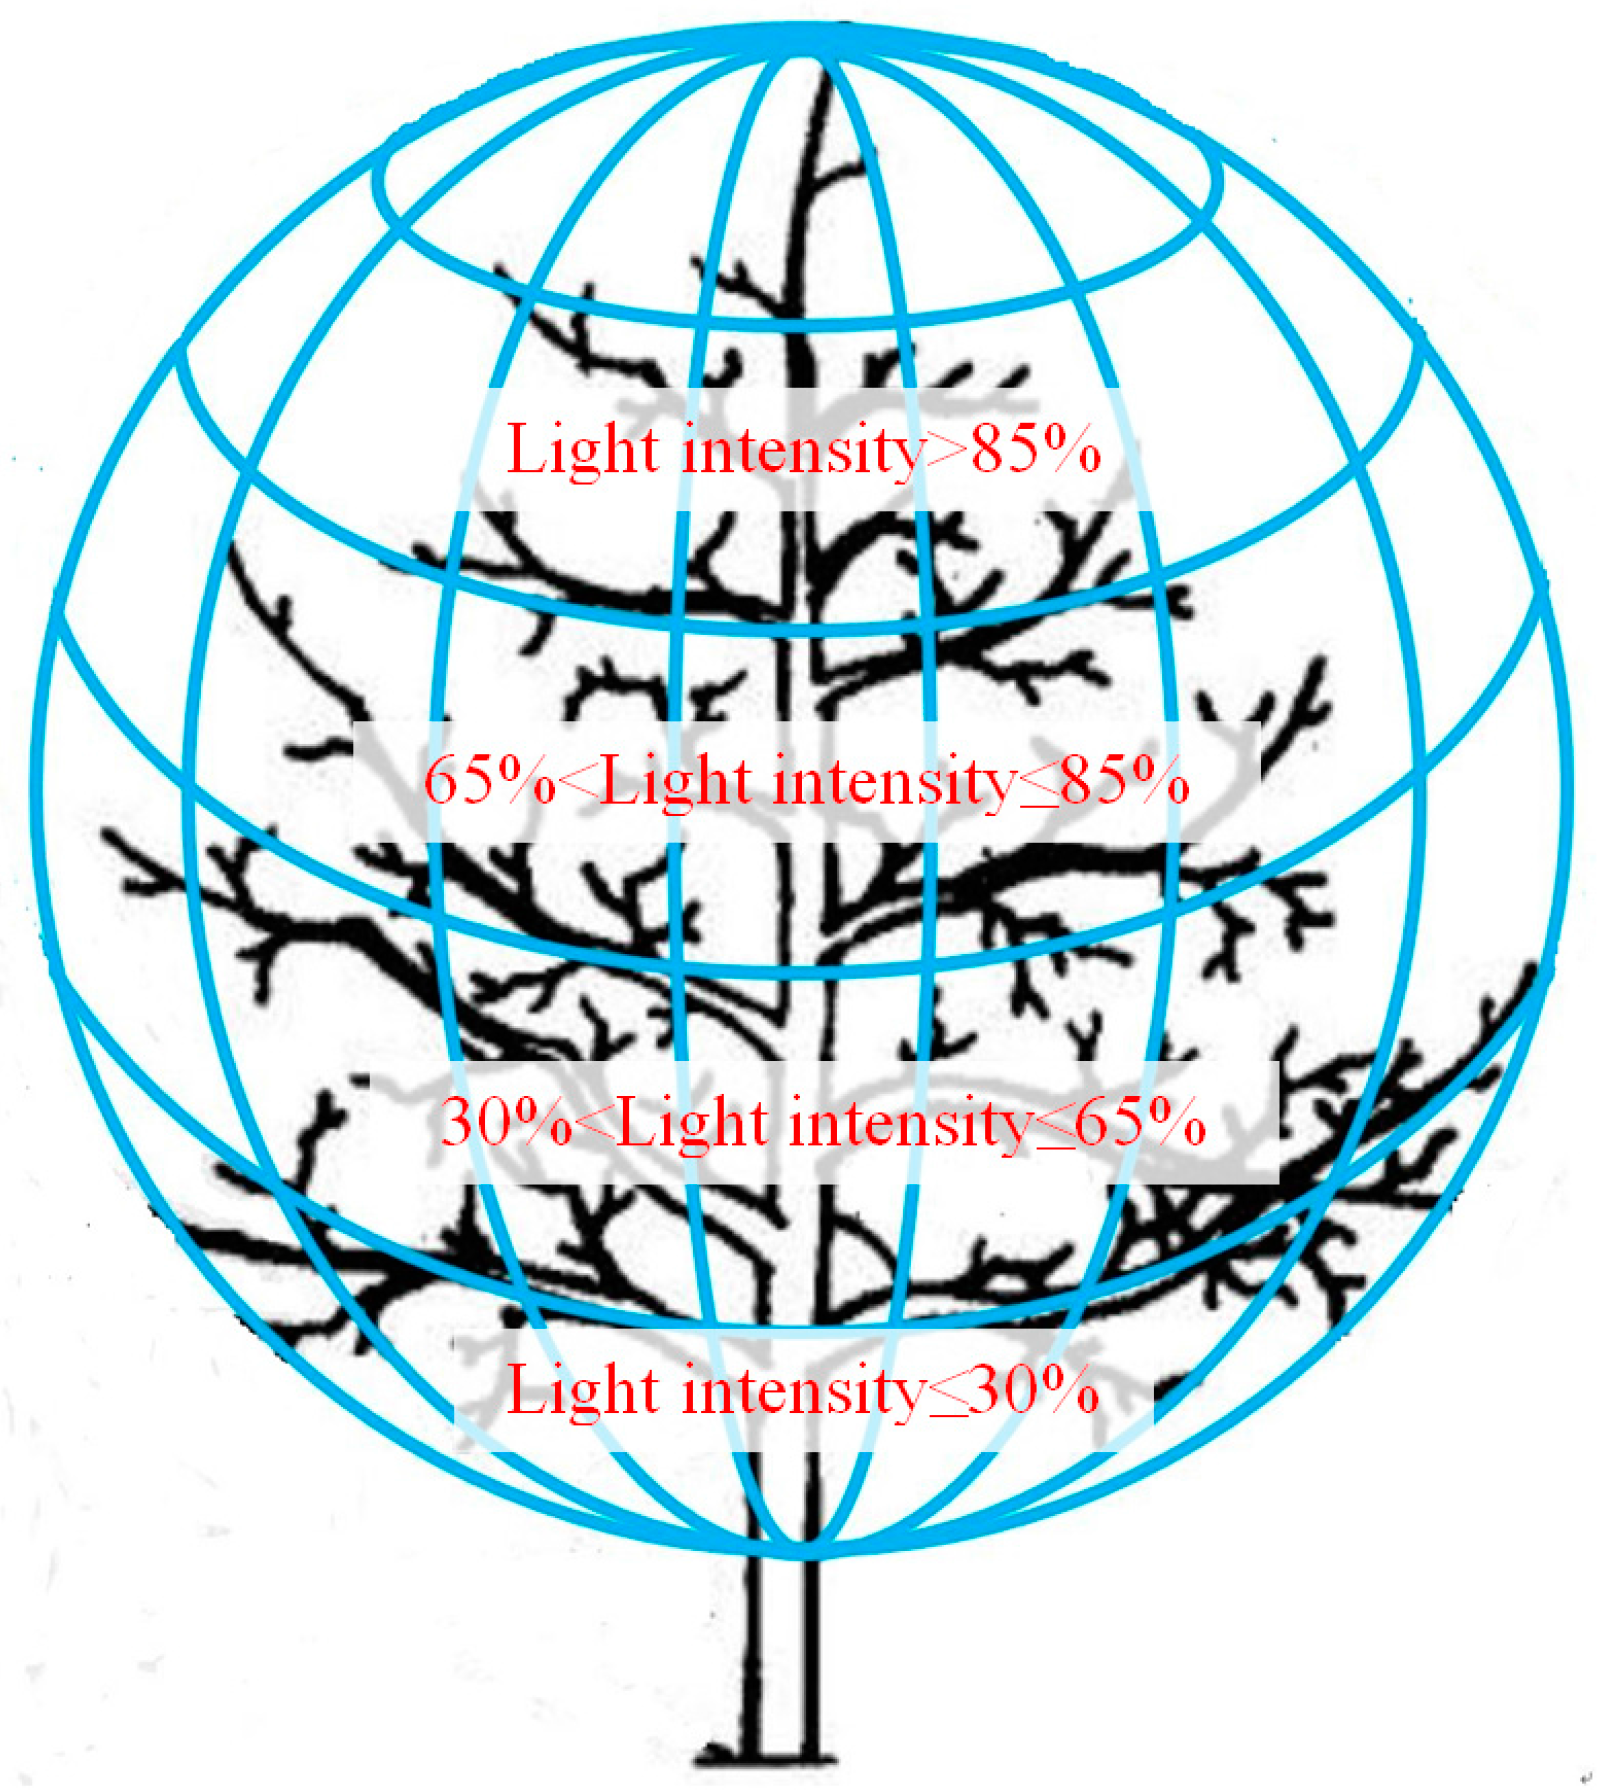
The next step was the measurement of RLI in different areas within the canopy, which can be expressed by Equation (1) in each light area. A common device for acquiring light intensity is the portable light meter [19]. However, it is time-consuming to measure many areas of a canopy one-by-one using portable light meters. Moreover, the measurement results are probably inaccurate because the sunlight would be blocked by the people taking the measurements. To improve accuracy, the measurement of light intensity for 180 cubic areas was carried out in each apple tree canopy in this study with light intensity sensors that we independently researched and developed. As shown in Figure 3b, six light sensors (0–200 Klux, China) controlled simultaneously through software we developed and installed in a laptop were fixed to a flat aluminum plate, which enabled light intensity in one column where six light areas could be acquired at the same time, with no shelter to impact accuracy. Light intensity in each area was measured four times by moving the aluminum plate. Meanwhile, the current natural light intensity was recorded by the same type of light intensity sensor accordingly in order to overcome the influence caused by quick changes of nature light intensity.
Here, indicates relative light intensity, and and represent light intensity in one light area and current natural light intensity in the orchard, respectively.
2.3. Ch1 Content Measurement
After establishing the distribution of RLI within a canopy, Ch1 content measurement was conducted from 9 a.m. to 11 a.m. on 6 June 2016. For the purpose of researching Ch1 content in different light areas in free spindle-shaped apple trees, a SPAD-502 Ch1 meter (Konica Minolta Sensing, Osaka, Japan) was used for Ch1 content acquisition as a reference field method. This device measures the absorbance of leaves at the 650 nm wavelength, at which both Ch1 a and b could reach maximum absorbance, while absorbance at the 940 nm wavelength was also measured in order to adjust for differences in individual leaf thickness. A “SPAD number” was calculated based on these two transmission values. Six leaves located at the bottom, middle, and top of one light area were measured three times and then averaged, recording one value for light intensity in one light area.
2.4. Three-Dimensional Laser Scanning System and Data Registration
In this study, a FARO Focus3D 120 laser scanner was used to acquire 3D data of apple trees after measuring Ch1 content. It captures objects in a range from 0.6 m to 120 m. Like all other phase-based scanners, it is characterized by a high measuring speed at a maximum of 976.000 measuring points per second. The Focus3D 120 can be controlled by a touch screen and by an external laptop via WLAN, as well as directly via physical cable connection. The scanner is equipped with an internal color camera of 70 million pixels in which an automatic brightness correction function works to avoid color distortion, enabling the reconstruction of a colorful 3D model.
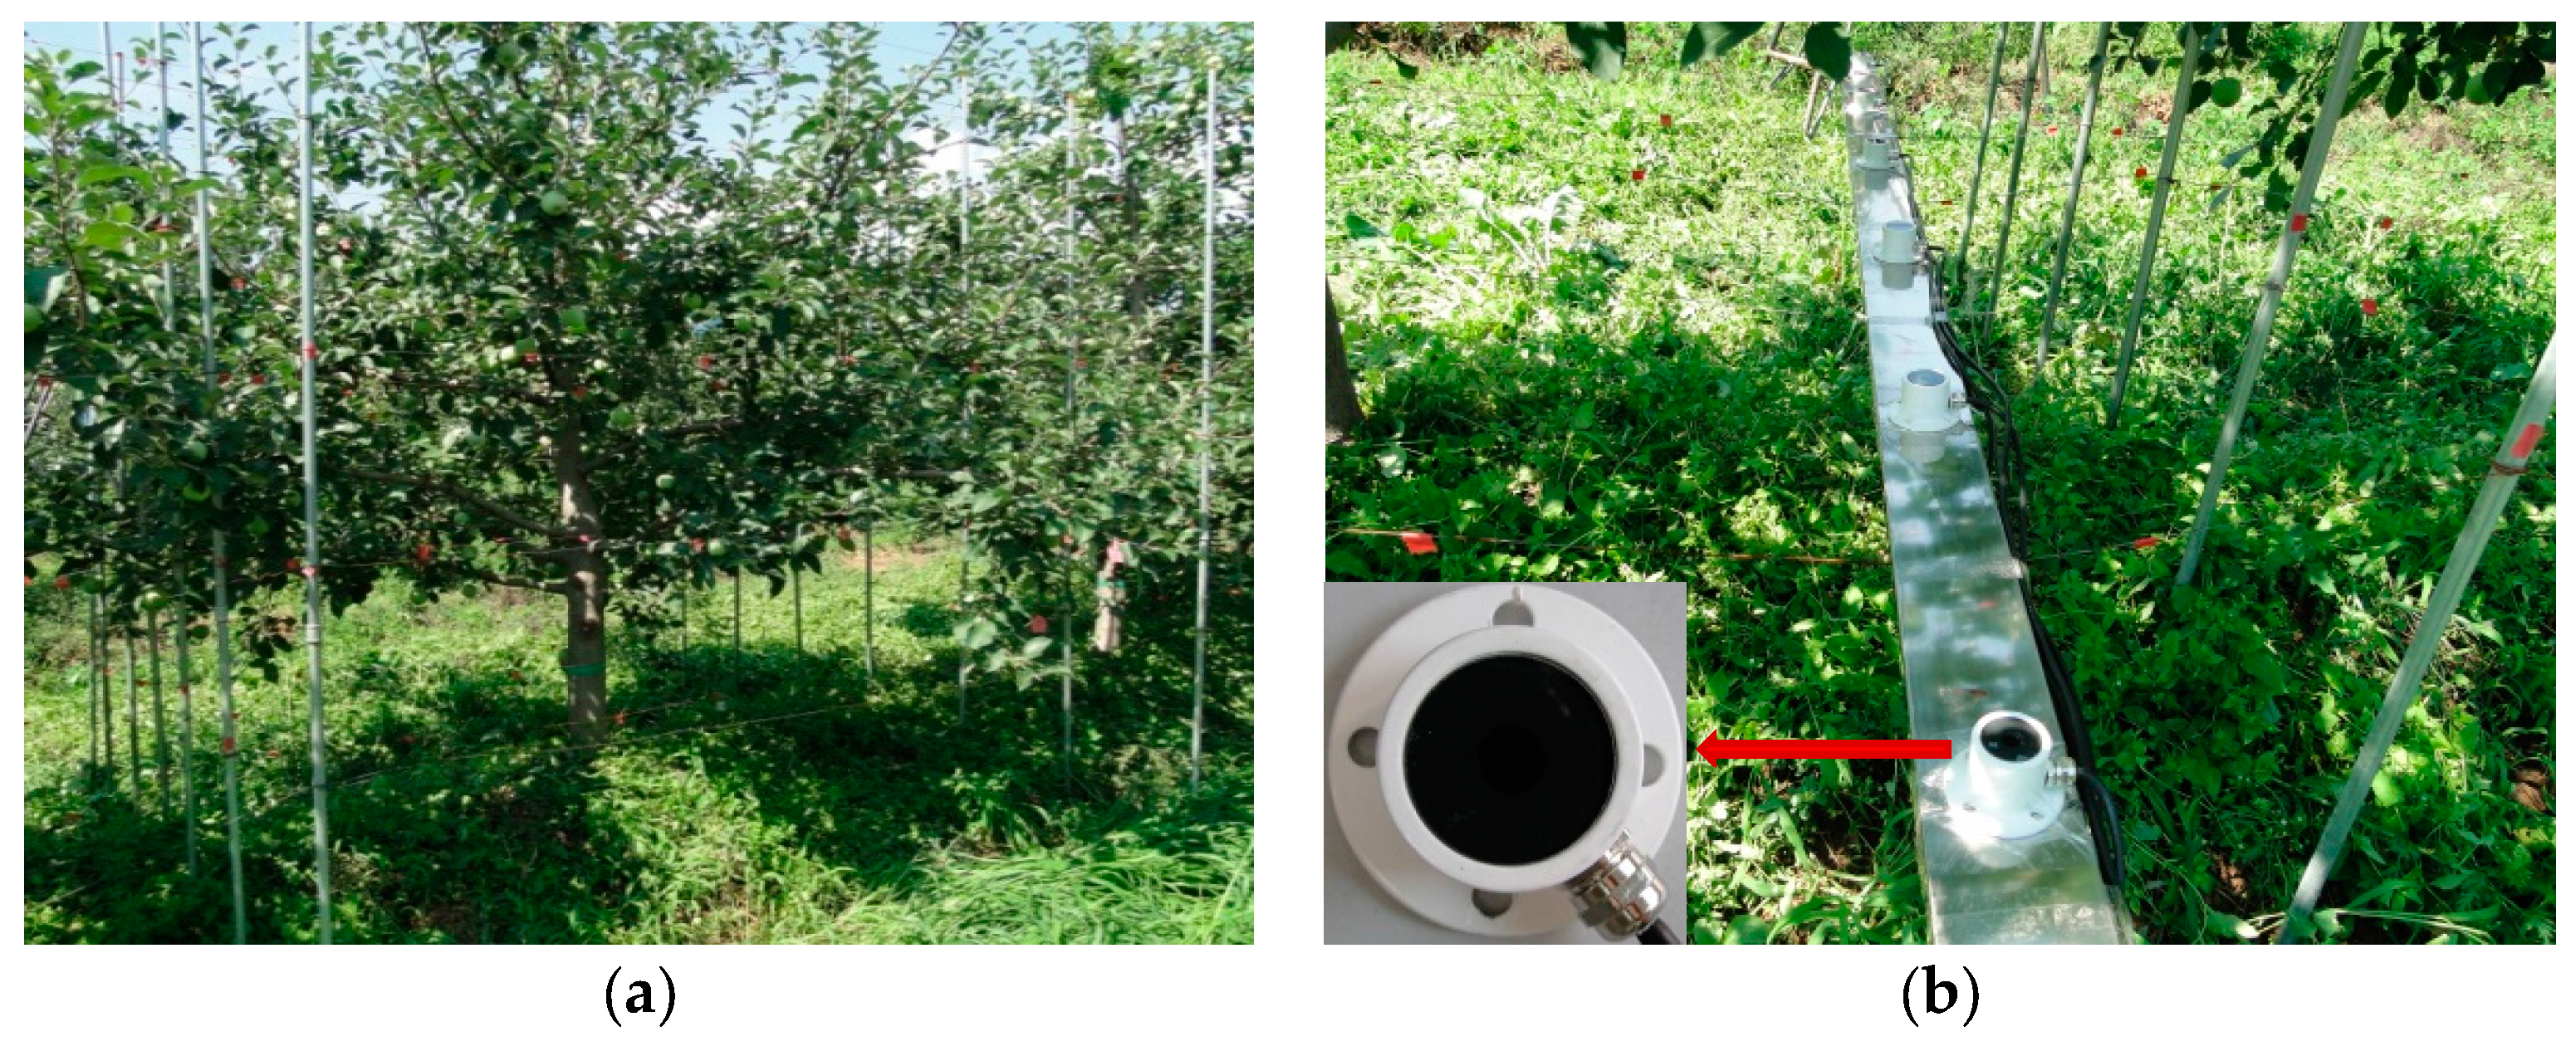
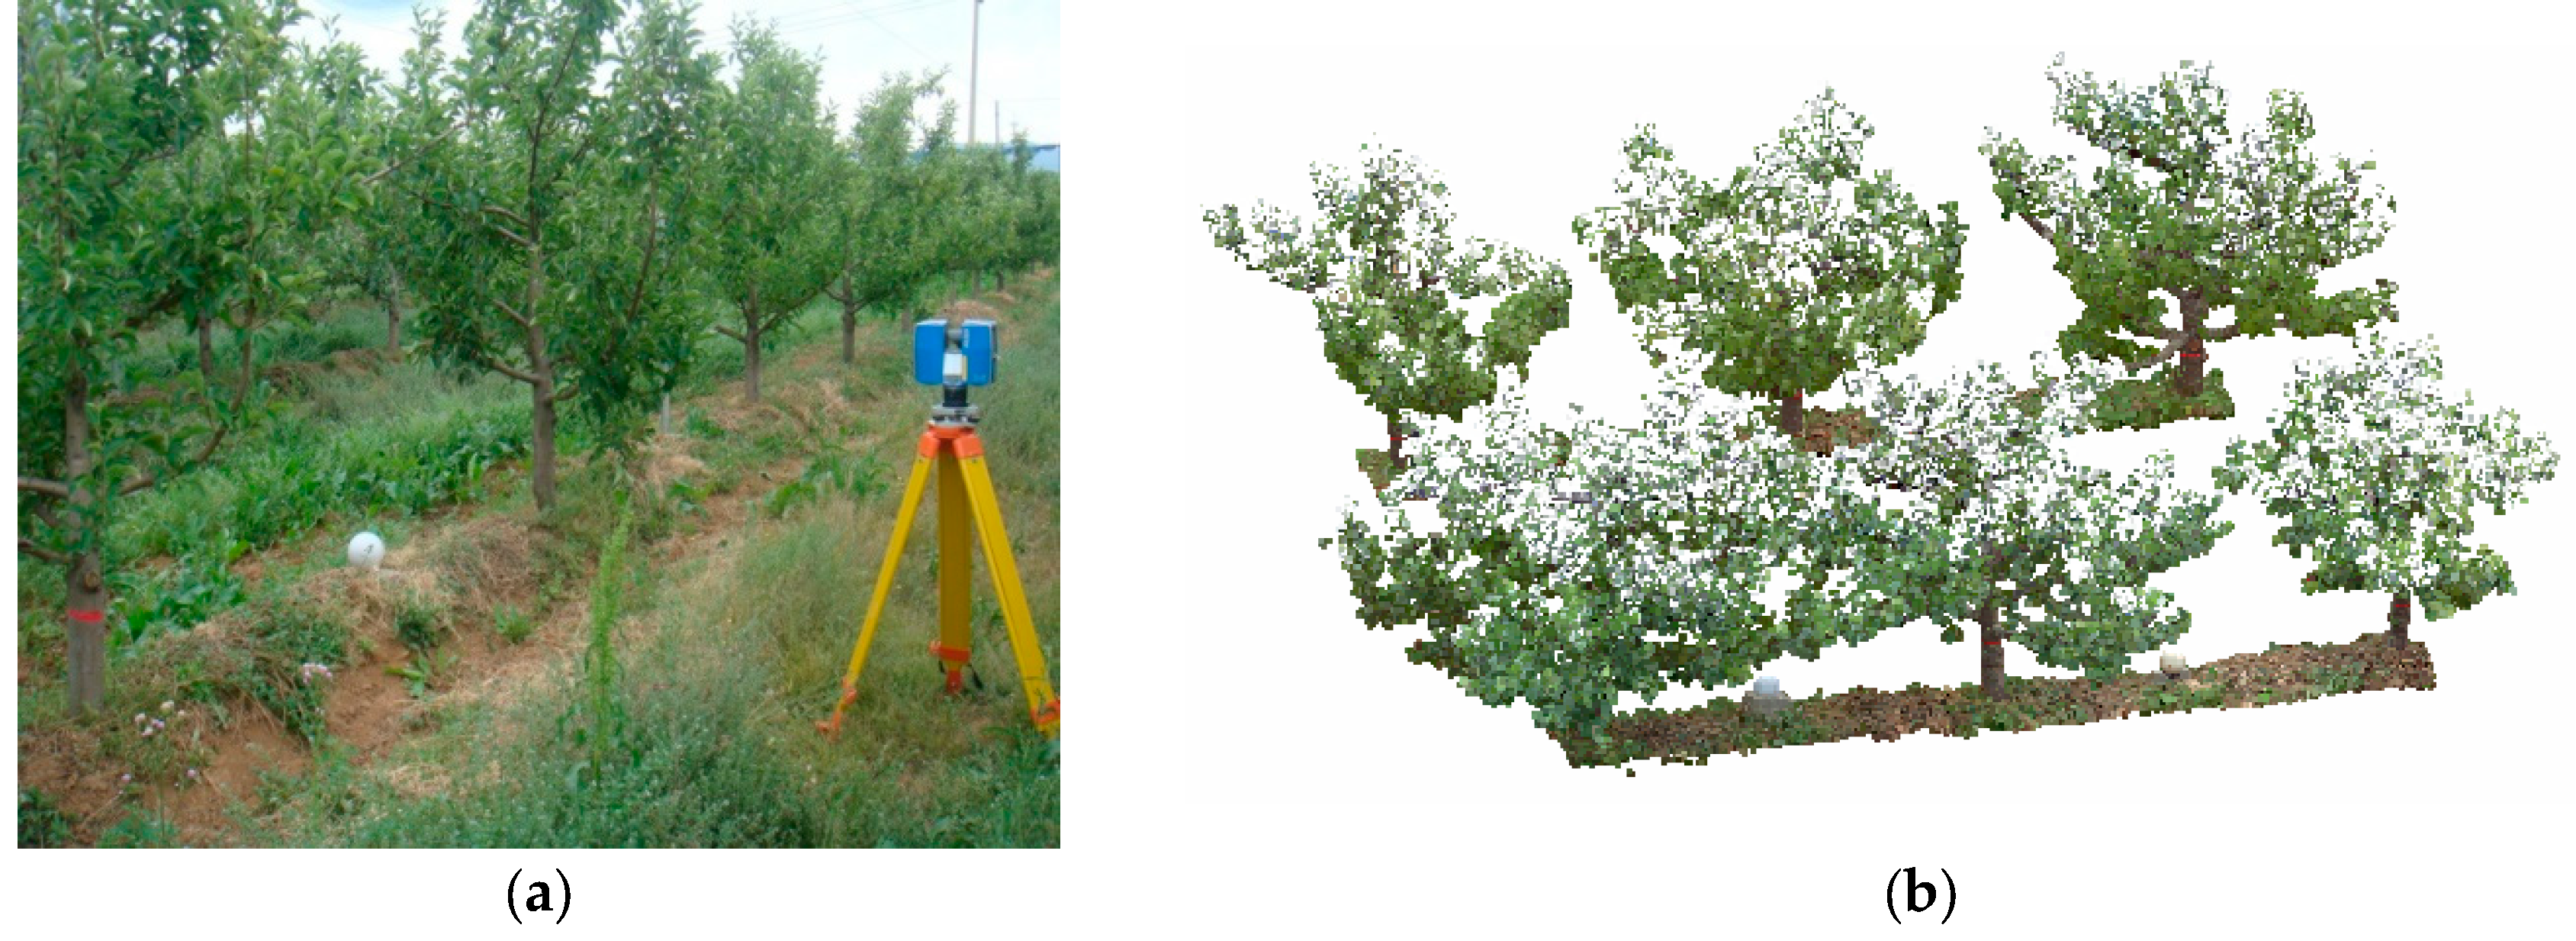
Prior to scanning, the locations of the measurement stations and auxiliary scanning equipment were determined for sample trees. The 3D laser scanner stations were set closest to the trees with a full view of the sample trees. Since the scenes to be scanned by the 3D laser scanning system were complex, and there are limitations in the laser scanner’s perspectives and the effect of intra-object shading, three stations were set up around a sample tree in order to obtain the 360° panoramic view of the tree. The auxiliary scanning equipment including reference balls were fixed for data registration. The scanning scene is illustrated in Figure 4a. At least three control targets were observed from each measurement station. Once the work was complete, the built-in CCD camera was used to collect photographs of the measurement area for subsequent data processing.
The scene software matched with this 3D laser scanner was used to register the raw point-cloud data. The data point coordinates about the scene space surface information obtained from different stations were converted to a uniform and designated coordinate system to complete the data registration. In the study, the point-cloud data of the first station was used as the basis, and the other stations were then matched with the first station according to the control targets so that the point-cloud data at all stations could be registered into one coordinate system. Figure 4b shows an example of point-cloud data after registration.
2.5. Selection of Color Variables
After acquiring the three-dimensional shape of apple trees, color characteristics including R, G, and B values were extracted from different light intensity areas within a canopy, and color variables were calculated through two different methods; these two color variables were used for predicting Ch1 content.
Various kinds of color variables have been developed to estimate Ch1 content, such as (R − G)/(R + G), (R − B)/(R + B), (G − B)/(G + B), (R − G)/(R + G + B), etc. It was found that although R − B and G − B wavelengths showed the highest correlation with Ch1 content under a limited range of meteorological conditions, normalized difference (R − B)/(R + B) was the most applicable function in a number of tests with color variables [20]. It was also much better than other color variables such as (R − G)/(R + G), (G − B)/(G + B), and (R − B)/(R + G + B), and could be used for data collection under different meteorological conditions and different growth stages for plant materials including wheat and rye with genetic diversities. Thus, (R − B)/(R + B) was the first color variable we selected to predict the Ch1 content of different light areas of apple trees.
Equation (3) can non-linearly map the normalized value of the G value using logarithmic sigmoid transfer functions. The equation was validated using three different plants (tomato, lettuce, and broccoli). The R, G, and B components were transformed by applying a single mathematical function to all of the observations with a logarithmic operator to improve the data distribution. Additionally, a standardization process was also performed to achieve zero mean and unit variance for the data points [21].
2.6. Prediction Model
Neural network models have been widely used in the field of data classification and prediction [22,23,24]. The restrictions imposed by using a single-layer network have directed scientists to the development of multi-layer feed-forward networks with one or more hidden layers, called multi-layer perceptron (MLP) networks. These new networks surpass many of the limitations of single-layer perceptrons, and can be trained using the back-propagation algorithm.
Normally, nonlinear curve-fitting (data-fitting) problems are solved in the least-squares sense by finding coefficients x that solve the following problem:
The given input data xdata and the observed output ydata, xdata, and ydata are matrices or vectors, and F(x, xdata) is a matrix or vector of a value’s function, which has the same size as that of ydata.
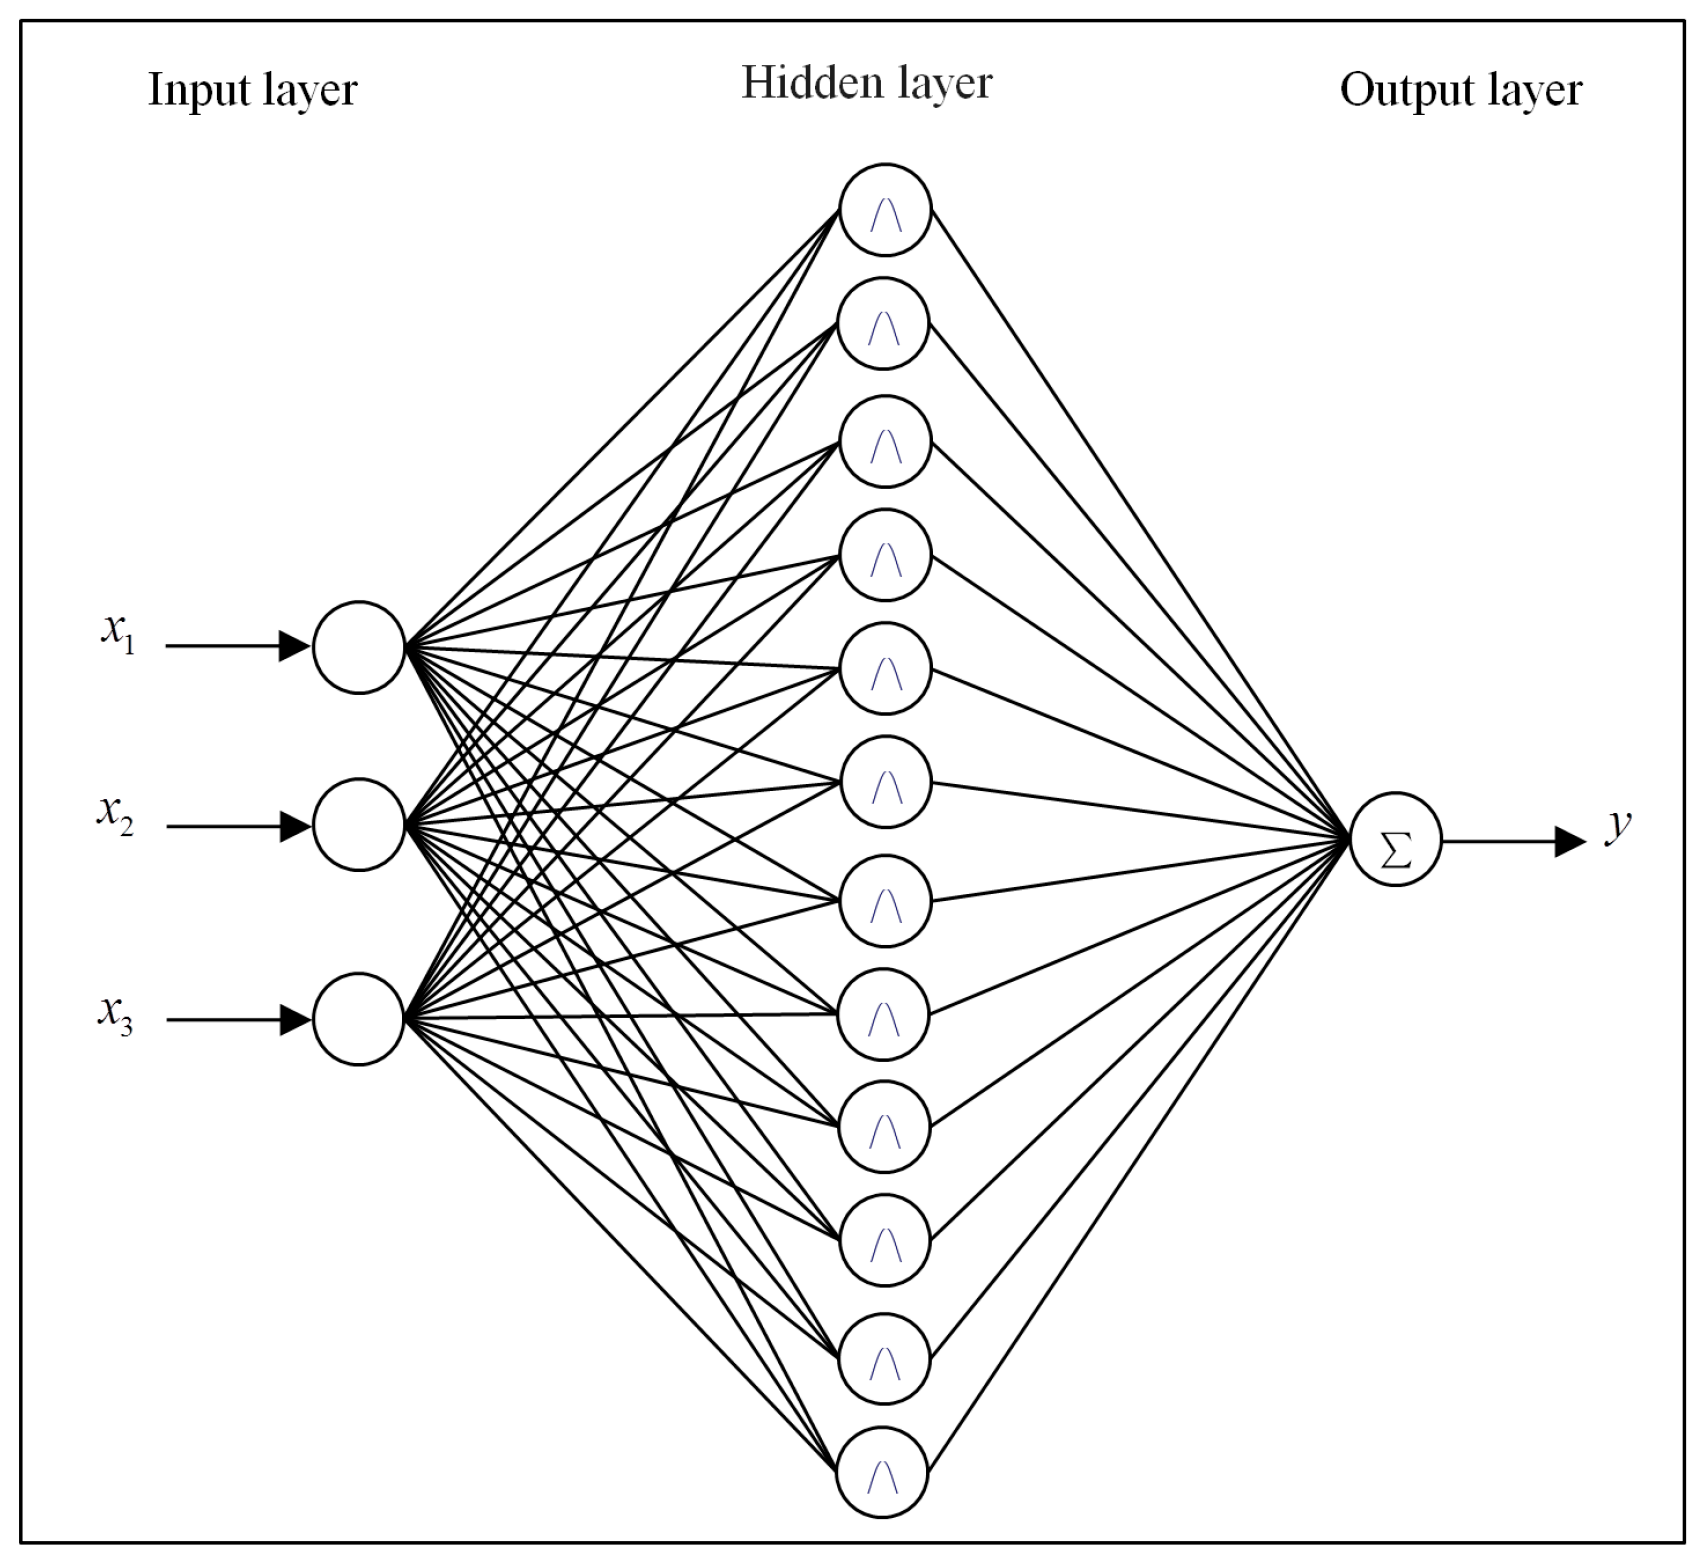
The ANN structure used in this research consisted of a simple three-layer feed-forward network, with a transfer function (sigmoid) in the hidden one layer with 12 neurons and a linear transfer function in the output layer (Figure 5). The two color variables and related Ch1 content were selected as input nodes to the ANN model while training the ANN network whose objective is to fit the data to a non-linear model. After training, a new output was created, which represents chlorophyll content in the corresponding RLI area in the predictions.
3. Results
3.1. Distribution of Relative Light Intensity
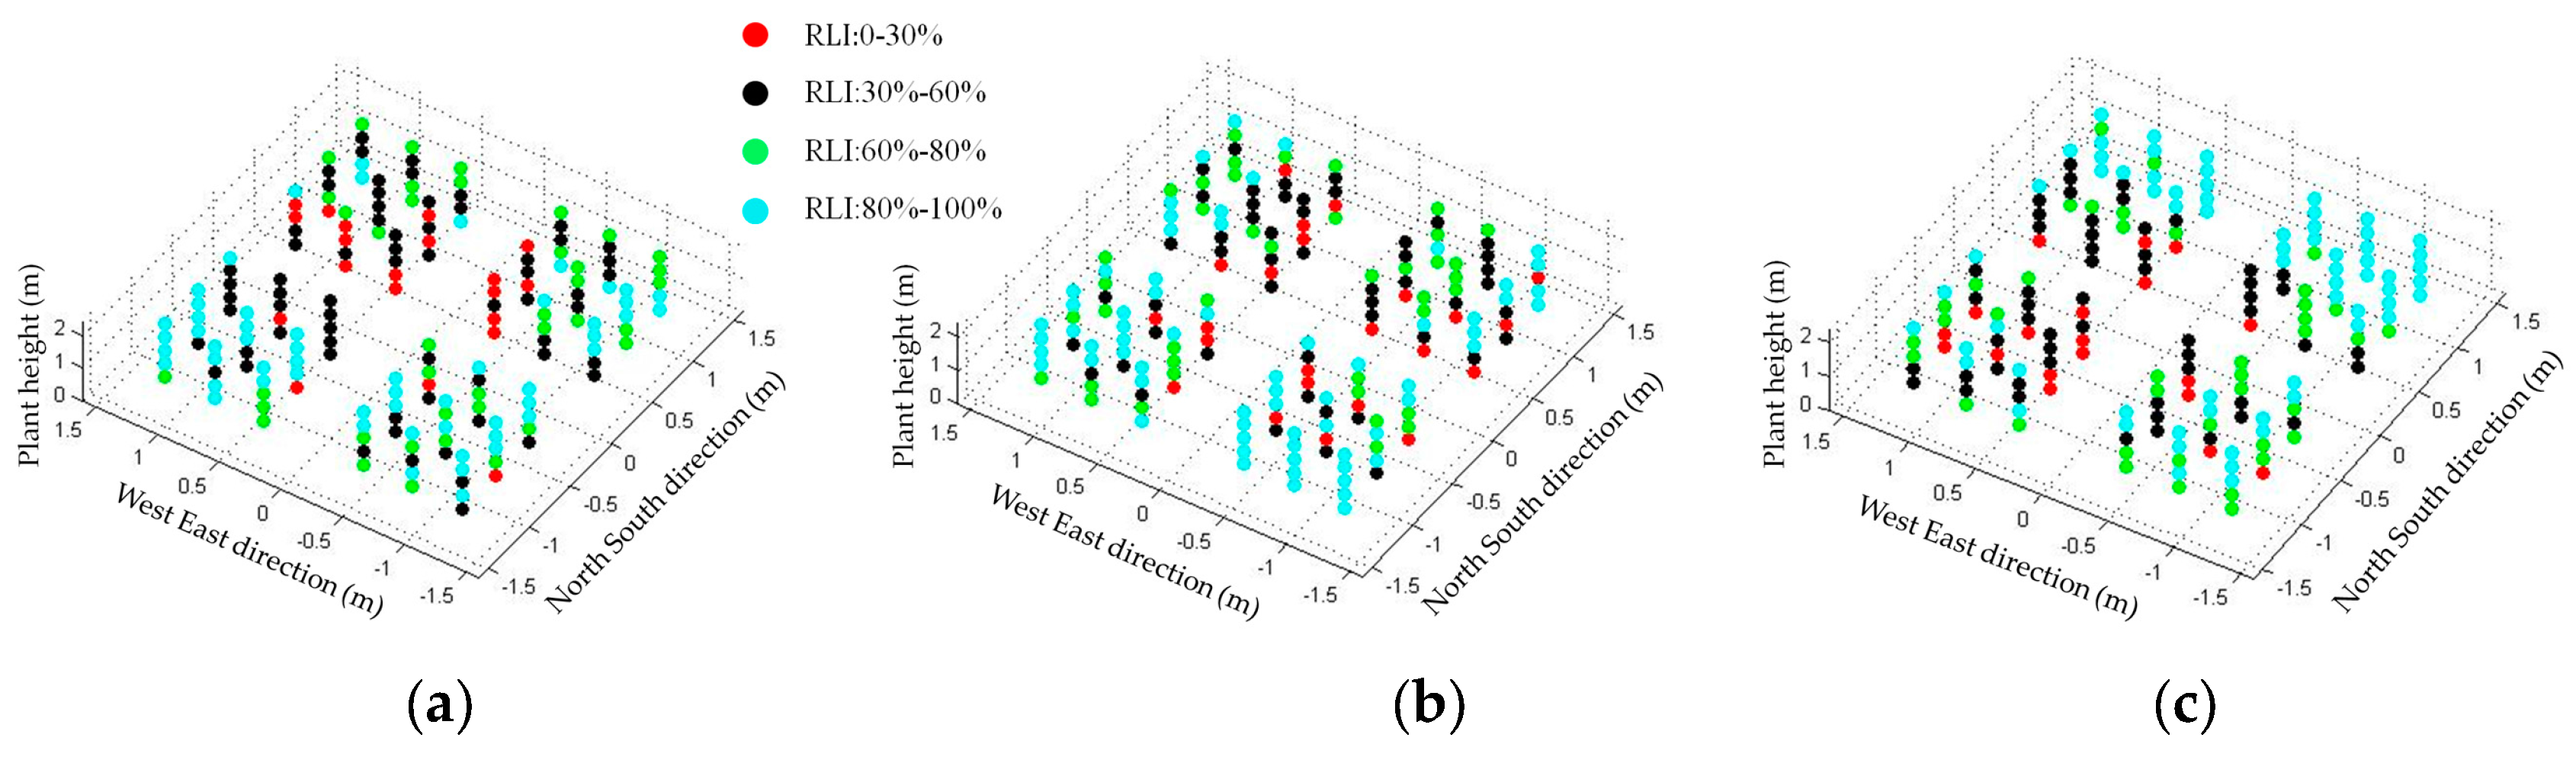
The first row including three trees of the six total apple trees tested (Figure 4b) was selected as the training sample, and the remaining trees were used for prediction of Ch1 content through the ANN technology mentioned in Section 2.6. One hundred and eighty areas in a tree canopy were described as small cubic units in three-dimensional spaces using the MATLAB math tool. Taking a trunk located in the middle of the 3D figure as the center, four regions of a canopy could be clearly observed. The RLIs of sample trees was calculated according to Equation (1) and classified into four types on the basis of the division principle of light intensity introduced in Section 2.1. The distribution is illustrated in Figure 6. Different RLI was represented by four different colors.
Although all selected specimens were free spindle-shaped apple trees, the real distribution of RLI could not be the same as that of ideal light distribution due to individual differences and pruning methods. However, the general relative light distribution was in accordance with ideal light distribution as described in Section 2.1, and could be classified into four types in light of RLI, which were 0–30%, 30–60%, 60–85%, and 85–100% RLI areas.
3.2. Distribution of Ch1 Content in Different RLI
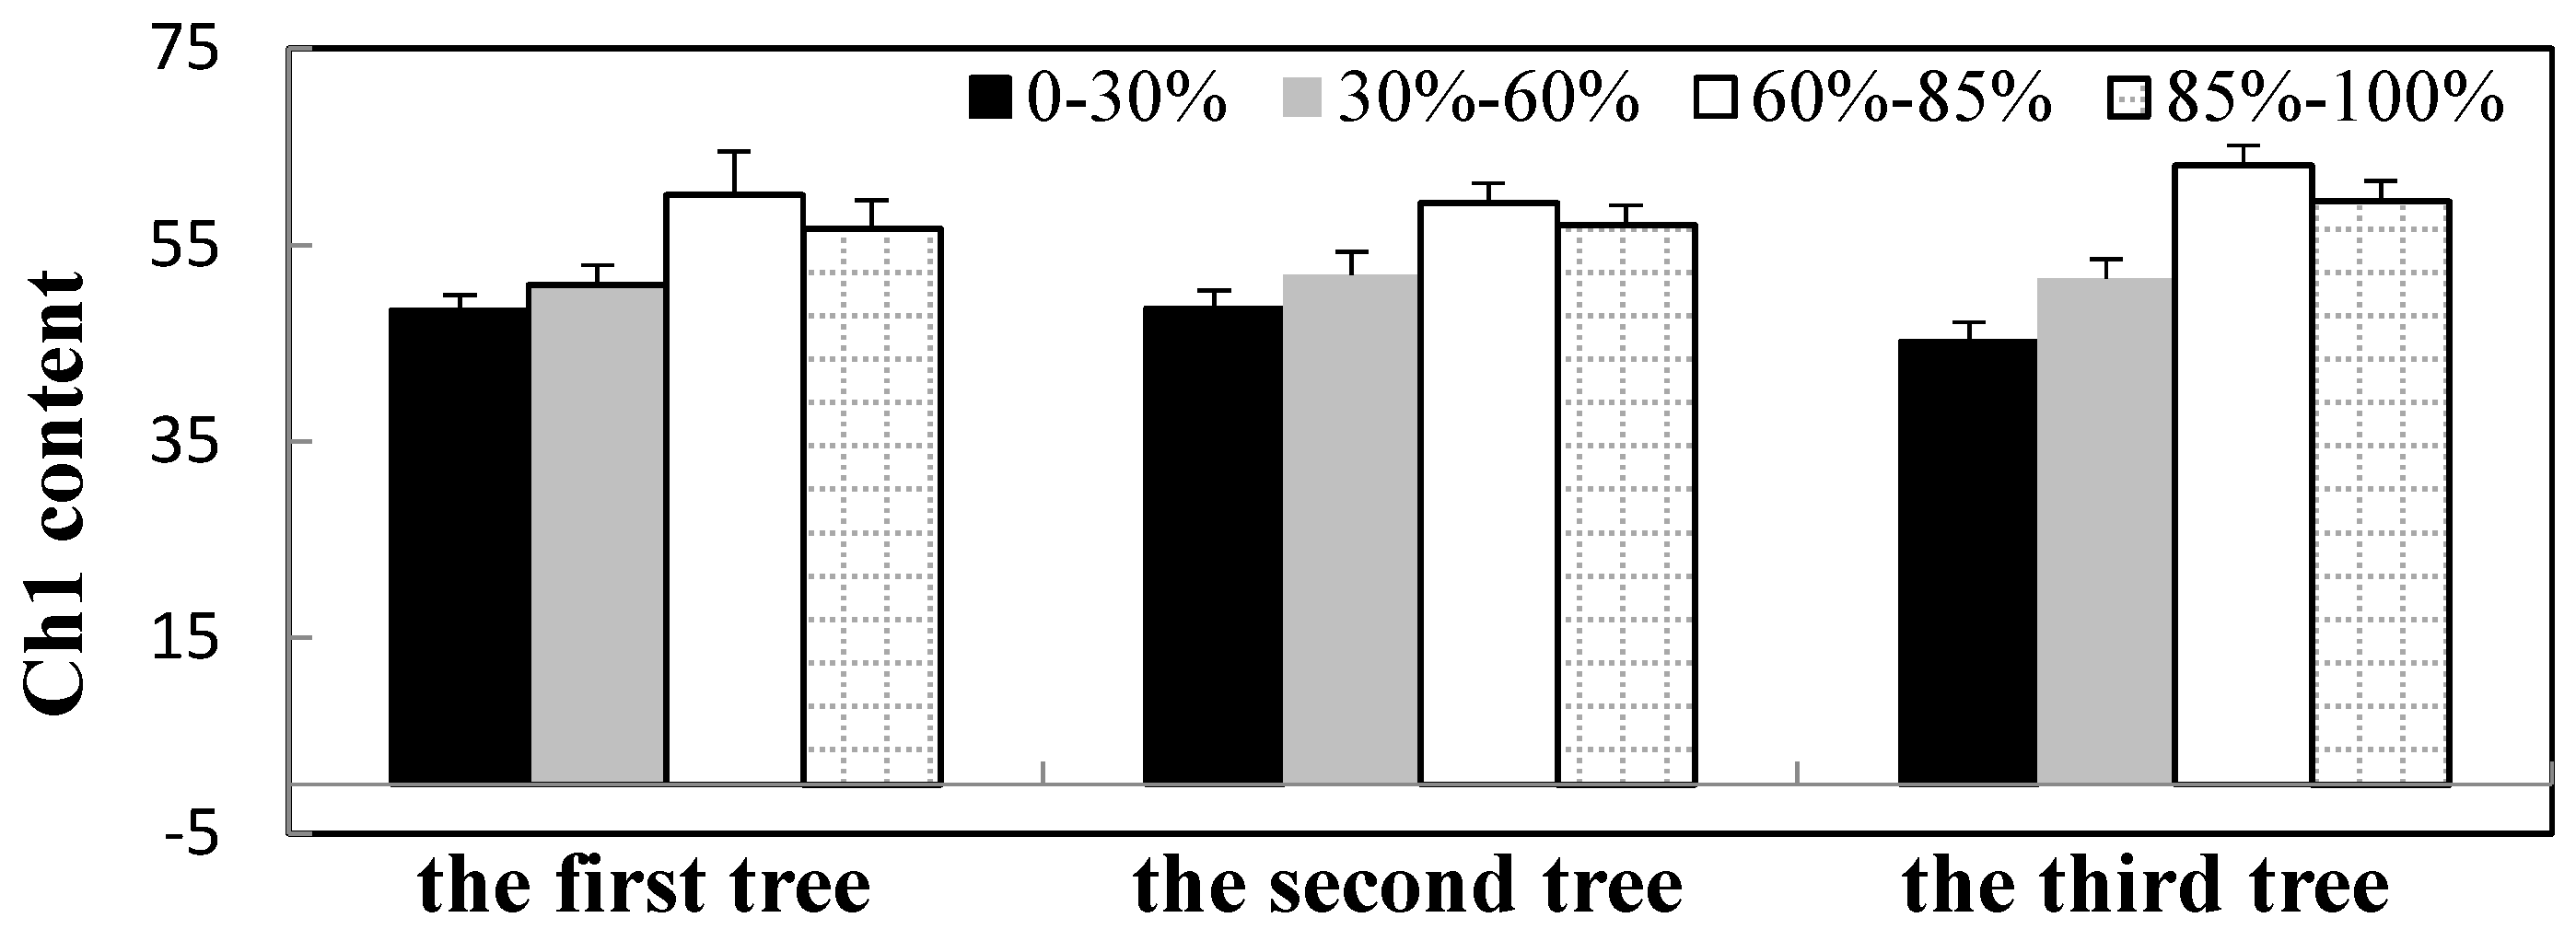
Mean Ch1 content in RLI between 60% and 85% was the highest compared with that of the other three RLI areas for three trees, and RLI over 85% had a higher Ch1 content than that of both the 30–60% and 0–30% RLI areas. However, Ch1 content did not significantly differ between the 0–30% and 30–60% RLI areas. In addition, Ch1 content in 60–85% light areas and over 85% areas were not significantly different from each other.
3.3. Color Distribution in Different RLI Areas
3.3.1. Canopy Division in 3D Space
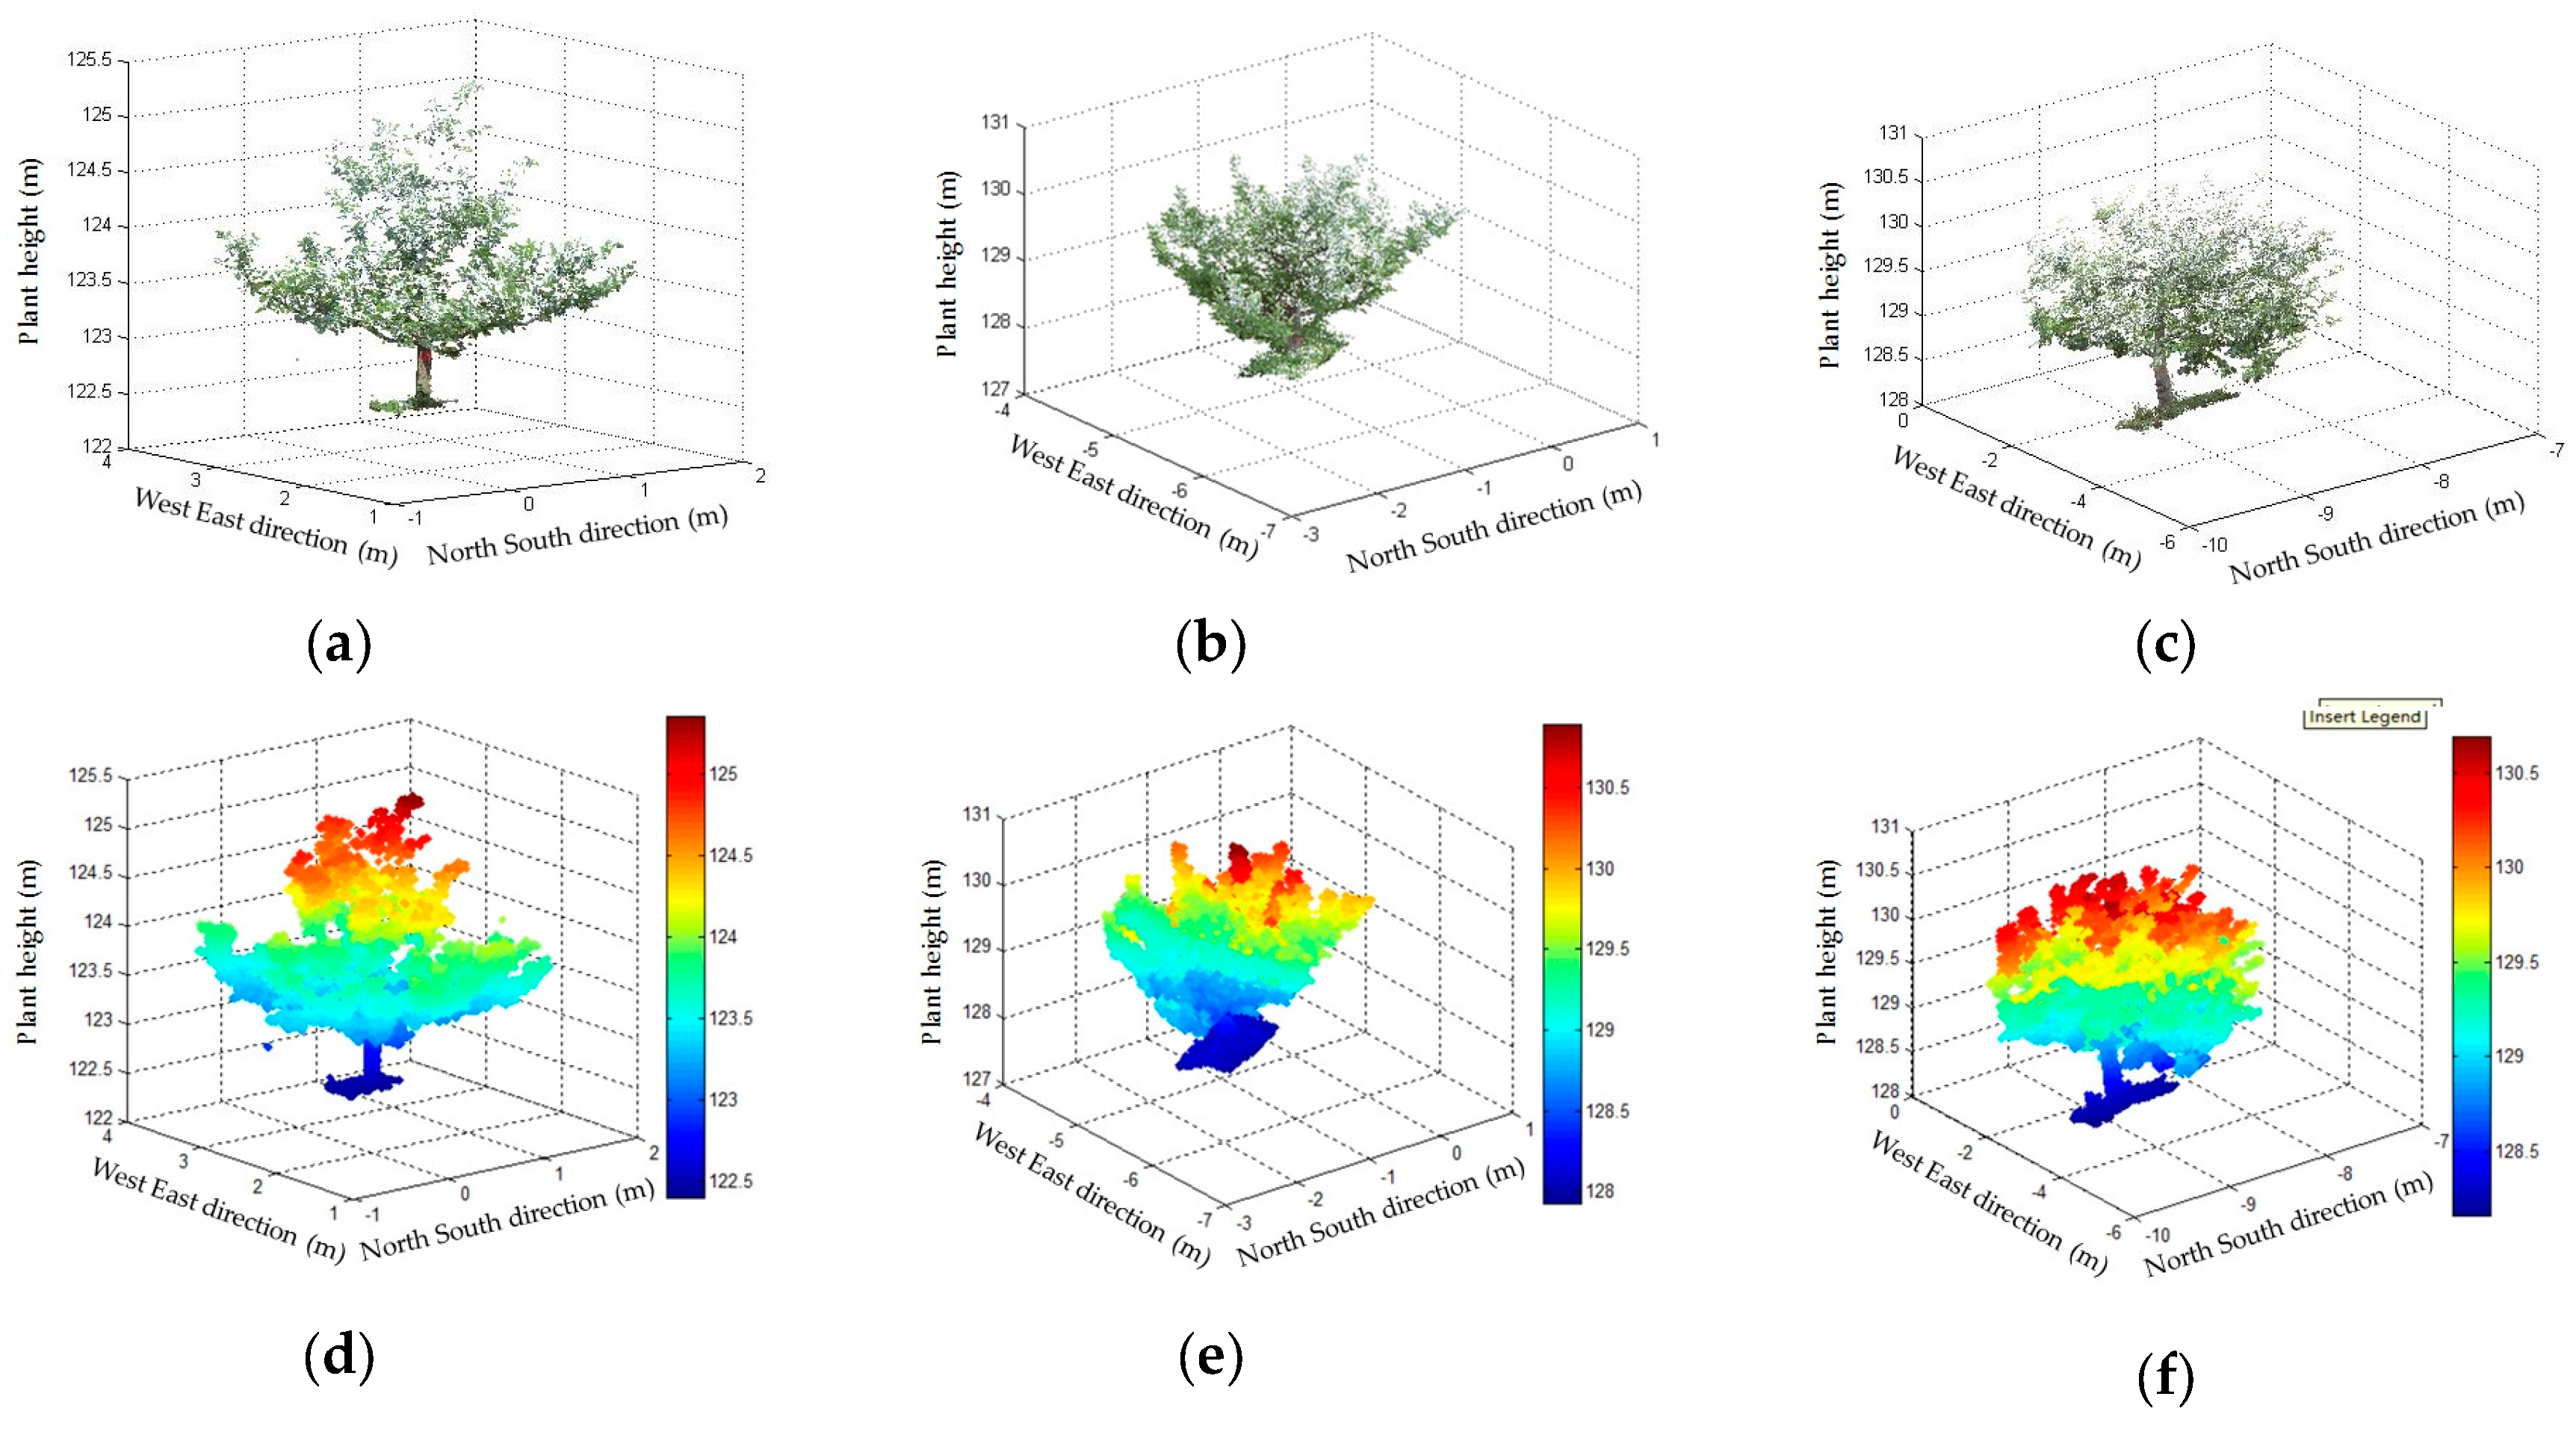
The methodology for this research focused on the use of the MATLAB tool to generate 3D model structures with color information about apple trees (Figure 7a), the data for which were scanned by a FARO Focus3D 120 laser scanner and output from scene software for canopy division in 3D space. To accomplish this, point clouds of the background were removed using the deletion function of the scene software, and three trees were also extracted. The separated trees in the first row of Figure 4b are shown from Figure 8a–c.
For the purpose of partitioning the canopy into 180 areas as mentioned in Section 2.1, it was essential to calculate canopy height and width information from the distance value of 3D points. Canopy height is defined as the shortest distance from the upper boundary of the main photosynthetic tissues (excluding inflorescences) on a plant to the bottom of the canopy [25], expressed in meters. In addition, canopy width is the maximum width of the crown along any axis from the drip-line on one side of the tree to the drip-line on the opposite side of the tree [26]. To obtain these values, the three single trees were expressed by distance value with gradient colors. Figure 7d–f display the distance effect.
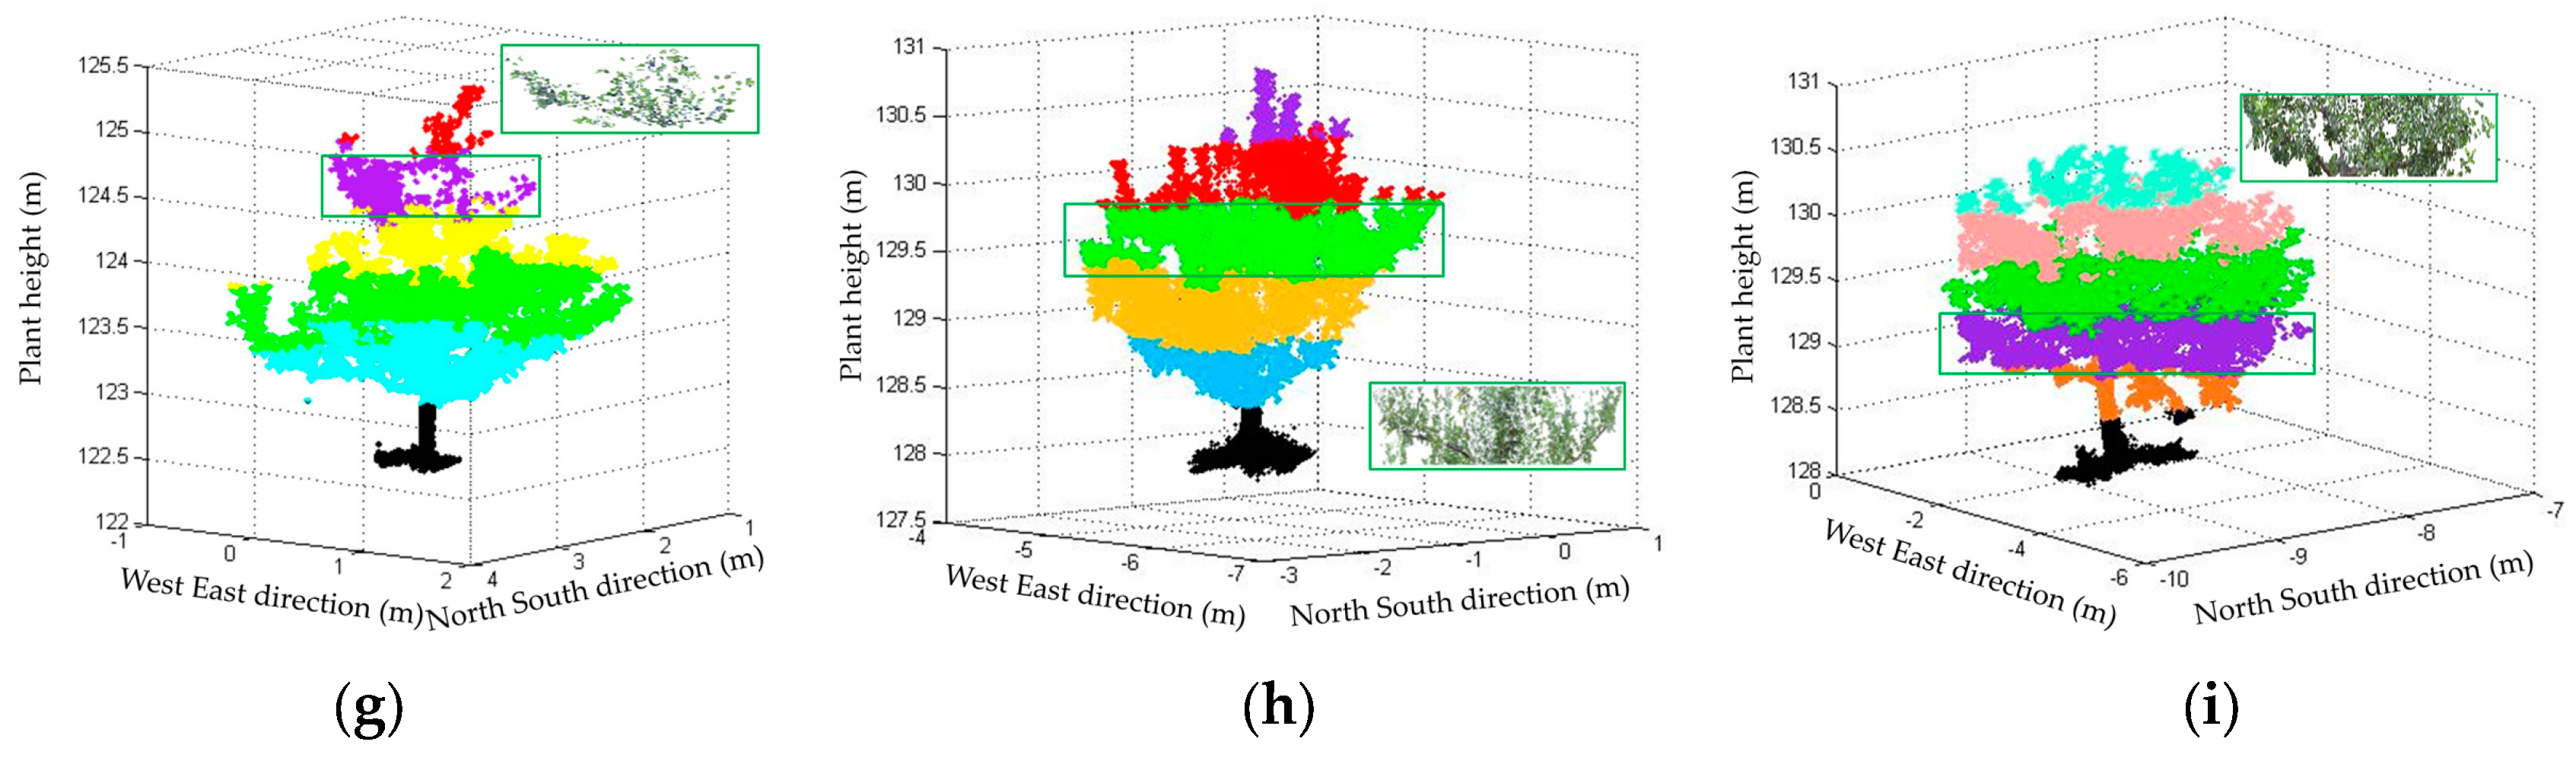
In light of the canopy height and width, the canopy of each apple tree was divided evenly into 180 3D spaces. Five different random colors were used for distinguishing five layers. Space information of each layer including length, width, and height as well as color information was recorded in a matrix for further division of the layer into six rows by six columns. So far, 180 3D spaces of a canopy were successfully divided according to distance values. Finally, the color information of each 3D space could be extracted from the pre-built matrix. An example is given to illustrate the color extraction result of a layer for each apple tree (Figure 8g–i).
3.3.2. Distribution of Color Information in Different RLI
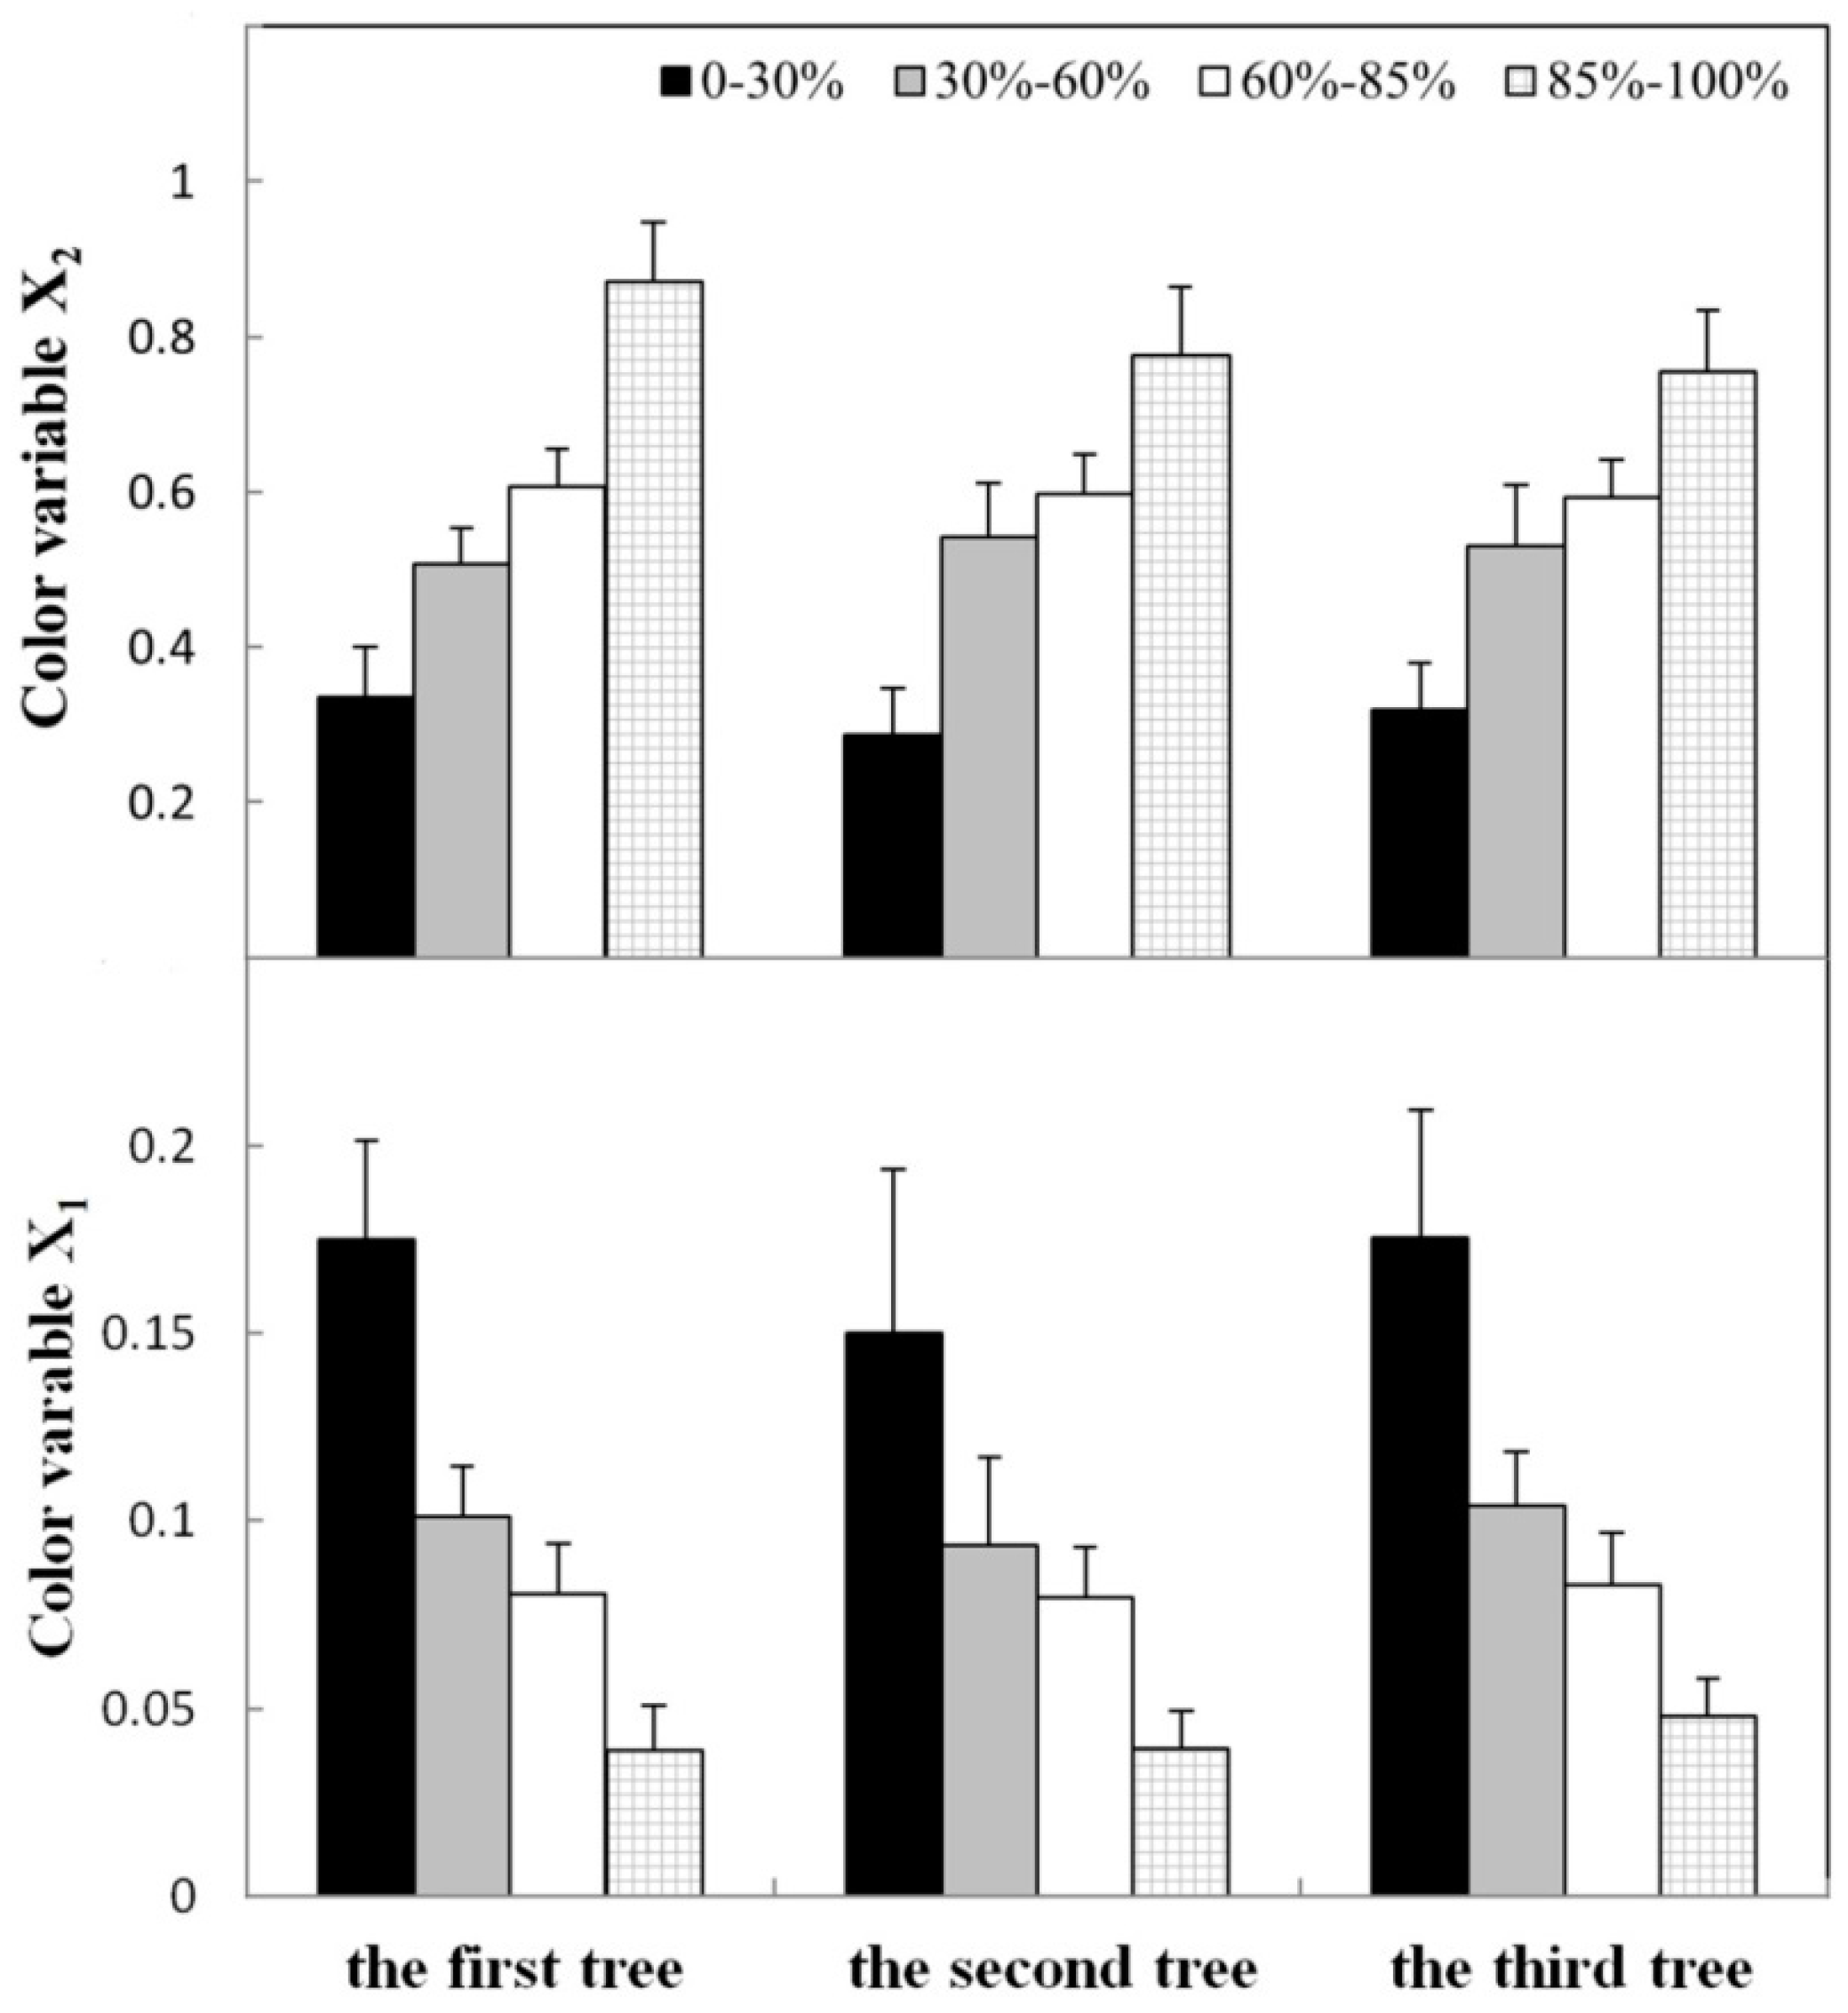
Color information was extracted from 180 cube units within each 3D apple tree canopy, and color variables were calculated according to Equations (1) and (2). The distribution of mean color variable X1 and mean color variable X2 for the four RLI areas is illustrated in Figure 9. Mean color variable X1 decreased as the RLI rose and showed regimes with differences between each other. Mean color variable X1 was the highest in the 0–30% RLI area and the lowest in the RLI area between 85% and 100%. However, mean color variable X1 between 30% and 60% did not significantly differ from that in RLI area between 60% and 85%. The opposite trend was observed in the distribution of mean color variable X2 for the four RLI areas. Mean color variable X2 increased as the RLI rose. Mean color variable X2 of RLI area between 80% and 100% was significantly higher than those in other RLI areas. Additionally, mean color variable X2 in 0–30% RLI was the lowest of all. Moreover, mean color variable X2 between 30% and 60% did not significantly differ from that in the 60–85% RLI area.
3.4. Prediction of Ch1 Content Based onANN
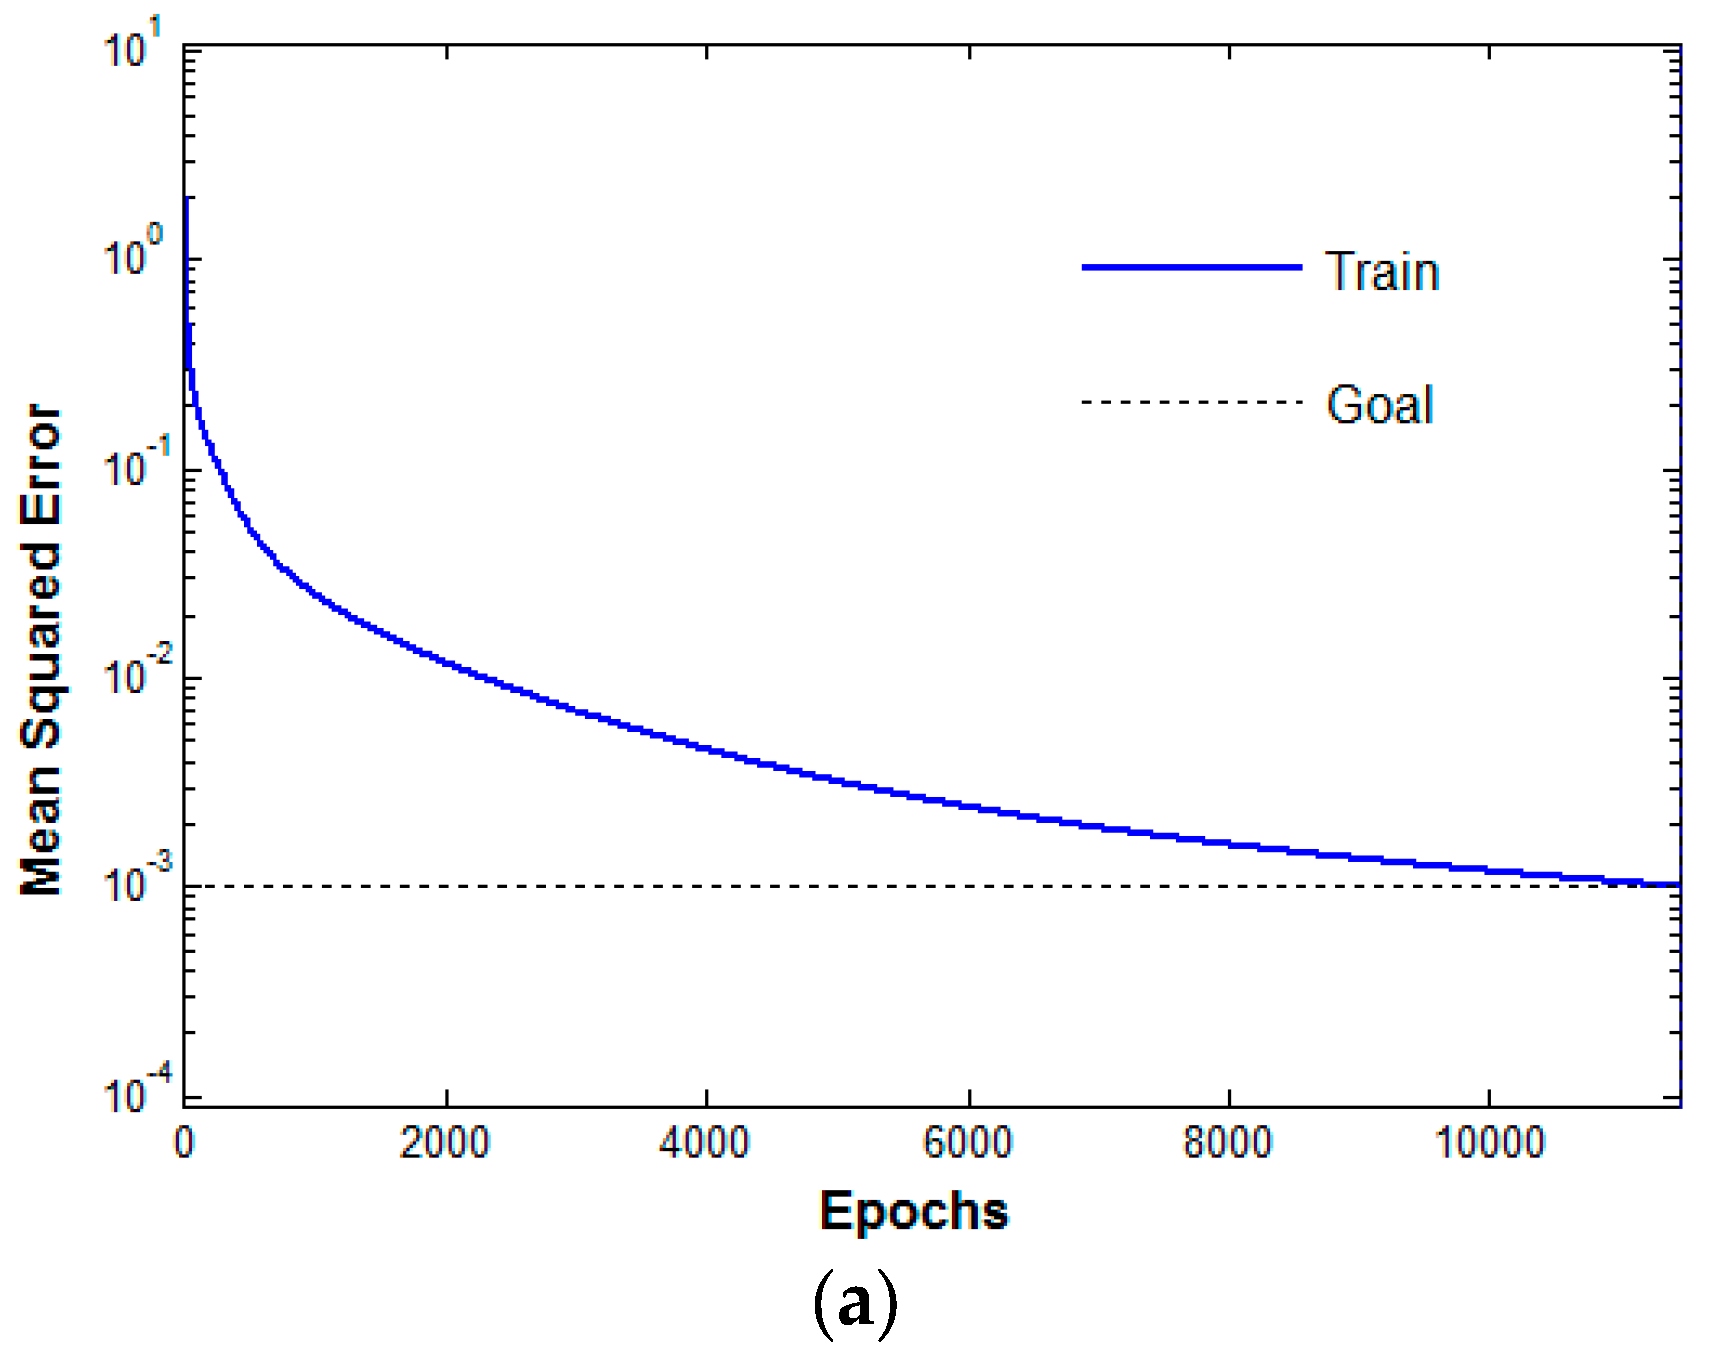
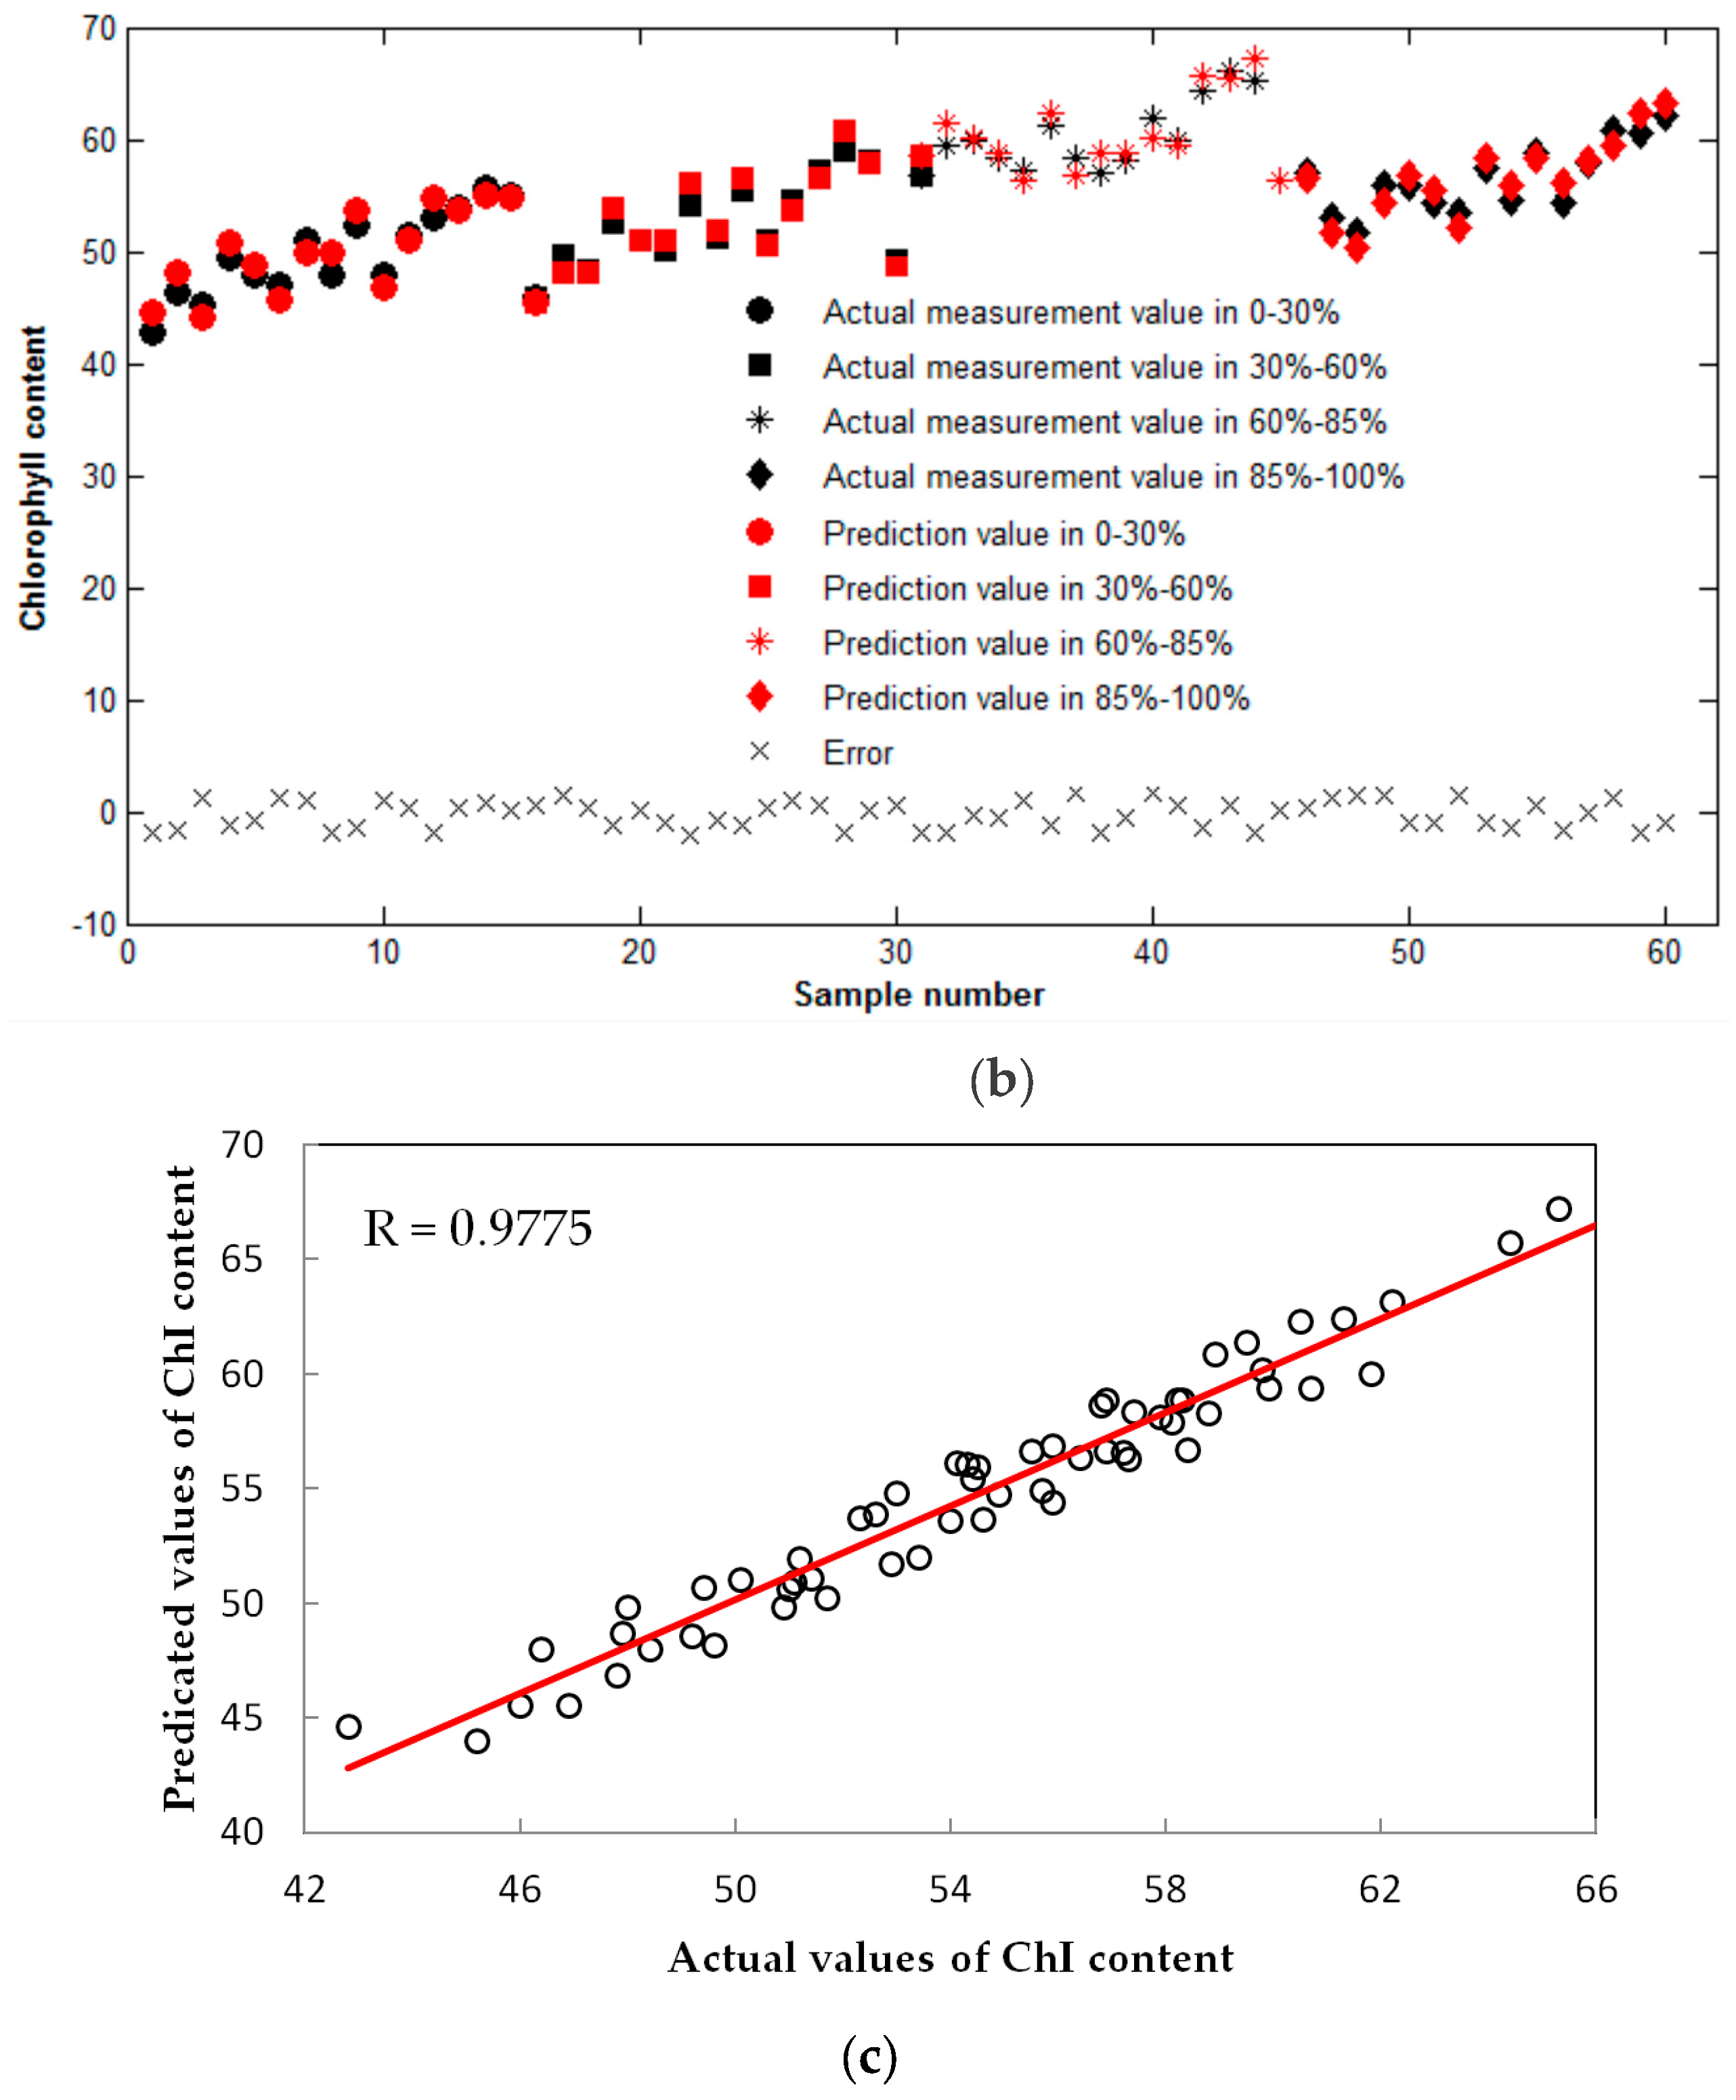
We could observe regular changes in Ch1 content and color variable values in different RLI areas of apple tree canopies from Section 3.2 and Section 3.3.2. Artificial neural networks were applied in this study to seek the relationship between Ch1 content and color characteristics and to further predict the Ch1 content of different areas of light intensity in apple trees using color information within the canopy. To find the relationship between color variables and Ch1 content, the proposed network architecture based on the concepts of artificial neural network (p, d, and q) design was trained with two color variables and Ch1 content data of three apple trees including 540 RLI areas using a constructive algorithm in MATLAB7 package software. ANN parameters were defined as follows: target accuracy was 0.0001, study speed was 0.8, and the maximum number of learning was 100,000. The training result of the ANN showed that the best training performance (Figure 10a) was 0.0001 at epoch 11,449 times, which met the requirements of the set parameters and further indicated the good ability of this network architecture for the purpose of predicting Ch1 content.
Good convergence effects (Figure 10a) proved the close relationship between Ch1 content and color information in different RLI areas. Thus, the next step was to predict Ch1 content through the ANN. To do this, five cubic units in each type of RLI area were selected randomly from each tree of the prediction sample. Additionally, according to the number of input nodes, two color variables X1 and X2, as well as corresponding RLI of 60 cubic units (5 cubic units × 4 RLI types × 3 trees) were input to the network for predicting Ch1 content. All linear best fits (R = 0.9755) between the predicted results and actual values measured with the SPAD leaf chlorophyll meter showed that the effective Ch1 content was accurately predicted by this ANN network through the error back-propagation that was trained by the Levenberg–Marquardt method [27]. However, some biases ranging from 0.2516 to 1.7772 are shown in Figure 10b, and the average error of prediction was 1.0702. In addition, the correlation between actual values and predicted values of Ch1 content was evaluated in this study. A significant correlation (p-value < 2.2 × 10⁻¹⁶) was found in Figure 10c with R = 0.9755, which was the same as that of the ANN analysis result. The statistical analysis of the correlation between actual and predicted Ch1 content further confirmed the effectiveness of approaches and the accuracy of the ANN model proposed in this study.
4. Discussion
4.1. Experimental Results Analysis
In this paper, the distribution of Ch1 content at different RLI was studied, and there was no significant difference in Ch1 content between adjacent RLI areas. The reason is that the distribution of Ch1 content—which was affected by light and nutrient elements—in a canopy is a continuous and gradient process. As a result, the Ch1 content in the light areas of 60–85% that was regarded as the best light area could achieve the highest Ch1 content value. In contrast, light areas between 0 and 30% were considered to be invalid areas, which could not get enough light and led to the least Ch1 content. However, obvious changes of Ch1 content were displayed between non-adjacent RLI areas.
Although there was no obvious distinction for Ch1 content at adjacent RLI areas, the difference could be observed for the two-color variables in the four types of RLI areas of three trees because the intensity of sunlight transmitted to the canopy region impacted the color brightness of the leaf surface [28]. We can see the RLI of 180 cubic units within each apple tree canopy from Figure 6. Most 0–30% RLI areas distributed in the canopy interior and bottom could not obtain enough light transmission, while areas with RLI between 85% and 100% located in the exterior and top of the canopy had advantages from being exposed to sufficient sunlight. In addition, it was possible to differentiate color variable values of 30–60% RLI area from that of 60–85% RLI area with a reduced significance of p > 0.05, no matter the mean color variable X1 or for the mean color variable X2.
4.2. Analysis of Experimental Parameters Selection and Configuration
In the present study, the laser-scanner used for 3D reconstruction produced 3D-point clouds of 645,000 to 850,000 points for each tree based on the complexity of the tree canopy. More point clouds were yielded for trees with bigger canopies and denser leaves. Objects with very thin structures could also be detected through this laser scanner, e.g., wires used for canopy division. More accurate models could be generated to reflect the actual apple tree structure with more cloud points, but it required longer time for computation. There were three levels of resolution of the laser scanner, including resolutions of 1/2, 1/4, and 1/5, among of which the last one could meet the requirements of 3D reconstruction for the purpose of predicting Ch1 content. It took about 5 minutes with a rate of 976,000 point clouds per second. About ten minutes could be saved per measurement station compared to using the highest resolution. In addition, to obtain the best possible 3D reconstruction quality with the laser scanner, the weather conditions must be optimal (in particular, low wind conditions). Although the results demonstrated that the phenotypic characteristics such as apple diameter, stem diameter, canopy height, and canopy diameter could be extracted from the 3D model of apple trees reconstructed by a terrestrial laser scanner (Trimble TX8, Danderyd, Sweden) even if the average wind speed was 4.5 m/s in the instant scanning [29], there were obvious changes in the leaves’ edge and thickness in the presence of wind speed ranging from 0.9 to 2.4 m/s. Therefore, weather conditions with no or low wind were the best environment to obtain optimal 3D reconstruction of trees.
4.3. Expansion Ability of Prediction Model
There were no exact mathematical formulae and comprehensive principles to establish the relationship between different light areas and Ch1 content. Most of researchers were focused on the whole tree canopy and did not aim at different light areas of canopy to estimate Ch1 content. Consequently, the result was not conducive to pruning and obtain the best canopy structure and in turn effect on apple quality as well as yield. To fill the above gap, a three-layer ANN with nonlinear mapping capability was selected as prediction model to estimate Ch1 content using color information obtained from 3D tree reconstruction. In this process, any function could be approximated with arbitrary precision.
In this study, two color variables based on RGB color space were used for two inputs of ANN-based prediction model. Although accurate results were achieved, the expanding ability of the ANN-based prediction model was limited by the number of spectral bands analyzed according to the three basic colors in RGB color space. Many spectral bands from spectrometers can be utilized to acquire more detailed multivariate analysis, potentially providing more comprehensive information [8,30]. However, among spectral bands, not all of them are useful for reflecting physiological indexes due to redundant information because only a few of them are of great benefit to the inversion of simple indices [10]. This conclusion was verified by the current practice of spectral sensing, where only two or a few spectral bands are useful for reflecting physiological indexes of plants. In contrast, leaves are partially transparent in the near-infrared (NIR) range, so NIR bands may contribute to the detection of plant biomass beyond the level of saturation. As a result, the combination of a NIR band and RGB bands is useful to study physiological indexes of plants more accurately than the single RGB-based approach. Physiological indexes of plants such as the normalized difference vegetation index(NDVI), green normalized difference vegetation index (GNDVI), and stomatal conductance could be estimated through the ANN-based prediction model proposed in the study, as long the variables were added with the combination of an NIR band and RGB bands as input nodes [31,32].
4.4. Future Work
In the research process, the results we achieved were based on a calm day without strong light intensity, which could reduce the impact on color information to a greater extent. This was a preliminary study on predicting the Ch1 content of different RLI areas of apple trees using color information based on 3D reconstruction, which needs to be extended to other weather conditions. Therefore, our future studies will involve model development using color information to evaluate Ch1 content in different RLI areas with various light intensities. It will be a great challenge to predict Ch1 content through color information in field conditions with strong light intensity—especially due to the changes in light intensity. However, these effects on color information can be compensated for by utilizing standard reference calibration panels during data acquisition by 3D laser scanner. Thus, experiments will be continued to predict Ch1 content in different RLI areas using color information calibrated by the method above based on 3D reconstruction, which will provide a rapid and reliable approach to calculating Ch1 content for the purpose of pruning to obtain a better light intensity area, which in turn improves apple production.
5. Conclusions
This experimental study showed that color information has the potential for rapid, non-destructive, and accurate estimation of Ch1 content in different RLI areas of free spindle-shaped apple tree canopies based on three-dimensional reconstructions. The main achievements of this paper are summarized as follows.
First, research samples were selected in an orchard. Actual canopy space was divided into 180 cubic units, and the same work was performed in 3D reconstruction models of apple trees. Then, RLI was calculated for the 180 cubic units of each tree canopy using light sensors in the actual canopy space and was classified into four types. The results showed that RLI distribution for training samples was in accordance with the actual light distribution of free spindle-shaped apple tree canopies.
Moreover, Ch1 content was measured by a SPAD leaf chlorophyll meter for 180 cubic units of each apple tree. The measurement results showed that the mean highest and mean lowest value of Ch1 content distributed in 60–85% and 0–30% of RLI areas, respectively, and that there was no significant difference between adjacent RLI areas. Additionally, color information was extracted from each cubic unit and was calculated by two color variables in RGB color space. The calculation results indicated that the mean color variable X1 decreased, and mean color variable X2 increased separately as the RLI rose.
Finally, color variables and corresponding RLIs were input into a three-layer ANN to predict the Ch1 content of different RLI areas. The results showed that the predicted Ch1 content was linearly correlated with that of actual measurements of different RLI areas with an R of 0.9755 and an average error of 1.0702. Overall, the results demonstrated the potential of using color information to predict Ch1 content for understanding the growth and future production of free spindle-shaped apple trees.
Acknowledgments
This study was funded jointly by Natural Science Foundation of HeiLongJiang Province (Funding code: QC2016031), National Natural Science Foundation of China (Funding code: 31601220, 31371532), China Postdoctoral Science Foundation (Funding code: 2016M601464; 2016M591559), Program of Heilongjiang Farms & Land Reclamation Administration (Funding code: HNK125A-08-03), Program for Young Scholars with Creative Talents in HeiLongJiang BaYi Agricultural University (Funding code:CXRC2016-14).
Author Contributions
X.M. and G.L. conceived and designed the experiments; X.M. performed the experiments and acquired the 3D data of apple trees; J.F. and H.G. analyzed and process the data; X.M. and H.G. wrote the paper.
Conflicts of Interest
The authors declare no conflict of interest.
References
- Ustin, S.L.; Gitelson, A.A.; Jacquemoud, S.; Schaepman, M.; Asner, G.P.; Gamon, J.A.; Zarco-Tejada, P. Retrieval of foliar information about plant pigment systems from high resolution spectroscopy. Remote Sens. Environ. 2009, 113, S67–S77. [Google Scholar] [CrossRef] [Green Version]
- Jay, S.; Gorretta, N.; Morel, J.; Maupas, F.; Bendoula, R.; Rabatel, G.; Dutartre, D.; Comar, A.; Baret, F. Estimating leaf chlorophyll content in sugar beet canopies using millimeter-to centimeter-scale reflectance imagery. Remote Sens. Environ. 2017, 198, 173–186. [Google Scholar] [CrossRef]
- Steele, M.R.; Gitelson, A.A.; Rundquist, D.C. A comparison of two techniques for nondestructive measurement of chlorophyll content in grapevine leaves. Agron. J. 2008, 100, 779–782. [Google Scholar] [CrossRef]
- Filella, I.; Serrano, L.; Serra, J.; Penuelas, J. Evaluating wheat nitrogen status with canopy reflectance indices and discriminant analysis. Crop Sci. 1995, 35, 1400–1405. [Google Scholar] [CrossRef]
- Pan, B.; Liang, S. Estimation of chlorophyll content in apple tree canopy based on hyperspectral parameters. Spectrosc. Spectr. Anal. 2013, 33, 2203–2206. [Google Scholar]
- Szafrańska, K.; Reiter, R.J.; Posmyk, M.M. Melatonin improves the photosynthetic apparatus in pea leaves stressed by paraquat via chlorophyll breakdown regulation and its accelerated de novo synthesis. Front. Plant Sci. 2017, 8, 878. [Google Scholar] [CrossRef] [PubMed]
- Butcher, J.D.; Laubscher, C.P.; Coetzee, J.C. A Study of Oxygenation Techniques and the Chlorophyll Responses of Pelargonium tomentosum Grown in Deep Water Culture Hydroponics. HortScience 2017, 52, 952–957. [Google Scholar] [CrossRef]
- Croft, H.; Chen, J.M.; Zhang, Y.; Simic, A.; Noland, T.L.; Nesbitt, N.; Arabian, J. Evaluating leaf chlorophyll content prediction from multispectral remote sensing data within a physically-based modelling framework. ISPRS J. Photogramm. Remote Sens. 2015, 102, 85–95. [Google Scholar] [CrossRef]
- Yadav, S.P.; Ibaraki, Y.; Gupta, S.D. Estimation of the chlorophyll content of micropropagated potato plants using RGB based image analysis. Plant Cell Tissue Organ Cult. (PCTOC) 2010, 100, 183–188. [Google Scholar] [CrossRef]
- Baresel, J.P.; Rischbeck, P.; Hu, Y.; Kipp, S.; Barmeier, G.; Mistele, B.; Schmidhalter, U. Use of a digital camera as alternative method for non-destructive detection of the leaf chlorophyll content and the nitrogen nutrition status in wheat. Comput. Electron. Agric. 2017, 140, 25–33. [Google Scholar] [CrossRef]
- Bendig, J.; Yu, K.; Aasen, H.; Bolten, A.; Bennertz, S.; Broscheit, J.; Gnyp, M.L.; Bareth, G. Combining UAV-based plant height from crop surface models, visible, and near infrared vegetation indices for biomass monitoring in barley. Int. J. Appl. Earth Obs. Geoinform. 2015, 39, 79–87. [Google Scholar] [CrossRef]
- Hunt, E.R., Jr.; Doraiswamy, P.C.; McMurtrey, J.E.; Daughtry, C.S.; Perry, E.M.; Akhmedov, B. A visible band index for remote sensing leaf chlorophyll content at the canopy scale. Int. J. Appl. Earth Obs. Geoinform. 2013, 21, 103–112. [Google Scholar] [CrossRef]
- Sass, L.; Majer, P.; Hideg, E. Leaf hue measurements: A high-throughput screening of chlorophyll content. Methods Mol. Biol. 2012, 918, 61–69. [Google Scholar] [PubMed]
- Padmaja, V.; Dey, M.A.K. Evaluation of leaf chlorophyll content by a non-invasive approach. Evaluation 2015, 3, 7–10. [Google Scholar]
- Berk, P.; Hocevar, M.; belsak, A. Development of alternative plant protection product application techniques in orchards, based on measurement sensing systems: A review. Comput. Electron. Agric. 2016, 124, 273–288. [Google Scholar] [CrossRef]
- Colaço, A.F.; Trevisan, R.G.; Molin, J.P.; Rosell-Polo, J.R. A method to obtain orange crop geometry information using a mobile terrestrial laser scanner and 3D modeling. Remote Sens. 2017, 9, 763. [Google Scholar] [CrossRef]
- Underwood, J.P.; Hung, C.; Whelan, B.; Sukkarieh, S. Mapping almond orchard canopy volume, flowers, fruit and yield using lidar and vision sensors. Comput. Electron. Agric. 2016, 130, 83–96. [Google Scholar] [CrossRef]
- Ma, X.; Guo, C.; Zhang, X.; Liu, G.; Liu, G.J.; Zong, Z. Calculation of Chlorophyll Fluorescence Characters in Different Light Area to Apple Tree Canopy. Spectrosc. Spectr. Anal. 2016, 36, 3986–3990. [Google Scholar]
- Osada, N.; Hiura, T. How is light interception efficiency related to shoot structure in tall canopy species? Oecologia 2017, 185, 29–41. [Google Scholar] [CrossRef] [PubMed]
- Kawashima, S.; Nakatani, M. An algorithm for estimating chlorophyll content in leaves using a video camera. Ann. Bot. 1998, 81, 49–54. [Google Scholar] [CrossRef]
- Ali, M.M.; Al-Ani, A.; Eamus, D.; Tan, D.K. A new image processing based technique to determine chlorophyll in plants. Am.-Eurasian J. Agric. Environ. Sci. 2012, 12, 1323–1328. [Google Scholar]
- Holmstrom, L.; Koistinen, P. Using additive noise in back-propagation training. IEEE Trans. Neural Netw. 1992, 3, 24–38. [Google Scholar] [CrossRef] [PubMed]
- Bezdek, J.C. A review of probabilistic, fuzzy, and neural models for pattern recognition. J. Intell. Fuzzy Syst. 1993, 1, 1–25. [Google Scholar] [CrossRef]
- Ahn, J.; Cho, S.; Chung, D.H. Analysis of energy and control efficiencies of fuzzy logic and artificial neural network technologies in the heating energy supply system responding to the changes of user demands. Appl. Energy 2017, 190, 222–231. [Google Scholar] [CrossRef]
- Perez-Harguindeguy, N.; Diaz, S.; Garnier, E.; Lavorel, S.; Poorter, H.; Jaureguiberry, P.; Bret-Harte, M.S.; Cornwell, W.K.; Craine, J.M.; Gurvich, D.E.; et al. New handbook for standardised measurement of plant functional traits worldwide. Aust. J. Bot. 2013, 61, 167–234. [Google Scholar] [CrossRef]
- Solanelles, F.; Planas, S.; Rosell, J.R.; Camp, F.; Gràcia, F. An electronic control system for pesticide application proportional to the canopy width of tree crops. Biosyst. Eng. 2006, 95, 473–481. [Google Scholar] [CrossRef]
- Baruch, I.S.; Quintana, V.A.; Reynaud, E.P. Complex-valued neural network topology and learning applied for identification and control of nonlinear systems. Neurocomputing 2017, 233, 104–115. [Google Scholar] [CrossRef]
- Lijie, Y.; Desheng, L.; Nanping, D. Research on lighting intensity optimum in vision inspection system. Comput. Eng. Appl. 2012, 17, 178–182. [Google Scholar]
- Guo, C.; Zong, Z.; Zhang, X.; Liu, G. Apple tree canopy geometric parameters acquirement based on 3D point clouds. Trans. Chin. Soc. Agric. Eng. 2017, 33, 175–181. [Google Scholar]
- Li, F.; Mistele, B.; Hu, Y.; Chen, X.; Schmidhalter, U. Reflectance estimation of canopy nitrogen content in winter wheat using optimised hyperspectral spectral indices and partial least squares regression. Eur. J. Agron. 2014, 52, 198–209. [Google Scholar] [CrossRef]
- Sankaran, S.; Mishra, A.; Maja, J.M.; Ehsani, R. Visible-near infrared spectroscopy for detection of Huanglongbing in citrus orchards. Comput. Electron. Agric. 2011, 77, 127–134. [Google Scholar] [CrossRef]
- Espinoza, C.Z.; Khot, L.R.; Sankaran, S.; Jacoby, P.W. High Resolution Multispectral and Thermal Remote Sensing-Based Water Stress Assessment in Subsurface Irrigated Grapevines. Remote Sens. 2017, 9, 961. [Google Scholar] [CrossRef]
Figure 1.
Preprocessing Framework. ANN: artificial neural network; Ch1: chlorophyll; RLI: relative light intensity.
Figure 1.
Preprocessing Framework. ANN: artificial neural network; Ch1: chlorophyll; RLI: relative light intensity.

Figure 2.
RLI in an ideal free spindle-shaped apple tree.

Figure 3.
Canopy division of an apple tree canopy and light intensity measurement. (a) Canopy division; (b) Light intensity measurement.
Figure 3.
Canopy division of an apple tree canopy and light intensity measurement. (a) Canopy division; (b) Light intensity measurement.

Figure 4.
Laser scanner used in the apple orchard and acquired 3D data of apple trees. (a) Laser scanner used in the apple orchard; (b) 3D data of apple trees.
Figure 4.
Laser scanner used in the apple orchard and acquired 3D data of apple trees. (a) Laser scanner used in the apple orchard; (b) 3D data of apple trees.

Figure 5.
Neural network model.

Figure 6.
Distribution of RLI within canopies. (a) The first tree; (b) The second tree; (c) The third tree.
Figure 6.
Distribution of RLI within canopies. (a) The first tree; (b) The second tree; (c) The third tree.

Figure 7.
Distribution of Ch1 content in different RLI areas.

Figure 8.
Color extraction based on 3D canopy division. (a) The first 3D tree; (b) The second 3D tree; (c) The third 3D tree; (d) Distance of the first 3D tree; (e) Distance of the second 3D tree; (f) Distance of the third 3D tree;(g) Color extraction of the first tree; (h) Color extraction of the second tree; (i) Color extraction of the third tree.


Figure 9.
Color distribution in different RLI areas.

Figure 10.
Convergence effect and prediction ability of the ANN. (a) Network convergence; (b) Prediction result; (c) Correlation between actual values and predicted values of Ch1 content.
Figure 10.
Convergence effect and prediction ability of the ANN. (a) Network convergence; (b) Prediction result; (c) Correlation between actual values and predicted values of Ch1 content.


© 2018 by the authors. Licensee MDPI, Basel, Switzerland. This article is an open access article distributed under the terms and conditions of the Creative Commons Attribution (CC BY) license (http://creativecommons.org/licenses/by/4.0/).
Share and Cite
MDPI and ACS Style
Ma, X.; Feng, J.; Guan, H.; Liu, G. Prediction of Chlorophyll Content in Different Light Areas of Apple Tree Canopies based on the Color Characteristics of 3D Reconstruction. Remote Sens. 2018, 10, 429. https://doi.org/10.3390/rs10030429
AMA Style
Ma X, Feng J, Guan H, Liu G. Prediction of Chlorophyll Content in Different Light Areas of Apple Tree Canopies based on the Color Characteristics of 3D Reconstruction. Remote Sensing. 2018; 10(3):429. https://doi.org/10.3390/rs10030429
Chicago/Turabian StyleMa, Xiaodan, Jiarui Feng, Haiou Guan, and Gang Liu. 2018. "Prediction of Chlorophyll Content in Different Light Areas of Apple Tree Canopies based on the Color Characteristics of 3D Reconstruction" Remote Sensing 10, no. 3: 429. https://doi.org/10.3390/rs10030429
Note that from the first issue of 2016, this journal uses article numbers instead of page numbers. See further details here.