Urban Heat Island Analysis over the Land Use Zoning Plan of Bangkok by Means of Landsat 8 Imagery


Abstract
:
1. Introduction
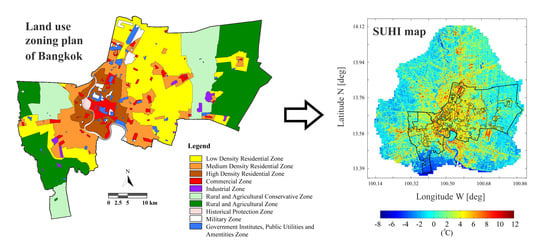
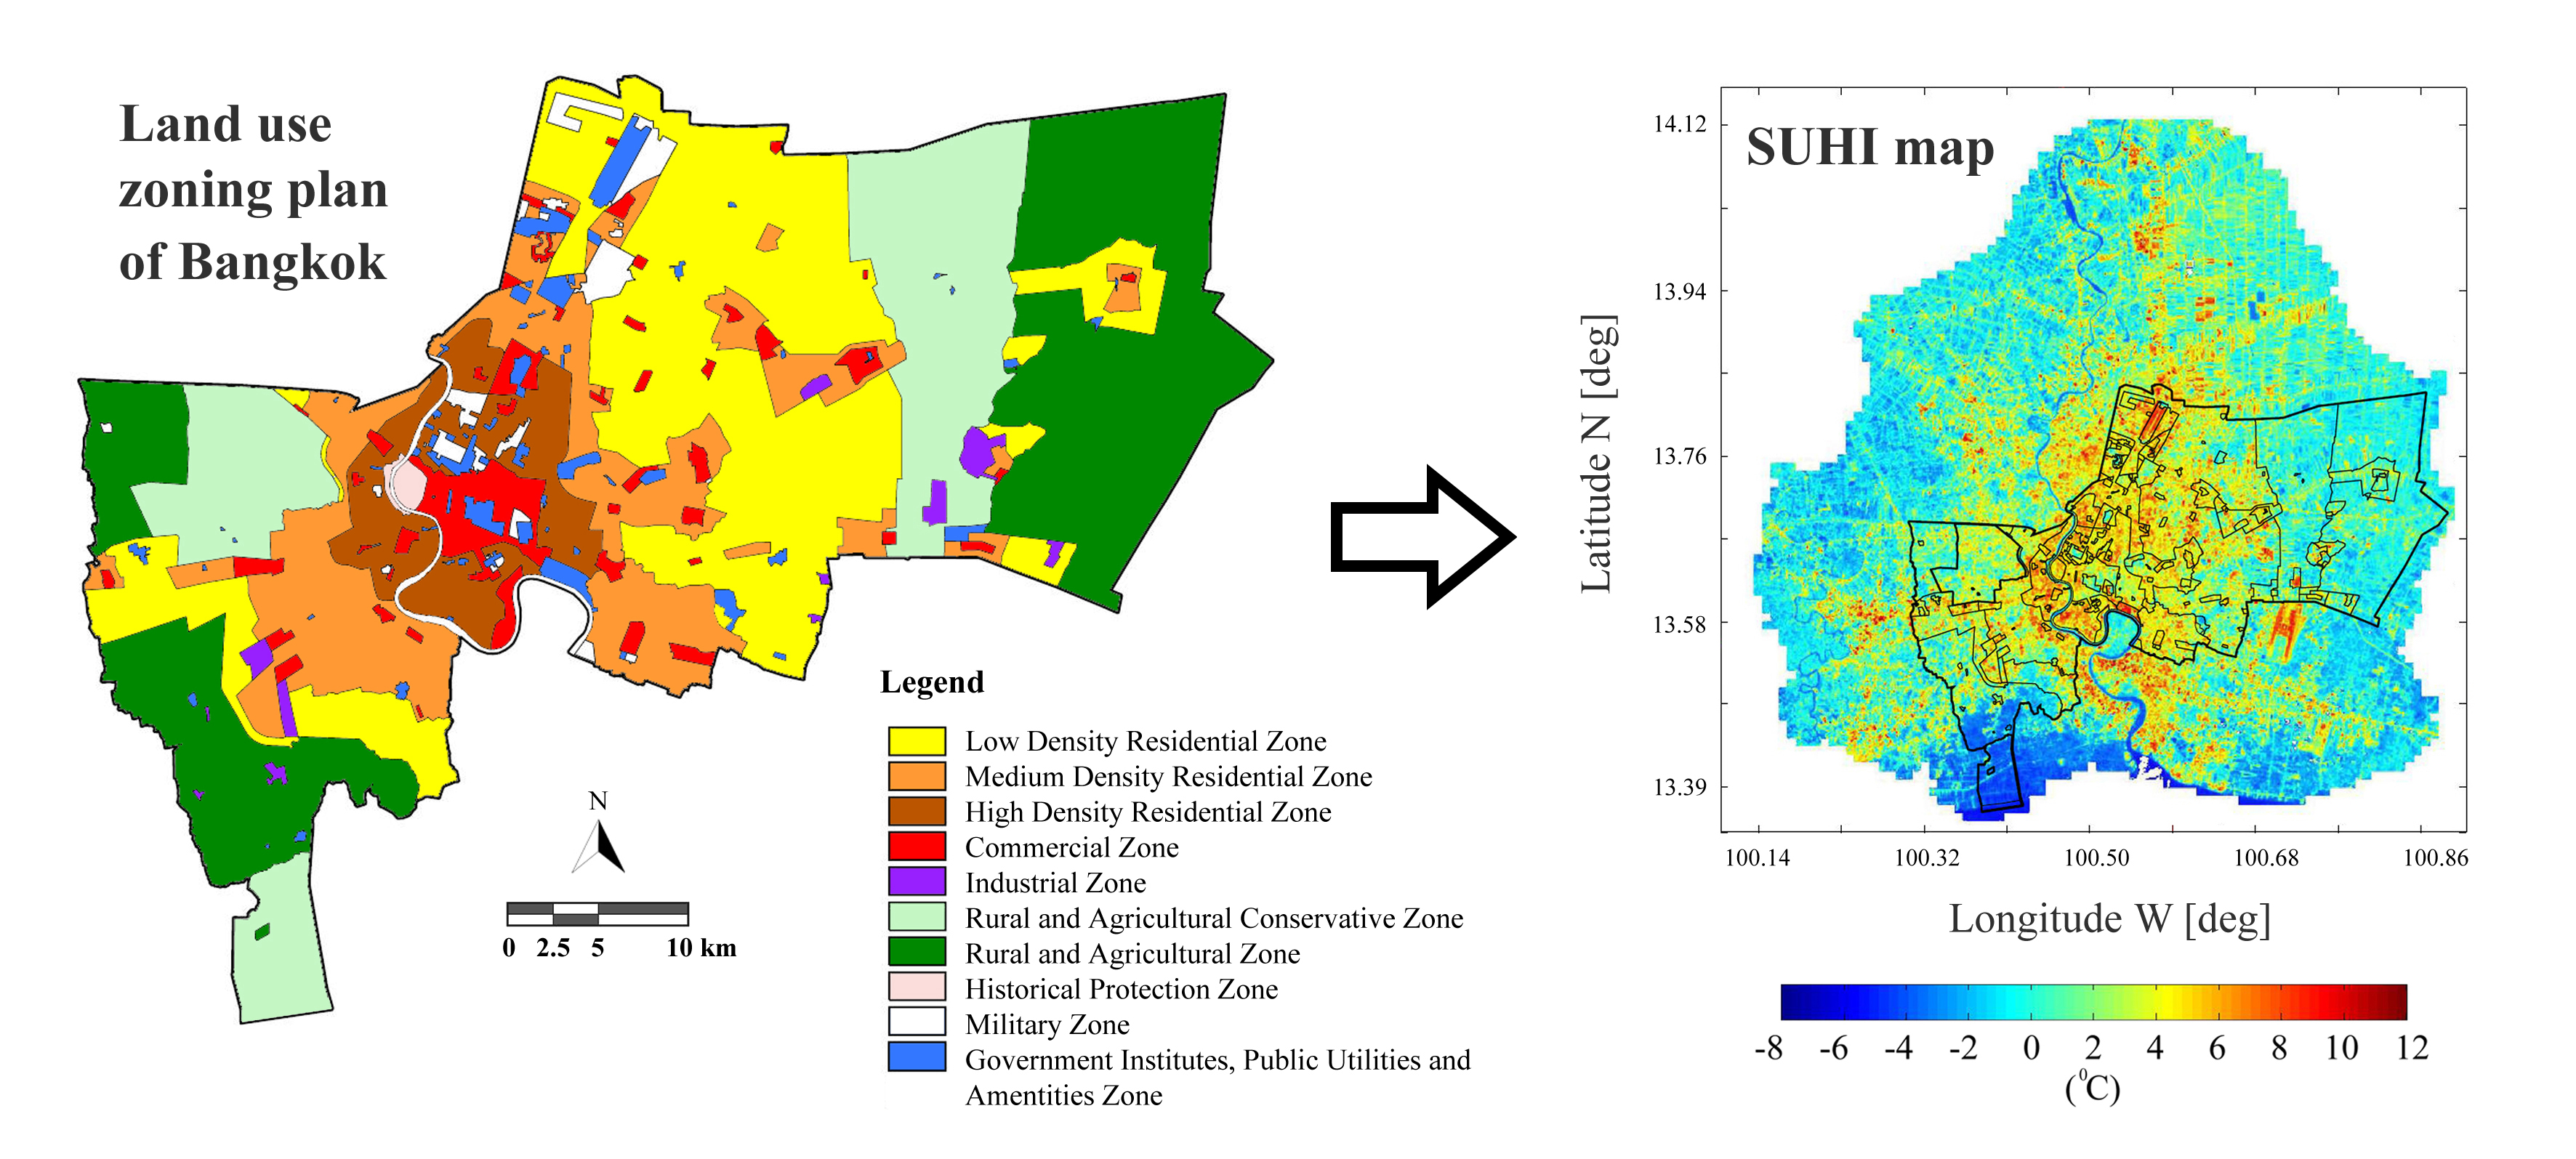
2. Study Area
3. Data Sets and Methods
3.1. Landsat 8 Data
- : At-sensor radiance at the top-of-atmosphere;
- ελ: Surface emissivity;
- Bλ(Ts): Planck’s law where Ts is the LST;
- : Downwelling atmospheric radiance;
- τλ: Total atmospheric transmissivity of the atmosphere;
- : Upwelling atmospheric radiance.
3.2. SUHI Computation
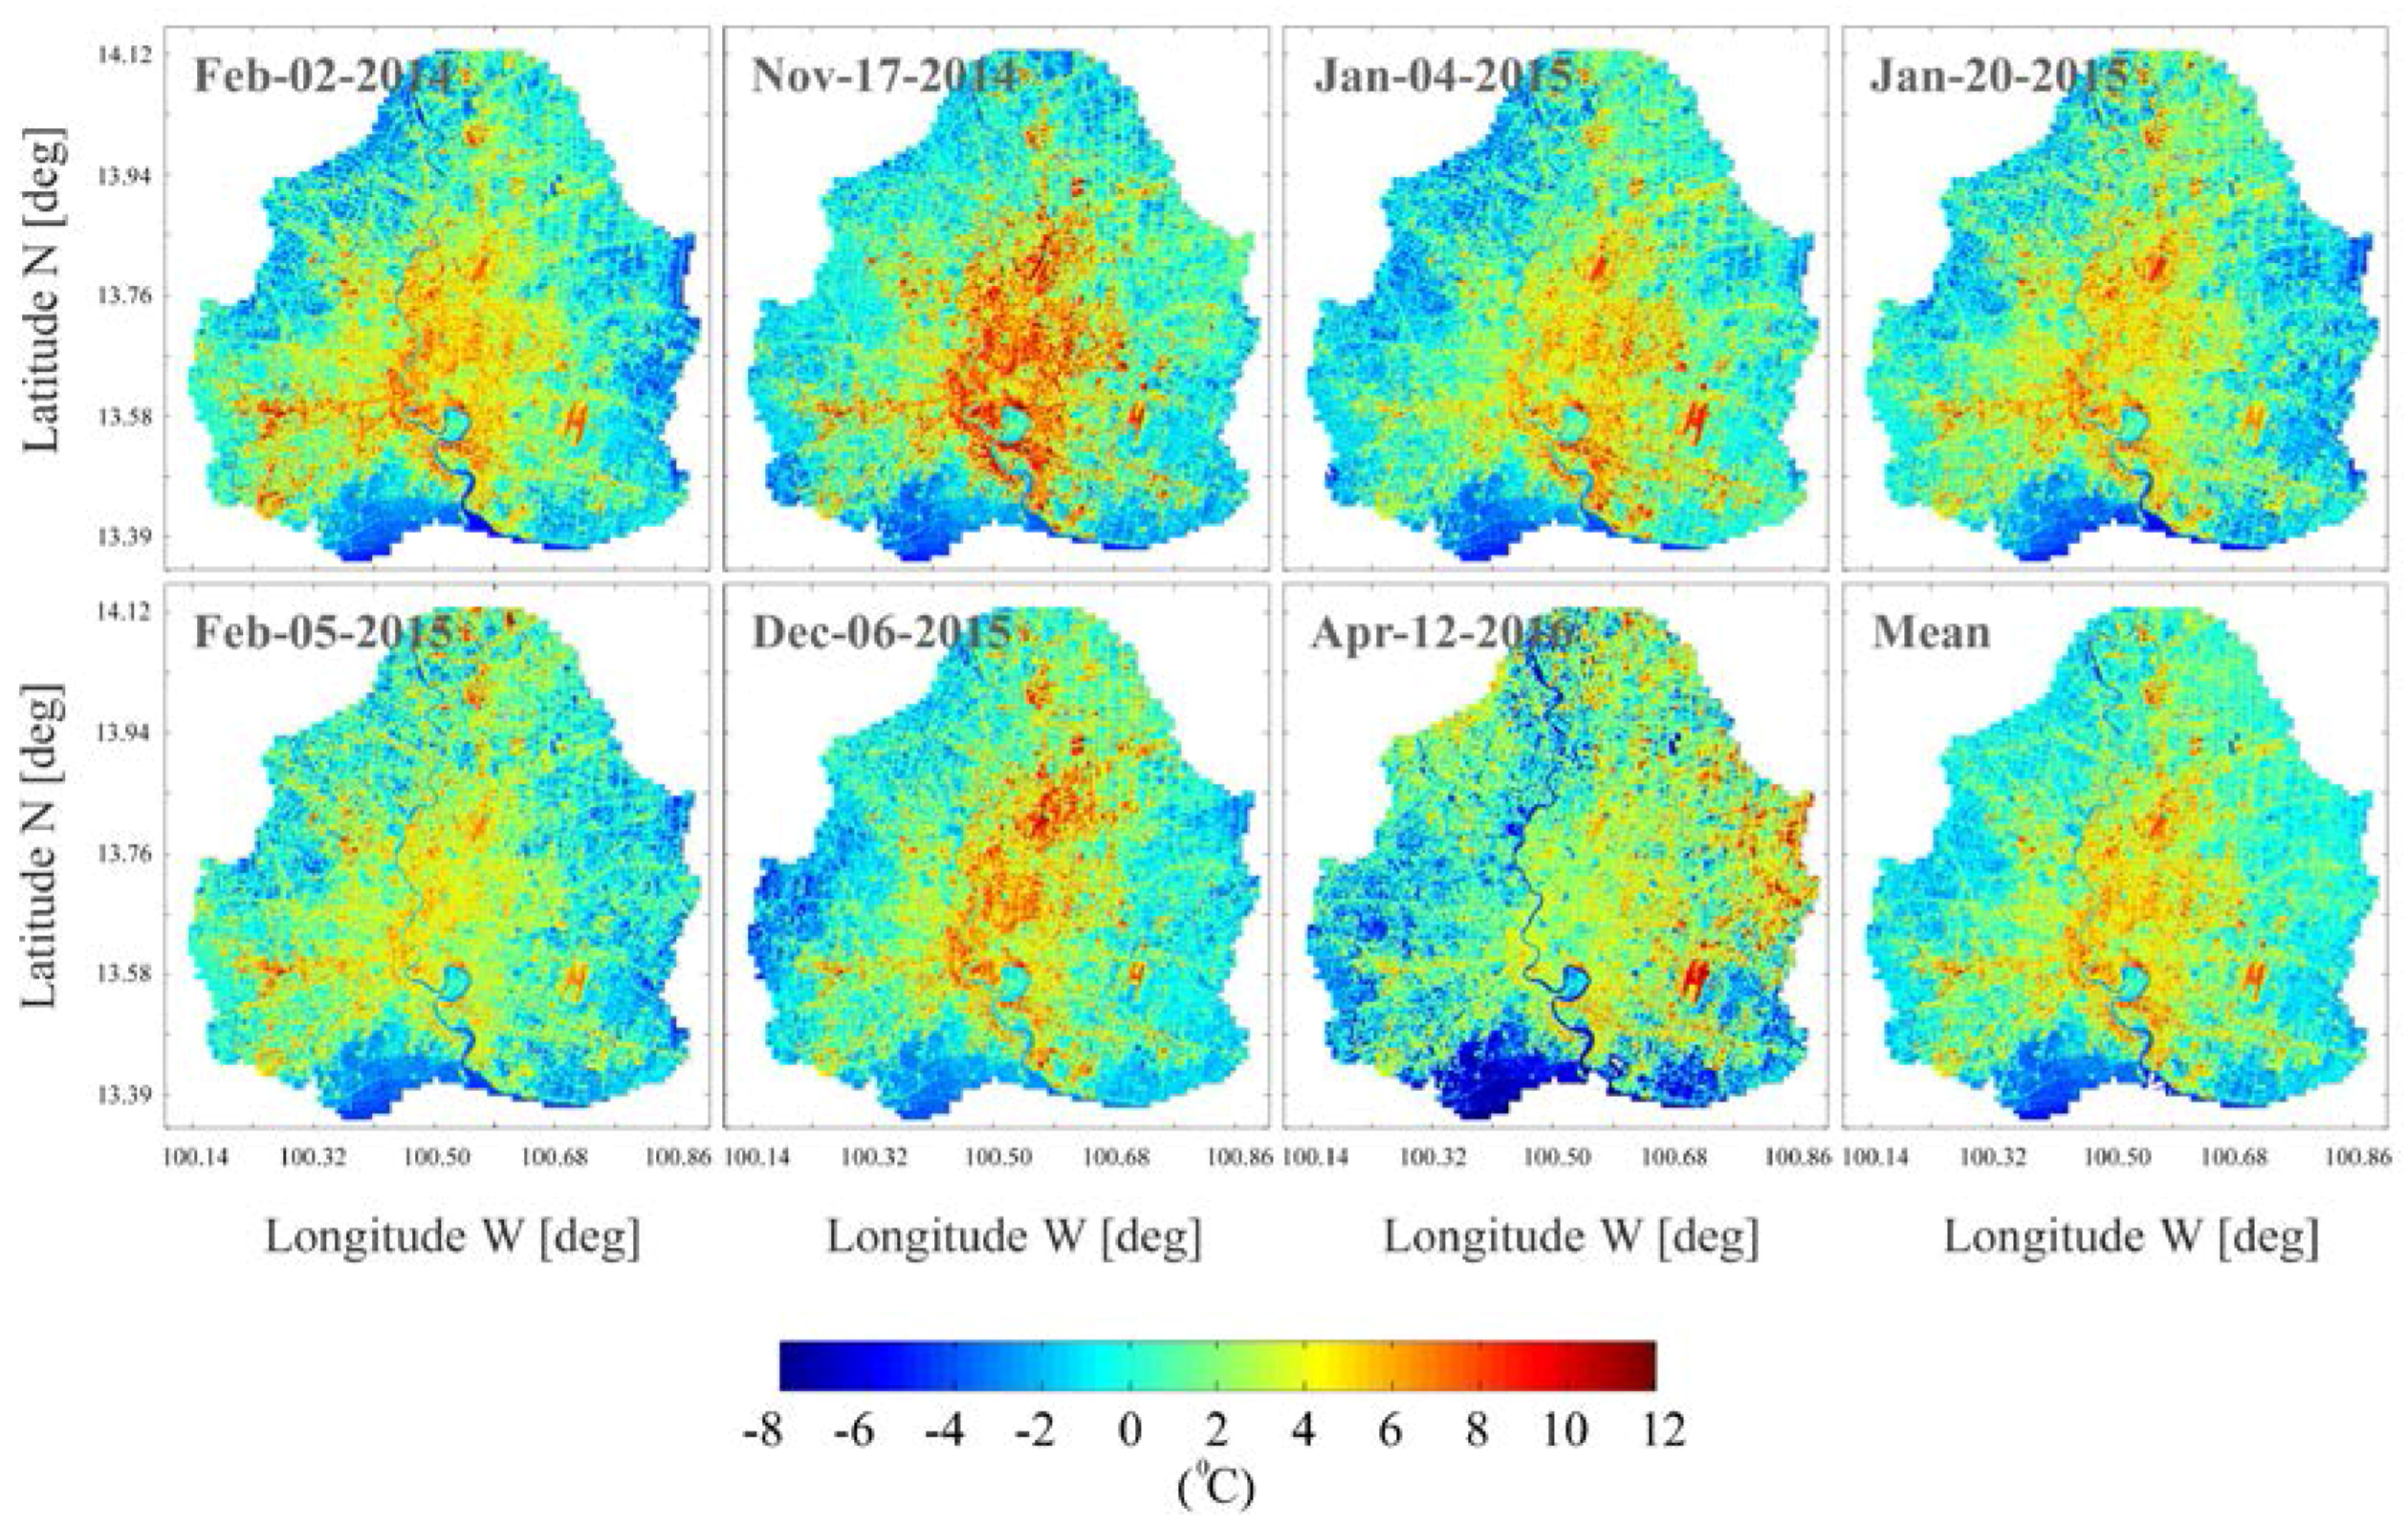
4. Results and Discussion
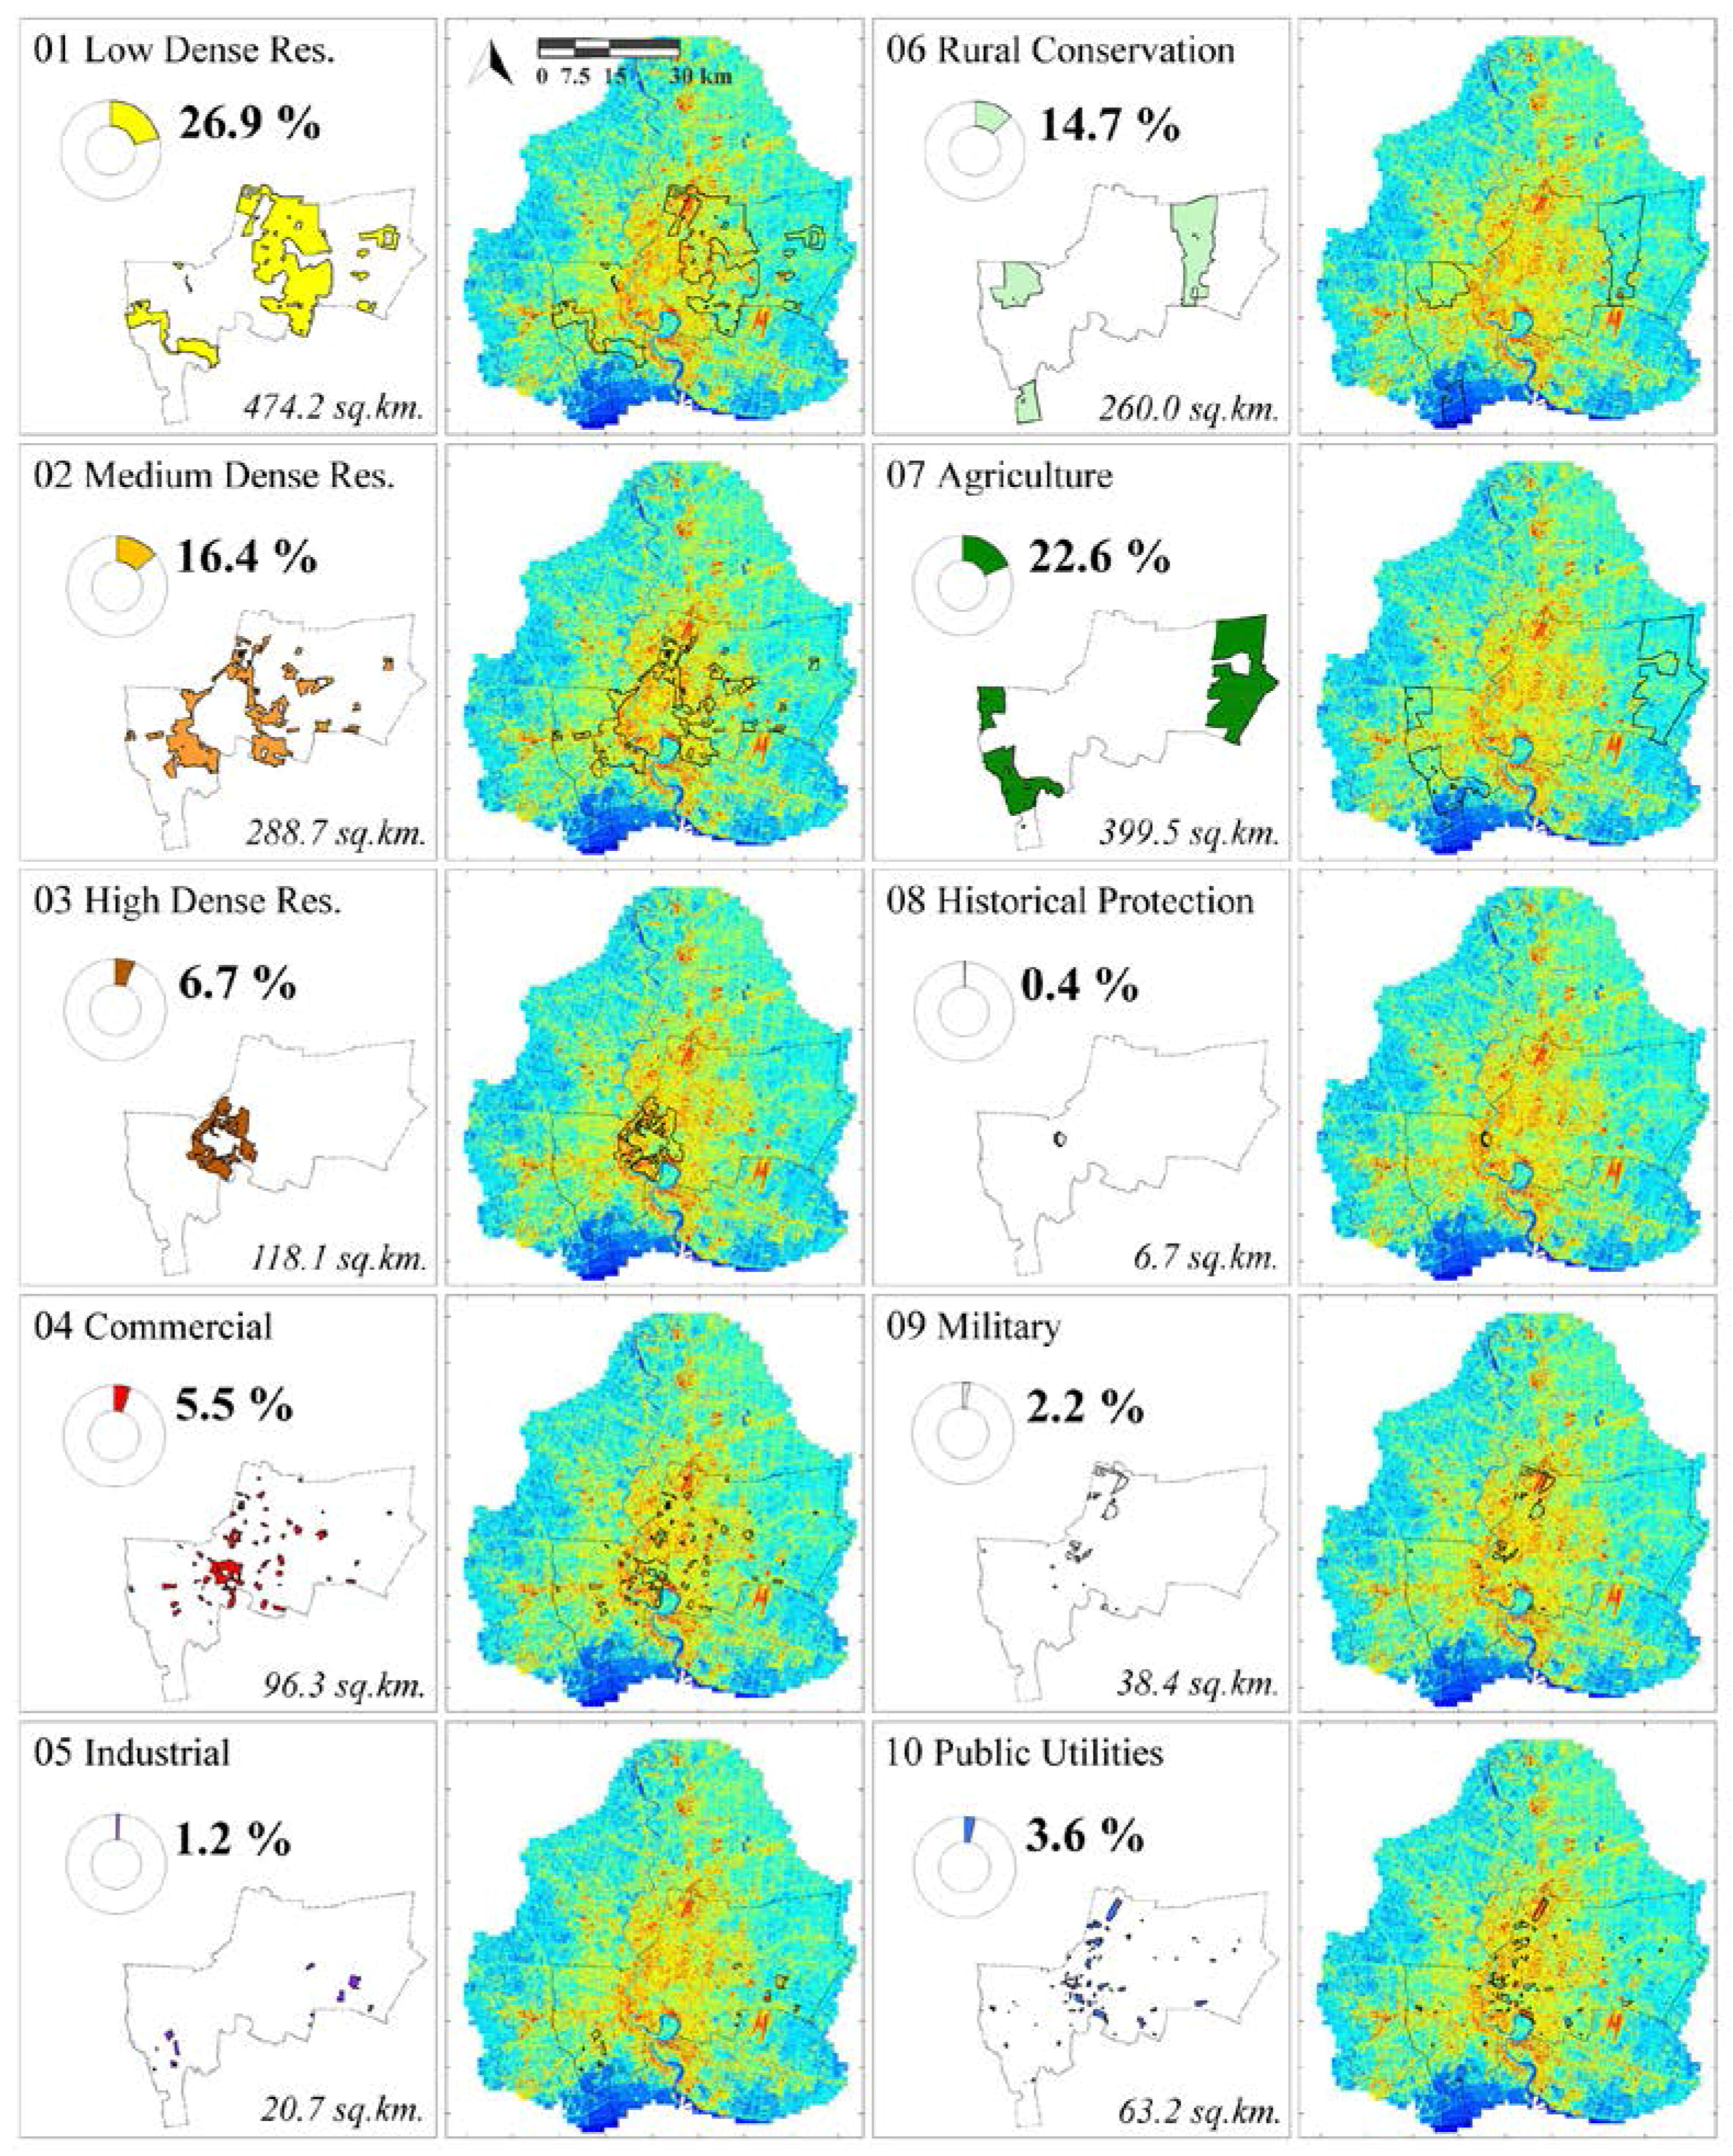
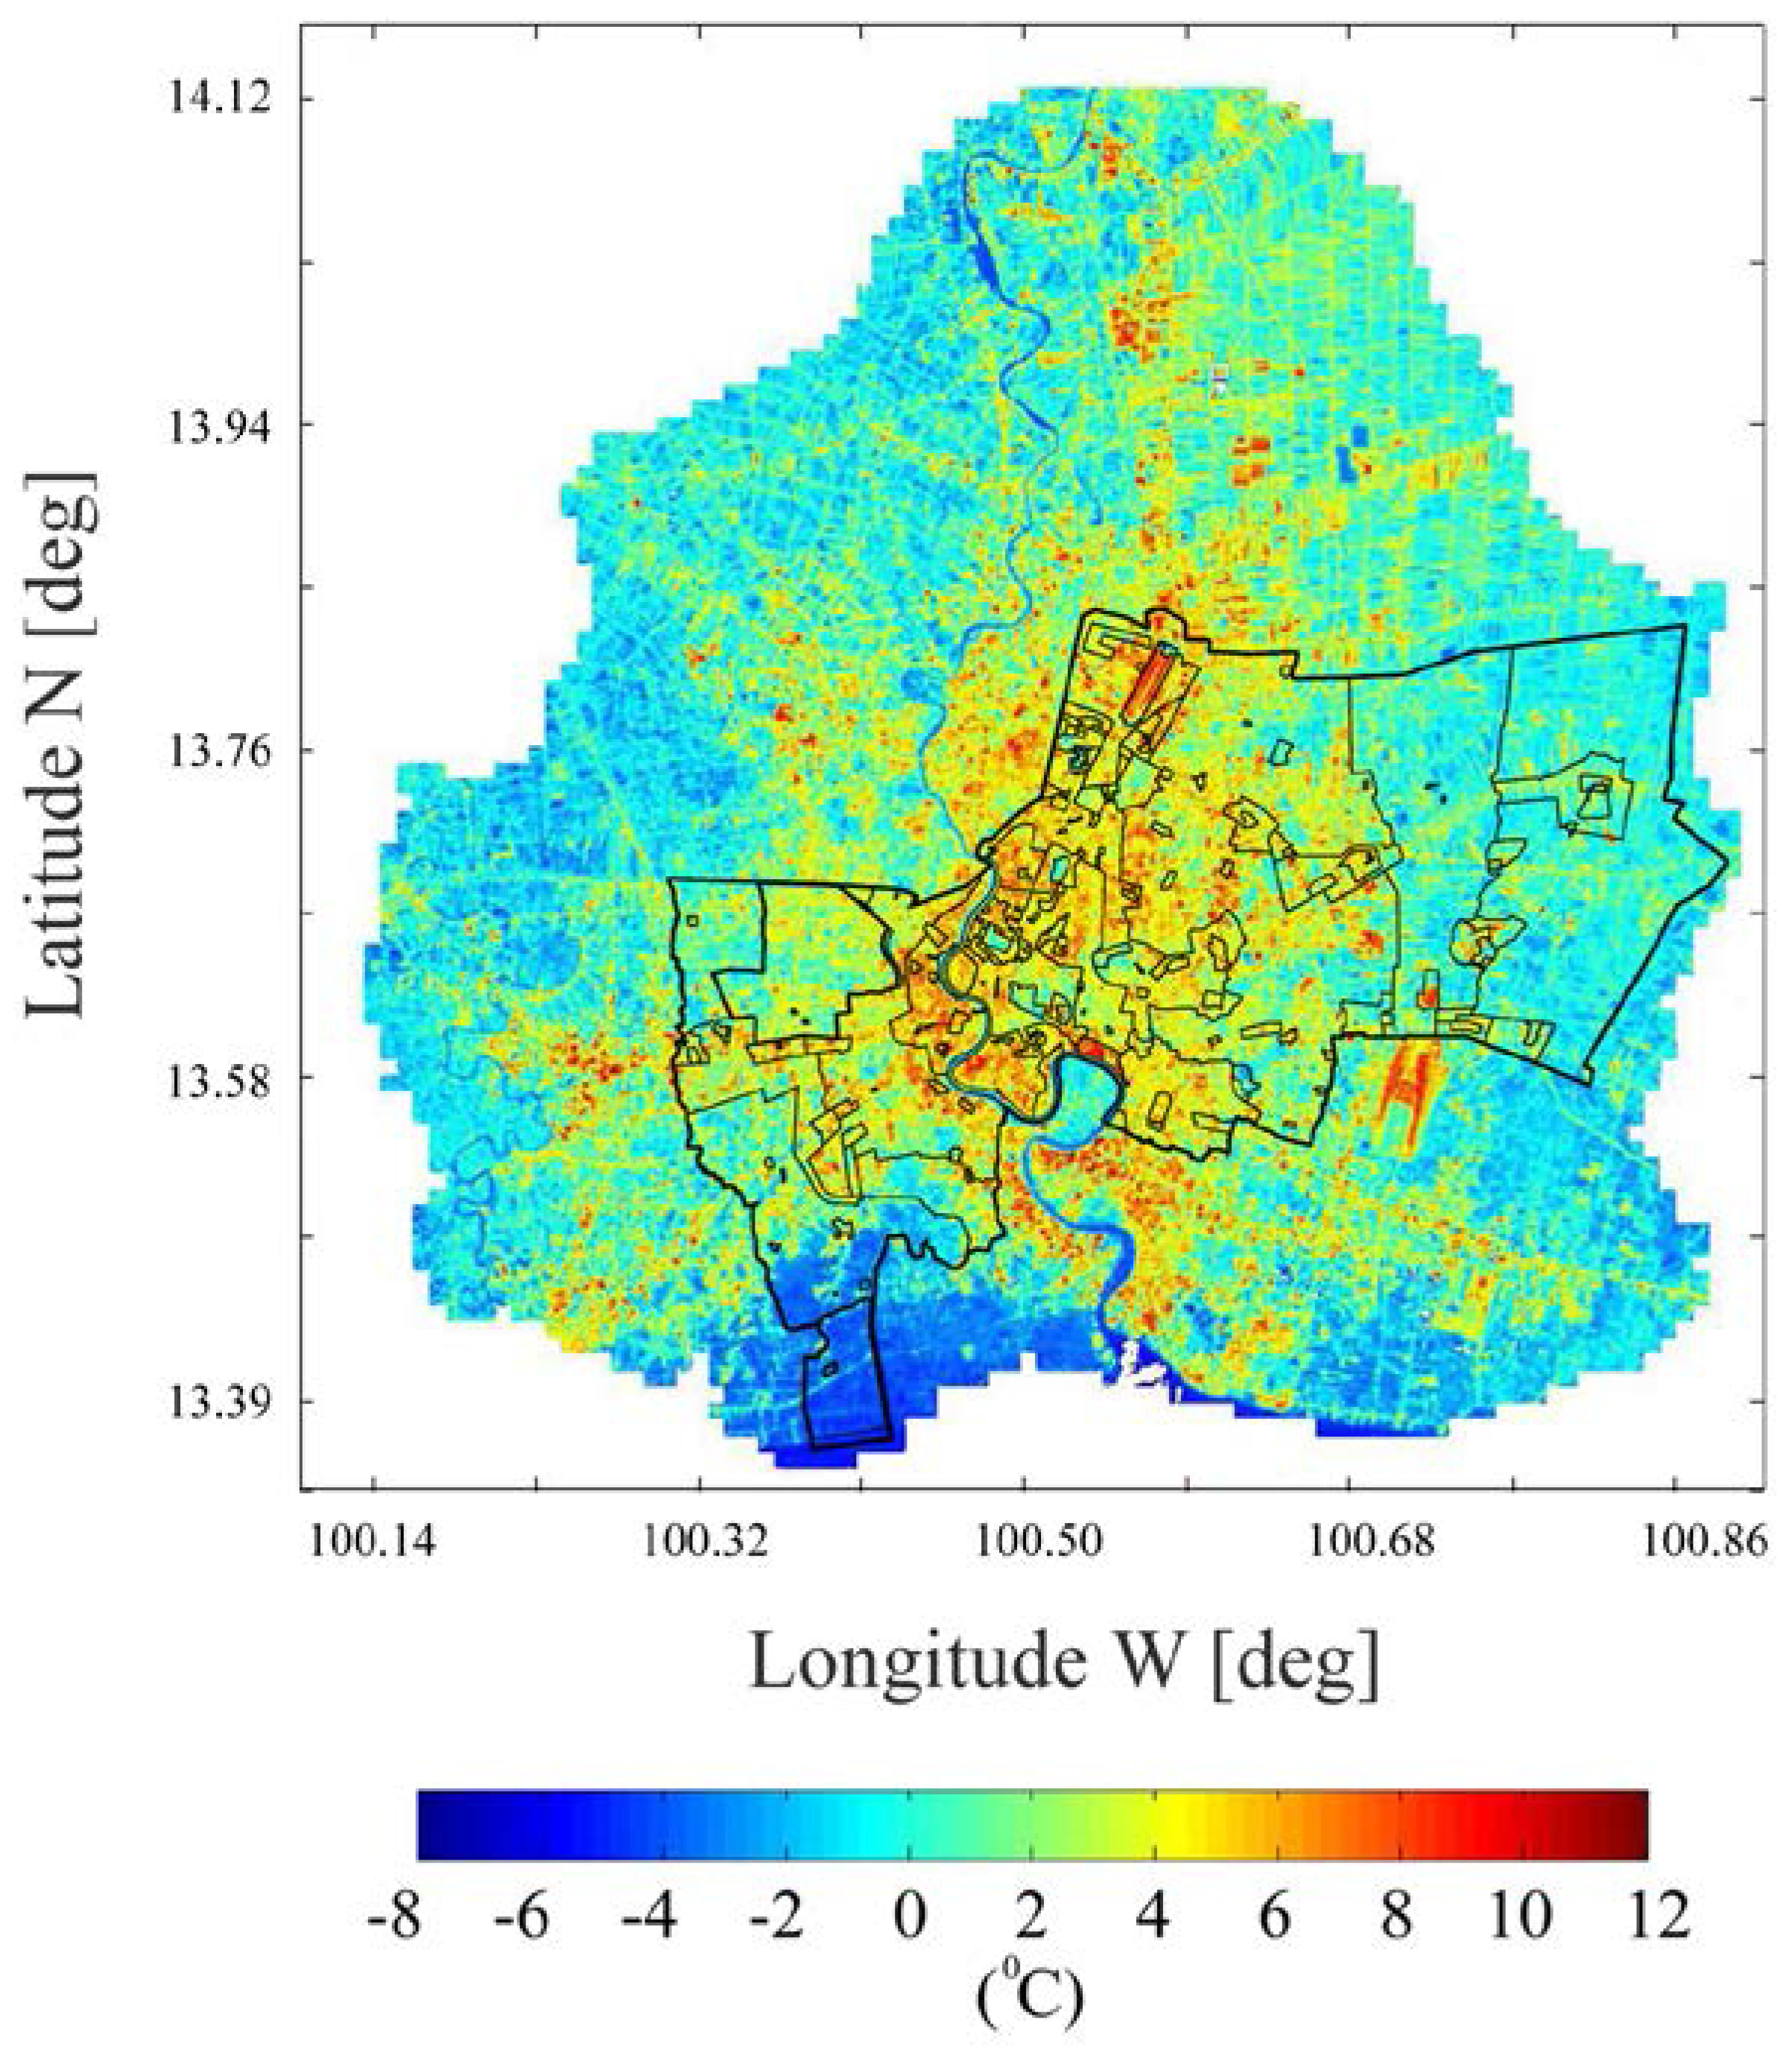
4.1. SUHI within the Land Use Zoning Plan
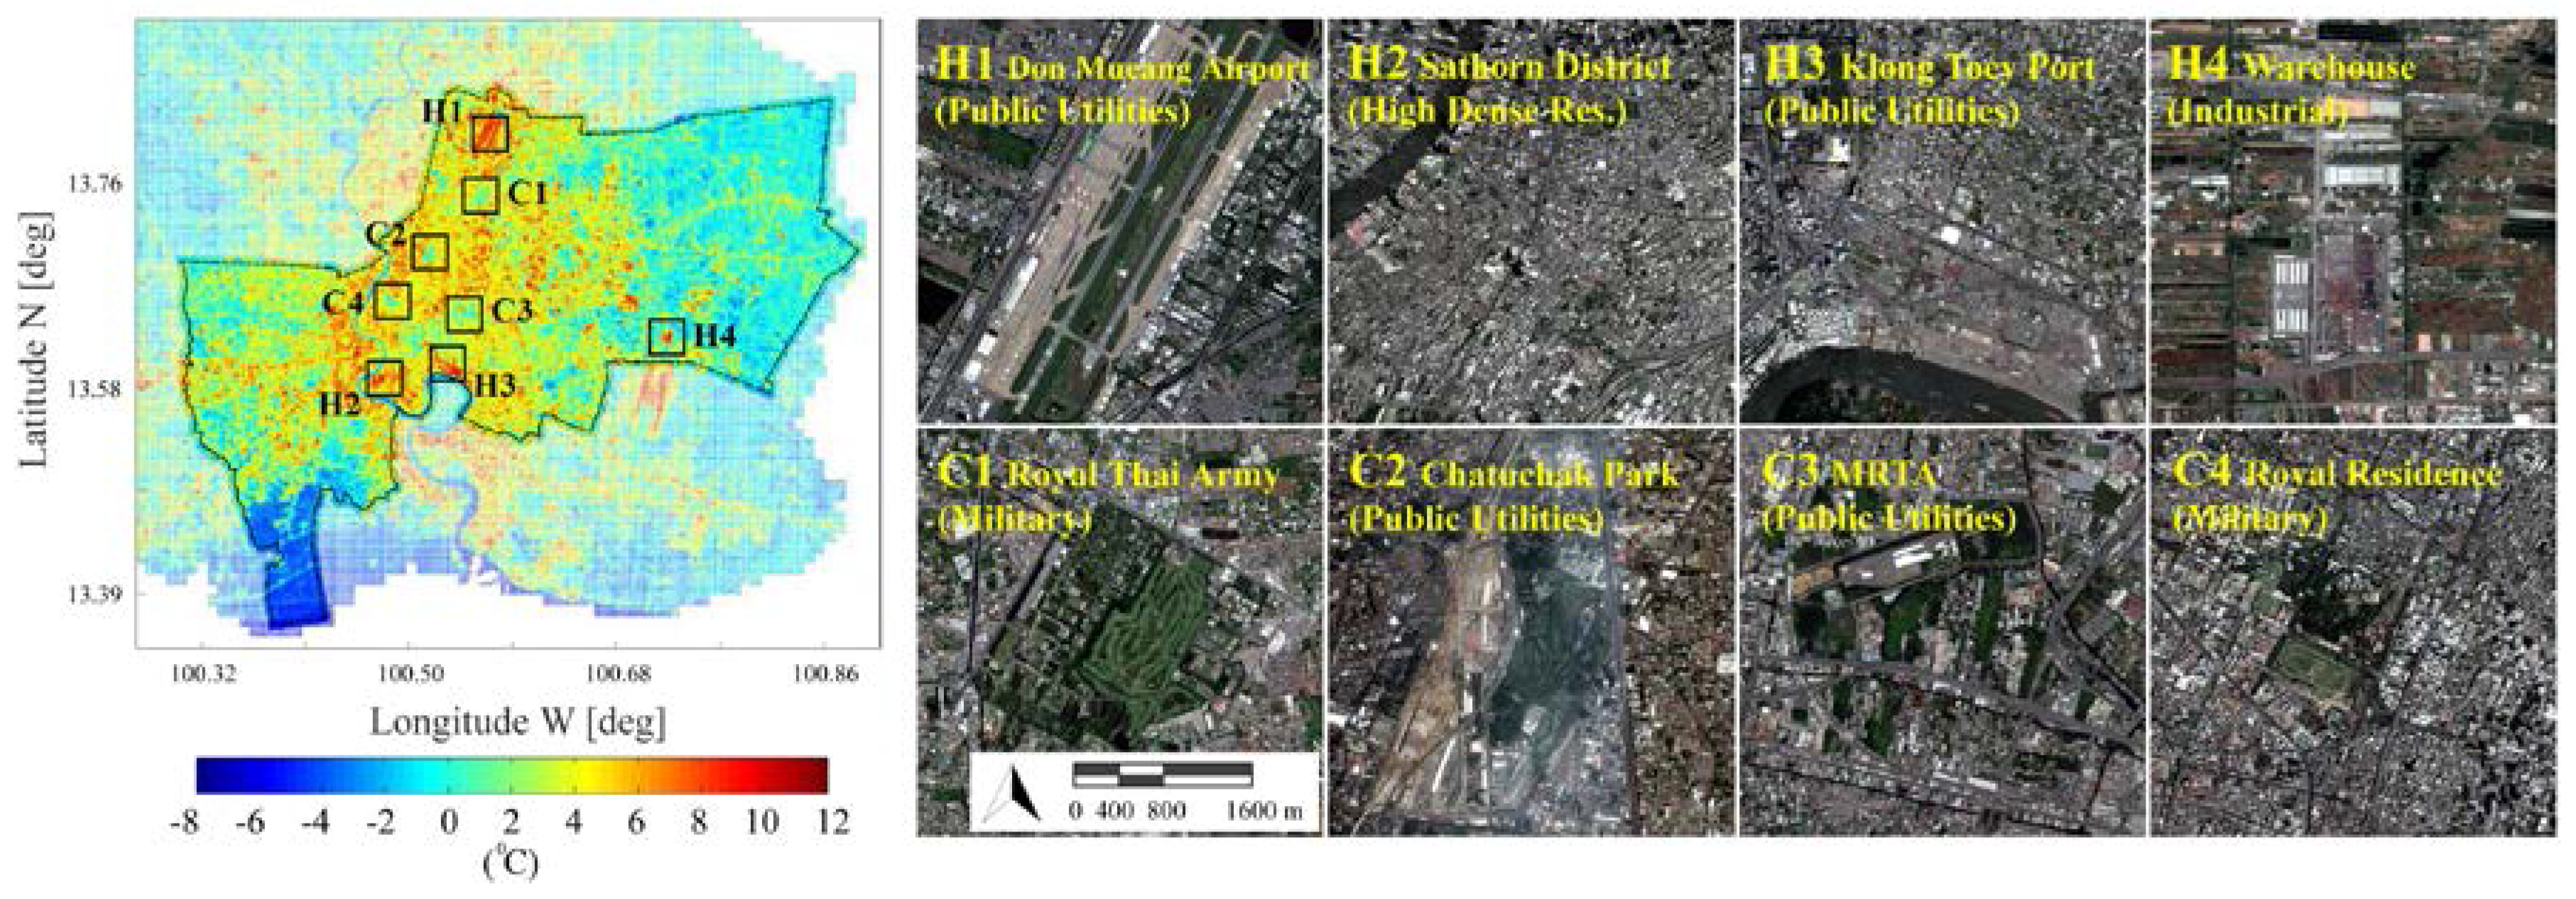
4.2. Surface Urban Cool Island and Hot-Spotted Surfaces
5. Conclusions
Author Contributions
Conflicts of Interest
References
- Fallmann, J.; Forkel, R.; Emeis, S. Secondary Effects of Urban Heat Island Mitigation Measures on Air Quality. Atmos. Environ. 2016, 125, 199–211. [Google Scholar] [CrossRef]
- Chen, W.; Zhang, Y.; Pengwang, C.; Gao, W. Evaluation of Urbanization Dynamics and Its Impacts on Surface Heat Islands: A Case Study of Beijing, China. Remote Sens. 2017, 9, 453. [Google Scholar] [CrossRef]
- Bhargava, A.; Lakmini, S.; Bhargava, S. Urban Heat Island Effect: It’s Relevance in Urban Planning. J. Biodivers. Endanger. Species. 2017, 5, 5–187. [Google Scholar]
- Liao, W.; Liu, X.; Wang, D.; Sheng, Y. The Impact of Energy Consumption on the Surface Urban Heat Island in China’s 32 Major Cities. Remote Sens. 2017, 9, 250. [Google Scholar] [CrossRef]
- Taha, H. Urban Climates and Heat Islands: Albedo, Evapotranspiration, and Anthropogenic Heat. Energy Build. 1997, 25, 99–103. [Google Scholar] [CrossRef]
- Imhoff, M.L.; Zhang, P.; Wolfe, R.E.; Bounoua, L. Remote Sensing of the Urban Heat Island Effect across Biomes in the Continental USA. Remote Sens. Environ. 2010, 114, 504–513. [Google Scholar] [CrossRef]
- Memon, R.A.; Leung, D.Y.C.; Chunho, L. A Review on the Generation, Determination and Mitigation of Urban Heat Island. J. Environ. Sci. 2008, 20, 120–128. [Google Scholar]
- Voogt, J.A.; Oke, T.R. Thermal Remote Sensing of Urban Climates. Remote Sens. Environ. 2003, 86, 370–384. [Google Scholar] [CrossRef]
- Rasul, A.; Balzter, H.; Smith, C.; Remedios, J.; Adamu, B.; Sobrino, J.A.; Srivanit, M.; Weng, Q. A Review on Remote Sensing of Urban Heat and Cool Islands. Land 2017, 6, 38. [Google Scholar] [CrossRef]
- Sobrino, J.; Oltra-Carrio, R.; Jimenez-Munoz, J.C.; Franch, B.; Hidalgo, V.; Mattar, C.; Julien, Y.; Cuenca, J.; Albentosa, M.R.R.; Gomez, J.A.; et al. Evaluation of the surface urban heat island effect in the city of Madrid by thermal remote sensing. Int. J. Remote Sens. 2013, 34, 3177–9192. [Google Scholar] [CrossRef]
- Pichierri, M.; Bonafoni, S.; Biondi, R. Satellite Air Temperature Estimation for Monitoring the Canopy Layer Heat Island of Milan. Remote Sens. Environ. 2012, 127, 130–138. [Google Scholar] [CrossRef]
- Anniballe, R.; Bonafoni, S.; Pichierri, M. Spatial and Temporal Trends of the Surface and Air Heat Island over Milan Using MODIS Data. Remote Sens. Environ. 2014, 150, 163–171. [Google Scholar] [CrossRef]
- Azevedo, J.A.; Chapman, L.; Muller, C.L. Quantifying the Daytime and Night-Time Urban Heat Island in Birmingham, UK: A Comparison of Satellite Derived Land Surface Temperature and High Resolution Air Temperature Observations. Remote Sens. 2016, 8, 153. [Google Scholar] [CrossRef]
- Li, Z.-L.; Tang, B.-H.; Wu, H.; Ren, H.; Yan, G.; Wan, Z.; Trigo, I.F.; Sobrino, J.A. Satellite-Derived Land Surface Temperature: Current Status and Perspectives. Remote Sens. Environ. 2013, 131, 14–37. [Google Scholar] [CrossRef]
- Lin, T.; Sun, C.; Li, X.; Zhao, Q.; Zhang, G.; Ge, R.; Ye, H.; Huang, N.; Yin, K. Spatial Pattern of Urban Functional Landscapes along an Urban–rural Gradient: A Case Study in Xiamen City, China. Int. J. Appl. Earth. Obs. Geoinf. 2016, 46, 22–30. [Google Scholar] [CrossRef]
- Deilami, K.; Kamruzzaman, M.; Hayes, J.F. Correlation or Causality between Land Cover Patterns and the Urban Heat Island Effect? Evidence from Brisbane, Australia. Remote Sens. 2016, 8, 716. [Google Scholar] [CrossRef]
- Zhang, L.; Weng, Q.; Shao, Z. An Evaluation of Monthly Impervious Surface Dynamics by Fusing Landsat and MODIS Time Series in the Pearl River Delta, China, from 2000 to 2015. Remote Sens. Environ. 2017, 201, 99–114. [Google Scholar] [CrossRef]
- Cao, X.; Onishi, A.; Chen, J.; Imura, H. Quantifying the Cool Island Intensity of Urban Parks Using ASTER and IKONOS Data. Landsc. Urban Plan. 2010, 96, 224–231. [Google Scholar] [CrossRef]
- Susca, T.; Gaffin, S.R.; Dell’Osso, G.R. Positive Effects of Vegetation: Urban Heat Island and Green Roofs. Environ. Pollut. 2011, 159, 2119–2126. [Google Scholar] [CrossRef] [PubMed]
- Gago, E.J.; Roldan, J.; Pacheco-Torres, R.; Ordóñez, J. The City and Urban Heat Islands: A Review of Strategies to Mitigate Adverse Effects. Renew. Sust. Energ. Rev. 2013, 25, 749–758. [Google Scholar] [CrossRef]
- Zhou, B.; Rybski, D.; Kropp, J.P. The Role of City Size and Urban Form in the Surface Urban Heat Island. Sci. Rep. 2017, 7, 4791. [Google Scholar] [CrossRef] [PubMed]
- MacLachlan, A.; Biggs, E.; Roberts, G.; Boruff, B. Urbanisation-Induced Land Cover Temperature Dynamics for Sustainable Future Urban Heat Island Mitigation. Urban Sci. 2017, 1, 38. [Google Scholar] [CrossRef]
- Jongtanom, Y.; Kositanont, C.; Baulert, S. Temporal Variations of Urban Heat Island Intensity in Three Major Cities, Thailand. Mod. Appl. Sci. 2011, 5, 105. [Google Scholar] [CrossRef]
- Arifwidodo, S.D.; Tanaka, T. The Characteristics of Urban Heat Island in Bangkok, Thailand. Procedia Soc. Behav. Sci. 2015, 195, 423–428. [Google Scholar] [CrossRef]
- Arifwidodo, S.; Chandrasiri, O. Urban Heat Island and Household Energy Consumption in Bangkok, Thailand. Energy Procedia. 2015, 79, 189–194. [Google Scholar] [CrossRef]
- Tran, H.; Uchihama, D.; Ochi, S.; Yasuoka, Y. Assessment with Satellite Data of the Urban Heat Island Effects in Asian Mega Cities. Int. J. Appl. Earth. Obs. Geoinf. 2006, 8, 34–48. [Google Scholar] [CrossRef]
- Thaiutsa, B.; Puangchit, L.; Kjelgren, R.; Arunpraparut, W. Urban Green Space, Street Tree and Heritage Large Tree Assessment in Bangkok, Thailand. Urban For. Urban Green. 2008, 7, 219–229. [Google Scholar] [CrossRef]
- Thai Meteorological Department. Available online: https://www.tmd.go.th/en/climate.php (accessed on 20 December 2017).
- Department of Public Works and Town & Country Planning. Available online: https://dpt.go.th/en/ (accessed on 3 January 2018).
- US Geological Survey USGS. Available online: http://earthexplorer.usgs.gov (accessed on 12 December 2017).
- Yu, X.; Guo, X.; Wu, Z. Land Surface Temperature Retrieval from Landsat 8 TIRS—Comparison between Radiative Transfer Equation-Based Method, Split Window Algorithm and Single Channel Method. Remote Sens. 2014, 6, 9829–9852. [Google Scholar] [CrossRef]
- Jimenez-Munoz, J.C.; Cristobal, J.; Sobrino, J.A.; Soria, G.; Ninyerola, M.; Pons, X. Revision of the Single-Channel Algorithm for Land Surface Temperature Retrieval From Landsat Thermal-Infrared Data. IEEE Trans. Geosci. Remote Sens. 2009, 47, 339–349. [Google Scholar] [CrossRef]
- Atmospheric Correction Parameter Calculator. Available online: http://atmcorr.gsfc.nasa.gov (accessed on 22 December 2017).
- Barsi, J.A.; Barker, J.L.; Schott, J.R. An Atmospheric Correction Parameter Calculator for a Single Thermal Band Earth-Sensing Instrument. In Proceedings of the IEEE International Geoscience and Remote Sensing Symposium (IGARSS) (IEEE Cat. No.03CH37477), Toulouse, France, 21–25 July 2003; Volume 5, pp. 3014–3016. [Google Scholar]
- Sobrino, J.A.; Jiménez-Muñoz, J.C.; Paolini, L. Land Surface Temperature Retrieval from LANDSAT TM 5. Remote Sens. Environ. 2004, 90, 434–440. [Google Scholar] [CrossRef]
- Bonafoni, S. Downscaling of Landsat and MODIS Land Surface Temperature Over the Heterogeneous Urban Area of Milan. IEEE J. Sel. Top. Appl. Earth Obs. Remote Sens. 2016, 9, 2019–2027. [Google Scholar] [CrossRef]
- Oltra-Carrio, R.; Sobrino, J.A.; Franch, B.; Nerry, F. Land surface emissivity retrieval from airborne sensor over urban areas. Remote Sens. Environ. 2012, 123, 298–305. [Google Scholar] [CrossRef]
- Bolstad, P.V.; Lillesand, T.M. Rapid Maximum Likelihood Classification. Photogramm. Eng. Remote Sens. 1991, 57, 67–74. [Google Scholar]
- Phiri, D.; Morgenroth, J. Developments in Landsat Land Cover Classification Methods: A Review. Remote Sens 2017, 9, 967. [Google Scholar] [CrossRef]
- Jensen, J.R. Introductory Digital Image Processing: A Remote Sensing Perspective, 4 ed.; Pearson: Glenview, IL, USA, 2015. [Google Scholar]
- Yang, C.; He, X.; Yu, L.; Yang, J.; Yan, F.; Bu, K.; Chang, L.; Zhang, S. The Cooling Effect of Urban Parks and Its Monthly Variations in a Snow Climate City. Remote Sens. 2017, 9, 1066. [Google Scholar] [CrossRef]


| Date | Path | Row |
|---|---|---|
| 2 February 2014 | 129 | 50, 51 |
| 17 November 2014 | 129 | 50, 51 |
| 4 January 2015 | 129 | 50, 51 |
| 20 January 2015 | 129 | 50, 51 |
| 5 February 2015 | 129 | 50, 51 |
| 6 December 2015 | 129 | 50, 51 |
| 12 April 2016 | 129 | 50, 51 |
© 2018 by the authors. Licensee MDPI, Basel, Switzerland. This article is an open access article distributed under the terms and conditions of the Creative Commons Attribution (CC BY) license (http://creativecommons.org/licenses/by/4.0/).
Share and Cite
Keeratikasikorn, C.; Bonafoni, S. Urban Heat Island Analysis over the Land Use Zoning Plan of Bangkok by Means of Landsat 8 Imagery. Remote Sens. 2018, 10, 440. https://doi.org/10.3390/rs10030440
Keeratikasikorn C, Bonafoni S. Urban Heat Island Analysis over the Land Use Zoning Plan of Bangkok by Means of Landsat 8 Imagery. Remote Sensing. 2018; 10(3):440. https://doi.org/10.3390/rs10030440
Chicago/Turabian StyleKeeratikasikorn, Chaiyapon, and Stefania Bonafoni. 2018. "Urban Heat Island Analysis over the Land Use Zoning Plan of Bangkok by Means of Landsat 8 Imagery" Remote Sensing 10, no. 3: 440. https://doi.org/10.3390/rs10030440
APA StyleKeeratikasikorn, C., & Bonafoni, S. (2018). Urban Heat Island Analysis over the Land Use Zoning Plan of Bangkok by Means of Landsat 8 Imagery. Remote Sensing, 10(3), 440. https://doi.org/10.3390/rs10030440