Article

Evaluation of Groundwater Storage Variations Estimated from GRACE Data Assimilation and State-of-the-Art Land Surface Models in Australia and the North China Plain

1
School of Engineering, University of Newcastle, Callaghan, NSW 2308, Australia
2
Research School of Earth Sciences, Australian National University, Canberra, ACT 2601, Australia
3
Fenner School of Environment and Society, Australian National University, Canberra, ACT 2601, Australia
4
Institute of Physical Geography, Goethe-University Frankfurt, 60438 Frankfurt , Germany
5
Senckenberg Biodiversity and Climate Research Centre (SBiK-F), 60325 Frankfurt, Germany
6
Department of Physical Geography, Faculty of Geosciences, Utrecht University, 3584 CS Utrecht, The Netherlands
7
State Key Laboratory of Geodesy and Earth’s Dynamics, Institute of Geodesy and Geophysics, Chinese Academy of Sciences, Wuhan 430077, China
*
Author to whom correspondence should be addressed.
Remote Sens. 2018, 10(3), 483; https://doi.org/10.3390/rs10030483
Submission received: 29 January 2018 / Revised: 9 March 2018 / Accepted: 19 March 2018 / Published: 20 March 2018
(This article belongs to the Special Issue Remote Sensing of Groundwater from River Basin to Global Scales)

Abstract

:
The accurate knowledge of the groundwater storage variation (ΔGWS) is essential for reliable water resource assessment, particularly in arid and semi-arid environments (e.g., Australia, the North China Plain (NCP)) where water storage is significantly affected by human activities and spatiotemporal climate variations. The large-scale ΔGWS can be simulated from a land surface model (LSM), but the high model uncertainty is a major drawback that reduces the reliability of the estimates. The evaluation of the model estimate is then very important to assess its accuracy. To improve the model performance, the terrestrial water storage variation derived from the Gravity Recovery And Climate Experiment (GRACE) satellite mission is commonly assimilated into LSMs to enhance the accuracy of the ΔGWS estimate. This study assimilates GRACE data into the PCRaster Global Water Balance (PCR-GLOBWB) model. The GRACE data assimilation (DA) is developed based on the three-dimensional ensemble Kalman smoother (EnKS 3D), which considers the statistical correlation of all extents (spatial, temporal, vertical) in the DA process. The ΔGWS estimates from GRACE DA and four LSM simulations (PCR-GLOBWB, the Community Atmosphere Biosphere Land Exchange (CABLE), the Water Global Assessment and Prognosis Global Hydrology Model (WGHM), and World-Wide Water (W3)) are validated against the in situ groundwater data. The evaluation is conducted in terms of temporal correlation, seasonality, long-term trend, and detection of groundwater depletion. The GRACE DA estimate shows a significant improvement in all measures, notably the correlation coefficients (respect to the in situ data) are always higher than the values obtained from model simulations alone (e.g., ~0.15 greater in Australia, and ~0.1 greater in the NCP). GRACE DA also improves the estimation of groundwater depletion that the models cannot accurately capture due to the incorrect information of the groundwater demand (in, e.g., PCR-GLOBWB, WGHM) or the unavailability of a groundwater consumption routine (in, e.g., CABLE, W3). In addition, this study conducts the inter-comparison between four model simulations and reveals that PCR-GLOBWB and CABLE provide a more accurate ΔGWS estimate in Australia (subject to the calibrated parameter) while PCR-GLOBWB and WGHM are more accurate in the NCP (subject to the inclusion of anthropogenic factors). The analysis can be used to declare the status of the ΔGWS estimate, as well as itemize the possible improvements of the future model development.

Graphical Abstract

1. Introduction

Groundwater is one of the most important resources worldwide that supplies freshwater to sustain the domestic and industrial sectors, particularly in arid and semi-arid environments [1,2]. Accurate knowledge of groundwater storage variation (∆GWS) is important to understand the groundwater resource situation, which is crucial to evaluate the threat with regards to soil salinity, degrading crop production, and land subsidence, which are mainly induced by the over-pumping of groundwater under the inadequate water supply condition. The distinct evidence is seen in Australia and the North China Plain (NCP), where heavy water demand and climate variation affect the groundwater cycle substantially [3,4,5,6,7].
The ∆GWS can be simulated from land surface models when the model parameters are properly calibrated. This may be challenging, particularly for a large-scale simulation, due to the scarcity of ground data to be used to calibrate the model. Another approach is to estimate the ∆GWS from the space-borne observation obtained from the Gravity Recovery And Climate Experiment satellite mission (GRACE) [8]. GRACE observations of Earth’s gravity can be used to derive the total water storage variation (∆TWS), which includes, e.g., soil moisture, groundwater, snow, canopy water, and surface water. The ∆GWS component could be extracted from the GRACE observation with the other components computed from a hydrology model; e.g., to estimate groundwater depletion over India [9], California’s Central Valley [10], and China [11,12]. However, the hydrological process is commonly neglected in the ∆GWS calculation, and the statistical information used to extract the desired component might not be properly accounted for. Several more sophisticated methods have been developed to enhance the quality of the ∆GWS estimate, considering the error propagated from the uncertainty in the model computation and the data. These include the decomposition of the water storage component using temporal independent component analysis [13], constrained forward modeling [14], wavelet decomposition [15], and inversion of the water balance equation [16], to name a few. Alternatively, GRACE data assimilation (DA) was also proposed to optimize the inclusion of GRACE data in the hydrological process, which results in the optimal estimation of the ∆GWS component (e.g., [17]).
The number of GRACE DA approaches and applications has been increasingly developed in the past few years regarding its performance and simplicity of the practical implementation. The GRACE DA schemes are commonly developed based on a suitable implementation into a specific land surface model. These include the data assimilation approach itself (e.g., ensemble Kalman filter (EnKF, e.g., [18]), constraint EnKF [19], ensemble Kalman smoother (e.g., [17,20]), ensemble square root filter [21], and particle filter (e.g., [21,22])), the configuration of updated state variables (e.g., update at the beginning of the month [23], update every five days [18,24]), and the inclusion of GRACE spatial correlation error (e.g., [25,26,27]). These GRACE DA approaches produced the improved ∆GWS estimate over a wide range of river basins including Mississippi [17], North America [28], Rhine [18], Hexi corridor [27], India [29], and Murray-Darling [20,24,30]. GRACE DA shows a clear benefit on the deep storage and groundwater storage estimates, but not on the soil moisture computation. The little benefit on soil moisture estimate is because the near-surface component exhibits more immediate temporal responses to the meteorological forcing than what GRACE monthly measurement can capture, causing GRACE DA less responsive to the surface storage computation [20]. To enhance the quality of the groundwater and surface soil moisture estimates simultaneously, [20] developed a joint DA scheme that assimilated together the satellite soil moisture and GRACE observations into the World-Wide Water (W3) model [31]. The approach successfully improved both surface soil moisture and groundwater components over Australia, validating against the in situ soil moisture and groundwater data. However, the quality of the ∆GWS estimate from the joint DA was reduced compared to the assimilation using the GRACE observation alone. The negative effect is seen as a drawback of the joint DA that cannot maximize the quality of all components at the same time [20].
This study focuses on GRACE DA for ∆GWS estimate only. GRACE data is assimilated into the PCRaster Global Water Balance (PCR-GLOBWB) hydrology model [32], and we call the output as GRACE DA. The study areas are Australia and the North China Plain (NCP), and the locations including the in situ groundwater sites are shown in Figure 1. The GRACE DA approach is developed based on the three-dimensional (3D) ensemble Kalman smoother (EnKS 3D), which has a similar schematic to the filter version (EnKF 3D) [27]. The EnKF 3D was developed to account for the GRACE spatial correlation error while keeping the computational cost affordable [33]. The EnKS 3D can be considered as an extension of EnKF 3D with the inclusion of the temporal correlation between the daily state of the month. The approach can also reduce the discontinuity between the months by updating the daily state estimate directly instead of distributing the monthly update to a particular day (e.g., at the end of the month [25]). The ∆GWS estimate from EnKS 3D is validated against the in situ groundwater data over Australia and the NCP. The Australian ∆GWS estimate from GRACE DA has been comprehensively assessed by [20]. However, the DA configuration of this study is different from [20] including land surface models (PCR-GLOBWB vs. W3), DA scheme (EnKS 3D vs. EnKS), GRACE data (CSR vs. JPL Mascon), and the inclusion of spatial correlation error (Yes vs. No). Therefore, this study can be considered as an independent evaluation of the ∆GWS estimate over all of Australia. Nevertheless, in this study for the first time, GRACE DA is conducted and evaluated over the NCP.
The performance of GRACE DA is evaluated by comparing the GRACE DA result with the simulated result from a particular model, i.e., the one that is used in the DA process. This evaluation provides some insight into the effect of GRACE DA regarding the model configuration and ineffective parameter calibration. The inter-comparison of multiple LSM outputs can also provide an effective quality assessment of water storage estimates. The comparison is also important to identify the strengths and weaknesses of a particular model, leading to a more correct direction of the future model development. In this study, the final products from three additional models, the Community Atmosphere Biosphere Land Exchange (CABLE) [34], the Water Global Assessment and Prognosis Global Hydrology Model (WGHM) [35], and the World-Wide Water (W3) [31] are obtained. The estimates from four independent models and GRACE DA are used to assess the quality of the ∆TWS and ∆GWS estimates. It is noted that PCR-GLOBWB and WGHM are hydrology models, as they do not contain the energy balance component. However, for convenience, we use the term LSMs to represent all models in this study.
This paper provides the overview of the ∆TWS and ∆GWS estimates in Australia and NCP from the four state-of-the-art model simulations as well as from the GRACE DA estimate. The qualitative and quantitative analyses are presented as follows: Section 2 describes the hydrology models and GRACE data processing, including the estimation of the GRACE error variance-covariance matrix. Section 3 outlines the EnKS 3D and its implementation. Section 4 presents the quality assessment of the ∆TWS and ∆GWS estimates based on the statistical analysis, as well as the validation against the in situ data. The groundwater depletion observed in Australia and the NCP is also presented in this section. Section 5 discusses the current limitation and possible future development of LSMs. Section 6 summarizes the findings.

2. Data Processing and Land Surface Models

2.1. GRACE

The GRACE data and its error variance-covariance matrices are obtained from the GRACE gravity product release 5 (RL05), generated by the University of Texas at Austin’s Center for Space Research [36] between January 2003 and December 2014. The product consists of monthly sets of spherical harmonic coefficients (SHC, C ¯ l m ). The TWS and its uncertainty are computed using the SHC up to degree (l) and order (m) 60. For the ΔTWS computation, the GRACE data are processed as follows. Firstly, the degree 1 coefficients provided by [37] are restored, and C ¯ 20 is replaced by the value obtained from [38]. Secondly, the long-term mean SHC is removed from each monthly product to obtain the SHC variation ( Δ C ¯ l m ). Finally, the destriping and 250 km-radius Gaussian smoothing filters are applied to reduce the high frequency noises [39,40]. The ΔTWS is then computed as:
Δ TWS ( θ , ϕ ) = l = 1 60 m = l l Y ^ l m ( θ , ϕ )   S l Δ C ¯ l m
where θ , ϕ are co-latitude and longitude in spherical coordinates, Y ^ l m is the normalized surface spherical harmonic, and S l contains a scaling factor used to convert dimensionless coefficients to ∆TWS (in meter) [41]:
S l = a e ( 2 l + 1 ) 3 ( 1 + k l ) ρ e ρ w
where a e is the semi-major axis if the reference ellipsoid, ρ e is the average density of the earth, ρ w is the average density of water, and k l is the load love number. The matrix form of Equation (1) is:
Δ T W S = Y S x  
where Y contains Y ^ l m of all locations, S contains S l , and x is a vector of Δ C ¯ l m . In this study, the ∆TWS is computed at every 0.5° × 0.5° grid cell. This cell size is chosen through trial and error as a balance between the performance and compatibility with the PCR-GLOBWB resolution. It is noted that the 0.5 grid data are highly correlated, and they are not used independently in GRACE DA. Instead, the correlation error of such a fine scale will be accounted for in the application of EnKS 3D. Additionally, the ΔTWS signal is generally damped after the application of filters. The damped signal is restored using the signal restoration method, which iteratively searches for the mitigated signal based on forward modeling [42,43].
The ΔTWS uncertainty is computed using the monthly full error variance-covariance matrix of the SHC ( Σ ). However, the provided Σ is associated with the original GRACE product, and cannot be directly used with the post-processed GRACE data. The method proposed in [27] is used to obtain the error variance-covariance matrix associated with the post-processed data. Firstly, the noise realization (100 members) is generated based on Σ , and each noise realization is post-processed in the same way as the GRACE data. Then, the error variance-covariance matrix ( Σ ^ ) associated with the post-processed SHCs is computed empirically from the post-processed noise realization. After obtaining Σ ^ , the error covariance matrix R of the GRACE-derived Δ T W S (see Equation (3)) is computed using the error propagation law as:
R = Y S   Σ ^   ( Y S ) T
It is noted that GRACE provides the variation of TWS while the DA process requires the absolute TWS. Therefore, in the DA process, the long-term mean TWS computed from PCR-GLOBWB between January 2003 and December 2014 is added to the GRACE-derived ΔTWS to obtain the absolute TWS observation.

2.2. Land Surface Models

2.2.1. PCR-GLOBWB Model and Uncertainties

The PCR-GLOBWB model [32,44] is a grid-based hydrology and water resources model that runs at daily resolution. The model is parameterized based on only global datasets and fed by meteorological forcing data, i.e., precipitation, temperature and reference potential evapotranspiration (PET). PCR-GLOBWB simulates spatial and temporal continuous fields of various fluxes of the hydrological cycle, e.g., evaporation, runoff, and groundwater recharge, as well as human water use. The latter includes surface water and groundwater abstraction that is estimated internally within the model based on the simulation of their availabilities and water demands for irrigation and other sectors [45]. The TWS of PCR-GLOBWB consists of several water storage components, including snow, interception, soil moisture, groundwater, and surface water (lakes, reservoirs, rivers, and inundated water). The groundwater store of PCR-GLOBWB consists of the renewable and non-renewable parts. Both parts are susceptible to groundwater abstraction, but only the renewable part receives groundwater recharge from the soil moisture storage. The non-renewable groundwater is available for abstraction to satisfy water demands once the overlying hydrologically-active renewable groundwater storage is depleted.
In this study, PCR-GLOBWB is forced by the daily precipitation data from the Tropical Rainfall Measuring Mission (TRMM 3B42) [46], and 2 m daily air temperature data from the European Centre for Medium-range Weather Forecasts (ERA-Interim) [47]. The daily PET is calculated based on the Hamon method [48]. The forcing data are resampled to 0.5° × 0.5° spatial resolution to reconcile with the PCR-GLOBWB spatial scale. Similar to [27], the precipitation uncertainties are obtained from the TRMM product [49] while the uncertainties of temperature and potential evapotranspiration are assumed to be 2 °C, and 30% of the nominal potential evapotranspiration value, respectively. The uncertainties of PCR-GLOBWB parameters that are related to the TWS calculation are assumed to be 20% of the range of the nominal values (see Table 1 in [27]). The error magnitudes are selected through trial-and-error, mainly to allow the ensemble growth between updates in the DA process.

2.2.2. CABLE, WGHM, and W3 Models

The CABLE model is the core LSM of the Australian Community Climate and Earth System Simulator (ACCESS) [50] that is used to project the Earth’s climate variation in the longer term, together with making short and medium-range weather forecasts and seasonal predictions globally. This study uses an offline CABLE version that calculates the water storage components every 3 h at 0.5° × 0.5° spatial resolution based on new subgrid-scale soil moisture and groundwater process (CABLE-SSGW, see full details in [34,51]). The model determines the soil water in six different layers by vertically redistributing the soil water based on the modified Richards equation [52]. An unconfined aquifer is located below the soil layers, and the groundwater is modeled with a simple water balance model [52]. The TWS consists of soil moisture, groundwater, snow water equivalent, and canopy storages. The model is forced by the combined forcing data obtained from the TRMM 3B42 and the Global Land Data Assimilation System (GLDAS) products [53]. The TRMM-GLDAS combination is chosen as they deliver the best water storage estimate in Australia (compared to other combination; see [54]).
The WGHM model [35,55,56] calculates the water balance and estimates the storage compartments and its related fluxes daily at 0.5° × 0.5° spatial resolution. WGHM was developed to assess the availability of water resources for historical time series, as well as for climate change scenarios. The model calculates water fluxes and storages on the global land area (except Antarctica and Greenland) considering both the natural hydrological cycle and its anthropogenic alterations. This study uses the most recent development of WGHM (version 2.2c), and the model is forced by the forcing data from the WATCH Forcing Data methodology applied to the ERA-Interim data (WFDEI) [57] and the Climatic Research Unit (CRU) using precipitation, temperature, and short-wave and long-wave downward radiation. WGHM is calibrated against observed long-term annual streamflow observations at 1319 stations worldwide, and the model constructs TWS using the storages of soil, groundwater, snow, canopy, and surface water (reservoir, lake, river, and wetland). The model also parameterizes the water withdrawal and water consumption from five different sources: irrigation, domestic, manufacturing, livestock, and cooling water use for thermal power plants, with the first three sectors using surface water and groundwater resources, and the latter two using only surface water resources. Comprehensive model descriptions can be found in [35].
The W3 model is a global water balance model based on the landscape component of the Australian Water Resource Assessment system (AWRA-L) [58]. The model is a grid-based, one-dimensional ecohydrological model that simulates water stores and flows in the soil, vegetation, and local catchment groundwater system. Version 1 of the W3 model with uncalibrated parameters is used in this study. The TWS simulated in W3 is the integration of surface water, soil moisture, unconfined groundwater, snow, and vegetation water storage. The model partitioned the unsaturated soil layers into three layers, namely the near-surface soil layer, the shallow, and the deep root layer. The groundwater balance is developed based on a simple model with recharge from deep drainage, capillary rise, evaporation from groundwater saturated areas and discharge into streams. The groundwater withdrawal module is currently not available in W3. The meteorological inputs of W3 are gridded 0.5° daily total precipitation, short-wave and long-wave downward radiation, air temperature, wind speed, surface pressure, and snow rate from WFDEI. The parameter values and comprehensive model description can be found in the model technical documentation [58].

2.3. In Situ Groundwater Data

In Australia, the monthly in situ groundwater level data are collected from the Australian Bureau of Meteorology through the Australian Groundwater Explorer. There are more than 870,000 monitoring bores distributed unevenly across the continent. Individually, these bores provide a point-scale measurement of the groundwater level. At the individual bore, the groundwater level measurement is converted to the groundwater level variation (∆GL) by removing the long-term mean computed between 2003 and 2014. The bores with missing data (more than 36 months or no seasonal variations) are excluded. The locations of the groundwater measurement used in this study are shown in Figure 1c. To reconcile with the model spatial resolution, all in situ data inside the same 0.5° × 0.5° grid cells are averaged. Note that the ∆GL data are mainly used in the validation, and they are not converted to groundwater storage due to the uncertain specific yield ( S y ).
In the NCP, monthly groundwater level data is obtained from the Ministry of Water Resources of China (MWRC). The data obtained is the mean groundwater level of eighteen main cities of the NCP (Figure 1b), which are computed based on approximately ~1200 phreatic well observations. The data are available to May 2014. The groundwater level anomalies are computed by removing its long-term mean, and the data are averaged to 0.5° × 0.5° grid cells.

3. GRACE Data Assimilation

The EnKS 3D is used to assimilate the GRACE observation into the PCR-GLOBWB model. The approach is developed based on its successor, EnKF 3D [27], which was used to account for the spatial correlation errors of the model and GRACE observation. Extending from the EnKF 3D, the EnKS 3D considers both spatial and temporal correlations in the DA process. The spatial correlation is computed only between the model neighboring grid cells, which is defined as all model grid cells inside the distance of the GRACE spatial resolution. In this study, the GRACE spatial resolution is assumed to be the same as the applied Gaussian smoothing radius, 250 km. The temporal correlation between the daily state estimates of the month is also considered, which is used to disaggregate the monthly GRACE information into the daily state estimate, i.e., via the temporal correlation included in the Kalman gain matrix.
The EnKS 3D process consists of forecast and update (analysis) steps. In the forecast step, the model (PCR-GLOBWB) is propagated forward in time, and the model state estimates ( ψ ) are related to the GRACE observations by:
d = H ψ + ϵ ,   ϵ ~ N ( 0 , R ) ,  
ψ = [ g i = 1 g i = 2 g i = 3 g i = m ] T | n m p × 1 ,  
where d is an m × 1 vector containing the GRACE observations for the month of interest, ϵ is the observation error,   R is the error covariance matrix of the observation (obtained from Section 2.1, Equation (4)), H is a measurement operator which relates the PCR-GLOBWB state ψ to the observation vector d , g contains daily TWS-related state variables of PCR-GLOBWB of all grid cells ( n × m ), m is the number of model grid cells, n is the number of PCR-GLOBWB state variables (n = 27), and p is the number of day. The subscription i of g is the model grid cell index, where i = 1 represents the center grid cell and i = 2 − m are the neighboring grid cells. As the sum of all daily state elements divided by the number of day (T) is equal to monthly TWS at a given cell, the H matrix is defined as:
H = 1 T [ 1 1 × n p 0 0 0 1 1 × n p 0 0 0 1 1 × n p ] m × n m p ,  
where 1 1 × n p indicates a row vector, which contains 1 in all elements, and 0 is the zero vector with the same dimension.
After the model propagation of N ensemble members for one month, the ensemble states are stored in a matrix A n m p × N = ( ψ 1 , ψ 2 , ψ 3 , , ψ N ) . Similarly, the GRACE observation vector is stored in the matrix D m × N = ( d 1 , d 2 , d 3 , , d N ) . Note here that the observation d is perturbed by the random noise ~ N ( 0 , R ) . Then, the ensemble perturbation matrix is defined as A = A A ¯ , where the matrix A ¯ is the replicate matrix of the mean value (column) vector computed from A . The observation perturbation matrix is defined a similar manner, D = D D ¯ , where D ¯ is the mean value matrix computed from D . The analysis equation can be expressed as [59]:
A a = A + K ( D H A ) ,  
with:
K = P e H T ( H P e H T + R e ) 1 ,  
where A n m p × N a is the updated model state, and K n m p × m is the Kalman gain matrix. The model and observation error covariance matrices P e | n m p × n m p and R e | m × m are computed as:
P e = A ( A ) T / ( N 1 ) ,  
R e = D ( D ) T / ( N 1 ) .  
The daily state variables of the center grid cell are saved, and the EnKS 3D process is applied to all remaining grid cells of the same month. After completing all grid cells, the model is propagated to the next month, and the DA process is repeated until the end of the study period. Note that EnKS 3D adopts the same update approach (spatially) as EnKF 3D. More details and processing diagrams can be found in [27].

4. Results

4.1. Data Assimilation Process and Impact on ∆TWS Estimates

The data assimilation is performed between January 2003 and December 2014 using N = 100 ensemble members. Firstly, the forcing data, parameters, and initial states are perturbed (see the error levels in Section 2.2.1) with the additive Gaussian noise. Then, the ensemble open loop (EnOL) is conducted by independently propagating the model using the N ensemble inputs without assimilating any GRACE data. Note that the mean value of the EnOL result is very close or identical to the nominal run result of PCR-GLOBWB when a sufficiently large ensemble member (e.g., 100) is used in EnOL. Therefore, the term PCR-GLOBWB is used to refer to the EnOL result in this study. For the GRACE DA, the model is also propagated from January 2003 and December 2014, but the GRACE observations (when available) are assimilated.
The ∆TWS estimates over the Gulf of Carpentaria (GOC, Figure 2a), Murray-Darling (MRD, Figure 2b), South West Coast (SWC, Figure 2c), and the NCP (Figure 2d) show that the GRACE DA estimate moves toward the GRACE observation (when available), and the GRACE DA result generally lies in between the PCR-GLOBWB estimates and GRACE observations. As expected, the overall standard error of the GRACE DA estimate is smaller than both model and observation errors. It is noticeable that without assimilating GRACE observation into the hydrological process, the PCR-GLOBWB uncertainty grows considerably in time, which indicates that the model might become unreliable after being propagated for some periods. In addition to the error reduction, GRACE DA has a visible impact on both seasonality and secular trend of the ∆TWS estimates. For example, GRACE DA increases the TWS seasonal amplitude of GOC by ~1 cm, which is ~13% closer to the GRACE observation (Figure 2a). Additionally, inspecting the ∆TWS in all four basins reveals that PCR-GLOBWB underestimates ∆TWS prior to 2007 and overestimates it after 2010. Assimilating the GRACE observation into the system remedies the poor estimates by adding more water into the basin between 2003 and 2007 and subtracting it after 2010. Consequently, GRACE DA alters the secular change of ∆TWS, leading to a closer long-term trend estimate to the GRACE observation, i.e., reducing from 0.2 cm/year (PCR-GLOBWB) to −0.3 cm/year (GRACE DA), compared to −0.4 cm/year (GRACE) in SWC (Figure 2c). The change in the long-term trend estimates indicates that PCR-GLOBWB likely underestimates the water storage loss in Australia and the NCP. More analysis of the long-term trend estimate is given in Section 4.3.2.

4.2. Evaluation of ∆TWS Estimates

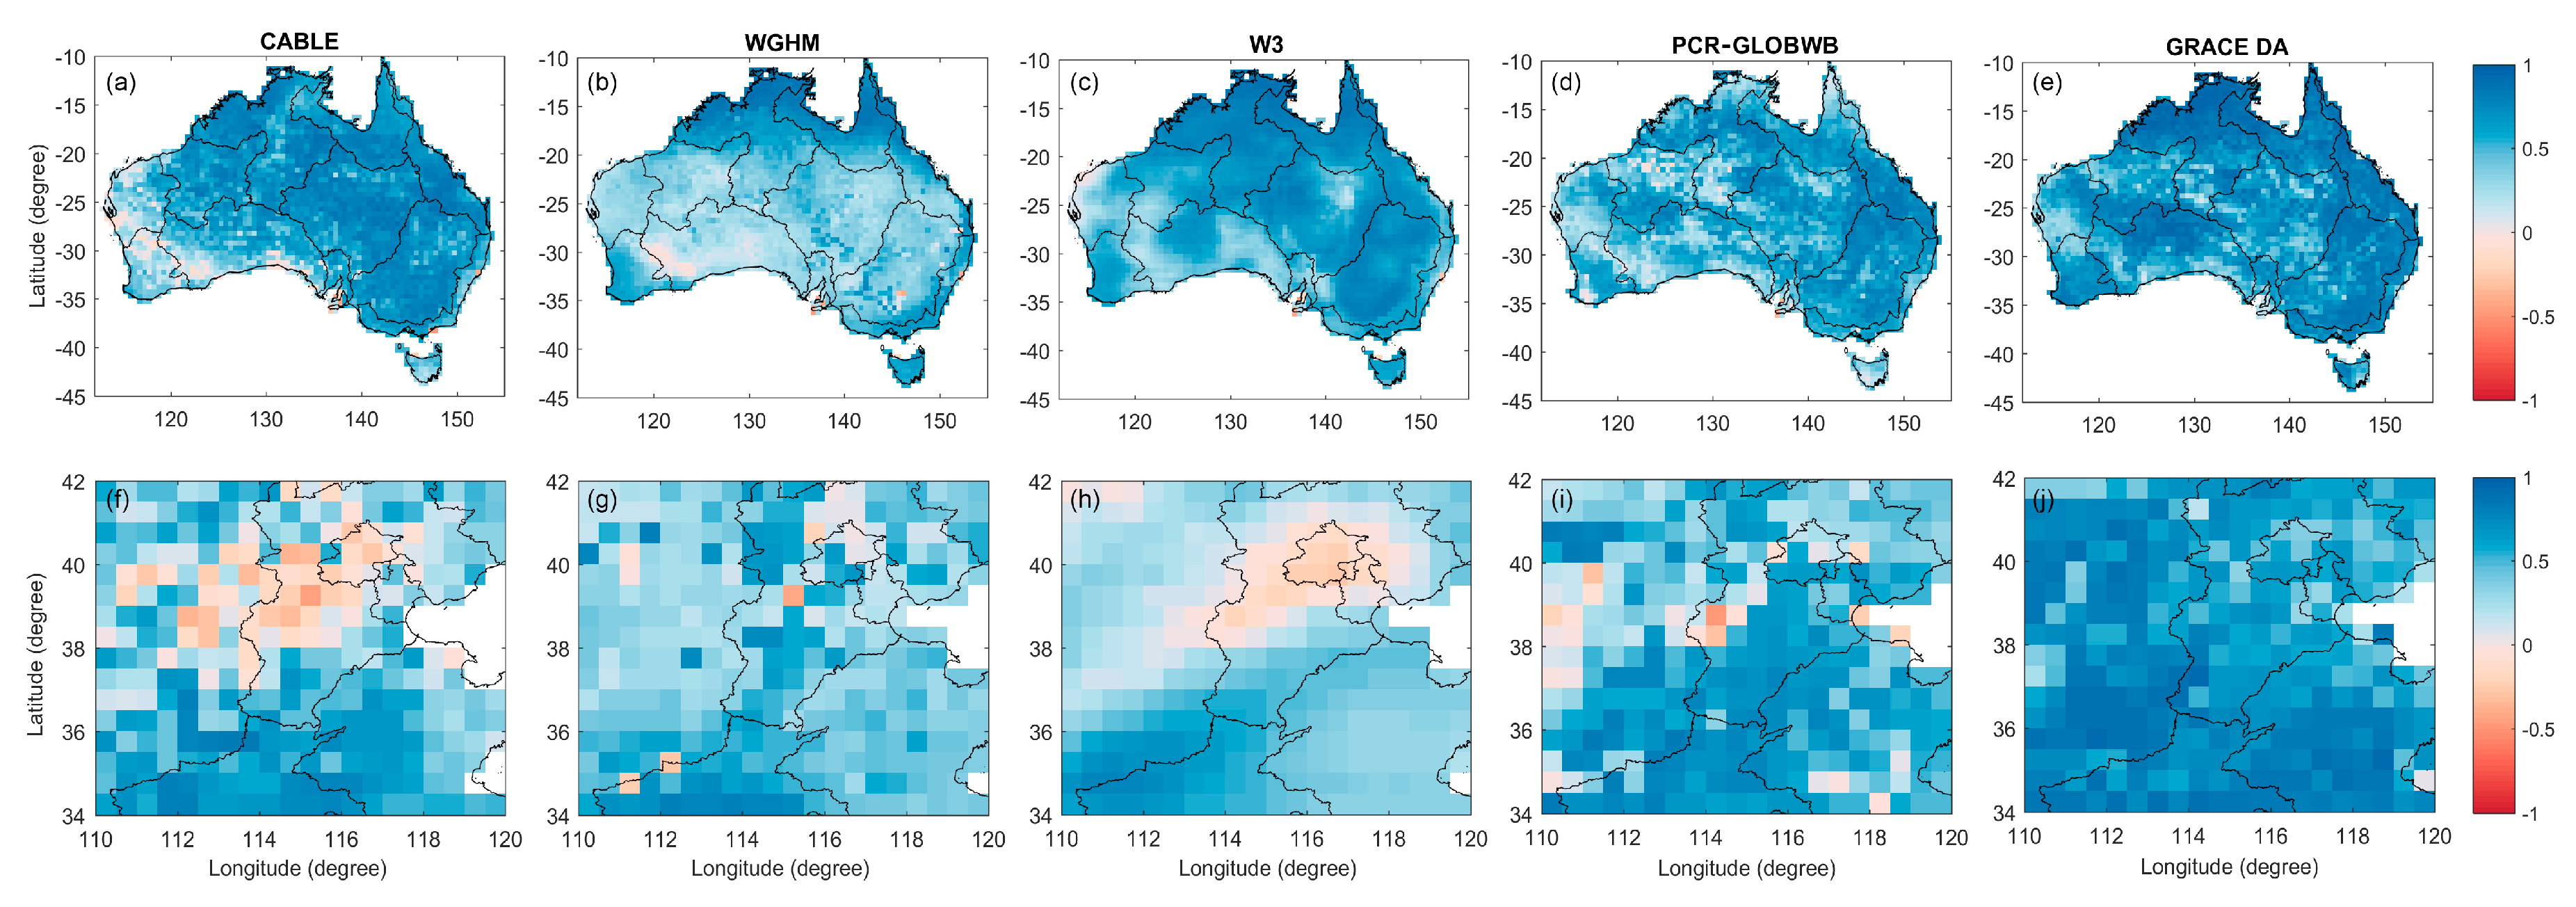
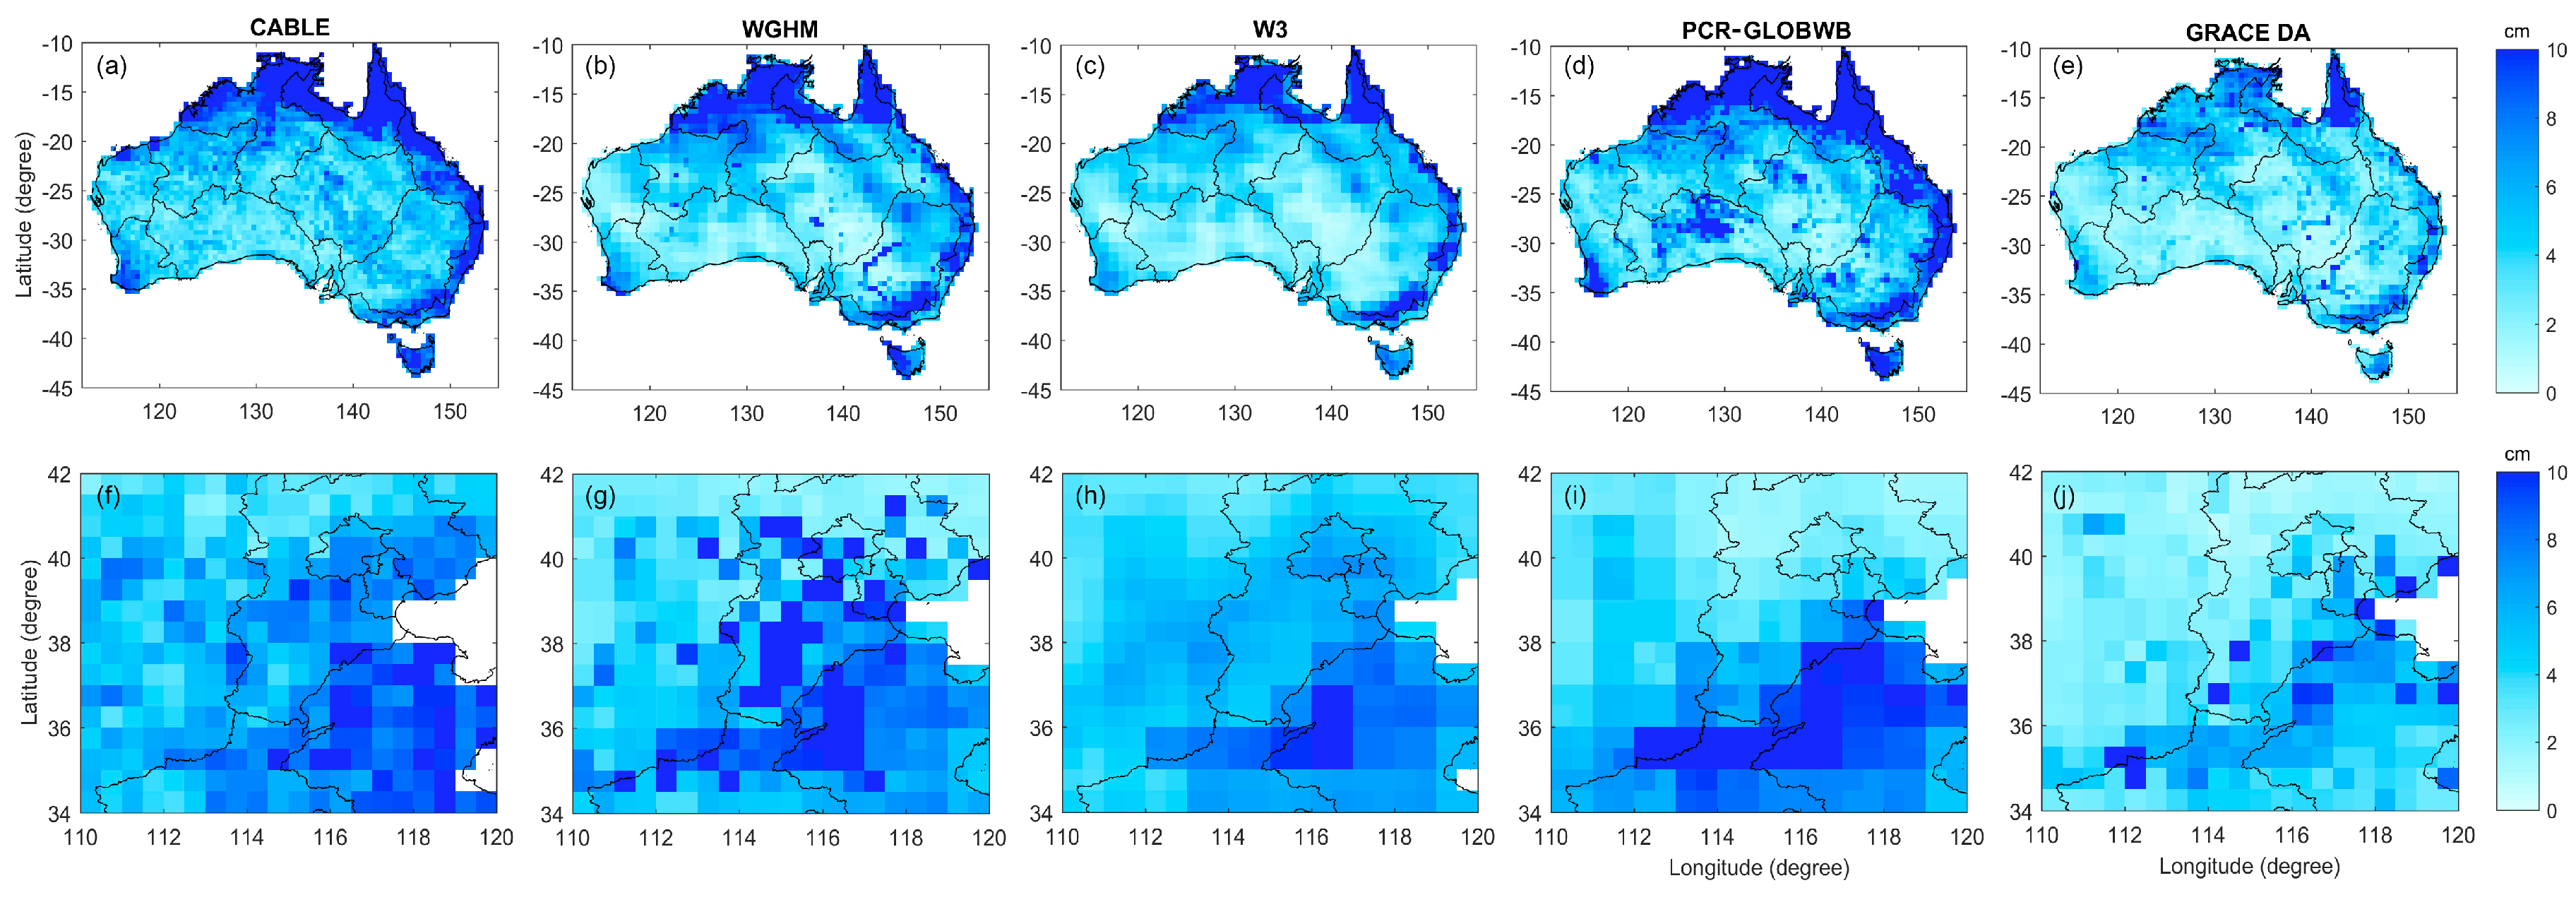
The ∆TWS estimates from four LSMs and GRACE DA are compared with the GRACE observation to provide a qualitative overview of the ∆TWS estimate from the four state-of-the-art models, together with the benefit of GRACE DA. The evaluation is conducted based on the temporal correlation (ρ), and the root mean square difference (RMSD) between the model estimates and GRACE observation. The results of ρ and RMSD in Australia and NCP are shown in Figure 3 and Figure 4 while the basin-averaged values are given in Table 1 and Table 2. Due to the coarse spatial resolution of GRACE data, any interpretation of the result on the individual 0.5° grid should be avoided. Therefore, Figure 3 and Figure 4 are only used for the visualization purpose, while the evaluation is mainly based on the basin-averaged statistical value (Table 1 and Table 2).
In terms of correlation, CABLE, W3, and PCR-GLOBWB show the best overall correlation values in Australia (averaged correlation, ρ ≈ 0.6), while WGHM provides lower values (~0.15 lower on average), particularly in the central part of the continent (Figure 3b). In the NCP, PCR-GLOBWB provides the highest ρ value (≈ 0.4), whereas the other three models perform similarly (ρ ≈ 0.3). In the northern part of Australia (e.g., GOC, TIM), CABLE, W3, and WGHM produce the highest ρ (~≥0.7), whereas PCR-GLOBWB provides the lowest correlation. For the NCP, negative values are observed in all models, particularly in CABLE and W3 over Central Hebei (Figure 3f,h). The negative ρ values might be attributed to the intense groundwater pumping activity that might interfere with the timing of the ∆GWS and ∆TWS variation, leading to the anti-correlation. The effect is more severe in CABLE and W3 as the groundwater consumption routine is not included in the groundwater computation. Details on groundwater depletion over NCP are discussed in Section 4.5.
In terms of RMSD, the inconsistency between models’ simulated ∆TWS and GRACE observation is greater in the coastal regions of Australia. A greater RMSD value in the north coastal areas (compared to the inner part of the continent, Figure 4a–d) is likely due to the larger variation of ∆TWS induced by greater precipitation in the monsoon region, as well as the leakage errors from the non-tidal ocean changes over the Gulf of Carpentaria [60,61]. In terms of the overall RMSD, W3 shows the best agreement with GRACE in Australia (Table 2) while the least agreement is seen in PCR-GLOBWB. The large RMSD value of PCR-GLOBWB is due to the overestimated ΔTWS in the northern and eastern basins (e.g., GOC, NEC, SEC, TIM) likely caused by the underestimated PET (see Section 5) and the ineffective calibration of groundwater drainage parameters that produce the over-accumulation of ΔGWS in the regions. The scenario is different in the NCP, where PCR-GLOBWB performs best regarding the overall RMSD. The twice RMSD values (compared to other LSMs) are observed in WGHM over Central Hebei, which is attributed to underestimated groundwater recharge or overestimated groundwater withdrawals (see Section 5).
After assimilating GRACE into PCR-GLOBWB (Figure 3e), the average ρ value of the Australian ∆TWS estimate is improved by 27% (from 0.56 to 0.71). The average ρ value of GRACE DA is greater than of other models, e.g., up to almost twice that compared to WGHM. At the same time, GRACE DA also reduces the RMSD by 114% (compared to PCR-GLOBWB), and the average RMSD is smaller than the other three models (Figure 4e). In NCP, a similar benefit of GRACE DA on the correlation and RMSD improvement is also observed (Figure 3f and Figure 4f). It is not surprising that GRACE DA outperforms all models regarding the inclusion of the GRACE observation in the DA’s ∆TWS computation. However, we emphasize here that the improvement only reflects the success of GRACE data assimilation. The evaluation of the GRACE DA estimate is necessary to assess the quality of the estimates before GRACE DA can be confidently applied into any operational water resource assessment system. The validation of GRACE DA estimate against the in situ data, ∆GWS in particular, is discussed in Section 4.4.

4.3. Seasonality and Long-Term Trends of ∆TWS and ∆GWS Estimates

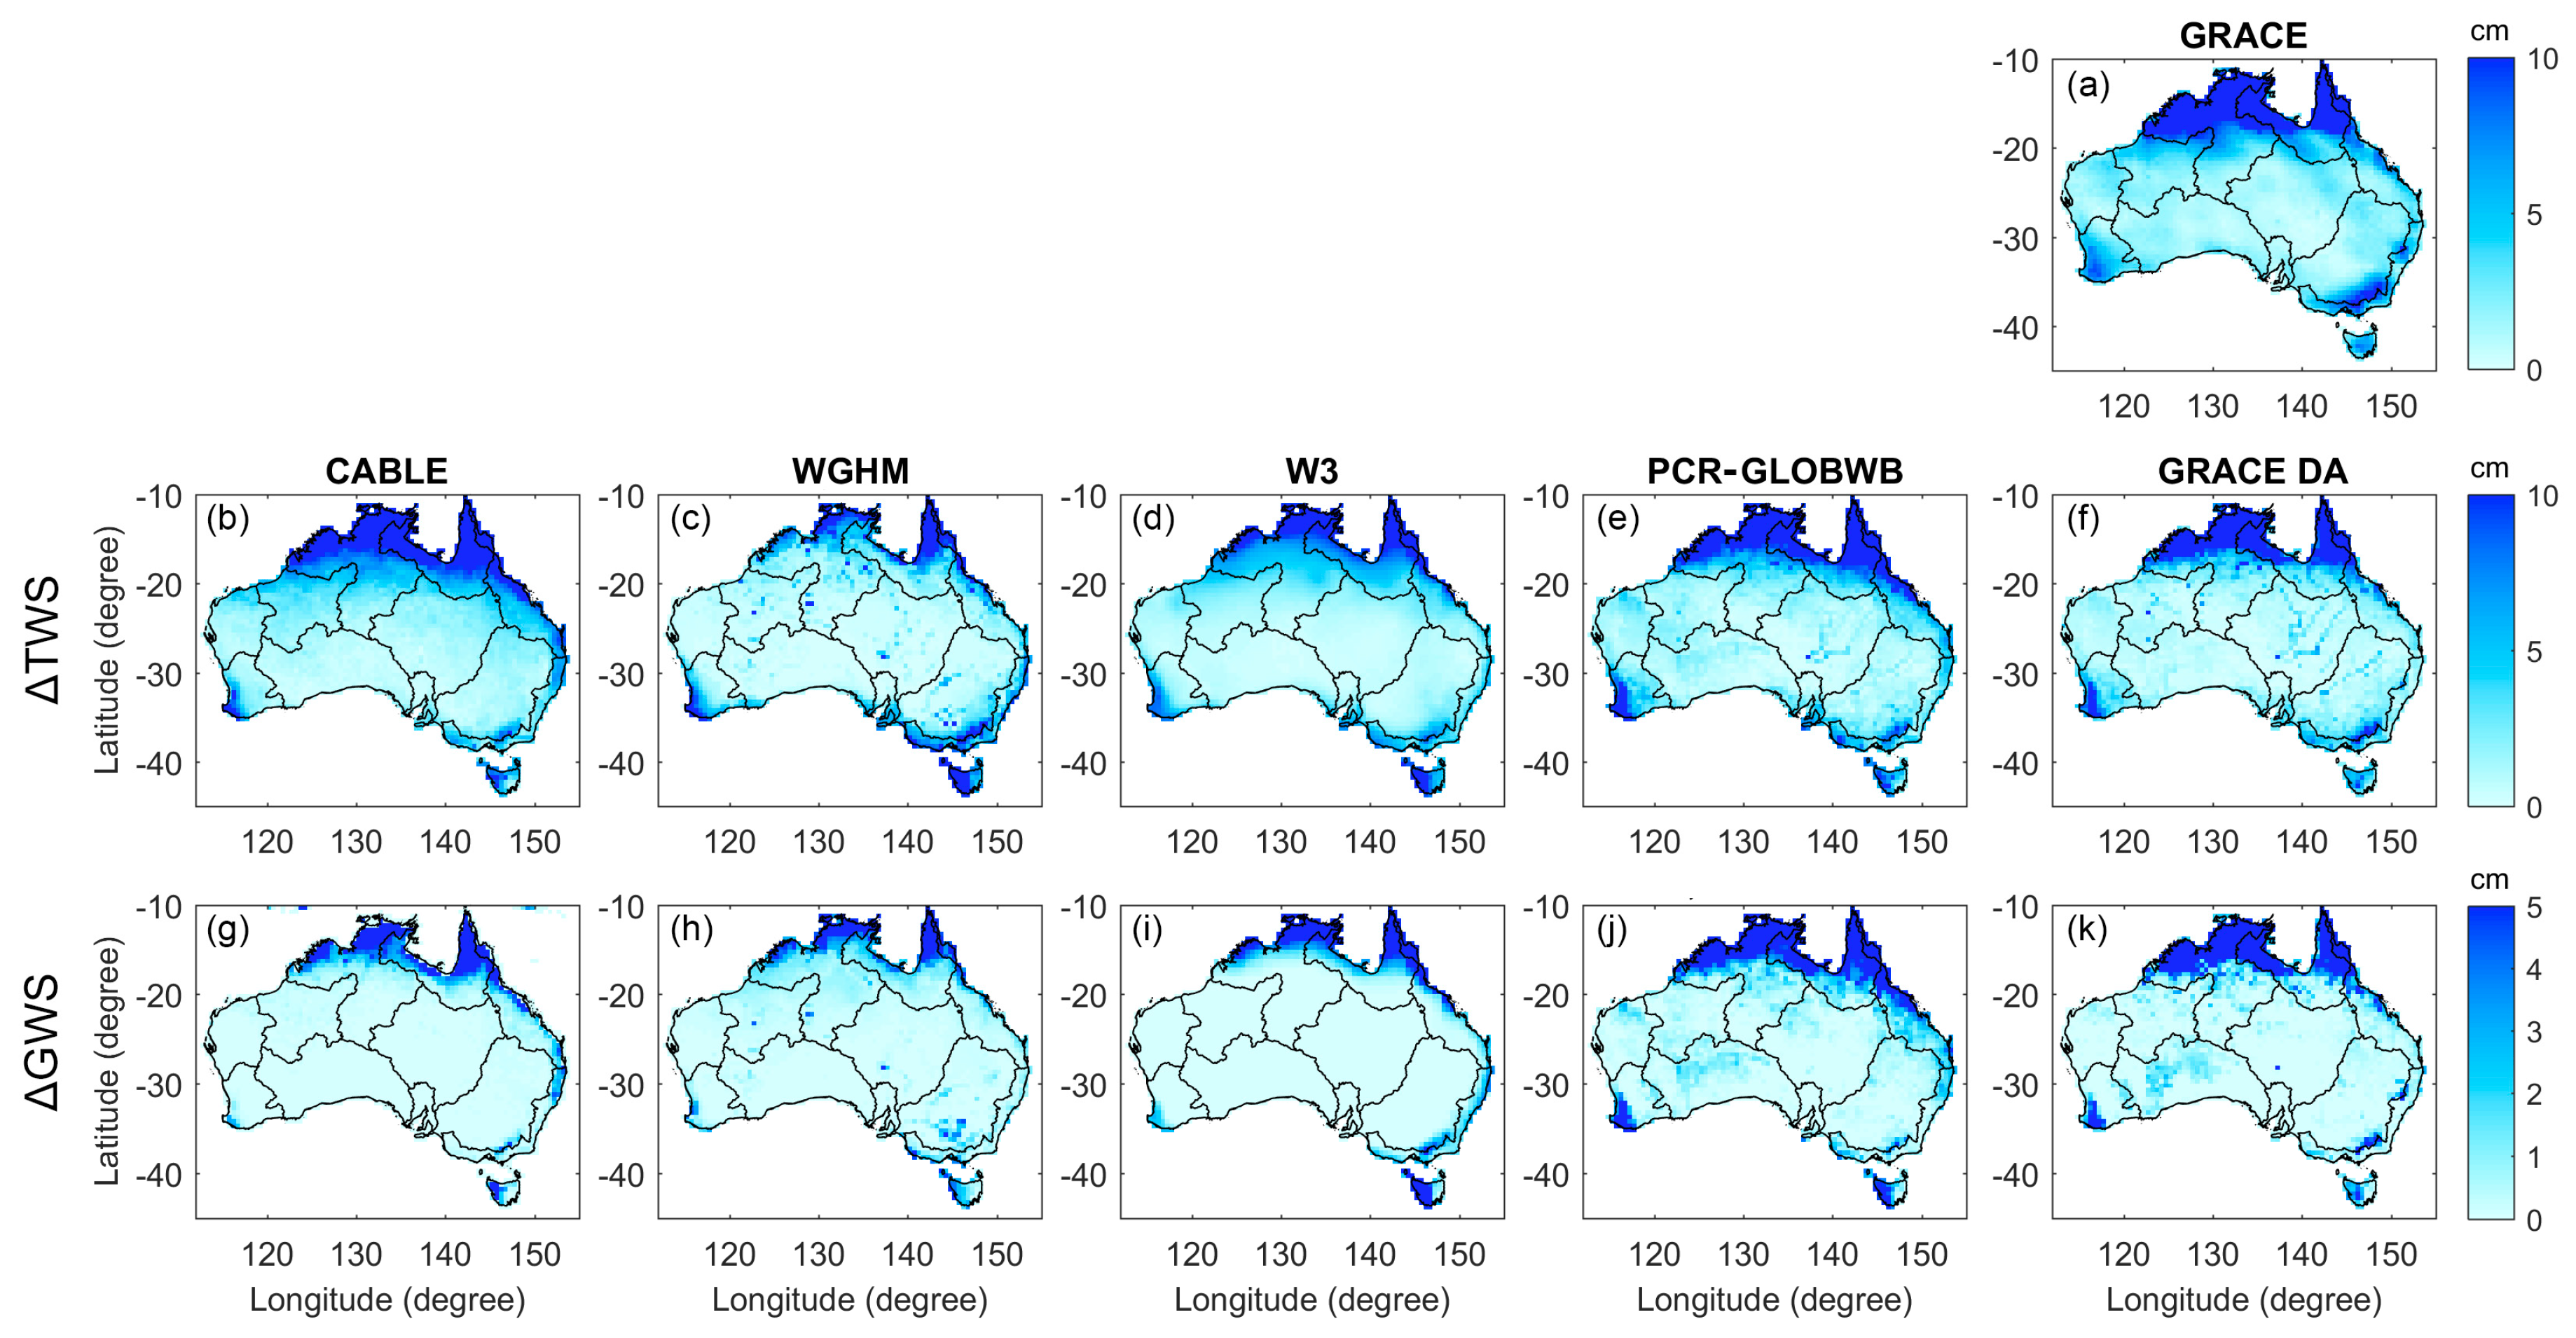
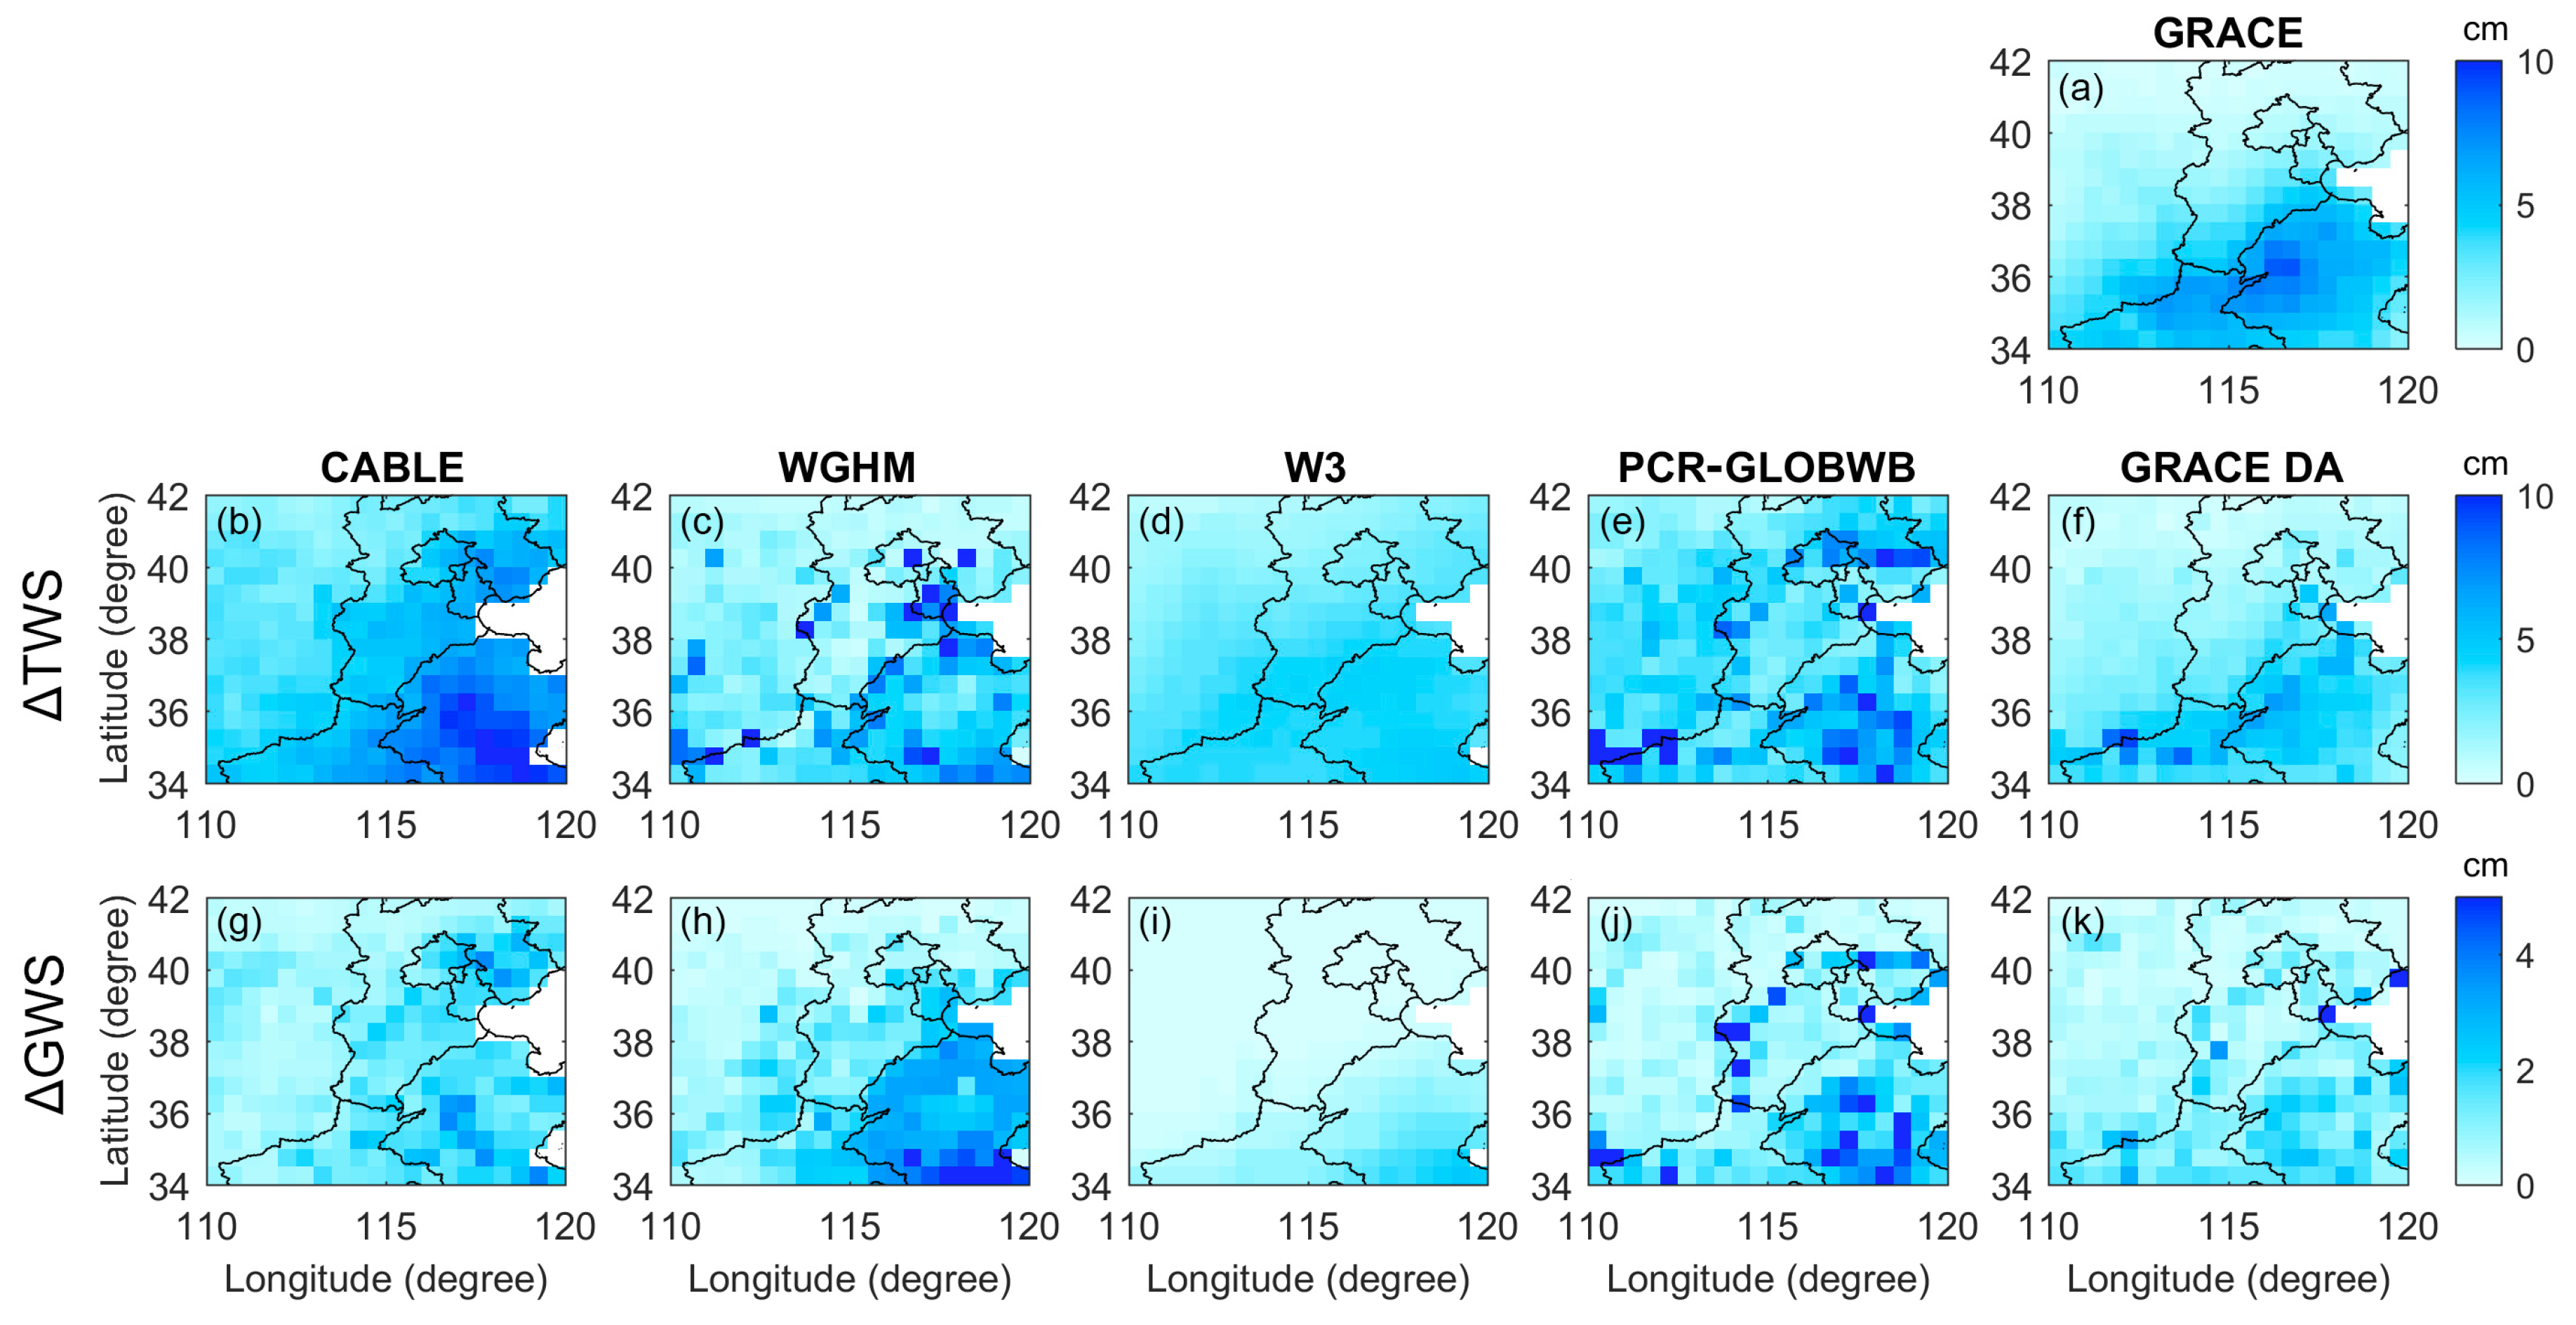
The annual amplitude (Figure 5 and Figure 6) and long-term trends (Figure 7 and Figure 8) of the ∆TWS and ∆GWS estimates in Australia and NCP from four different models and GRACE DA are analyzed in this section to provide the overview of the water storage variation in the past decade, as well as the characteristics of ∆GWS estimated from different models.

4.3.1. Seasonal Variation

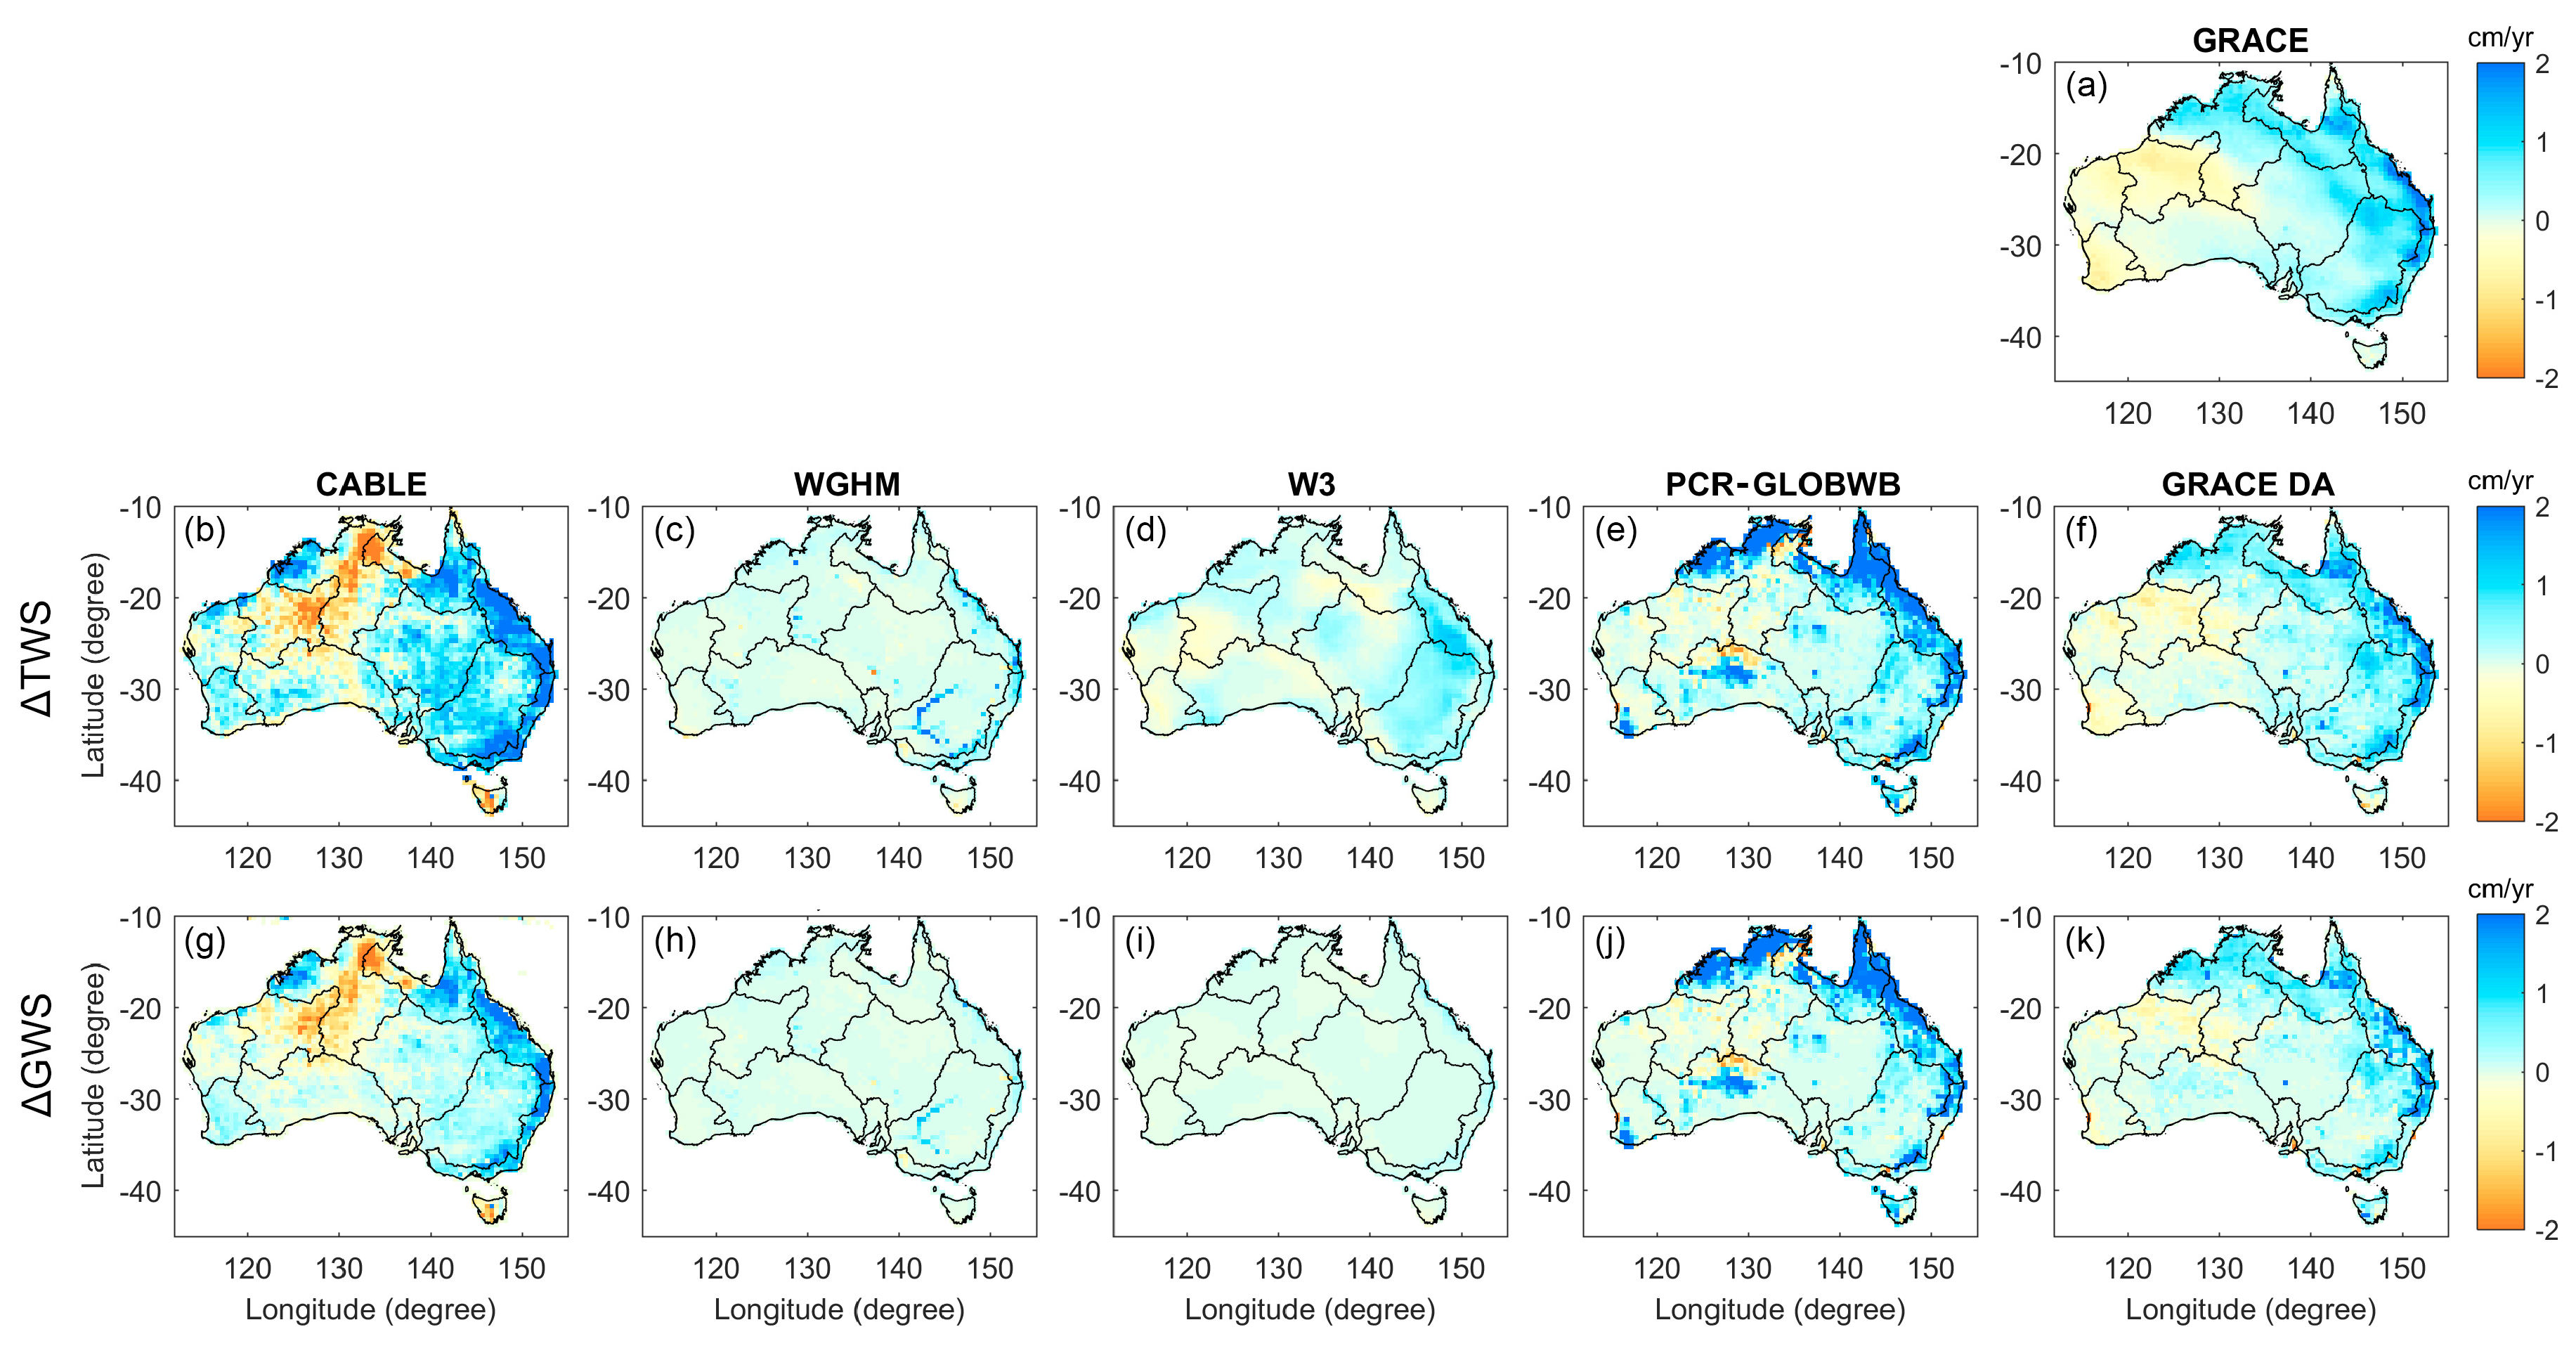
In Australia, the spatial pattern of the ∆TWS annual amplitude of all models is almost similar to the GRACE pattern, stronger in the Northern, Southeastern, and Southwestern Australia, while weaker in the inner part of the continent (Figure 5b–f). A strong seasonal rainfall induced by wet climates, e.g., tropical savanna in the north and humid-subtropical in the east [62], mainly influences the greater ∆TWS amplitude there. WGHM shows the smallest overall ∆TWS variation, which is likely attributed to the maximum soil water storage that is substantially lower than other models (see also supporting information of [63]). Additionally, the ∆GWS estimate exhibits a similar spatial pattern as ∆TWS, but the annual amplitude is approximately 2–3 times smaller (Figure 5g–k), implying considerable contribution from the soil moisture to total storage changes.
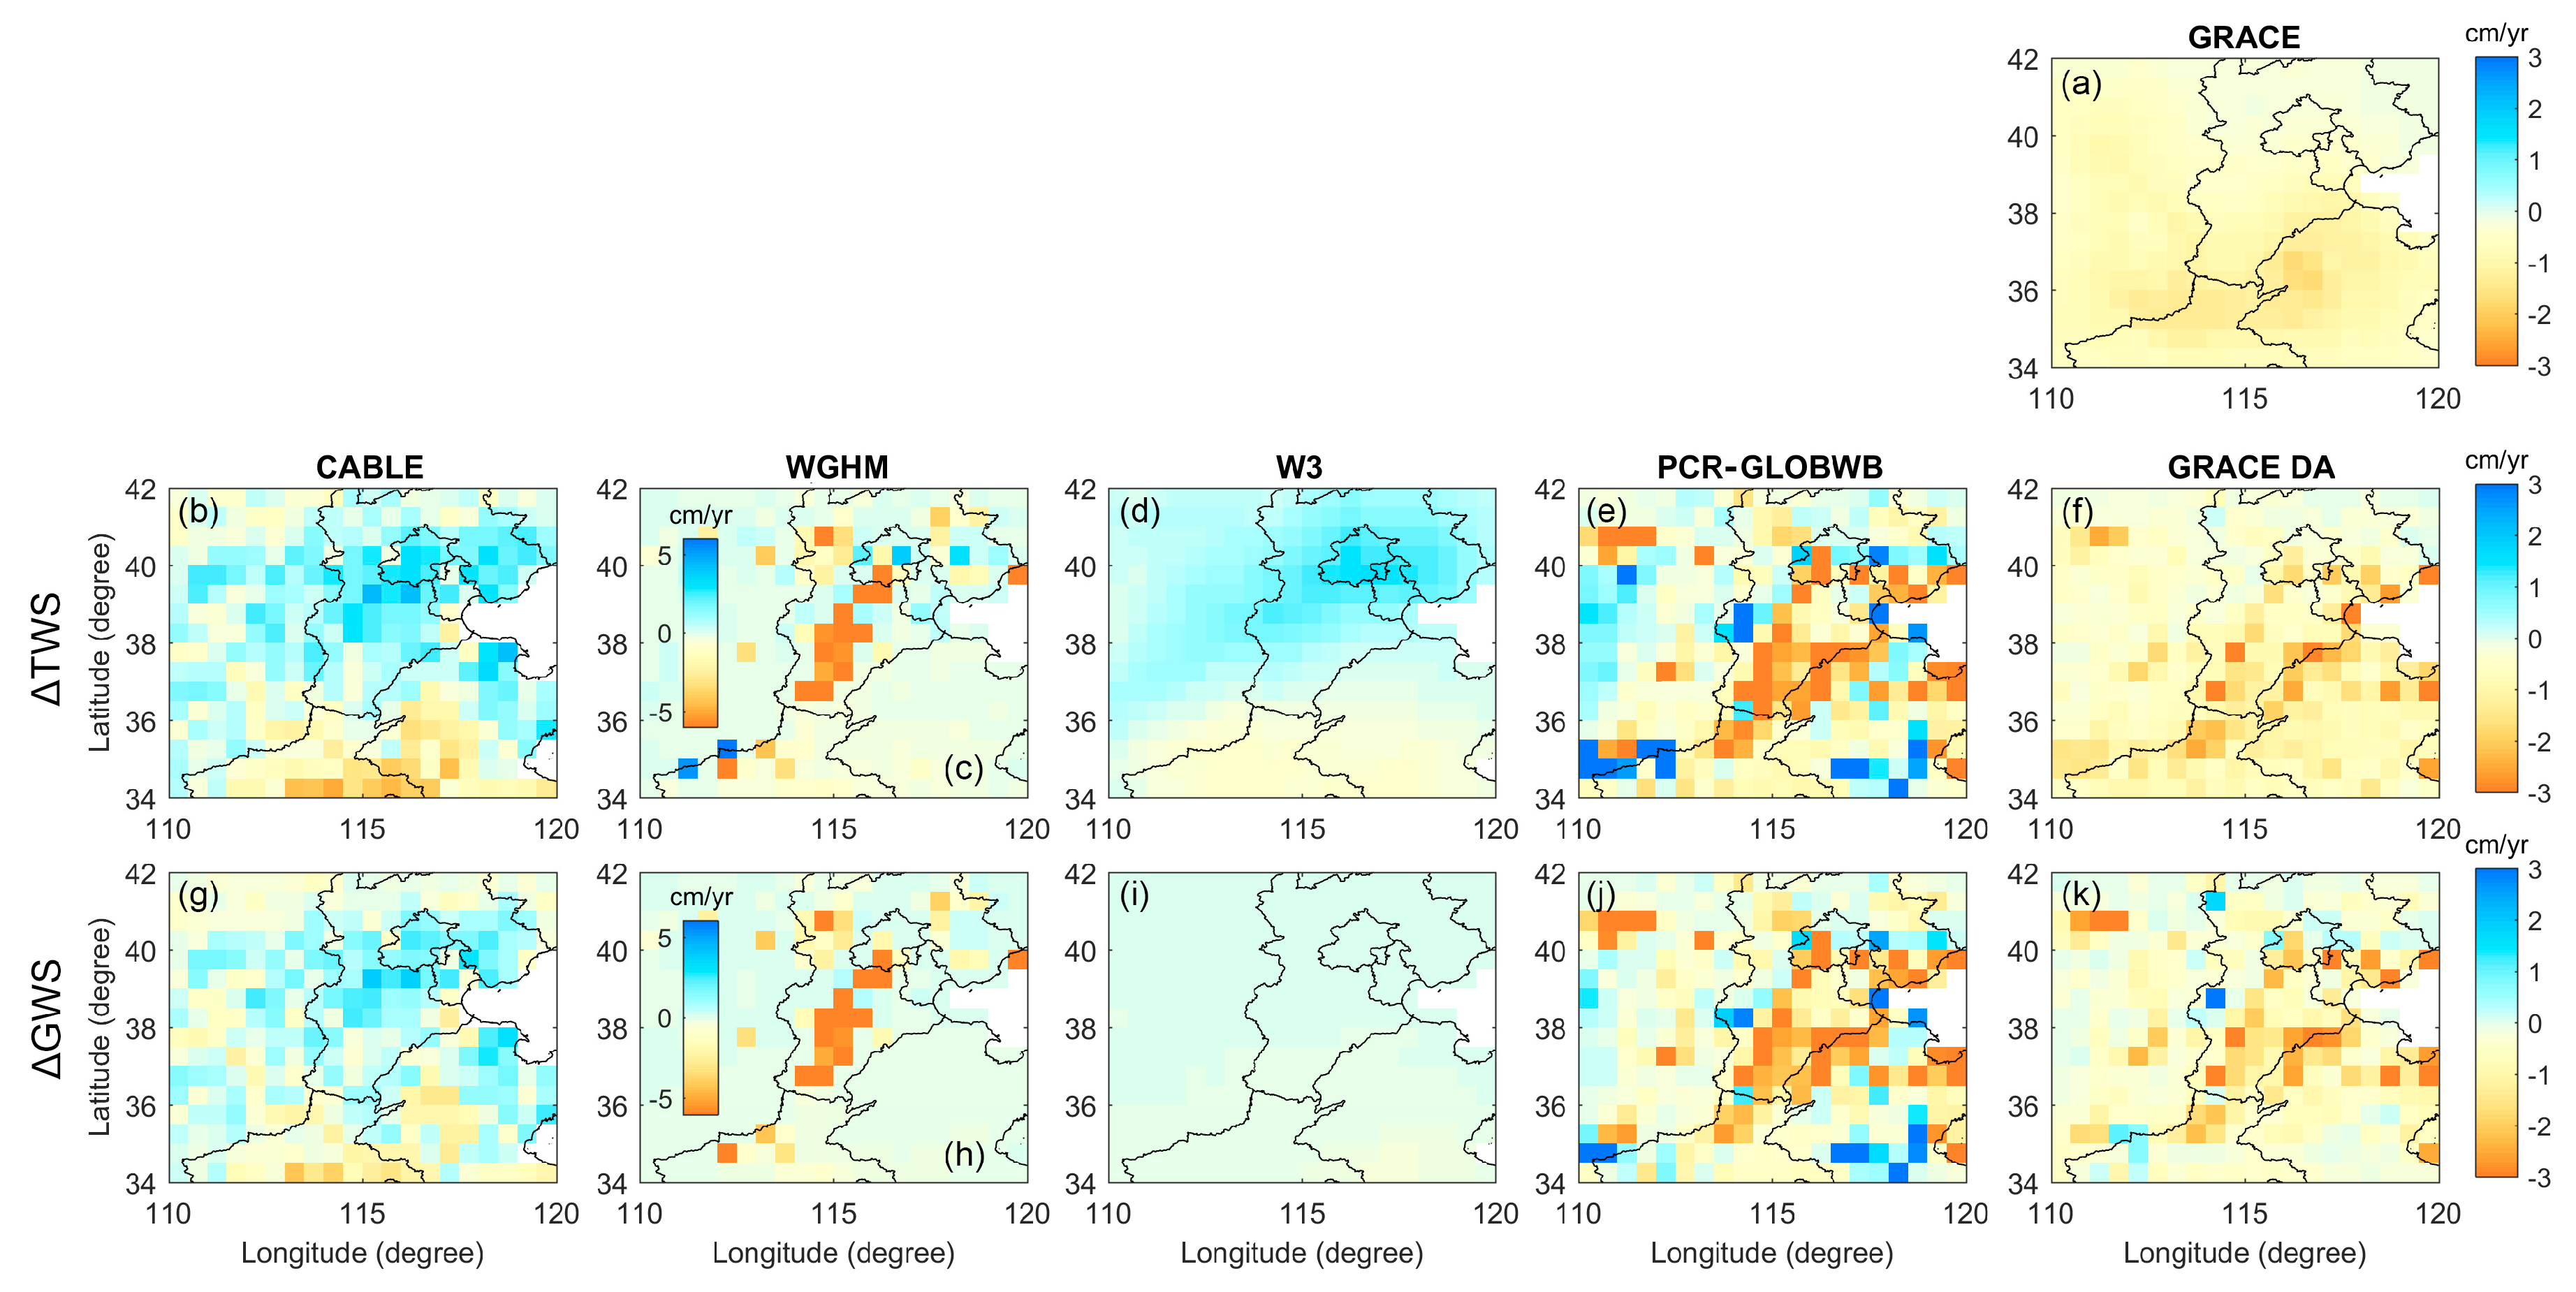
Similar behavior is seen in the NCP (Figure 6), the ∆GWS estimate contributes less than 50% of the ∆TWS annual amplitude. In all model simulations, stronger seasonal variations of ∆TWS and ∆GWS are observed in the south-eastern part of NCP, particularly in Shandong Province where the precipitation’s annual amplitude is approximately 24% greater than the Hebei Province (not shown). Among all models, W3 has a very small ∆GWS spatial variation in the NCP, particularly the ∆GWS annual amplitude is only ~12% of the ∆TWS amplitude. W3 models the unconfined groundwater storage using a one-parameter linear reservoir equation. The groundwater store does not have physical depths, and the uncalibrated field capacity (~1000 mm) for the deep soil component is used. Therefore, the groundwater storage is enclosed in the deep soil storage when the distributing water does not reach the default field capacity. In such a case, groundwater recharge is not generated, and the groundwater storage becomes very small.
The inaccurate ΔGWS estimate seen in WGHM is likely caused by an improper value of an empirically parameter-controlled runoff volume ( γ , see Equation (A11) in [56]). In Australia, the γ value is generally calibrated to nearly a maximum value, leading to the underestimated groundwater recharge and storage. However, the value is lower in all coastal areas of Australia, where a better agreement (e.g., with in situ data) is found. Additionally, in the semi-arid and arid regions, WGHM allows the groundwater recharge only when a daily precipitation value of 12.5 mm is reached. If this is not the case, the calculated groundwater recharge leaves the soil as runoff, contributing to a very small variation of the ΔGWS component. In the upcoming WGHM model version, the calculated groundwater recharge is kept in the soil in such cases. In the NCP, the γ value is set very low (a large portion of soil water recharges groundwater or runoff), but still underestimated groundwater recharge occurs.
Assimilating GRACE into PCR-GLOBWB has a clear impact on the ∆TWS and ∆GWS annual amplitudes in both regions. In Australia (Figure 5f,k), the ∆TWS and ∆GWS patterns are clearly led by GRACE. GRACE DA reduces the ∆GWS annual amplitude in NEC, SWC by >50%, and the northern part of MRD while it increases the amplitude in the southern part of MRD, SWP, GOC, and TIM (~20%). A similar effect is also observed in the NCP, where GRACE DA reduces the overestimated annual amplitude of ∆TWS (and ∆GWS) in all provinces (see, e.g., Figure 6e vs. Figure 6f), leading to a closer spatial pattern to the GRACE observation. A clear impact of GRACE on the ∆GWS spatial pattern confirms that the GRACE DA successfully distributes the gravity information into the groundwater store. A similar finding can be seen in the GRACE DA literature (e.g., [17,30]).

4.3.2. Long-Term Trend Estimates

The long-term trend of ∆TWS and ∆GWS from four model simulations, GRACE observation, and GRACE DA in Australia and the NCP are shown in Figure 7 and Figure 8, respectively. In Australia (Figure 7), CABLE and PCR-GLOBWB show a distinct secular trend of ∆GWS (as well as ∆TWS) while WGHM and W3 show a much smaller trend. The spatial pattern and the magnitude of the ∆GWS trend almost resemble the ∆TWS trend, indicating that the long-term change of the water storage in Australia mainly stems from groundwater. Compared to GRACE, CABLE shows the most comparable spatial pattern of the ∆TWS trend estimate, particularly in the NWP where CABLE and GRACE observe the negative trend of ca. −0.6 cm/year and ca. −0.4 cm/year, respectively, while PCR-GLOBWB and other models fail to capture the decreasing ∆TWS in this basin. However, the inaccurate ∆TWS trend estimates are still observed from CABLE in several regions, e.g., IND, and SWC. Furthermore, PCR-GLOBWB shows a reasonable ∆TWS spatial feature in northern and eastern coastal regions, but the long-term trends are overestimated by several times compared to GRACE (attributed to incorrect parameters (Section 4.2) and forcing data; see also Section 5). After assimilating GRACE data into PCR-GLOBWB, the spatial patterns of ∆TWS and ∆GWS trends become closer to the GRACE pattern (Figure 7f,k vs. Figure 7a). GRACE DA reduces the trend estimate in NEC from 4.9 cm/year to 1.1 cm/year (compared to GRACE, 1.0 cm/year) while increasing the depletion trend in NWP from −0.2 cm/year to −0.3 cm/year (compared to GRACE, −0.4 cm/year). GRACE DA also resolves the ambiguous increasing trend in SWP, which is likely caused by the ineffective calibration of the groundwater discharge generation, causing the accumulation of ∆GWS in the region.
In the NCP (Figure 8), except W3, the ∆GWS trend of all models almost resemble the ∆TWS pattern. This behavior is already seen in Australia, which emphasizes again that the trend of the ∆TWS estimate is mainly dominated by the ∆GWS trend. PCR-GLOBWB and WGHM detect the negative ∆GWS trends in Hebei Province, while CABLE and W3 cannot observe such features. The negative ∆GWS trend in this area is mainly induced by the excessive demand of groundwater required for agriculture during the 2003–2009 rainfall deficiency period ([11], see also Section 4.5). Apparently, a missing groundwater consumption component in the water storage calculation (e.g., in CABLE and W3) leads to the failure of groundwater depletion modeling. However, albeit the inclusion of groundwater demand component, it is found that PCR-GLOBWB and WGHM overestimate the ∆TWS trend in Hebei Province (comparing with GRACE) by approximately two and four times, respectively. After assimilating GRACE into PCR-GLOBWB, the estimated ∆TWS trend becomes closer to the GRACE trend (−0.5 cm/year). The ∆TWS trend of the Hebei province is reduced from −1.0 cm/year to −0.7 cm/year, and the ∆GWS trend is reduced from −1.1 cm/year to −0.7 cm/year. Undeniably, the instantaneous trend correction delivered by GRACE DA highlights its potential function on the improved ∆TWS (and ∆GWS) trend estimate. The evaluation of the ∆GWS trend estimate, particularly over areas with substantial groundwater demand, will be separately discussed (Section 4.5).

4.4. Validation of ∆GWS Estimates

4.4.1. Validation of ∆GWS Estimates against In Situ Data

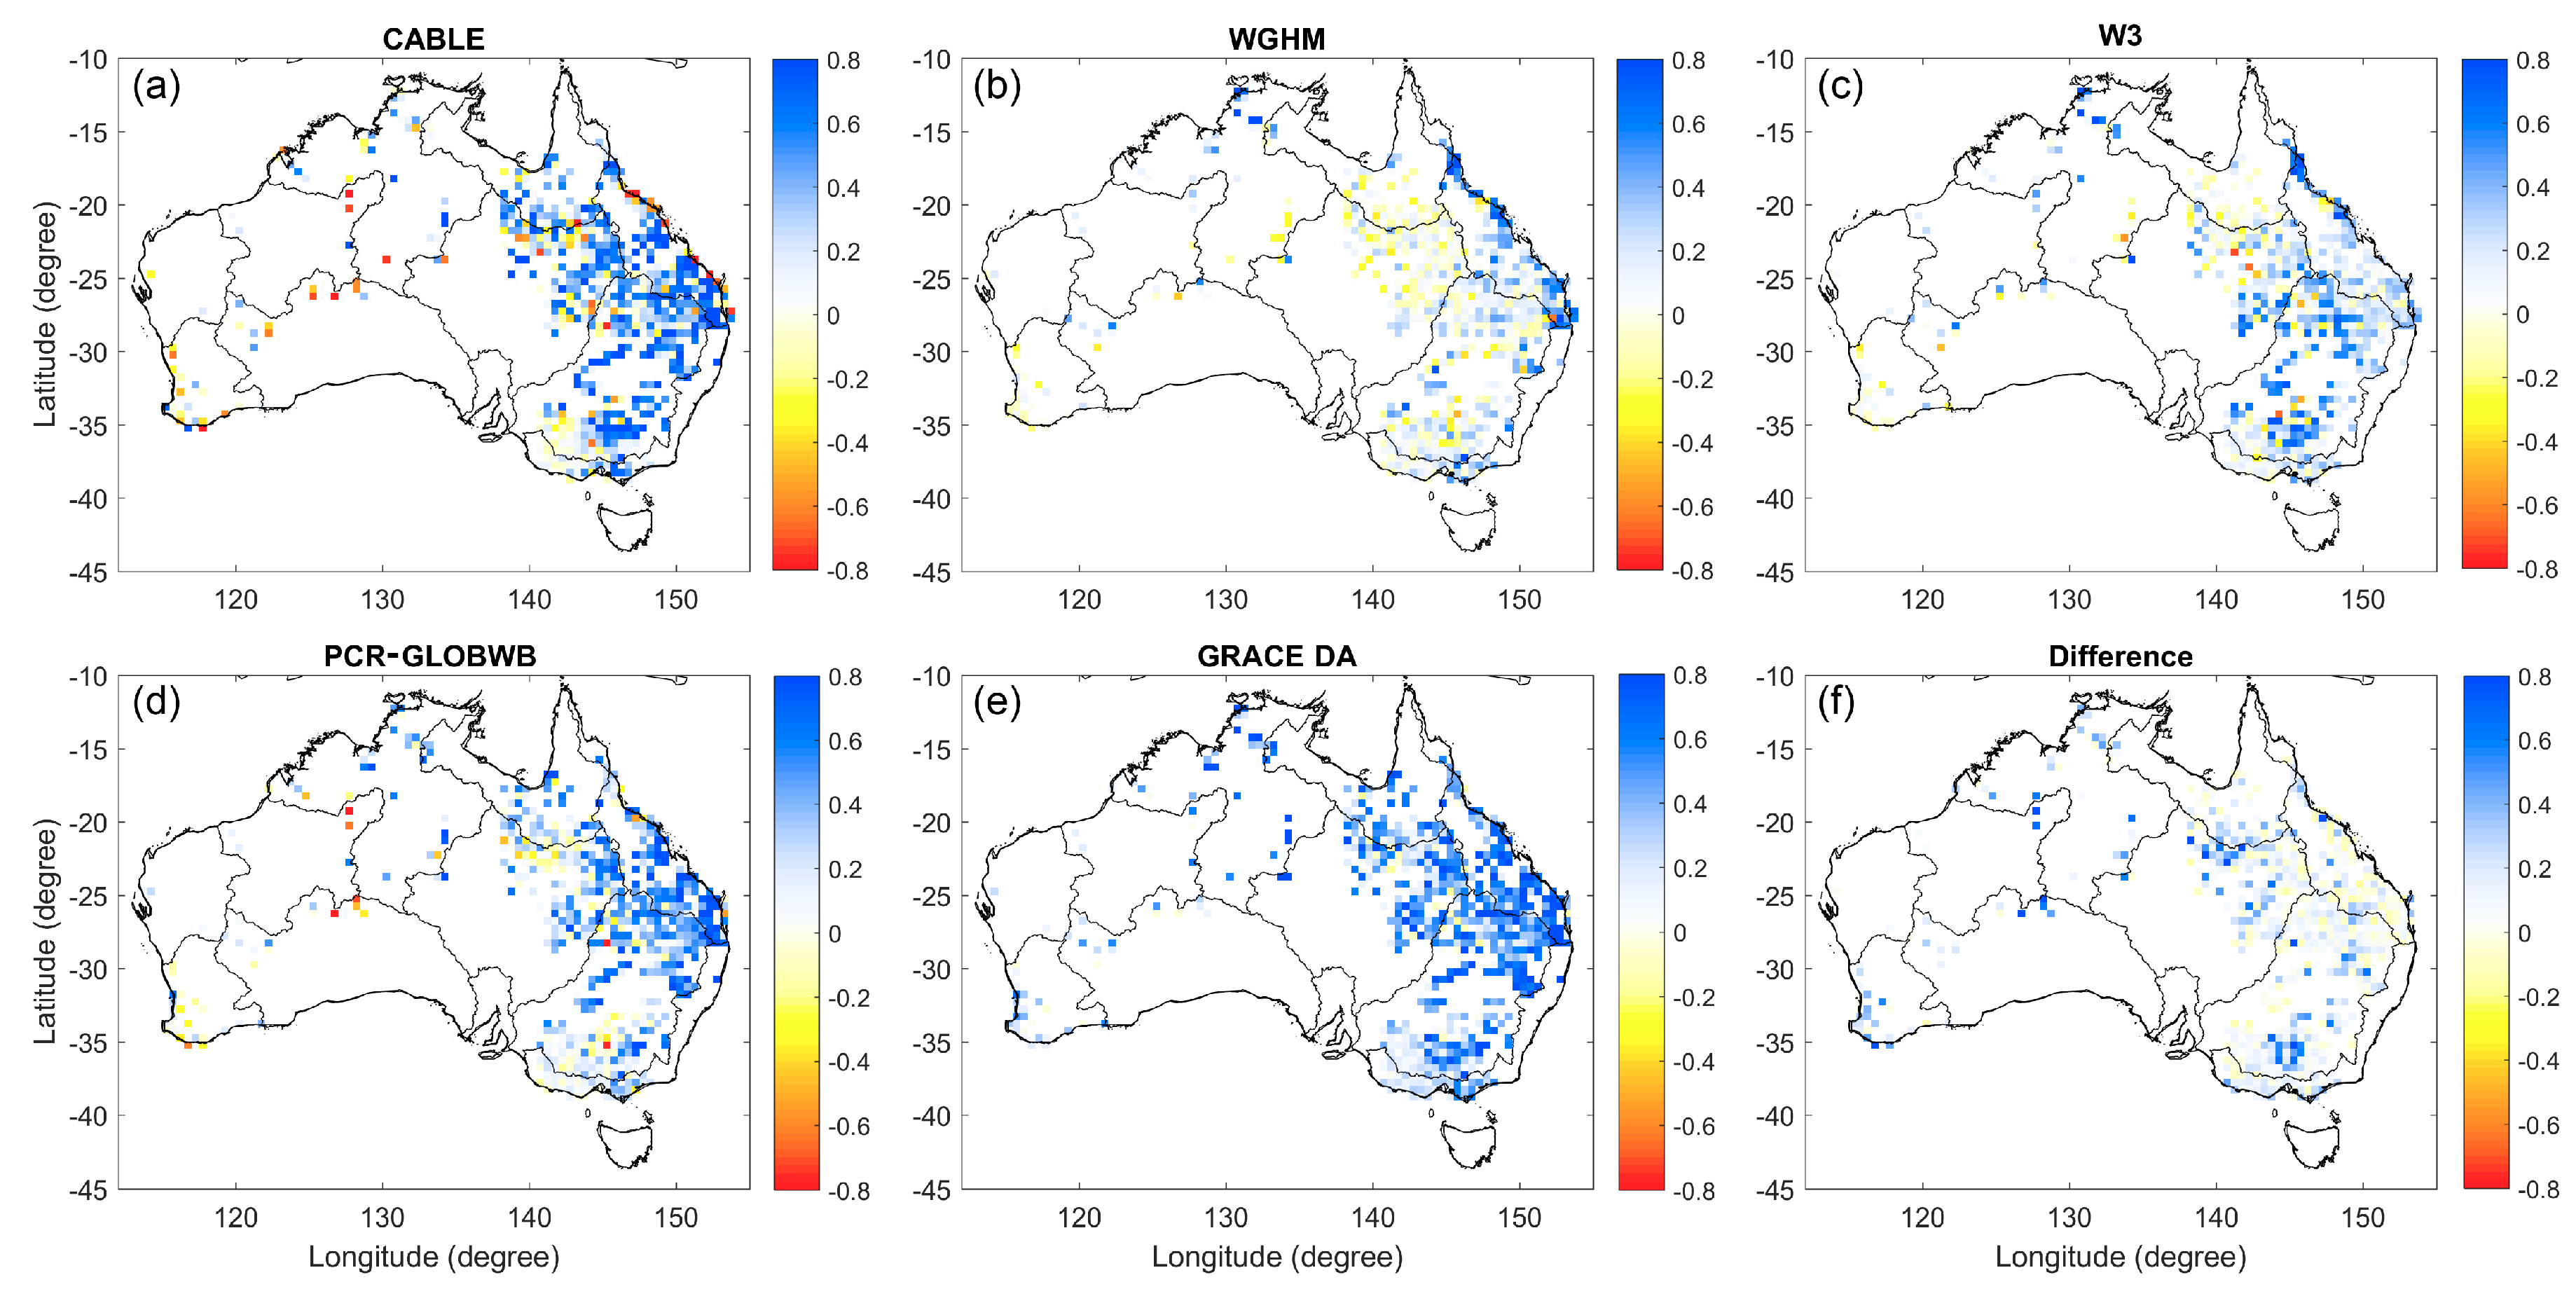
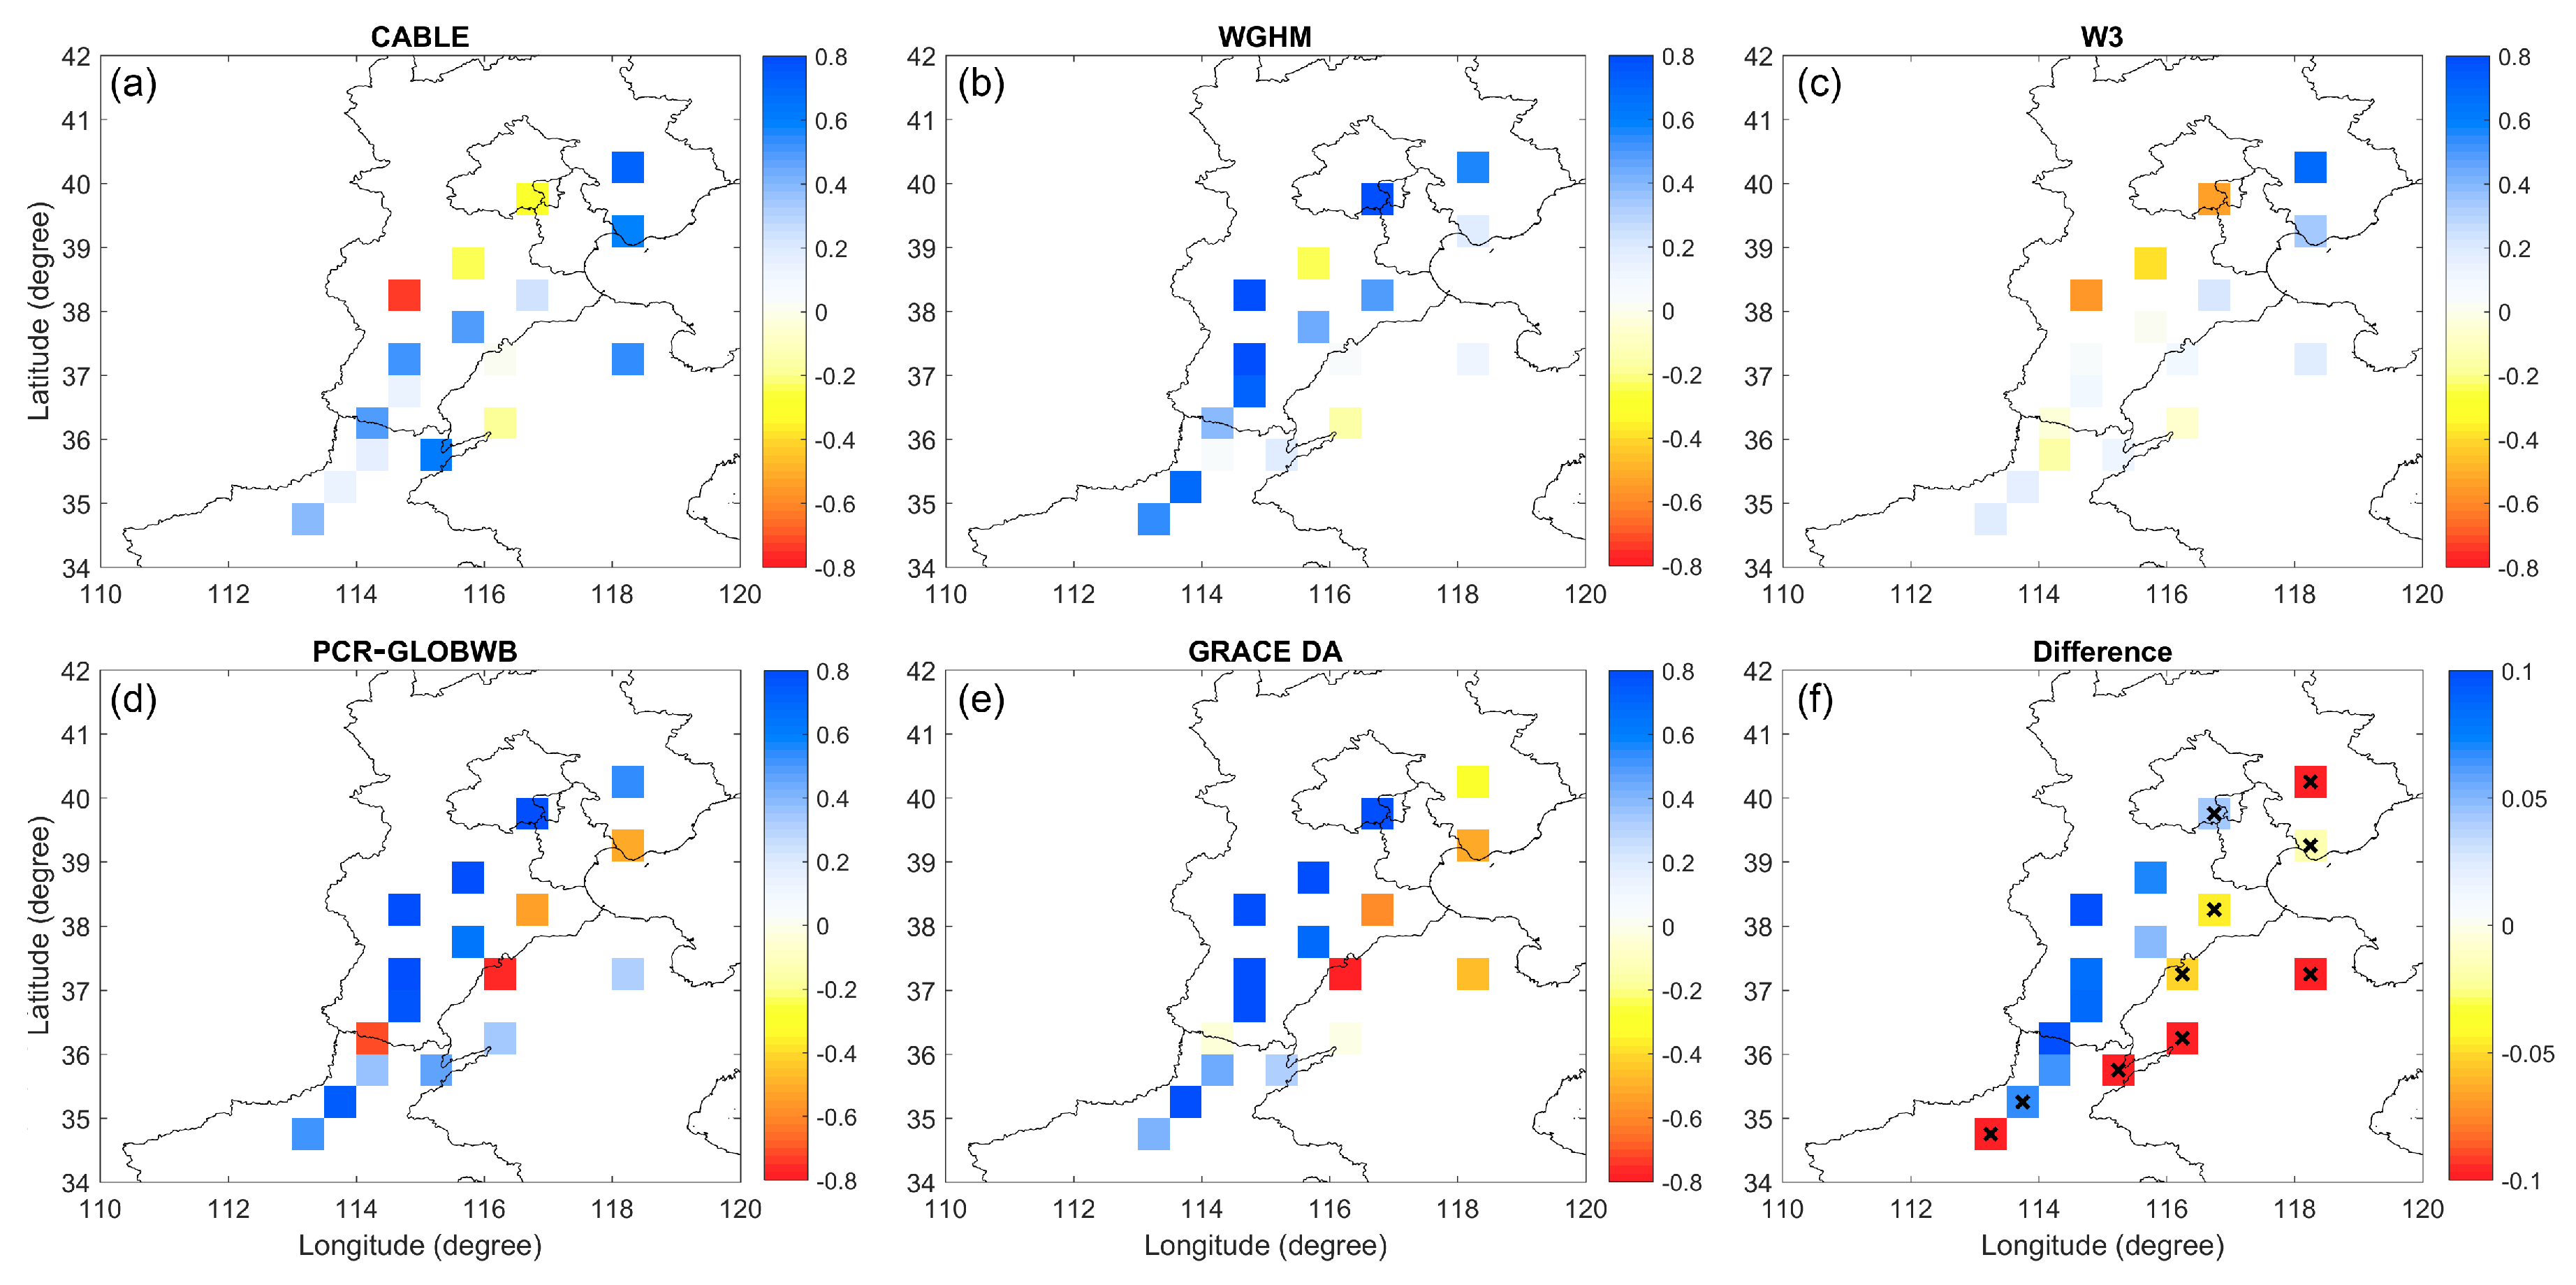
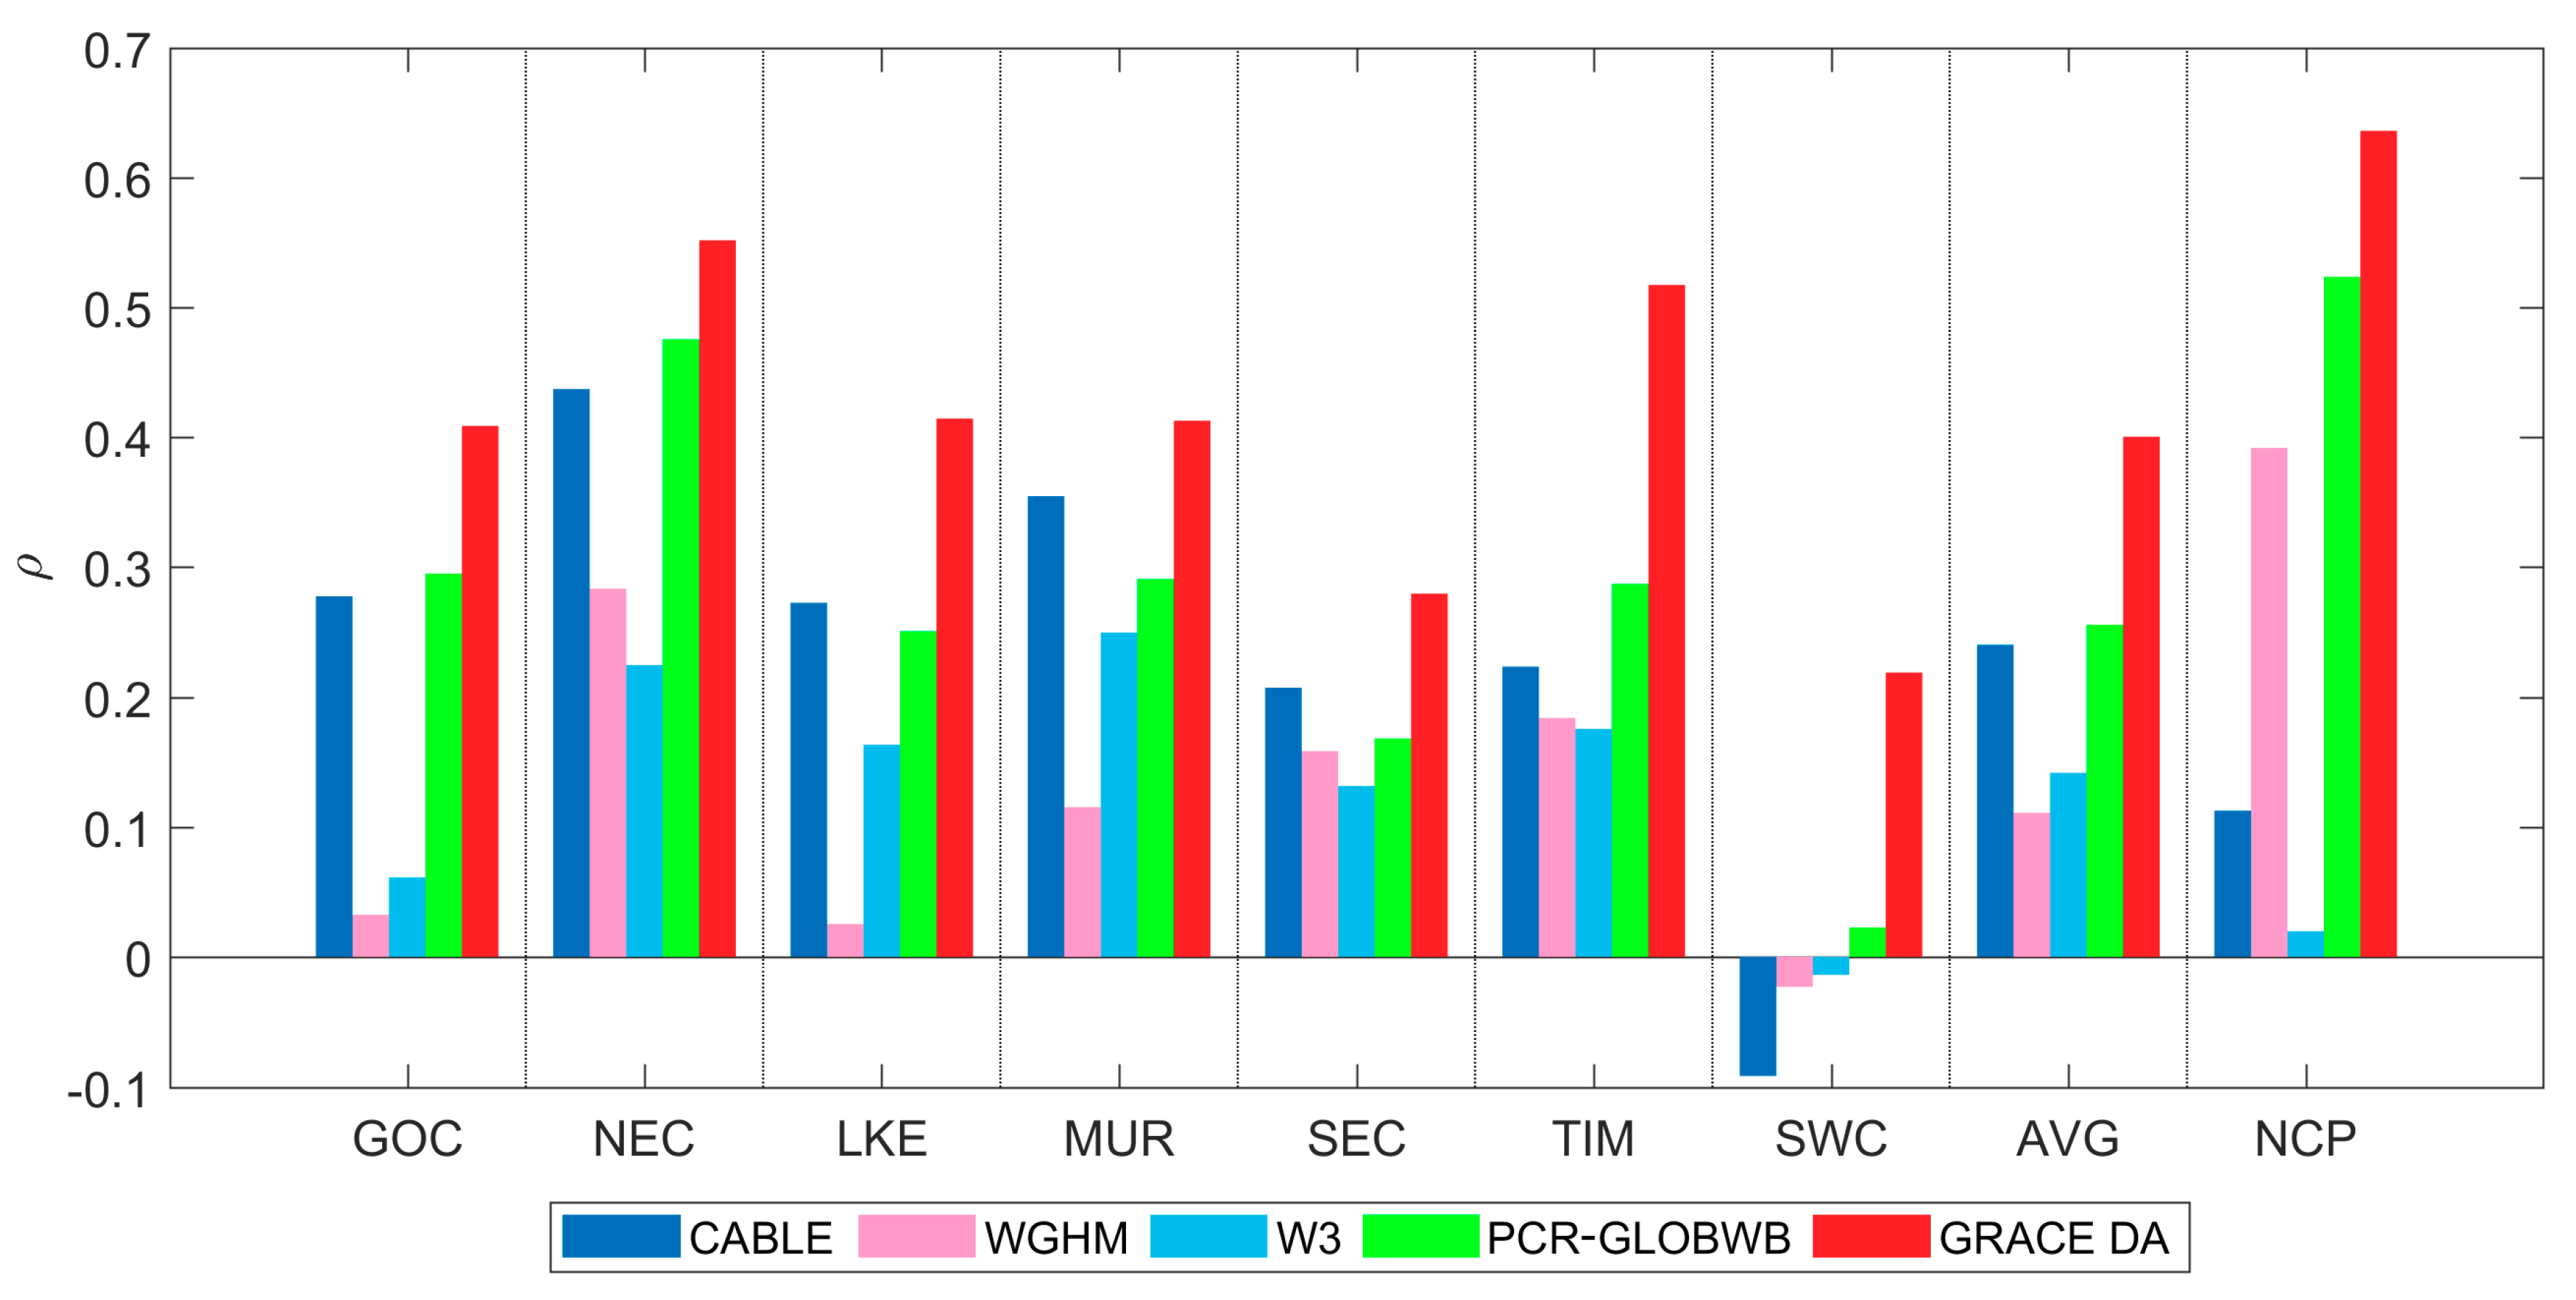
The ∆GWS estimates from four models and GRACE DA are validated in terms of temporal correlation against the available in situ ∆GL data in Australia (Figure 9) and the NCP (Figure 10). The basin-averaged correlation values of GOC, NEC, LKE, MRD, SEC, TIM, SWC (the basin where the number of the available in situ data is greater than 20 pixels), and the NCP are also shown to provide an overall quality of the ∆GWS estimate (Figure 11).
In Australia (Figure 9), all models correlate better with the in situ data in the eastern part of the continent while very low or negative correlation values are observed mostly in the western part (e.g., ρ < 0.02 in SWC). CABLE and PCR-GLOBWB show better agreements with the in situ data compared to WGHM and W3 in all basins. The average correlation values of CABLE and PCR-GLOBWB are 0.24 and 0.26, respectively, which are approximately 0.1 higher than WGHM (ρ ≈ 0.11) and W3 (ρ ≈ 0.14). In terms of correlation, CABLE provides the highest value mostly in the inner part of the continent (e.g., LKE, MRD) while PCR-GLOBWB delivers more accurate ∆GWS in the northern and eastern coastal areas of Australia (e.g., GOC, NEC, TIM). By assimilating the GRACE observation into PCR-GLOBWB, the correlation increases in most basins. Clear increments are seen in the northern part of LKE, the southern part of MRD, and SWC basins (see Figure 9d vs. Figure 9e), and the negative values in the western part of the continent mostly turn to positive. The impact of GRACE DA on the ∆GWS estimate can be seen from the correlation value difference ( ρ d ) between the ∆GWS computation with and without GRACE DA ( ρ d = ρ GRACE DA ρ PCR GLOBWB , Figure 9f). The ρ d value expresses that GRACE DA provides a greater benefit in the inner and western parts of the continent where the model-data correlation was lower. Overall, GRACE DA improves the ρ values in all Australian basins, not only compared with PCR-GLOBWB, but also compared with the three other models (see Figure 11). On average, GRACE DA increases the ρ value from 0.26 to 0.40 (by ~54%, compared to PCR-GLOBWB).
In the NCP (Figure 10), WGHM and PCR-GLOBWB apparently show higher ρ values compared to CABLE and W3, particularly in Central Hebei and Henan Provinces. With the GRACE DA application, the correlation is improved mostly in the central NCP while degraded in the eastern part of the region (Figure 10f). The degradation is found consistently from the (relatively) shallower ground level data with an average water level less than 10 m is displayed as a black cross (x) in Figure 10f. The groundwater observations in these pixels are unlikely sensitive to the groundwater water depletion that commonly occurs in deep aquifers. By contrast, GRACE observations infer the total water column encompassing groundwater signal in both deep and shallow aquifers. The groundwater levels in the shallow aquifer do not effectively represent the total ∆GWS in the NCP. We only consider the groundwater table deeper than 10 m, i.e., the pixel without marks in Figure 10f. Without considering the shallow groundwater observation, on average, GRACE DA improves the ρ value from 0.52 to 0.64 (by ~21%, compared to PCR-GLOBWB) and provides the greatest ρ value among all models (see Figure 11).

4.4.2. Impact of Climate Variation on Groundwater Variation

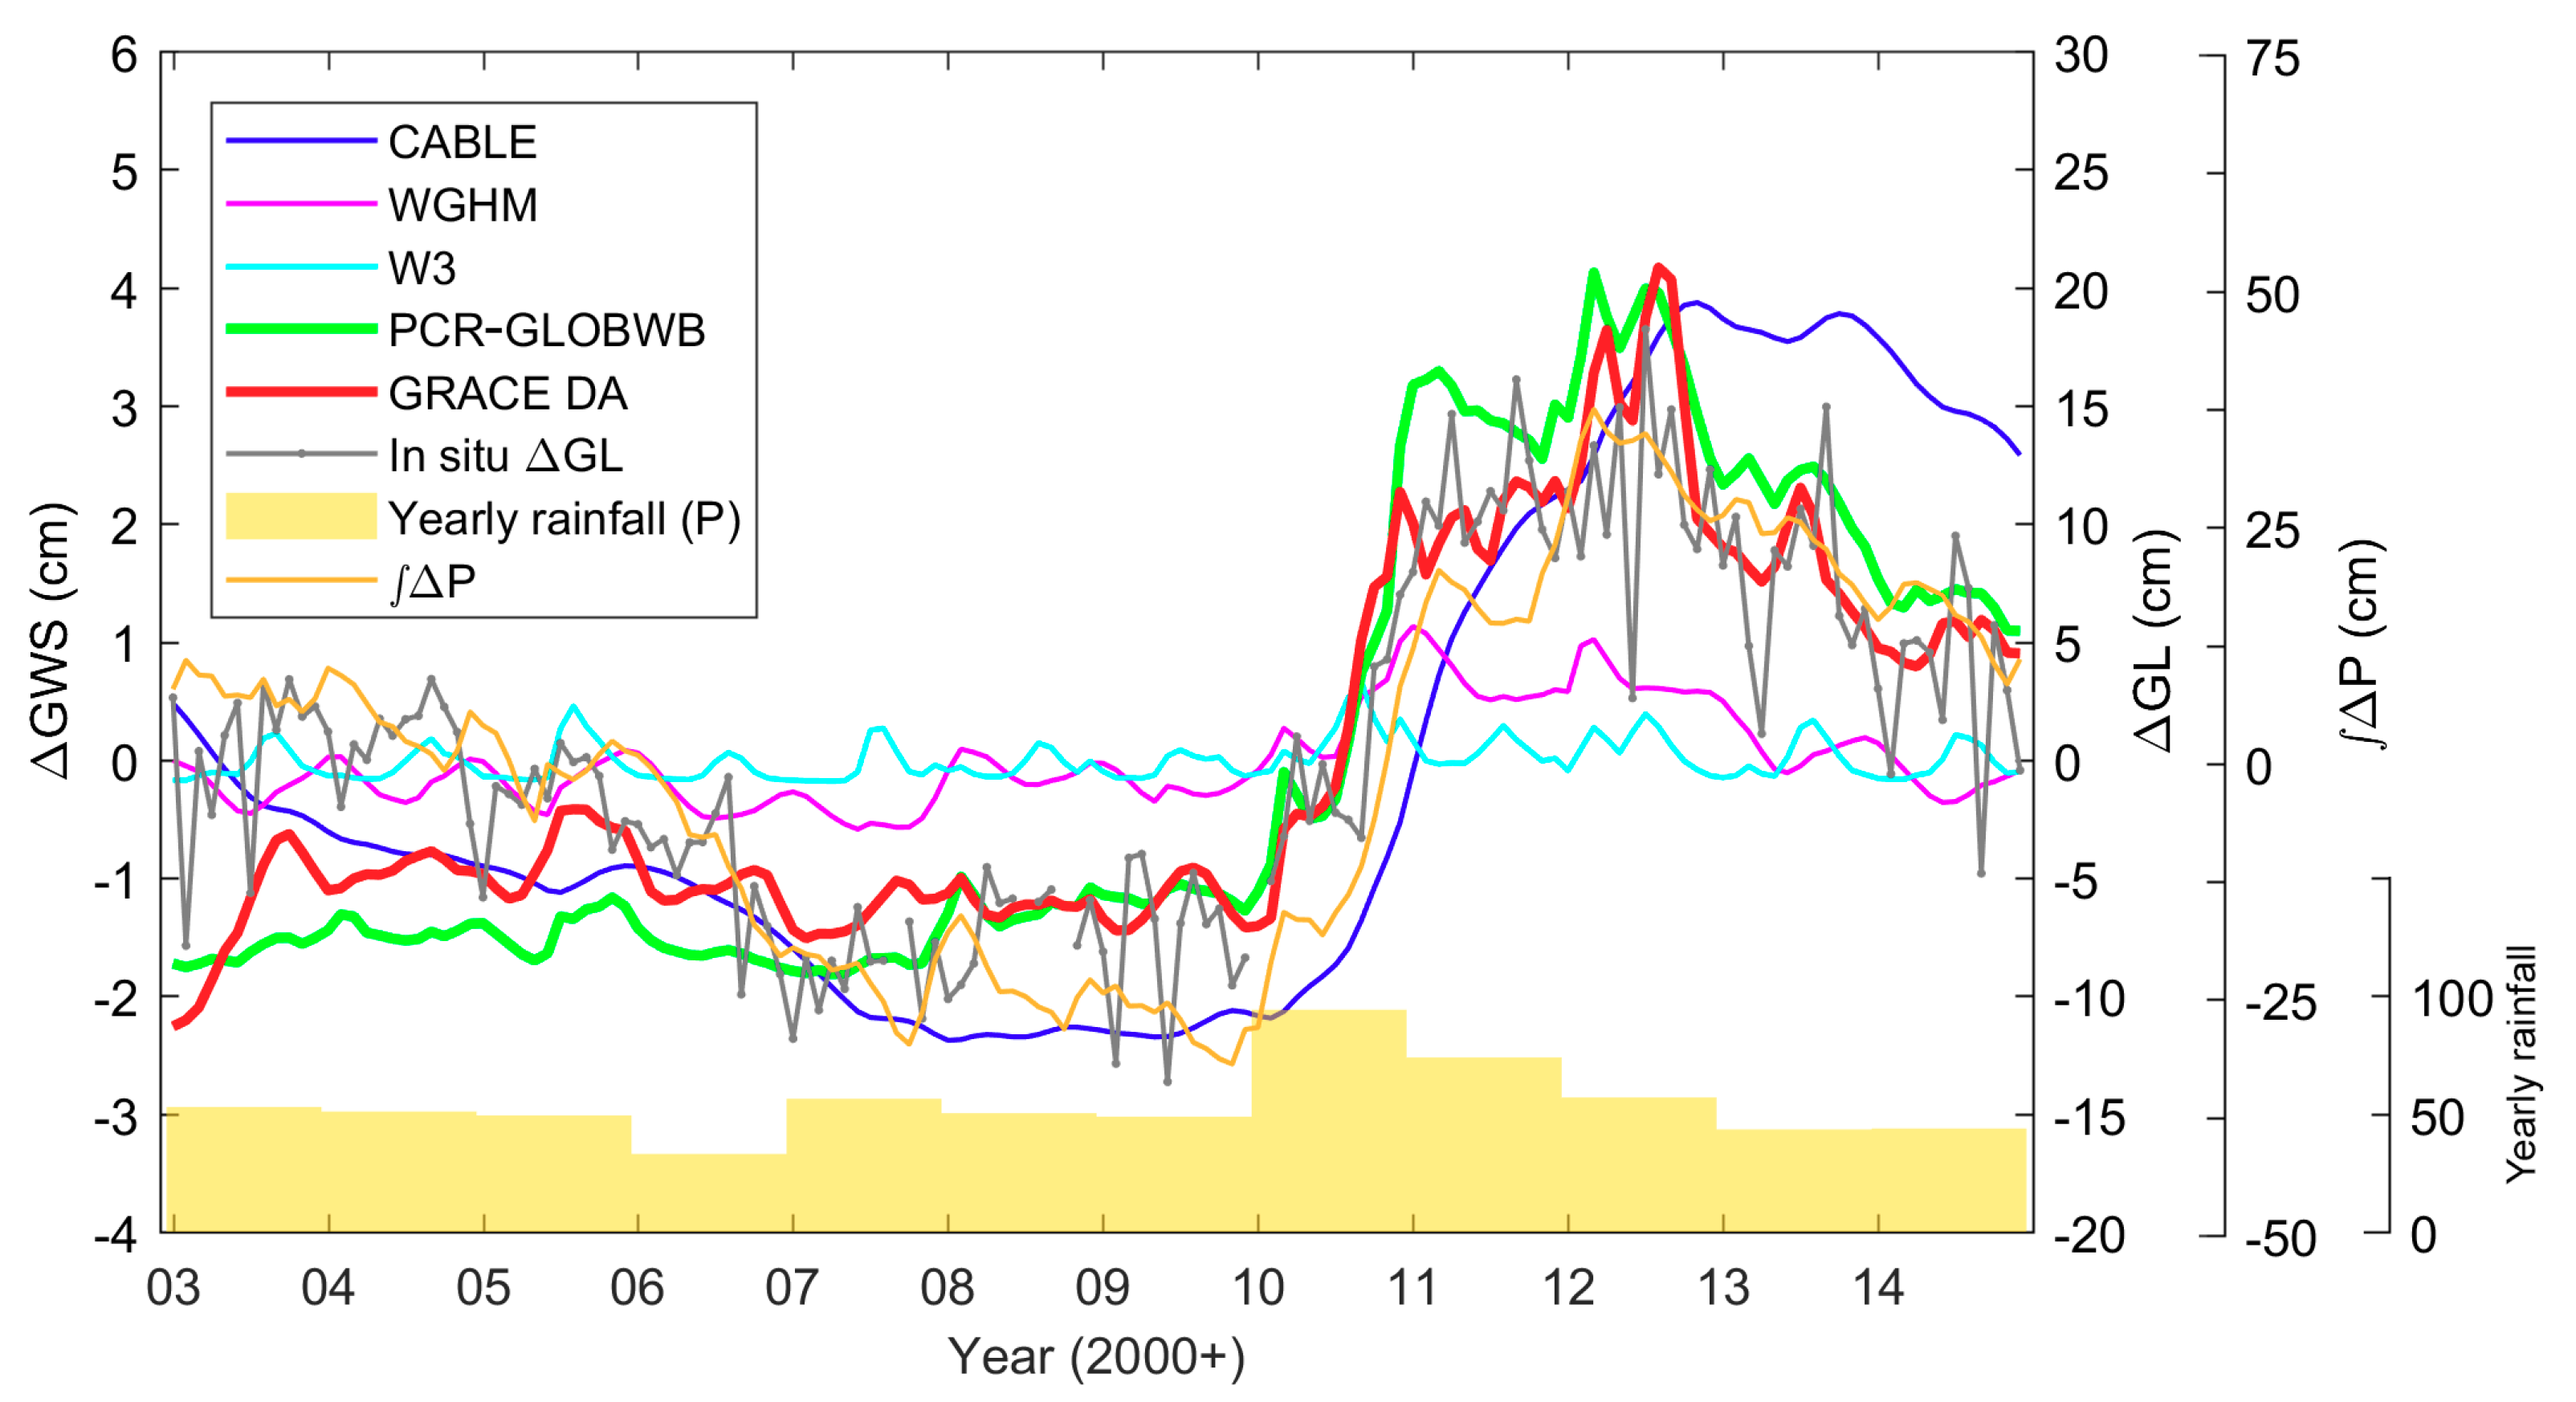
This section investigates the impact of climate variation (long-term rainfall variability) on the groundwater variation. First, the in situ ∆GL data is compared with the precipitation from TRMM data over MRD (Figure 12). To be consistent with the in situ data, only the grid cells with available in situ ∆GL data are used to construct the basin-averaged precipitation time series. The yearly precipitation is computed by accumulating monthly precipitation from January to December. In addition, the integrated monthly precipitation anomaly ( Δ P ) is computed to examine how the long-term variation of ∆GL is correlated with the inter-annual variation of the precipitation. From Figure 12, it is clearly seen that the long-term ∆GL is driven mainly by the precipitation variability. For example, the decreased ∆GL between 2003 and 2006 is mainly influenced by the precipitation deficiency during the millennium drought that affects all Australian basins since 2000 [64,65]. The ∆GL is stabilized in 2007 when the basin receives a greater amount of 2007 rainfall. The ∆GL declines again between 2008 and 2009 caused by the smaller amount of precipitation in the following years. Influenced by the significant recharge from the 2010 to 2011 La Niña rainfall, the ∆GL substantially rises from ca. –9.5 cm in 2009 to ~14 cm in 2012 (by ~2.5 times). The Δ P also shows a similar increment signature, by ~2.3 times. After 2012, the precipitation returns to the mean level and no significant recharge supplies to groundwater store between 2013 and 2014. The amount of groundwater is then reduced mainly via the groundwater discharge.
For the modeled ∆GWS, CABLE and PCR-GLOBWB agree with the in situ data with a ρ value ≥ 0.8 (Table 3). WGHM also provides high correlation of ~0.7, but the amplitude is approximately three times smaller than CABLE and PCR-GLOBWB, and the in situ data. W3 fails to simulate a long-term ∆GWS variability; the simulated ∆GWS does not reproduce the ∆GWS rise during the 2010–2011 La Niña periods. The impact of GRACE DA can be summarized in Table 3 showing the basin-averaged ∆GWS time series (Figure 12), which is different from Figure 9, Figure 10 and Figure 11 where the value is calculated at each cell. Assimilating GRACE observation adjusts the ∆GWS estimate to be consistent with the in situ ∆GL data. In particular, the GRACE DA estimate provides the highest correlation value compared to all model simulations in this basin (see Table 3). A similar benefit of GRACE DA on the ∆GWS estimate in MRD can also be found in, e.g., [19,20,21,30].

4.5. Groundwater Depletion

This section investigates the performance of the model simulation and GRACE DA in detecting the groundwater depletion in Australia and NCP. The study basins are Victoria (VIC), Perth basin (PB), and the NCP, where the noticeable groundwater depletion has been reported [11,66,67].
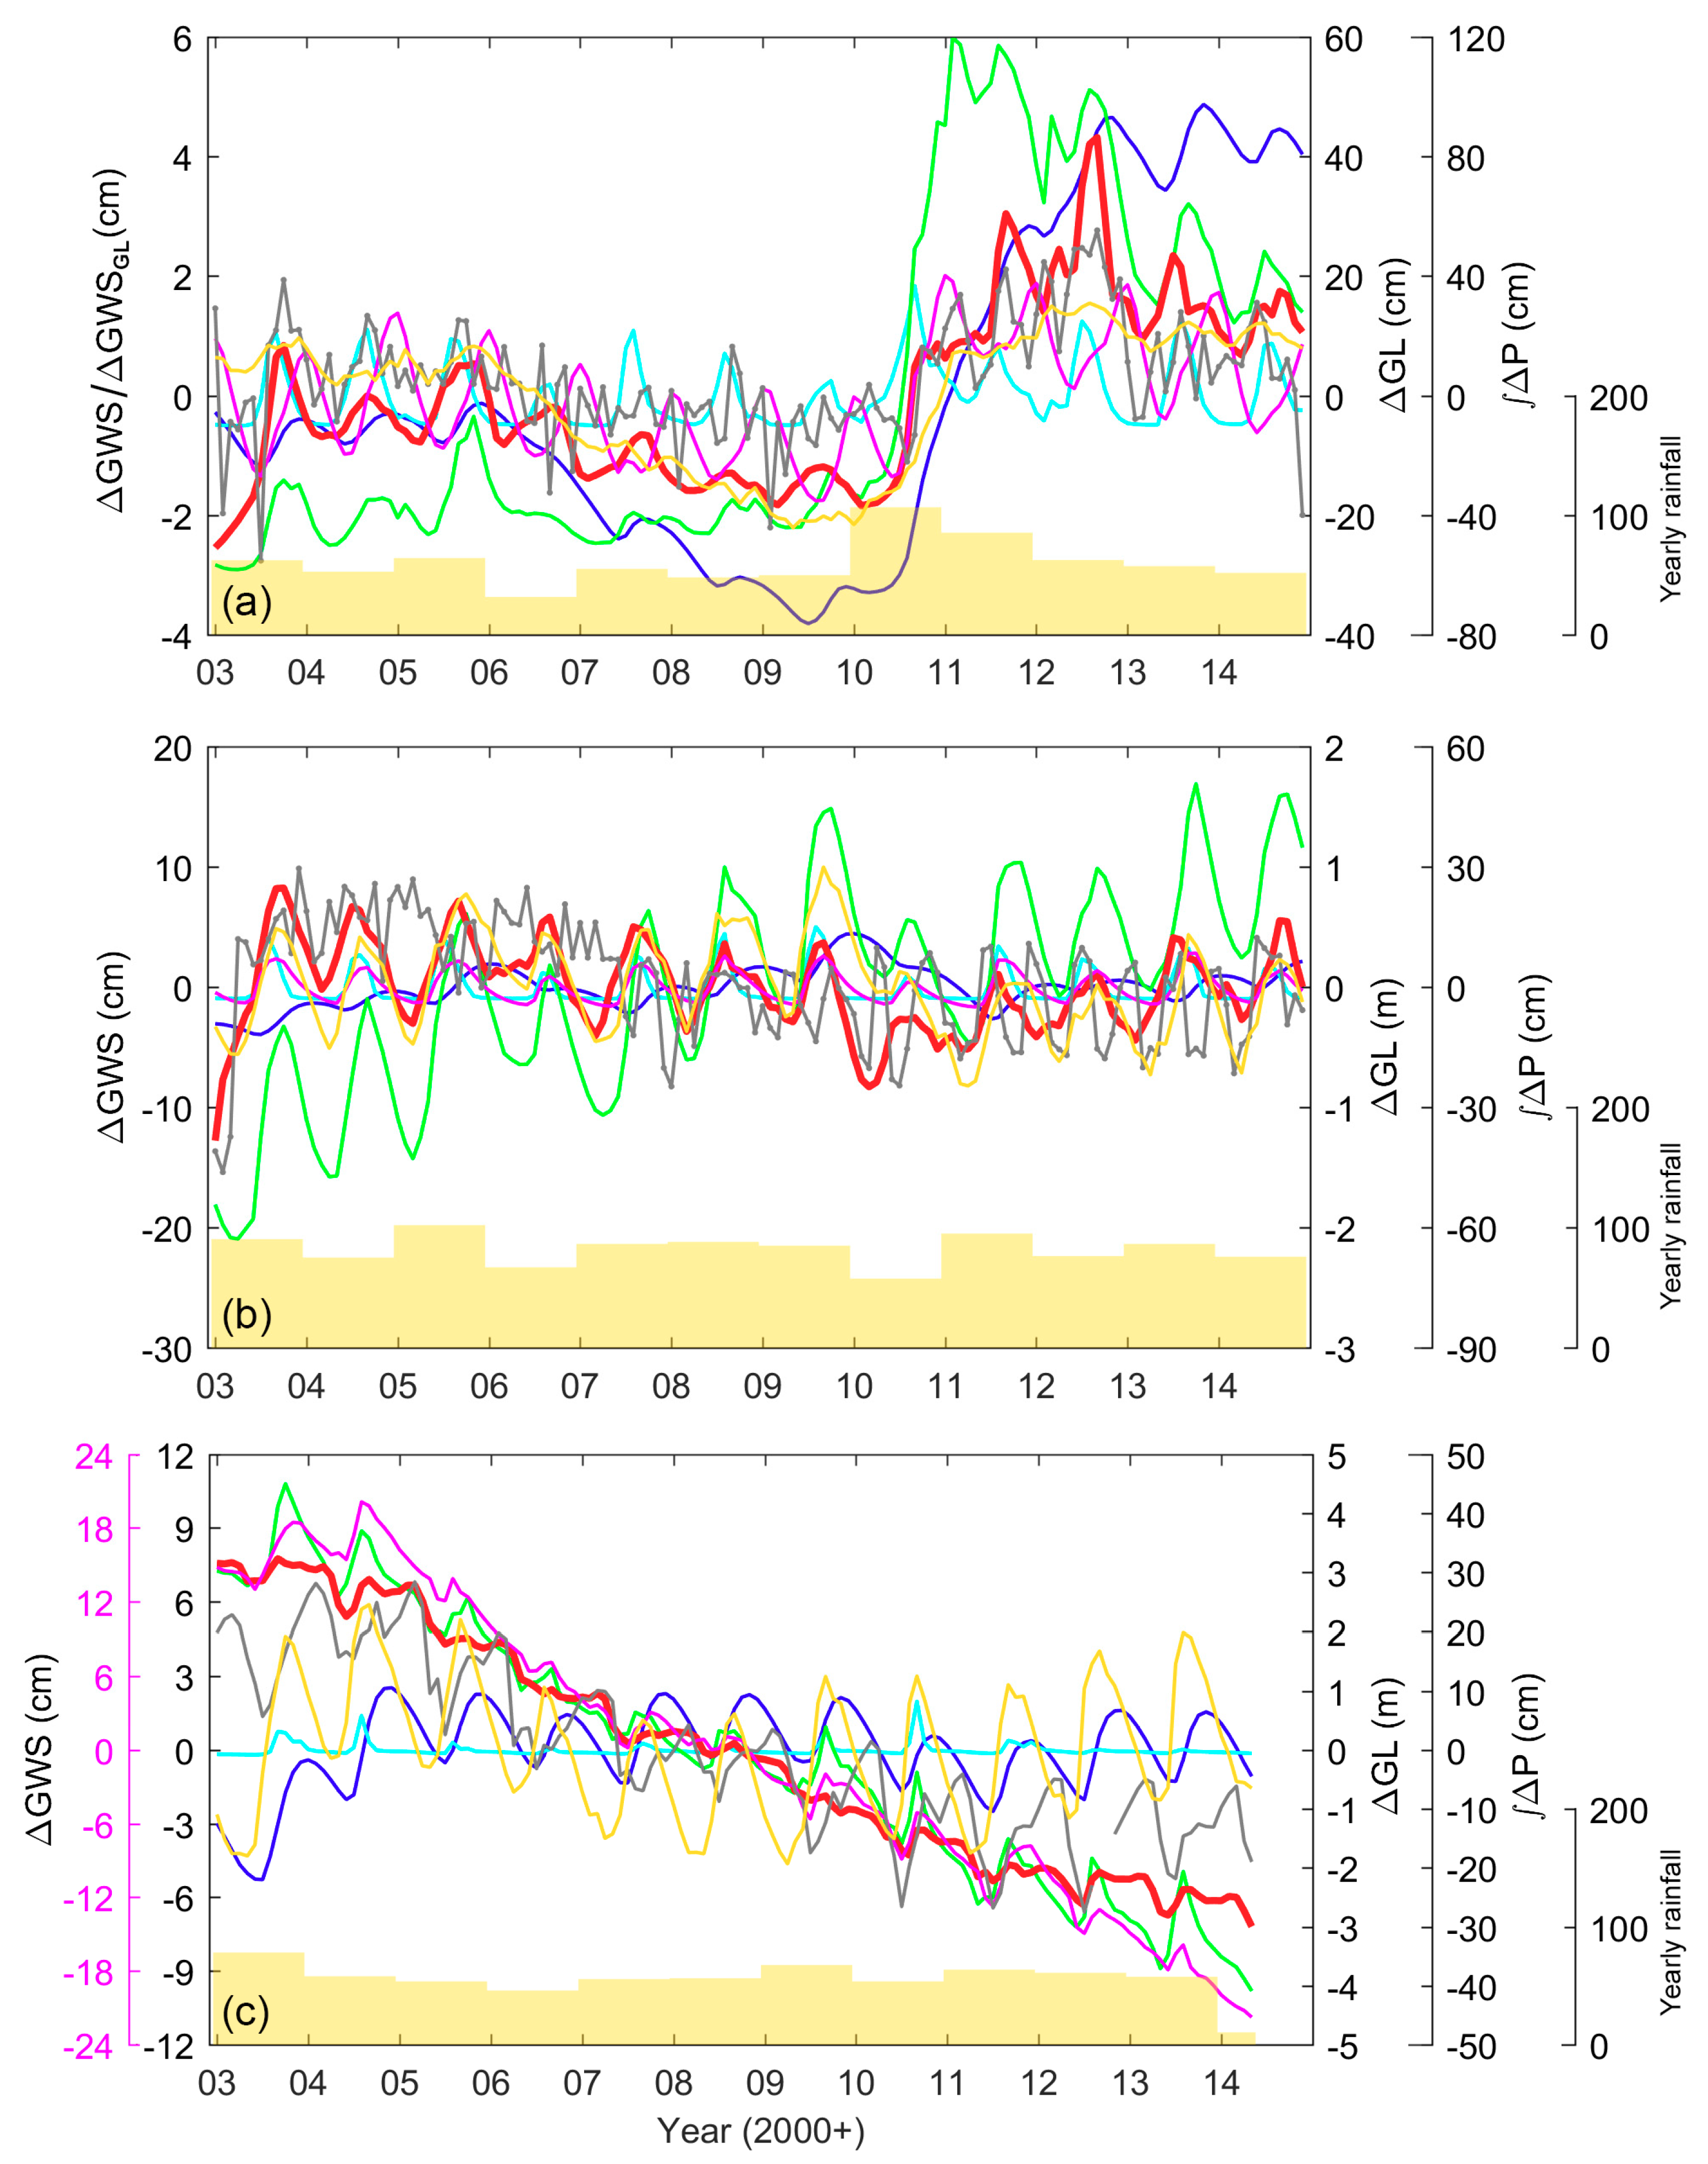
In VIC (Figure 13a), the groundwater depletion signature is seen from the in situ ∆GL data during the millennium drought period from 2003 to 2009. A qualitative agreement between the ∆GL and Δ P is also observed (ρ ~ 0.6), indicating that the groundwater depletion of VIC is responding to the rainfall decrease by ~11 cm/year prior to 2009 (depletion period). The rainfall decrease is influenced by the positive Indian Ocean Dipole events in 2006, 2007, and 2008 [68]. CABLE and PCR-GLOBWB agree with the in situ data by ρ > 0.5. The negative trend between 2004 and 2009 is observed in all models. Note that the direct comparison between ∆GL and ∆GWS requires an application of specific yield S y . In VIC, we adopt S y = 0.1 reported in [66] and convert ∆GL to ∆GWS by Δ GWS GL = S y   Δ GL . With the application of S y , the WGHM trend estimate shows the best agreement with Δ GWS GL (−0.21 vs. −0.23 cm/year) among all four models. CABLE provides an overestimated (by twice greater) depletion trend while PCR-GLOBWB and W3 nearly fail to capture the depletion signature.
Assimilating GRACE into PCR-GLOBWB improves the ∆GWS estimation compared with Δ GWS GL . From Figure 13a, similar to the ∆TWS temporal pattern, GRACE DA lies between the PCR-GLOBWB result and the in situ Δ GWS GL . GRACE DA works in a way to add water storage to the basin prior to 2010 when the PCR-GLOBWB underestimates ∆GWS and removes water from the basins after 2011 when the model overestimates ∆GWS. It leads to a better agreement in terms of the ∆GWS amplitude. Particularly, GRACE DA improves the ρ value by 19% (compared to PCR-GLOBWB), and the ρ value is the highest compared to all models and Δ P . In terms of the groundwater depletion trend estimate, GRACE DA significantly improves the trend value from −0.02 to −0.25 cm/year.
The benefit of GRACE DA is also seen in PB (Figure 13b). In terms of correlation, only GRACE DA provides a reasonable correlation (~0.5) while all four models do not agree with the in situ data (ρ < 0.07). GRACE DA improves the correlation over PCR-GLOBWB (from −0.25 to 0.45). Additionally, GRACE DA is capable of capturing the signature of groundwater depletion between 2004 and 2009 (ca. −0.7 cm/year) while all models are insensitive to such a variation. All models show increasing ∆GWS when ∆GL shows ca. −16 cm/year during this period. As S y for SWC is not available in PB, we do not compare the trend estimates between ∆GWS and ∆GL here. Unlike VIC or MRD, the variation of ∆GL in PB seems different from the precipitation pattern Δ P (the ρ value between them is low, ~0.2). Additionally, the Δ P fails to capture the groundwater depletion between 2004 and 2009. The anthropogenic activities in PB (independently from Δ P ), e.g., groundwater pumping, likely perturbs the ∆GWS in wide temporal scales, and the model does not replicate this effect without a parameter calibration or introducing an accurate groundwater abstraction information into the calculation of ∆GWS. On the contrary, the GRACE DA is an effective way to examine the ∆GWS change, particularly affected by the excessive groundwater usage.
The importance of considering the groundwater demand information or GRACE DA in the estimation of ∆GWS is even more evident in NCP (Figure 13c). Note again that only the deep aquifer grid cells are considered here (see Section 4.4.1). In NCP, GRACE DA and models that include groundwater using simulation (PCR-GLOBWB and WGHM) provide a very high correlation value, ~0.9. Modeling ∆GWS without a groundwater abstraction process leads to nearly zero correlation (see CABLE and W3). Similarly, only PCR-GLOBWB, WGHM, and GRACE DA can capture the depletion signature between 2003 and 2014, while no noticeable trend is detected from CABLE and W3. It is clear that PCR-GLOBWB and WGHM perform well in the NCP in terms of correlation and detection of groundwater depletion. However, the magnitude of ∆GWS of WGHM is twice greater than that of PCR-GLOBWB, and other models, which leads to a twice-greater trend estimate observed from WGHM (e.g., compared to PCR-GLOBWB). The comparison between ∆GWS and Δ GWS GL is not carried out here due to the high uncertainty of S y [11]. Additionally, it is noticeable in Figure 13c that ∆GL is significantly depleted between 2003 and 2010, then stabilized after 2010 (when the rainfall is increased). The PCR-GLOBWB and WGHM show the same temporal pattern, but do not stabilize after 2010. Note that PCR-GLOBWB and WGHM employ similar information of the irrigation water use, which is available only until 2010, and the 2010 water consumption is used after 2010. The trend of the ∆GWS estimate is reliable as long as the human impact and climate condition remain unchanged. The region, nevertheless, receives greater groundwater recharge after the drought period, which generally slows down the groundwater depletion. In addition, farmers might adapt the agriculture system to groundwater depletion problem. This includes the creation of more surface water reservoirs and the irrigation water transfer from the southern part of the region [69]. These factors are not included in the current model development. Without accounting for the correct temporal variation of the groundwater withdrawal information, the model simulated ∆GWS remains decreasing in time, which might result in the overestimated groundwater depletion in the NCP, e.g., after 2010.

5. Discussion

The GRACE observation is assimilated into CABLE in order to improve the ΔGWS estimate in Australia and the NCP. The major challenge is to develop a DA approach that can effectively disaggregate the GRACE monthly information into the LSM that possesses much higher spatial and temporal resolutions. A novel DA approach is then developed to fulfill such a task. Not only different from the EnKF 3D [27] (see Section 3), our developed DA approach can be considered as an extension of the generic EnKF (e.g., [17,70]), which neglects the spatial and temporal correlation errors in the Kalman gain computation. The developed EnKS 3D allows the monthly GRACE data and its associated covariance error information to be directly assimilated into the LSM without any assumption required (e.g., temporal/spatial resolution, error characteristics). The effectiveness of the developed approach is clearly observed from the increased accuracy of the estimated ∆GWS (see, e.g., Section 4.4.1). Validating against the in situ groundwater data, it is found that the accuracy in terms of correlation improves by up to ~80% (in Australia, see TIM in Figure 11), and ~21% (in the NCP), respectively. A positive impact of GRACE DA also agrees with, e.g., [20,21,30], even though different DA approaches and LSMs were used in the ∆GWS computation. This highly encourages the application of GRACE DA to be considered as a part of the future LSM development.
The evaluation of the ΔGWS estimates conducted in this study also reveals the strengths and limitations of the current developed models in different geographical regions. Firstly, CABLE produces an accurate ΔGWS estimate (as accurate as PCR-GLOBWB) in Australia. Similar to the finding of [54], the model does not perform well over the area associated with substantial water demand (e.g., VIC, PB, and the NCP) due to the absence of the groundwater withdrawal component. Introducing the anthropogenic factor (as in, e.g., PCR-GLOBWB and WGHM) into the model is feasible to resolve this issue. Including GRACE DA in the model’s development can also be considered according to a noticeable improvement of the ΔGWS estimate, as also seen in earlier studies [22,54].
WGHM estimates small ΔGWS (e.g., seasonally) in both regions. Although WGHM accounts for the human water use in the calculation of ΔGWS [56,71], this study found that the long-term trend is underestimated in Australia and overestimated roughly by a factor of two in the NCP. The inaccurate ΔGWS is attributed to the ineffective groundwater recharge generation of the model (see Section 4.3.1). Note that the model is calibrated against river discharge measurements, which are sparse in the NCP—and due to dry conditions in major parts of Australia. As a result, a regionalized parameter value (e.g., [72]) is applied, which likely leads to an incorrect water storage estimate. The overestimated ∆TWS trend in NCP is mainly influenced by the overestimated ∆GWS, which was also reported in [2] and is due to underestimated groundwater recharge rates and potentially overestimated groundwater abstraction rates. The reconfiguration of the model, including restoring the soil infiltration (e.g., add runoff back to the soil storage in case where no groundwater recharge occurs (see Section 4.3.1)) can lead to a more realistic ∆GWS dynamic in terms of both seasonality and long-term trend. Assimilation of GRACE data into WGHM also shows a satisfactory outcome (in, e.g., MRD [30]).
W3 also shows a smaller variation of the ∆GWS estimate in most basins. The long-term trend is significantly underestimated in both regions, and the correlation value in the NCP is the lowest among all models. As mentioned in Section 4.3.1, W3 generates the groundwater recharge based on the soil water drainage controlled by the uncalibrated parameters, and the deep soil water currently accounts for most of the ∆TWS. The soil and groundwater components are not separated efficiently, and the variation of ∆GWS is likely presented in the soil layer. This is evidently seen in Australia where the correlation between the ∆TWS and GRACE observation is very high (see Figure 3) even though the contribution of ∆GWS is very low (see Figure 5, Figure 6, Figure 7 and Figure 8). In the ongoing development of W3, the calibrated parameters will be used in the ∆GWS computation. Importantly, GRACE DA is being implemented into the model to assist the parameter calibration and enhance the quality of the state estimate. The initial studies show a significant improvement of the estimate, i.e., they improved the ρ value by up to >100% in most Australian basins [20,24]).
PCR-GLOBWB performs well in both study regions. The problems detected are the overestimated ΔGWS in the Australian coastal regions, which can likely be attributed to two common factors, the ineffective calibration of the groundwater drainage parameter (see Section 4.3.2) and the inaccurate PET input. Unlike a conventional PCR-GLOBWB [73], this study computed PET based on the information of air temperature input only (see Section 2.2.1) in order to extend the time series. Such a simple methodology may produce an underestimated ET in Australia, which leads to an overestimated soil infiltration and groundwater recharge, and, consequently, to water accumulation in several basins. PCR-GLOBWB recently released a new PET input [32], which can be used to improve the accuracy of the ET estimate. Additionally, similar to other model developments, the implementation of GRACE DA into the model can also be considered as an alternative model extension for the improved ΔGWS estimate. In fact, the GRACE DA implementation and source code development are already ongoing in independent research (e.g., [27]).

6. Conclusions

This study evaluates the ΔGWS computation from four state-of-the-art land surface models and GRACE DA in Australia and the North China Plain. For the first time, the GRACE DA is developed to account for both temporal and spatial errors simultaneously, which reflects a more realistic approach to assimilate a coarse GRACE spatiotemporal scale observation into a fine-grid LSM. A thorough validation against the in situ groundwater (level changes) measurements reveals that our developed GRACE DA successfully improves the ΔGWS estimates in terms of seasonal and long-term variations, and detects significant anthropogenic groundwater depletion. More importantly, GRACE DA provides the most accurate ΔGWS among all available state-of-the-art LSM products.
The analysis of this study can be used as a milestone for the future development of LSMs. Among four LSMs, and PCR-GLOBWB and CABLE provide the best ΔGWS estimates in Australia. PCR-GLOBWB and WGHM perform reasonably well in the NCP. We find that the unavailable or inaccurate information of human factors (e.g., irrigation practices using groundwater abstraction in semi-arid regions) prevents the reliable computation of groundwater changes from LSMs. GRACE DA shows a tremendous advantage to fill in this missing component in LSMs for computing more accurate groundwater storages.
The validation of the large-scale ΔGWS estimate with the in situ groundwater observations is commonly limited by three main factors: unavailable specific yield values, incomplete data records, and limited spatial coverages. This study faces the same limitation and only presents the evaluation of the ΔGWS estimates in terms of temporal correlation (due to the availability of specific yield values) over 8 out of 11 studied river basins (due to the limited spatial coverage). Although not all basins are assessed, the validation covers >70% of the study area and provides convincing evidence on the overall quality of the ΔGWS estimate from LSMs and GRACE DA. The evaluation highlights the benefit of GRACE DA leading to a better ΔGWS estimate than with the other four LSMs. Moreover, the analysis in NCP underlines the importance of groundwater change at depths. The in situ groundwater record reflecting deeper aquifers agree better with GRACE observations (and, thus, GRACE DA results). From this point of view, documenting the bore’s properties is clearly as important as recording the comprehensive in situ groundwater measurement itself.
From a convincing performance of GRACE DA, the implementation of GRACE DA is presently considered in the development of several LSMs, e.g., the Catchment Land Surface Model [70] (http://nasagrace.unl.edu), W3 [20], and PCR-GLOBWB (this study). The LSM DA products will provide a more accurate picture of the water storage estimate suitable for groundwater monitoring and hydrological reanalysis purposes.

Acknowledgments

This work is funded by The University of Newcastle to support NASA’s GRACE and GRACE Follow-On projects as an international science team member to the missions. We thank the three anonymous reviewers for providing us very valuable comments and suggestions, leading to a significant improvement of the paper.

Author Contributions

N.T. conceived, designed, and performed the experiments; N.T., S.-C.H., S.T., H.M.S., and E.H.S. analyzed the data; N.T., S.-C.H., S.T., H.M.S., E.H.S., J.R., and W.F. contributed reagents/materials/analysis tools; N.T. wrote the paper; and S.-C.H., S.T., H.M.S., E.H.S., J.R., and W.F. improved the paper.

Conflicts of Interest

The authors declare no conflict of interest.

References

  1. Siebert, S.; Burke, J.; Faures, J.M.; Frenken, K.; Hoogeveen, J.; Döll, P.; Portmann, F.T. Groundwater use for irrigation—A global inventory. Hydrol. Earth Syst. Sci. 2010, 14, 1863–1880. [Google Scholar] [CrossRef] [Green Version]
  2. Döll, P.; Müller Schmied, H.; Schuh, C.; Portmann, F.T.; Eicker, A. Global-scale assessment of groundwater depletion and related groundwater abstractions: Combining hydrological modeling with information from well observations and GRACE satellites. Water Resour. Res. 2014, 50, 5698–5720. [Google Scholar] [CrossRef]
  3. Konikow, L.F.; Kendy, E. Groundwater depletion: A global problem. Hydrogeol. J. 2005, 13, 317–320. [Google Scholar] [CrossRef]
  4. Leblanc, M.J.; Tregoning, P.; Ramillien, G.; Tweed, S.O.; Fakes, A. Basin-scale, integrated observations of the early 21st century multiyear drought in southeast Australia. Water Resour. Res. 2009, 45, W04408. [Google Scholar] [CrossRef]
  5. Crosbie, R.S.; McCallum, J.L.; Walker, G.R.; Chiew, F.H.S. Modelling climate-change impacts on groundwater recharge in the Murray-Darling Basin, Australia. Hydrogeol. J. 2010, 18, 1639–1656. [Google Scholar] [CrossRef]
  6. McCallum, J.L.; Crosbie, R.S.; Walker, G.R.; Dawes, W.R. Impacts of climate change on groundwater in Australia: A sensitivity analysis of recharge. Hydrogeol. J. 2010, 18, 1625–1638. [Google Scholar] [CrossRef]
  7. Cao, G.; Zheng, C.; Scanlon, B.R.; Liu, J.; Li, W. Use of flow modeling to assess sustainability of groundwater resources in the North China Plain. Water Resour. Res. 2013, 49, 159–175. [Google Scholar] [CrossRef]
  8. Tapley, B.D.; Bettadpur, S.; Ries, J.C.; Thompson, P.F.; Watkins, M.M. GRACE Measurements of Mass Variability in the Earth System. Science 2004, 305, 503–505. [Google Scholar] [CrossRef] [PubMed]
  9. Rodell, M.; Velicogna, I.; Famiglietti, J.S. Satellite-based estimates of groundwater depletion in India. Nature 2009, 460, 999–1002. [Google Scholar] [CrossRef] [PubMed]
  10. Famiglietti, J.S.; Lo, M.; Ho, S.L.; Bethune, J.; Anderson, K.J.; Syed, T.H.; Swenson, S.C.; de Linage, C.R.; Rodell, M. Satellites measure recent rates of groundwater depletion in California’s Central Valley. Geophys. Res. Lett. 2011, 38, L03403. [Google Scholar] [CrossRef]
  11. Feng, W.; Zhong, M.; Lemoine, J.-M.; Biancale, R.; Hsu, H.-T.; Xia, J. Evaluation of groundwater depletion in North China using the Gravity Recovery and Climate Experiment (GRACE) data and ground-based measurements. Water Resour. Res. 2013, 49, 2110–2118. [Google Scholar] [CrossRef]
  12. Huang, Z.; Pan, Y.; Gong, H.; Yeh, P.J.-F.; Li, X.; Zhou, D.; Zhao, W. Subregional-scale groundwater depletion detected by GRACE for both shallow and deep aquifers in North China Plain. Geophys. Res. Lett. 2015, 42, 1791–1799. [Google Scholar] [CrossRef]
  13. Forootan, E.; Rietbroek, R.; Kusche, J.; Sharifi, M.A.; Awange, J.L.; Schmidt, M.; Omondi, P.; Famiglietti, J. Separation of large scale water storage patterns over Iran using GRACE, altimetry and hydrological data. Remote Sens. Environ. 2014, 140, 580–595. [Google Scholar] [CrossRef]
  14. Long, D.; Chen, X.; Scanlon, B.R.; Wada, Y.; Hong, Y.; Singh, V.P.; Chen, Y.; Wang, C.; Han, Z.; Yang, W. Have GRACE satellites overestimated groundwater depletion in the Northwest India Aquifer? Sci. Rep. 2016, 6, 24398. [Google Scholar] [CrossRef] [PubMed] [Green Version]
  15. Andrew, R.; Guan, H.; Batelaan, O. Estimation of GRACE water storage components by temporal decomposition. J. Hydrol. 2017, 552, 341–350. [Google Scholar] [CrossRef]
  16. Forootan, E.; Safari, A.; Mostafaie, A.; Schumacher, M.; Delavar, M.; Awange, J.L. Large-Scale Total Water Storage and Water Flux Changes over the Arid and Semiarid Parts of the Middle East from GRACE and Reanalysis Products. Surv. Geophys. 2017, 38, 591–615. [Google Scholar] [CrossRef]
  17. Zaitchik, B.F.; Rodell, M.; Reichle, R.H. Assimilation of GRACE Terrestrial Water Storage Data into a Land Surface Model: Results for the Mississippi River Basin. J. Hydrometeorol. 2008, 9, 535–548. [Google Scholar] [CrossRef]
  18. Tangdamrongsub, N.; Steele-Dunne, S.C.; Gunter, B.C.; Ditmar, P.G.; Weerts, A.H. Data assimilation of GRACE terrestrial water storage estimates into a regional hydrological model of the Rhine River basin. Hydrol. Earth Syst. Sci. 2015, 19, 2079–2100. [Google Scholar] [CrossRef]
  19. Khaki, M.; Ait-El-Fquih, B.; Hoteit, I.; Forootan, E.; Awange, J.; Kuhn, M. A two-update ensemble Kalman filter for land hydrological data assimilation with an uncertain constraint. J. Hydrol. 2017, 555, 447–462. [Google Scholar] [CrossRef]
  20. Tian, S.; Tregoning, P.; Renzullo, L.J.; van Dijk, A.I.J.M.; Walker, J.P.; Pauwels, V.R.N.; Allgeyer, S. Improved water balance component estimates through joint assimilation of GRACE water storage and SMOS soil moisture retrievals. Water Resour. Res. 2017, 53, 1820–1840. [Google Scholar] [CrossRef]
  21. Khaki, M.; Hoteit, I.; Kuhn, M.; Awange, J.; Forootan, E.; van Dijk, A.I.J.M.; Schumacher, M.; Pattiaratchi, C. Assessing sequential data assimilation techniques for integrating GRACE data into a hydrological model. Adv. Water Resour. 2017, 107, 301–316. [Google Scholar] [CrossRef]
  22. Tangdamrongsub, N.; Han, S.-C.; Yeo, I.-Y. Enhancement of water storage estimates using GRACE data assimilation with particle filter framework. In Proceedings of the 22nd International Congress on Modelling and Simulation (MODSIM), Hobart, Australia, 8–11 December 2017; pp. 1041–1047. [Google Scholar]
  23. Girotto, M.; De Lannoy, G.J.M.; Reichle, R.H.; Rodell, M. Assimilation of gridded terrestrial water storage observations from GRACE into a land surface model. Water Resour. Res. 2016, 52, 4164–4183. [Google Scholar] [CrossRef]
  24. Khaki, M.; Schumacher, M.; Forootan, E.; Kuhn, M.; Awange, J.L.; van Dijk, A.I.J.M. Accounting for spatial correlation errors in the assimilation of GRACE into hydrological models through localization. Adv. Water Resour. 2017, 108, 99–112. [Google Scholar] [CrossRef]
  25. Eicker, A.; Schumacher, M.; Kusche, J.; Döll, P.; Müller Schmied, H. Calibration/Data Assimilation Approach for Integrating GRACE Data into the WaterGAP Global Hydrology Model (WGHM) Using an Ensemble Kalman Filter: First Results. Surv. Geophys. 2014, 35, 1285–1309. [Google Scholar] [CrossRef]
  26. Schumacher, M.; Kusche, J.; Döll, P. A systematic impact assessment of GRACE error correlation on data assimilation in hydrological models. J. Geod. 2016, 90, 537–559. [Google Scholar] [CrossRef]
  27. Tangdamrongsub, N.; Steele-Dunne, S.C.; Gunter, B.C.; Ditmar, P.G.; Sutanudjaja, E.H.; Sun, Y.; Xia, T.; Wang, Z. Improving estimates of water resources in a semi-arid region by assimilating GRACE data into the PCR-GLOBWB hydrological model. Hydrol. Earth Syst. Sci. 2017, 21, 2053–2074. [Google Scholar] [CrossRef]
  28. Kumar, S.V.; Zaitchik, B.F.; Peters-Lidard, C.D.; Rodell, M.; Reichle, R.; Li, B.; Jasinski, M.; Mocko, D.; Getirana, A.; De Lannoy, G.; et al. Assimilation of Gridded GRACE Terrestrial Water Storage Estimates in the North American Land Data Assimilation System. J. Hydrometeorol. 2016, 17, 1951–1972. [Google Scholar] [CrossRef]
  29. Girotto, M.; De Lannoy, G.J.M.; Reichle, R.H.; Rodell, M.; Draper, C.; Bhanja, S.N.; Mukherjee, A. Benefits and pitfalls of GRACE data assimilation: A case study of terrestrial water storage depletion in India. Geophys. Res. Lett. 2017, 44, 4017–4115. [Google Scholar] [CrossRef]
  30. Schumacher, M.; Forootan, E.; van Dijk, A.I.J.M.; Müller Schmied, H.; Crosbie, R.S.; Kusche, J.; Döll, P. Improving drought simulations within the Murray-Darling Basin by combined calibration/assimilation of GRACE data into the WaterGAP Global Hydrology Model. Remote Sens. Environ. 2018, 204, 212–228. [Google Scholar] [CrossRef]
  31. Van Dijk, A.I.J.M.; Peña-Arancibia, J.L.; Wood, E.F.; Sheffield, J.; Beck, H.E. Global analysis of seasonal streamflow predictability using an ensemble prediction system and observations from 6192 small catchments worldwide. Water Resour. Res. 2013, 49, 2729–2746. [Google Scholar] [CrossRef]
  32. Sutanudjaja, E.H.; van Beek, R.; Wanders, N.; Wada, Y.; Bosmans, J.H.C.; Drost, N.; Ent, R.J.; van der Graaf, I.E.M.; de Hoch, J.M.; Jong, K.; et al. PCR-GLOBWB 2: A 5 ARC-minute global hydrological and water resources model. Geosci. Model Dev. Discuss. 2017. [Google Scholar] [CrossRef]
  33. De Lannoy, G.J.M.; Reichle, R.H.; Houser, P.R.; Arsenault, K.R.; Verhoest, N.E.C.; Pauwels, V.R.N. Satellite-Scale Snow Water Equivalent Assimilation into a High-Resolution Land Surface Model. J. Hydrometeorol. 2009, 11, 352–369. [Google Scholar] [CrossRef]
  34. Decker, M. Development and evaluation of a new soil moisture and runoff parameterization for the CABLE LSM including subgrid-scale processes. J. Adv. Model. Earth Syst. 2015, 7, 1788–1809. [Google Scholar] [CrossRef]
  35. Müller Schmied, H. Evaluation, Modification and Application of a Global Hydrological Model. Ph.D. Thesis, Institute of Physical Geography, Goethe University Frankfurt, Frankfurt am Main, Germany, 2017. [Google Scholar]
  36. Bettadpur, S. Gravity Recovery and Climate Experiment UTCSR Level-2 Processing Standards Document for Level-2 Product Release 0005; Center for Space Research, The University of Texas: Austin, TX, USA, 2012. [Google Scholar]
  37. Swenson, S.; Chambers, D.; Wahr, J. Estimating geocenter variations from a combination of GRACE and ocean model output. J. Geophys. Res. Solid Earth 2008, 113, B08410. [Google Scholar] [CrossRef]
  38. Cheng, M.; Tapley, B.D. Variations in the Earth’s oblateness during the past 28 years. J. Geophys. Res. Solid Earth 2004, 109, B09402. [Google Scholar] [CrossRef]
  39. Swenson, S.; Wahr, J. Post-processing removal of correlated errors in GRACE data. Geophys. Res. Lett. 2006, 33, L08402. [Google Scholar] [CrossRef]
  40. Jekeli, C. Alternative Methods to Smooth the Earth’s Gravity Field; Scientific Report, 327; The Ohio State University: Columbus, OH, USA, 1981. [Google Scholar]
  41. Wahr, J.; Molenaar, M.; Bryan, F. Time variability of the Earth’s gravity field: Hydrological and oceanic effects and their possible detection using GRACE. J. Geophys. Res. Solid Earth 1998, 103, 30205–30229. [Google Scholar] [CrossRef]
  42. Tangdamrongsub, N.; Ditmar, P.G.; Steele-Dunne, S.C.; Gunter, B.C.; Sutanudjaja, E.H. Assessing total water storage and identifying flood events over Tonlé Sap basin in Cambodia using GRACE and MODIS satellite observations combined with hydrological models. Remote Sens. Environ. 2016, 181, 162–173. [Google Scholar] [CrossRef]
  43. Zhou, H.; Luo, Z.; Tangdamrongsub, N.; Wang, L.; He, L.; Xu, C.; Li, Q. Characterizing Drought and Flood Events over the Yangtze River Basin Using the HUST-Grace2016 Solution and Ancillary Data. Remote Sens. 2017, 9, 1100. [Google Scholar] [CrossRef]
  44. Van Beek, L.P.H.; Wada, Y.; Bierkens, M.F.P. Global monthly water stress: 1. Water balance and water availability. Water Resour. Res. 2011, 47, W07517. [Google Scholar] [CrossRef]
  45. Erkens, G.; Sutanudjaja, E.H. Towards a global land subsidence map. Proc. Int. Assoc. Hydrol. Sci. 2015, 372, 83–87. [Google Scholar] [CrossRef]
  46. Huffman, G.J.; Bolvin, D.T.; Nelkin, E.J.; Wolff, D.B.; Adler, R.F.; Gu, G.; Hong, Y.; Bowman, K.P.; Stocker, E.F. The TRMM Multisatellite Precipitation Analysis (TMPA): Quasi-Global, Multiyear, Combined-Sensor Precipitation Estimates at Fine Scales. J. Hydrometeorol. 2007, 8, 38–55. [Google Scholar] [CrossRef]
  47. Dee, D.P.; Uppala, S.M.; Simmons, A.J.; Berrisford, P.; Poli, P.; Kobayashi, S.; Andrae, U.; Balmaseda, M.A.; Balsamo, G.; Bauer, P.; et al. The ERA-Interim reanalysis: Configuration and performance of the data assimilation system. Q. J. R. Meteorol. Soc. 2011, 137, 553–597. [Google Scholar] [CrossRef]
  48. Lu, J.; Sun, G.; McNulty, S.G.; Amatya, D.M. A Comparison of Six Potential Evapotranspiration Methods for Regional Use in the Southeastern United States1. JAWRA J. Am. Water Resour. Assoc. 2005, 41, 621–633. [Google Scholar] [CrossRef]
  49. Huffman, G.J. Estimates of Root-Mean-Square Random Error for Finite Samples of Estimated Precipitation. J. Appl. Meteorol. 1997, 36, 1191–1201. [Google Scholar] [CrossRef]
  50. Bi, D.; Dix, M.; Marsland, S.; O’Farrell, S.; Rashid, H.; Uotila, P.; Hirst, T.; Kowalczyk, E.; Golebiewski, M.; Sullivan, A.; et al. The ACCESS Coupled Model: Description, Control Climate and Evaluation. Aust. Meteorol. Oceanogr. J. 2013, 63, 41–64. [Google Scholar] [CrossRef]
  51. Ukkola, A.M.; Pitman, A.J.; Decker, M.; De Kauwe, M.G.; Abramowitz, G.; Kala, J.; Wang, Y.-P. Modelling evapotranspiration during precipitation deficits: Identifying critical processes in a land surface model. Hydrol. Earth Syst. Sci. 2016, 20, 2403–2419. [Google Scholar] [CrossRef]
  52. Decker, M.; Zeng, X. Impact of Modified Richards Equation on Global Soil Moisture Simulation in the Community Land Model (CLM3.5). J. Adv. Model. Earth Syst. 2009, 1, 5. [Google Scholar] [CrossRef]
  53. Rodell, M.; Houser, P.R.; Jambor, U.; Gottschalck, J.; Mitchell, K.; Meng, C.-J.; Arsenault, K.; Cosgrove, B.; Radakovich, J.; Bosilovich, M.; et al. The Global Land Data Assimilation System. Bull. Am. Meteorol. Soc. 2004, 85, 381–394. [Google Scholar] [CrossRef]
  54. Tangdamrongsub, N.; Han, S.-C.; Decker, M.; Yeo, I.-Y.; Kim, H. On the use of the GRACE normal equation of inter-satellite tracking data for estimation of soil moisture and groundwater in Australia. Hydrol. Earth Syst. Sci. 2018, 22, 1811–1829. [Google Scholar] [CrossRef]
  55. Döll, P.; Kaspar, F.; Lehner, B. A global hydrological model for deriving water availability indicators: Model tuning and validation. J. Hydrol. 2003, 270, 105–134. [Google Scholar] [CrossRef]
  56. Müller Schmied, H.; Eisner, S.; Franz, D.; Wattenbach, M.; Portmann, F.T.; Flörke, M.; Döll, P. Sensitivity of simulated global-scale freshwater fluxes and storages to input data, hydrological model structure, human water use and calibration. Hydrol. Earth Syst. Sci. 2014, 18, 3511–3538. [Google Scholar] [CrossRef]
  57. Weedon, G.P.; Balsamo, G.; Bellouin, N.; Gomes, S.; Best, M.J.; Viterbo, P. The WFDEI meteorological forcing data set: WATCH Forcing Data methodology applied to ERA-Interim reanalysis data. Water Resour. Res. 2014, 50, 7505–7514. [Google Scholar] [CrossRef]
  58. Van Dijk, A. Landscape Model (Version 0.5); AWRA Technical Report 3; WIRADA/CSIRO Water for a Healthy Country Flagship: Canberra, Australia, 2010. [Google Scholar]
  59. Evensen, G. The Ensemble Kalman Filter: Theoretical formulation and practical implementation. Ocean Dyn. 2003, 53, 343–367. [Google Scholar] [CrossRef]
  60. Tregoning, P.; McClusky, S.; Van Dijk, A.; Crosbie, R.; Pena Arancibia, J. Assessment of GRACE Satellites for Groundwater Estimation in Australia; National Water Commission: Canberra, Australia, 2012; ISBN 978-1-921853-54-8. [Google Scholar]
  61. Tregoning, P.; Lambeck, K.; Ramillien, G. GRACE estimates of sea surface height anomalies in the Gulf of Carpentaria, Australia. Earth Planet. Sci. Lett. 2008, 271, 241–244. [Google Scholar] [CrossRef]
  62. Peel, M.C.; Finlayson, B.L.; McMahon, T.A. Updated world map of the Köppen-Geiger climate classification. Hydrol. Earth Syst. Sci. 2007, 11, 1633–1644. [Google Scholar] [CrossRef]
  63. Khandu; Forootan, E.; Schumacher, M.; Awange, J.L.; Müller Schmied, H. Exploring the influence of precipitation extremes and human water use on total water storage (TWS) changes in the Ganges-Brahmaputra-Meghna River Basin. Water Resour. Res. 2016, 52, 2240–2258. [Google Scholar] [CrossRef]
  64. Mcgrath, G.; Sadler, R.; Fleming, K.; Tregoning, P.; Hinz, C.; Veneklaas, E. Tropical cyclones and the ecohydrology of Australia’s recent continental-scale drought. Geophys. Res. Lett. 2012, 39, 1–6. [Google Scholar] [CrossRef]
  65. Van Dijk, A.I.J.M.; Beck, H.E.; Crosbie, R.S.; de Jeu, R.A.M.; Liu, Y.Y.; Podger, G.M.; Timbal, B.; Viney, N.R. The Millennium Drought in southeast Australia (2001–2009): Natural and human causes and implications for water resources, ecosystems, economy, and society. Water Resour. Res. 2013, 49, 1040–1057. [Google Scholar] [CrossRef]
  66. Chen, J.L.; Wilson, C.R.; Tapley, B.D.; Scanlon, B.; Güntner, A. Long-term groundwater storage change in Victoria, Australia from satellite gravity and in situ observations. Glob. Planet. Chang. 2016, 139, 56–65. [Google Scholar] [CrossRef]
  67. CSIRO. Water Yields and Demands in South-West Western Australia; A Report to the Australian Government from the CSIRO South-West Western Australia Sustainable Yields Project; Department of the Environment, Water, Heritage and the Arts, CSIRO Water for a Healthy Country Flagship: Canberra, Australia, 2009.
  68. García-García, D.; Ummenhofer, C.C.; Zlotnicki, V. Australian water mass variations from GRACE data linked to Indo-Pacific climate variability. Remote Sens. Environ. 2011, 115, 2175–2183. [Google Scholar] [CrossRef]
  69. Webber, M.; Crow-Miller, B.; Rogers, S. The South–North Water Transfer Project: Remaking the geography of China. Reg. Stud. 2017, 51, 370–382. [Google Scholar] [CrossRef]
  70. Houborg, R.; Rodell, M.; Li, B.; Reichle, R.; Zaitchik, B.F. Drought indicators based on model-assimilated Gravity Recovery and Climate Experiment (GRACE) terrestrial water storage observations. Water Resour. Res. 2012, 48, W07525. [Google Scholar] [CrossRef]
  71. Müller Schmied, H.; Adam, L.; Eisner, S.; Fink, G.; Flörke, M.; Kim, H.; Oki, T.; Portmann, F.T.; Reinecke, R.; Riedel, C.; et al. Impact of climate forcing uncertainty and human water use on global and continental water balance components. Proc. Int. Assoc. Hydrol. Sci. 2016, 374, 53–62. [Google Scholar]
  72. Hunger, M.; Döll, P. Value of river discharge data for global-scale hydrological modeling. Hydrol. Earth Syst. Sci. 2008, 12, 841–861. [Google Scholar] [CrossRef]
  73. Sutanudjaja, E.H.; van Beek, L.P.H.; de Jong, S.M.; van Geer, F.C.; Bierkens, M.F.P. Large-scale groundwater modeling using global datasets: A test case for the Rhine-Meuse basin. Hydrol. Earth Syst. Sci. 2011, 15, 2913–2935. [Google Scholar] [CrossRef] [Green Version]
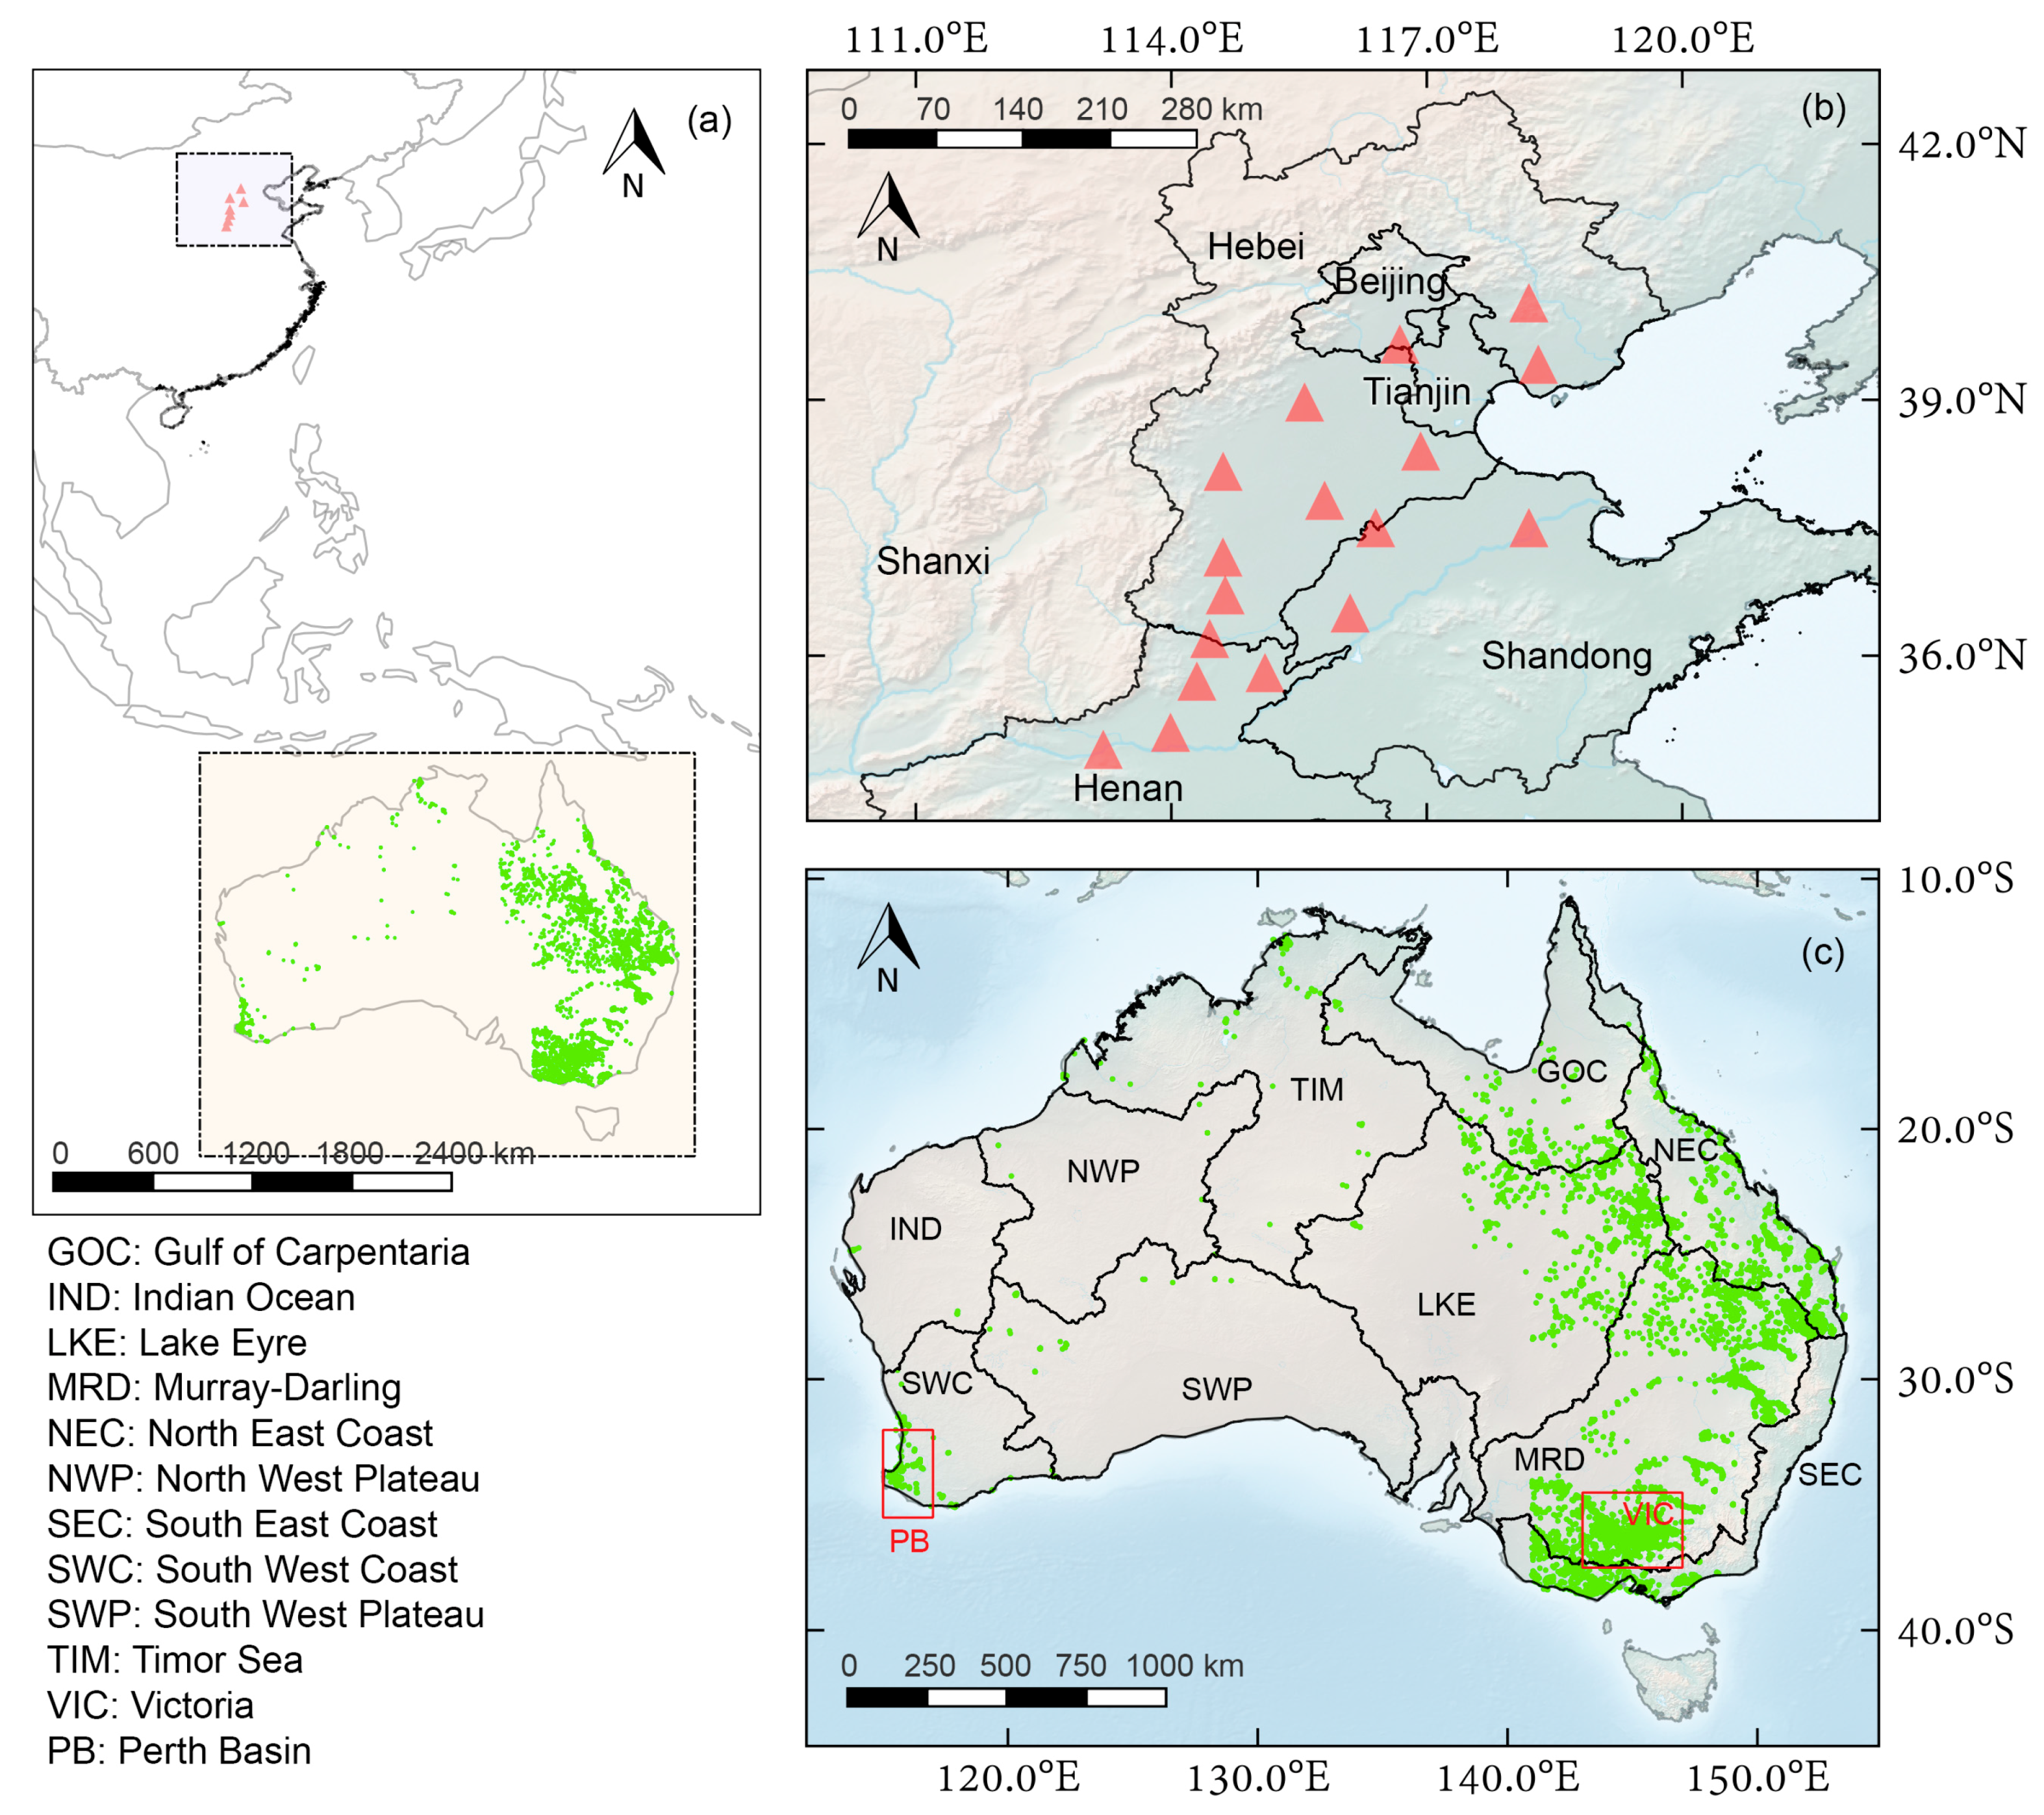
Figure 1. (a) Geographical locations of the study areas; (b) the North China Plain (NCP); and (c) Australia. The groundwater locations (red triangles) in major cities of NCP are shown in (b) while the locations of groundwater observation bores (green dots) in Australia are shown in (c).
Remotesensing 10 00483 g001
Figure 2. The ΔTWS estimates from PCR-GLOBWB (EnOL, green), GRACE DA (EnKS 3D, red), and the GRACE observation (black) in the GOC (a); MRD (b); SWC (c); and the NCP (d). The uncertainties of the ΔTWS estimates are also shown.
Remotesensing 10 00483 g002
Figure 3. The correlation coefficient between the GRACE observation and ΔTWS estimates from four models (CABLE (a,f), WGHM (b,g), W3 (c,h), PCR-GLOBWB (d,i)) and GRACE DA (e,j) in Australia (top row) and NCP (bottom row).
Remotesensing 10 00483 g003
Figure 4. The RMS difference (cm) between the GRACE observation and ΔTWS estimates from four models (CABLE (a,f), WGHM (b,g), W3 (c,h), PCR-GLOBWB (d,i)) and GRACE DA (e,j) in Australia (top row) and NCP (bottom row).
Remotesensing 10 00483 g004
Figure 5. The seasonal amplitude (cm) of the ΔTWS (second row) and ΔGWS (third row) estimates from four models (CABLE (b,g), WGHM (c,h), W3 (d,i), PCR-GLOBWB (e,j)) and GRACE DA (f,k) in Australia. The amplitude of the GRACE observation is also shown (a).
Remotesensing 10 00483 g005
Figure 6. Same as Figure 5, but in the NCP.
Remotesensing 10 00483 g006
Figure 7. The long-term trend (cm/year) of the ΔTWS (second row) and ΔGWS (third row) estimates from four models (CABLE (b,g), WGHM (c,h), W3 (d,i), PCR-GLOBWB (e,j)) and the GRACE DA (f,k) in Australia. The trend of the GRACE observation is also shown (a).
Remotesensing 10 00483 g007
Figure 8. Same as Figure 7, but in the NCP. Note that the color scale of WGHM is different from other models, a more than twice as great (see insert color bars in (c,h)).
Remotesensing 10 00483 g008
Figure 9. The correlation coefficient between the in situ ΔGL data and the ΔGWS estimate from four models (CABLE (a), WGHM (b), W3 (c), PCR-GLOBWB (d)) and GRACE DA (e) in Australia. The difference between GRACE DA and PCR-GLOBWB (GRACE DA minus PCR-GLOBWB) is also shown (f).
Remotesensing 10 00483 g009
Figure 10. Same as Figure 9 but in NCP. The cross (x) mark in (f) indicates the groundwater measurement associated with shallow aquifer (averaged depth less than 10 m).
Remotesensing 10 00483 g010
Figure 11. The averaged correlation coefficient between the in situ ΔGL and the ΔGWS estimate from four models and GRACE DA in Australia, and the NCP. In Australia, only the basins with more than 20 in situ ΔGL pixels are analyzed. The averaged value of Australia is also shown (AVG). In the NCP, only the in situ ΔGL data measured from the deep aquifer are considered.
Remotesensing 10 00483 g011
Figure 12. The ΔGWS estimates (left axis) from four models and GRACE DA in Murray-Darling basin. The in situ ΔGL data as well as the yearly rainfall (cm/month/year) and Δ P (see text for the description) are also shown (right axis).
Remotesensing 10 00483 g012
Figure 13. Same as Figure 12, but in VIC (a); PB (b); and NCP (c). For visualization purposes, the additional axis (magenta left axis) is displayed for the WGHM estimated ΔTWS in NCP (c).
Remotesensing 10 00483 g013
Table 1. The correlation coefficient (ρ, 5% significance level) between GRACE observation and the ΔTWS estimates from four different models and GRACE DA in different study regions (see full name in Figure 1). The averaged value of Australia is also given.
River BasinCABLEWGHMW3PCR-GLOBWBGRACE DA
GOC0.700.680.760.590.81
IND0.330.310.370.430.54
LKE0.730.360.640.610.65
MRD0.710.400.690.690.76
NEC0.730.510.660.700.82
NWP0.660.350.580.490.65
SEC0.550.550.510.560.73
SWC0.250.450.540.460.66
SWP0.460.210.450.460.66
TIM0.720.610.760.570.78
Average0.580.440.600.560.71
NCP0.350.360.350.420.60
Table 2. The RMS difference (cm) between GRACE observation and the ΔTWS estimates from four different models and GRACE DA in different study regions (see full name in Figure 1). The averaged value of Australia is also given.
River Basin CABLEWGHMW3PCR-GLOBWBGRACE DA
GOC12.7510.949.9718.977.74
IND4.432.943.203.752.62
LKE4.413.392.883.862.85
MRD5.025.634.215.973.77
NEC10.927.577.6618.495.10
NWP5.225.224.325.084.14
SEC8.737.907.4010.375.51
SWC5.464.414.016.023.59
SWP3.452.812.554.872.06
TIM7.798.466.8314.025.43
Average6.825.935.309.144.28
NCP5.465.514.143.382.93
Table 3. The correlation coefficient (respect to in situ ∆GL data) and long-term trend (cm/year) of the ΔGWS estimates from four different models, GRACE DA, TRMM ( Δ P ), and in situ ∆GL in the basins with excessive groundwater consumption. The depletion period used to calculate the long-term trend is also shown.
CABLEWGHMW3PCR-GLOBWBGRACE DATRMM ( Δ P )∆GL
Correlation
MUR0.800.680.340.820.840.831.0
PB−0.150.030.07−0.250.450.181.0
VIC0.540.440.300.580.690.591.0
NCP0.030.880.010.870.910.121.0
Trend
MUR
(2004–2009)
−0.35 ± 0.01−0.01 ± 0.005−0.01 ± 0.0039 × 10⁻⁴ ± 1 × 10⁻⁴−0.09 ± 0.01−6.90 ± 0.14−0.20 ± 0.01
PB
(2004–009)
0.45 ± 0.040.05 ± 0.020.08 ± 0.032.61 ± 0.10−0.71 ± 0.041.61 ± 0.21−16.03 ± 0.94
VIC
(2004 –009)
−0.66 ± 0.01−0.21 ± 0.01−0.05 ± 0.01−0.02 ± 0.01−0.25 ± 0.01−11.05 ± 0.22−2.29 ± 0.18
NCP
(2003–2014)
0.10 ± 0.02−3.51 ± 0.04−0.005 ± 0.003−1.59 ± 0.01−1.41 ± 0.01−0.21 ± 0.09−37.19 ± 0.62