Dust Detection and Intensity Estimation Using Himawari-8/AHI Observation
by
 ,
,
Lu She
1,2, 
Yong Xue
1,3,*,
Xihua Yang
4,
Jie Guang
1,
Ying Li
1,2,
Yahui Che
1,2,
Cheng Fan
1,2 and
Yanqing Xie
1,2 1
State Key Laboratory of Remote Sensing Science, Jointly Sponsored by the Institute of Remote Sensing and Digital Earth of Chinese Academy of Sciences and Beijing Normal University, Institute of Remote Sensing and Digital Earth, Chinese Academy of Sciences, Beijing 100101, China
2
University of Chinese Academy of Sciences, Beijing 100049, China
3
Department of Electronics, Computing and Mathematics, College of Engineering and Technology, University of Derby, Derby DE22 1GB, UK
4
New South Wales Office of Environment and Heritage, Parramatta, NSW 2050, Australia
*
Author to whom correspondence should be addressed.
Remote Sens. 2018, 10(4), 490; https://doi.org/10.3390/rs10040490
Submission received: 23 January 2018
/
Revised: 16 March 2018
/
Accepted: 20 March 2018
/
Published: 21 March 2018
(This article belongs to the Section Atmospheric Remote Sensing)
Abstract
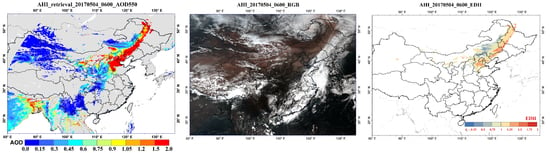
:In this study, simple dust detection and intensity estimation methods using Himawari-8 Advanced Himawari Imager (AHI) data are developed. Based on the differences of thermal radiation characteristics between dust and other typical objects, brightness temperature difference (BTD) among four channels (BT11–BT12, BT8–BT11, and BT3–BT11) are used together for dust detection. When considering the thermal radiation variation of dust particles over different land cover types, a dynamic threshold scheme for dust detection is adopted. An enhanced dust intensity index (EDII) is developed based on the reflectance of visible/near-infrared bands, BT of thermal-infrared bands, and aerosol optical depth (AOD), and is applied to the detected dust area. The AOD is retrieved using multiple temporal AHI observations by assuming little surface change in a short time period (i.e., 1–2 days) and proved with high accuracy using the Aerosol Robotic Network (AERONET) and cross-compared with MODIS AOD products. The dust detection results agree qualitatively with the dust locations that were revealed by AHI true color images. The results were also compared quantitatively with dust identification results from the AERONET AOD and Ångström exponent, achieving a total dust detection accuracy of 84%. A good agreement is obtained between EDII and the visibility data from National Climatic Data Center ground measurements, with a correlation coefficient of 0.81, indicating the effectiveness of EDII in dust monitoring.
1. Introduction
Mineral dust aerosol is tiny soil particle that is suspended in the atmosphere [1]. It is one of the most important aerosols as it affects the Earth’s radiation balance, hydrological cycle, and biogeochemical cycles [1,2]. Previous studies confirm that mineral dust has significant impacts on regional and global climate via a series of complex processes [1,2,3,4,5,6,7]. Dust particles can produce strong backscattering to solar radiation at shortwave band, which significantly changes the albedo of the Earth-atmosphere system. They can also absorb incoming solar radiation and outgoing radiation, and thus alter the distribution of long-wave radiation [8,9]. Besides, dust aerosols can change the microphysical properties of cloud and affect precipitation processes, and thus indirectly affect the energy balance [8,10,11,12]. Dust aerosol also has a range of impacts on humans and environment [12,13].
The dominant sources of the atmospheric dusts are deserts, arid, and semi-arid regions [14]. The most important dust source is the Sahara, which accounts for about half of the global dust emissions [13,15]. The long-distance transport and optical properties of Sahara dust have been investigated by many studies [4,5,6,7,16]. As the second largest mineral dust source, Taklimakan desert, and Gobi desert are mainly responsible for the strong dust storms in East Asia [3]. Large quantities of dust particles are transported towards Northern China [17], Korean Peninsula, and Japan [18], even across the pacific to North America [19]. Desert dust is a main contributor to particulate mass load in Northern China during spring seasons [17,20]. The affected area and duration of dust events are dominantly determined by the dust intensity, dust sources, optical properties of the dust particles, and meteorological condition [4,5,6,21,22]. It is important to monitor the dust events over China, especially the dust distribution, transport, as well as the dust intensity.
Many studies have been carried out to monitor dust using satellite data, including polar orbiting satellites, such as Ozone Monitoring Instrument (OMI) [23,24], MODerate-resolution Imaging Spectroradiometer (MODIS) [25,26,27], and geostationary satellites, such as Chinese Feng-Yun (FY) [28] and Meteosat Second Generation (MSG) [29,30]. Various methods were proposed to detect dust using satellite observations in ultraviolet (UV) [13,14], visible (VIS) and/or Near infrared (NIR) [25,31,32], and thermal-infrared (TIR) channels [26,29,33,34,35,36]. Generally, those methods can be classified into three groups: TIR-based methods, shortwave reflectance-based methods, and methods that are based on the combination of shortwave reflectance and TIR. Among them, dust detection based on brightness temperature (BT) in TIR channels are the most widely used, due to its advantage of monitoring dust at nighttime and over ‘bright’ surface [37,38]. According to Ackerman [36], the real and imaginary parts of complex refractive indices for quartz are wavelength dependent in the TIR region, which can be used for dust detection. Algorithms using brightness temperature difference (BTD) between two IR channels were developed [35,36], which typically are BTD between 11 µm and 12 µm (BTD (11–12)), 8 µm and 11 µm (BTD (8–11)), and 3 µm and 11 µm (BTD (3–11)) [18,25,26,28,29]. The dust presence is especially indicated by the negative BTD (11–12). In this paper, BTD between two wavelengths ( and ) is generally defined as . Moreover, dust indices were introduced by combining different thermal band BT, such as TDI (thermal-infrared dust index) [39] and D/D*-parameter [40,41,42]. In these methods, a fixed threshold was used. However, as the BTD is strongly related to the land temperature, land emissivity, and the dust properties, including the dust layer height, size distribution, and chemical composition [43,44,45,46], the ability of BTD methods with fixed threshold values varies from situation to situation [16,28,37]. For example, Baddock et al. [28] and Jafari et al. [47] suggested that the threshold-based methods are sensitive to different dust events, and that it is difficult to use a single fixed threshold to identify the dust-laden area for all dust events. Multiple temporal TIR composition methods were also developed. For example, instead of using threshold applied on single-date images, the infrared difference dust index (IDDI) method is based on the difference between the sensor observed BT and BT from the clear-sky image, which is defined by the maximum BT (10–12 µm) within a 15-day reference period [28,48]. Similarly, Park et al. [26] compared the BT ratios (BTλ1/BTλ2) of the 30-day clear sky composited image and the observed image.
Based on the strong absorption of dust in UV/blue spectral region, dust detection methods using spectral reflectance in shortwave (UV, VIS, and NIR) were developed, including the absorbing Aerosol Index from OMI [13] and the normalized different dust density (NDDI) based on the reflectance in 0.47 µm and 2.1 µm bands [32]. However, it is suggested that NDDI is highly sensitive to bright land surface, thus it is difficult to separate the dust from deserts [47]. Based on the spectral dependence of Rayleigh scattering, surface reflectance, and dust absorption, Ciren et al. [25] developed a dust aerosol index and a non-dust aerosol index using MODIS observations at 0.41, 0.44, and 2.13 µm. However, this method cannot be employed directly to other sensor data, e.g., Himawari-8 Advanced Himawari Imager (AHI), due to band availability.
Algorithms based on the combination of VIS/NIR and IR channels to detect dust are also developed. Miller [15] introduced an index using multi-channels reflectance, and BT at 11 µm and 12 µm to separate dust from other objects. Di et al. [49] developed an dust index, called the Enhanced Dust Index (EDI), which is based on aerosol optical depth (AOD), BTD (3–11), and the reflectance in 0.63 and 1.6 µm channels, and the dust index shows high consistency with visibility data from ground-based measurements.
In this study, a simple dust detection method using BT over both bright and dark surface is proposed using Himawari-8/AHI observations. An enhanced dust intensity index (EDII), which couples the AOD and spectral reflectance/BT, was also proposed. The AOD was retrieved using multiple temporal AHI VIS channels and validated using AERONET and cross-compared with MODIS AOD. A regression analysis between the visibility and EDII was performed for validation. The algorithm is applied to investigate AHI data over Northern China acquired in March–June 2017. This paper is organized as follows. Section 2 introduces the study area and the data used. Section 3 presents the algorithm, including the theory, dust detection methods, AOD retrieval, and dust index calculation. Section 4 describes the results and validation. A summary is given in Section 5.
2. Study Area and Data
Figure 1 shows the land cover map for the study area, which is adopted from MODIS Land cover product (MCD12C1) [50]. Northwestern China (Taklimakan Desert and Gobi Desert) and Mongolia emit huge amounts of mineral dust every year, causing abundant dust storms, especially during spring seasons.
2.1. Himawari-8 (H8) Advanced Himawari Imager (AHI) Data
Himawari-8 (H8) satellite was launched on 7 October 2014 by the Japan Meteorological Agency (JMA), and started operation on 7 July 2015. H8 carries a new payload, called Advanced Himawari Imager (AHI), which can provide multi-spectral image. As shown in Table 1, AHI has 16 channels, including three visible (VIS) channels (0.47, 0.51, 0.67 µm), three near infrared (NIR) channels, and 10 mid and thermal infrared channels. AHI Level-2 calibrated data from JMA have a spatial coverage of 120° by 120°, and centered at 0°N, 140°E with a spatial resolution of 2–10 km for different products. AHI sensor can scan the full-disk every 10 min. It offers unique advantages for dust detection, as well as tracking dust movement. In this paper, AHI Level-2 calibrated data with a spatial resolution of 2 km were used, which have been converted to reflectance for VIS and NIR channels, and to BT for thermal infrared channels. Data are obtained from Japan Aerospace Exploration Agency (JAXA) Earth Observation Research Center (EORC), which are provided by JMA (download from http://www.eorc.jaxa.jp/ptree/terms.html).
2.2. MODIS/Aqua and Terra
MODIS aerosol products are used to validate the retrieved AODs. The current Collection 6 (C6) aerosol product provides AOD from both dark-target and deep-blue algorithms and a combination of them for a better spatial coverage [51]. MODIS C6 aerosol product has been intensively evaluated at both the regional and global scale [52,53]. According to Levy et al. [51] the MODIS AOD has expected errors (EE) of for dark-target algorithm and for deep-blue algorithm [54]. In this study, dark-target and deep-blue combined AOD was used for a better spatial coverage.
2.3. AERONET Data
AERONET AOD and Ångström exponent were used to validate the retrieved AODs and to define the dust area for AHI dust detection validation. AERONET is a ground-based aerosol network [55], which provides spectral AOD and inversion product derived from the direct and diffuse radiation measured by Cimel sun/sky-radiometers [56]. The Level-1.5 data are cloud screened, and Level-2 data are cloud screened and quality assured. Both Level-1.5 and Level-2 AOD from ten AERONET sites in the study area during March–June in 2017 were used to validate the retrieved AODs from AHI data. AOD and Ångström exponent from both Level-1.5 and Level-2 were also used to define dust area for AHI dust detection results validation.
2.4. Visibility Data
Visibility data are used to show the effectiveness of EDII. Visibility data from global surface summary of day product produced by the National Climatic Data Center (NCDC) were used to compare with the dust index. These daily data are built by using the Integrated Surface Data, which includes global data obtained from the USAF Climatology Center, located in the Federal Climate Complex within NCDC. Visibility data from this product are mean visibility for the day. There are hundreds of stations located in China, which provide data since 1970s. In this study, daily mean visibility data during March–June in 2017 were used.
3. Methods
3.1. Therory Base of Dust Detection and Intensity Indication
As dust aerosols show distinguished radiative properties over a wide wavelength range from VIS to IR over different underlying backgrounds, it is possible to effectively identify them through the distinct spectral reflective and thermal radiation characteristics. Figure 2 shows the comparison of spectral reflective (Figure 2a) and thermal radiation (Figure 2b) characteristics of several typical objects, including thin dust, thick dust, cloud, bare/desert ground, and dark ground. The spectral reflective and thermal radiation data are derived from AHI sensor and the samples were collected from different dust events in mainland China during 2016 and 2017. The mean reflectance and BT of all the samples were calculated. Dusts show a higher reflectance in the NIR wavelength region and lower reflectance in blue wavelength region when compared with other objects (Figure 2a). The reflectance of dust increases with the wavelength, reaches maximum value at 1.61 µm, and drops slightly at 2.25 µm. The big difference between reflectance at 0.47 and 1.61 µm suggests the potential of utilizing VIS/NIR reflectance to indicate information about dust intensity.
In the thermal-infrared channels, cloud shows low BT, while ground shows high BT at most of channels (Figure 2b). BT at 11.2 µm (BT11) is greater than that at 12.4 µm (BT12) for ground and cloud, while it is lower for dust. BTD between 8.6 and 11 µm (BTD (8–11)) is larger for dust than for the ground and cloud. In addition, the big differences between BT at 3.9 (BT3) and 11 µm for dust particles were evident. Consequently, the dust can be identified by using the BTDs between the different channels [35], e.g., the difference between 3.9 and 11 µm. Besides, Ackerman [36] found that the increasing of dust optical depth increases the BTD (8–11) and BTD (11–12). Thus, the combination of 3.9, 8.6, 11.2, and 12.4 µm BT is very promising to identify the dust. Furthermore, as a major contribution to aerosol loading, dust aerosols are strongly related to high AODs.
3.2. Dust Detection
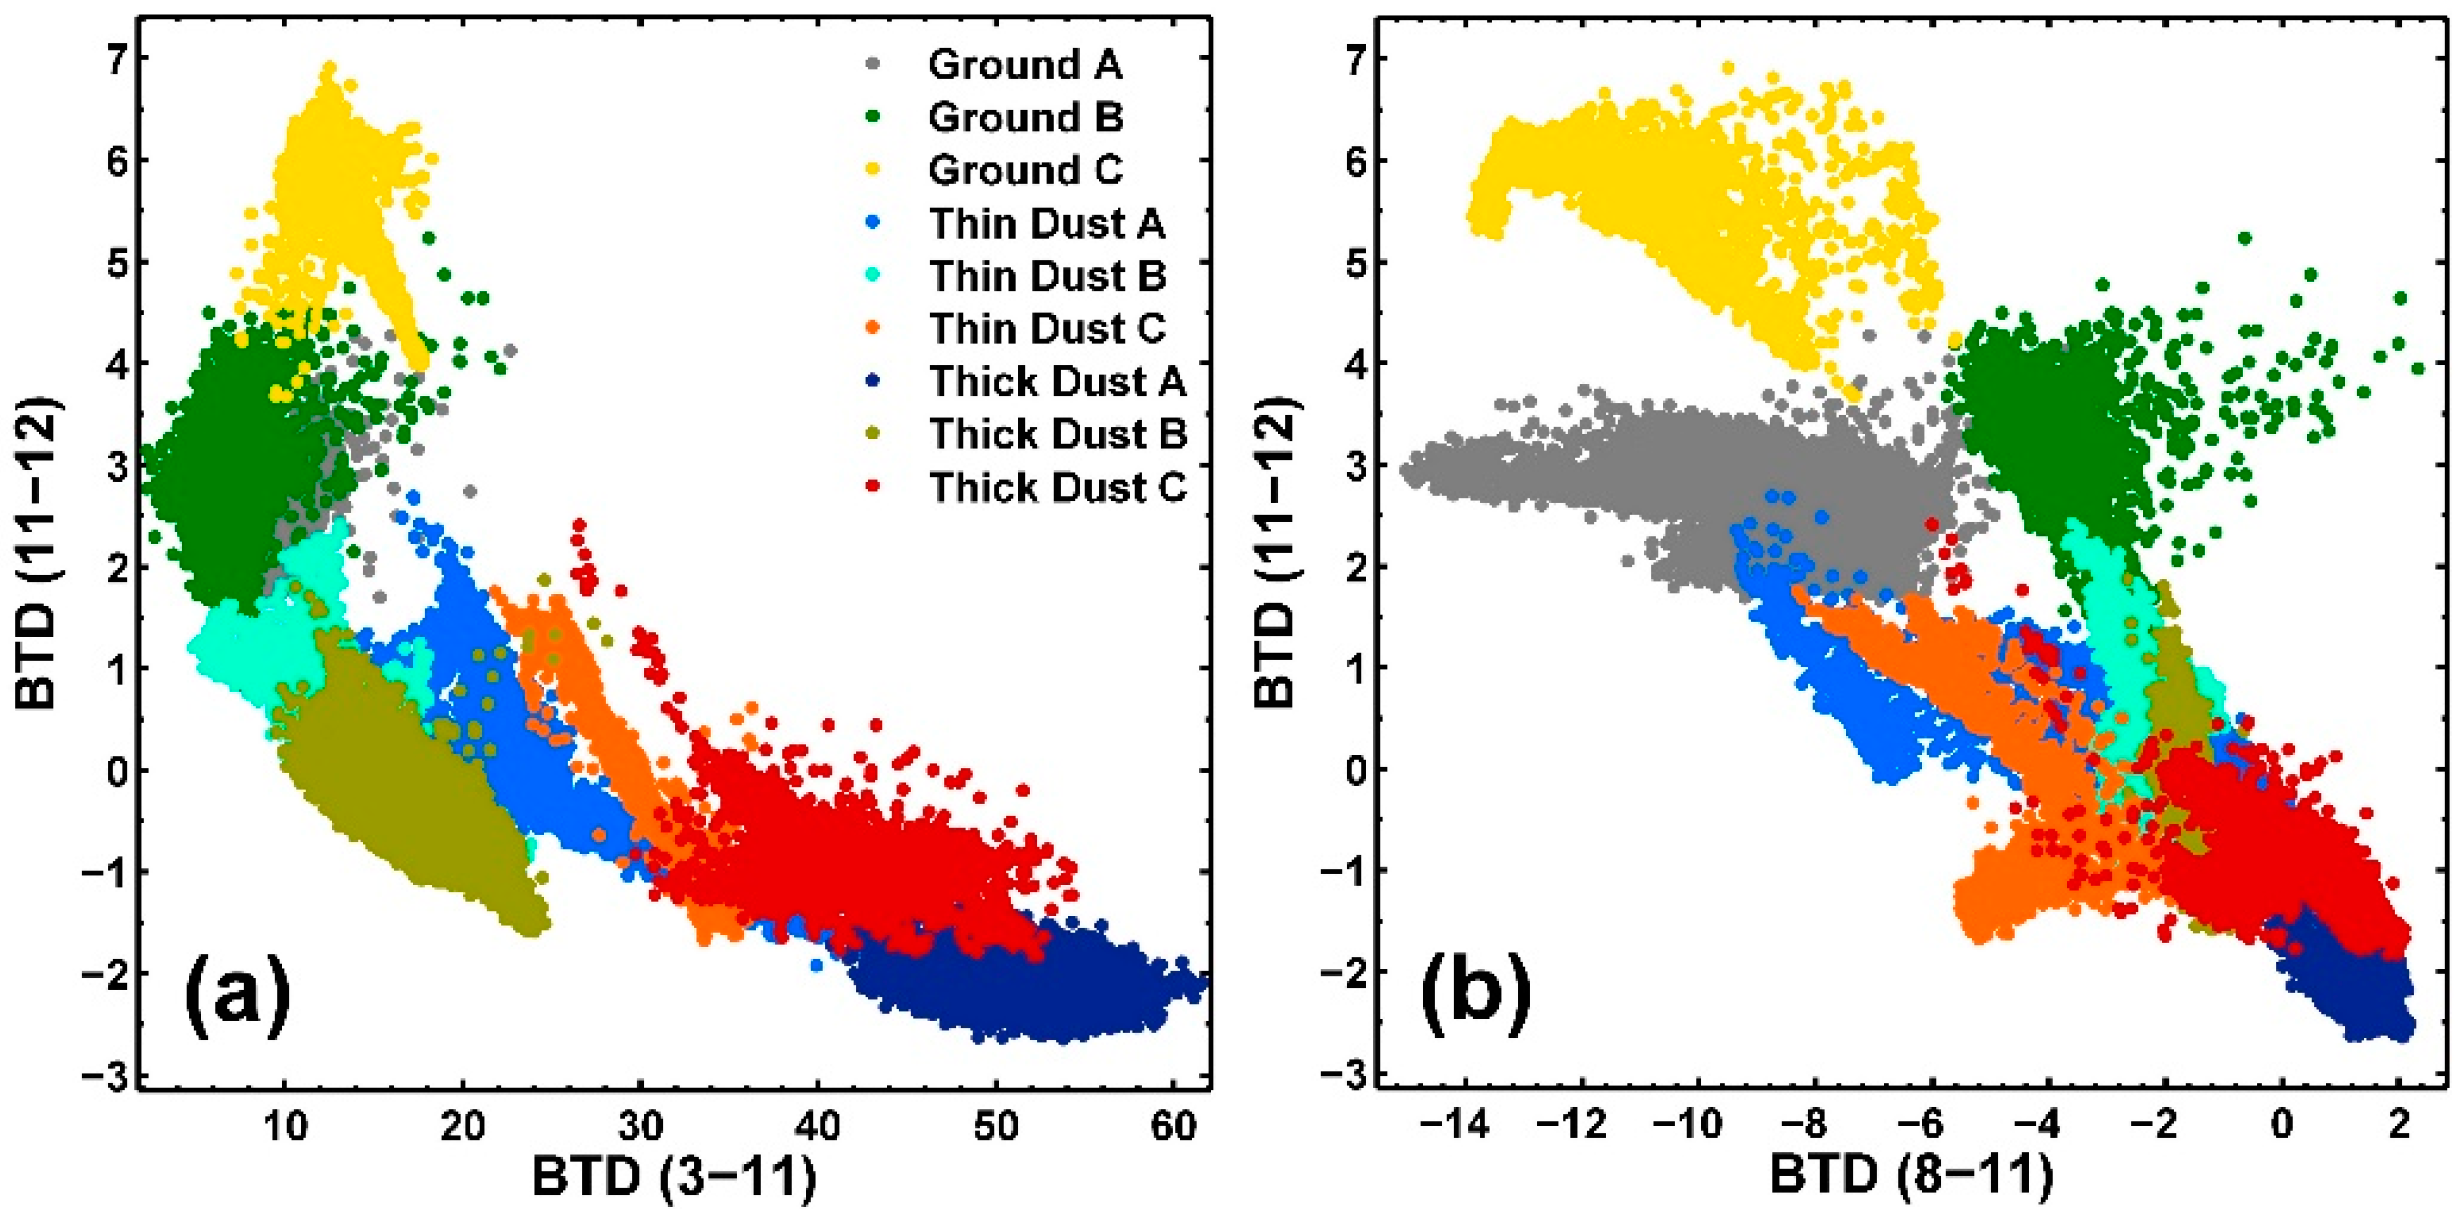
According to Seemann et al. [57], the emissivity in IR channels varied with different surface types, and the thresholds of BTD are strongly related to the source regions [26,58]. It is necessary to consider the regional difference of surface types in dust detection. In order to address this issue, efforts have been made to analyze BT characteristics over different regions. Figure 3 depicts the scatterplots of BTD as a function of different surface types, including Gobi (Ground A), relatively dark ground (Ground B), and desert (Ground C). As the plots show, there is no clearly gap between dust-free samples and dusty samples. BTDs under clear sky vary from place to place. The BTD characteristics of dust also vary greatly over typical surface types. It is difficult to distinguish the dust area using a single fixed BTD threshold over different surface types. Instead, if we focus on one surface type at a time, relatively clear boundaries can be found.
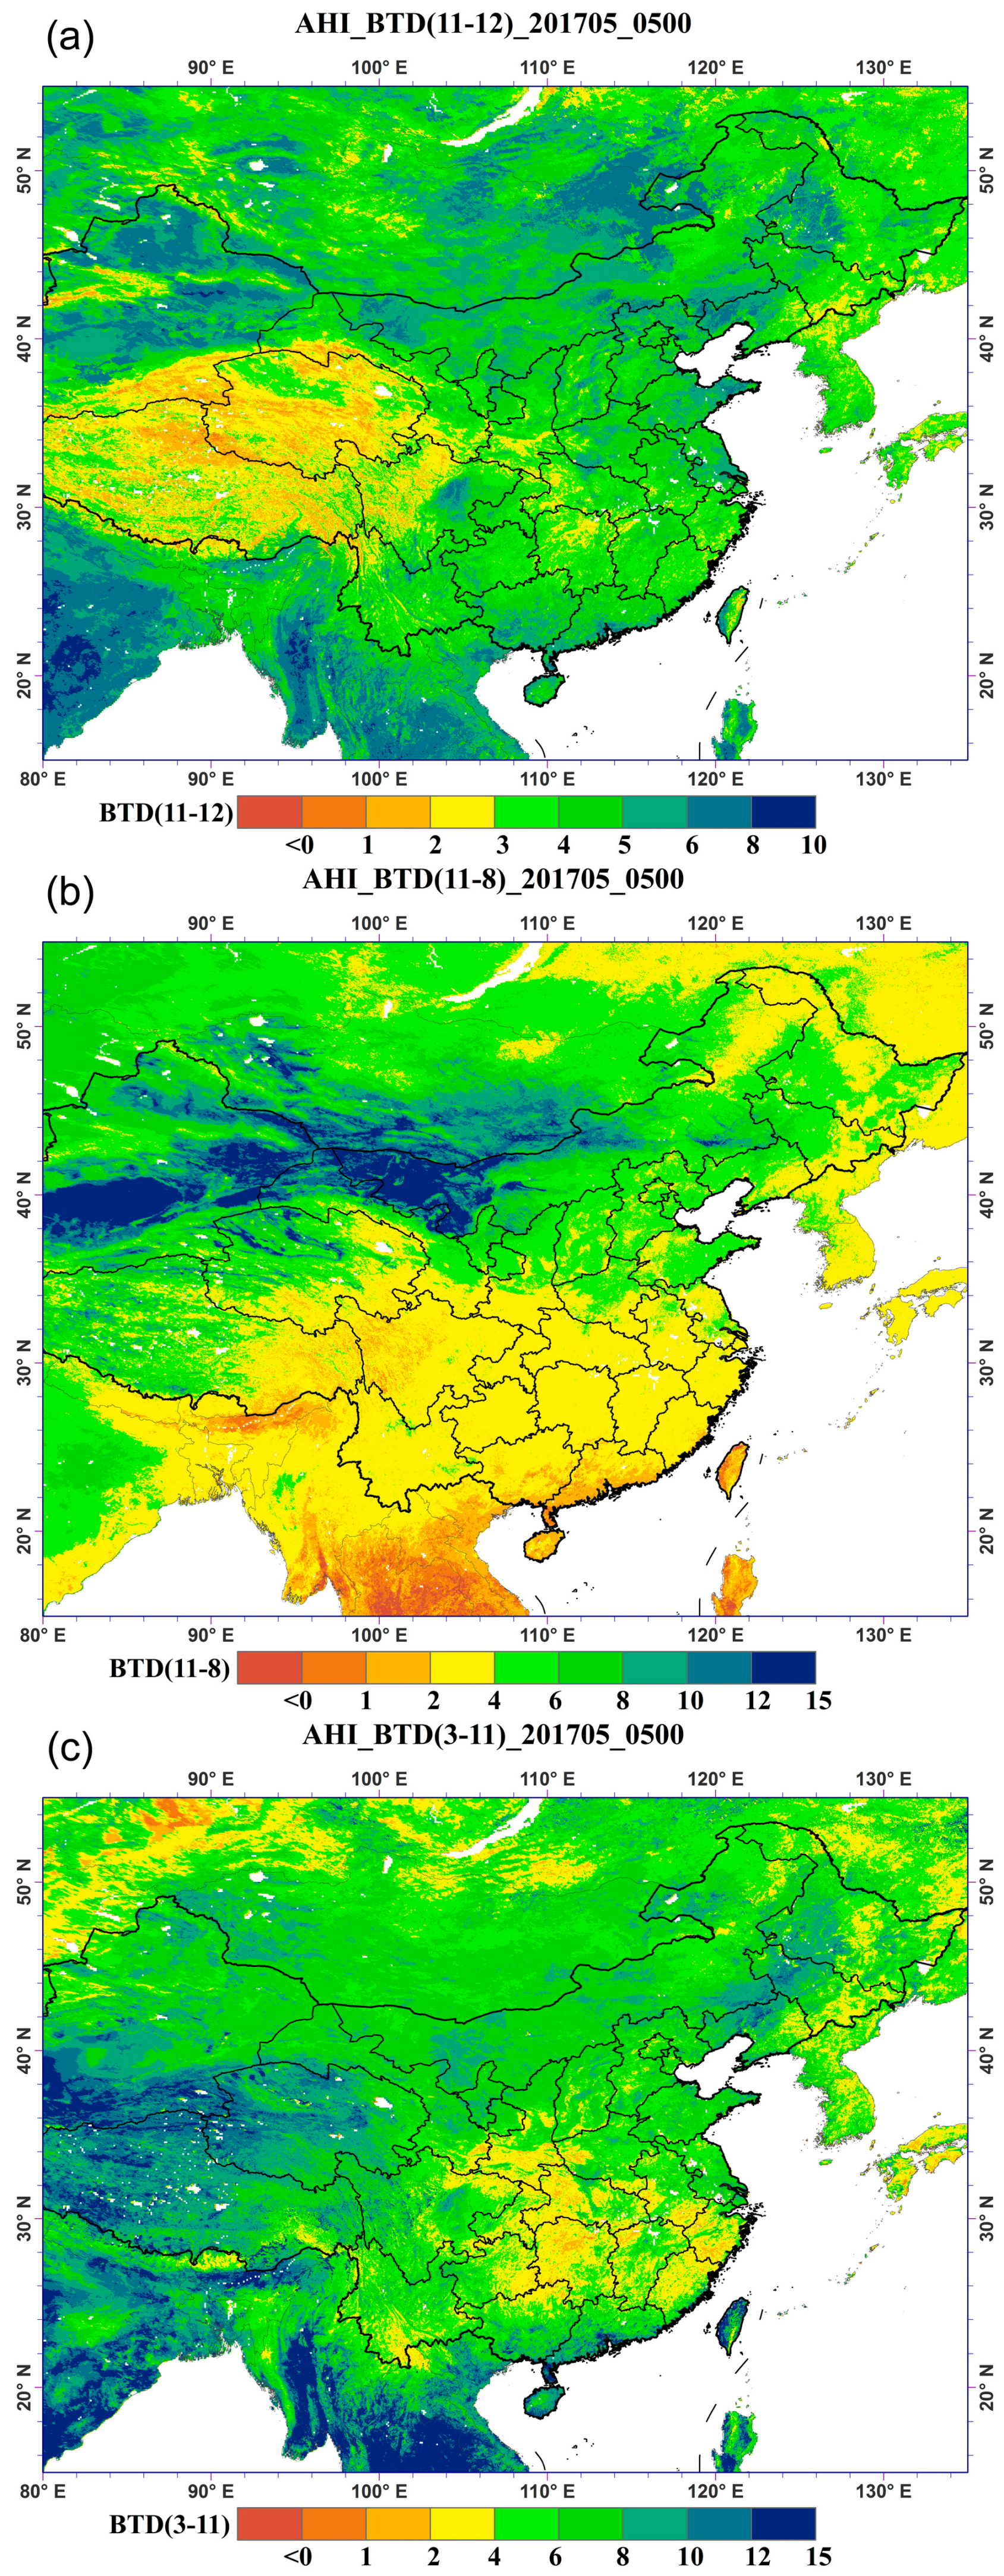
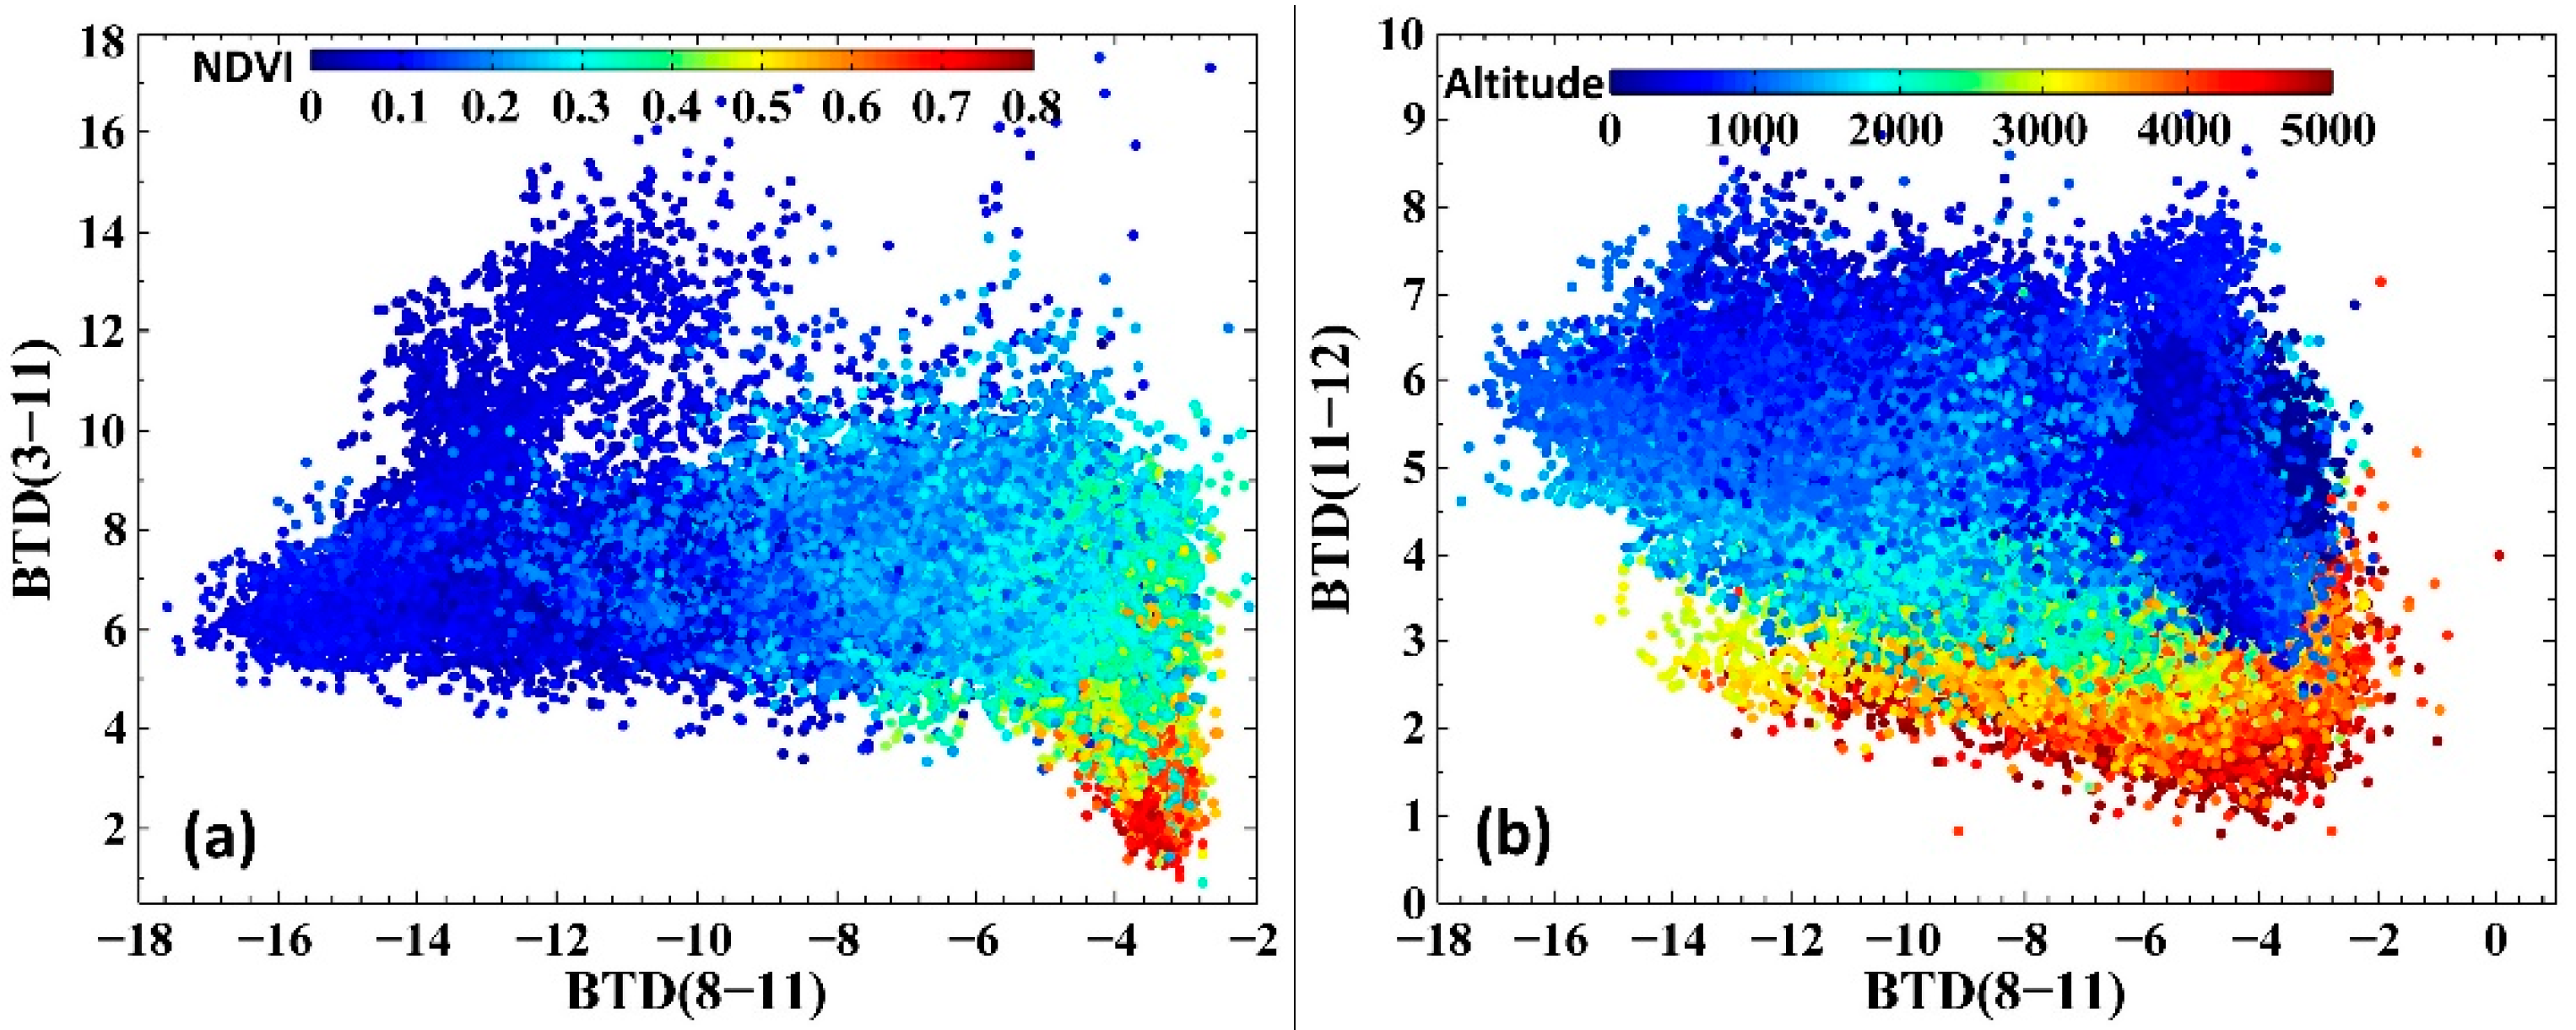
To determine a suitable dust identification method for different regions, the spatial distribution of the background BTDs over China mainland was analyzed. Figure 4 shows the clear sky BTDs at 05:00 UTC in May 2017. The clear sky reference BT was obtained by selecting the maximum BT at 11 µm within 30-day window for every hour. The BTD distributions show geographic and surface-type dependency by comparing the background BTDs with the normalized difference vegetation Index (NDVI) and altitude (Figure 5). On the one hand, the BTDs were strongly related to NDVI. The plots of BTD (3–11) verse BTD (8–11) show two clusters: (i) when NDVI is greater than 0.3, BTD (8–11) is generally greater than −5 K and BTD (3–11) ranged 1–9; (ii) when NDVI is less than 0.3, the BTD (3–11) tends to be large than 5 K. On the other hand, the BTD (11–12) scatters were also separated into two clusters in the altitude space: (i) when the altitude is less than 3000, the BTD (11–12) is larger than 2.5 K, (ii) when altitude is greater than 3000, the BTD (11–12) is generally greater than 1 and less than 4 K. Thus, a NDVI value of 0.3 and an altitude value of 3000 were combined to classify land surface into three types: (1) arid and semiarid region, (2) relatively dark region, and (3) high altitude region. For these three regions, different thresholds were tested to optimize dust detection. Training data were manually selected based on the AHI true color images. A total of more than 100 scenes of dusty days from March–June in 2016 and 2017 were used for training, specific dates of AHI data used for this training are listed in Table 2. The following dust identification thresholds were determined:
For dust detection over arid and semiarid region:
For dust detection over relatively dark region:
For dust detection over high altitude region:
3.3. Dust Index
Di et al. [49] proposed an Enhanced Dust Index for dust detection over the Xinjiang region using Indian geostationary satellite—INSAT 3A/D IMGER data. The EDI is calculated using observations at VIS, NIR, and TIR channels, and AOD:
In which, and denote the TOA reflectance at 1.6 and 0.6 µm, while BT3.7 and BT11 refer to the brightness temperature at 3.7 and 11 µm. a = 0.1, b = 10, and c = 0.1 are three coefficients to balance different component contributions. It is proved that this EDI can indicate dust intensity effectively over the Xinjiang region. However, EDI does not work well for northern China in our tests using AHI data, as a single EDI without dust mask might lead to incorrect dust identification due to high AOD caused by fine mode aerosol (e.g., frequently haze weather in northern China).
A new dust index based on the EDI, but adaptive to the AHI sensor data, is designed. Firstly, dust has the minimum and maximum reflectance values at the AHI 0.47 µm and 1.61 µm bands, respectively, based on the analysis in Section 3.1 and in previous studies [59,60,61]. Thus, the AHI 0.47 and 1.61 µm reflectance difference is effective to describe the dust intensity. Similar to the NDDI () [32], was employed as a component to describe the dust intensity. Secondly, dust strongly increases the AHI BT at 3.9 µm, while it decreases the AHI BT at 11 µm. The BTD between AHI 3.7 and 11 µm shows a positive relationship with dust intensity. Thirdly, the AOD is also strongly related to the dust intensity, which has been reported by previous studies [53,54]. Consequently, an enhanced dust intensity index (EDII) was proposed for AHI sensor data:
where A = 1, B = 10, and C = 0.1 and the AHI AOD retrieval is detailed in the following. These coefficients are determined based on Di et al. [49] and adapted to AHI data by analysis of AHI dust and non-dust observations. Typical areas with dust, deserts, and non-desert land surface are selected as training samples. A bunch of coefficient combinations are tested to make sure the EDII values of dust pixels are greater than 0, and the EDII values of pixels for land surface without dust are less than 0. In this way, the balance among the three component contributions is achieved and the EDII values can also be used for dust detection with 0 values as a boundary value.
An aerosol retrieval algorithm assuming a stable surface Bidirectional Reflectance Distribution Function (BRDF) in a short time period (i.e., 1–2 days) was designed to retrieve hourly AOD and surface BRDF parameters from multi-temporal AHI data [62,63]. Unlike the dark target method, this algorithm can retrieve AOD over bright surface and does not make any assumptions on the VIS and NIR reflectance relationships. Unlike the deep blue method, this algorithm does not require historical observation data to construct land surface reflectance. This algorithm is suitable for satellite data with high frequency observations (e.g., 10 min for AHI) so that there are enough observations for a robust model inversion.
The radiative transfer function with coupled BRDF are expressed as [64]:
where is the solar/view zenith angle and is the relative azimuth angle. represents the top of atmosphere (TOA) reflectance, is the contribution of the atmospheric path reflectance to the TOA reflectance. and are the total transmission of light on the sun-land path and the sensor-land path, respectively. is the atmosphere hemispherical albedo. is the surface spectral albedo, while is the surface bidirectional reflectance. The Ross-Thick-Li-Sparse (RTLS) model was employed to describe the surface BRDF, which expressed as [65]
The three kernel coefficients depend on the wavelength, while the kernels , , and depend only on the sun-view geometry. The expressions for all three kernels can be found in Wanner et al. [65]. The RTLS model is also used in MODIS BRDF products [66].
This aerosol retrieval algorithm assumes that the surface bidirectional reflective property (the three BRDF kernel coefficients) change little within short time period (e.g., 1–2 days). Using multi-spectral and multi-temporal AHI observations, the AOD and BRDF kernel coefficients are retrieved through an optimization method, i.e., to minimize the following cost function [67,68]:
where denotes the unknown parameters to be retrieved (i.e., the AOD and three kernel parameters for each band), is the initial state of the variables, which are derived from the MODIS BRDF product for the kernel coefficients. is the calculated TOA reflectance based on the radiative transfer forward model (Equation (6)) and variables . is the observed AHI TOA reflectance. and are the error covariance matrices for the AHI TOA reflectance and the initial state of the variables (), respectively. The uncertainty of AHI TOA reflectance is band-independent. Consequently, the diagonal components of are calculated by multiplying the spectral reflectance with the radiometric calibration accuracy for each band. The diagonal components of are obtained from the uncertainty of MODIS BRDF product. The Levenberg-Marquardt method is used for the minimization to obtain the AOD and BRDF kernel parameters. This joint retrieval of AOD and BRDF kernel parameters were proven to be effective [63,68,69].
4. Results and Validation
The dust detection and dust index algorithms were applied to AHI data acquired from March to June in 2017. Dust detection results are qualitatively compared with the RGB images, and quantitatively compared with the dust detection results from the AERONET measurements. EDII is evaluated using visibility data from the ground-based observations. In addition, we compared the retrieved AHI AOD with MODIS aerosol product and AERONET AOD observations.
4.1. Results of Dust Detection and Dust Index
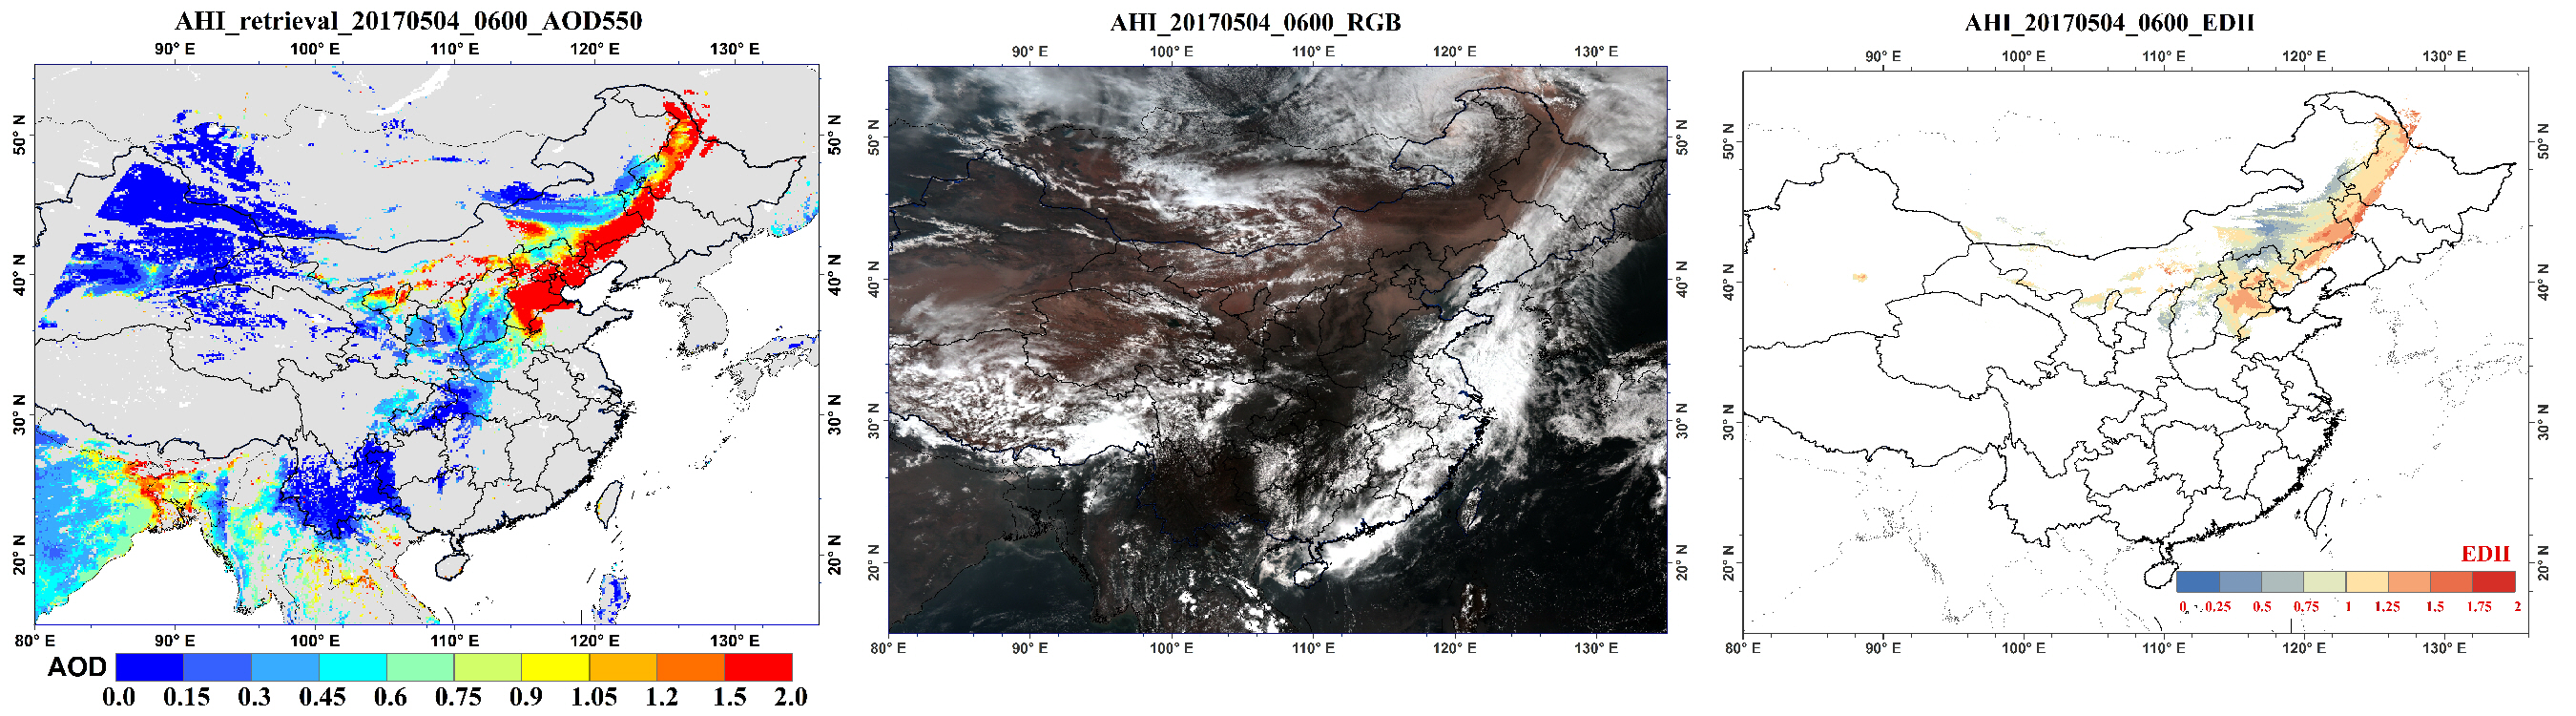
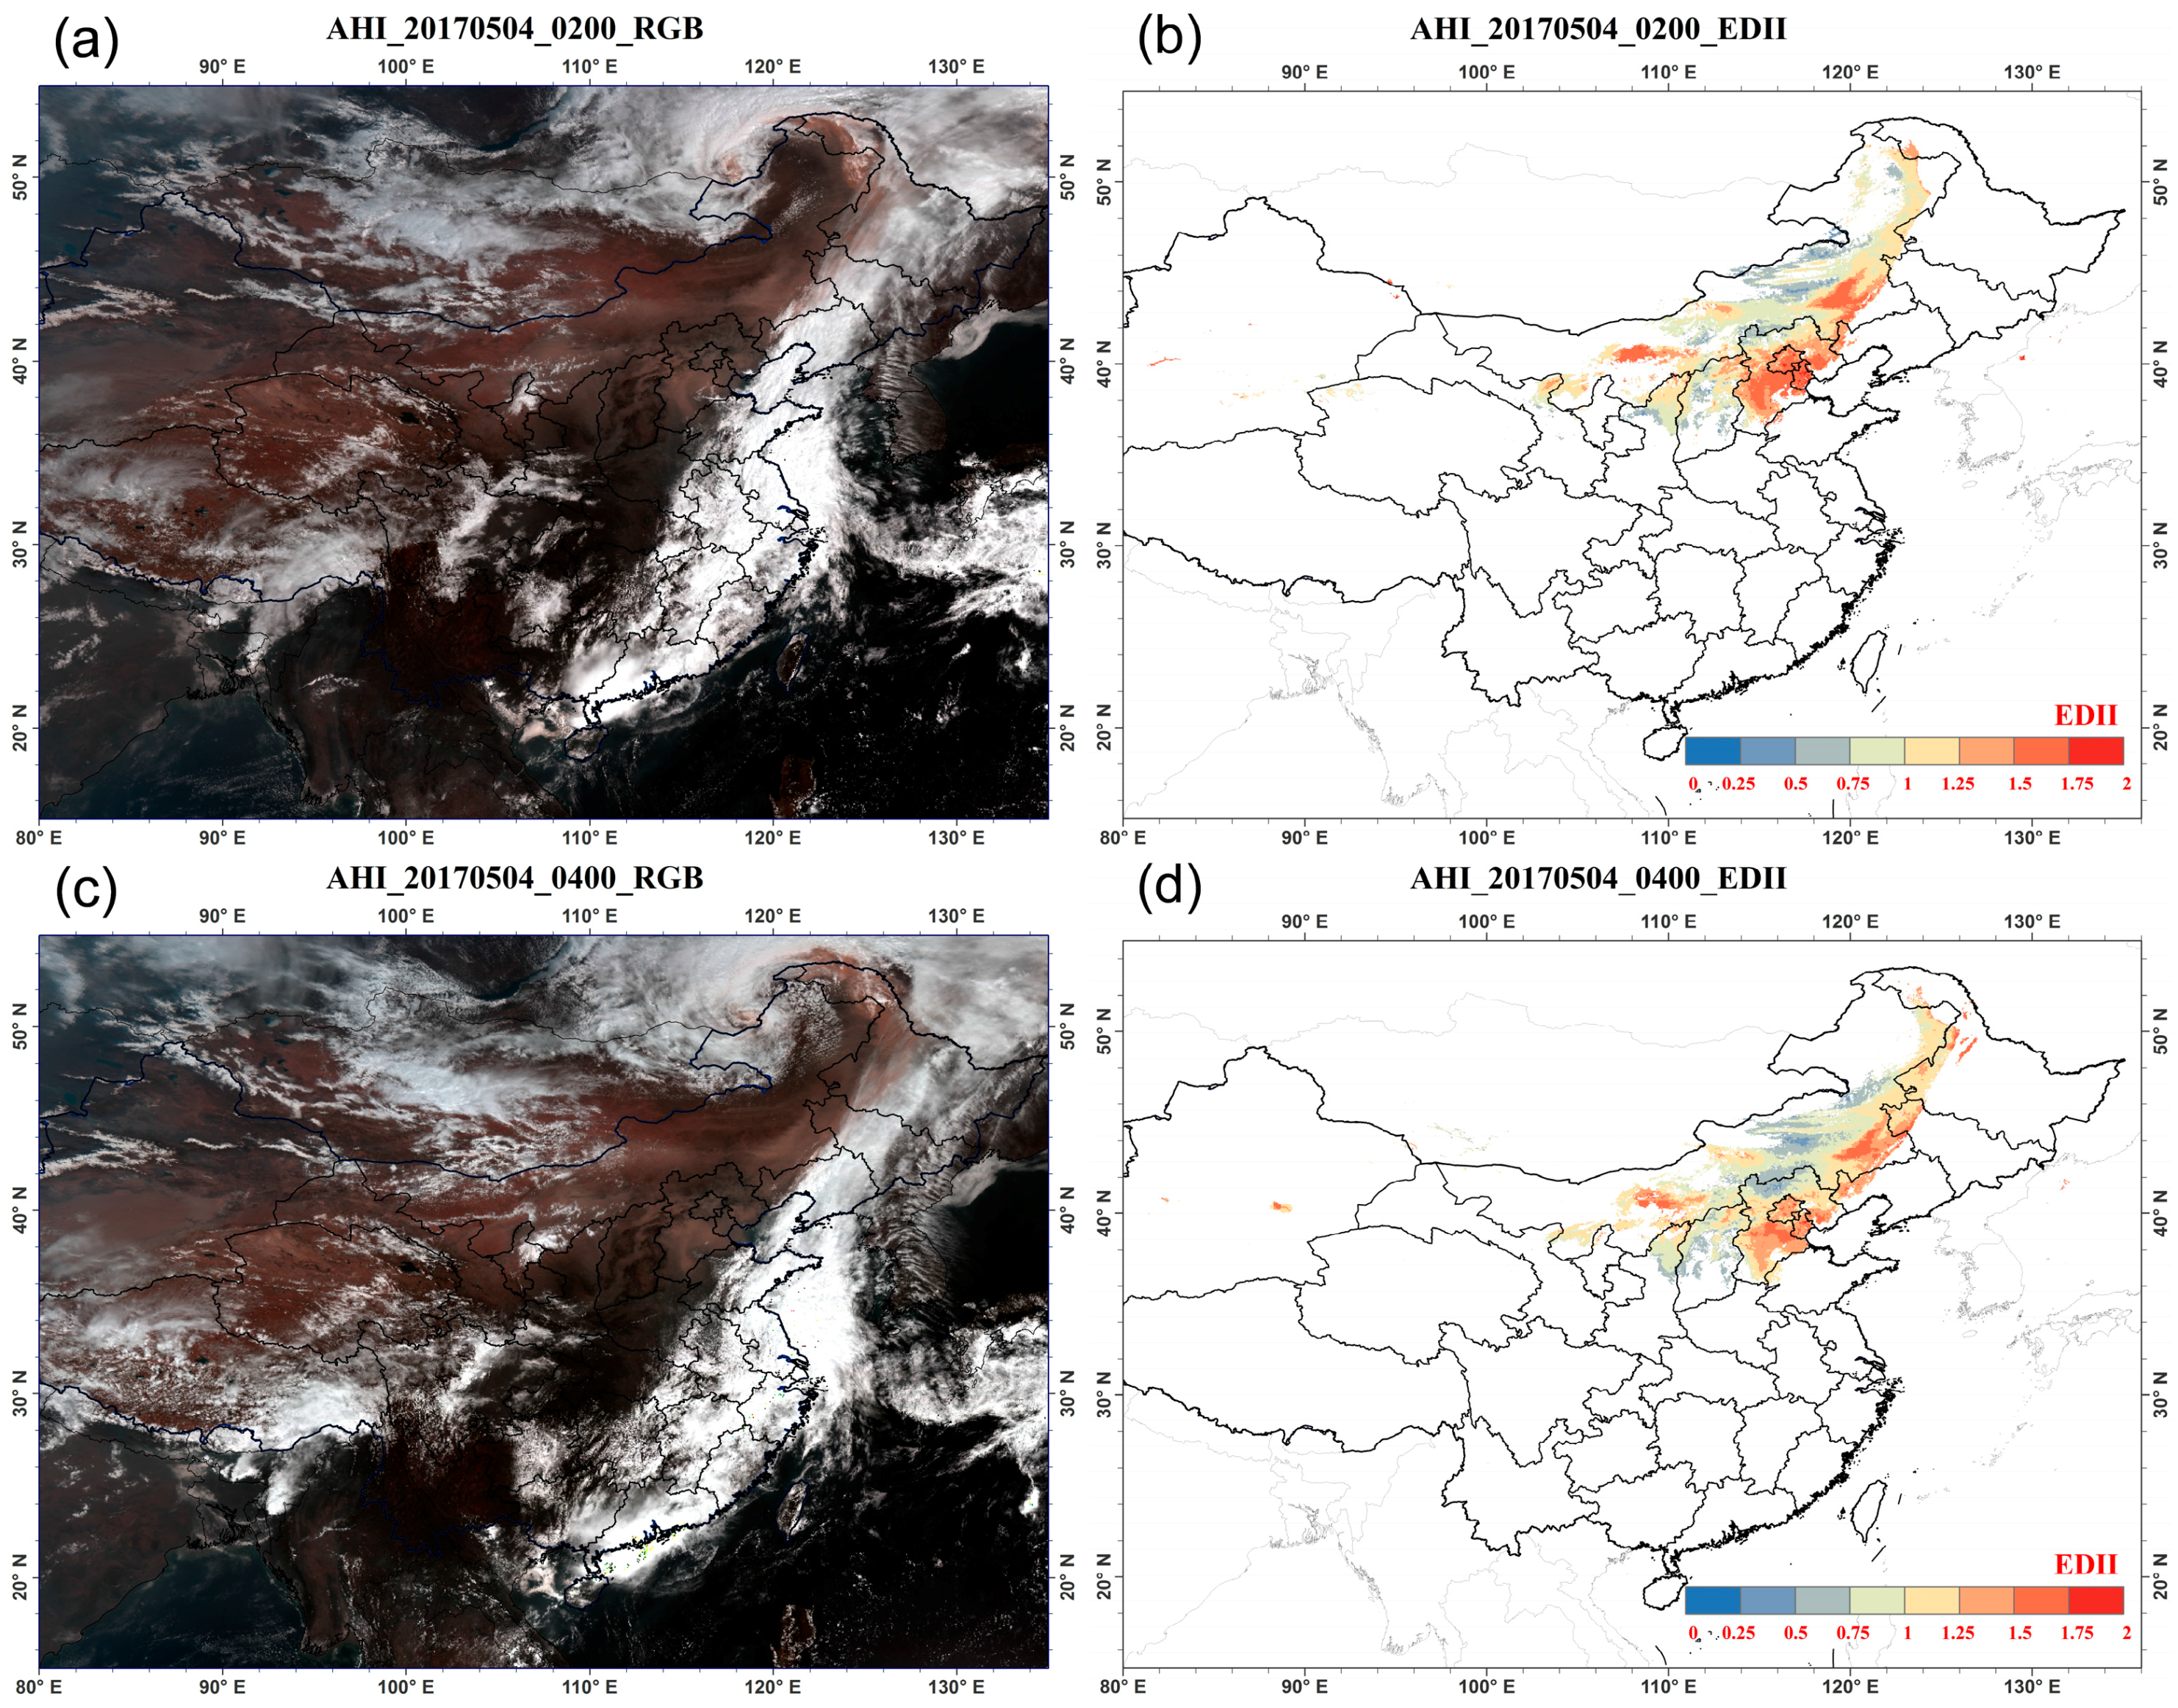
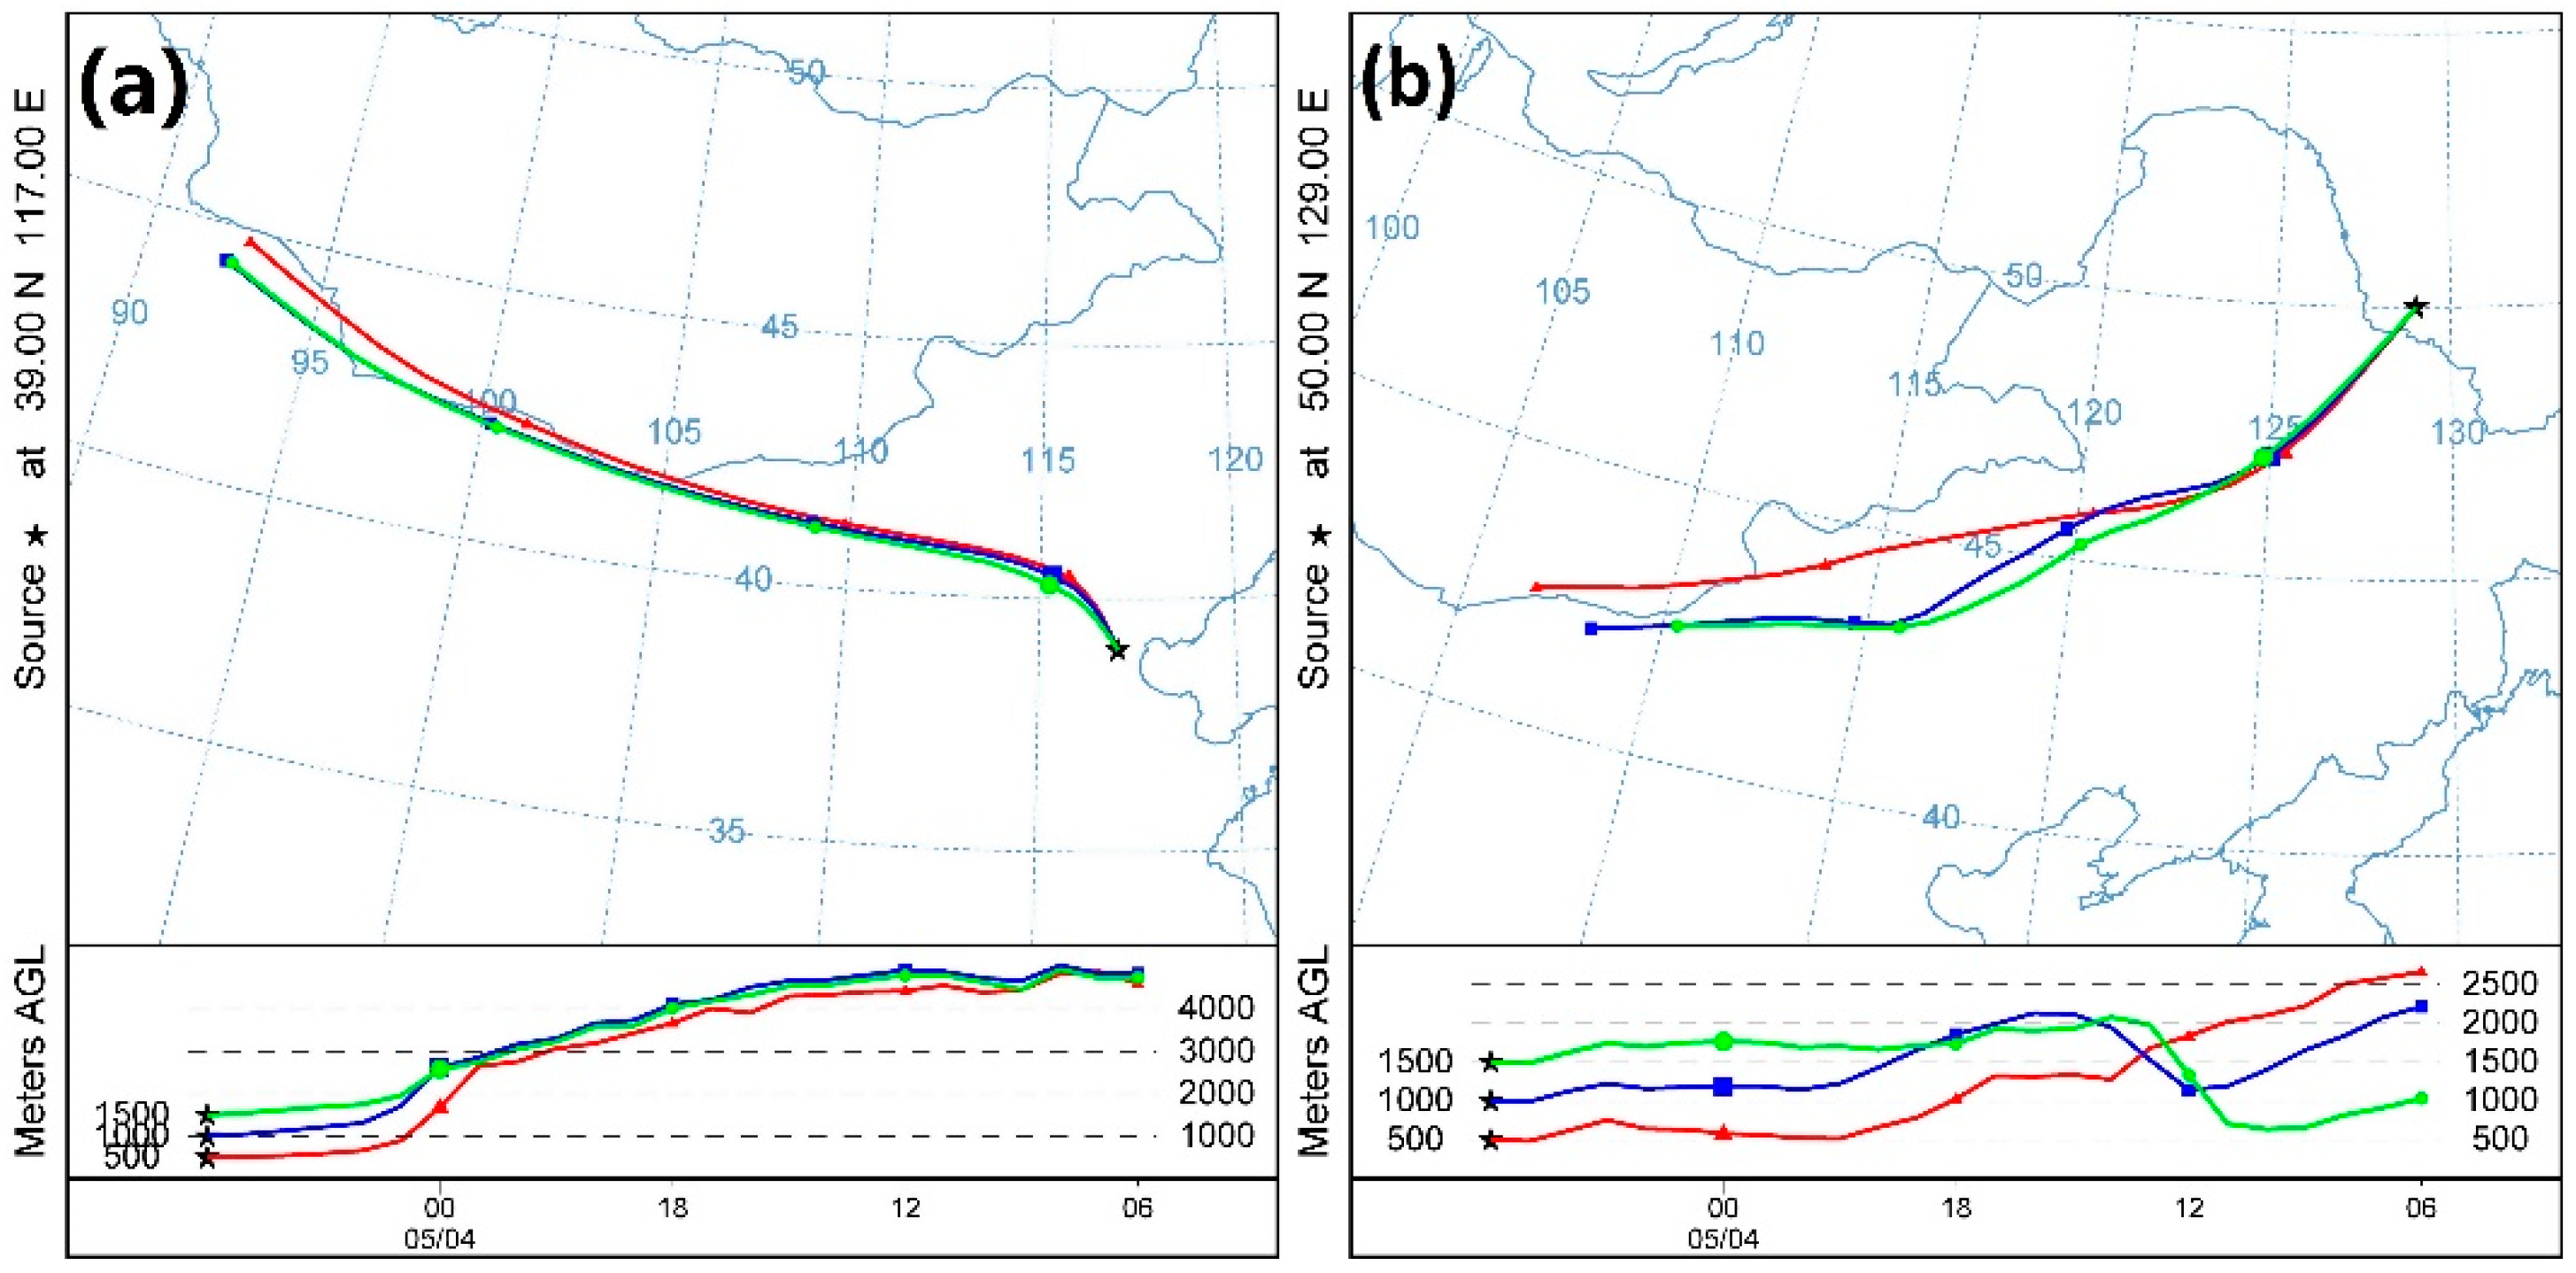
For qualitative evaluation, AHI Red, Green, and Blue (RGB) composite images and EDII images from 02:00 to 08:00 UTC at 2 h interval on 3 May and 4 May 2017 were shown in Figure 6 and Figure 7, respectively. These two days are when a typical Asian dust event over northern China. Note that the EDII values are shown only for the detected dust area and for the area with an EDII greater than 0. The detected dust areas agree qualitatively with the dust locations that are revealed by AHI RGB images. As shown in Figure 6 and Figure 7, the dust storm originated from the deserts in Inner Mongolia in the morning of 3 May 2017. Then, large plumes of dust moved across the China-Mongolia border, and covered western southern Mongolia, Inner Mongolia, and Northwestern Gansu in the afternoon of 3 May. It arrived in north China and even northeastern of China on 4 May. This fast movement of the dust plume is well corresponding to the air mass trajectories. Figure 8a,b shows the 24 h forward air mass trajectories analysis on 4 May starting at northeast China and north China, respectively. The air mass trajectories are derived from the Hybrid Single-Particle Lagrangian Integrated Trajectory (HYSPLIT) model, and are computed at three different altitudes (500 m, 1000 m, and 1500 m). As the trajectories depict, the northern air masses at both of the sources are from the Gobi deserts. It indicates that the dust storm moved eastward and northeastward, and reached northeast China on 4 May, which is consistent with the results in Figure 6 and Figure 7. Besides, the dust plume over both bright land surface (e.g., Gobi desert) and ‘Dark land’ (e.g., North China), and even the small dust plumes over Taklimakan desert, were detected. However, a small part of dust plume is missed, such as the dust storm over Inner Mongolia in Figure 7. This may be because it is mixed with cloud.
The visual comparison between EDII and AHI true colors image also showed the consistency between the EDII value and dust intensity. This is evident by high EDII over central dust area (e.g., Inner Mongolia) and relatively small EDII over marginal part of dust areas (e.g., Xinjiang). The changes of the high EDII values are in agreement with the movement of the dust storms.
For quantitative evaluation, the dust detection results are compared with the dust identification results from the AERONET AOD and Ångström exponent. Ångström exponent is an indicator of aerosol particle size, i.e., a smaller value indicates larger particles, with value near 0 indicating a coarse mode dominant aerosol [70]. A dust criterion was adapted from Ciren et al. [25], i.e., any AERONET observation with AOD at 1020 nm greater than 0.3 and Ångström exponent between 440 and 870 nm less than 0.6 was classified as dusty observation. In this study, four stations (see Table 2) that are located in northern China covering the dust regions were used.
Dust detection results using hourly AHI observations from 01:00 UTC to 10:00 UTC from March to June in 2017 are evaluated. The AERONET observations are time-space matched with the dust detection results from AHI data. AERONET measurements were required within 15 min of satellite scan time. Only the satellite results within 25 km distance from AERONET station are used. For satellite dust detections, if more than one half of the cloud-free pixels were identified as dusty, the area is considered as dusty.
The performance of the dust detection was evaluated using three statistical indices [25], including the Accuracy, Probability of correct detection (PCD), and Probability of false detection (PFD):
where DD represents the number of matched points where both the AERONET and AHI detection results indicate ‘dust’, DN represents the number of matched points where AERONET detection result indicates ‘dust’, while AHI detection result indicates ‘no dust’, ND represents the number of matched points where AERONET detection result indicates ‘no dust’, while AHI detection result indicates ‘dust’, NN represents the number of matched points where both the AERONET and AHI detection results indicate ‘no dust’. Table 3 gives the evaluation results. A total of 172 matched points were obtained, with an Accuracy of 84%, a PCD of 77%, and a low PFD of 9%. Note that only the AERONET observations with AOD greater than 0.3 were used in matching points to balance the dust and non-dust matched points, i.e., to avoid an extremely large number of non-dust observations. Station-based statistics shows large differences. The best performance occurred at AOE_Baotou station, which has accuracy, PCD, and PFD values of 81%, 86%, and 13%, respectively. The worst detection was found at Beijing station, with a relatively low PCD of 69%. This is because Beijing is affected by both the transported dust particle and the haze that is caused by industrial pollution and traffic emission. The mixed particles exhibit more complex properties making dust detection difficult. Xianghe station shows similar behavior with Beijing. The Dalanzadgad station has low Accuracy and high PFD due to the relatively low number (25) of matchups and high ‘DN’ number.
Many studies have shown that the visibility is a good indicator of dust concentration [71,72]. In order to demonstrate that the EDII values are able to describe the intensity of dust, a regression analysis between the obtained EDII and ground measurements of visibility was performed. When considering that the low visibility might result from the high aerosol loading caused by fine mode particles, only data from stations located in northwest China were used to reduce the influence of the fine mode aerosols. AHI detection results within 25 km from the station are used. Daily average of the AHI EDII results was calculated and only AHI detection results with at least three cloud-free observations in one day are used. The data used for this comparison is from March–June 2017. A total of 116 matchups from 31 stations were obtained. Figure 9 depicts the scatter plot and the regression curve. A good agreement was obtained between the visibility and EDII, a quantitative relationship was obtained as: . The correlation coefficient reaches 0.81.
4.2. Results of Aerosol Optical Depth Retrieval
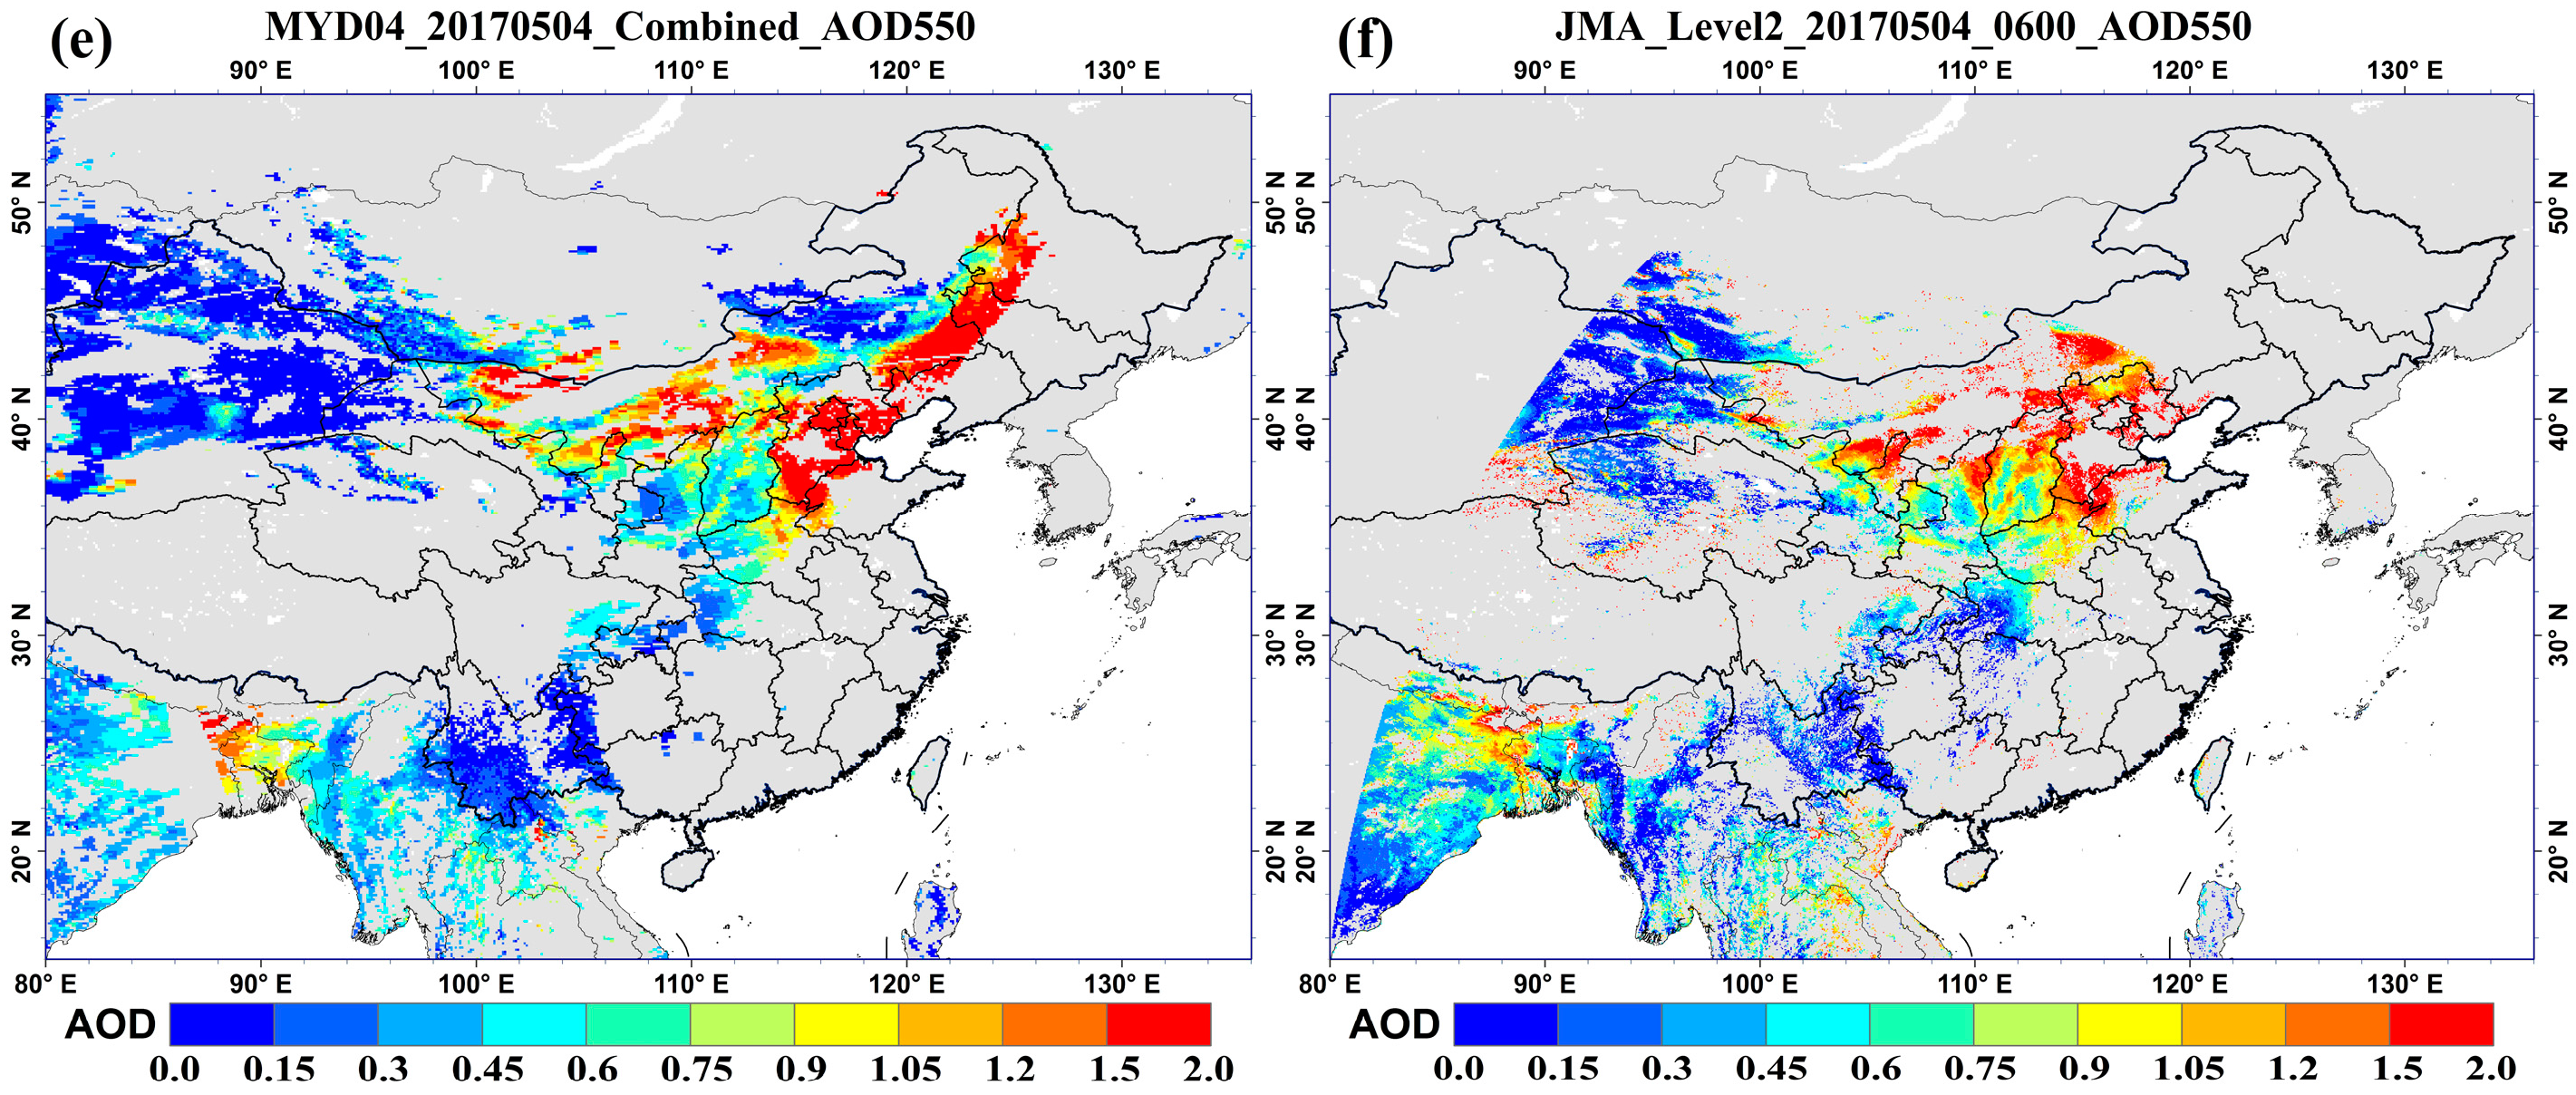
Retrieved AODs were compared with the MODIS C6 and AERONET AOD data. Figure 10 shows the comparison between the MODIS C6 AOD with our retrieved AOD at 03:00 UTC and 06:00 UTC. AODs from JMA L2 aerosol product were also employed to compare with our retrieval, as shown in the right column. Their corresponding RGB composite images were shown in Figure 7. Our retrieved AODs show similar spatial distribution with that of the MODIS C6 AOD, while the JMA L2 AODs missed some retrieval over strong dust area. Both MODIS and our retrieved AODs reveal the sharp contrast between dusty and clear areas.
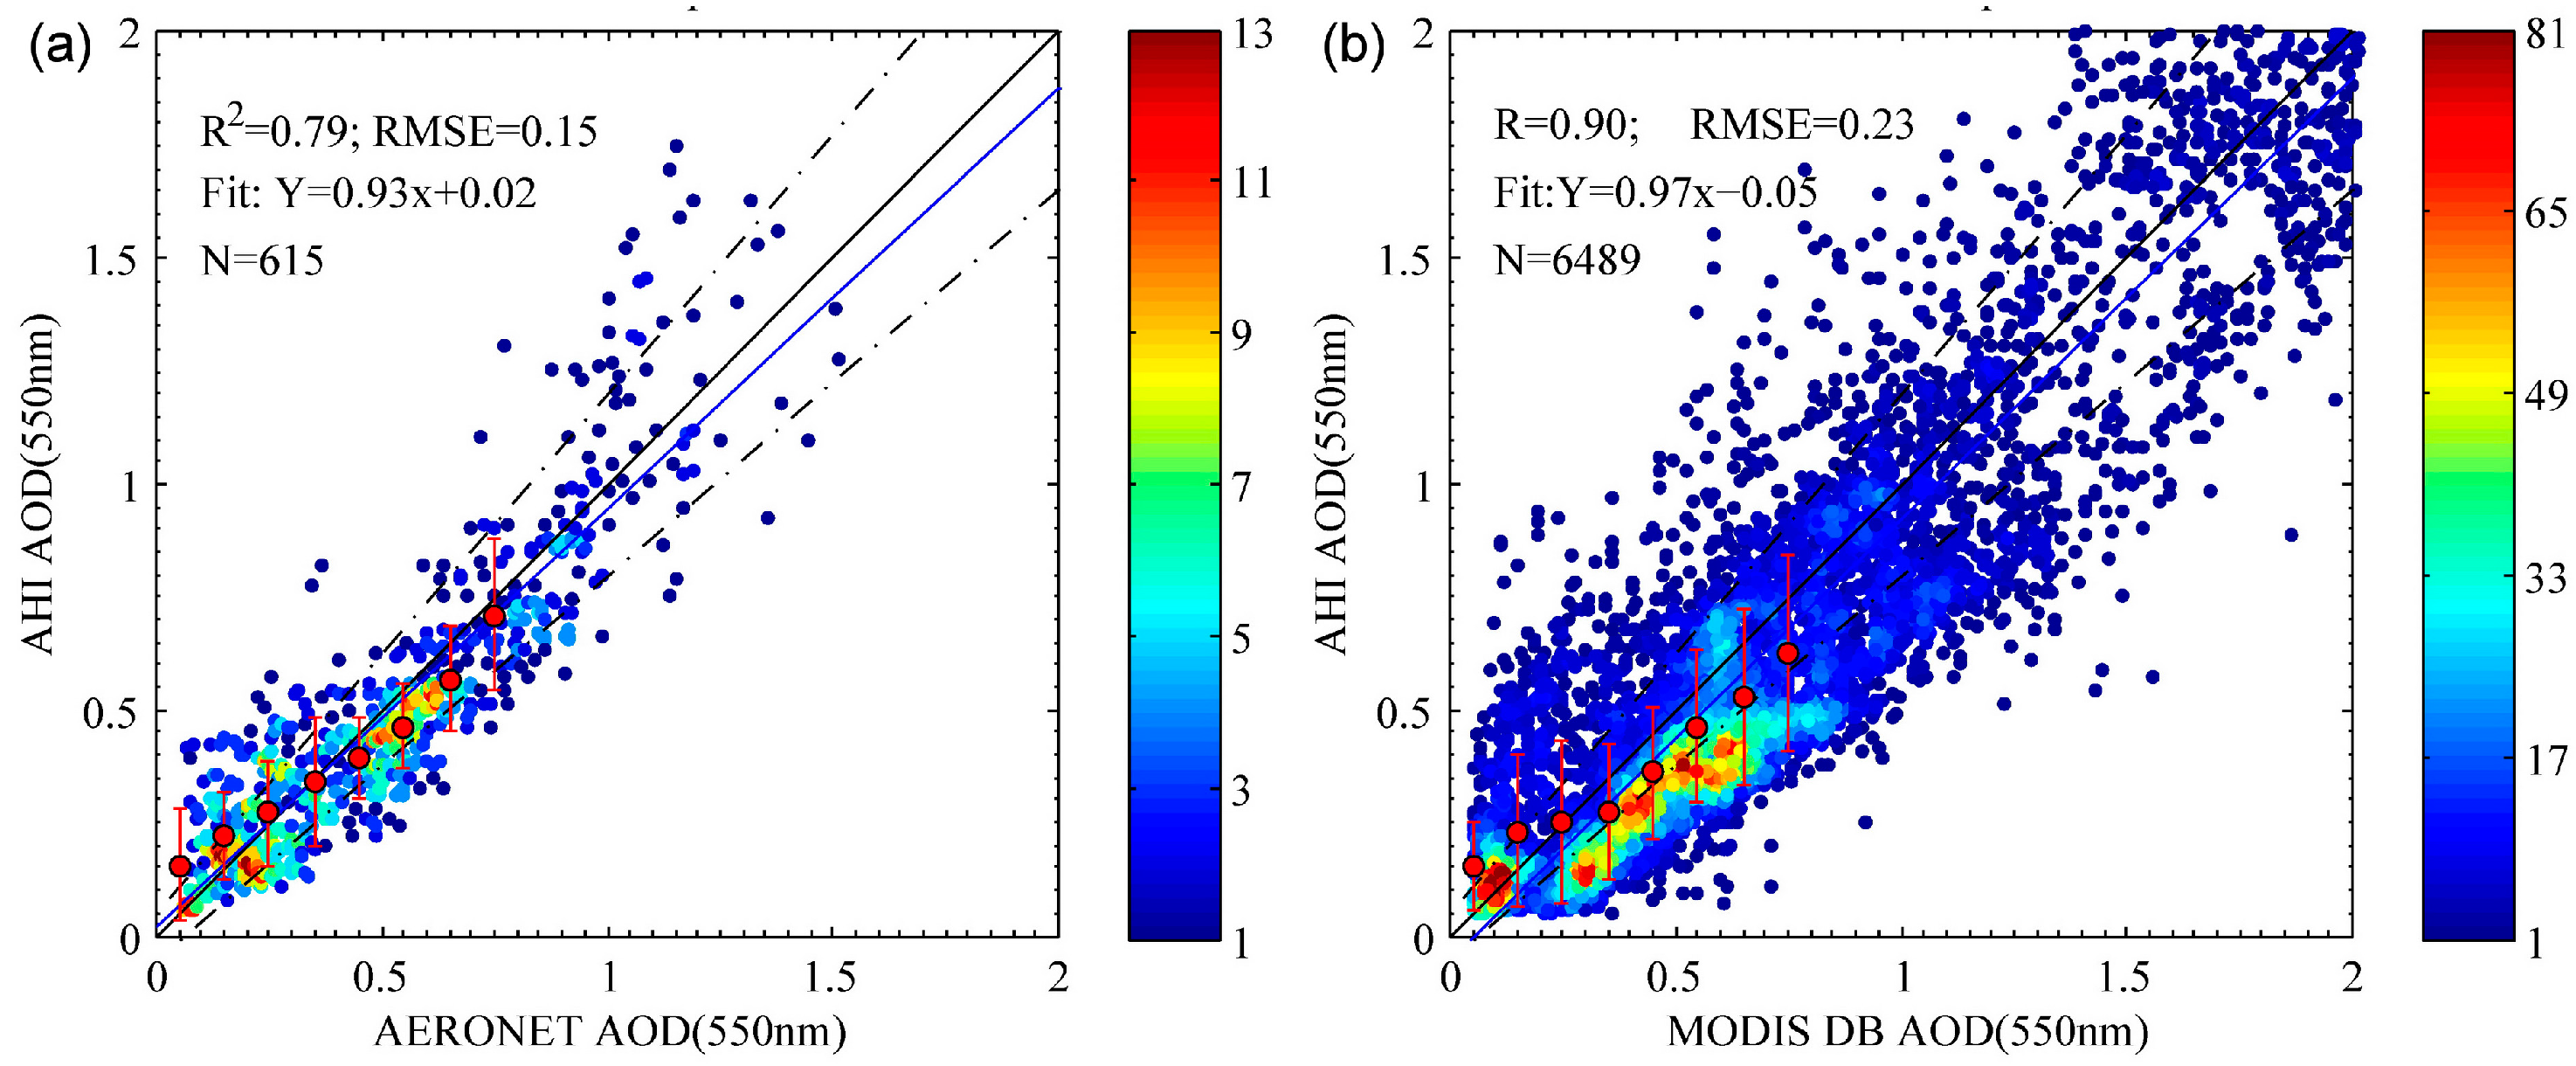
To assess the reliability of AHI AOD retrievals, both AERONET and MODIS AODs are used to quantitatively compare with our retrieved AODs. The AHI AOD and AERONET AOD were compared for a period from March to June 2017 over the study area for the ten AERONET sites. For validation, AERONET AODs were converted to 550 nm using Angstrom exponent. Figure 11a shows the comparison of AHI AOD and AERONET AOD. These two datasets show good consistency, with R2 = 0.79. Figure 11b is the cross comparison between AODs from MODIS and our AHI retrieval on 4 May 2017. It has a R2 = 0.81, showing good agreement.
5. Conclusions
In this study, we presented a dust detection method and a dust index to estimate the dust intensity over China mainland using AHI data. Based on a dynamic threshold of BTD among four channels: BTD (11–12), BTD (3–11), and BTD (11–8), the dust detection method can achieve fast dust identification for the different surface types over northern China. By combining the spectral reflectance at VIS/NIR, BT at TIR, and AOD, the enhanced dust intensity index (EDII) was developed with AOD that was estimated from multiple temporal AHI observations.
The dust detection and density estimation (EDII) algorithms were applied on the AHI data acquired in March–June 2017 in mainland China. The AHI dust detection results and intensity map were examined by the analysis of a strong dust event over northern China during 3–4 May 2017 using the AHI true color images and the air mass trajectories data. It was shown that the dust intensity map well captured the dust area and its movement. This dust detection method is simple, fast, and ideally suited for monitoring dust in real time using geostationary satellite H8 data. Unlike other dust detection methods using a universal threshold value on BTDs, the dynamic threshold scheme with threshold values adaptive to different land surfaces allowed for more accurate dust identification under various surface conditions. The AERONET measurement derived dust detection result was used to validate the AHI dust detection result, showing a dust detection agreement of 84%. In addition to identifying the dust area, the EDII can be used as a semi-quantitative parameter to describe the dust intensity and showed good agreement with the visibility data (a correlation coefficient of 0.81). In addition, to gain more confidence on the EDII, the retrieved AODs used for EDII calculation were validated using AERONET and MODIS AODs, both showing high correlation coefficient values.
Future work will focus on the dust detection at night time to achieve a continuous monitoring of dust. Other than the algorithm difference for night time dust detection, we noted that the dust validation is also challenging especially considering that there is no ‘ground truth’ data for dust quantification at either day or night time. Visibility data from ground measurement used in this study can be related to satellite derived dust intensity, assuming that there is no horizontal and vertical dust distribution difference. Instead, ground aerosol measurements from active remote sensing with optical aerosol characterization could be utilized for dust detection validation. Lidar and ceilometer can provide observations during both day and night time, can also provide vertical information of dust layer, and can distinguish dust layers with other layers [73,74,75]. Future study would consider using Lidar and ceilometer data for validation subject to the ground station availability. The new generation of geostationary satellite, like FY-4 equipped with a Multi-channel scanning radiometer, which is similar to AHI, can provide better sight for the China and Asia area. This presented method can be also adapted for FY-4 dust detection, to achieve dust detection for China and West Asia with more complete coverage.
Acknowledgments
This work was supported in part by the Open Fund of State Key Laboratory of Remote Sensing Science (Grant No. OFSLRSS201703). We gratefully acknowledge the support by the National Natural Science Foundation of China (NSFC) under grant No. 41471306 and 41590853, and the Ministry of Science and Technology (MOST) of China under Grand 2016YFC0200500. MODIS data were available through NASA MODIS LAADS. AHI data were supplied by the P-Tree System, Japan Aerospace Exploration Agency (JAXA) (http://www.eorc.jaxa.jp/ptree/terms.html). Yi Qin from CSIRO Australia kindly provided sample Himawari-8 AHI data for dust algorithms testing and development in the early stage of the project. Visibility data were supplied by the National Climatic Data Center (NCDC) (ftp://ftp.ncdc.noaa.gov/pub/data/gsod). The authors gratefully acknowledge the NOAA Air Resources Laboratory (ARL) for the provision of the HYSPLIT transport model used in this publication. Many thanks are due to the principal investigators of the AERONET sites used in this paper for maintaining their sites and making their data publicly available. We would also like to thank the anonymous reviewers for their valuable comments, which greatly improved the quality of this manuscript.
Author Contributions
Lu She, Yong Xue and Xihua Yang conceived and designed the experiments; Lu She, Yong Xue, Xihua Yang, and Jie Guang performed the experiments; Lu She, Yong Xue, Jie Guang and Yahui Che analyzed the data; Lu She, Yong Xue, Xihua Yang, Yanqing Xie, Cheng Fan, and Yong Xue contributed reagents/materials/analysis tools; Lu She, Yong Xue and Xihua Yang wrote the paper.
Conflicts of Interest
The authors declare no conflict of interest.
References
- Kohfeld, K.E.; Tegen, I. Record of mineral aerosols and their role in the earth system. Treatise Geochem. 2007, 4, 1–26. [Google Scholar]
- Choobari, O.A.; Zawar-Reza, P.; Sturman, A. The global distribution of mineral dust and its impacts on the climate system: A review. Atmos. Res. 2014, 138, 152–165. [Google Scholar] [CrossRef]
- Shao, Y.; Wyrwoll, K.-H.; Chappell, A.; Huang, J.; Lin, Z.; McTainsh, G.H.; Mikami, M.; Tanaka, T.Y.; Wang, X.; Yoon, S. Dust cycle: An emerging core theme in earth system science. Aeolian Res. 2011, 2, 181–204. [Google Scholar] [CrossRef]
- MüLler, D.; Heinold, B.; Tesche, M.; Tegen, I.; Althausen, D.; Alados Arboledas, L.; Amiridis, V.; Amodeo, A.; Ansmann, A.; Balis, D.; et al. Earlinet observations of the 14–22-may long-range dust transport event during SAMUM 2006: Validation of results from dust transport modelling. Tellus B Chem. Phys. Meteorol. 2009, 61, 325–339. [Google Scholar] [CrossRef] [Green Version]
- Wiegner, M.; Groß, S.; Freudenthaler, V.; Schnell, F.; Gasteiger, J. The May/June 2008 Saharan dust event over Munich: Intensive aerosol parameters from lidar measurements. J. Geophys. Res. Atmos. 2011, 116, D23213. [Google Scholar] [CrossRef]
- Toledano, C.; Wiegner, M.; Garhammer, M.; Seefeldner, M.; Gasteiger, J.; MüLler, D.; Koepke, P. Spectral aerosol optical depth characterization of desert dust during SAMUM 2006. Tellus B Chem. Phys. Meteorol. 2009, 61, 216–228. [Google Scholar] [CrossRef]
- Varga, G.; Újvári, G.; Kovács, J. Spatiotemporal patterns of saharan dust outbreaks in the Mediterranean Basin. Aeolian Res. 2014, 15, 151–160. [Google Scholar] [CrossRef] [Green Version]
- Rosenfeld, D.; Rudich, Y.; Lahav, R. Desert dust suppressing precipitation: A possible desertification feedback loop. Proc. Natl. Acad. Sci. USA 2001, 98, 5975–5980. [Google Scholar] [CrossRef] [PubMed]
- Tegen, I. Modeling the mineral dust aerosol cycle in the climate system. Quat. Sci. Rev. 2003, 22, 1821–1834. [Google Scholar] [CrossRef]
- Sassen, K. Indirect climate forcing over the western us from Asian dust storms. Geophys. Res. Lett. 2002, 29, 103-1–103-4. [Google Scholar] [CrossRef]
- Bangert, M.; Nenes, A.; Vogel, B.; Vogel, H.; Barahona, D.; Karydis, V.A.; Kumar, P.; Kottmeier, C.; Blahak, U. Saharan dust event impacts on cloud formation and radiation over Western Europe. Atmos. Chem. Phys. 2012, 12, 4045–4063. [Google Scholar] [CrossRef]
- Rodríguez, S.; Alastuey, A.; Querol, X. A review of methods for long term in situ characterization of aerosol dust. Aeolian Res. 2012, 6, 55–74. [Google Scholar] [CrossRef]
- Goudie, A.S. Dust storms: Recent developments. J. Environ. Manag. 2009, 90, 89–94. [Google Scholar] [CrossRef] [PubMed]
- Basha, G.; Phanikumar, D.V.; Kumar, K.N.; Ouarda, T.B.M.J.; Marpu, P.R. Investigation of aerosol optical, physical, and radiative characteristics of a severe dust storm observed over UAE. Remote Sens. Environ. 2015, 169, 404–417. [Google Scholar] [CrossRef]
- Miller, S.D. A consolidated technique for enhancing desert dust storms with MODIS. Geophys. Res. Lett. 2003, 30. [Google Scholar] [CrossRef]
- Tegen, I.; Schepanski, K.; Heinold, B. Comparing two years of saharan dust source activation obtained by regional modelling and satellite observations. Atmos. Chem. Phys. 2013, 13, 2381–2390. [Google Scholar] [CrossRef]
- Wang, H.; Zhang, L.; Cao, X.; Zhang, Z.; Liang, J. A-train satellite measurements of dust aerosol distributions over Northern China. J. Quant. Spectrosc. Radiat. Transf. 2013, 122, 170–179. [Google Scholar] [CrossRef]
- Mikami, M.; Shi, G.Y.; Uno, I.; Yabuki, S.; Iwasaka, Y.; Yasui, M.; Aoki, T.; Tanaka, T.Y.; Kurosaki, Y.; Masuda, K.; et al. Aeolian dust experiment on climate impact: An overview of Japan–China joint project ADEC. Glob. Planet. Chang. 2006, 52, 142–172. [Google Scholar] [CrossRef]
- Guo, J.; Lou, M.; Miao, Y.; Wang, Y.; Zeng, Z.; Liu, H.; He, J.; Xu, H.; Wang, F.; Min, M.; et al. Trans-Pacific transport of dust aerosols from East Asia: Insights gained from multiple observations and modeling. Environ. Pollut. 2017, 230, 1030–1039. [Google Scholar] [CrossRef] [PubMed]
- Arimoto, R. Chemical composition of atmospheric aerosols from Zhenbeitai, China, and Gosan, South Korea, during ACE-Asia. J. Geophys. Res. 2004, 109, D19S04. [Google Scholar] [CrossRef]
- Wang, Y.; Stein, A.F.; Draxler, R.R.; Rosa, J.D.D.L.; Zhang, X. Global sand and dust storms in 2008: Observation and HYSPLIT model verification. Atmos. Environ. 2011, 45, 6368–6381. [Google Scholar] [CrossRef]
- Marinou, E.; Amiridis, V.; Binietoglou, I.; Tsikerdekis, A.; Solomos, S.; Proestakis, E.; Konsta, D.; Papagiannopoulos, N.; Tsekeri, A.; Vlastou, G.; et al. Three-dimensional evolution of saharan dust transport towards europe based on a 9-year earlinet-optimized calipso dataset. Atmos. Chem. Phys. 2017, 17, 5893–5919. [Google Scholar] [CrossRef]
- Torres, O.; Tanskanen, A.; Veihelmann, B.; Ahn, C.; Braak, R.; Bhartia, P.K.; Veefkind, P.; Levelt, P. Aerosols and surface UV products from ozone monitoring instrument observations: An overview. J. Geophys. Res. 2007, 112, D24S47. [Google Scholar] [CrossRef]
- Torres, O.; Bhartia, P.K.; Herman, J.R.; Ahmad, Z.; Gleason, J. Derivation of aerosol properties from satellite measurements of backscattered ultraviolet radiation: Theoretical basis. J. Geophys. Res. Atmos. 1998, 103, 17099–17110. [Google Scholar] [CrossRef]
- Ciren, P.; Kondragunta, S. Dust aerosol index (DAI) algorithm for MODIS. J. Geophys. Res. Atmos. 2014, 119, 4770–4792. [Google Scholar] [CrossRef]
- Park, S.S.; Kim, J.; Lee, J.; Lee, S.; Kim, J.S.; Chang, L.S.; Ou, S. Combined dust detection algorithm by using MODIS infrared channels over East Asia. Remote Sens. Environ. 2014, 141, 24–39. [Google Scholar] [CrossRef]
- Cho, H.-M.; Nasiri, S.L.; Yang, P.; Laszlo, I.; Zhao, X.T. Detection of optically thin mineral dust aerosol layers over the ocean using MODIS. J. Atmos. Ocean. Technol. 2013, 30, 896–916. [Google Scholar] [CrossRef]
- Hu, X.Q.; Lu, N.M.; Niu, T.; Zhang, P. Operational retrieval of asian sand and dust storm from fy-2c geostationary meteorological satellite and its application to real time forecast in Asia. Atmos. Chem. Phys. 2008, 8, 1649–1659. [Google Scholar] [CrossRef]
- Klüser, L.; Schepanski, K. Remote sensing of mineral dust over land with MSG infrared channels: A new bitemporal mineral dust index. Remote Sens. Environ. 2009, 113, 1853–1867. [Google Scholar] [CrossRef] [Green Version]
- Li, J.; Zhang, P.; Schmit, T.J.; Schmetz, J.; Menzel, W.P. Technical note: Quantitative monitoring of a Saharan dust event with SEVIRI on Meteosat-8. Int. J. Remote Sens. 2007, 28, 2181–2186. [Google Scholar] [CrossRef]
- Tanré, D.; Legrand, M. On the satellite retrieval of Saharan dust optical thickness over land: Two different approaches. J. Geophys. Res. 1991, 96, 5221–5227. [Google Scholar] [CrossRef]
- Qu, J.J.; Hao, X.; Kafatos, M.; Wang, L. Asian dust stormmonitoring combining terra and Aqua MODIS SRB measurements. IEEE Geosci. Remote Sens. Lett. 2006, 3, 484–486. [Google Scholar] [CrossRef]
- Zhao, X. Asian dust detection from the satellite observations of moderate resolution imaging spectroradiometer (MODIS). Aerosol Air Qual. Res. 2012, 12, 1073–1080. [Google Scholar] [CrossRef]
- Zhao, T.X.P.; Ackerman, S.; Guo, W. Dust and smoke detection for multi-channel imagers. Remote Sens. 2010, 2, 2347–2368. [Google Scholar] [CrossRef]
- Ackerman, S.A. Using the radiative temperature difference at 3.7 and 11 μm to tract dust outbreaks. Remote Sens. Environ. 1989, 27, 129–133. [Google Scholar] [CrossRef]
- Ackerman, S.A. Remote sensing aerosols using satellite infrared observations. J. Geophys. Res. Atmos. 1997, 102, 17069–17079. [Google Scholar] [CrossRef]
- Zhang, P.; Lu, N.-M.; Hu, X.-Q.; Dong, C.-H. Identification and physical retrieval of dust storm using three MODIS thermal IR channels. Glob. Planet. Chang. 2006, 52, 197–206. [Google Scholar] [CrossRef]
- Baddock, M.C.; Bullard, J.E.; Bryant, R.G. Dust source identification using MODIS: A comparison of techniques applied to the Lake Eyre Basin, Australia. Remote Sens. Environ. 2009, 113, 1511–1528. [Google Scholar] [CrossRef] [Green Version]
- Hao, X. Saharan dust storm detection using moderate resolution imaging spectroradiometer thermal infrared bands. J. Appl. Remote Sens. 2007, 1, 013510. [Google Scholar] [CrossRef]
- Hansell, R.A.; Ou, S.C.; Liou, K.N.; Roskovensky, J.K.; Tsay, S.C.; Hsu, C.; Ji, Q. Simultaneous detection/separation of mineral dust and cirrus clouds using MODIS thermal infrared window data. Geophys. Res. Lett. 2007, 34, L11808. [Google Scholar] [CrossRef]
- Roskovensky, J.K. Detection of thin cirrus from 1.38 μm/0.65 μm reflectance ratio combined with 8.6–11 μm brightness temperature difference. Geophys. Res. Lett. 2003, 30. [Google Scholar] [CrossRef]
- Roskovensky, J.K.; Liou, K.N. Differentiating airborne dust from cirrus clouds using MODIS data. Geophys. Res. Lett. 2005, 32, L12809. [Google Scholar] [CrossRef]
- Sokolik, I.N.; Toon, O.B.; Bergstrom, R.W. Modeling the radiative characteristics of airborne mineral aerosols at infrared wavelengths. J. Geophys. Res. Atmos. 1998, 103, 8813–8826. [Google Scholar] [CrossRef]
- Pierangelo, C.; Ch’edin, A.; Heilliette, S.; Jacquinet-Husson, N.; Armante, R. Dust altitude and infrared optical depth from airs. Atmos. Chem. Phys. 2004, 4, 1813–1822. [Google Scholar] [CrossRef]
- Caquineau, S. Mineralogy of Saharan dust transported over northwestern tropical atlantic ocean in relation to source regions. J. Geophys. Res. 2002, 107, D15. [Google Scholar] [CrossRef]
- Merchant, C.J.; Embury, O.; Le Borgne, P.; Bellec, B. Saharan dust in nighttime thermal imagery: Detection and reduction of related biases in retrieved sea surface temperature. Remote Sens. Environ. 2006, 104, 15–30. [Google Scholar] [CrossRef]
- Jafari, R.; Malekian, M. Comparison and evaluation of dust detection algorithms using MODIS Aqua/Terra Level 1b data and MODIS/OMI dust products in the middle east. Int. J. Remote Sens. 2015, 36, 597–617. [Google Scholar] [CrossRef]
- Legrand, M.; Plana-Fattori, A.; N’Doumé, C. Satellite detection of dust using the IR imagery of meteosat: 1. Infrared difference dust index. J. Geophys. Res. Atmos. 2001, 106, 18251–18274. [Google Scholar] [CrossRef]
- Di, A.; Xue, Y.; Yang, X.; Leys, J.; Guang, J.; Mei, L.; Wang, J.; She, L.; Hu, Y.; He, X.; et al. Dust aerosol optical depth retrieval and dust storm detection for Xinjiang region using indian national satellite observations. Remote Sens. 2016, 8, 702. [Google Scholar] [CrossRef]
- Friedl, M.A.; McIver, D.K.; Hodges, J.C.F.; Zhang, X.Y.; Muchoney, D.; Strahler, A.H.; Woodcock, C.E.; Gopal, S.; Schneider, A.; Cooper, A.; et al. Global land cover mapping from MODIS: Algorithms and early results. Remote Sens. Environ. 2002, 83, 287–302. [Google Scholar] [CrossRef]
- Levy, R.C.; Mattoo, S.; Munchak, L.A.; Remer, L.A.; Sayer, A.M.; Patadia, F.; Hsu, N.C. The collection 6 MODIS aerosol products over land and ocean. Atmos. Meas. Tech. 2013, 6, 2989–3034. [Google Scholar] [CrossRef]
- Zhang, Q.; Xin, J.; Yin, Y.; Wang, L.; Wang, Y. The variations and trends of MODIS c5 & c6 products’ errors in the recent decade over the background and urban areas of North China. Remote Sens. 2016, 8, 754. [Google Scholar] [CrossRef]
- Sayer, A.M.; Munchak, L.A.; Hsu, N.C.; Levy, R.C.; Bettenhausen, C.; Jeong, M.J. Modis collection 6 aerosol products: Comparison between Aqua’s e-deep blue, dark target, and “merged” data sets, and usage recommendations. J. Geophys. Res. Atmos. 2014, 119, 13965–13989. [Google Scholar] [CrossRef]
- Sayer, A.M.; Hsu, N.C.; Bettenhausen, C.; Jeong, M.J. Validation and uncertainty estimates for MODIS collection 6 “deep blue” aerosol data. J. Geophys. Res. Atmos. 2013, 118, 7864–7872. [Google Scholar] [CrossRef]
- Holben, B.N.; Eck, T.F.; Slutsker, I.; Tanre, D.; Buis, J.P.; Setzer, A.; Vermote, E.; Reagan, J.A.; Kaufman, Y.J.; Nakajima, T.; et al. Aeronet—A federated instrument network and data archive for aerosol characterization. Remote Sens. Environ. 1998, 66, 1–16. [Google Scholar] [CrossRef]
- Dubovik, O.; Sinyuk, A.; Lapyonok, T.; Holben, B.N.; Mishchenko, M.; Yang, P.; Eck, T.F.; Volten, H.; Muñoz, O.; Veihelmann, B.; et al. Application of spheroid models to account for aerosol particle nonsphericity in remote sensing of desert dust. J. Geophys. Res. 2006, 111, D11208. [Google Scholar] [CrossRef]
- Seemann, S.W.; Borbas, E.E.; Knuteson, R.O.; Stephenson, G.R.; Huang, H.-L. Development of a global infrared land surface emissivity database for application to clear sky sounding retrievals from multispectral satellite radiance measurements. J. Appl. Meteorol. Climatol. 2008, 47, 108–123. [Google Scholar] [CrossRef]
- Darmenov, A. Identifying the regional thermal-ir radiative signature of mineral dust with MODIS. Geophys. Res. Lett. 2005, 32, L16803. [Google Scholar] [CrossRef]
- Han, L.; Tsunekawa, A.; Tsubo, M.; Zhou, W. An enhanced dust index for asian dust detection with MODIS images. Int. J. Remote Sens. 2013, 34, 6484–6495. [Google Scholar] [CrossRef]
- Yang, Y.; Sun, L.; Zhu, J.; Wei, J.; Su, Q.; Sun, W.; Liu, F.; Shu, M. A simplified suomi NPP VIIRS dust detection algorithm. J. Atmos. Sol. Terr. Phys. 2017, 164, 314–323. [Google Scholar] [CrossRef]
- Yue, H.; He, C.; Zhao, Y.; Ma, Q.; Zhang, Q. The brightness temperature adjusted dust index: An improved approach to detect dust storms using MODIS imagery. Int. J. Appl. Earth Obs. Geoinf. 2017, 57, 166–176. [Google Scholar] [CrossRef]
- Mei, L.; Xue, Y.; de Leeuw, G.; Holzer-Popp, T.; Guang, J.; Li, Y.; Yang, L.; Xu, H.; Xu, X.; Li, C.; et al. Retrieval of aerosol optical depth over land based on a time series technique using msg/seviri data. Atmos. Chem. Phys. 2012, 12, 9167–9185. [Google Scholar] [CrossRef] [Green Version]
- Li, Y.; Xue, Y.; de Leeuw, G.; Li, C.; Yang, L.; Hou, T.; Marir, F. Retrieval of aerosol optical depth and surface reflectance over land from NOAA AVHRR data. Remote Sens. Environ. 2013, 133, 1–20. [Google Scholar] [CrossRef]
- Liou, K.N. An Introduction to Atmospheric Radiation; Academic Press: Cambridge, MA, USA, 2002; pp. 1–28. [Google Scholar]
- Wanner, W.; Li, X.; Strahler, A.H. On the derivation of kernels for kernel-driven models of bidirectional reflectance. J. Geophys. Res. Atmos. 1995, 100, 21077–21089. [Google Scholar] [CrossRef]
- Schaaf, C.B.; Gao, F.; Strahler, A.H.; Lucht, W.; Li, X.; Tsang, T.; Strugnell, N.C.; Zhang, X.; Jin, Y.; Muller, J.P. First operational BRDF, albedo nadir reflectance products from MODIS. Remote Sens. Environ. 2002, 83, 135–148. [Google Scholar] [CrossRef]
- Rodgers, C.D. Inverse Methods for Atmospheric Sounding; World Scientific: Singapore, 2000. [Google Scholar]
- Govaerts, Y.; Wagner, S.; Lattanzio, A.; Watts, P. Application of the optimal estimation method to the joint retrieval of aerosol load and surface reflectance from MSG/SEVIRI observations. AIP Conf. Proc. 2009, 1100, 255–258. [Google Scholar]
- He, T.; Liang, S.; Wang, D.; Wu, H.; Yu, Y.; Wang, J. Estimation of surface albedo and directional reflectance from moderate resolution imaging spectroradiometer (MODIS) observations. Remote Sens. Environ. 2012, 119, 286–300. [Google Scholar] [CrossRef]
- Giles, D.M.; Holben, B.N.; Eck, T.F.; Sinyuk, A.; Smirnov, A.; Slutsker, I.; Dickerson, R.R.; Thompson, A.M.; Schafer, J.S. An analysis of aeronet aerosol absorption properties and classifications representative of aerosol source regions. J. Geophys. Res. Atmos. 2012, 117, D17203. [Google Scholar] [CrossRef]
- Baddock, M.C.; Strong, C.L.; Leys, J.F.; Heidenreich, S.K.; Tews, E.K.; McTainsh, G.H. A visibility and total suspended dust relationship. Atmos. Environ. 2014, 89, 329–336. [Google Scholar] [CrossRef] [Green Version]
- Camino, C.; Cuevas, E.; Basart, S.; Alonso-Pérez, S.; Baldasano, J.M.; Terradellas, E.; Marticorena, B.; Rodríguez, S.; Berjón, A. An empirical equation to estimate mineral dust concentrations from visibility observations in Northern Africa. Aeolian Res. 2015, 16, 55–68. [Google Scholar] [CrossRef] [Green Version]
- Pappalardo, G.; Amodeo, A.; Apituley, A.; Comeron, A.; Freudenthaler, V.; Linné, H.; Ansmann, A.; Bösenberg, J.; D’Amico, G.; Mattis, I.; et al. Earlinet: Towards an advanced sustainable european aerosol lidar network. Atmos. Meas. Tech. 2014, 7, 2389–2409. [Google Scholar] [CrossRef] [Green Version]
- Wiegner, M.; Madonna, F.; Binietoglou, I.; Forkel, R.; Gasteiger, J.; Geiß, A.; Pappalardo, G.; Schäfer, K.; Thomas, W. What is the benefit of ceilometers for aerosol remote sensing? An answer from earlinet. Atmos. Meas. Tech. 2014, 7, 1979–1997. [Google Scholar] [CrossRef]
- Mamouri, R.E.; Ansmann, A. Fine and coarse dust separation with polarization lidar. Atmos. Meas. Tech. 2014, 7, 3717–3735. [Google Scholar] [CrossRef]
Figure 1.
Land over map of China mainland region. The red circles represent the AERONET stations, and the white circles with black points represent the stations, which provide the visibility data used in this study.
Figure 1.
Land over map of China mainland region. The red circles represent the AERONET stations, and the white circles with black points represent the stations, which provide the visibility data used in this study.
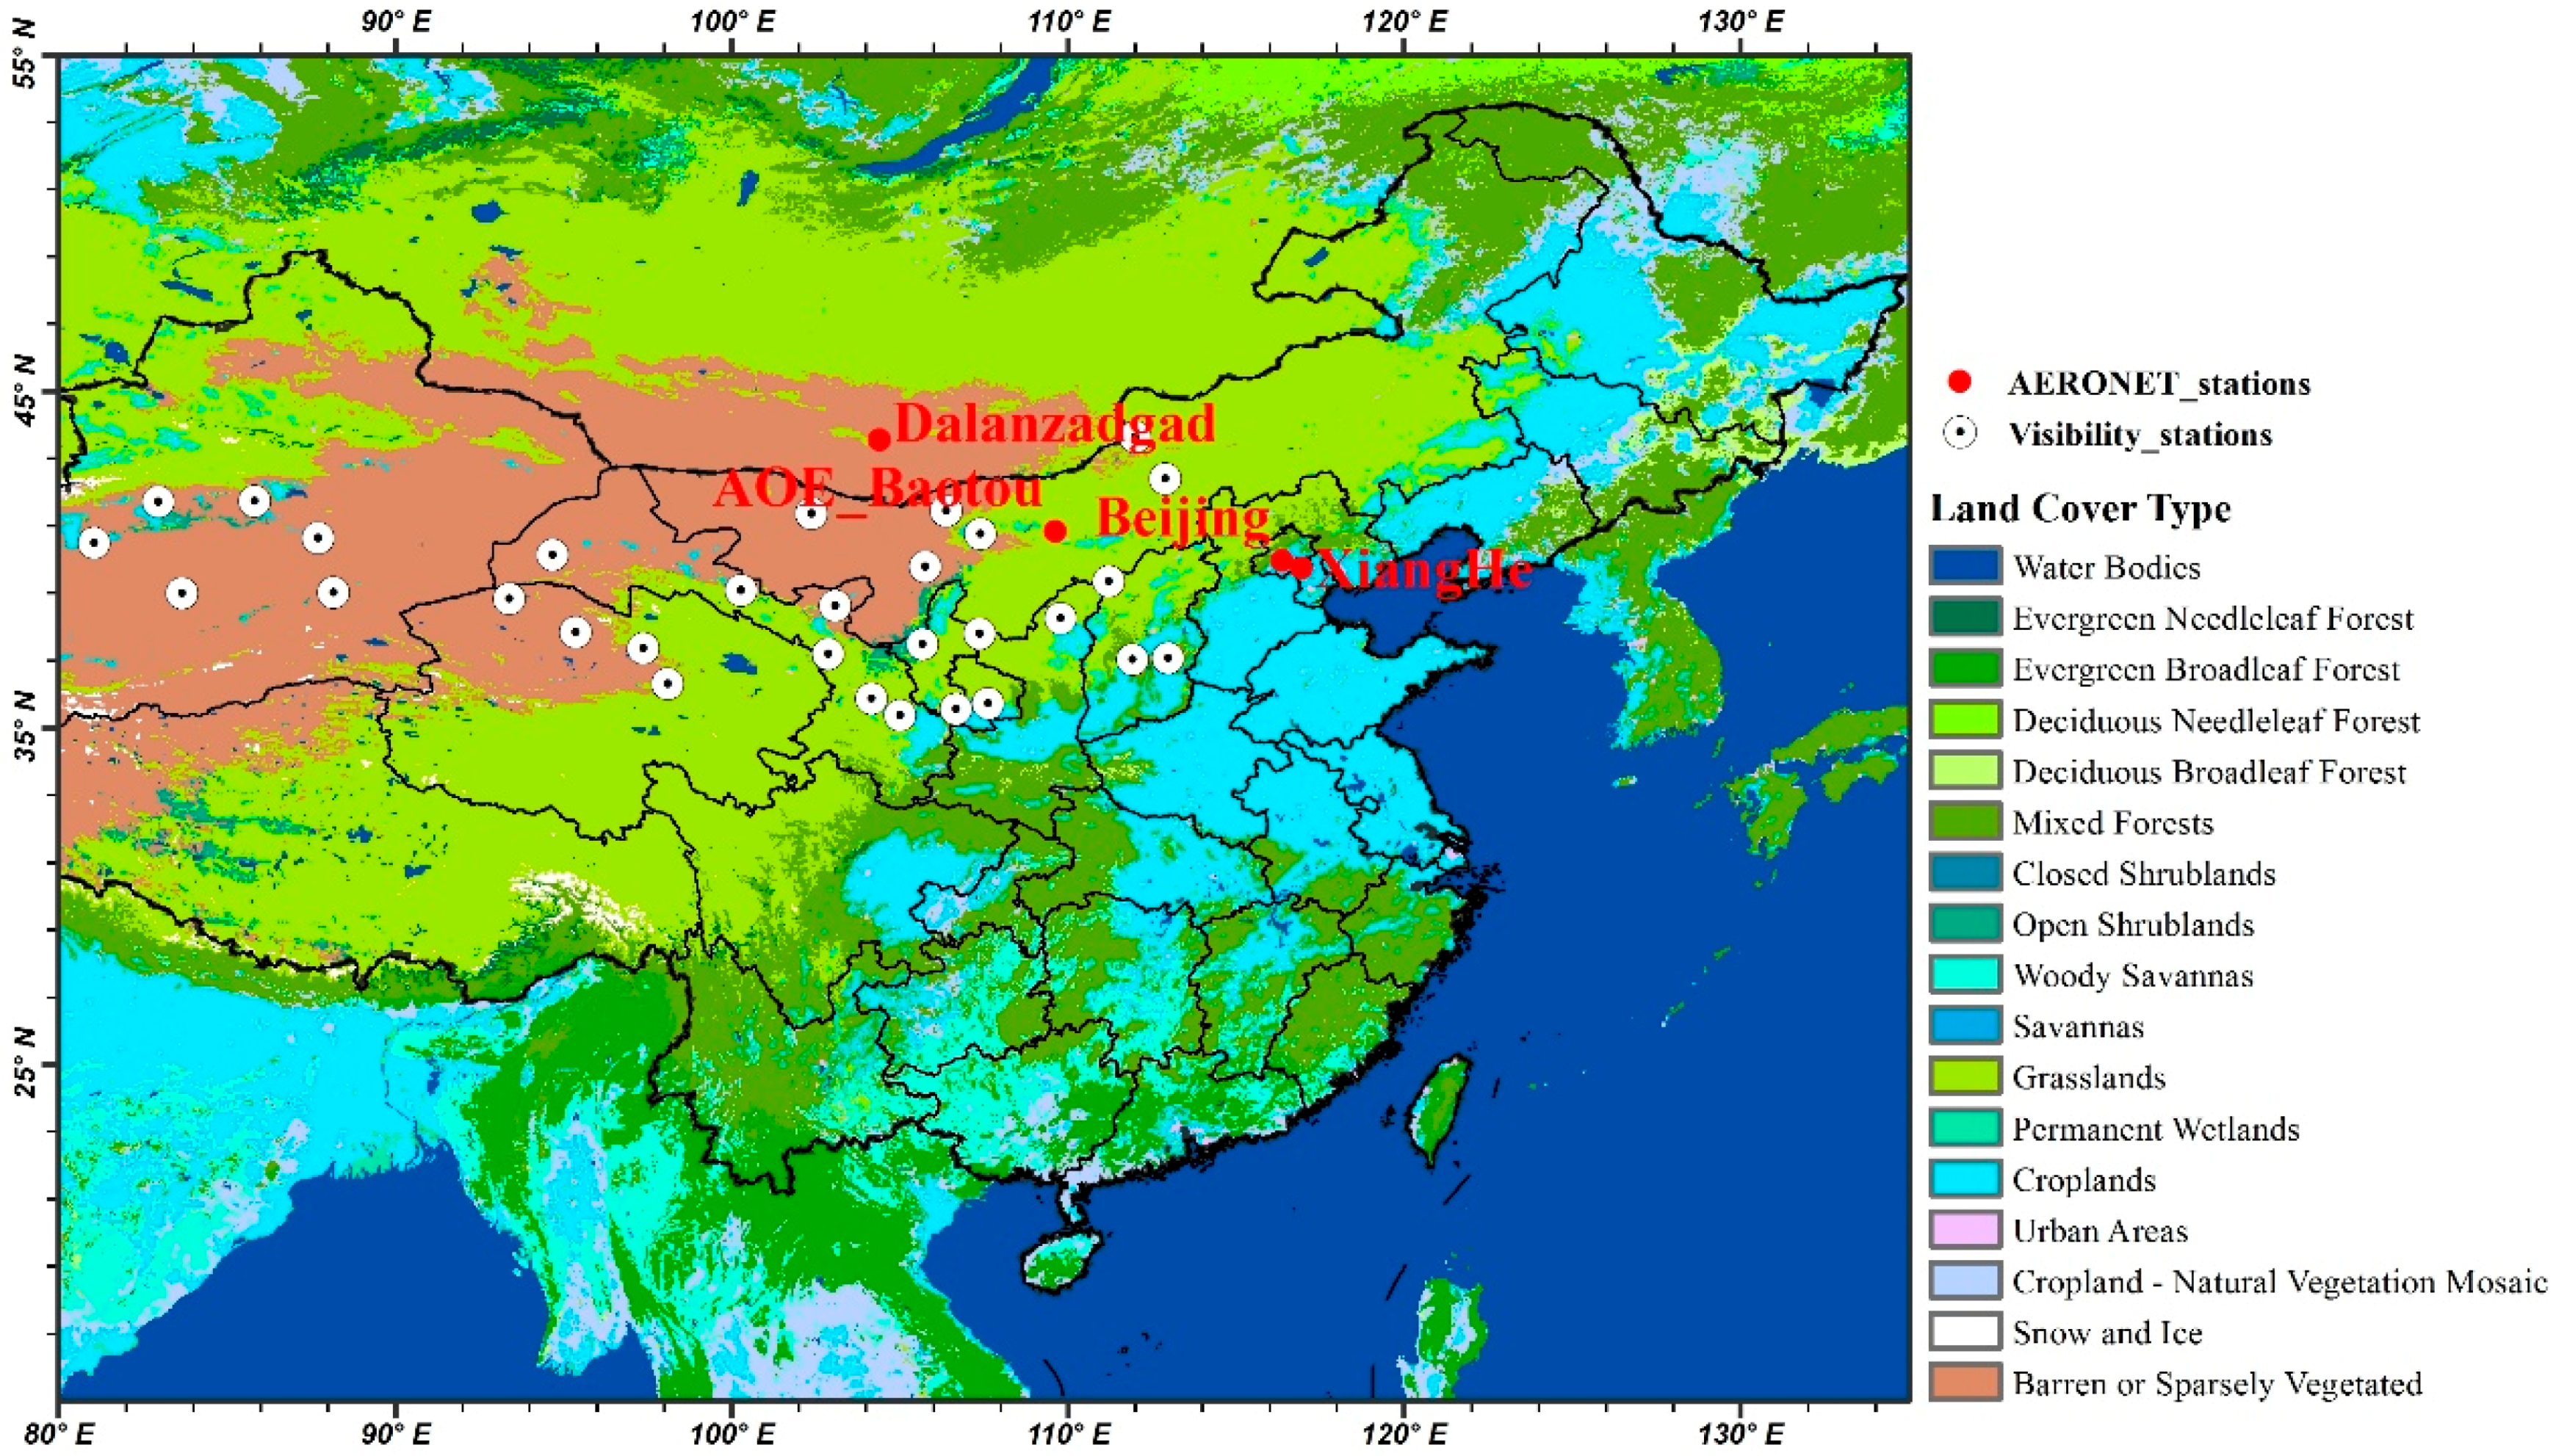
Figure 2.
The mean spectral reflectance (a) and thermal brightness temperature (BT) (b) curves of the typical objects of all the samples collected from AHI data. The diamonds represent one standard deviation away from the mean, and the horizontal lines within the diamonds represent median.
Figure 2.
The mean spectral reflectance (a) and thermal brightness temperature (BT) (b) curves of the typical objects of all the samples collected from AHI data. The diamonds represent one standard deviation away from the mean, and the horizontal lines within the diamonds represent median.

Figure 3.
Scatter plots of the brightness temperature difference (BTDs) as a function of different objects: (a) BTD (11–12) versus BTD (3–11); and, (b) BTD (11–12) versus BTD (8–11). The Ground A represents Gobi desert surface, Ground B is relatively dark land surface, and Ground C is Taklimakan desert surface. Thus, thin/thick dust A/B/C represents thin/thick dust over Gobi desert/relatively dark land/Taklimakan desert.

Figure 4.
BTD distribution under clear sky condition, obtained at 05:00 UTC in May 2017 over China mainland: (a) BTD (11–12); (b) BTD (11–8); and, (c) BTD (3–11).
Figure 4.
BTD distribution under clear sky condition, obtained at 05:00 UTC in May 2017 over China mainland: (a) BTD (11–12); (b) BTD (11–8); and, (c) BTD (3–11).

Figure 5.
Scatter plots of the BTDs from clear reference scenes of May 2017 as a function of (a) normalized difference vegetation Index (NDVI), and (b) Altitude. Altitude data are downloaded from the CGIAR-CSI SRTM 90 m Database (http://westdc.westgis.ac.cn/data/view/uuid/acb49ce8-2bfe-4ab4-97ff-e6e727110703).

Figure 6.
Comparison of enhanced dust intensity index (EDII) (b,d,f,h) and corresponding Advanced Himawari Imager (AHI) Red, Green, and Blue (RGB) composite images (a,c,e,g) on 3 May 2017. (a–d) are at 02:00, 04:00, 06:00, and 08:00 UTC, respectively.
Figure 6.
Comparison of enhanced dust intensity index (EDII) (b,d,f,h) and corresponding Advanced Himawari Imager (AHI) Red, Green, and Blue (RGB) composite images (a,c,e,g) on 3 May 2017. (a–d) are at 02:00, 04:00, 06:00, and 08:00 UTC, respectively.
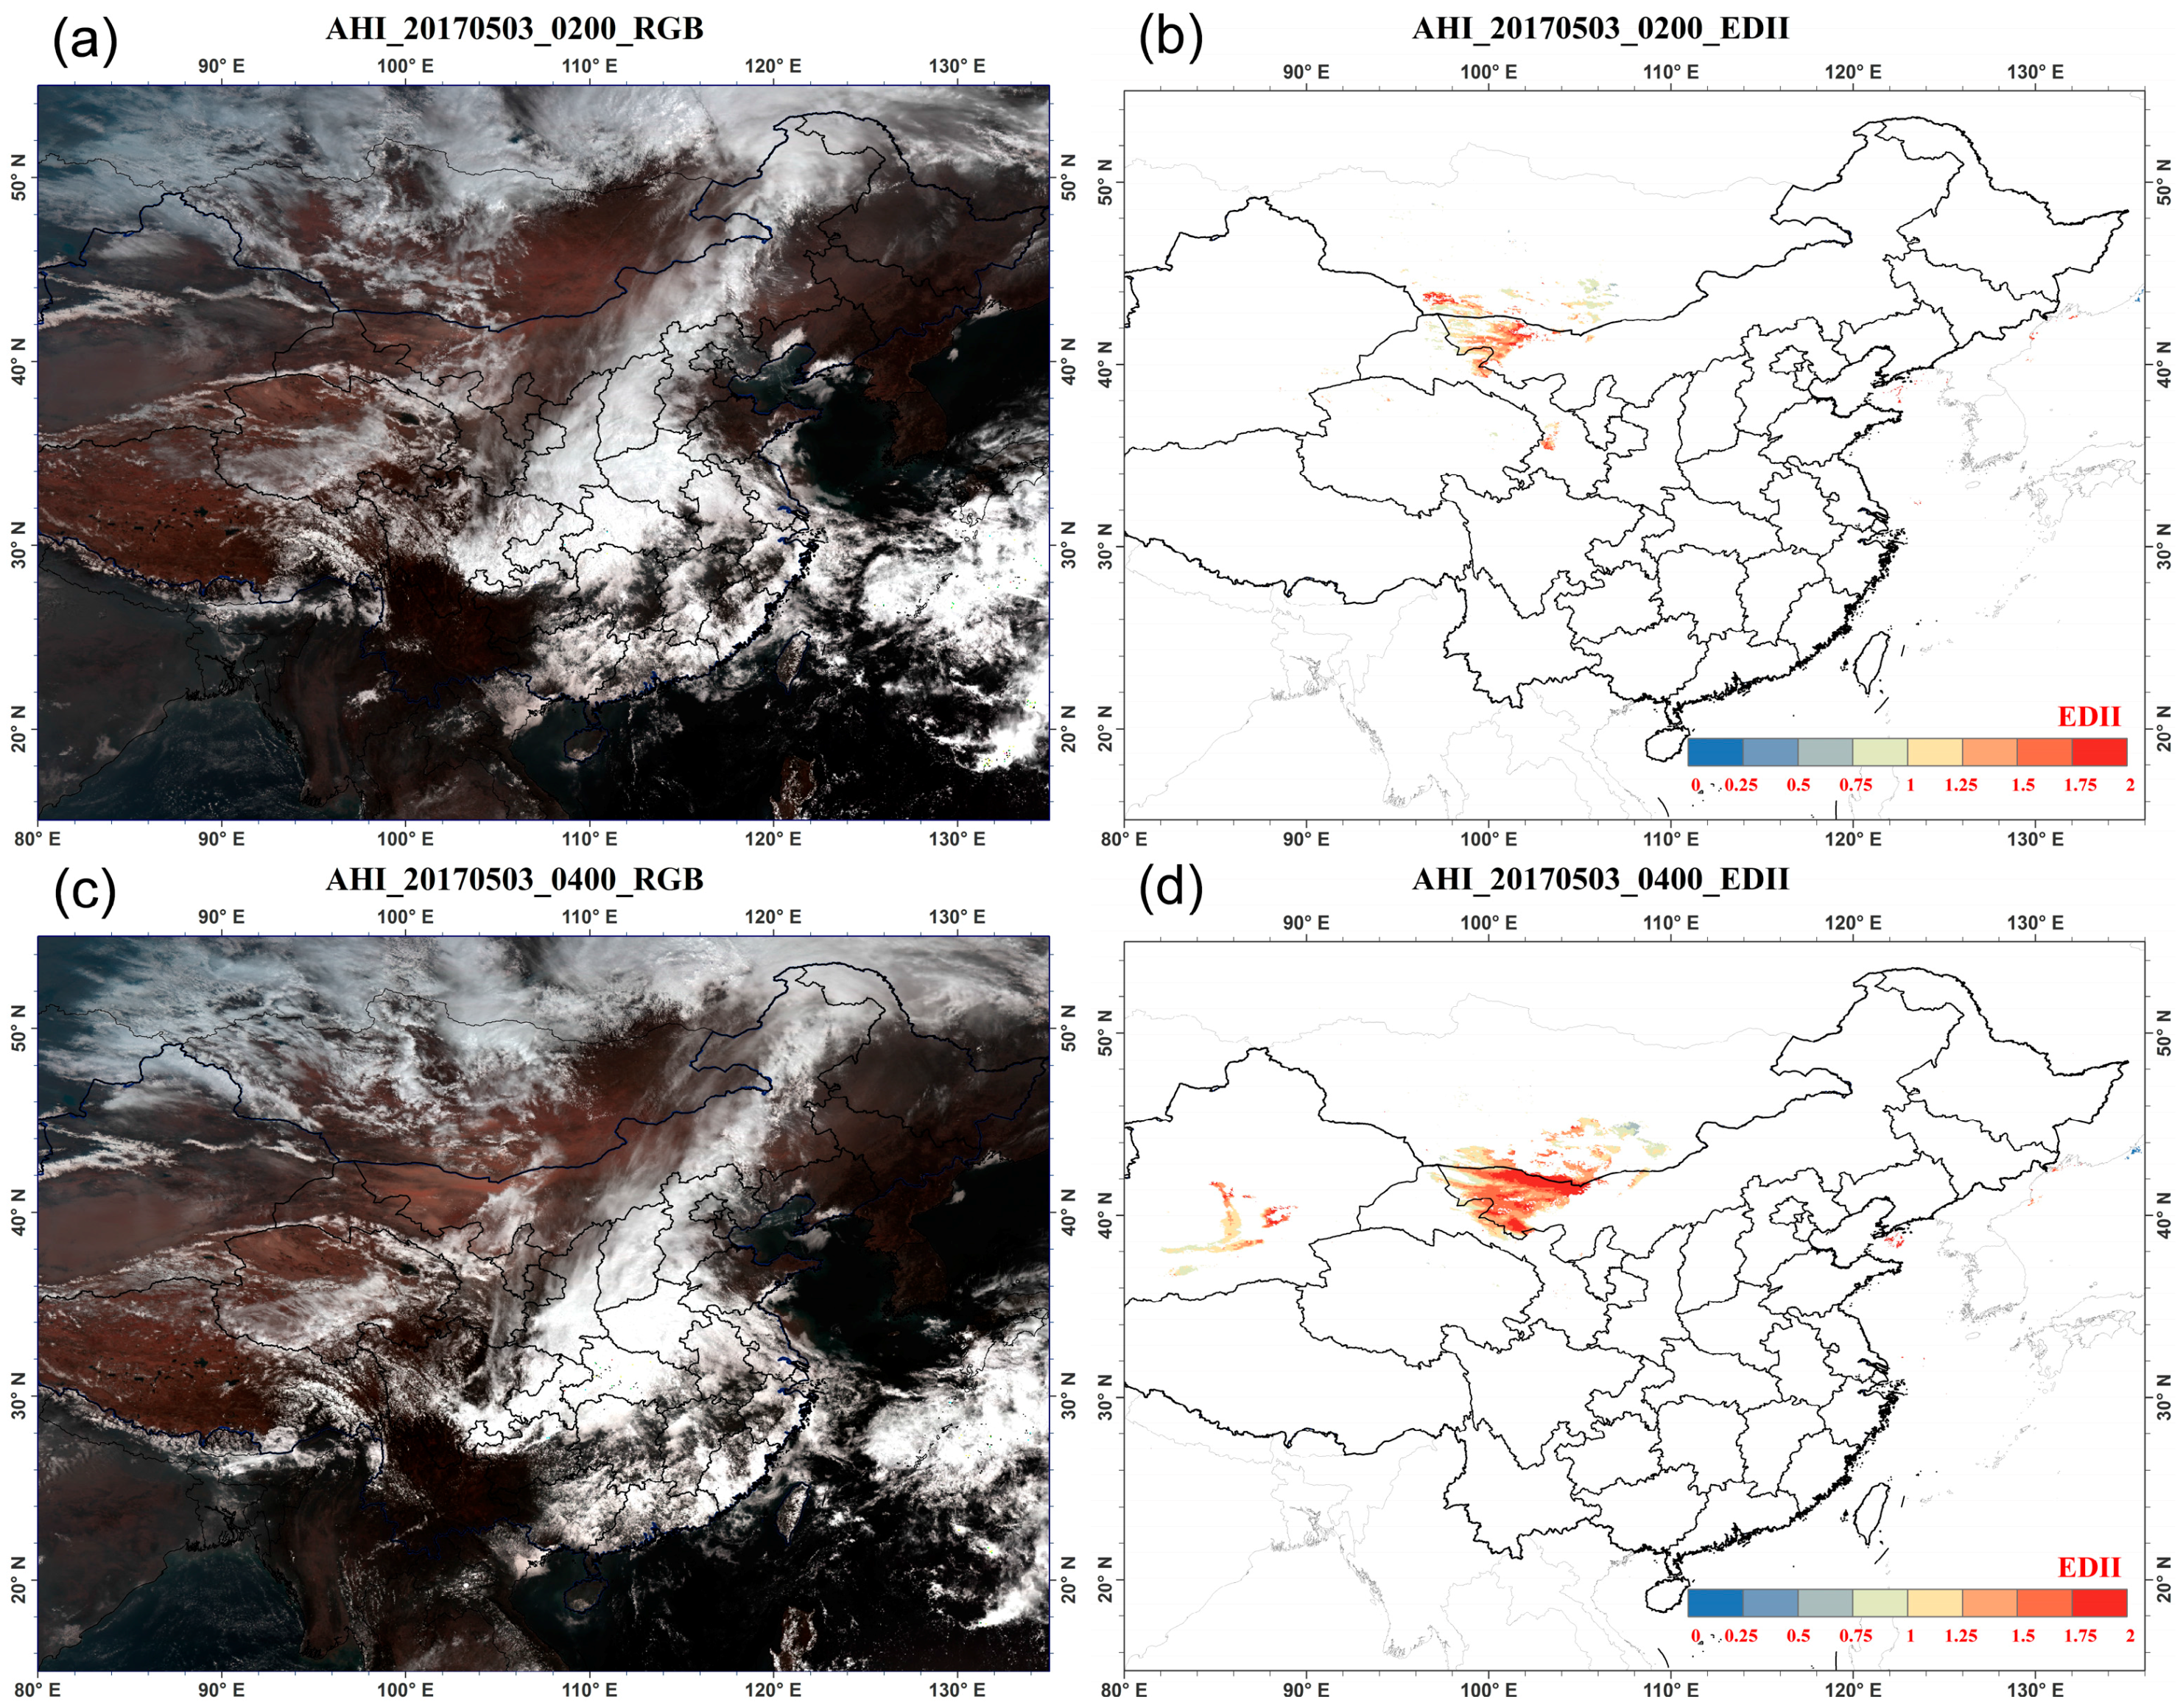
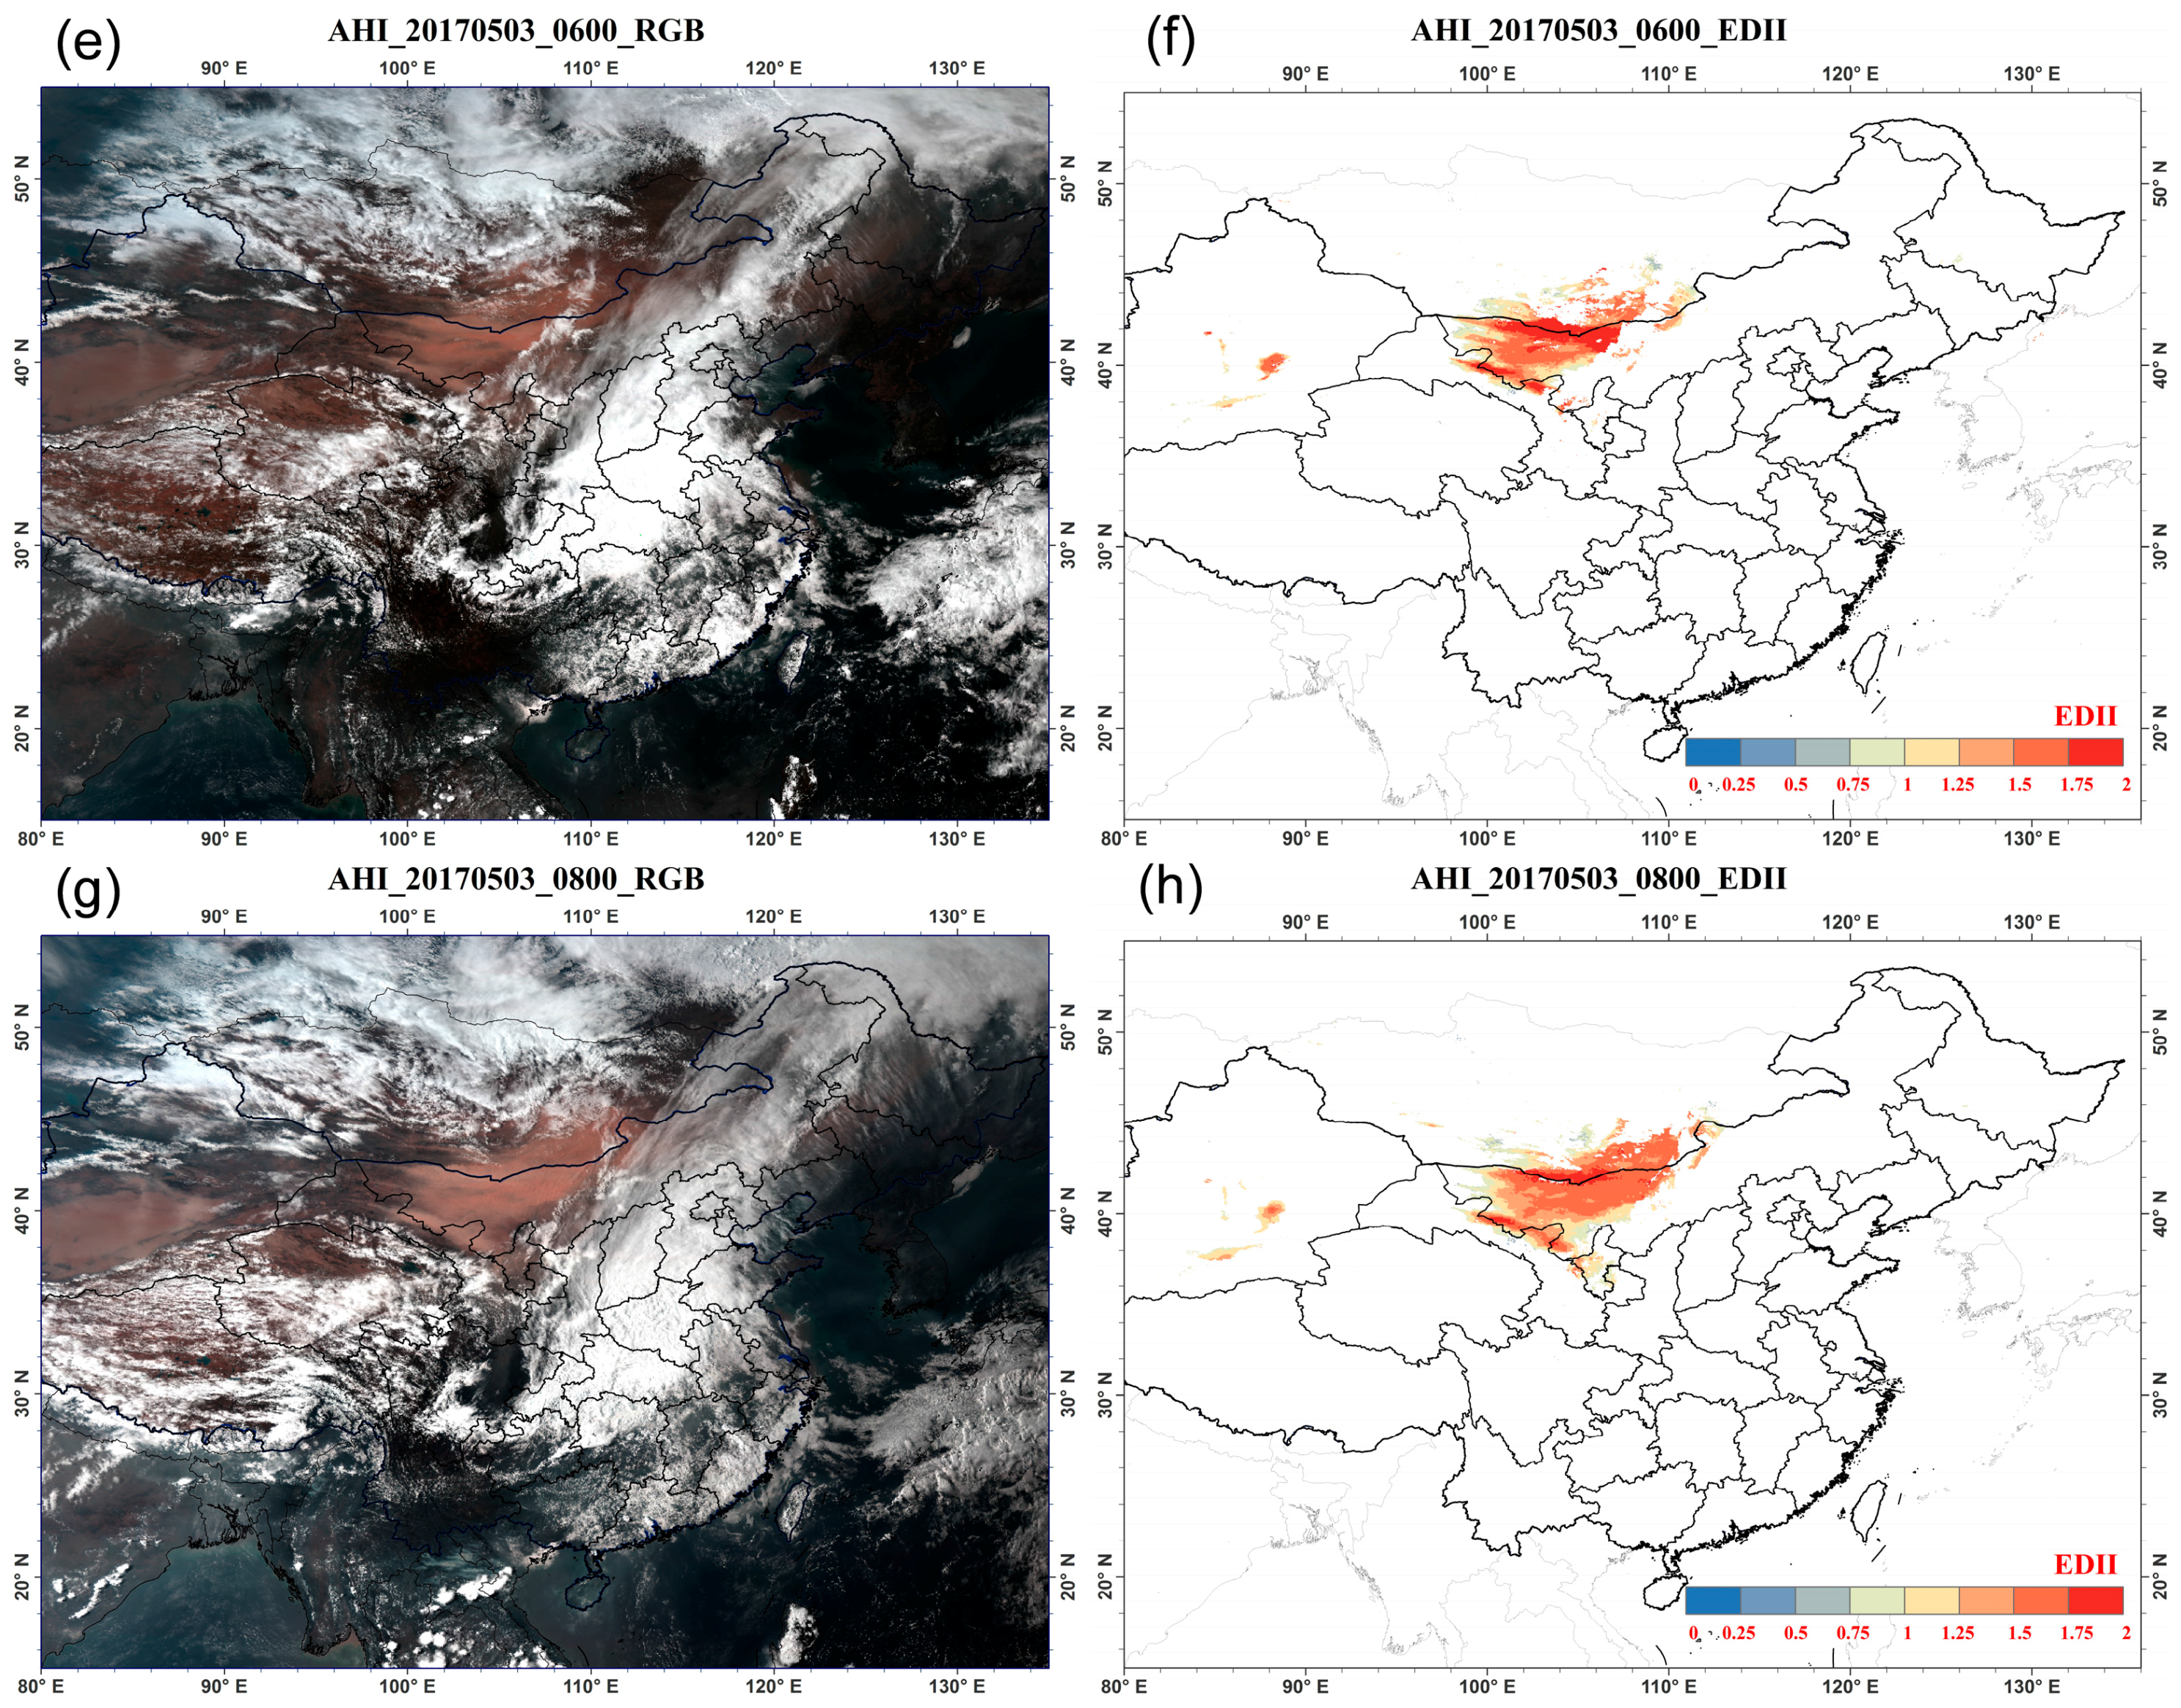
Figure 7.
Comparison of EDII (b,d,f,h) and corresponding AHI RGB composite images (a,c,e,g) on 4 May 2017. (a–d) are at 02:00, 04:00, 06:00, and 08:00 UTC, respectively.
Figure 7.
Comparison of EDII (b,d,f,h) and corresponding AHI RGB composite images (a,c,e,g) on 4 May 2017. (a–d) are at 02:00, 04:00, 06:00, and 08:00 UTC, respectively.

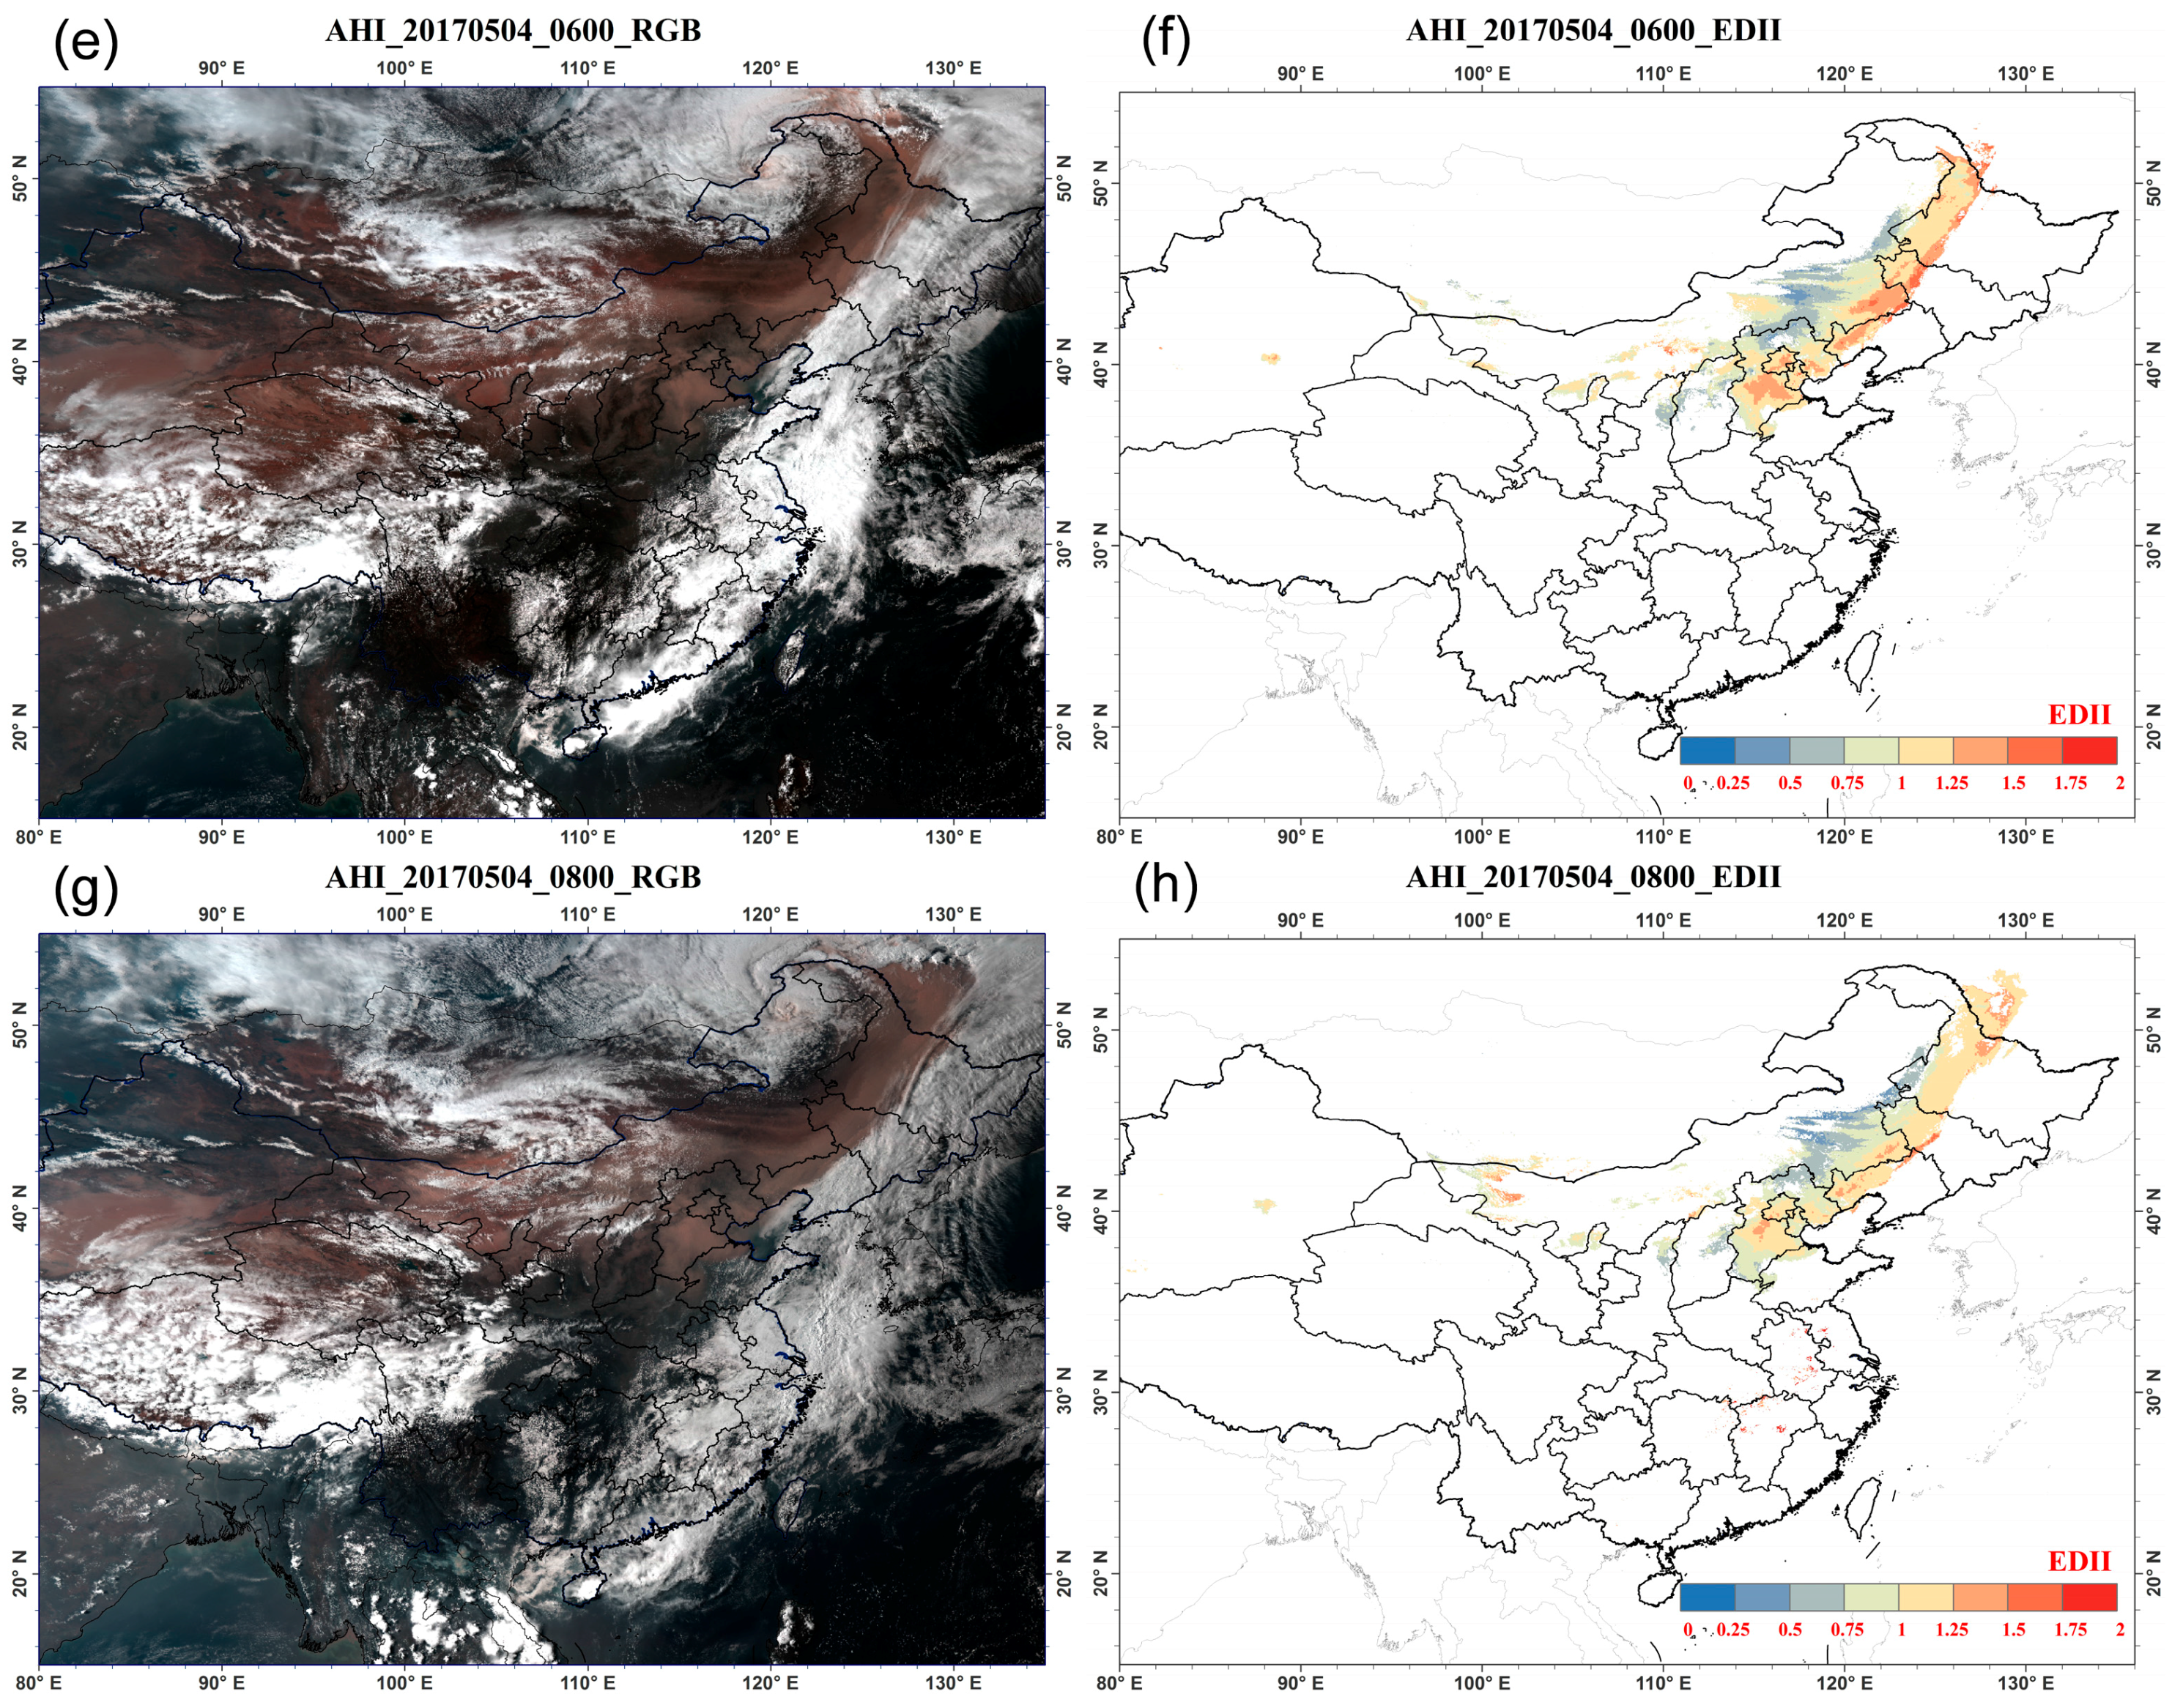
Figure 8.
24 h Backward trajectories derived from HYSPLIT model at (a) (39.0°N, 117.0°E), (b) (50.0°N, 129.0°E) on 4 May 2017. The three lines represent for different altitude levels: 500 m (red), 1000 m (blue), and 1500 m (green).
Figure 8.
24 h Backward trajectories derived from HYSPLIT model at (a) (39.0°N, 117.0°E), (b) (50.0°N, 129.0°E) on 4 May 2017. The three lines represent for different altitude levels: 500 m (red), 1000 m (blue), and 1500 m (green).

Figure 9.
AHI EDII related to the in-situ visibility. The fit curve is in red.
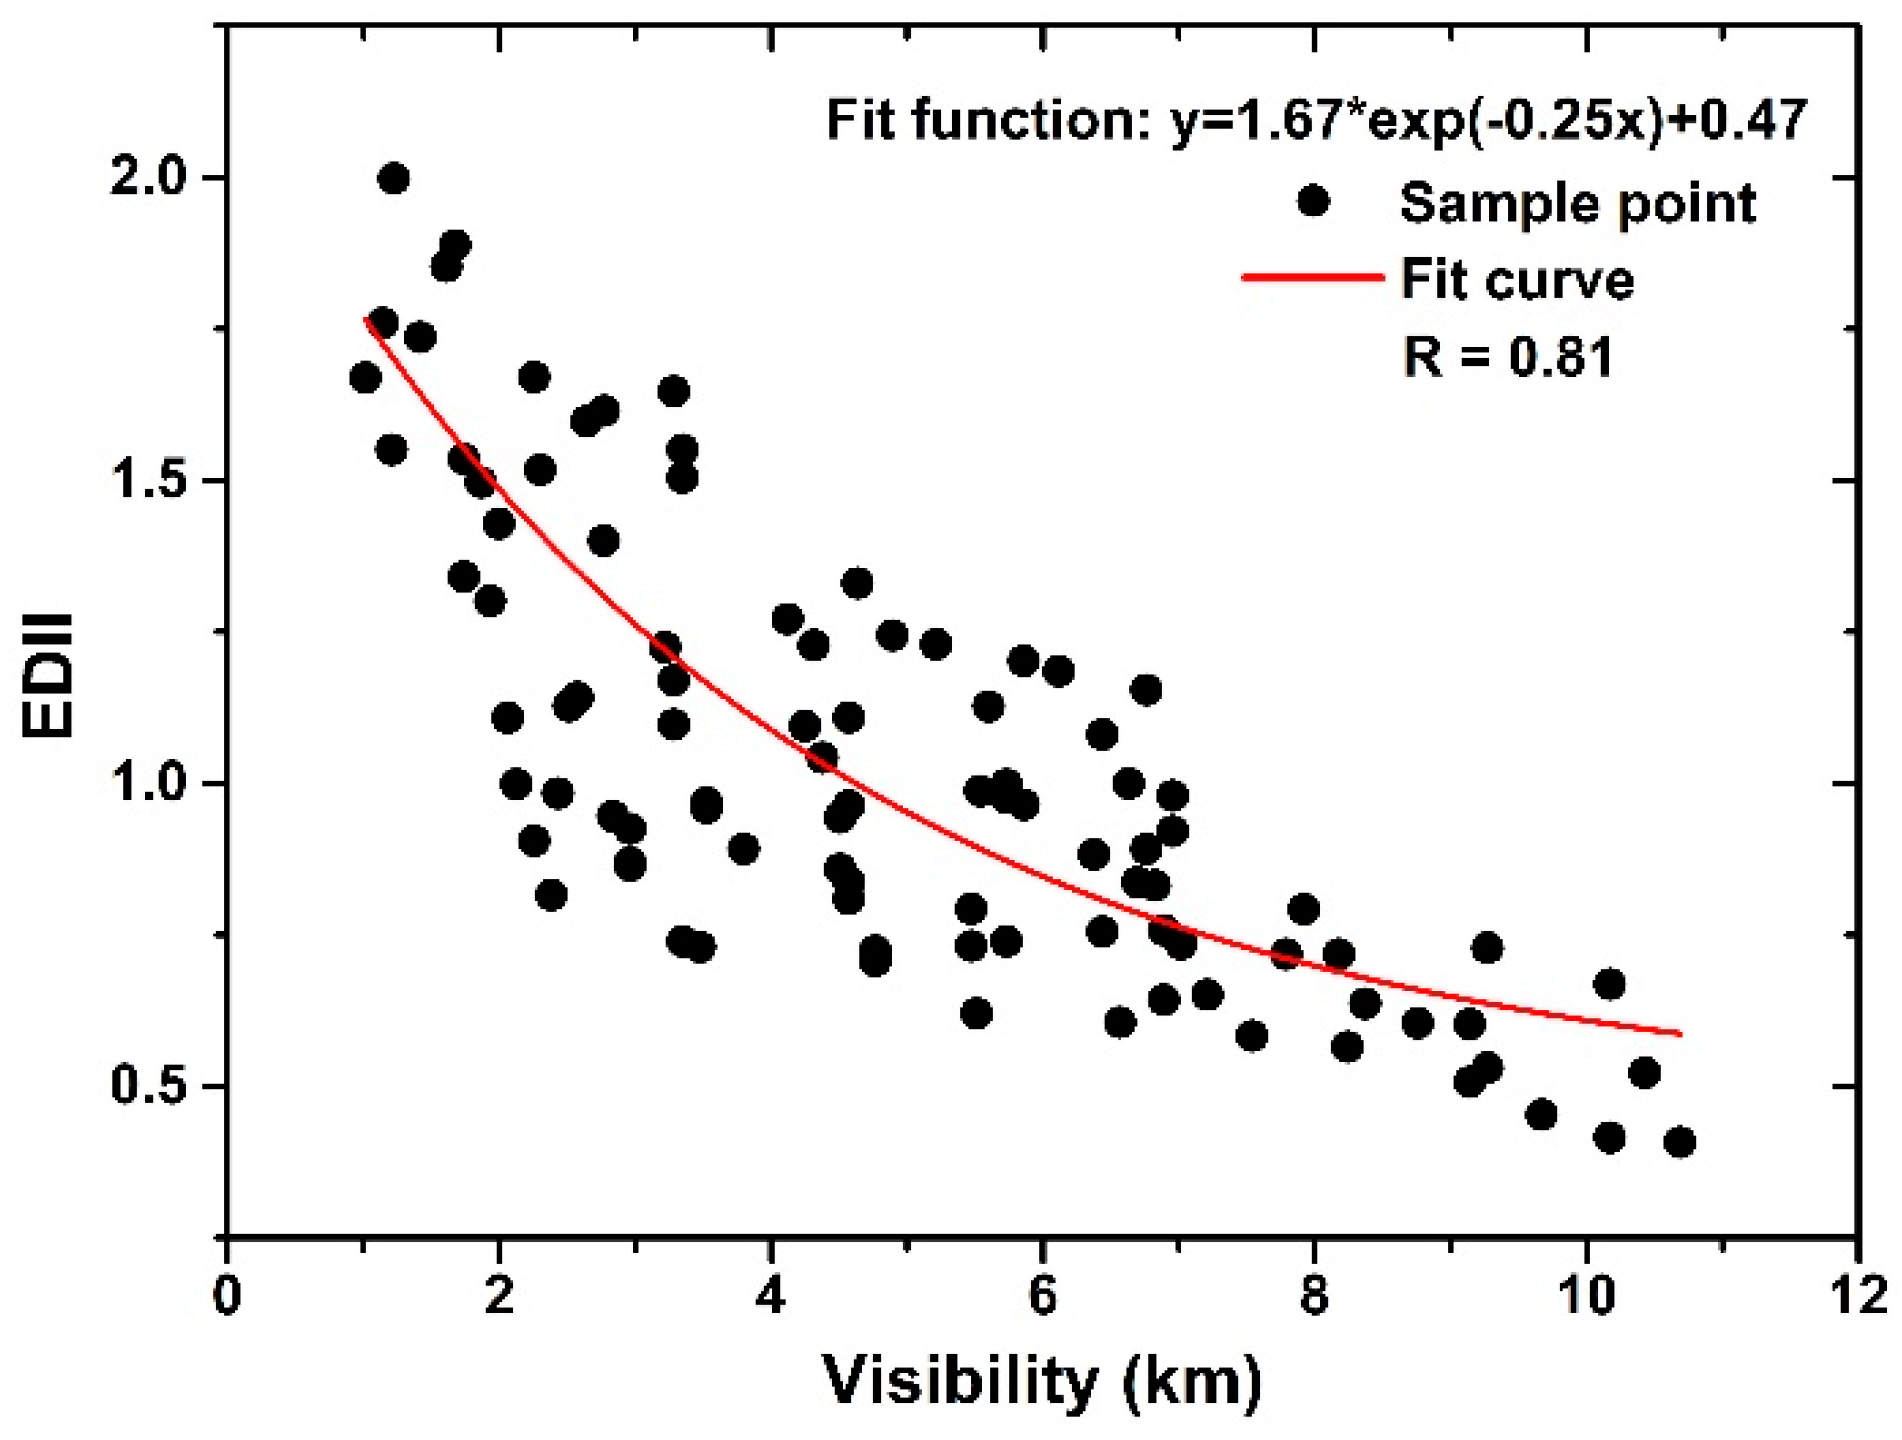
Figure 10.
Comparison of our retrieved aerosol optical depth (AOD) (a,d), MODIS C6 combined AOD (b,e), and JMA Level 2 AOD (c,f) on 4 May 2017. AOD from AHI data are at 03:00 (a,c) and 06:00 (d,f) UTC, corresponding to MODIS C6 AOD from Terra (b) and Aqua (e), respectively.
Figure 10.
Comparison of our retrieved aerosol optical depth (AOD) (a,d), MODIS C6 combined AOD (b,e), and JMA Level 2 AOD (c,f) on 4 May 2017. AOD from AHI data are at 03:00 (a,c) and 06:00 (d,f) UTC, corresponding to MODIS C6 AOD from Terra (b) and Aqua (e), respectively.
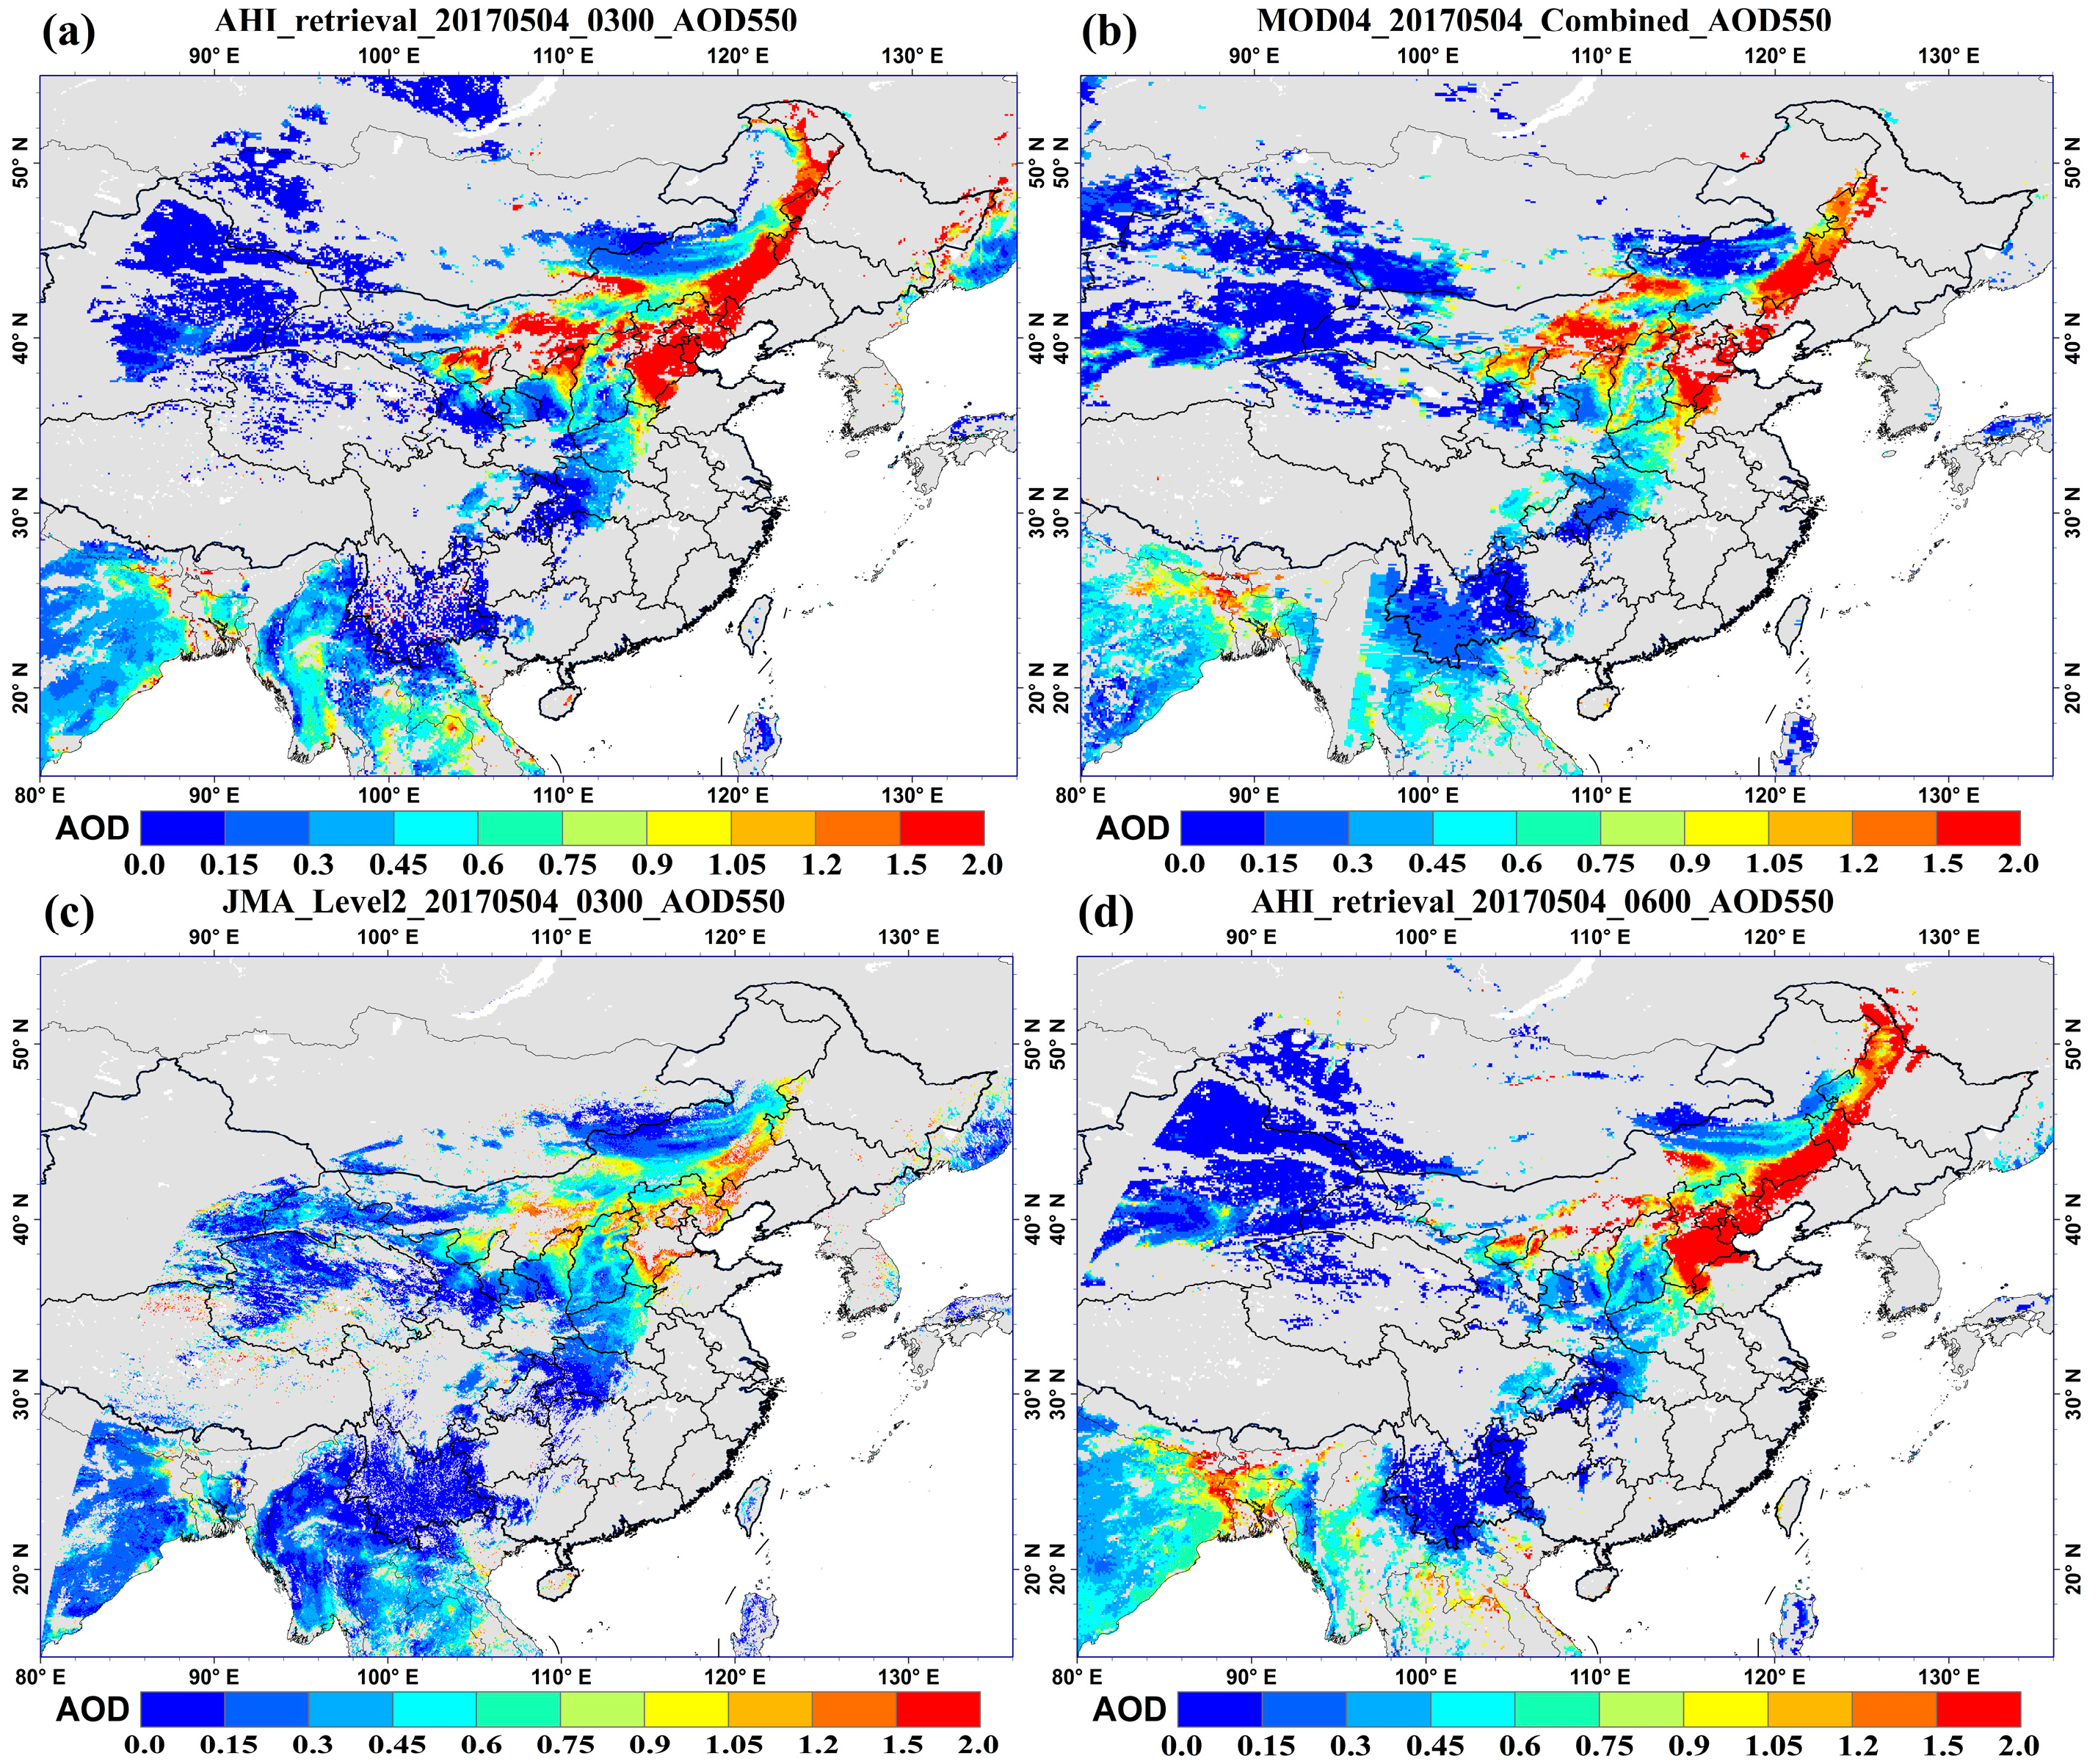

Figure 11.
Scatter plots of AHI AOD against AERONET AOD (a) and MODIS C6 AOD (b) at 0.55 μm. The solid (black), dashed (gray), and solid (blue) lines are 1:1 line, Expected Error (0.2*AODAERONET ± 0.05) envelope line and the regression line, respectively. The text at the top describes the number of matched points (N), the regression function (Fit), R2, and the root mean square error (RMSE).


Table 1.
Advanced Himawari Imager (AHI) channels specifications (http://www.jma-net.go.jp/msc/en/).
Table 1.
Advanced Himawari Imager (AHI) channels specifications (http://www.jma-net.go.jp/msc/en/).
| Channel Number | Central Wavelength (µm) | Channel Number | Central Wavelength (µm) |
|---|---|---|---|
| 1 | 0.47 | 9 | 6.94 |
| 2 | 0.51 | 10 | 7.35 |
| 3 | 0.64 | 11 | 8.60 |
| 4 | 0.86 | 12 | 9.64 |
| 5 | 1.61 | 13 | 10.41 |
| 6 | 2.25 | 14 | 11.24 |
| 7 | 3.89 | 15 | 12.38 |
| 8 | 6.24 | 16 | 13.28 |
Table 2.
List of dates of AHI data used for training.
| Dates (yyyy-mmdd) | Dates (yyyy-mmdd) | Dates (yyyy-mmdd) | Dates (yyyy-mmdd) |
|---|---|---|---|
| 2016-0303 | 2016-0406 | 2016-0505 | 2017-0504 |
| 2016-0308 | 2016-0411 | 2016-0506 | 2017-0508 |
| 2016-0311 | 2016-0416 | 2016-0510 | 2017-0529 |
| 2016-0316 | 2016-0421 | 2016-0517 | 2017-0614 |
| 2016-0317 | 2016-0424 | 2016-0530 | |
| 2016-0318 | 2016-0425 | 2016-0606 | |
| 2016-0331 | 2016-0430 | 2016-0625 |
Table 3.
Statistics metrics for comparison of AHI-based dust identification and AERONET observations.
Table 3.
Statistics metrics for comparison of AHI-based dust identification and AERONET observations.
| Station | DD | DN | ND | NN | Accuracy (%) | PCD (%) | PFD (%) |
|---|---|---|---|---|---|---|---|
| AOE_Baotou | 13 | 2 | 2 | 4 | 81 | 86 | 13 |
| Beijing | 22 | 10 | 1 | 45 | 86 | 69 | 4 |
| Dalanzadgad | 16 | 4 | 3 | 2 | 72 | 80 | 16 |
| Xianghe | 20 | 5 | 1 | 22 | 88 | 80 | 5 |
| Total | 71 | 21 | 7 | 73 | 84 | 77 | 9 |
© 2018 by the authors. Licensee MDPI, Basel, Switzerland. This article is an open access article distributed under the terms and conditions of the Creative Commons Attribution (CC BY) license (http://creativecommons.org/licenses/by/4.0/).
Share and Cite
MDPI and ACS Style
She, L.; Xue, Y.; Yang, X.; Guang, J.; Li, Y.; Che, Y.; Fan, C.; Xie, Y. Dust Detection and Intensity Estimation Using Himawari-8/AHI Observation. Remote Sens. 2018, 10, 490. https://doi.org/10.3390/rs10040490
AMA Style
She L, Xue Y, Yang X, Guang J, Li Y, Che Y, Fan C, Xie Y. Dust Detection and Intensity Estimation Using Himawari-8/AHI Observation. Remote Sensing. 2018; 10(4):490. https://doi.org/10.3390/rs10040490
Chicago/Turabian StyleShe, Lu, Yong Xue, Xihua Yang, Jie Guang, Ying Li, Yahui Che, Cheng Fan, and Yanqing Xie. 2018. "Dust Detection and Intensity Estimation Using Himawari-8/AHI Observation" Remote Sensing 10, no. 4: 490. https://doi.org/10.3390/rs10040490
Note that from the first issue of 2016, this journal uses article numbers instead of page numbers. See further details here.