Article

Examining the Effects of Hydropower Station Construction on the Surface Temperature of the Jinsha River Dry-Hot Valley at Different Seasons

1
School of Geology and Geomatics, Tianjin Chengjian University, No. 26 Jinjing RD., Xiqing District, Tianjin 300384, China
2
Institute of International Rivers and Eco-Security, Yunnan University, Kunming 650500, China
3
Yunnan Key Laboratory of International Rivers and Trans-Boundary Eco-Security, Yunnan University, Kunming 650500, China
4
Appraisal Center for Environment & Engineering Ministry of Environmental Protecion, No. 8 Beiyuan RD., Chaoyang District, Beijing 100012, China
*
Author to whom correspondence should be addressed.
Remote Sens. 2018, 10(4), 600; https://doi.org/10.3390/rs10040600
Submission received: 12 March 2018 / Revised: 31 March 2018 / Accepted: 6 April 2018 / Published: 12 April 2018

Abstract

:
On the completion of a large-scale hydropower station, the change of the water area can cause a corresponding change of local weather. To examine such changes, this paper analyzed the effect of the reservoir in the head area of the Xiluodu hydropower station based on the temperature data of MODIS MYD11A2. The temperature differences (TD) between various locations in the study area and the reservoir were calculated to explore the TD in different seasons. The reservoir effect change intensity (RECI) was established to explore the impact of the reservoir on local weather changes in different flood seasons. The combination of the TD and RECI was applied to explore the role of the hydropower station in regulating the temperature of the surrounding reservoir. The results showed the following: (1) after hydropower station construction (HSC), the TD in the valleys decreased and the TD in the dry season was lower than that in the wet season; (2) the RECI had different distribution characteristics in different flood seasons of the reservoir, and the RECI was stronger in the wet season than that in the dry season; and (3) unlike in the plains, cooling and warming effects existed simultaneously in different parts of the mountains.

Graphical Abstract

1. Introduction

Water is an important component of nature and is the most active element in the environment. Water moves constantly and participates actively in a series of physical, chemical, and biological processes in the natural environment. Significant differences between the radiation and thermal characteristics of water and other substances influence their surrounding microclimate. Water is one of the main measures for alleviating urban heat island effects [1], mainly through cooling and humidifying surrounding air through transpiration and water evaporation [2,3,4]. This is significant as urban heat islands, generated during urban development and construction, have led to a series of problems such as the rise of urban air temperature, air pollution, and energy consumption [1]. In Tehran, the capital of Iran, Bokaie et al. found that water has a slowing effect on the intensity and spread of urban heat islands [5]. In Gansu Province, China, Shi et al. studied the changes of environmental factors in the water area after artificial water conveyance in the lower reaches of the Shiyang River. The results showed an obvious “cold island” effect on the water, which promoted a similarly obvious improvement of the regional ecological environment [6]. In the area of the Shihezi Wasteland, Gao et al. studied the spatiotemporal variations of the cold island effect in the Shihezi Oasis and the cold island effect influencing factors. The results showed that the cold island effect of Shihezi Oasis first decreased and then increased, and showed that an increased water area led to an enhanced oasis cold island effect [7]. Furthermore, many scholars have found that the cold island effect of an oasis significantly and positively affected the stability of the oasis [8,9,10,11]. Consequently, the cooling effect of water is of great significance in maintaining the stability of urban and oasis ecological environments.
With the acceleration of hydropower development and construction, the issues of hydropower construction that alter the water area and surrounding ecological protection have become increasingly prominent. Studies had shown that dams could change the weather of the surrounding areas [12,13,14]. Degu et al. studied 92 large dams in North America and found that dam construction could change the surrounding weather and rainfall pattern, and they suggested building dams to ameliorate certain extremely bad weathers [15]. Moreover, Miao et al. studied the regulation of sediment in the Xiaolangdi reservoir and found that the water sediment regulation scheme (WSRS) implemented in 2002 has weakened in both function and impact, thereby increasing the risk of flooding [16]. Kong et al. studied the Xiaolangdi Dam and found that a new regulatory framework helped to stabilize the runoff [17]. Liao et al. analyzed the microclimate effects of the construction of 12 large reservoirs in Fujian Province, and they found definite microclimate effects due to the reservoirs and that different microclimates were produced by the reservoirs at different times [18].
The impact of water on the environment can be different associated with time and seasonality. Litvinov et al. discussed the ecosystem of the Rybinsk reservoir according to the seasonal water level [19]. Arfi et al. studied the ecological effects of changes in the water level of a single reservoir in Mali in West Africa. The results showed that the surrounding ecological environment is very sensitive at low water levels and that reservoir management rules and the duration of low water levels should be defined [20]. Casado et al. quantified the effects of flow regulation on the thermal behavior of rivers in a basin of Argentina. The results showed that regulating the river runoff would impact both the water temperature and the stability of the overall weather below the dam [21]. Reservoir scheduling is one of the main aspects of reservoir project management. Some scholars have suggested dynamic control of the flood-control water level to improve the utilization rate of water resources during the flood season scheduling of reservoir [22,23,24,25,26]. When the flood is small, it is necessary to increase the flood control level. When the flood is too large, flood control should be reduced [27]. For power generation without increasing the risk of flood control, Li et al. realized that the Three Gorges Project could effectively improve the land utilization rate under dynamic reservoir control [28].
Most of the aforementioned studied areas are located in flat terrains. The nature and extent of weather change depends on the geographical locations. Rastorguev et al. found that, in mountainous conditions, reservoirs have a smaller impact on the surrounding weather than they do on plains because of the special topographic conditions in mountains [29]. At high altitudes, the surface temperature is related to altitude. Sun et al. studied the effects of topography on temperature and its distribution in complex mountainous environments. They found that altitude had the greatest effect on the variation and distribution of surface air temperature [30]. By analyzing the trend of temperature change, Kane et al. found that altitude had a great influence on the temperature change [31]. Bailey et al. found that for every 1000-m increase in elevation, the average temperature dropped by 6.4 °C and that this law has regional characteristics [32]. By studying the cold island effect of parks and lakes in Chongqing, Li et al. found that the strength of the cold island produced by the water was greatly affected by altitude [33]. Zhao et al. divided areas with large differences in altitude into either mountains or plains according to altitude, and the results showed that the cold island effect changed differently in the two regions [34].
The Jinsha River Dry-Hot Valley has a special distribution of geographical landscapes. The valleys are lower in elevation and its ecological environment in these areas differs greatly from that in the surrounding area, forming a local drought climate. Because of the special dry-hot climatic conditions, the ecological environment and the ecosystem are fragile, which seriously hampers the ecological protection and social development in the area [35,36,37]. The Xiluodu hydropower project is an important part of the cascade hydropower development in the Jinsha River basin and is the largest hydropower station in the Jinsha River. After a large-scale hydropower station comes into operation, artificial reservoirs form in its upper reaches. As the area of water expands, the local weather changes [38]. Therefore, it is very important to study the changes in surrounding temperature before and after hydropower station construction (HSC) to analyze the reservoir effect and its changes. At present, the methods for studying the climate effects generated by hydropower projects need to be deduced through complex theories or numerical simulations, and most of these models require long-term field measurements [39,40]. When the terrain of the study area is complex and dangerous, remote sensing technology has become the safest and most convenient means for data acquisition.
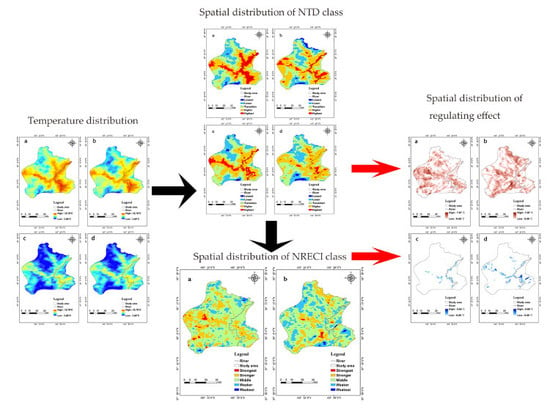
This research, therefore, aims to develop a relatively simple method to assess the intensity of the local weather change due to a dam construction in different (e.g., dry or wet) seasons. To reach this goal, we developed two indices, temperature difference (TD) and reservoir effect change intensity (RECI), and evaluated the scenarios of warming, cooling, and no adjustment effects of the reservoir on surrounding surface temperature. Specifically, the research aimed to study the following:
(1)
The spatial variations of land surface temperature before and after HSC in wet and dry seasons;
(2)
The impact of reservoir (e.g., warming, cooling, or no adjustment effect) on surrounding lands using the integration of TD and RECI; and
(3)
The quantification of the impact of reservoir and seasonality on the spatial distribution of TD and RECI with a classification scheme.

2. Materials and Methods

2.1. Study Area

The study area is the head area of the Xiluodu Reservoir (27°50′–28°20′ N, 103°00′–103°40′ E) with an area of 2548.78 km2. The Xiluodu hydropower project is an important part of cascade hydropower development in the lower reaches of the Jinsha River. The project was started in late 2005 and put into operation in 2013. It is a giant hydropower station that focuses on power generation, balancing the comprehensive benefits of sand blocking and flood control. The normal water level of Xiluodu Reservoir is 600 m and the dead water level is 540 m. The total capacity of the reservoir is 12.8 billion cubic meters and regulation of the storage capacity is 6.46 billion cubic meters. Incomplete annual regulation can be carried out. Inundation of the reservoir involves nine counties (districts) in Sichuan Province. The hydropower station is located at the junction of Leibo County, Sichuan Province and Yongshan County, Yunnan Province, within the Jinsha River Gorge between the northeastern Yunnan Plateau and the southwest Sichuan Basin. The left bank is the Daliangshan area in the southwestern Sichuan; the right bank is the northern edge of the northeastern Yunnan Plateau (Figure 1). The hydropower-station area is a narrow valley from northwest to southeast and its construction elevation is 400–800 m above sea level. The Xiluodu hydropower-station area has high mountains, low valleys, complex terrain, and a variable weather, and it suffers frequent meteorological and geological disasters.
The study area is located in the Dry-Hot Valley of the Jinsha River. The ecological environment is fragile in this area, and the contradiction between water and heat is very prominent. Degradation of vegetation and soil is serious. The annual average temperature is 20–27 °C, the annual rainfall is 600–800 mm, and the annual evaporation is three to six times of the annual precipitation. The wet and dry seasons in the study area are clearly distinguished. In the dry season (November to May), the precipitation is only 10.0–22.2% of that in a whole year and the evaporation is 10–20 times of the precipitation. During this period, the soil exhibits moisture deficiency, with the relative water content and effective moisture guarantee rate being very low [36,41,42].

2.2. Data

With the implementation of the development strategy of the southwest hydropower cascade in China, an environmental survey was conducted to examine the abundant water resources of the Jinsha River. However, because the elevation exceeds 2000 m in parts of the Jinsha River valley, with its steep valleys and cliffs, the survey was greatly hampered by transportation issues and it had been extremely difficult to use conventional ground-based survey methods to study the reservoir environment systematically. Instead, remote sensing technology was employed to obtain surface information. The reservoir topography was extracted based on visual interpretation of the Landsat TM/OLI remote sensing imagery. The selected temperature data were generated from MODIS remote sensing images through the split-window algorithm and were radiated to the cloud for processing. The product name is MYD11A2, with a resolution of 1 km and a period of 8-day. The global division of MODIS images is numbered H27V06, which is transited every day at about 13:30 in the afternoon and 01:30 in the night of the next day. After various processing such as coordinate transformation and image stretching, the temperatures were obtained. The MODIS remote sensing images were distributed through NASA’s Earth Observing System Data and Information System via the Reverb website (https://search.earthdata.nasa.gov/) and the Geospatial Data Cloud website (http://www.gscloud.cn/). In addition, we obtained DEM data with a resolution of 90 m via the Reverb website because the study area was determined based on DEM data.

2.3. Selection of Study Period and Reservoir Flood Season

Construction of the Xiluodu hydropower station began at the end of 2005 and was intercepted in 2007. Concrete construction of the main hydropower station began in March 2009.The hydropower station was fully operational in June 2014.This paper mainly studies the influence of the Xiluodu HSC on the temperature in the study area. Accordingly, we selected 2003 and 2004 as the period before HSC, and 2016 and 2017 as the period after HSC. We downloaded the MODIS remote sensing images of 2003, 2004, 2005, 2015, 2016, and 2017, and derived the annual surface temperatures. The calculation results are shown in Table 1, which indicates the choice of study period is not specific. The river where the multi-stage cascade hydropower station is located has the characteristics of large runoff and uneven spatial distribution of runoff [43]. According to Song [44], the rainfall distribution in the deep runoff area was not uniform: wet and dry seasons were obvious and the distribution was mainly during June–September. Therefore, we defined the flood season of the study area according to the actual situation: the wet season is June–August, and the dry season is December–February (running into the following calendar year). The data involved in wet and dry periods are the average of three months of MODIS images, with three or four MODIS images per month.

2.4. Calculation of TD

Based on the surface temperature obtained from MODIS imagery, TD was calculated to examine temperature differences between each location of the study area and the nearest river surface. For a particular pixel, the land surface temperature (LST) was extracted from the MODIS imagery using the split-window algorithm. For deriving the LST of the nearest river surface (LSTEA) for the pixel, the Euclidean Allocation (EA) method of ArcGIS, a commercial geographic information system (GIS) package, was employed to assign the nearest river surface temperature. Then, TD was obtained by taking the difference between LST and LSTEA. The equation is as follows:
TD = LST − LSTEA,
where TD is the temperature difference (°C), LST is the land surface temperature of a particular pixel, and LSTEA is the land surface temperature (°C) of the nearest river surface obtained by the EA processing.

2.5. Establishment of RECI

The construction of the reservoir has an impact on the surrounding environment. To study the changes of impact before and after HSC, we have newly established an index to subtract the TD before HSC from that after, which is defined as the RECI (reservoir effect change intensity). The equation is as follows:
RECI = TDL − TDF,
where RECI represents the difference in TD (°C) between different periods at the same location, and TDF and TDL represent the TD (°C) before and after HSC, respectively.

2.6. Reservoir Effect on Temperature and Its Distribution

Water plays an essential role in regulating and compensating the surrounding temperature. Many previous articles on the impact of reservoir effects on the surrounding temperature basically adopt the method of observing the temperature around the reservoir to judge the cooling/warming effect. This paper uses TD and RECI to discuss the effects of the reservoir on temperature. Based on the different combinations of TDF (before HSC), TDL (after HSC), and RECI, eight scenarios representing the effect of HSC on surrounding temperature were obtained and summarized in Table 2.
Table 2 illustrates that cooling effects occur with two scenarios, both with RECI lower than zero. For the first scenario (Row 2 of Table 2), TDs are greater than zero before HSC, and greater or equal to zero after HSC. For example, before HSC, the temperature of the water body was 3 °C and the temperature of a certain point in the study area was 5 °C (e.g., TDF = 2). After HSC, the temperature of the water body was still 3 °C, but that point’s temperature changed to 3 °C (e.g., TDL = 0, and RECI = −2), which suggests that the reservoir construction has a cooling effect on the surrounding environment. For the second scenario of the cooling effect (Row 4 of Table 2), TD is higher than zero before HSC and lower than or equal to zero after HSC. As an example, before HSC, the temperature of the water body was 3 °C and the temperature of a certain point in the study area was 5 °C (e.g., TDF = 2). After HSC, the temperature of the water body was still 3 °C, but that point’s temperature changed to 2 °C (e.g., TDL = −1, and RECI = −3), which also suggests that the reservoir construction has a cooling effect on the surrounding environment.
Similarly, two scenarios indicate warming effect with RECI higher than zero (Row 5 and Row 7 in Table 2). For Row 5, TD is lower than zero before HSC and is higher than or equal to zero after HSC. As an example, before HSC the temperature of the water body was 4 °C and the temperature of a certain point in the study area was 1 °C (TDF = −3). After HSC, the temperature of the water body was still 4 °C, but that point’s temperature changed to 5 °C (TDL = 1, and RECI = 4), which suggests that the reservoir construction has a warming effect on the surrounding environment. Similarly, Row 7 of Table 2 represents the other scenarios of warming effect, with TD before HSC lower than zero and after HSC lower than or equal to zero. As an example, before HSC the temperature of the water body was 4 °C and the temperature of a certain point in the study area was 1 °C (TDF = −3). After HSC the temperature of the water body was still 4 °C, but that point’s temperature changed to 3 °C (TDL = −1, and RECI = 2), which also suggests that the reservoir construction has a warming effect on the surrounding environment.
For other four scenarios, the warming or cooling effects are not significant enough to be identified or do not exist. For example, if both TDs before HSC and after HSC are great than zero, and the RECI is great than or equals to zero (Row 1 of Table 2), the warming effect is not clear enough to be recognized. Similarly, if both TDs before and after HSC are lower than zero, and the RECI is also lower than or equals to zero (Row 8 of Table 2), the cooling effect is not significant enough. Besides, the two scenarios (Row 3 and Row 6 of Table 2) do not exist and are not considered in this research.

2.7. Standardization and Reclassification

Because the standardization can eliminate the influence of remote sensing image at different times, TD and RECI have been standardized in this paper. The calculation equations [45] are as follows:
NTD = (TD − TDMIN)/(TDMAX − TDMIN),
NRECI = (RECI − RECIMIN)/(RECIMAX − RECIMIN),
where NTD stands for normalized TD; TDMAX and TDMIN are the maximum and minimum values of TD, respectively; NRECI represents the normalized reservoir effect change intensity; and RECIMAX and RECIMIN represent the maximum and minimum of reservoir effect change intensity, respectively. NTD and NRECI reflect only the size of the TD and RECI values but do not well determine their levels. Therefore, to represent and evaluate the spatiotemporal distributions of TD and RECI more accurately, the ranges of NTD and NRECI can be unified to 0–1 by using Equations (3) and (4). As shown in Table 3 and Table 4, we divided NTD and NRECI into five grades by means of equal breaks.

3. Results

3.1. Analysis of Temperature Spatial Distribution and Characteristics

As shown in Figure 2, the temperature distribution illustrates a clear trend across the study area. That is, the temperature close to the reservoir was relatively high, showing a large difference with the surrounding temperature. The temperature decreased gradually with distance from the reservoir. The temperature distribution is one of the main characteristics of the Dry-Hot Valley. The distributions of temperature in the dry and wet seasons were basically the same, but the highest and lowest temperatures in the dry season were, respectively, less than those in the wet season. In the wet season, the temperature extremes after HSC were not much different from those before HSC. However, in the dry season, the temperature extremes after HSC were lower than those before HSC.

3.2. Reservoir Effect and Its Distribution

The results of analyzing the impact of reservoirs on the temperature of the surrounding area (TD and RECI changes) through examining the scenarios given in Table 2, are shown in Figure 3. As shown in Figure 3, the spatial distributions of the cooling and warming effects were quite different. The cooling effect was distributed mainly in a small area close to the reservoir, whereas the warming effect was distributed more widely over a larger area. In the wet season, the extremes of the cooling effect were lower than those in the dry season, and the range of the cooling effect was relatively small. The extremes of the warming effect in the dry and wet seasons were almost the same. The cooling effect in both the wet and dry seasons was basically restricted to within 2 km of the reservoir.

3.3. Spatial Distribution and Characteristic Analysis of NTD

The results of normalizing TD (NTD, see Equation (3)) and classifying the study area based on their values according to Table 3 (see Figure 4 and Table 5) show that the distances from the reservoir from near to far were those of the highest, higher, transition, lower, and lowest zones of NTD. That is, the location close to the reservoir is with the highest temperature difference, and a decreasing trend of temperature difference has been discerned. Further, when compared with the dry season, the area of the highest zone in the wet season close to the reservoir was larger, and the NTD varied with distance from the reservoir. In the wet season before HSC, the proportions of the transition zone and higher zone were larger, accounting for 32.2% and 30.4%, respectively. The proportions of the transition zone and higher zone in the dry season remained relatively large at 40.4% and 30.6%, respectively. The proportion of the highest zone close to the reservoir decreased from 18.1 to 11.0%. After HSC, the combined area of the transition and higher zones accounted for a larger proportion. The area of the highest zone close to the reservoir decreased from 12.5 to 3.7% from the wet season to the dry season. In the wet season in different periods, the area of the highest zone close to the reservoir gradually decreased. In the dry season at different periods, the proportion of the highest zone area showed a drastic decrease.

3.4. Spatial Distribution and Characteristic Analysis of NRECI

Similarly, with the results from RECI calculations, we also derived normalized RECI (NRECI) values (see Equation (4)), and classified the study area into different zones based on their values according to Table 4. The results (see Figure 5 and Table 6) show that, in both the wet and dry seasons, the proportion of the middle zone was relatively large. In the wet season, both banks of the reservoir were characterized mainly by stronger-zone and middle-zone areas, and the middle zone within the study area was dominant with a ratio of 60.6%. In the dry season, the changed areas around the two banks of the reservoir were mainly the middle zone and the weaker zone. From the wet season to the dry season, the areas of the stronger, strongest, and middle zones decreased. Meanwhile, the proportions of the lower and lowest zones both increased, which indicates that the RECI diminished. Therefore, before and after HSC, the RECI changed differently in different flood seasons of the reservoir, with the RECI being higher in the wet season.

4. Discussion

Construction of the Xiluodu hydropower station started in 2003 and was completed in 2014. By 2016, it had started to generate water and electricity already, leading to an increase in water volume in the study area and a widening of the reservoir. The area of the main river channel has increased from 14.11 km2 to 52.49 km2, which shows that HSC can change the reservoir water area. In the study area, the closer is the neighboring area to the reservoir, the greater is the TD between the surrounding area and the reservoir. It is emphasized that the TD in this paper is not an absolute one but is either positive or negative. The temperature close to the reservoir was higher than the temperature of the reservoir water. Farther from the reservoir, the temperature on both banks of the reservoir became progressively lower than that of the reservoir. Therefore, the trend of TD on both sides of the reservoir was a continuous decrease from positive to negative values. The reason for this is that the study area is located in the dry-hot valley while the lower valley area is higher in temperature. With increasing altitude, the temperature became progressively lower, and so the TD distribution around the reservoir differed from that of the plain area.
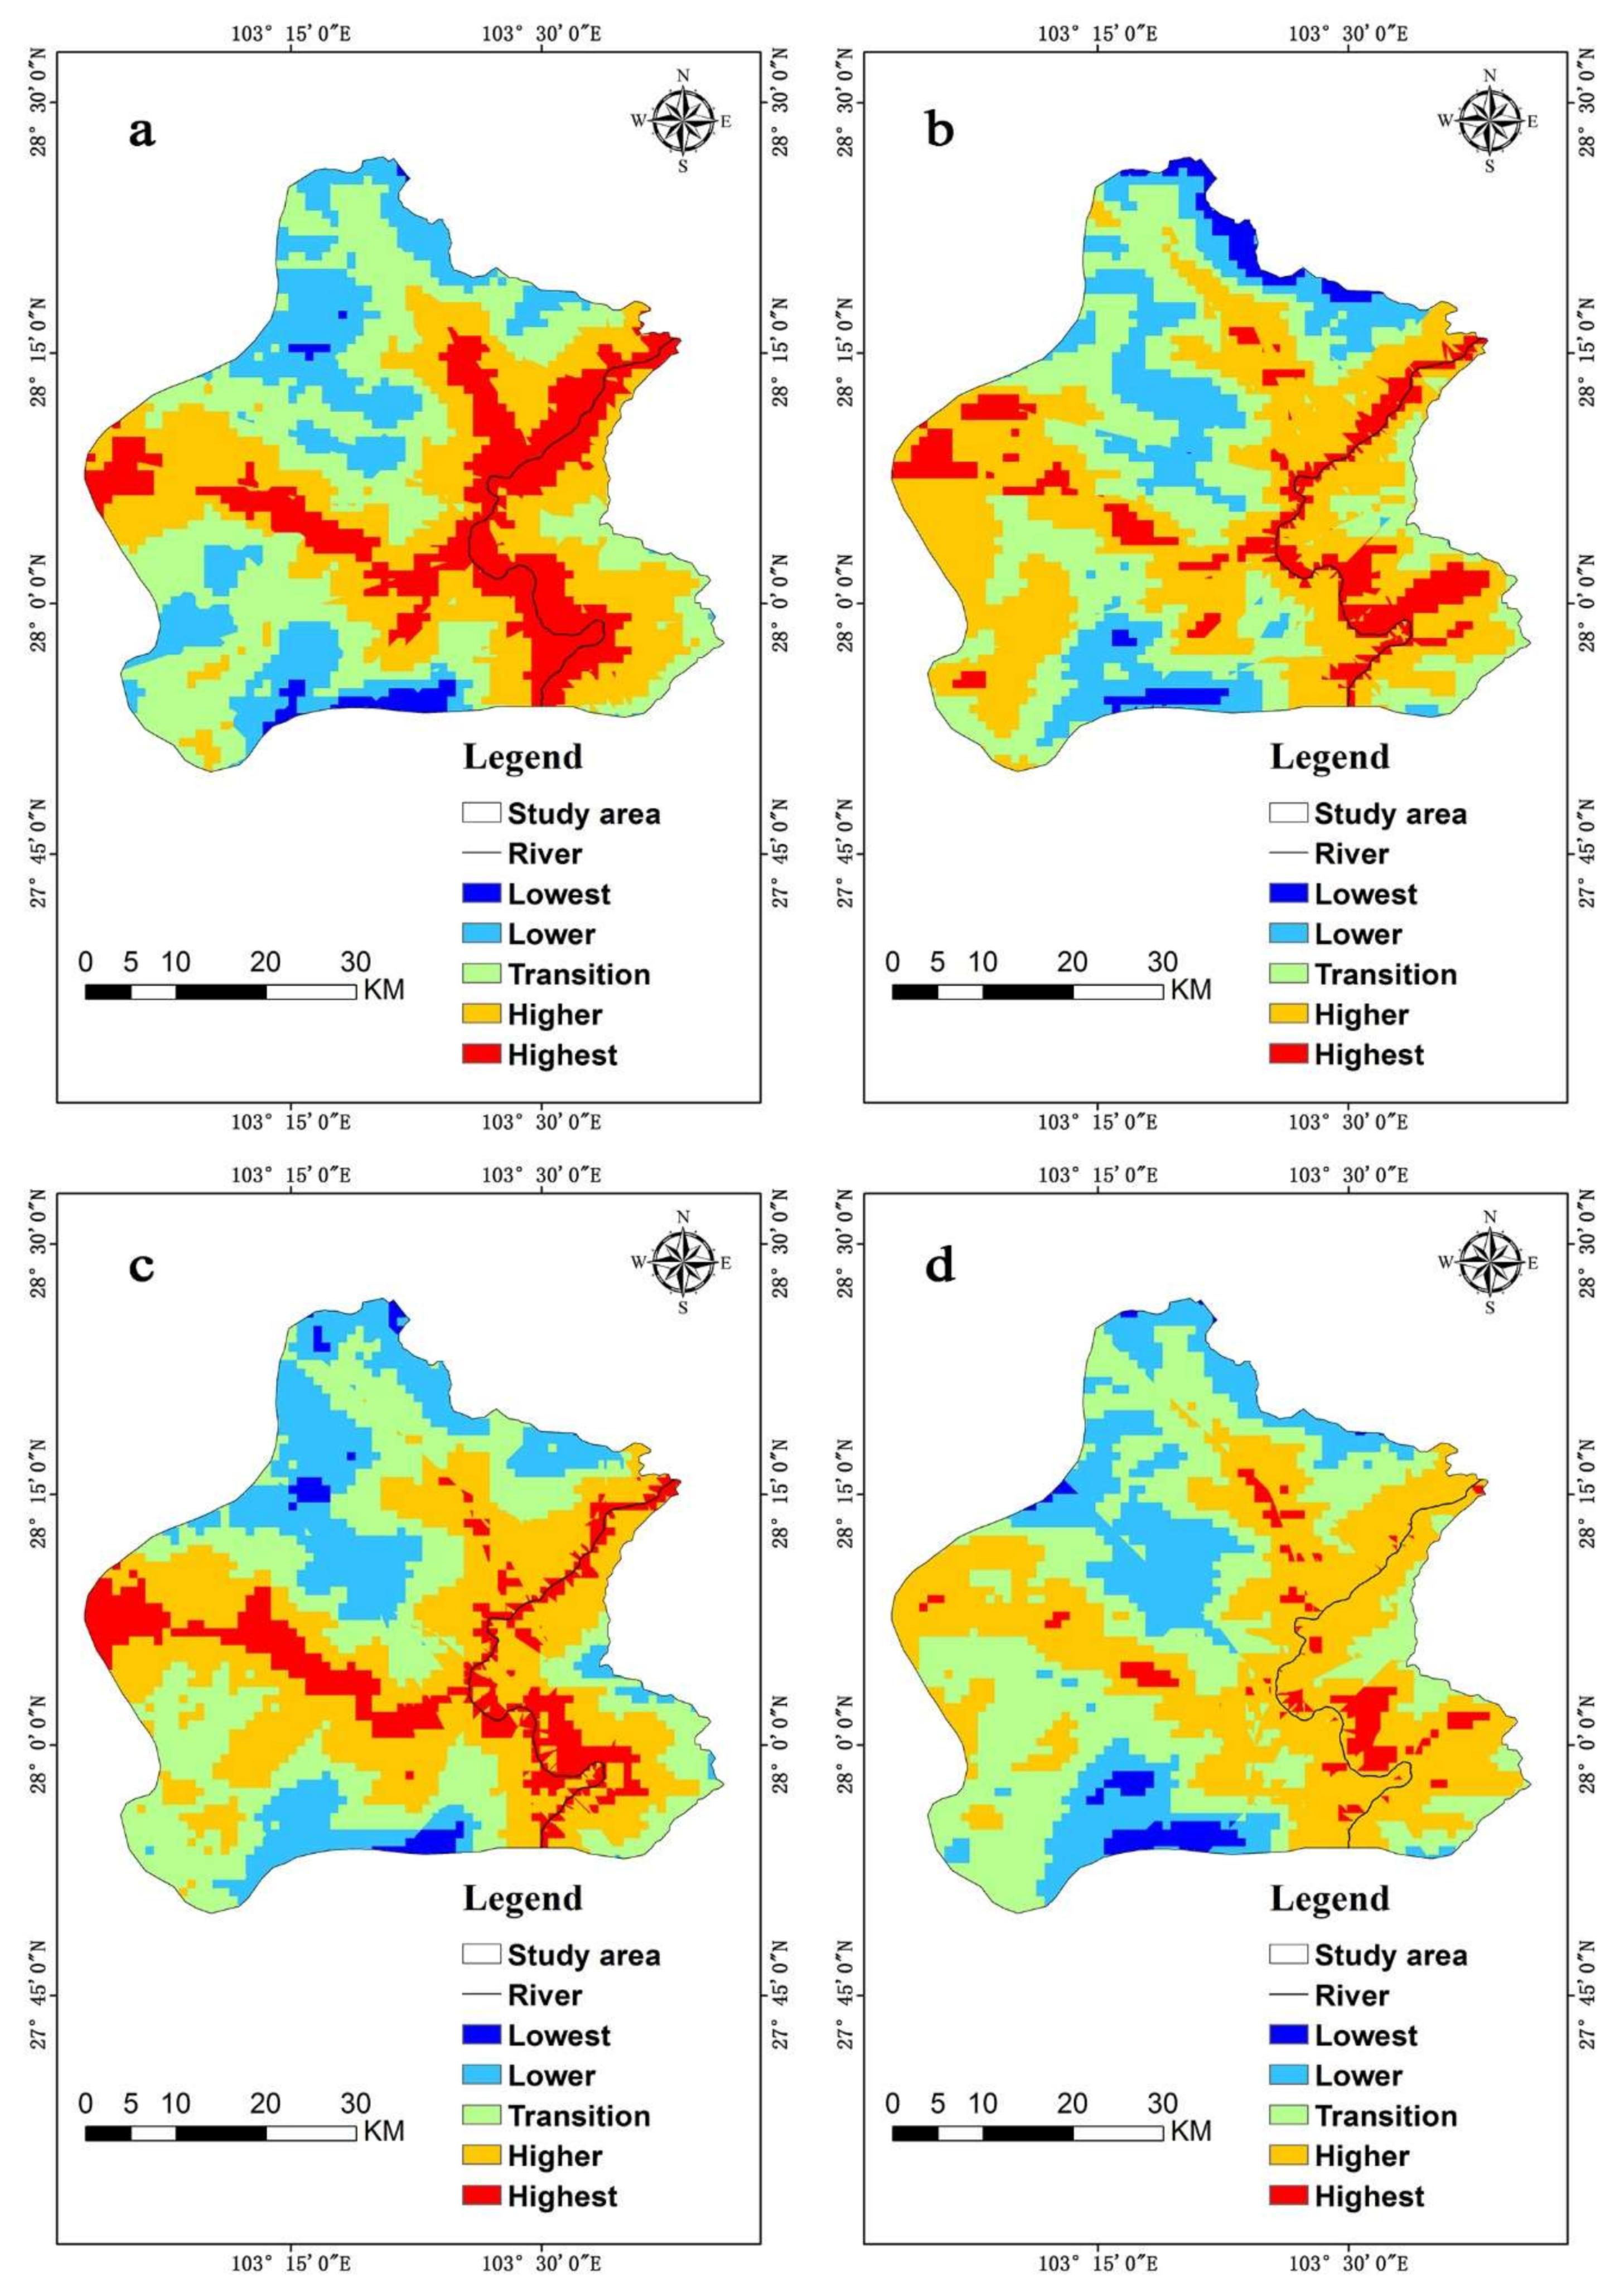
This paper explores the TD in relation to two separate aspects, namely the HSC period and the flood season of the reservoir. The rise in water level and the increase of water area after HSC affect the temperatures of the various locations in the study area. The position of the highest zone before and after HSC did not change and was distributed on both sides of the river, but the geographic area of the highest zone after the HSC was less than the geographic area before the HSC, indicating the temperature between the reservoir area and the neighboring area is getting closer, and the temperature between the reservoir and the neighboring area had become more moderate. Moreover, we found that the TD was related to the width of the water area. The wider is the water area, the more obvious are the temperature changes, the greater is TD between water and land, and the more obvious is the cooling effect to the surrounding water [46]. Therefore, differences in the study area caused differences in the results. According to the schedule of the Xiluodu hydropower station, the reservoir discharges during the wet season to relieve the reservoir load, thus reducing the reservoir water level and decreasing the water area. During the dry season, the hydropower station will be shut down to maintain water storage at a high level [27]. Because the water level and its area in the wet season were lower than those in the dry season, the highest zone in the dry season was lower than in the wet season in different flood seasons in the same period, which indicates that the temperatures of the surroundings and the reservoir were more moderate during the dry season. Tashlykova et al. presented the results of a microclimate survey of the Us-Ilimsk reservoir in Angara, Russia, one of the largest man-made reservoirs in the world. The results showed that the reservoir could affect the temperature in the surrounding area, making the neighboring weather more temperate [47]. As temperatures in the neighboring areas approached the reservoir temperature, the temperature became more moderate.
For RECI, during the wet season, the reservoir water level was reduced to run with a lower area of water. The distribution of both banks of the reservoir was mainly the stronger and middle zones, and the reservoir effect in the study area closed to the reservoir was stronger. During the dry season, the water level of the reservoir was raised and the water area was relatively large. The distribution of the two banks of the reservoir was mainly the middle and weaker zones, and the reservoir effect in both banks near the reservoir was weaker. This indicates that the change of reservoir effect was stronger in the wet season compared to the dry season. What is more, in the wet season, the temperature in the study area was high and the reservoir had a good cooling effect on the surrounding temperature. In the dry season, the temperature in the valley was not low and the reservoir had no obvious effect on the surrounding temperature. Therefore, during the period from the wet season to the dry season, the strength of the reservoir effect changed from strong to weak.
Many scholars have studied the specific impact of reservoirs on the surrounding temperature. Rastorguev et al. found that an increased water area due to reservoir construction decreased the temperature in the surrounding area and had a cooling effect in spring and summer [29], which is consistent with the conclusion that the reservoir regulates the temperature. The influence of the Miyun Reservoir on the ambient temperature was analyzed and the results showed differing results for the reservoir effect in different seasons and at different times [48]. Wang et al. studied the effect of reservoirs on the surrounding temperature and found that the temperature increased in winter and decreased in summer [38]. The research results of Liu and Wang are consistent with the findings of different flood seasons in this article. Fu et al. and Chen et al. [49,50] found that with the construction of the reservoir, the increase in water area, the winter water body has a warming effect around the reservoir area, and the summer water body has a cooling effect, but the overall effect is to increase the temperature. In this article, the reservoir has the effect of warming and cooling in both winter and summer, but the result is mainly warming. The microclimate effect of reservoir construction was analyzed and it was found that the reservoir adjusted the temperature. Specifically, in the summer, when the temperature is highest in the afternoon (approximately 2–3 p.m.), the temperature in the reservoir area is lower than in the surrounding area, while, in the morning and evening, the temperature in the reservoir area is higher than in the surrounding area [18]. This is the direction we will study next about the reservoir effect at different times of the day. Because of the special geographical location of the reservoir, it had a cooling effect on the surrounding valley area but a warming effect on the higher-altitude area. Because of the impoundment operation of reservoirs in the dry season and the flood discharge operation of reservoirs in the wet season, the water level and water area in the wet season were lower than those in the dry season [27]. Thus, the extreme value and area of the cooling effect in the dry season were both higher than those in the wet season.
In the Jinsha River dry-hot valley, with a large temperature range including extreme temperatures, it is very difficult for plants to grow. Comprehensive analysis showed that the reservoir effect will restrain the high temperature in the dry-hot valley, thereby restraining the transpiration of the surface plants and the evaporation on the ground, which is very beneficial to plant growth. The reservoir effect differs in different reservoir flood seasons, and the reservoir has the simultaneous functions of cooling and warming. It helps both to cool the valley area where the temperature is higher and warm the mountain area at higher elevation, thereby relieving the dry-hot valley weather and improving the fragile ecological environment. Because the research area has changeable climatic conditions in its mountainous areas, it is important to pay attention to the protection of vegetation, to the rational development and utilization of water resources, to maintaining the basic characteristics of the reservoir effects, and to the sustainable development of the Xiluodu hydropower station.
Because of the limited test conditions, there are no measurements of surface temperature. Many other studies, however, have shown that this method is feasible [45,51], and have applied the remotely sensed surface temperature data for reservoir water storage and reservoir effects interaction studies [52,53,54]. The other limitation of this study is that it is based on an analysis of transit remote sensing data of the Terra satellite at 11:30 a.m. Hence, the distribution of nighttime reservoirs, intensity of change, interaction between reservoir water storage and reservoir effects, and trends require further study. A third limitation is the impact of weather anomaly on the research results. With the developed method, we intentionally mitigate the effects of anomalous local climate on the results. That is, TD is developed to measure the temperature difference between land surface and water surface for the same time, with minimum impact from climatic variation. Consequently, RECI measures the temporal changes of TD, that is, the difference of the impact of water surface on local temperatures, and the effect of the local climate is insignificant. Further studies, however, are necessary to explore such impacts.

5. Conclusions

In this paper, we employed multi-temporal MODIS imagery to study the temperature and TD, and developed a simple method that integrates TD and RECI to assess the intensity of the microclimate change. Our conclusions are as follows.
(1)
The temperature and TD in the study area varied spatially: the closer to the reservoir, the higher the temperature and the higher grade the TD.
(2)
The reservoir has both a cooling and a warming effect. The cooling areas are distributed mainly in the valleys close to the reservoir with lower altitudes, while the cooling areas are distributed more widely with higher altitudes.
(3)
In general, moderate temperature variations have been found in the study area after HSC. Further, the temperature in the dry season and close to the reservoir has fewer variations when compared to those in wet season.
(4)
The RECI differs between the wet and dry seasons, with the reservoir effect more obvious in the wet season than in the dry season.

Acknowledgments

This research is supported by the National Natural Science Foundation of China (No. 91547118). The historical temperature data of the study area were downloaded from websites (https://search.earthdata.nasa.gov/) and (http://www.gscloud.cn/). DEM data of the study area were downloaded from the Geographic Spatial Data Cloud website (https://search.earthdata.nasa.gov/). Enago (https://www.enago.cn/) reviewed this paper in English language. The authors would like to show our thanks to all of them.

Author Contributions

D.W. and Y.H. conceived and designed the research; D.W. and F.W. performed the experiments; F.W. and J.L. drafted the article; F.W., Z.S., X.D. and J.C. collected and processed the data; F.W., X.D. and B.H. made the data analysis; D.W. and Y.H. discussed and modified the original manuscript; and D.W. and F.W. polished the language of the paper. All authors revised the article critically and approved the final manuscript.

Conflicts of Interest

The authors declare no conflict of interest. The founding sponsors had no role in the design of the study; in the collection, analyses, or interpretation of data; in the writing of the manuscript, and in the decision to publish the results.

References

  1. Lo, C.P.; Quattrochi, D.A.; Luvall, J.C. Application of high-resolution thermal infrared remote sensing and GIS to assess the urban heat island effect. Int. J. Remote Sens. 1997, 18, 287–304. [Google Scholar] [CrossRef]
  2. Zhang, W.; Jiang, J.; Zhu, Y. Change in urban wetlands and their cold island effects in response to rapid urbanization. Chin. Geogr. Sci. 2015, 25, 462–471. [Google Scholar] [CrossRef]
  3. Xin, C.; Onishi, A.; Jin, C.; Imura, H. Quantifying the cool island intensity of urban parks using ASTER and IKONOS data. Landsc. Urban Plan. 2010, 96, 224–231. [Google Scholar]
  4. Li, B.; Yu, W.; Liu, M.; Li, N. Climatic Strategies of Indoor Thermal Environment for Residential Buildings in Yangtze River Region, China. Indoor Built Environ. 2011, 20, 101–111. [Google Scholar]
  5. Bokaie, M.; Zarkesh, M.K.; Arasteh, P.D.; Hosseini, A. Assessment of urban heat island based on the relationship between land surface temperature and land use/land cover in tehran. Sustain. Cities Soc. 2016, 23, 94–104. [Google Scholar] [CrossRef]
  6. Shi, W.; Liu, S.; Liu, S.; Yuan, H.; Ma, J.; Liu, H.; An, F. Influence analysis of artificial water transfer on the regional ecological environment of Qingtu Lake in the lower reaches of the Shiyang River. Acta Ecol. Sin. 2017, 37, 5951–5960. [Google Scholar]
  7. Gao, Y.; Liu, P.X.; Yao, Y.L.; Yong, G.Z.; Wang, Y. Spatial-temporal characteristics and factor analysis of the cold island effect in the Shihezi oasis based on remote sensing images. J. Nat. Resour. 2015, 30, 1319–1331. [Google Scholar]
  8. Hao, X.; Li, W. Oasis cold island effect and its influence on air temperature: A case study of Tarim basin, northwest China. J. Arid Land 2016, 8, 172–183. [Google Scholar] [CrossRef]
  9. Guo, N.; Zhang, J.; Liang, Y. Climate Change Indicated by the Recent Change of Inland Lakes in Northwest China. J. Glaciol. Geocryol. 2003, 25, 211–214. [Google Scholar]
  10. Shi, Q.; Shi, Q.; Gao, W.; Ma, B.; Zhang, Y. Research on the cold-island effect with desertification process based on the Qitai oasis. In International Symposium on Multispectral Image Processing and Pattern Recognition; International Society for Optics and Photonics: Washington, DC, USA, 2007; Volume 6790. [Google Scholar]
  11. Chao, L.E.; YaNing, C.H.; XinGong, L.I.; YanXia, S.U. Evaluation of oasis stability in the lower reaches of the Tarim River. J. Arid Land 2011, 3, 123–131. [Google Scholar]
  12. Kudo, R.; Masumoto, T.; Horikawa, N.; Yoshida, T. Projection of climate change Impact on water resources for hydropower and irrigation under new dam construction in the Mekong River. AGU Fall Meet. Abstr. 2011, 43, 393–400. [Google Scholar]
  13. Zhao, Q.; Liu, S.; Deng, L.; Dong, S.; Yang, Z.; Liu, Q. Determining the influencing distance of dam construction and reservoir impoundment on land use: A case study of Manwan Dam, Lancang river. Ecol. Eng. 2013, 53, 235–242. [Google Scholar] [CrossRef]
  14. An, N.; Liu, S.; Yin, Y.; Cheng, F.; Dong, S.; Wu, X. Spatial distribution and sources of polycyclic aromatic hydrocarbons (PAHs) in the reservoir sediments after impoundment of Manwan Dam in the middle of Lancang river, China. Ecotoxicology 2016, 25, 1072–1081. [Google Scholar] [CrossRef] [PubMed]
  15. Degu, A.M.; Hossain, F.; Niyogi, D.; Sr, R.P.; Shepherd, J.M.; Voisin, N.; Chronis, T. The influence of large dams on surrounding climate and precipitation patterns. Geophys. Res. Lett. 2011, 38, 10–1029. [Google Scholar] [CrossRef]
  16. Miao, C.; Kong, D.; Wu, J.; Duan, Q. Functional degradation of the water-sediment regulation scheme in the lower yellow river: Spatial and temporal analyses. Sci. Total Environ. 2016, 551, 16–22. [Google Scholar] [CrossRef] [PubMed]
  17. Kong, D.; Miao, C.; Borthwick, A.G.L.; Duan, Q.; Liu, H.; Sun, Q.; Ye, A.; Di, Z.; Gong, W. Evolution of the yellow river Delta and its relationship with runoff and sediment load from 1983 to 2011. J. Hydrol. 2015, 520, 157–167. [Google Scholar] [CrossRef]
  18. Liao, S.; Yang, X.; Chen, S. Analysis on Microclimate Effects of Reservoirs Based on Spatial-temporal Observation Samples—A Case Study of Large-sized Reservoirs in Fujian Province. J. Fujian Normal Univ. 2014, 5, 38–43. Available online: http://ir.igsnrr.ac.cn/handle/311030/40435 (accessed on 12 April 2018).
  19. Litvinov, A.S.; Roshchupko, V.F. Long-term and seasonal water level fluctuations of the Rybinsk reservoir and their role in the functioning of its ecosystem. Water Resour. 2007, 34, 27–34. [Google Scholar] [CrossRef]
  20. Arfi, R. Seasonal ecological changes and water level variations in the Sélingué reservoir (Mali, West Africa). Phys. Chem. Earth Parts A/B/C 2005, 30, 432–441. [Google Scholar] [CrossRef]
  21. Casado, A.; Hannah, D.M.; Peiry, J.L.; Campo, A.M. Influence of dam-induced hydrological regulation on summer water temperature: Sauce Grande River, Argentina. Ecohydrology 2013, 6, 523–535. [Google Scholar] [CrossRef]
  22. Ren, J.F. Research on reservoir flood season staging and limited water level dynamic control. J. Zhejiang Univ. Water Resour. Electr. Power 2016, 28, 22–25. [Google Scholar]
  23. Liu, P.; Li, L.; Guo, S.; Xiong, L.; Zhang, W.; Zhang, J.; Xu, C.Y. Optimal design of seasonal flood limited water levels and its application for the three gorges reservoir. J. Hydrol. 2015, 527, 1045–1053. [Google Scholar] [CrossRef]
  24. Moussa, A.M.A. Dynamic operation rules of multi-purpose reservoir for better flood management. Alex. Eng. J. 2017, in press. [Google Scholar] [CrossRef]
  25. Gioia, A. Reservoir Routing on Double-Peak Design Flood. Water 2016, 8, 553. [Google Scholar] [CrossRef]
  26. Scarrott, R.M.J.; Reed, D.W.; Bayliss, A.C. Indexing the attenuation effect attributable to reservoirs andlakes. In Statistical Procedures for Flood Frequency Estimation; Flood Estimation Handbook; Robson, A., Reed, D., Eds.; Centre for Ecology & Hydrology: Wallingford, UK, 1999; Volume 5, pp. 19–26. [Google Scholar]
  27. Li, L. Research on dynamitic control of flood limitation water level during main flood period in Panjiakou reservoir. Haihe Water Resour. 2007, 34–36. [Google Scholar]
  28. Li, X.; Guo, S.; Liu, P.; Chen, G. Dynamic control of flood limited water level for reservoir operation by considering inflow uncertainty. J. Hydrol. 2010, 391, 124–132. [Google Scholar] [CrossRef]
  29. Rastorguev, V.I.; Roshchina, I.M. Consideration of changes in the local climate in the region of the reservoir and lower pool of hydroelectric stations. Hydrotech. Constr. 1987, 21, 580–583. [Google Scholar] [CrossRef]
  30. Sun, R.; Zhang, B. Topographic effects on spatial pattern of surface air temperature in complex mountain environment. Environ. Earth Sci. 2016, 75, 621. [Google Scholar] [CrossRef]
  31. Kane, R.P.; Buriti, R.A. Latitude and altitude dependence of the interannual variability and trends of atmospheric temperatures. Pure Appl. Geophys. 1997, 149, 775–792. [Google Scholar] [CrossRef]
  32. Bailey, R.G. Ecosystem Geography; Springer: New York, NY, USA, 2009; ISBN 978-0-387-89516-1. [Google Scholar]
  33. Li, C.; Yu, C.W. Mitigation of urban heat development by cool island effect of green space and water body. Lect. Notes Electr. Eng. 2014, 261, 551–561. [Google Scholar]
  34. Zhao, H.L. The Land Surface Temperature of Arid Regoin Calculation and the Space-Time Characteristic Analysis of It; Xinjiang University: Urumqi, China, 2007. [Google Scholar]
  35. Fang, H.D.; Duan, C.Q.; Pan, Z.X.; Sha, Y.C.; Lu, H.E.; Zhong-Hua, J.I. Progress and perspectives on ecological restoration in the dry-hot valley of Jinshajiang river. Environ. Ecol. Three Gorges 2009, 2, 5–9. [Google Scholar]
  36. Luo, H.; Wang, K. Soil seed bank and aboveground vegetation within hillslope vegetation restoration sites in Jinshajing hot-dry river valley. Acta Ecol. Sin. 2006, 26, 2432–2442. [Google Scholar] [CrossRef]
  37. Liu, F.Y.; Zhang, Z.X.; Wang, X.Q.; Kun, L.I.; Chen, M.; Deng, X.J. Seed dispersion and seed bank characteristics of terminaliafranchetii in dry-hot valley of Jinsha river. J. Trop. Subtrop. Bot. 2012, 20, 333–340. [Google Scholar]
  38. Wang, W.; Liu, W.; Ma, X. Analysis for influence upon local climate factors of reservoir area of hydropower station after water storage. Appl. Mech. Mater. 2012, 212, 245–252. [Google Scholar] [CrossRef]
  39. Lei, X.; Lin, Z.; Su, Z.; Zhou, S.; Huang, M. Analysis on the Characteristics of Climate Change and Influence of Tianshengqiao Reservoir. J. Anhui Agric. Sci. 2010, 38, 3556–3558. [Google Scholar]
  40. Tian, L.; Wang, L.; Wen, J.; Yang, R.; Xia, K. Effects of climate change on inflow and water consumption in Dahaibo reservoir. South-to-North Water Divers. Water Sci. Technol. 2012, 10, 27–31. [Google Scholar]
  41. Zhang, Z.; Ming, Q.; Zhang, H.; Li, H.; Duan, L. Progress and Issues on Geographical Environment Evolution in Dry-Hot Valley of Jinsha River. Geogr. Sci. Res. 2013, 2, 1–7. [Google Scholar] [CrossRef]
  42. Xie, Y.; Zeng, S.; Wang, W. Fractal dimensional analysis of runoff in jinsha river basin, China. Appl. Mech. Mater. 2013, 405, 2181–2184. [Google Scholar] [CrossRef]
  43. Wang, X.; Pang, Y.; Niu, Y.; Ji, F. Study on the Cumulative Effects of Cascading Reservoirs in Wujiang. Sci. Technol. Eng. 2015, 15, 275–279. [Google Scholar]
  44. Song, M.; Li, T.; Chen, J. Preliminary analysis of precipitation runoff features in the Jinsha river basin. Procedia Eng. 2012, 28, 688–695. [Google Scholar]
  45. Sandholt, I.; Rasmussen, K.; Andersen, J. A simple interpretation of the surface temperature/vegetation index space for assessment of surface moisture status. Remote Sens. Environ. 2002, 79, 213–224. [Google Scholar] [CrossRef]
  46. Sun, R. How can urban water bodies be designed for climate adaptation? Landsc. Urban Plan. 2012, 105, 27–33. [Google Scholar] [CrossRef]
  47. Tashlykova, T.A. Changes in local climate in the neighbourhood of the Ust-Ilimsk water reservoir on the angara, Russia. Environ. Soc. Econ. Stud. 2013, 1, 9–16. [Google Scholar] [CrossRef]
  48. Liu, Y.; Xuan, C.; Quan, W. Thermal environment effect of land surface water bodies in beijing based on satellite data. J. Lake Sci. 2013, 25, 73–81. [Google Scholar]
  49. Fu, B. The Climatic Effects of Waters in Different Natural Condition. Acta Geographica Sinica. 1997, 3, 246–253. Available online: http://dx.chinadoi.cn/10.3321/j.issn:0375-5444.1997.03.007 (accessed on 12 April 2018).
  50. Chen, X.; Song, L.; Guo, Z. Climate Change over the Three Gorges Reservoir and Upper Yangtze with its Possible Effect. Resour. Environ. Yangtze Basin 2013, 22, 1466–1471. [Google Scholar]
  51. Boschetti, L.; Roy, D.; Hoffmann, A.A. Modis Collection 5 Burned area Product-MCD45; Users Guide; University of Maryland: College Park, MD, USA, 2008. [Google Scholar]
  52. Sun, Q.; Miao, C.; Duan, Q. Changes in the spatial heterogeneity and annual distribution of observed precipitation across China. J. Clim. 2017, 30, 9399–9416. [Google Scholar] [CrossRef]
  53. Wu, J.; Miao, C.; Wang, Y.; Duan, Q.; Zhang, X. Contribution analysis of the long-term changes in seasonal runoff on the loess plateau, China, using eight budyko-based methods. J. Hydrol. 2016, 545, 263–275. [Google Scholar] [CrossRef]
  54. Shu, W.; Qiuping, L.I.; Wang, H.; Wang, X. Impact analysis of climatic changes and human activities on characteristics of inflow runoff of three gorges reservoir. Water Power. 2016, 42, 29–33. [Google Scholar]
Figure 1. Location of the Study Area.
Remotesensing 10 00600 g001
Figure 2. (a) Temperature distribution in wet season before HSC; (b) temperature distribution in wet season after HSC; (c) temperature distribution in dry season before HSC; and (d) temperature distribution in dry season after HSC.
Remotesensing 10 00600 g002
Figure 3. (a) Spatial distribution of warming effect in wet season; (b) spatial distribution of warming effect in dry season; (c) spatial distribution of cooling effect in wet season; and (d) spatial distribution of cooling effect in dry season.
Remotesensing 10 00600 g003
Figure 4. (a) Spatial distribution of NTD class before HSC in wet season; (b) spatial distribution of NTD class before HSC in dry season; (c) spatial distribution of NTD class after HSC in wet season; and (d) spatial distribution of NTD class after HSC in dry season.
Remotesensing 10 00600 g004
Figure 5. (a) Spatial distribution of NRECI class in wet season; and (b) spatial distribution of NRECI class in dry season.
Remotesensing 10 00600 g005
Table 1. Reservoir’s average annual surface temperatures (°C).
YearAverage Annual Surface Temperatures
200320.88
200421.43
200521.95
201520.14
201619.87
201721.27
Table 2. Reservoir effects on temperature regulation. Visa sign (√) indicates the reservoireffects on temperature regulation.
TD before HSCTD after HSCRECICooling EffectWarming EffectNo Adjustment Effect
>0>0≥0
>0≥0<0
>0<0≥0
>0≤0<0
<0≥0>0
<0>0≤0
<0≤0>0
<0<0≤0
Table 3. Classification level based on the range of NTD.
GradeNTD’s Range
Lowest0.0~0.2
Lower0.2~0.4
Transition0.4~0.6
Higher0.6~0.8
Highest0.8~1.0
Table 4. Classification level based on the range of NRECI.
GradeNRECI’s Range
Weakest0.0~0.2
Weaker0.2~0.4
Middle0.4~0.6
Stronger0.6~0.8
Strongest0.8~1.0
Table 5. Percentage (%) of TD-class per season and time respect hydropower station construction (HSC).
GradeBefore HSC in Wet SeasonBefore HSC in Dry SeasonAfter HSC in Wet SeasonAfter HSC in Dry Season
Lowest1.52.61.32.1
Lower17.815.418.418.3
Transition32.230.631.236.5
Higher30.440.436.639.4
Highest18.111.012.53.7
Table 6. Percentage (%) of the NRECI-class (normalized reservoir effect change intensity) per season.
GradeWet SeasonDry Season
Strongest1.40.9
Stronger26.117.7
Middle60.657.3
Weaker11.523.2
Weakest0.40.9

