Evaluation of ISS-RapidScat Wind Vectors Using Buoys and ASCAT Data

The First Institute of Oceanography, State Oceanic Administration, Qingdao 266061, China
*
Author to whom correspondence should be addressed.
Remote Sens. 2018, 10(4), 648; https://doi.org/10.3390/rs10040648
Submission received: 8 March 2018
/
Revised: 16 April 2018
/
Accepted: 17 April 2018
/
Published: 23 April 2018
(This article belongs to the Special Issue Radar Remote Sensing of Oceans and Coastal Areas)
Abstract
:The International Space Station scatterometer (named ISS-RapidScat) was launched by NASA on 20 September 2014 as a continuation of the QuikSCAT climate data record to maintain the availability of Ku-band scatterometer data after the QuikSCAT missions ended. In this study, the overall archived ISS-RapidScat wind vectors in the wind speed range of 0–24 m/s are evaluated by the global moored buoys’ wind observations, including the U.S. National Data Buoy Center (NDBC), the Tropical Atmosphere Ocean (TAO), and the Pilot Research Moored Array in the Tropical Atlantic (PIRATA), the Research Moored Array for African–Asian–Australian Monsoon Analysis and Prediction (RAMA), and Advanced Scatterometer (ASCAT) wind data in the same period of ISS-RapidScat by calculating the statistical parameters, namely, the root mean square error (RMSE), bias (mean of residuals), and correlation coefficient (R) between the collocated data. The comparisons with the global moored buoys show that the RapidScat wind vectors are consistent with buoys’ wind measurements. The average errors of the RapidScat wind vectors are 1.42 m/s and 19.5°. The analysis of the RapidScat wind vector errors at different buoy wind speeds in bins of 1 m/s indicates that the errors of the RapidScat wind speed reduce firstly, and then increase with the increasing buoy wind speed, and the errors of the RapidScat wind direction decrease with increasing buoy wind speed. The comparisons of the errors of the RapidScat wind speed and direction at different months from April 2015 to August 2016 show that the accuracies of the RapidScat wind vectors have no dependence on the time, and the biases of the RapidScat wind speed indicate that there is an annual periodic signal of wind speed errors which are due to the annual cycle variation of ocean winds. The accuracies of the RapidScat wind vectors at different times in one day are also analyzed and the results show that the accuracy of the RapidScat wind vectors at different times of the day is basically consistent and with no diurnal variation. In order to evaluate the ISS-RapidScat wind vectors of the global oceans, the differences (RapidScat-ASCAT) in the wind speed range of 0–30 m/s are analyzed in the different months from October 2014 to August 2016, and the average RMSEs of differences between ISS-RapidScat and ASCAT wind vectors are less than 1.15 m/s and 15.21°. In general, the evaluation of the all-over archived ISS-RapidScat wind vectors show that the accuracies of the ISS-RapidScat wind vectors satisfy the general scatterometer’s mission requirement and are consistent with ASCAT wind data.
1. Introduction
Oceans, which cover about 70% of the Earth’s surface area, are a regulator of the Earth’s system and a major factor affecting the global climate system. Ocean surface wind vectors are an important parameter of physical oceanography and occupy an important position in the ocean and climate model. Ocean surface wind is one of the important factors that influences the generation and movement of the ocean waves, ocean currents, and water masses. Ocean surface wind is directly related to almost all seawater movements, from small-scale ocean waves to large-scale ocean currents. Going back to the 1970s, spaceborne radar scatterometry has been used to measure ocean surface winds [1,2]. The SeaSat-A satellite, which was equipped with the first spaceborne scatterometer—SASS—was launched in 1978, and the SASS is a Ku-band scatterometer with the spatial resolution of 50 km and a swath of 1000 km. A large number of scatterometers have appeared since SASS. The European Space Agency’s European Remote Sensing satellites (ERS-1 and ERS-2), launched in 1991 and 1995, carried the Active Microwave Instrument (AMI), which worked in the C-band and had the same spatial resolution and swath as SASS. The Advanced Earth Observing Satellite 1 (ADEOS-I), which was equipped with the National Aeronautics and Space Administration (NASA) Scatterometer (NSCAT), had a spatial resolution of 50 km and the swath of 600 km, and was launched by the National Space Development Agency of Japan in 1996. After the end of ADEOS-I in 1997 after the satellite sustained structural damage to the solar panel array, its successor, ADEOS-II, equipped with the Seawinds instrument, which had a spatial resolution of 25 km and the swath of 1800 km, was launched in 2002. In addition, the Seawinds instrument on the QuikSCAT satellite was launched by NASA in 1999, which had a spatial resolution of 25 km and a swath of 1800 km. QuikSCAT was the longest-lived scatterometer satellite which ended in 2009. The MetOp-A and MetOp-B polar orbiting meteorological satellites developed by the European Space Agency, and operated by the European Organization for the Exploitation of Meteorological Satellites (EUMETSAT), were launched in 2006 and 2012, which employed the Advanced Scatterometer (ASCAT) with a 25 km spatial resolution and two swaths of 550 km. The Oceansat-2 satellite, launched by India in 2009, employed a scatterometer with a spatial resolution of 50 km and a swath of 1400–1840 km. China’s first ocean dynamic environment monitoring satellite—HY-2A—launched in 2011, also employed a radar scatterometer which worked in the Ku-band with a spatial resolution of 25 km and a swath of 1700 km. The basic information of the previous and on-going scatterometers is given in Table 1.
To maintain the availability of Ku-band scatterometer data after the ADEOS-II and QuikSCAT missions ended, NASA developed a new scatterometer for the International Space Station (named ISS-RapidScat) using a combination of spare SeaWinds subsystems and a new, low-cost subsystem having mostly commercial-grade parts [3]. The ISS-RapidScat mission was launched on 20 September 2014 with the primary goal of measuring ocean surface wind vectors at a 10 m reference height as a continuation of the QuikSCAT climate data record in support of fundamental scientific research of Earth’s weather, oceans, and coupled climate system. After successfully being mounted and properly calibrated on the ISS, the ISS-RapidScat instrument began providing wind vector measurements on 3 October 2014. ISS-RapidScat is in a unique position to provide the asynchronous ocean surface wind measurements with respect to the solar day cycle of the Earth; thus, the ISS-RapidScat had the unique capability (in contrast to all other space-borne scatterometers) of observing diurnal and semi-diurnal variability over seasonal time scales. The ISS-RapidScat stopped working due to an instrument power failure on 19 August 2016.
It is well known that the evaluation of scatterometer wind retrievals is fundamental in data improvements and applications. Especially, climate data records (CDRs) for global change study require long time series multi-source satellite scatterometer ocean surface wind data with consistency and high accuracy. Thus, data assessments of satellite scatterometer ocean surface wind vectors are necessary. Many validation and evaluation studies have been carried out for the past and present satellite scatterometers. Freilich [4] compared the NASA Scatterometer (NSCAT1) wind vectors with operational U.S. National Data Buoy Center (NDBC) buoy wind data using a vector correction statistic method, and the results showed that the standard deviations of wind speed and direction are 1.3 m/s and 18°. Quilfen [5] referenced NDBC buoy winds and the European Center for Medium Range Weather Forecasting (ECMWF) analysis winds to evaluate ERS scatterometer ocean wind measurements via a triple collocation analysis and found that the ERS scatterometer and NSCAT measurement accuracies were comparable. Wind vectors observed by the QuikSCAT/SeaWinds satellite are validated by comparing with wind buoy observations operated by the NDBC, the Tropical Atmosphere Ocean (TAO), and the Pilot Research Moored Array in the Tropical Atlantic (PIRATA) projects, and the Japan Meteorological Agency (JMA). The comparisons show that the wind speeds and directions observed by QuikSCAT/SeaWinds agree well with the buoy data and the root mean square differences of the wind speed and direction for the QuikSCAT/SeaWinds wind data products are 1.01 m/s and 23° [6]. Bentamy [7] compared the ASCAT wind retrievals with moored buoys, and the comparisons indicate that the ASCAT wind speeds and directions agree well with buoy data and the root mean square differences of the wind speed and direction are less than 1.72 m/s and 18°. Oceansat-2 scatterometer wind vectors were compared with in situ observations made by the Research Moored Array for African–Asian–Australian Monsoon Analysis and Prediction (RAMA) and the Triangle Trans-Ocean Buoy Network (TRITON) buoys in the Indian Ocean and the Pacific Ocean, and the root mean square deviation for wind speed and direction are 1.71–1.92 m/s and 44.61°–51.38°, respectively [8]. HY-2A scatterometer wind data were compared with NDBC and TAO buoys, and ASCAT and National Centers for Environmental Prediction (NCEP) wind data [9]. For the evaluation of ISS-RapidScat wind data, three RapidScat along-track wind data (Level 2B) products during October 2014–March 2015, obtained from the Jet Propulsion Laboratory (JPL)/NASA and the Royal Netherlands Meteorological Institute (KNMI), were compared with NDBC buoy wind data by the spatial and temporal separations of 12.5 km and 10 min. The comparisons showed that the RMSs of ISS-RapidScat wind speed and direction were 0.96–1.16 m/s and 19.4°–25.6°, respectively [10]. Verhoef validated the EUMETSAT Ocean and Sea Ice Satellite Application Facility (OSI SAF) RapidScat 25 km and 50 km wind products on 25–26 January 2015 and from November 2014 to January 2015 by being compared with ECMWF and buoy wind data, respectively [11]. The ECMWF comparison results showed the remote sensing wind speed bias, u, and v standard deviations were 0.11 m/s, 1.29 m/s, and 1.25 m/s. The buoy comparison results showed that the remote sensing wind speed bias, u, and v standard deviations were 0.07 m/s, 1.61 m/s, and 1.72 m/s.
The non-sun-synchronous orbit of the ISS gives different overpass times for each day and ocean surface wind vectors for a given location at different times of the day can be obtained. This will help to better understand the diurnal wind cycle. The 12.5 km ocean surface wind vectors from October 2014 to August 2016 were developed by JPL. In this study, overall historical archived ISS-RapidScat ocean surface wind data from 3 October 2014 to 19 August 2016 are evaluated by the global distribution moored buoys and ASCAT employed in Metop-A and Metop-B satellite wind data. The accuracies of ISS-RapidScat wind vectors over different oceans and in the different range of wind speed are given in this paper. The data and methods used in this study are described in Section 2, the results of this study are presented and discussed in Section 3, and the main findings from this study are concluded in Section 4.
2. Data and Methods
2.1. Data
Three types of wind data are used in this study, which are briefly described below.
2.1.1. ISS-RapidScat Wind Vectors
To evaluate the data quality of ISS-RapidScat wind vectors, overall archived data of ISS-RapidScat wind vectors produced and distributed by JPL are used in this study. ISS-RapidScat wind vectors include two parts, which are the Level 2B 12.5 km version 1.1 ocean surface wind vectors from 3 October 2014 to 19 August 2015 and Level 2B 12.5 km version 1.2 ocean surface wind vectors from 20 August 2015 to 19 August 2016. The Level 2B wind vectors are binned on a 12.5 km wind vector cell (WVC) grid and processed using the Level 2A Sigma-0 dataset. The wind retrieval algorithm of the ISS-RapidScat is the same as that used to process the QuikSCAT version 3 wind product [12]. This wind retrieval processing is performed in three steps. First, a point-wise maximum likelihood estimate of the wind speed and direction is computed, resulting in multiple ambiguous solutions. Next, a median filter is used to select the best ambiguity. Finally, directional interval retrieval (DIR) processing is performed, which allows the retrieved wind direction to vary within a region of high likelihood about the selected ambiguity [13]. In addition, a neural network approach is implemented to correct rain-contaminated winds speed [14]. Quality control of RapidScat wind vectors is according to the data quality flag bits in the data files, which include a rain flag, a high wind speed flag, a low wind speed flag, an ice edge flag, a coastal flag, an available data flag, and so on [13]. Only the data which satisfies good data conditions are selected. The operating frequency of the ISS-RapidScat is the Ku-band and the swath width is 900–1100 km. ISS-RapidScat with a low inclination angle is not in a sun-synchronous orbit, which restricts the data spatial coverage to the tropics and mid-latitude regions, and the extent of latitudinal coverage stretches from approximately 56°N to 56°S. Furthermore, there is no consistent local time of day retrieval.
2.1.2. Wind Observations by Moored Buoys
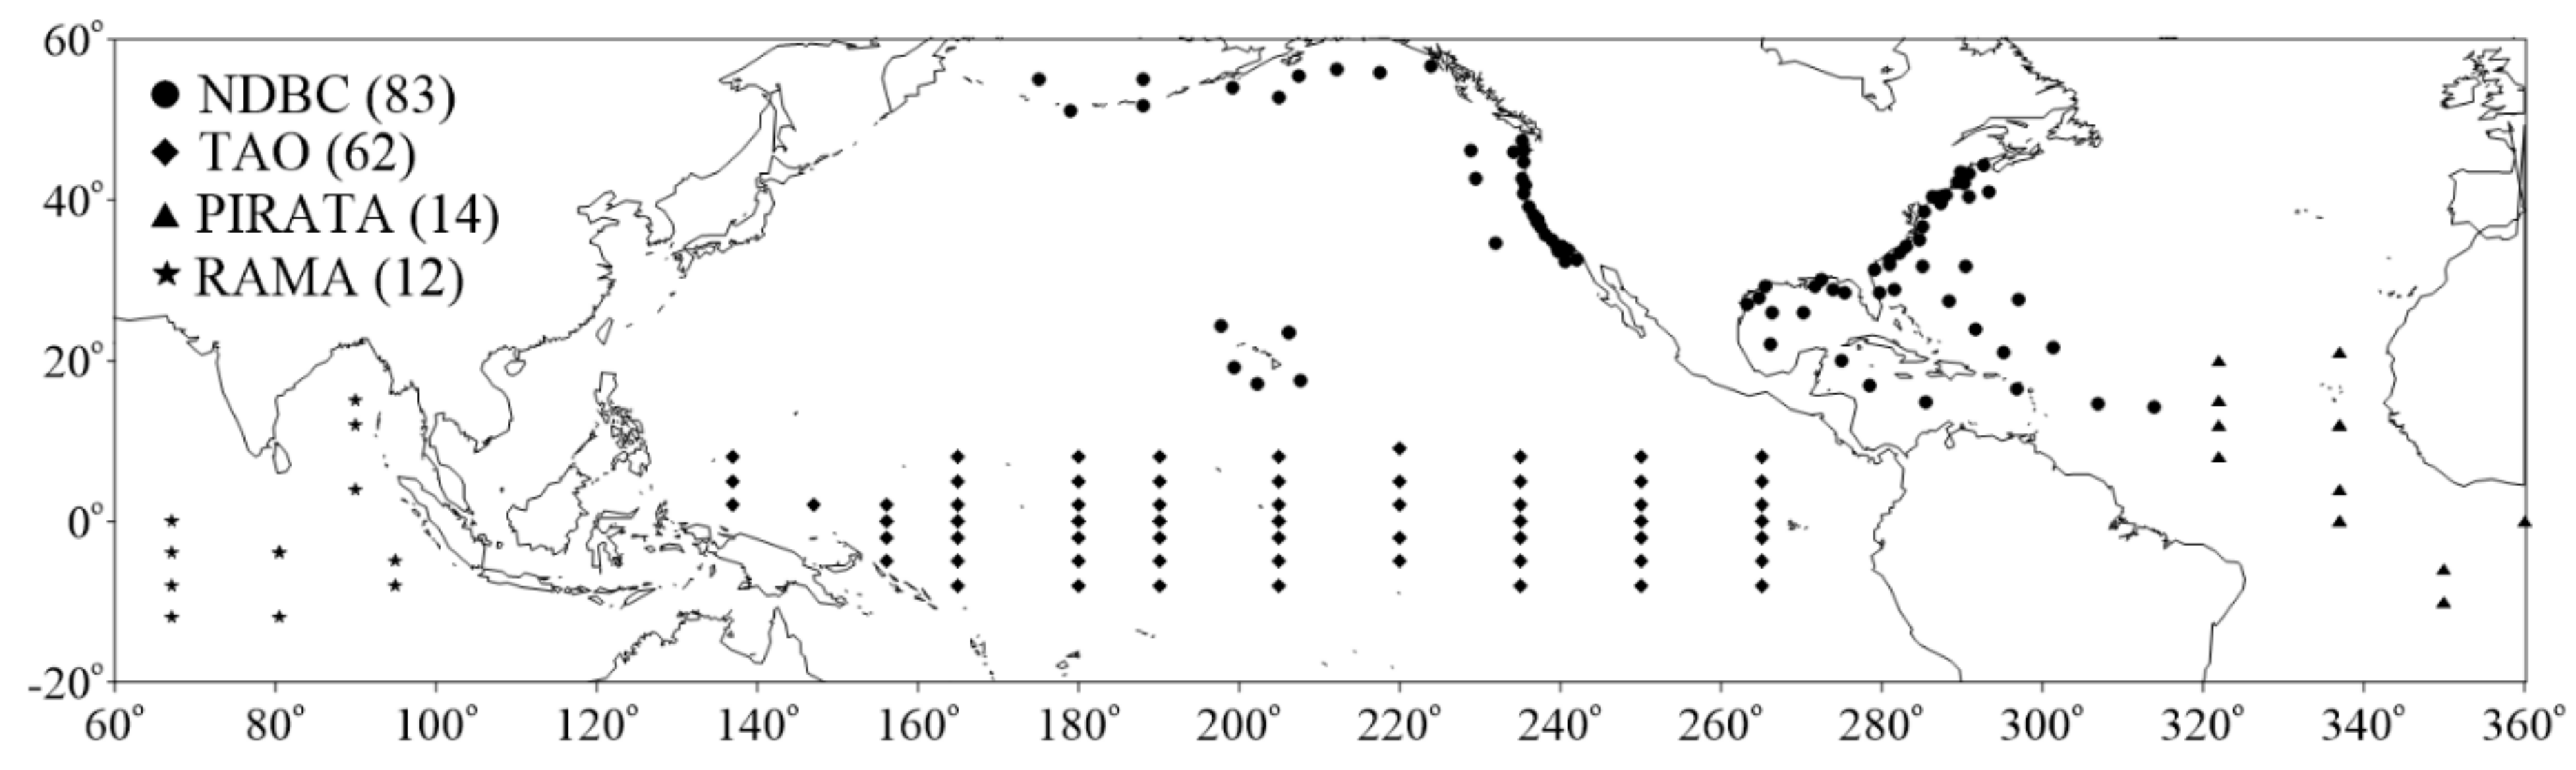
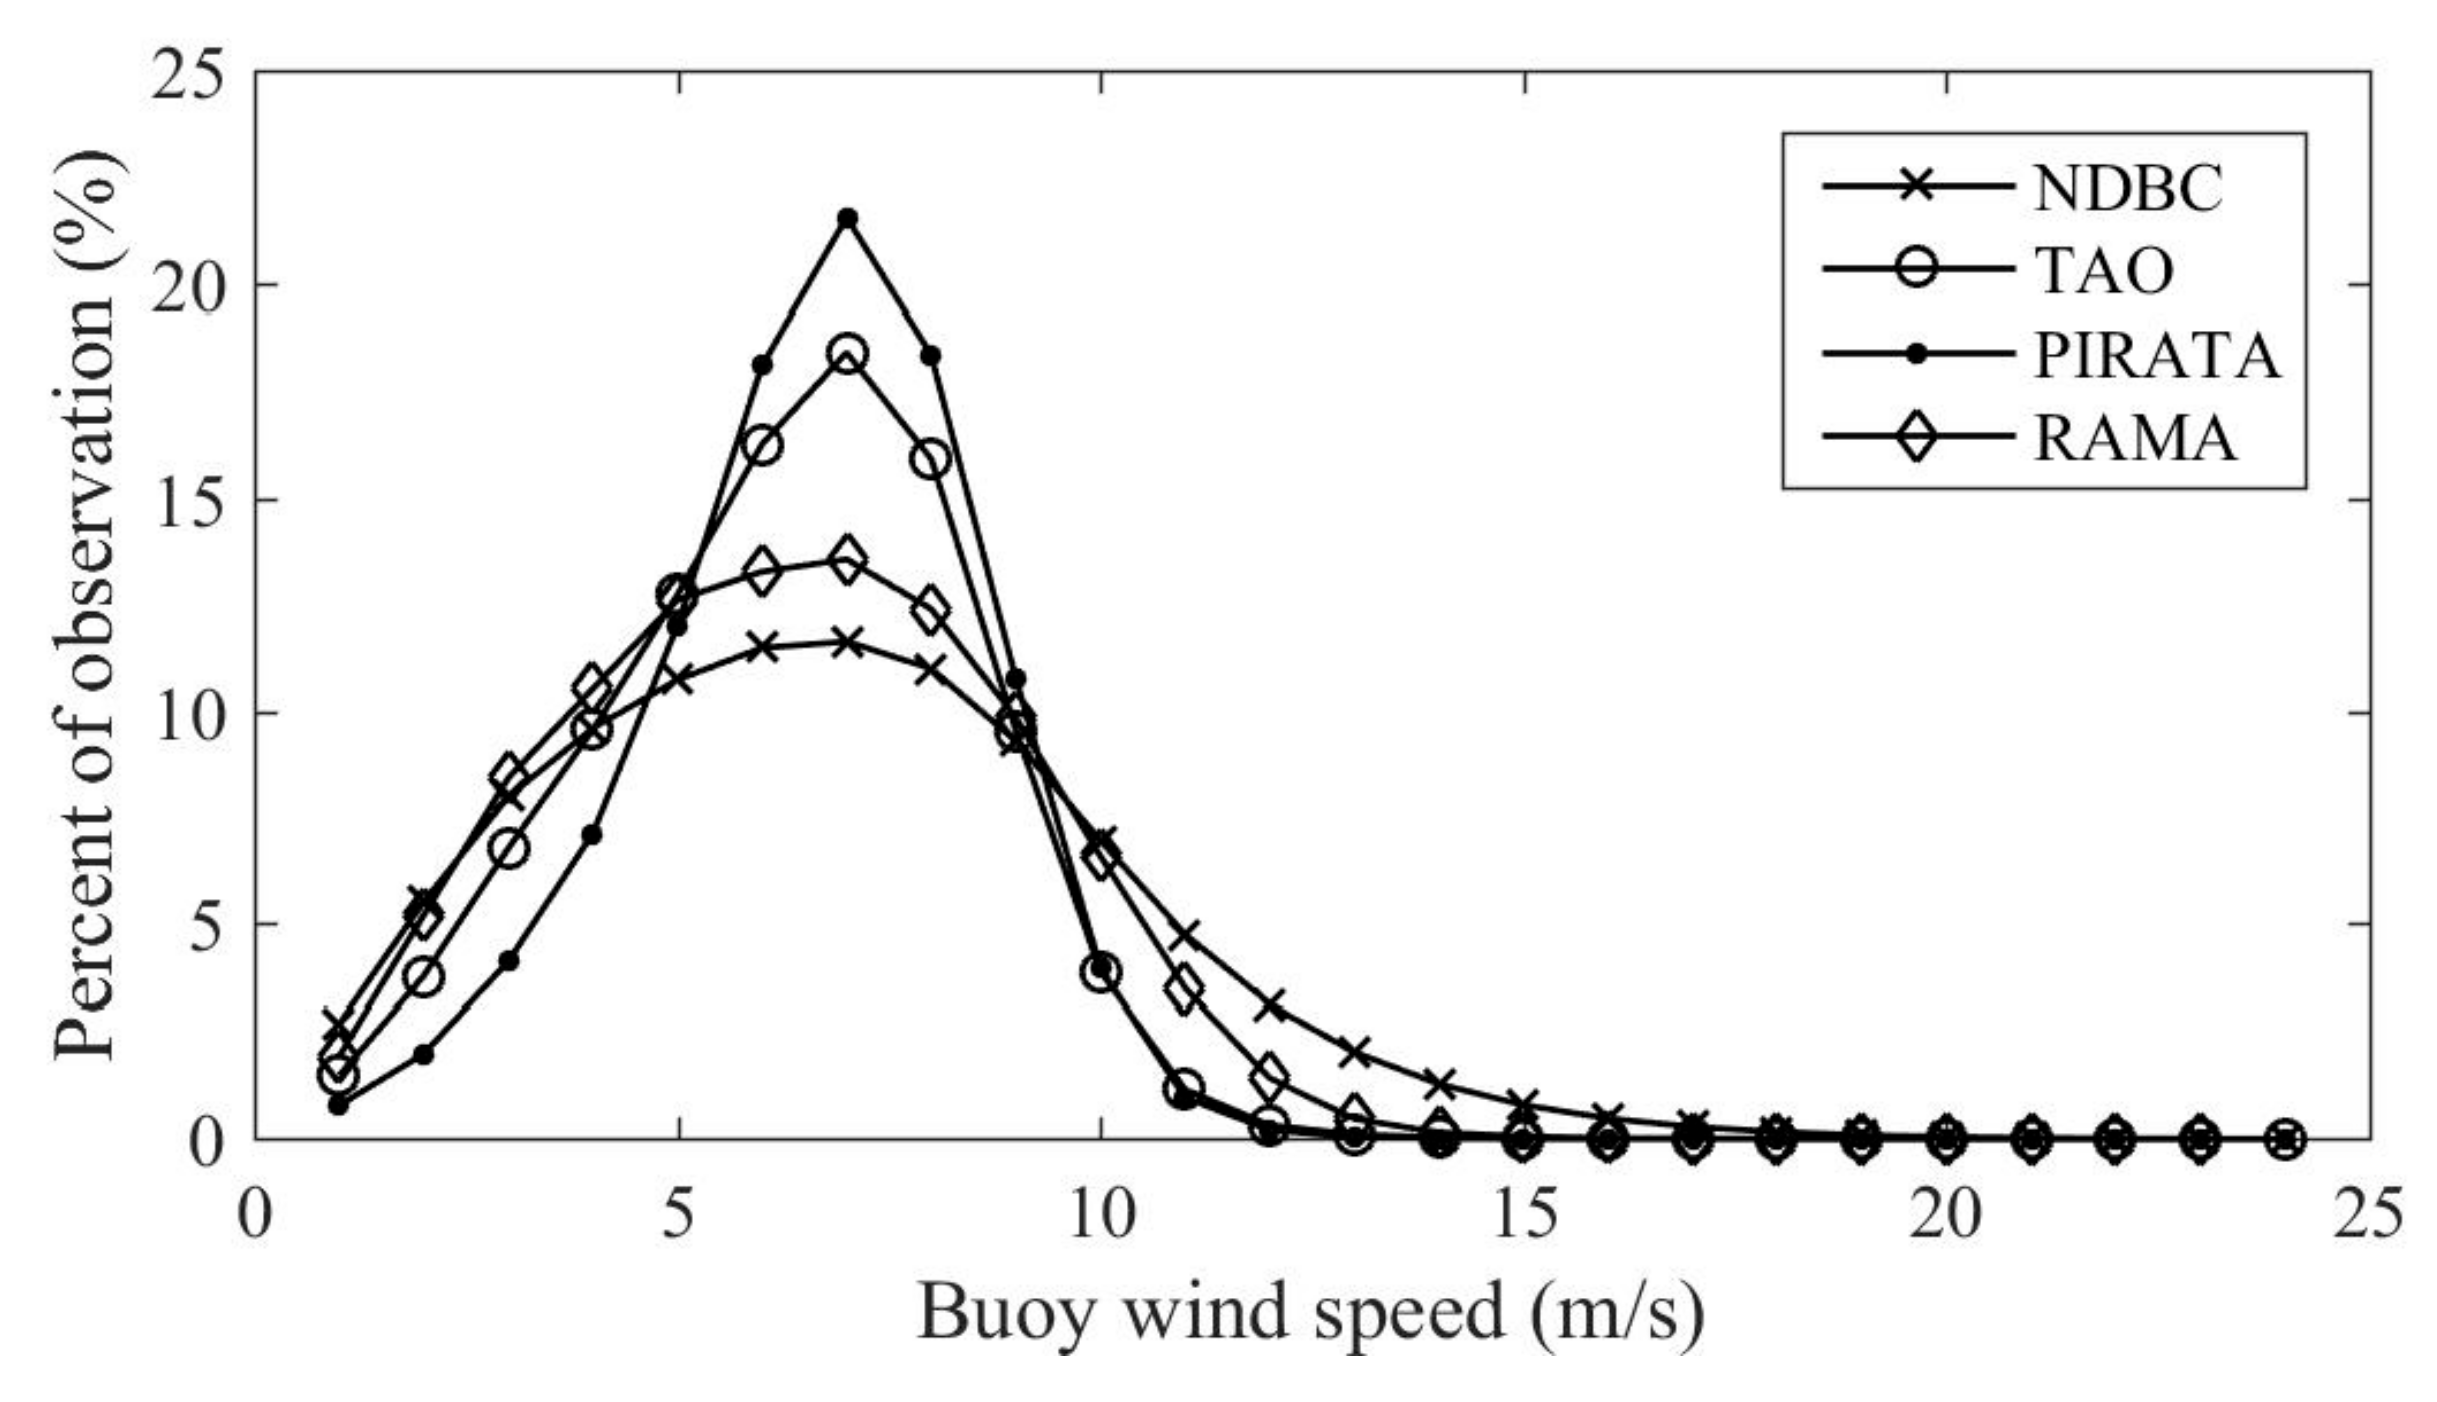
Wind observation data during the same period of ISS-RapidScat wind vectors obtained by 83 moored buoys from NDBC, 62 moored buoys from TAO/TRITON, 14 moored buoys from PIRATA, and 12 moored buoys from RAMA are used in this study. Buoy winds are looked as the true wind. Only buoys more than 50 km away from lands and islands are selected and buoy winds are regarded to be consistent in the area of ISS-RapidSCAT wind vector cells. The locations of these buoys are shown in Figure 1. The buoy winds are measured hourly by averaging the wind speed and direction over 10 min. Four sets of buoy winds are measured by different instruments with different accuracies at different heights from the ocean surface. The estimated accuracies of buoy wind speed and direction are 0.3 m/s and 2° [15]. The percentage of the number of observations by four sets of buoys is shown in Figure 2, and it can be seen that most buoy wind speeds are smaller than 12 m/s. In order to make the buoy data comparable with ISS-RapidScat, all of the buoy winds were converted to 10-m neutral winds using the LKB model [16,17,18]. For the quality control of buoy data, monthly time series are constructed and used to perform a basic quality check on the buoy data. This quality check procedure only keeps values within an acceptable physical range, and removes outliers by looking at the deviation from the mean of each monthly data record and from the deviation from one hourly value to the next [19].
2.1.3. The Advanced Scatterometer Wind Data
The Advanced Scatterometer on the MetOp-A and MetOp-B Level 25 km ocean surface wind vector products during the same period of ISS-RapidScat data are used in this study. These data were produced by KNMI in the Ocean and Sea Ice Satellite Application Facility European Organization for the Exploitation of Meteorological Satellites projects. The validation of ASCAT wind data showed that the wind speed bias was between −0.3 and 0.3 m/s at different times and the average standard deviation of zonal and meridional wind component of 25 km ASCAT winds versus buoy winds was less than 1.6 m/s [20]. The data quality control of ASCAT wind data is according to the variable ‘wvc_quality_flag’ in the NetCDF data files [21].
2.2. Methods
2.2.1. Data Collocation
ISS-RapidScat wind vectors were collocated with global moored buoy wind data and ASCAT wind data to evaluate data accuracy. The spatial resolution of ISS-RapidScat wind vectors is 12.5 km, and the time interval of the NDBC, PIRATA, RAMA, and TAO buoy wind observations are 10 min. All of these moored buoys’ wind data are collocated to the nearest ISS-RapidScat wind vector cell of less than 12.5 km and time spans less than 10 min. There are 171 global moored buoys’ wind data used in the evaluation of ISS-RapidScat wind vectors.
ISS-RapidScat wind vectors are also collocated with ASCAT wind data to evaluate data accuracy during the whole data period of ISS-RapidScat wind data by a time span of less than 3 min and a distance of less than 12.5 km. Even if ASCAT has a consistent local observation time, because there is no consistent local time of day retrieval of ISS-RapidScat wind vectors, the collocated ISS-RapidScat and ASCAT wind vector cells are distributed on the global oceans as shown in the Figure 3. The number of collocated data pairs is 8,320,044.
2.2.2. Statistical Methods
Statistical parameters namely root mean square error (RMSE), Bias (mean of residuals) and correlation coefficient (R) are computed and presented to evaluate the accuracy of ISS-RapidScat wind vectors. These parameters are given by
In order to overcome the difficulty due to the discontinuity between 0° and 360°, statistical parameters of wind direction are modified as follows:
where spd and dir denote the wind speed and direction of the collocated data between RapidScat and buoys or ASCAT. The subscript SCAT represents ISS-RapidScat and the subscript 0 represents buoys or ASCAT. The ‘< >’ represents the statistical average [22].
3. Results and Discussions
3.1. Comparison with Moored Buoys
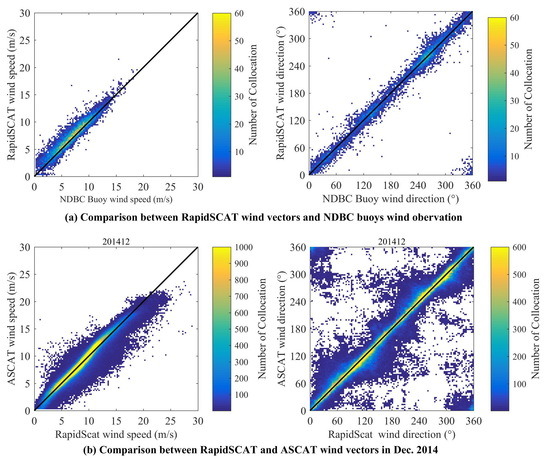
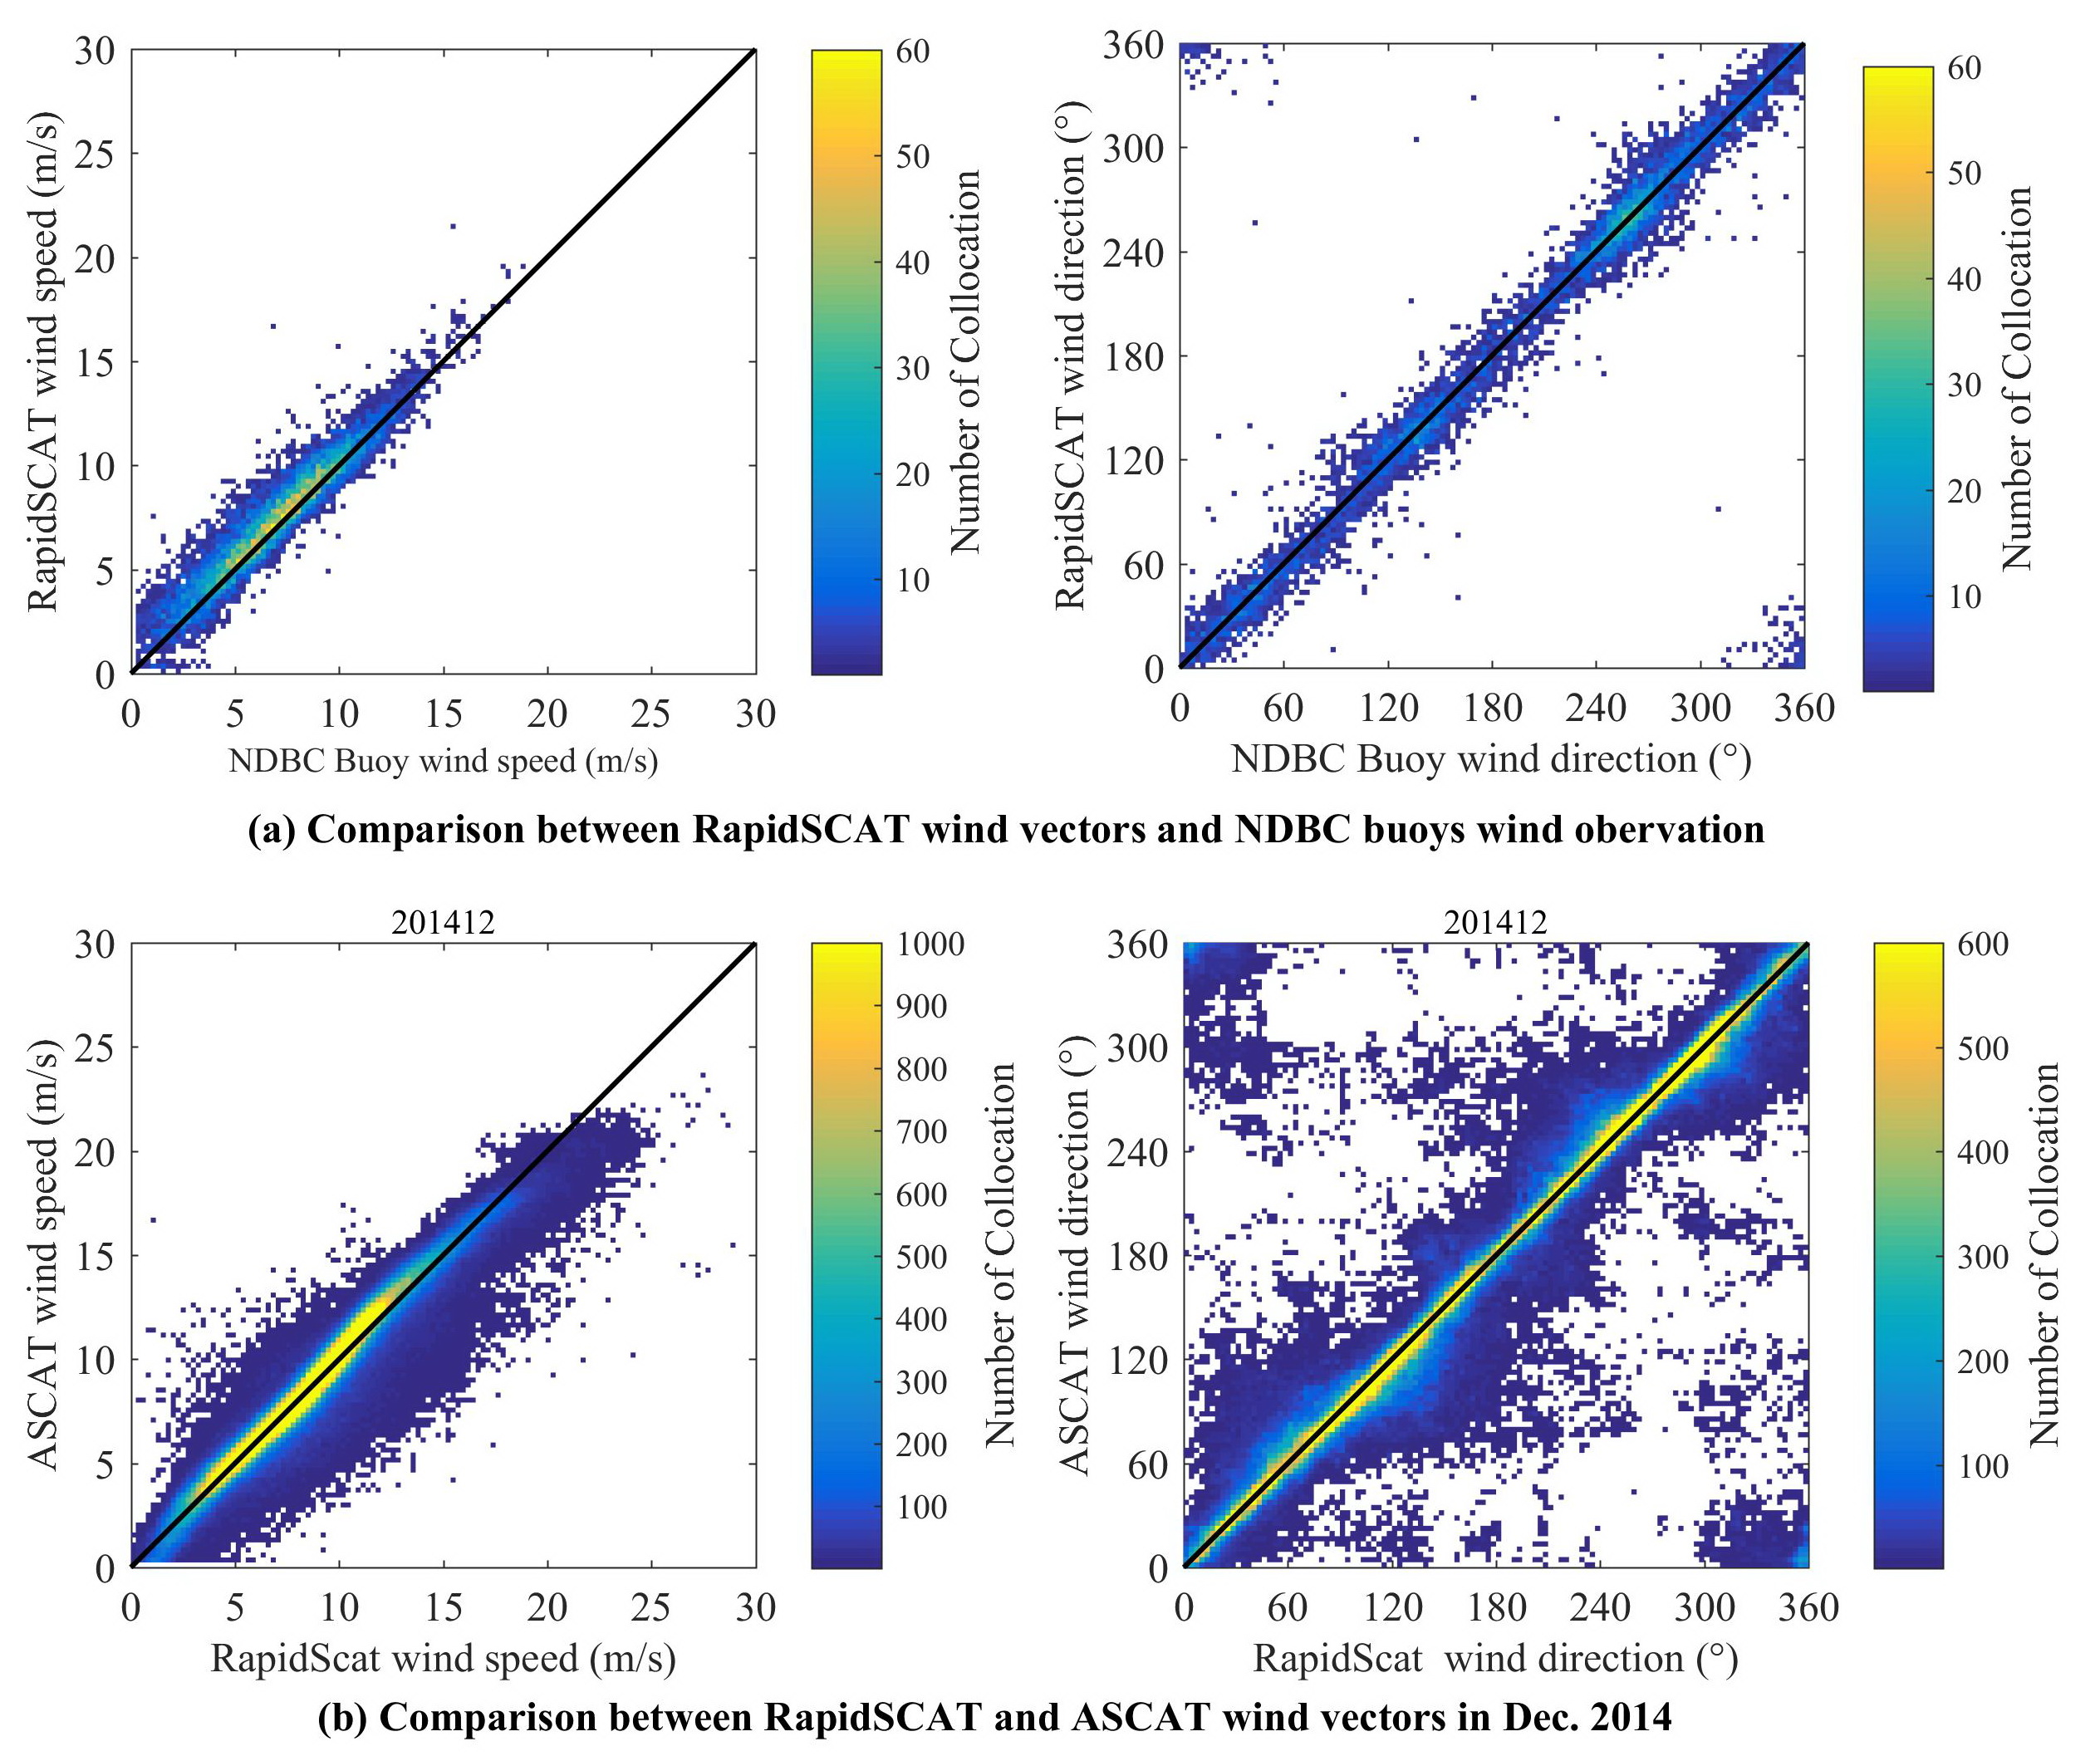
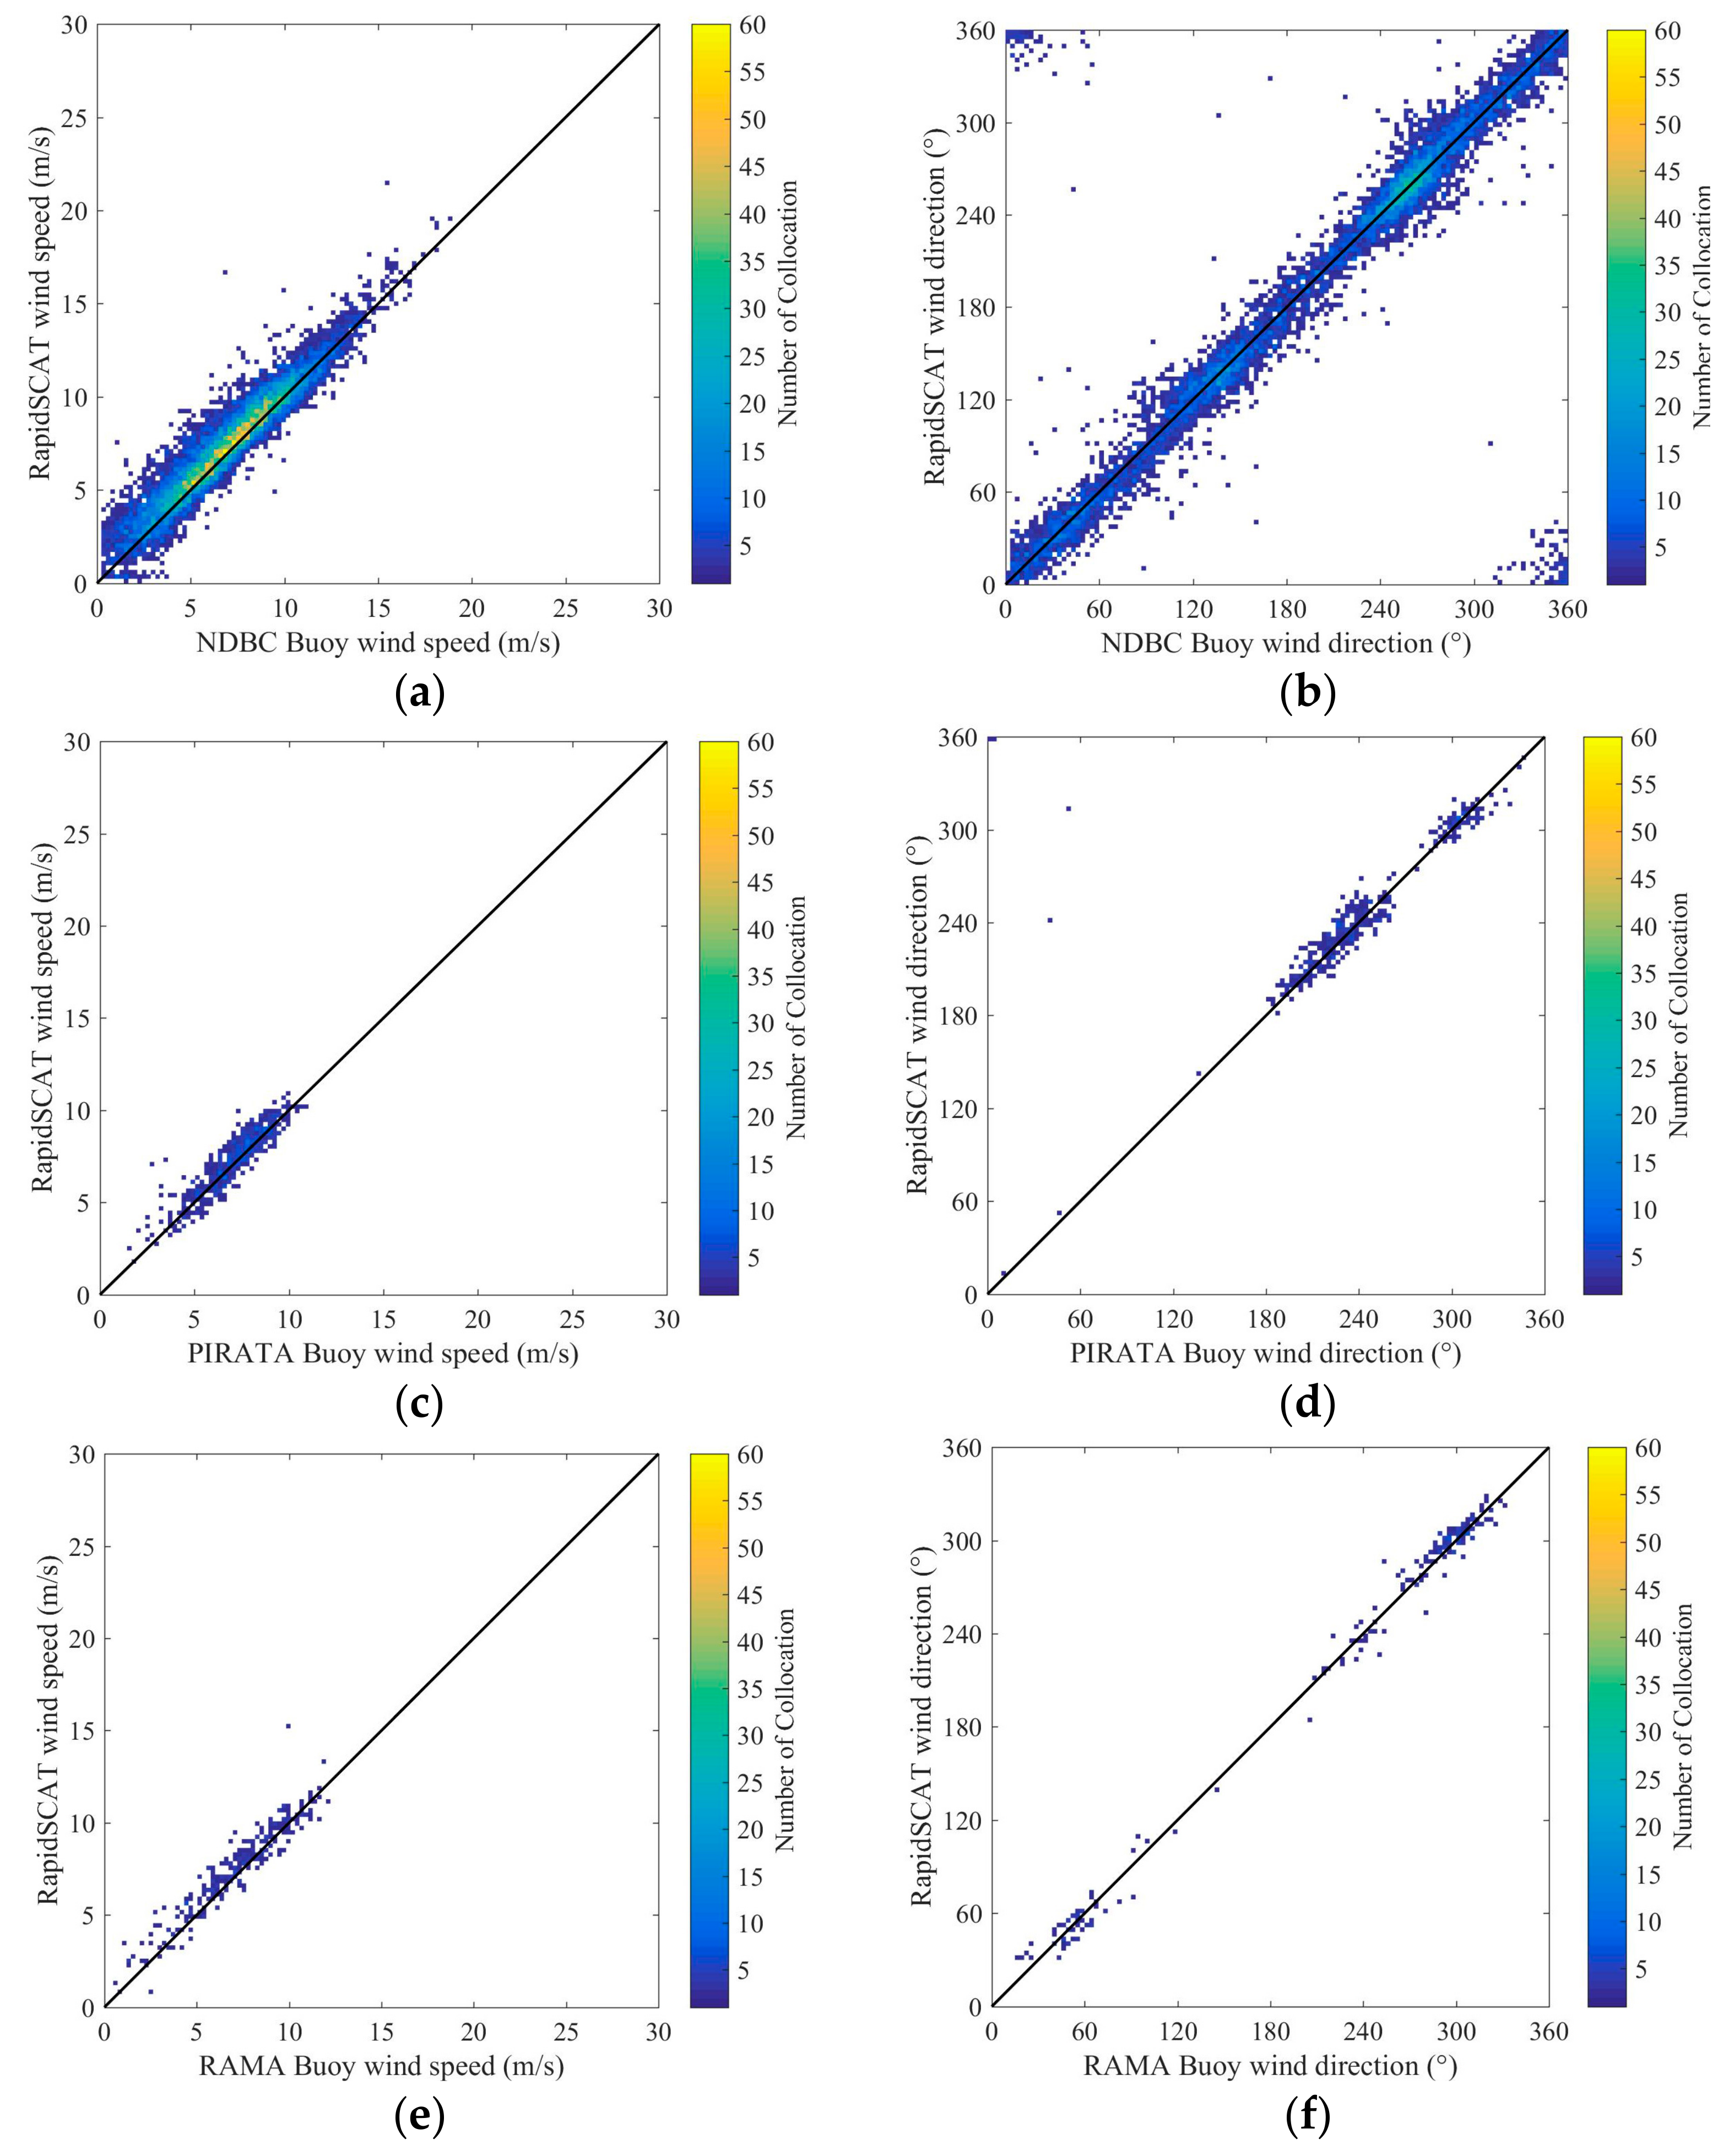
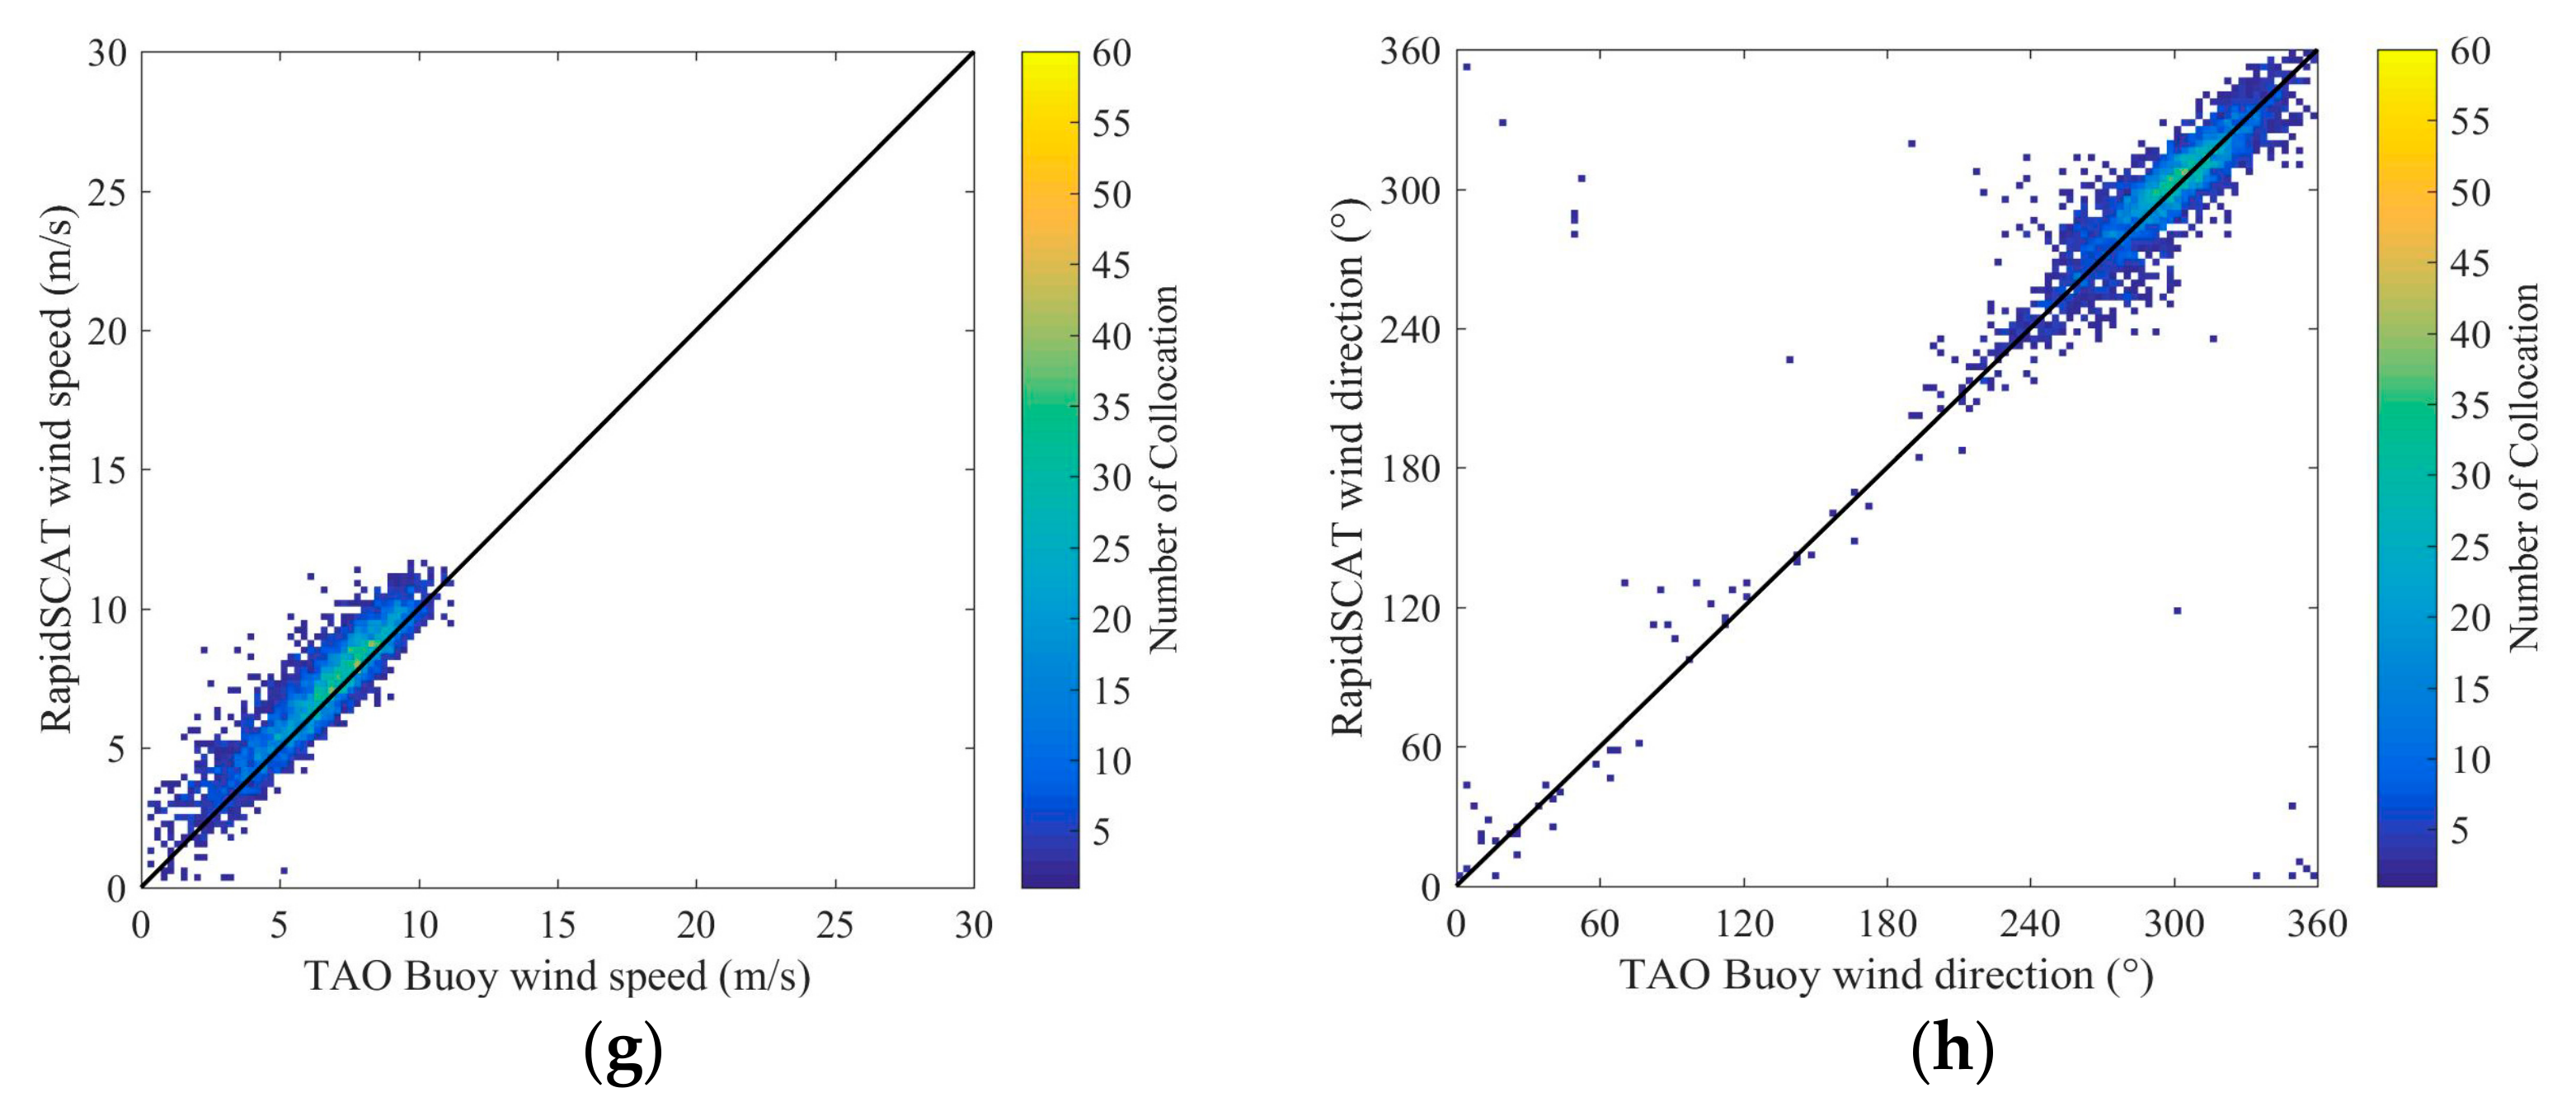
The overall historical archived ISS-RapidScat Level 2B 12.5 km ocean surface wind vectors during the period from 3 October 2014 to 19 August 2016 are compared with global moored buoys’ wind data. Data pairs totaling 12,578 from 83 NDBC buoys, 1092 from 14 PIRATA buoys, 899 from 12 RAMA buoys, and 5603 from 62 TAO buoys are collocated by the method introduced in Section 2. The scatter diagrams of comparisons of wind speed and direction are shown in Figure 4. In general, buoys’ wind speeds were overestimated slightly by RapidScat for all wind speed ranges. Their wind directions are consistent for all different directions.
The statistical parameters of errors between RapidScat and buoys are given in Table 2. The biases and RMSEs of RapidScat wind speeds compared with different buoys are between 0.38 and 0.68 m/s and 1.35 and 1.76 m/s, and the biases and RMSEs of RapidScat wind directions compared with different buoys are 0.31°–1.41° and 17.4°–19.8°. The overall average biases and RMSEs are 0.59 m/s and 1.42 m/s for wind speed, and 0.72° and 19.5° for wind direction, respectively. The correlation coefficients are also shown to be consistent between RapidScat wind vectors and buoy wind data.
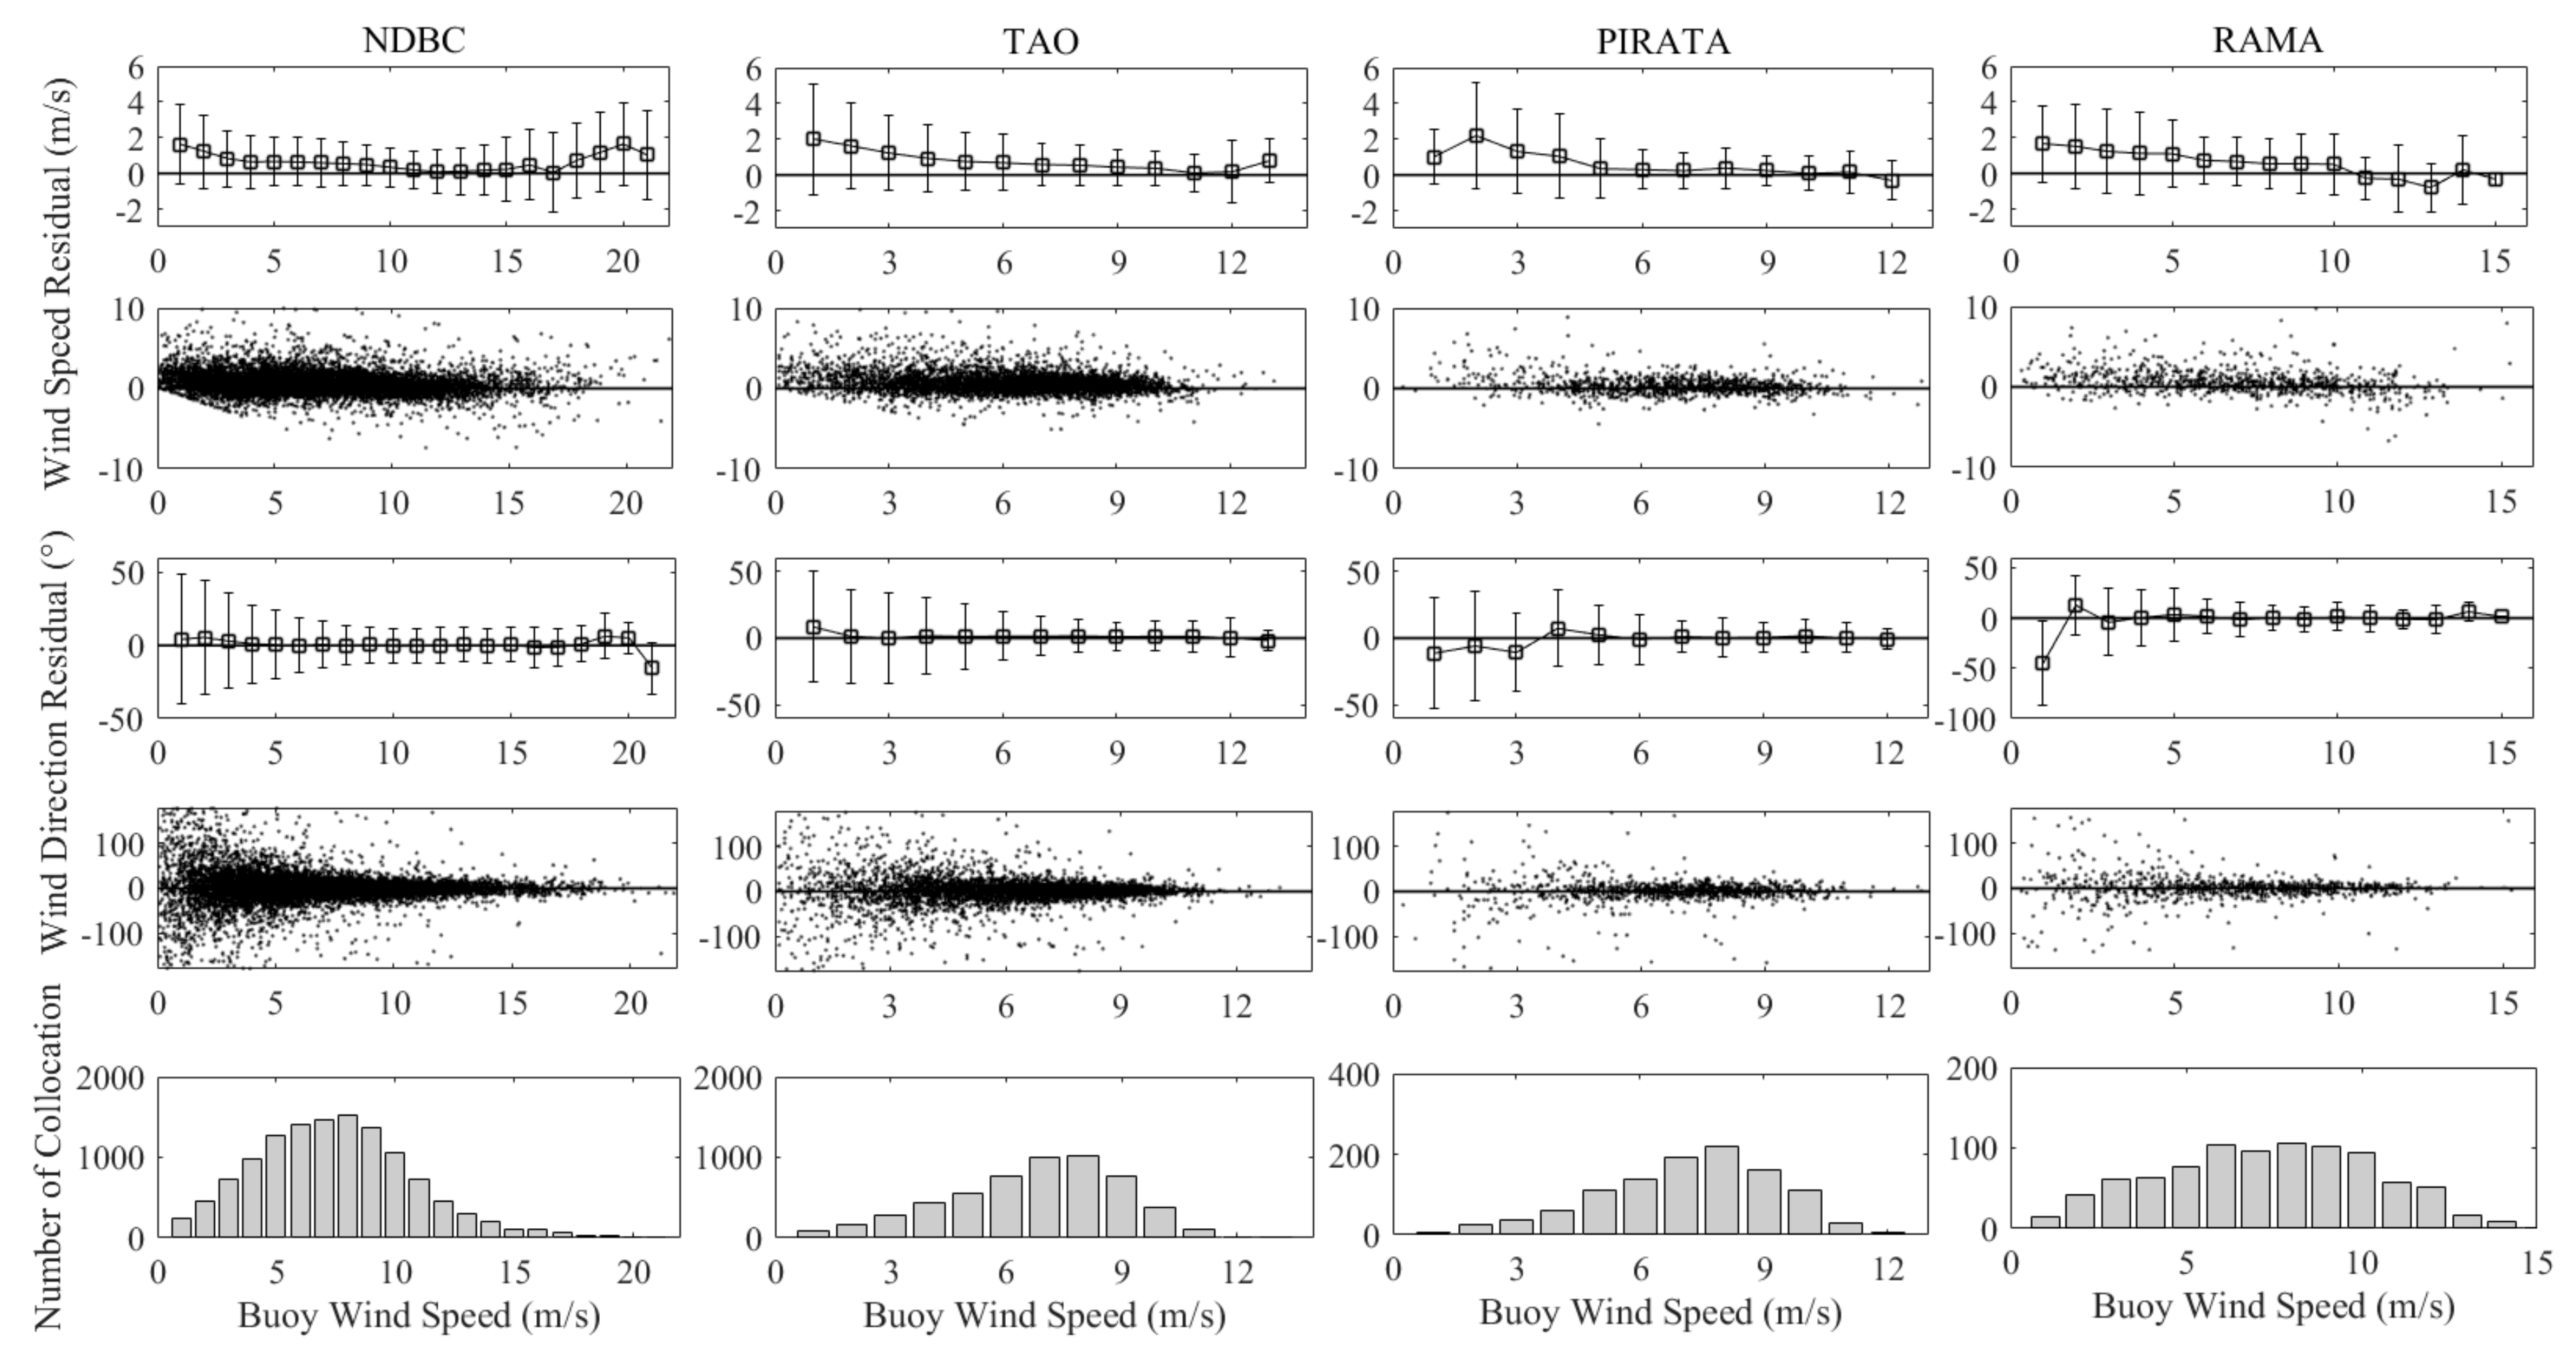
In order to analyze the errors of RapidScat wind vectors at different wind speeds, the biases and RMSEs between RapidScat and buoy wind data are calculated in bins of buoy wind speeds of 1 m/s, and the wind speed and direction residuals (RapidScat-buoy) are also analyzed in bins of buoy wind speeds of 1 m/s. The results are shown in Figure 5. The error bars indicate the bias and the RMSE.
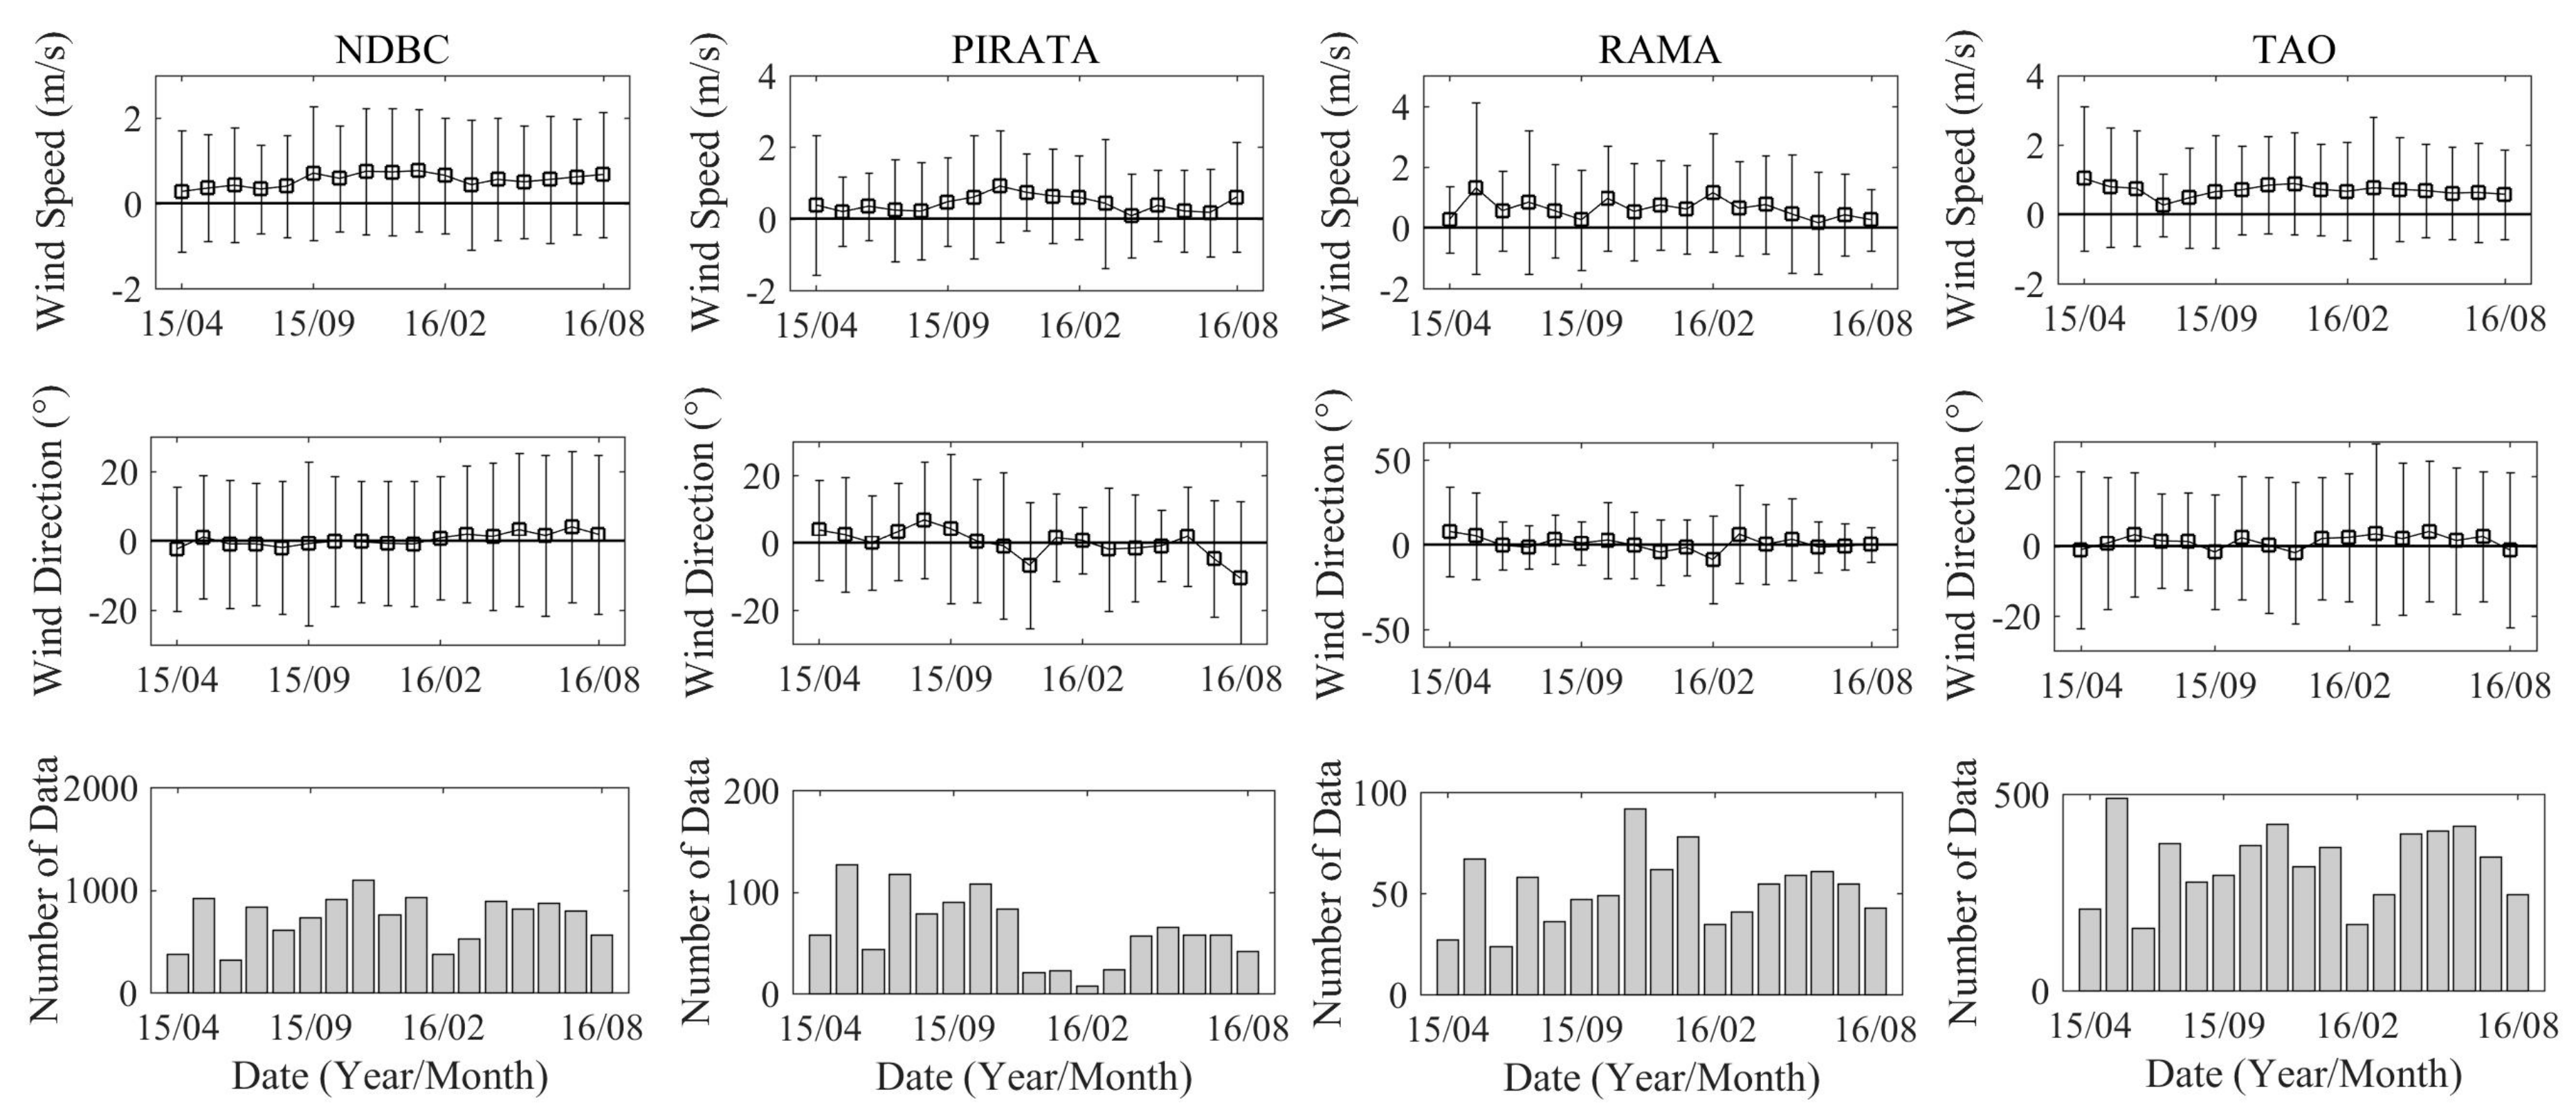
It is shown in Figure 5 that the wind speed residuals for four sets of buoys decrease with the increasing buoys wind speed and the biases of RapidScat wind speed are basically larger than 0. This also means that RapidScat overestimates the wind. The RMSEs of RapidScat wind speed decreases firstly when buoy wind speeds are less than 12–13 m/s, and then increases with the increasing buoy wind speed. The biases of the RapidScat wind direction are also close to 0 and there is the obvious trend that the RMSEs of the RapidScat wind direction decreases with the increasing buoy wind speed. The errors of the RapidScat wind vectors at different months from April 2015 to August 2016 are also analyzed, which are shown in Figure 6. The comparisons of RMSEs of the RapidScat wind speed and direction at different months show that there is no dependence on the time regarding the accuracy of the RapidScat wind vectors and the accuracies are consistent during the entire period. The biases of the RapidScat wind speed at different months shows that there is an annual periodic signal regarding the RapidSCAT wind speed errors, as shown in Figure 6, especially for NDBC and PIRATA buoys. The operating mechanism of a scatterometer makes the errors of the retrieved winds have no dependence on the time. The possible reasons for these results are the annual cycle variation of ocean winds causing the annual error variations of buoy wind observations. This means that the accuracy of in situ observations of ocean surface wind vectors depends on the magnitude of the wind speed. There is no same signal regarding the biases of the RapidScat wind direction because the accuracies of the wind direction depend mainly on the magnitude of the wind speed.
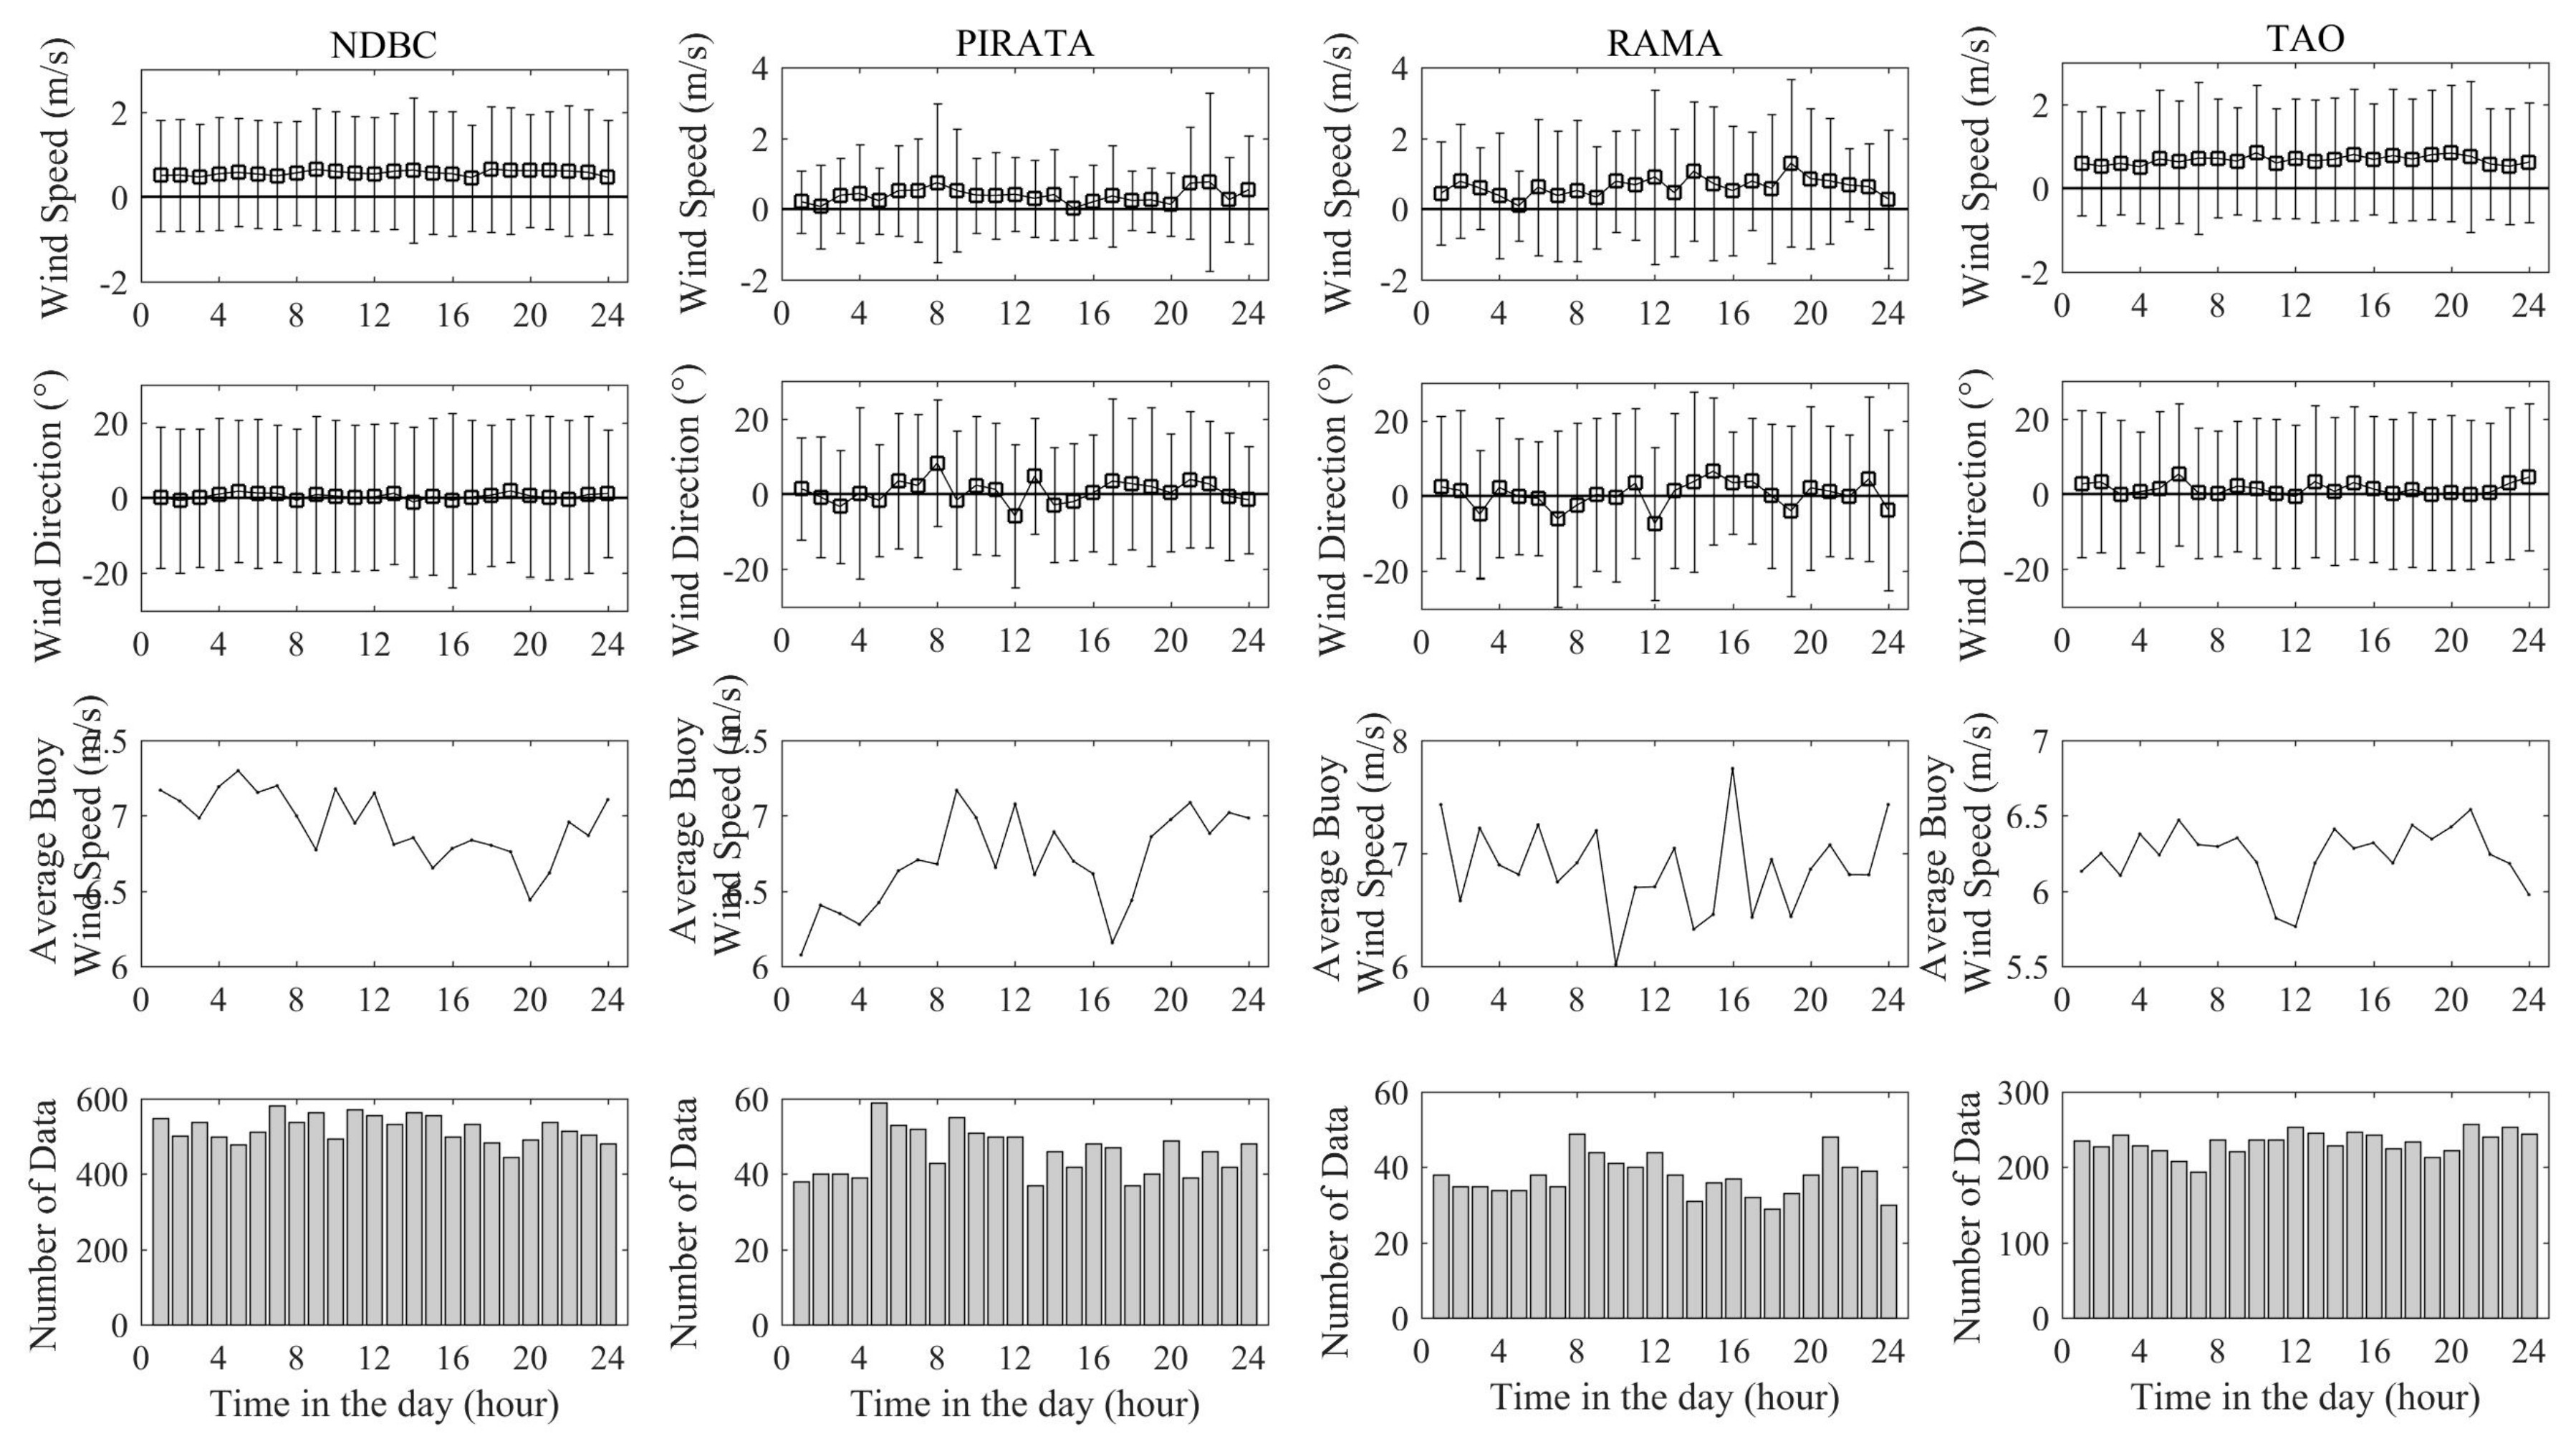
RapidScat can observe the same place at different times of the day, so the accuracies of RapidScat wind vectors at different times in one day are also analyzed, as shown in Figure 7, by counting the errors at the same time of different days. The comparisons of RapidScat ocean surface wind speed and direction errors at different times in a day for all buoys show that there is no obvious difference regarding the errors at different times of the day even if the average buoy wind speed at different times varied largely (shown in the third line of Figure 7), especially for the comparisons with the NDBC and TAO buoys. The analyses of less collocated data of the PIRATA and RAMA buoys show a slight fluctuation with no periodic and trend variability in the errors of wind speed and direction. Therefore, the accuracy of the RapidScat wind vectors at different times of the day is basically consistent and with no diurnal variation.
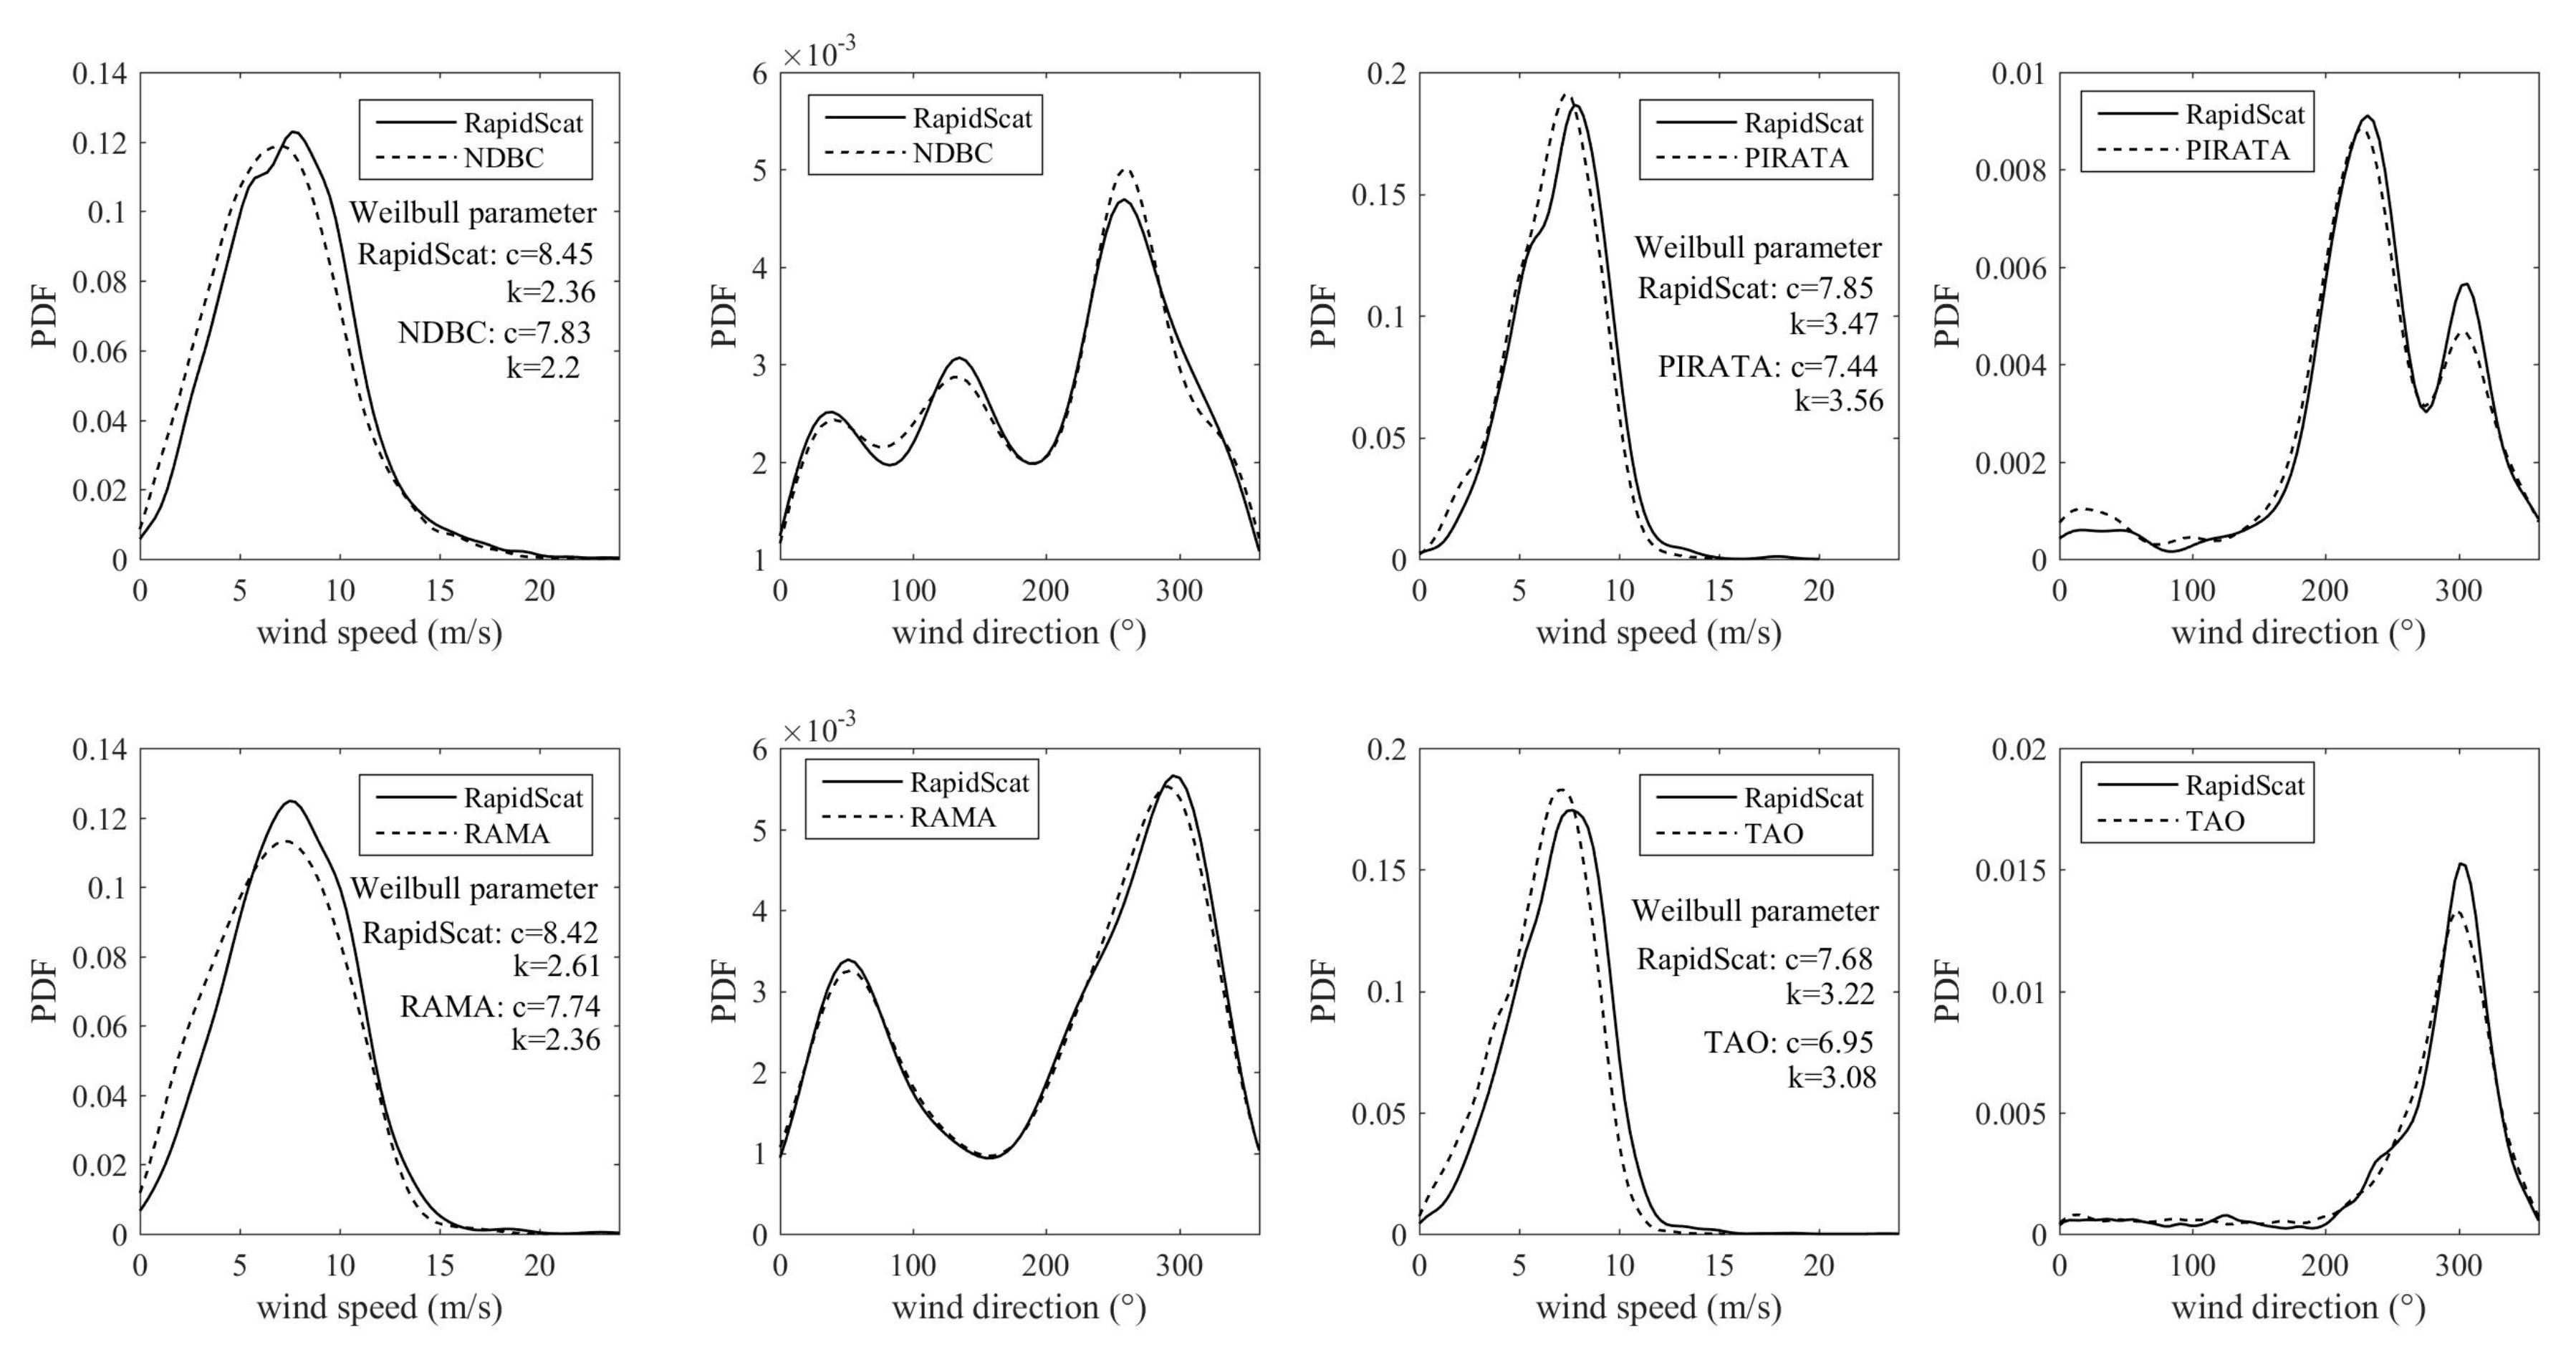
To understand the abundance of the collocated data for an entire possible range of ocean surface wind, probability distribution functions (PDFs) of the collocated data are plotted for wind speed and direction as shown in Figure 8, and the Weibull parameters of wind speed [23] in the distributions of the collocated data are also given in Figure 8. The distribution behavior of PDFs of RapidScat and buoys for wind speed and direction imply the similar characteristics of RapidScat wind vectors and buoy observations. The wind speed histograms of RapidScat and buoys at speeds less than 15 m/s have a slight offset, which indicates that the RapidScat wind speed is slightly larger than the buoy wind speed; that is, RapidScat overestimates the buoy wind. This has been proven in the above analysis. The Weibull shape parameters of four sets of buoys and RapidScat wind speeds are similar and this shows the consistency of the collocated data. The differences of the Weibull scale parameters show that RapidScat overestimates buoy wind speeds.
3.2. Comparison with Advanced Scatterometer Wind Vectors
Although buoy wind data are the most commonly used data to evaluate scatterometer wind vectors, the spatial distribution of buoys on the global oceans is sparse and spatially irregular, especially for the high-latitude areas. In order to evaluate RapidScat wind vectors on the global oceans with no buoy wind observations, they are compared with ASCAT wind vectors in the same period. The collocated data pairs of RapidScat and ASCAT wind vectors by the method introduced in Section 2 are more than 8 million and they are distribute all over the global oceans between 56°N and 56°S, as shown in Figure 3.
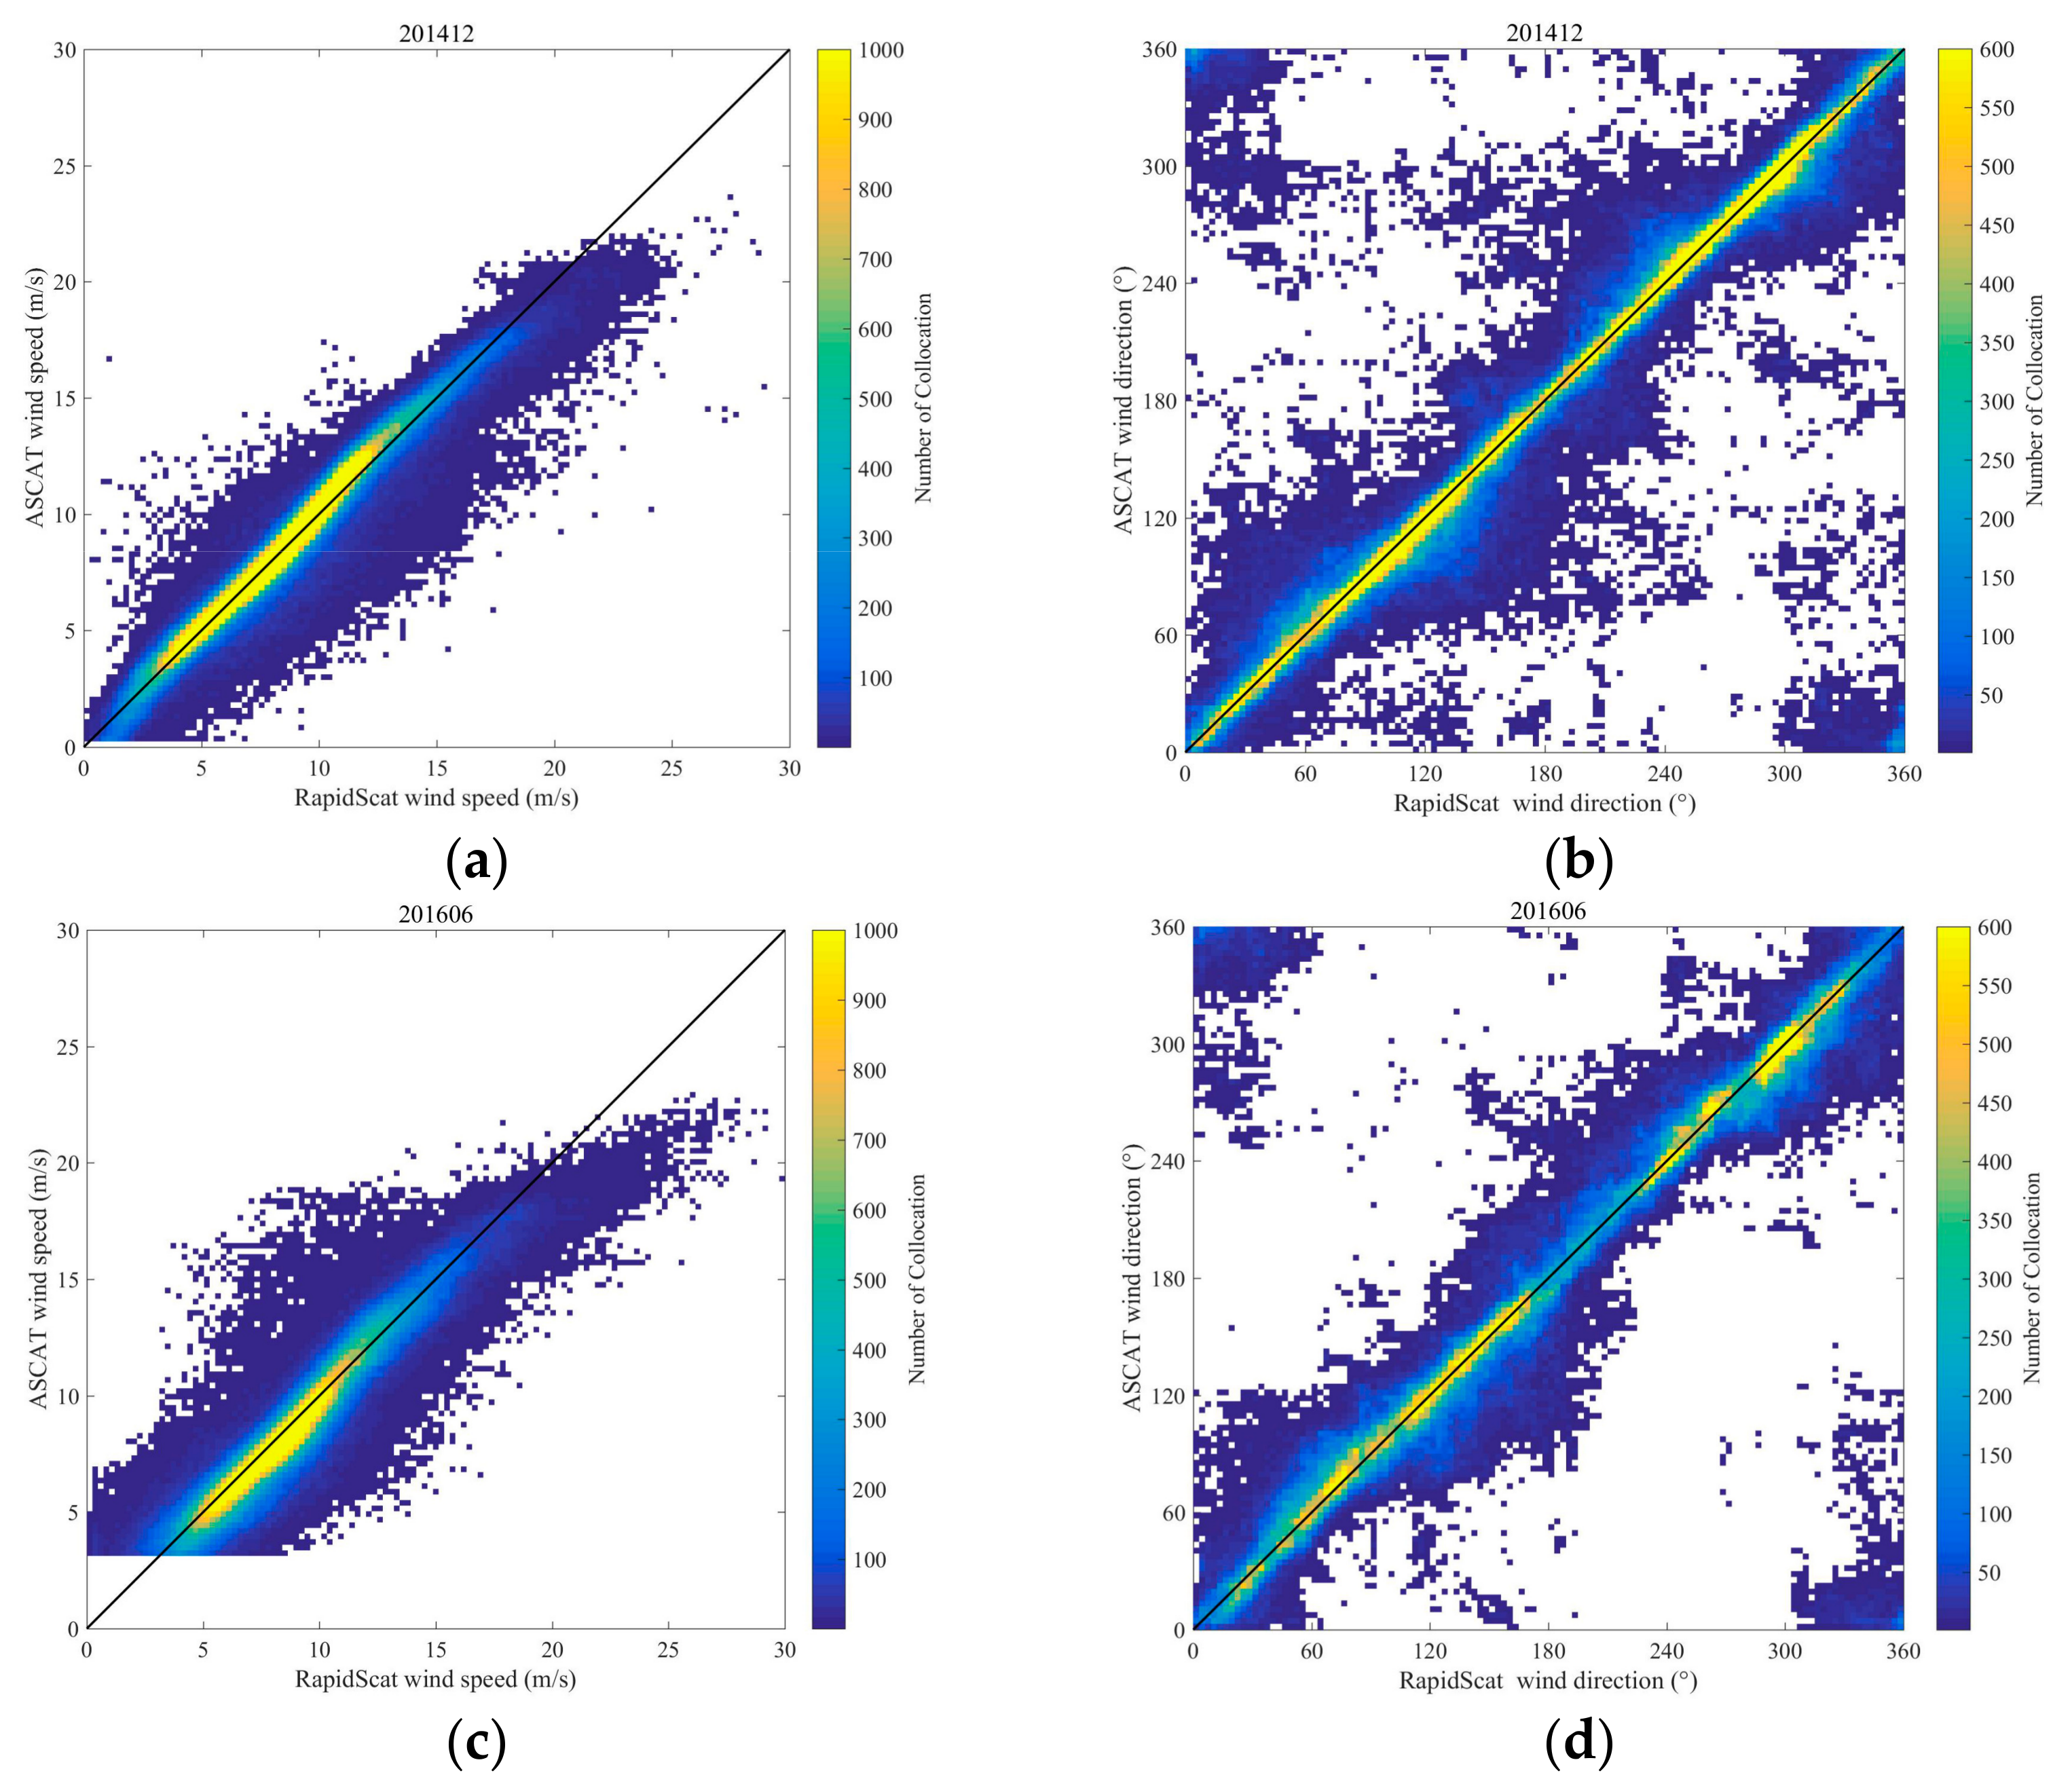
The differences (RapidScat-ASCAT) are analyzed through the statistical parameters, including bias, RMSE, and R, introduced in Section 2 at the different months from October 2014 to August 2016, respectively. The scatterplots of comparisons in typical months, including December 2014 of the minimal wind speed RMSE, and June 2016 of the maximal wind speed RMSE, are shown in Figure 9. The ASCAT wind data less than 3 m/s during June 2016 are absent in the original data. RapidScat wind vectors feature the wind speed being larger than that of ASCAT when it is more than 15 m/s, and the possible reason is that their working microwave frequencies are different and their response to the high wind speeds are different. Scatterplots of wind direction show that there is a clear oscillation of wind direction differences and the existence of wind direction 180° ambiguities. The possible reason is that there may be systematic biases for some wind directions and not for others. The differences in different months are given in Table 3. The bias and RMSE of wind speed are between −0.02 and 0.55 m/s and 0.95 and 1.31 m/s, and those of wind direction are −1.85°–0.87° and 13.62°–17.31°. These indicate the consistency of RapidScat and ASCAT wind vectors, and they have the same accuracies of wind vectors.
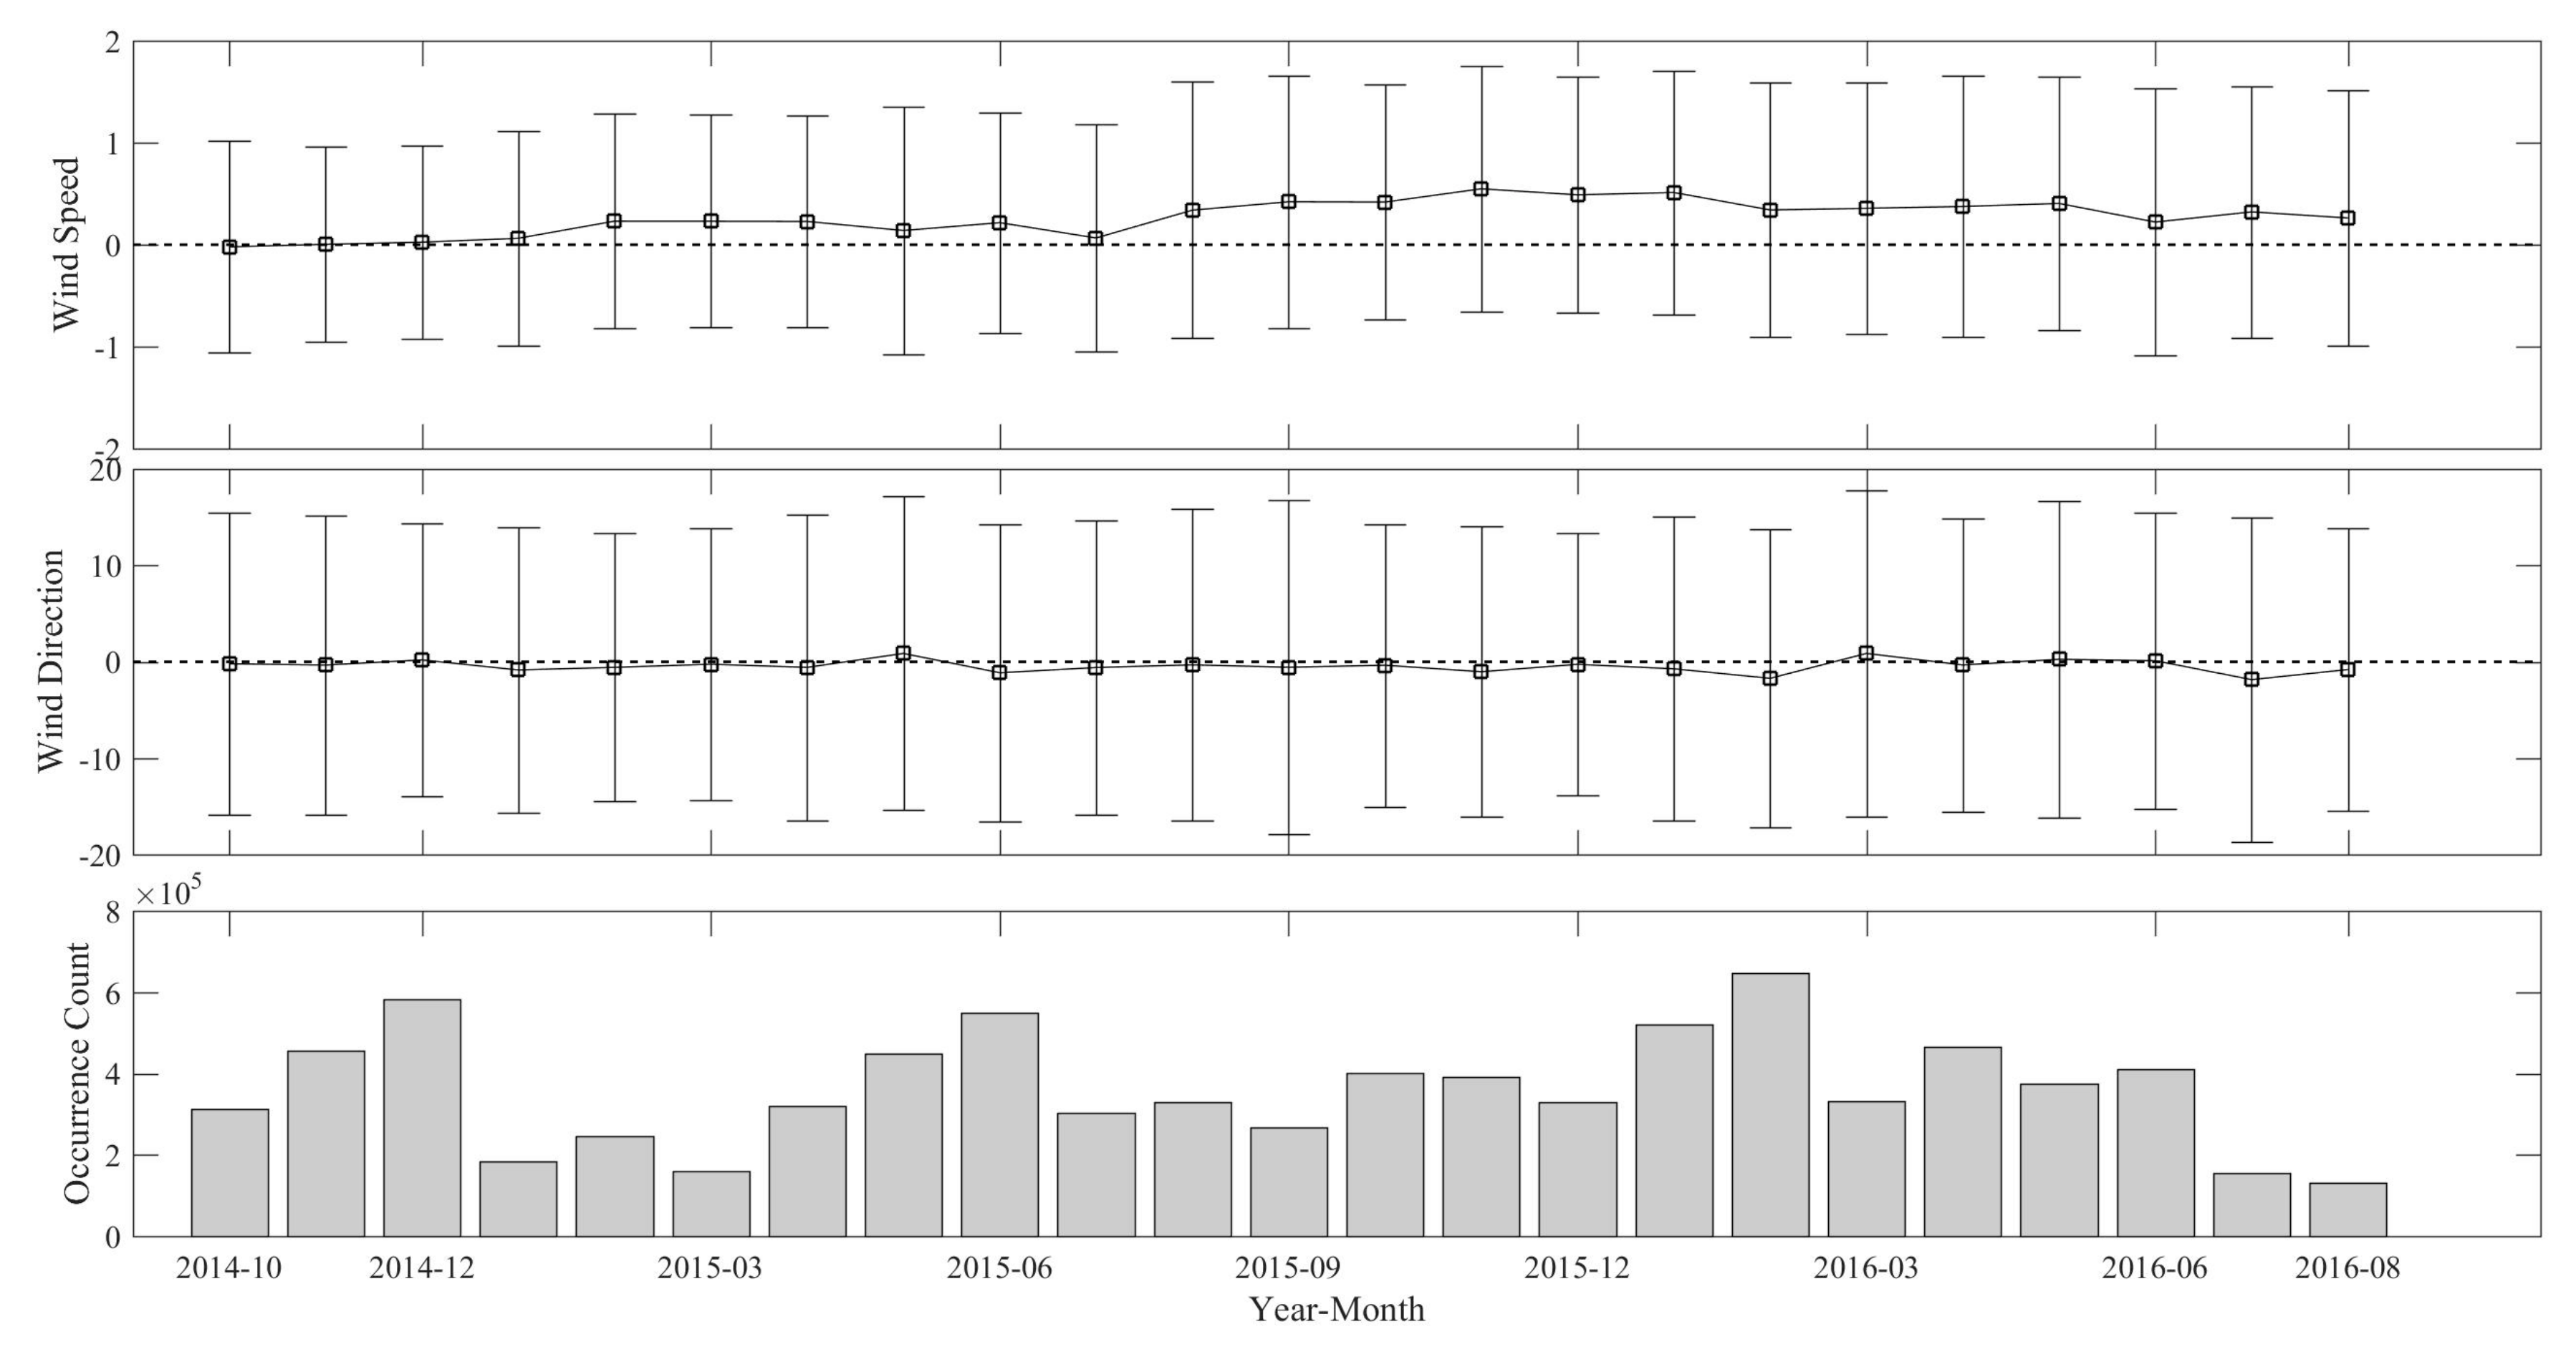
The statistical parameters of differences between RapidScat and ASCAT wind vectors at different months are shown in Figure 10. It is shown that RapidScat wind speed is slightly larger than that of ASCAT. However, RapidScat wind vectors are consistent with ASCAT at different times and there is no dependence of differences on the time at different months. This means that the RapidScat wind vectors have consistent accuracy with ASCAT wind vectors and they remain stable.
4. Conclusions
This study comprehensively evaluates the overall historical archived ISS-RapidScat wind vectors from 3 October to 19 August 2016 by comparing with global moored buoys (in the wind speed range of 0–24 m/s) and MetOp-A/B ASCAT wind data (in the wind speed range of 0–30 m/s). A totoal of 171 global moored buoys’ wind data, including NDBC, TAO, PIRATA, and RAMA buoys, in which the wind speed range is mainly in the range of 0–12 m/s are used for the evaluation of the ISS-RapidScat wind vectors and more than 20,000 data pairs are collocated within the spatial and temporal scales of 12.5 km and 10 min. The results show that the overall average biases and RMSEs of wind speed are 0.59 m/s and 1.42 m/s, and those of wind direction are 0.72° and 19.5°. Its accuracy is roughly equal to that of QuikSCAT (1.01 m/s and 23°) [6] and ASCAT (1.72 m/s and 18°) [7]. This indicates that the consistency between RapidScat wind vectors and buoy wind data, except RapidScat, overestimates the buoys’ wind measurements slightly. The analyses of ISS-RapidScat wind vector errors in the different buoys’ wind speeds show that the errors of the RapidScat wind speed begins to reduce firstly, and then increase with the increasing buoy wind speed, and the errors of the RapidScat wind direction decreases with the increasing buoy wind speed. The comparison of errors of the RapidScat wind speed and direction at different months show that there is no dependence on the time regarding the accuracy of the RapidScat wind vectors. The biases of the RapidScat wind speed and direction at different months show that there is an annual periodic signal of wind speed errors, and there is no same signal regarding the RapidScat wind direction because the accuracies of the wind direction depend mainly on the magnitude of the wind speed. In addition, the accuracies of the RapidScat wind vectors at different times in one day are analyzed and the results show that the accuracies of the RapidScat wind vectors at different times of the day are basically consistent and with no diurnal variation.
For the evaluation of the ISS-RapidScat wind vectors on the global oceans, the differences (RapidScat-ASCAT) are analyzed at the different months from October 2014 to August 2016, and the wind speed range is mainly in the range of 3–20 m/s. More than 8 million data pairs of RapidScat and ASCAT wind data are collocated. The results show that the all-over average bias and RMSE of wind speed and direction difference are between 0.27 m/s and 1.15 m/s, and −0.42° and 15.21°, respectively. This indicates that the consistency of RapidScat and ASCAT wind vectors, and that the RapidScat wind vectors have a consistent accuracy with ASCAT wind vectors, except that RapidScat overestimates the ASCAT wind slightly when the wind speeds are larger than 20 m/s.
In general, the accuracies of the ISS-RapidScat wind vectors satisfy the general scatterometer mission requirements and are consistent with ASCAT wind data. This shows that the RapidScat wind vectors have enough accuracy to be used in the oceanic numerical forecast and in the global change study by the combination with other scatterometer data.
Acknowledgments
This study is supported by National Key R and D Program of China (2016YFA0600102), the National Natural Science Foundation of China (41576176), and the Chinese Polar Environment Comprehensive Investigation and Assessment Programs (CHINARE2017-02-04). The authors would like to thank the JPL’s Physical Oceanography Distributed Active Data Center (PO. DAAC) of NASA for the distribution of the RapidScat data, KNMI for the distribution of ASCAT data, and the NOAA Pacific Marine Environmental Laboratory (PMEL) for NDBC, TAO, PIRATA, and RAMA buoy data.
Author Contributions
J.Y. and J.Z. conceived and designed the experiments; and J.Y. performed the experiments and analyzed the data.
Conflicts of Interest
The authors declare no conflict of interest.
References
- Ulaby, F.T.; Moore, R.K.; Fung, A.K. Microwave Remote Sensing: Active and Passive; Vol. 3: From Theory to Applications; Artech House: Norwood, MA, USA, 1986; pp. 1660–1685. [Google Scholar]
- Grantham, W.L.; Bracalente, E.; Jones, W.; Johnson, J. The Seasat-A satellite scatterometer. IEEE J. Ocean. Eng. 1977, 2, 200–206. [Google Scholar] [CrossRef]
- Durden, S.L.; Perkovic-Martin, D. The Rapidscat ocean winds scatterometer: A radar system engineering perspective. IEEE Geosci. Remote Sens. Mag. 2017, 5, 36–43. [Google Scholar] [CrossRef]
- Freilich, M.H.; Dunbar, R.S. The accuracy of the NSCAT 1 vector winds: Comparisons with National Data Buoy Center buoys. J. Geophys. Res. 1999, 104, 11231–11246. [Google Scholar] [CrossRef]
- Quilfen, Y.; Charpon, B.; Vandemark, D. The ERS scatterometer wind measurement Accuracy: Evidence of seasonal and regional biases. J. Atmos. Ocean. Technol. 2001, 18, 1684–1697. [Google Scholar] [CrossRef]
- Ebuchi, N.; Graber, H.C.; Caruso, M.J. Evaluation of Wind Vectors Observed by QuikSCAT/SeaWinds Using Ocean Buoy Data. J. Atmos. Ocean. Technol. 2002, 19, 2049–2062. [Google Scholar] [CrossRef]
- Bentamy, A.; Croize-fillon, D.; Perigaud, C. Characterization of ASCAT measurements based on buoy and QuikSCAT wind vector observations. Ocean Sci. 2008, 4, 265–274. [Google Scholar] [CrossRef]
- Sudha, A.K.; Prasada Rao, C.V.K. Comparison of Oceansat-2 scatterometer winds with buoy observations over the Indian Ocean and the Pacific Ocean. Remote Sens. Lett. 2013, 4, 171–179. [Google Scholar] [CrossRef]
- Wang, H.; Zhu, J.H.; Lin, M.S.; Huang, X.Q.; Zhao, Y.L.; Chen, C.T.; Zhang, Y.G.; Peng, H.L. First six months quality assessment of HY-2A SCAT wind products using in situ measurements. Acta Oceanol. Sin. 2013, 32, 27–33. [Google Scholar] [CrossRef]
- Ebuchi, N. Evaluation of marine vector winds observed by RapidScat on the international space station using statistical distribution. In Proceedings of the 2015 IEEE International Geoscience and Remote Sensing Symposium (IGARSS), Milan, Italy, 26–31 July 2015; pp. 4901–4904. [Google Scholar]
- Verhoef, A.; Vogelzang, J.; Stoffelen, A. RapidScat Wind Validation Report; Ocean and Sea Ice SAF Technical Note, SAF/OSI/CDOP2/KNMI/TEC/MA/228; OSI SAF Tech.: De Bilt, The Netherlands, 2015. [Google Scholar]
- Fore, A.G.; Stiles, B.W.; Chau, A.H.; Williams, B.A.; Dunbar, R.S.; Rodriguez, E. Point-wise Wind Retrieval and Ambiguity Removal Improvements for the QuikSCAT Climatological Data Set. IEEE Trans. Geosci. Remote Sens. 2013, 52, 51–59. [Google Scholar] [CrossRef]
- Physical Oceanography Distributed Active Archive Center (PO.DAAC). Jet Propulsion Laboratory. RapidScat Level 2B NetCDF Guide Document. Document Clearance Number: CL#16-1418. March 2016. Available online: ftp://podaac.jpl.nasa.gov/allData/rapidscat/retired/L2B12/docs/rscat_l2b_user_guide_v1.pdf (accessed on 19 April 2018).
- Stiles, B.W.; Dunbar, R.S. A Neural Network Technique for Improving the Accuracy of Scatterometer Winds in Rainy Conditions. IEEE Trans. Geosci. Remote Sens. 2010, 48, 3114–3122. [Google Scholar] [CrossRef]
- Mcphaden, M.J.; Busalacchi, A.J.; Cheney, R.; Donguy, J.R.; Gage, K.S.; Halpern, D.; Ji, M.; Julian, P.; Meyers, G.; Mitchum, G.T.; et al. The tropical ocean-global atmosphere observing system: A decade of progress. J. Geophys. Res. 1998, 103, 14169–14240. [Google Scholar] [CrossRef]
- Liu, W.T.; Katsaros, K.B.; Businger, J.A. Bulk Parameterization of Air-Sea Exchanges of Heat and Water Vapor Including the Molecular Constraints at the Interface. J. Atmos. Sci. 1979, 36, 1722–1735. [Google Scholar] [CrossRef]
- Liu, W.T.; Tang, W.Q. Equivalent Neutral Wind; Jet Propulsion Laboratory Publication 96-17; 1996. Available online: https://ntrs.nasa.gov/archive/nasa/casi.ntrs.nasa.gov/19970010322.pdf (accessed on 7 March 2018).
- Fairall, C.W.; Bradley, E.F.; Hare, J.E.; Grachev, A.A.; Edson, J.B. Bulk Parameterization of Air–Sea Fluxes: Updates and Verification for the COARE Algorithm. J. Clim. 2003, 16, 571–591. [Google Scholar] [CrossRef]
- Bidlot, J.R.; Holmes, D.J.; Wittmann, P.A.; Lalbeharry, R.; Chen, H.S. Intercomparison of the performance of operational ocean wave forecasting systems with buoy data. Weather Forecast. 2001, 17, 287–310. [Google Scholar] [CrossRef]
- Verhoef, A.; Vogelzang, J.; Stoffelen, A. ASCAT L2 Winds Data Record Validation Report; Ocean and Sea Ice SAF Technical Note, SAF/OS /CDOP2/KNMI/TEC/RP/239; OSI SAF Tech.: De Bilt, The Netherlands, 2016. [Google Scholar]
- ASCAT Wind Product User Manual, Ocean and Sea Ice SAF, EUMETSAT Advanced Retransmission Service, Version 1.14. March 2016. Available online: http://profects.knmi.nl/scatterometer/publications/pdf/ASCAT_Product_Manual.pdf (accessed on 19 April 2018).
- Chakraborty, A.; Kumar, R. Generation and validation of analyzed wind vectors over the global oceans. Remote Sens. Lett. 2013, 4, 114–122. [Google Scholar] [CrossRef]
- Ulgen, K.; Hepbasli, A. Determination of Weibull parameters for wind energy analysis of İzmir, turkey. Int. J. Energy Res. 2002, 26, 495–506. [Google Scholar] [CrossRef]
Figure 1.
Locations of the National Data Buoy Center (NDBC), Tropical Atmosphere Ocean (TAO), Pilot Research Moored Array (PIRATA), and Research Moored Array for African-Asian-Australian Monsoon (RAMA) moored buoys.
Figure 1.
Locations of the National Data Buoy Center (NDBC), Tropical Atmosphere Ocean (TAO), Pilot Research Moored Array (PIRATA), and Research Moored Array for African-Asian-Australian Monsoon (RAMA) moored buoys.

Figure 2.
Percentage of the number of observations by the NDBC, TAO, PIRATA, and RAMA moored buoys.

Figure 3.
The number distribution of RapidScat and The Advanced Scatterometer (ASCAT) collocated data pairs.
Figure 3.
The number distribution of RapidScat and The Advanced Scatterometer (ASCAT) collocated data pairs.

Figure 4.
Scatterplots for wind speed and direction of the comparisons between RapidScat and moored buoys. (a) NDBC wind speed; (b) NDBC wind direction; (c) PIRATA wind speed; (d) PIRATA wind direction; (e) RAMA wind speed; (f) RAMA wind direction; (g) TAO wind speed; (h) TAO wind direction.
Figure 4.
Scatterplots for wind speed and direction of the comparisons between RapidScat and moored buoys. (a) NDBC wind speed; (b) NDBC wind direction; (c) PIRATA wind speed; (d) PIRATA wind direction; (e) RAMA wind speed; (f) RAMA wind direction; (g) TAO wind speed; (h) TAO wind direction.


Figure 5.
Dependence of statistical parameters and wind speed and direction residuals (RapidScat-buoy) on the buoy wind speed.
Figure 5.
Dependence of statistical parameters and wind speed and direction residuals (RapidScat-buoy) on the buoy wind speed.

Figure 6.
Errors of RapidScat wind vectors in different months from April 2015 to August 2016 for NDBC, PIRATA, RAMA, and TAO buoys.
Figure 6.
Errors of RapidScat wind vectors in different months from April 2015 to August 2016 for NDBC, PIRATA, RAMA, and TAO buoys.

Figure 7.
Errors of RapidScat wind vectors at different times of the day for NDBC, PIRATA, RAMA, and TAO buoys.
Figure 7.
Errors of RapidScat wind vectors at different times of the day for NDBC, PIRATA, RAMA, and TAO buoys.

Figure 8.
PDFs of RapidScat and buoy wind speeds and directions in the bin of 1 m/s and 10°.

Figure 9.
Scatterplots for wind speed and direction of the comparisons between RapidScat and ASCAT in December 2014 and June 2016. (a) wind speed in December 2014; (b) wind direction in December 2014; (c) wind speed in June 2016; (d) wind direction in June 2016.
Figure 9.
Scatterplots for wind speed and direction of the comparisons between RapidScat and ASCAT in December 2014 and June 2016. (a) wind speed in December 2014; (b) wind direction in December 2014; (c) wind speed in June 2016; (d) wind direction in June 2016.

Figure 10.
statistical parameters of difference between RapidScat and ASCAT wind vectors in different months from October 2014 to August 2016.
Figure 10.
statistical parameters of difference between RapidScat and ASCAT wind vectors in different months from October 2014 to August 2016.


Table 1.
The basic information of previous and on-going scatterometer missions.
| Sensor/Mission | Frequency | Launch Time (UTC) | Spatial Resolution | Swath | Design Accuracy |
|---|---|---|---|---|---|
| SASS/SeaSat-A | 14.6 GHz | 27 June 1978 | 50 km | 1000 km | 2 m/s and 20° |
| AMI/ERS-1&2 | 5.3 GHz | 17 July 1991 21 April 1995 | 50 km | 500 km | 2 m/s and 20° |
| NSCAT/ADEOS-1 | 14.0 GHz | 17 August 1996 | 50 km | 600 km | 2 m/s and 20° |
| SeaWinds/ADEOS-II | 13.4 GHz | 14 December 2002 | 25 km | 1800 km | 2 m/s and 20° |
| SeaWinds/QuikSCAT | 13.4 GHz | 19 June 1999 | 25 km | 1800 km | 2 m/s and 20° |
| ASCAT/Metop-A&B | 5.3 GHz | A: 19 October 2006 B: 17 September 2012 | 25 km | 2 × 550 km | 2 m/s and 20° |
| Oscat/OCEANSAT-2 | 13.5 GHz | 23 September 2009 | 50 km | 1400–1840 km | 2 m/s and 20° |
| HSCAT/HY-2A | 13.3 GHz | 16 August 2011 | 25 km | 1350–1700 km | 2 m/s and 20° |
| RapidScat/ISS | 13.4 GHz | 20 September 2014 | 12.5 km | 900–1100 km | 2 m/s and 20° |
Table 2.
The error statistics of the comparison between the RapidScat and buoy wind data.
| Buoy | Buoy Wind Speed | Number of Collocation | Wind Speed | Wind Direction | ||||
|---|---|---|---|---|---|---|---|---|
| Bias (m/s) | RMSE (m/s) | R | Bias (°) | RMSE (°) | R | |||
| NDBC | 0–24 m/s | 12,578 | 0.56 | 1.38 | 0.93 | 0.44 | 19.8 | 0.78 |
| PIRATA | 0–20 m/s | 1092 | 0.38 | 1.35 | 0.82 | 0.64 | 17.4 | 0.79 |
| RAMA | 0–20 m/s | 899 | 0.63 | 1.76 | 0.86 | 0.31 | 19.7 | 0.82 |
| TAO | 0–15 m/s | 5603 | 0.68 | 1.47 | 0.84 | 1.41 | 19.2 | 0.66 |
| ALL | 0–24 m/s | 20,131 | 0.59 | 1.42 | 0.91 | 0.72 | 19.5 | 0.79 |
Table 3.
The statistics of the differences between the RapidScat and ASCAT A and B wind data.
| Month | Number of Collocation | Wind Speed | Wind Direction | ||||
|---|---|---|---|---|---|---|---|
| Bias (m/s) | RMSE (m/s) | R | Bias (°) | RMSE (°) | R | ||
| Oct. 2014 | 312,514 | −0.02 | 1.04 | 0.96 | −0.21 | 15.67 | 0.89 |
| Nov. 2014 | 455,124 | 0.01 | 0.96 | 0.96 | −0.34 | 15.53 | 0.08 |
| Dec. 2014 | 583,358 | 0.03 | 0.95 | 0.96 | 0.19 | 14.14 | 0.94 |
| Jan. 2015 | 184,001 | 0.06 | 1.06 | 0.96 | −0.85 | 14.85 | 0.88 |
| Feb. 2015 | 246,063 | 0.23 | 1.05 | 0.96 | −0.58 | 13.89 | 0.93 |
| Mar. 2015 | 158,950 | 0.23 | 1.04 | 0.96 | −0.25 | 14.09 | 0.83 |
| Apr. 2015 | 321,073 | 0.23 | 1.04 | 0.96 | −0.58 | 15.86 | 0.87 |
| May 2015 | 449,212 | 0.14 | 1.22 | 0.94 | 0.87 | 16.28 | 0.80 |
| Jun. 2015 | 550,082 | 0.22 | 1.08 | 0.95 | −1.14 | 15.39 | 0.87 |
| Jul. 2015 | 303,726 | 0.07 | 1.12 | 0.96 | −0.59 | 15.30 | 0.94 |
| Aug. 2015 | 330,595 | 0.34 | 1.26 | 0.95 | −0.31 | 16.15 | 0.87 |
| Sep. 2015 | 267,640 | 0.42 | 1.24 | 0.95 | −0.57 | 17.31 | 0.84 |
| Oct. 2015 | 400,119 | 0.42 | 1.16 | 0.95 | −0.36 | 14.66 | 0.93 |
| Nov. 2015 | 392,022 | 0.55 | 1.21 | 0.95 | −1.03 | 15.08 | 0.88 |
| Dec. 2015 | 329,652 | 0.49 | 1.16 | 0.94 | −0.26 | 13.62 | 0.96 |
| Jan. 2016 | 519,671 | 0.51 | 1.20 | 0.95 | −0.73 | 15.78 | 0.86 |
| Feb. 2016 | 646,977 | 0.34 | 1.25 | 0.95 | −1.71 | 15.51 | 0.83 |
| Mar. 2016 | 332,428 | 0.36 | 1.24 | 0.94 | 0.87 | 16.92 | 0.92 |
| Apr. 2016 | 466,392 | 0.38 | 1.28 | 0.93 | −0.33 | 15.20 | 0.88 |
| May 2016 | 373,794 | 0.41 | 1.24 | 0.94 | 0.26 | 16.47 | 0.87 |
| Jun. 2016 | 409,699 | 0.22 | 1.31 | 0.93 | 0.11 | 15.37 | 0.84 |
| Jul. 2016 | 155,656 | 0.32 | 1.24 | 0.94 | −1.85 | 16.80 | 0.07 |
| Aug. 2016 | 131,296 | 0.26 | 1.26 | 0.94 | −0.80 | 14.68 | 0.70 |
| ALL | 8,320,044 | 0.27 | 1.15 | 0.95 | −0.42 | 15.21 | 0.83 |
© 2018 by the authors. Licensee MDPI, Basel, Switzerland. This article is an open access article distributed under the terms and conditions of the Creative Commons Attribution (CC BY) license (http://creativecommons.org/licenses/by/4.0/).
Share and Cite
MDPI and ACS Style
Yang, J.; Zhang, J. Evaluation of ISS-RapidScat Wind Vectors Using Buoys and ASCAT Data. Remote Sens. 2018, 10, 648. https://doi.org/10.3390/rs10040648
AMA Style
Yang J, Zhang J. Evaluation of ISS-RapidScat Wind Vectors Using Buoys and ASCAT Data. Remote Sensing. 2018; 10(4):648. https://doi.org/10.3390/rs10040648
Chicago/Turabian StyleYang, Jungang, and Jie Zhang. 2018. "Evaluation of ISS-RapidScat Wind Vectors Using Buoys and ASCAT Data" Remote Sensing 10, no. 4: 648. https://doi.org/10.3390/rs10040648
Note that from the first issue of 2016, this journal uses article numbers instead of page numbers. See further details here.