Abstract
This paper describes the use of the Chinese Gaofen-1 (GF-1) satellite imagery to automatically extract tertiary Linear Archaeological Traces of Tuntian Irrigation Canals (LATTICs) located in the Miran site. The site is adjacent to the ancient Loulan Kingdom at the eastern margin of the Taklimakan Desert in western China. GF-1 data were processed following atmospheric and geometric correction, and spectral analyses were carried out for multispectral data. The low values produced by spectral separability index (SSI) indicate that it is difficult to distinguish buried tertiary LATTICs from similar backgrounds using spectral signatures. Thus, based on the textual characteristics of high-resolution GF-1 panchromatic data, this paper proposes an automatic approach that combines joint morphological bottom and hat transformation with a Canny edge operator. The operator was improved by adding stages of geometric filtering and gradient vector direction analysis. Finally, the detected edges of tertiary LATTICs were extracted using the GIS-based draw tool and converted into shapefiles for archaeological mapping within a GIS environment. The proposed automatic approach was verified with an average accuracy of 95.76% for 754 tertiary LATTICs in the entire Miran site and compared with previous manual interpretation results. The results indicate that GF-1 VHR PAN imagery can successfully uncover the ancient tuntian agricultural landscape. Moreover, the proposed method can be generalized and applied to extract linear archaeological traces such as soil and crop marks in other geographic locations.
1. Introduction
The Silk Road was an ancient network of trade routes that for centuries were central to cultural communication and interaction originally through vast regions of Eurasia connecting China and the West. In June 2014, UNESCO designated the Chang’an-Tianshan Corridor of the Silk Road as a World Cultural Heritage Site. Communications with the Western Regions (including today’s Xinjiang Uyghur Autonomous Region in China and Eastern Central Asia) started only in the time of Han Emperor Wu (141 B.C.–87 B.C.) [1]. Originally, there had been thirty-six oasis kingdoms, but afterwards these were gradually divided into more than fifty [2]. During the period of Han Emperor Wu, the ancient Silk Road from Dunhuang to Central Asia, named the Western Regions Section, was extended through the Tarim Basin between the Tianshan Mountains and the Kunlun Mountains [3], and generally divided into three parallel lines (Figure 1).
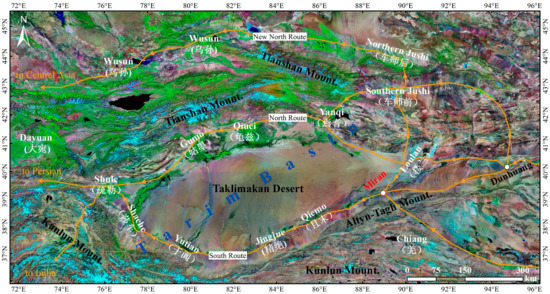
Figure 1.
Map of ancient Miran and the main Silk Road routes in the Western Regions Section where the orange lines represent the Silk Road routes, and the white words indicate the general locations of the major oasis Kingdoms during the Early Han Dynasty. The base map is Landsat TM imagery, which can be downloaded from http://maps.ngdc.noaa.gov/.
The three lines were: (1) South Route from Dunhuang to Shule Kingdom along the northern foot of the Altyn-Tagh Mountains and Kunlun Mountains; (2) North Route from Dunhuang to Shule Kingdom along the southern foot of the Tianshan Mountains; and (3) the New North Route from Dunhuang to Wusun Kingdom along the northern foot of the Tianshan Mountains [4]. To strengthen the domination along these frontiers and to ease the problems of supplying and transporting food grain to these remote oases, the Early Han Dynasty (206 B.C.–8 A.D.) sponsored military—agricultural colonies, known as the tuntian system, in northwestern China to ensure the safety of traders along the Silk Road [3,5].
The tuntian system, a state-promoted system of agriculture which originated in the Early Han Dynasty, grew out from the policy of having garrison troops or newly settled peasants bring undeveloped land under cultivation [5]. The Early Han Dynasty implemented the tuntian system, which placed garrisons around the military facilities (fort, castle, Great Wall and watch tower) and in well-irrigated agricultural colonies [3]. Thus, the soldiers at the frontier areas could join the battle and cultivate the land during periods of war and peace, respectively. The tuntian system was first piloted in oases along the Hexi Corridor, and soon rolled out to the Western Regions after it proved to be an enormous success; as a result, the positive effects of this organized military farming were soon felt all over the thirty-six oasis kingdoms, which the Early Han Dynasty unified for the first time [3]. It is known from Han bamboo slips unearthed in Dunhuang [6] that ancient Miran was one of the major headquarters of the tuntian system based on the scientific discoveries.
Located at the southeastern margin of the Tarim Basin (Figure 1), Miran or Milan, the outpost of Loulan Kingdom, was formerly one of the major stops on the southern route of the Western Regions Section. In 77 B.C., Weituyan, the King of Loulan Kingdom requested the government of Early Han Dynasty to send troops to develop the wasteland and to plant food grain [2,7]. A military commander and forty soldiers were then dispatched to garrison Miran to farm there [3,8]. According to the historical records [2,5] and archaeological discoveries [3,9,10,11,12], ancient Miran was continuously used from the Early Han Dynasty to Tang Dynasty (618–907 A.D.) and kept a long silence for nearly one thousand years after the collapse of the Tang Dynasty. In the beginning of the 20th century, the British explorer and archaeologist Aurel Stein first explored and excavated the Miran site [8] and uncovered the dust-laden history of ancient Miran. In the 1950s, the irrigation canal of the Miran tuntian system was discovered by a Chinese exploration team, as well as vast fertile croplands buried under the desert [13].
Artificial Tuntian Irrigation Canals (TICs) were major features and symbols of oasis agricultural development in ancient Miran. They are viewed as the most important water conservation facilities in the tuntian system. The TICs system was generally constructed by being placed into the main channel of a perennial river that was fed by glaciers and snow meltwater from mountainous areas. TICs represent a unique and integrative water conservancy system that illustrates the use of indigenous knowledge and wisdom in sustainable management of land and water in western regions with very low water accessibility. This artificial water conservancy system was popular in western regions during the Han–Tang period [2], especially in southern areas (e.g., the Kingdoms of Loulan, Qiemo, Jingjue, and Yutian) (Figure 1). In this study, it was crucial to extract and map TICs so that military and agricultural policies employed along the northwestern frontiers of ancient China could be better understood [3].
Satellite remote sensing is a novel approach that provides us with the opportunity to understand archaeological landscapes from space using optical imaging techniques. Spatial information from optical imagery can be used to target archaeological features. These features can be extracted from imagery as statistical and morphological data using GIS-aided visual interpretation or (semi-)automatic extraction techniques following image enhancement and feature detection. In the past two decades, applications of imagery have been concentrated on enhancing the visibility of archaeological features (e.g., crop, soil, and shadow marks) and detecting these subtle features from multi-sensor imagery using data fusion, spatial filters, image transformations (e.g., Principal Component Analysis (PCA), Hue-Saturation-Value (HSV), Kauth-Thomas (K-T), and Wavelet), spectral indexes, and linear combinations [14,15,16,17,18,19,20,21].
Studies that involve the visual interpretation of archaeological features increasingly employ aerial photographs [22,23]; declassified CORONA imagery [24,25]; Landsat, ASTER, SPOT and Sentinel multispectral data [20,21,26,27]; VHR satellite remote sensing data (including Gaofen [3], IKONOS [25,26], QuickBird [18,28], GeoEye [29,30] and WorldView [31,32]); and Google Earth VHR imagery [33,34]. Agapiou et al. [20] proposed three new linear orthogonal equations for different optical data derived from QuickBird, IKONOS, WorldView-2, GeoEye-1, ASTER, and Landsat sensors to enhance the exposure of crop-marks. A comprehensive image analysis, including 38 vegetation indices, object-oriented classification and segmentation, PCA and color transformation, was applied and interpreted for the detection of looted marks in WorldView-2 imagery [32]. An approach based on local indicators of spatial autocorrelation applied to ASTER and QuickBird data allowed them to visually identify traces of a possible ancient hydrographic network in the archaeological area of Tiwanaku [28]. Morehart [35] demonstrated the weakness of automatic methods and how they are not applicable to the extraction of archaeological features with heterogeneous backgrounds at a large scale. In that study, the Chinampa landscapes in the Valley of Mexico were mapped from multiple remote sensing data based on visual interpretation.
Several methods have been proposed for the semi-automatic extraction of archaeological features from aerial, satellite multispectral, and panchromatic imagery [36,37,38,39,40,41,42,43,44,45,46]. D’Orazio et al. [41] proposed a semi-automatic approach for crop-mark extraction using a region-based active contour model [42]. This approach employed a multiphase active contour model, image segmentation, and object filtering analysis. Traviglia and Torsello [43] proposed an automatic detection approach of archaeolandscape pattern using multiscale analysis of dominant oriented response filters to provide accurate localization of target linear archaeological objects. Lasaponara et al. [44] presented a semi-automatic method for square-shaped and linear soil-mark detection using unsupervised classification and object-based image analysis from QuickBird imagery. Luo et al. [45] proposed an automatic approach to perform extraction of Qanat tops using edge detection algorithm and circular Hough transformation from Google Earth imagery. D’Orazio et al. [46] designed an automatic approach for crop-mark extraction using modified variance analysis to improve extraction accuracy for aerial imagery.
Both visual interpretation and (semi-)automatic extraction techniques have their strengths and shortcomings. Visual interpretation, an accurate method, is time-consuming and strongly dependent on the digitization experience of the archaeologist using it; however, it has the advantage that the naked eye can identify subtle differences between archaeological features and the backgrounds that a computer cannot. The existing (semi-)automatic detection techniques save time and manpower but are not very successful except at an extremely limited range of spatial scales and spectral contrasts. Generally, the experimental and test images were chosen for the great spectral variability of the archaeological remains and the marked contrast between them and their surroundings [41,42,43,44,45]. For instance, in [42], the lengths of the linear archaeological traces that were the targets for the semi-automatic method were only a hundred meters with homogeneous backgrounds. Automatic extraction of archaeological features is already a challenging task and further analysis of the features requires even more effort.
In our previous study [3], Miran TICs were divided into four types: trunk, primary, secondary, and tertiary. All TICs presented linear archaeological traces in remote sensing imagery and required appropriate methods for extracting each type. The Linear Archaeological Traces of TICs were extracted from Landsat-8 OLI and GF-1 PMS data using a visual interpretation method [3] for trunk, primary, and secondary types. The degree of automation of classification and feature extraction procedures can range from semi-automatic (i.e., including human interaction) to fully automatic level. The methodology herein proposed fully enabled the automatic feature extraction, i.e., completely excluded human interaction. The aim of this study was to extract and map tertiary LATTICs from GF-1 data using the proposed automatic method which integrates mathematical morphological transformation and an improved edge detection algorithm. Section 2 introduces the study area and relevant data, and Section 3 describes the method used to extract tertiary LATTICs. The results and discussion are presented in Section 4, and conclusions are provided in Section 5.
2. Materials
2.1. Miran Site
Ancient Miran was located on the southeastern rim of the Tarim Basin in northwest China. It lies on the famous trade route known as the Silk Road where the Taklamakan Desert meets the Altyn-Tagh Mountains (Figure 1). The Miran site, located approximately 80 km east of the ancient oasis city of Charkhlik (today’s Ruoqiang County) (Figure 2a), is now one of the most important archaeological sites in the Tarim Basin [12].
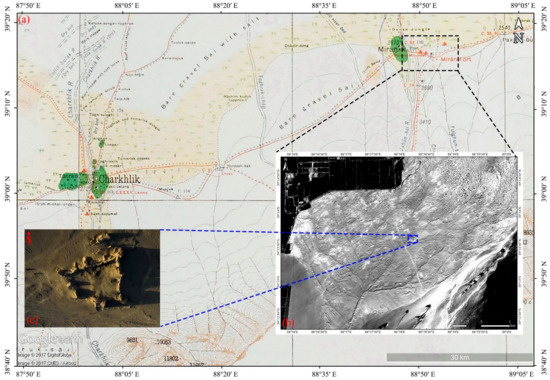
Figure 2.
(a) The locations of the Miran site and ancient Charkhlik in Stein’s archaeological map, which can be downloaded from http://dsr.nii.ac.jp/; (b) the conservation area of the Miran site where LATTICs can be seen in the GF-1 PAN image; and (c) Miran Fort.
According to Hanshu [2], ancient Miran belonged to the ancient Yixun city in the Loulan Kingdom, which was located in the Western Regions of the Empire in the early Han period [3,6,12]. The tuntian irrigation canal system (Figure 2b) was constructed and used for irrigating farmland and water conservation when ancient Miran was garrisoned during the Han Dynasty. In the early Tang Dynasty, this land was occupied by the Tibetan Empire and the existing Miran Fort (Figure 2c) was a military castle built by Tibet. However, following depopulation, this once prosperous town became a wind-eroded desert area after the Buddhist monk Xuanzang passed through the area in about 645 A.D. [47]. At present, the ruins at Miran site consist of a large irregular square-shaped fort (Figure 2c) together with architectural relics from the Han–Tang period (206 B.C.–907 A.D.) that are scattered around the surrounding areas, a monastery, several stupas and many sun-dried brick constructions, located relatively close to the ancient caravan track to Dunhuang, running west to east [3].
The artifacts and remains found in Miran site demonstrate the extensive and sophisticated trade and cultural communications and connections these ancient towns had with places as far away as the Mediterranean Sea [8]. Archaeological evidence from Miran site shows the influence of Buddhism on artistic work as early as the first century BC [48]. Early Buddhist sculptures and murals excavated from the site show stylistic similarities to the traditions of Central Asia and north India [49] and other artistic aspects of the paintings found there suggest that Miran had a direct connection with Rome and its provinces [50].
2.2. Remote Sensing Data
Gaofen (GF) images, acquired by the GF-1 satellite, were obtained from the China Centre for Resource Satellite Data and Applications. GF-1 is equipped with two panchromatic (PAN) multispectral (MS) cameras (Table 1), which can generate 2-m PAN data and 8-m MS data across the same 60-km swath. Because Chinese GF-1 data have a VHR, they are ideal sources for extracting the LATTICs found at the Miran site. The GF-1 data used in this study were acquired on 18 September 2014, at 5:22:54 UTC.

Table 1.
Characteristics of GF-1PMS data.
In this study, many shadow pixels (shadow marks) were present in the original GF-1 image due to the low solar elevation angle in satellite imagery. The shadow marks from Miran LATTICs could be seen in the micro topographic relief and were made visible by shadowing [3,19]. The micro topographic relief was caused by buried aeolian sand deposits and gravel formed by alluvial fans from the Miran River. The shadows provided insight into the profile and relative height of targets and made identification easier. Furthermore, they were the main factors for automatic extraction of tertiary LATTICs.
2.3. LATTICs in Miran Site
Intact TICs can indicate the skeletal structure of the Miran tuntian system. They are often buried beneath layers of sand and cannot be easily observed on the ground. However, their traces can be observed from space, especially in VHR imagery (Figure 3). Most Miran TICs appear similar to soil marks in sandy areas and appear as linear archaeological traces in remote sensing imagery. Linear Archaeological Traces of TICs (LATTICs) can appear due to changes in textures or shadows. Miran TICs can be classified according to length, shape and hydrological position [35]. There are four types of TICs, which in our previous study [3] were labeled trunk, primary, secondary and tertiary.
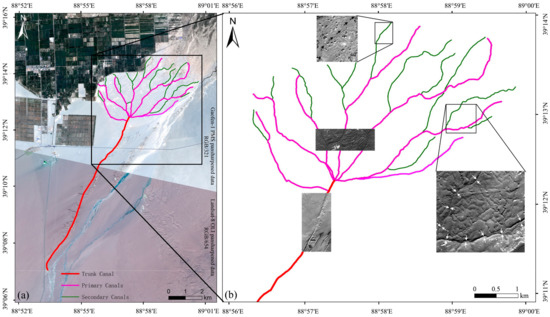
Figure 3.
General schematic of the Miran TICs system (a) without tertiary TICs from 2 m GF-1 PMS pansharpened data (RGB321) and Landsat-8 OLI pansharpened data (RGB654). The inset images in (b) are the GF-1 sub-PAN imagery; the white arrows indicate the tuntian irrigation canals.
The trunk TIC was a “diverter” canal that conveyed water from the perennial or seasonal river to the primary canal. The primary TICs, which were similar to the central arteries of the human body, were used to distribute water from the trunk TICs. Secondary TICs, which were branches of the primary TICs, were built to assist the distribution of water from the primary TICs to the hinterland of the tuntian farmland area. The tertiary TICs were “feeder” canals [3,35] that distributed water from the primary TICs to the central region of the ancient Miran area. The first three types, which have a mean width and length of up to 5–8 m and 5 km, respectively, often appear blurred and fragmented (Figure 3a) due to human disturbance and wind erosion, but tertiary LATTICs were usually clear (Figure 3b). The latter had a mean width and length of around 2–3 m and 200 m, respectively. This allows us to develop an automatic method for extracting tertiary LATTICs from GF-1 imagery.
3. Methods
3.1. Data Pre-Processing
A flowchart describing the procedure used in this study is shown in Figure 4. The GF-1 MS and PAN images were first orthorectificated before atmospheric correction was carried out. Subsequently, the GF-1 images were atmospherically corrected to minimize the interference due to signal attenuation caused by atmospheric constituents, which affects the ability to use the imagery to generate the Spectral Separability Index (SSI). The atmospheric correction was carried out using FLAASH, which is included in ENVI5.1 [51]. Lastly, the GF-1 images were geometrically corrected using ten ground control points acquired using a hand-held portable DGPS system [52] with a horizontal accuracy better than 1 m (equal to 0.5 pixel). This yielded an average root mean square error of less than 0.4 pixels.
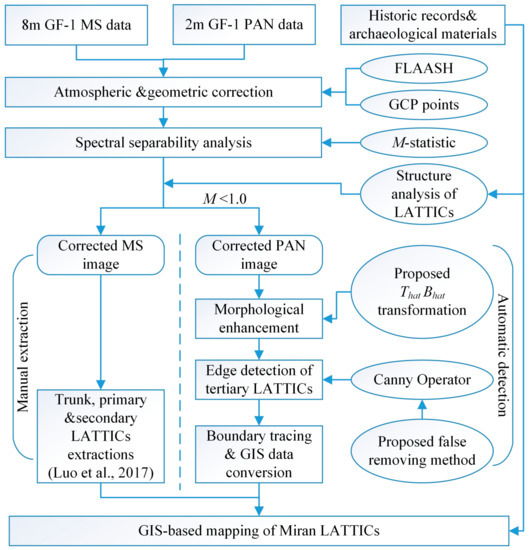
Figure 4.
Flowchart for automatic extraction and mapping of Miran LATTICs.
3.2. Spectral Separability Analysis
In this study, we adopted the spectral separability index (SSI) [44], or the M-statistic, to assess the separability of archaeological classes (e.g., LATTICs, fort, monastery, and stupas) and the background alluvial fan in the Miran site. SSI was calculated for all channels and the channel ratio was calculated for each archaeological class. SSI was also calculated for the alluvial fan to determine which of the original channels and channel ratios (spectral indices) provided the best discrimination between LATTICs and other classes. This statistical method provides a measure of class separation; the equation is given as follows [53]:
where and represent the means of two classes (LATTICs and their surroundings), and and are their standard deviations. A large SSI indicates good separation between the two classes since within-class variance is minimized and between-class variance is maximized [54]. Following Kaufman and Remer [53], SSI > 1.0 and SSI < 1.0 indicate good and poor class separation, respectively. The SSI assesses the separability for LATTICs and each archaeological class pair. Furthermore, it allows for an examination of spectral separability among substrate classes and the identification of indices that are important for classification. Spectral separability analysis was carried out to compare the spectral separability of LATTICs for the GF-1 PAN image with GF-1 MS images and their products (e.g., spectral indices and PCA).
3.3. Mathematical Morphology Based Image Enhancement
The fundamental operators in mathematical morphology are erosion and dilation [55]. When erosion is followed by dilation, it is known as morphological opening, which is mathematically denoted by Equation (2):
where g is the original image, s denotes the structural elements, and Θ and ⊕ represent the morphological erosion and dilation operations, respectively.
In contrast, when dilation is followed by erosion, the process is known as morphological closing, which is mathematically denoted by Equation (3):
The top-hat transformation is defined as the difference between the original image and the opening image, as expressed by Equation (4):
Similarly, the bottom-hat transformation is defined as the difference between the closing image and the original image. The relevant expression is given as Equation (5):
These two transformations can be used in combination to produce the effect of image enhancement for the foreground together with further stretching of the background gray levels. It also has the effect of highlighting the objects of interest and their details [56].
In this study, we proposed a joint morphological transformation approach to improve the enhancement quality of the GF-1 imagery. The GF-1 data were enhanced by adding the original image to the image that had the top-hat transformation applied to it and then subtracting the image to which the bottom-hat transformation had been applied. This can be expressed as:
3.4. Improved Edge Detection Based on the Canny Operator
In the imagery, edge points were defined as points with maximal strength in the direction of the gradient [55]. Many edge detection algorithms (e.g., Sobel, Roberts, Laplacian, Prewitt, LoG, and Canny) have been proposed over the years in the field of digital image processing. Maini and Aggarwal [57] reviewed different edge extraction techniques used in image processing and found that the Canny operator provides the best visual and quantitative performance, especially for weak edges. The Canny operator was proposed by John Canny in 1986 and uses a multistage algorithm to detect a wide range of edges in images [58].
The Canny operator reduces noise and smooths the original image by employing a 2D Gaussian function, as defined in Equation (7):
where σ is the standard deviation that changes based on imagery, G is a Gaussian function and f is an original input image function. Furthermore, the Canny operator uses the image gradient to highlight regions with high spatial derivatives. The direction, n, of the local edge for the Canny operator is estimated by Equation (8) for each pixel:
It then tracks along highlighted regions and suppresses any pixel that is not at the maximum (non-maximum suppression) with the help of Equation (9):
Finally, the gradient array is further reduced by hysteresis using two (high and low) thresholds. If the edge magnitude is below the low threshold, it is set to zero and made a non-edge. The array is made an edge if the magnitude is above the high threshold. Lastly, if the magnitude is between the two thresholds, then it is set to zero unless there is a path from pixel to a pixel with a gradient above the high threshold. The edge magnitude is computed by Equation (10):
Many false edge segments were detected due to the presence of shadow pixels in the original satellite image. Furthermore, the edges of shadows were detected and misjudged as LATTICs. In this study, we improved the Canny operator by adding a stage of gradient vector direction analysis to remove false detections. Generally, the angle between the gradient vector and the direction of illumination was greater than 90° for true edges. In contrast, false edges had an angle that was less than 90° between the gradient vector and illumination direction. Thus, the angle between the gradient direction and the illumination direction could be used as the basis for removing false edges. The angles were transformed into the threshold, ρ, given by Equation (11):
where g and n represent the gradient vector and illumination direction vector in the image plane, respectively. A value of ρ > 0 indicates a false edge.
3.5. Mapping the Tertiary LATTICs
The edges detected by tertiary LATTICs were retrieved using the GIS-based draw tool and converted into shapefiles for archaeological mapping within the GIS environment. In this paper, we used polylines to represent tertiary LATTICs.
4. Results and Discussion
4.1. Spectral Separability Analysis of LATTICs
The atmospheric correction approach produced a clear improvement in the spectral reflectance within the area of the GF-1MS image (Figure 5). Figure 6 shows the values of the SSI obtained for LATTICs in the Miran area. Unfortunately, all calculated SSI values were lower than 1.0.
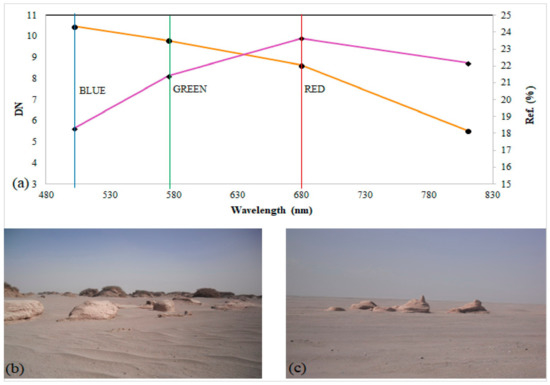
Figure 5.
The spectral profiles of LATTICs before (orange DN values) and after (purple reflectance values) atmospheric correction using FLAASH (a); and the canals have high optical reflectance values due to being buried under gravel and sand deposits (b,c).
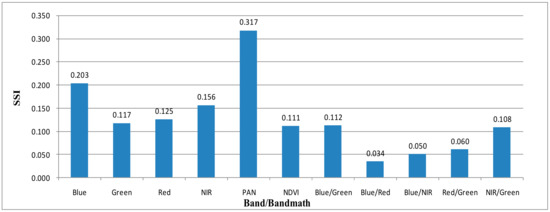
Figure 6.
SSI for LATTICs in Miran site.
This was caused by Miran LATTICs, which have no distinctive spectral signature, being completely buried beneath layers of aeolian sand deposits and gravels (Figure 5b,c). Thus, it was difficult to distinguish TICs from background information using spectral classification. In these situations, we applied GF-1 PAN data for detecting tertiary LATTICs based on their textural characteristics, which has been a crucial factor in visual interpretation.
4.2. Morphological Enhancement
GF-1 PAN data are valuable resources for extracting the tertiary LATTICs based on textural characteristics that consider the distribution and variation of neighborhood pixel value [3]. If the edges are extracted directly, tuntian canals in the background are difficult to detect, due to the dark and bright backgrounds that exist in GF-1 PAN imagery (Figure 7a).
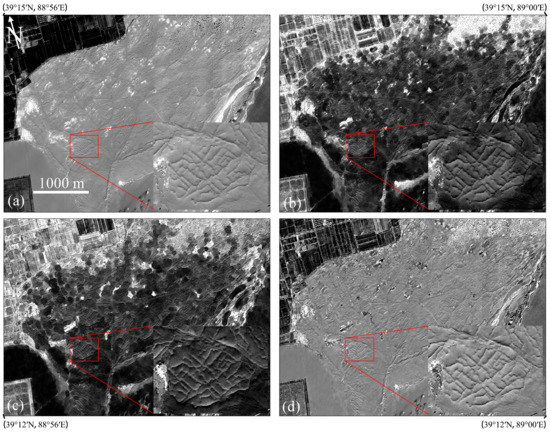
Figure 7.
Morphological enhancement results for the GF-1 PAN image containing a disk-like structural element (disk radius = 20 pixels): (a) original image; (b) original image after top-hat transformation; (c) original image after bottom-hat transformation; and (d) original image after top-hat−bottom-hat transformation. The red box indicates the experimental site.
In this study, because the contrast between the tuntian canals and the background was small, processing based on mathematical morphology was used to enhance the GF-1 PAN imagery before edge detection was carried out. Figure 7a shows the original GF-1 PAN data and Figure 7b–d shows the top-hat, bottom-hat and top-hat−bottom-hat transformation of this image, respectively. In Figure 6b, the background has been suppressed and the edge information of the targets enhanced. In Figure 6c, the foreground has been suppressed and the boundaries between connected targets strengthened. In comparison with Figure 7a, in Figure 7d, the background has been suppressed and the irrigation canals enhanced.
4.3. Automatic Detection of Tertiary LATTICs
The proposed approach for automatic detection and processing of GF-1PAN imagery at experimental sites is discussed in this section. A comparison of the morphologically enhanced image (Figure 8a) with edge detection results (Figure 8b) indicates that the Canny operator managed to delineate most LATTICs. However, the operator also discovered some objects that were not of interest (Figure 8b).
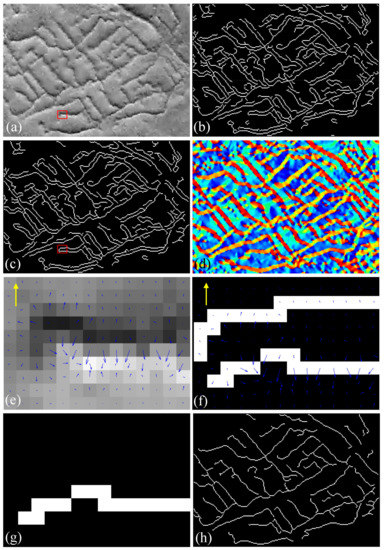
Figure 8.
Results of edge detection applied to the area enclosed by the red box in Figure 7d: (a) morphologically enhanced image; (b) results of the Canny operator; (c) results of the geometric filter; (d) gradient direction map of (a); (e) gradient vector sub-map covering the area enclosed by red boxes in (a); (f) gradient vector displayed on the red boxes in (c); (g) image in (f) after shadow edge removal; and (h) the edges in (a) after the removal of false edges. The blue and yellow arrows in (e,f) represent the gradient vectors and the directional illumination vectors in the image plane, respectively.
Due to the presence of small sand dunes, a geometric filtering procedure was applied to remove the non-interesting edges from the edges detected using the Canny operator. According to the ground-truth statistics for the tertiary LATTICs, the length of a single canal is generally more than 20 m, i.e., more than 10 pixels, and the length of the linear sand dunes is often less than 10 m, i.e., less than 5 pixels. Therefore, the length threshold for removing non-interesting targets and small linear sand dune was set to 5 pixels (Figure 8c). However, some canals probably have lengths of less than 5 pixels and these were, therefore, “falsely” removed by this process.
In addition, the false edge segments could be distinguished from shadows due to the low solar elevation angle (Figure 8c,d). The directions of the gradient vectors for the false edges were opposite to those for the true edges (Figure 8e). Figure 8g,h shows the results of the edge detection after length filtering and shadow edge removal. In contrast to Figure 8b, most of the non-interesting targets have been removed.
4.4. Performance Evaluation
Generally, automatic methods should improve the accuracy of extraction results and enable greater data acquisition. It is important to use standard quality factors and rules to make an accurate quantitative assessment. A quantitative evaluation of automatic extraction methods was necessary, but proved to be difficult due to the complexity and subjective perceptions of the targeted archaeological objects. In [21,35], the semi-automatic performances of the proposed algorithms were evaluated by classifying archaeological traces according to their visibility, integrity, global difficulty, and level of feature extraction. The performances of different extraction approaches should be compared at the same test site. Unfortunately, the performances for the extraction methods discussed in the literature have been evaluated at different sites or sets of sites making a fair comparison impossible. In [38], the automatic sensitivity and accuracy values of the proposed method were evaluated on four synthetic images with varying window and spacing dimensions. However, values were qualitatively evaluated on real archaeological images by comparison with three other approaches from the perspective of archaeological interpretability.
The performance of our proposed method was semi-quantitatively evaluated by calculating the ratio of the automatically extracted length to the manually extracted length for various LATTICs. The total length of tertiary LATTICs derived from manual interpretation of experimental imagery was 4243 m. Our proposed method identified an extracted length of 4002 m. The extraction accuracy was near 94.32% and was found by comparing the ratio of the automatically extracted length to the manually extracted length (4002 m/4243 m). The yellow lines in Figure 9a denote the tertiary LATTICs that were extracted manually but which the proposed method failed to extract; these total about 241 m in length. The detected edges were draw out using GIS tools and converted into shapefiles for archaeological mapping (Figure 9a–c). Figure 9a–c shows a comparison between the canals that were automatically extracted and manually extracted from the experimental image.
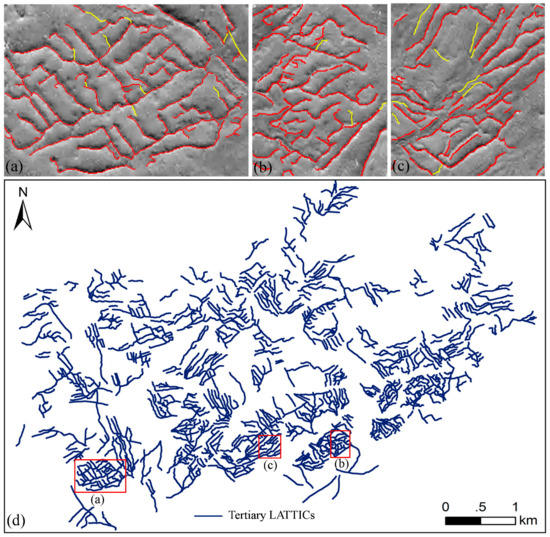
Figure 9.
(a–c) Results of auto-extracting tertiary LATTICs from the experimental image (a); and Test Images I (b); and II (c); and automatic extraction results of tertiary LATTICs for the whole Miran site (d).
The same approach was used to extract tertiary LATTICs in two test images (I and II) to assess the method used in this study. LATTICs with a total length of 1384 m (Figure 9b) and 1367 m (Figure 9c) were extracted from Test I and Test II with an accuracy of 97.12% (1415 m/1457 m) and 90.68% (1362 m/1502 m), respectively. Thus, the proposed method performed well for extracting tertiary LATTICs in the Miran site. The visual interpretation method extracted 754 tertiary LATTICs of various sizes in our previous study [3]. Figure 9d shows the automatic extraction results of tertiary LATTICs for the entire Miran site with an average accuracy of 95.76%.
Automated detection of archaeological features and landscape patterns is still today in its infancy stage in the remote sensing for archaeology. The quantitative evaluation herein performed pointed out that the automatic identification of linear archaeological traces of tertiary irrigation canals can be successfully performed. This paper advances on the development of automatic methods for the extraction of archaeological landscape features.
4.5. Mapping the LATTICs in Miran Site
The primary objective of this study was to create a map to help understand the irrigation structure of the tuntian landscape. In a previous study, trunk, primary, and secondary LATTICs were visually interpreted in ArcGIS [3]. In this study, a map of tertiary LATTICs was also made in ArcGIS by digitally converting the automatic extraction results to polyline features. Figure 10 shows the integrated map of all LATTICs in the Miran site.
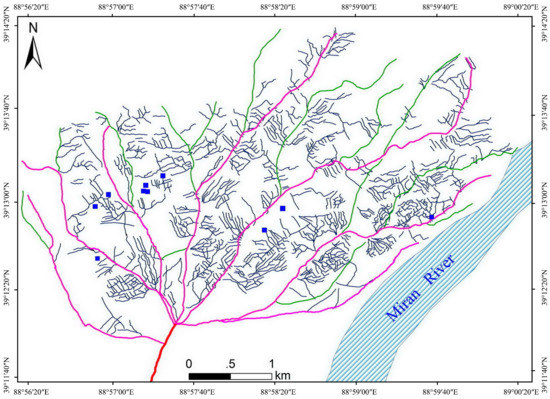
Figure 10.
Map of the canal-based tuntian irrigation system in the Miran site. It is a fan-shaped complex that includes trunk LATTICs (red), primary LATTICs (pink), secondary LATTICs (green), and tertiary LATTICs (dark blue). The blue blocks indicate the earthen monuments.
Only one trunk canal existed (Figure 3 and Figure 10) in the Miran tuntian system during ancient times. The main body of the trunk canal has disappeared due to shifting sand dunes and wind erosion [3]. The trunk LATTICs flowed from the middle reaches of the Miran River (Figure 3a) and there were seven primary LATTICs leading from the trunk LATTICs through the Miran area. These primary LATTICs formed a fan-shaped structure and constituted the basic skeleton of the Miran tuntian canal-based landscape (Figure 10). Secondary canals formed the branches of primary canals. In comparison with the other three types of LATTICs, Tertiary LATTICs were shorter, narrower, and laid along the same direction that gave the tuntian landscape its characteristic appearance. Most of these LATTICs flowed directly from primary LATTICs, although some were connected to secondary LATTICs. The tertiary LATTICs appeared to be organized in a regular pattern. These LATTICS were usually parallel to other tertiary LATTICs and perpendicular to the higher-level primary and secondary LATTICs.
The transfer of water from the Milan River and its distribution to farmland was a key aspect of the tuntian system. Generally, areas along the banks of rivers would not be selected for farming in the northwestern frontier areas of ancient China, especially in the snowmelt flood season. The only way to avoid flooding was to build water conservation facilities to redistribute water from the rivers and to cultivate farmland located away from rivers. According to historical records [2,5] and archaeological discoveries [10,59], the irrigation canal was a simple and practical water conservation facility. It was widely used as part of a tuntian system not only in ancient Milan, but also in ancient Dunhuang, Loulan, Qiemo, Yutian and Niya [60].
5. Conclusions
The tuntian system is one of the most significant agricultural development projects in ancient China’s northwest frontier areas and has been studied widely not only because it offers us crucial information on arid agriculture, the military, archaeology, climate change, and the paleoenvironment, but also because it is regarded as a cultural symbol of the Silk Road and precious irrigation heritage. This study proposed an automatic approach to support the extraction of tertiary LATTICs from GF-1 VHR PAN data in the Miran site in northwestern China. In general, the tuntian irrigation canals appeared as linear archaeological traces with poor contrast in multispectral imagery. This study proposed a new method consisting of morphological joint bottom–top transformation, an improved Canny edge operator, and GIS tools. The performances were 94.32% for the experimental image, and 97.12% and 90.68% for test images I and II, respectively. These results indicate an impressive agreement with visual interpretation. The results revealed that the proposed method performed well in tertiary LATTICs extraction despite the buried state of traces in the study region.
The tuntian system has had far-reaching effects, not only for ancient China, but also for the overall economy and geopolitics of modern China. Based on historical Chinese books [2,5] and archaeological investigations [6,7,8], archaeologists believe that the Miran tuntian system was continuously used from the Han Dynasty to the Tang Dynasty. The 14C ages for samples from Miran sites fall within the range 1450–1900 cal. BP (about 50–500 AD) [12], i.e., a span of ~500 years from the Later Han Dynasty, through the Wei and Jin, to the Northern and Southern Dynasties. The tuntian system at Miran site seems to have been mostly abandoned after the end of the Tang Dynasty due to invasion by the desert, climate change and the wars between the Tang Empire and the Kingdom of Tibet. New China restarted the tuntian strategy in 1950 to increase food production and maintain stability in Xinjiang. Barren land was again reclaimed by the Xinjiang Production and Construction Corps (XPCC) and hundreds of new irrigated oases together with dozens of modern cities and towns were established along ancient routes of the Silk Road. Miran was one of the most important pilot areas in this special campaign. In making its great contribution to modern Xinjiang, the XPCC also ensured the continuity of the ancient tuntian system.
The mechanism of water distribution and the agricultural–military outputs of the tuntian system are essential information for understanding the ancient tuntian landscape. It is also important to understand the topographical parameters for the location of branches and nodes in irrigation canals. These aspects need to be researched in more detail in the future. Future work will also incorporate the use of VHR SAR imagery and LiDAR data to produce structural information, including the width and height of LATTICs. Additionally, attempts will be made to map the canal-based tuntian irrigation systems at other oases (e.g., Dunhuang, Loulan, Qiemo, Yutian, and Shule) in the ancient western regions. The spatial patterns of these canals will be analyzed using integrated geoinformatics tools and geophysical field investigations. Moreover, the spatial patterns of irrigation canals across ancient western regions can assist in understanding the distribution and use of water resources. These considerations are important for research on the evolution of the irrigated Oasis-Kingdom, the development of border defense strategies, and the spatio-temporal changes of the ancient Silk Road.
Author Contributions
L.L. drafted the manuscript and was responsible for the research design, experiment and analysis. X.W. and R.L. provided the space archaeology theory and the historical–geographical information of the Silk Road. J.Z. and L.Z. supported the data preparation and the interpretation of the results. B.X. and C.L. provided fieldwork data and technical supports. D.L. and R.Y. gave environmental archaeological analysis. All authors contributed to editing and reviewing the manuscript.
Acknowledgments
The authors thank three anonymous reviewers for their helpful comments, which improved this manuscript. This work was supported by the Strategic Priority Research Program of the CAS (XDA19030502), the Key Science & Development Program of Hainan Province (ZDKJ2016021-02) and the International Partnership Program of the CAS (131C11KYSB20160061). Many thanks are due to China Centrerfor Resource Satellite Data and Applications for providing the GF-1 VHR remote sensing data that were used in this study.
Conflicts of Interest
The authors declare no conflict of interest.
References
- Elisseeff, V. The Silk Roads: Highways of Culture and Commerce; Berghahn Books: New York, NY, USA, 2000. [Google Scholar]
- Ban, G. HanShu; Zhonghua Book Company: Beijing, China, 92; reprint in 1962. (In Chinese) [Google Scholar]
- Luo, L.; Wang, X.; Liu, J.; Guo, H.; Lasaponara, R.; Ji, W. Uncovering the ancient canal-based Tuntian agricultural landscape at China’s northwestern frontiers. J. Cult. Herit. 2017, 23, 79–88. [Google Scholar] [CrossRef]
- Luo, L. Space Archaeology for Tunshu Sites along the South Route of the Ancient Silk Road. Ph.D. Thesis, University of Chinese Academy of Sciences, Beijing, China, 30 June 2016. (In Chinese). [Google Scholar]
- Sima, Q. Shiji; Zhonghua Book Company: Beijing, China, 91 B.C.; reprint in 1962. (In Chinese) [Google Scholar]
- Zhang, D. Station troops to open-up wasteland of western region in the Han dynasty based on the Han slips from Xuanquan. Dunhuang Res. 2001, 3, 113–121. (In Chinese) [Google Scholar]
- Xia, X.; Wang, B.; Zhao, Y. Lop Nor in China; Science Press: Beijing, China, 2007. (In Chinese) [Google Scholar]
- Zhang, J.; Lü, H.; Wu, N.; Qin, X.; Wang, L. Paleoenvironment and agriculture of ancient Loulan and Milan on the Silk Road. Holocene 2012, 23, 208–217. [Google Scholar] [CrossRef]
- Stein, A. Innermost Asia: Detailed Report of Explorations in Central Asia, Kansu and Eastern Iran, Carried Out and Described under the Orders of H. M. Indian Government; Clarendon Press: Oxford, UK, 1928. [Google Scholar]
- Wang, S. Historical status of the capital Loulan and ancient Lop Nor region. West Reg. Stud. 1996, 4, 43–53. (In Chinese) [Google Scholar]
- Chen, Z. Lop Nor and Lop Desert. Acta Geogr. Sin. 1936, 3, 18–49. (In Chinese) [Google Scholar]
- Lü, H.; Xia, X.; Liu, J.; Qin, X.; Wang, F.; Yidilisi, A.; Zhou, L.; Mu, G.; Jiao, Y.; Li, J. A preliminary study of chronology for a newly-discovered ancient city and five archaeological sites in Lop Nor, China. Chin. Sci. Bull. 2009, 55, 63–71. [Google Scholar] [CrossRef]
- Xiao, X. Summary of archaeology in Loulan-Shanshan. West Reg. Stud. 2006, 4, 82–92. (In Chinese) [Google Scholar]
- Noviello, M.; Ciminale, M.; Pasquale, V. Combined application of pansharpening and enhancement methods to improve archaeological cropmark visibility and identification in QuickBird Imagery: Two case studies from Apulia, Southern Italy. J. Archaeol. Sci. 2013, 40, 3604–3613. [Google Scholar] [CrossRef]
- Atzberger, C.; Wess, M.; Doneus, M.; Verhoeven, G. ARCTIS—A MATLAB® Toolbox for archaeological imaging spectroscopy. Remote Sens. 2014, 6, 8617–8638. [Google Scholar] [CrossRef]
- Aminzadeh, B.; Samani, F. Identifying the boundaries of the historical site of Persepolis using remote sensing. Remote Sens. Environ. 2006, 102, 52–62. [Google Scholar] [CrossRef]
- Bini, M.; Isola, I.; Zanchetta, G.; Ribolini, A.; Ciampalini, A.; Baneschi, I.; Mele, D.; D’Agata, A. Identification of leveled archeological mounds (Höyük) in the Alluvial plain of the Ceyhan River (Southern Turkey) by satellite remote-sensing analyses. Remote Sens. 2018, 10, 241. [Google Scholar] [CrossRef]
- Lasaponara, R.; Masini, N. Detection of archaeological crop marks by using satellites QuickBird Multispectral Imagery. J. Archaeol. Sci. 2007, 34, 214–221. [Google Scholar] [CrossRef]
- Lasaponara, R.; Masini, N. Satellite Remote Sensing: A New Tool for Archaeology; Springer: Berlin, Germany, 2012. [Google Scholar]
- Agapiou, A.; Alexakis, D.; Sarris, A.; Hadjimitsis, D. Orthogonal equations of multi-spectral satellite imagery for the identification of un-excavated archaeological sites. Remote Sens. 2013, 5, 6560–6586. [Google Scholar] [CrossRef]
- Agapiou, A.; Lysandrou, V.; Lasaponara, R.; Masini, N.; Hadjimitsis, D. Study of the variations of archaeological marks at neolithic site of Lucera, Italy using high-resolution multispectral datasets. Remote Sens. 2016, 8, 723. [Google Scholar] [CrossRef]
- Bewley, R. Understanding the past. Aerial survey, remote sensing, interpretation and management. Archeologia Aerea Studi di Aerotopografia Archeologica 2004, 1, 37–45. [Google Scholar]
- Tarantino, E.; Figorito, B. Steerable filtering in interactive tracing of archaeological linear features using digital true color aerial images. Int. J. Digit. Earth 2014, 7, 870–880. [Google Scholar] [CrossRef]
- Ur, J. CORONA Satellite photography and ancient road networks: A Northern Mesopotamian case study. Antiquity 2003, 77, 102–115. [Google Scholar] [CrossRef]
- Beck, A.; Philip, G.; Abdulkarim, M.; Donoghue, D. Evaluation 17 of CORONA and IKONOS high resolution satellite imagery for archaeological prospection in Western Syria. Antiquity 2007, 81, 161–175. [Google Scholar] [CrossRef]
- Agapiou, A.; Alexakis, D.; Hadjimitsis, D. Spectral sensitivity of ALOS, ASTER, IKONOS, LANDSAT and SPOT satellite imagery intended for the detection of archaeological crop marks. Int. J. Digit. Earth 2014, 7, 351–372. [Google Scholar] [CrossRef]
- Agapiou, A.; Alexakis, D.; Sarris, A.; Hadjimitsis, D. Evaluating the potentials of Sentinel-2 for archaeological perspective. Remote Sens. 2014, 6, 2176–2194. [Google Scholar] [CrossRef]
- Lasaponara, R.; Masini, N. Beyond modern landscape features: New insights in the archaeological area of Tiwanaku in Bolivia from satellite data. Int. J. Appl. Earth Obs. Geoinf. 2014, 26, 464–471. [Google Scholar] [CrossRef]
- Luo, L.; Wang, X.; Liu, J.; Guo, H.; Zong, X.; Ji, W.; Cao, H. VHR GeoEye-1 Imagery reveals an ancient water landscape at the Longcheng Site, Northern Chaohu Lake Basin (China). J. Digit. Earth 2017, 2, 139–154. [Google Scholar] [CrossRef]
- Lin, A.; Novo, A.; Har-Noy, S.; Ricklin, N.D.; Stamatiou, K. Combining GeoEye-1 Satellite remote sensing, UAV aerial imaging, and geophysical surveys in anomaly extraction applied to archaeology. IEEE J. Sel. Top. Appl. Earth Observ. Remote Sens. 2011, 4, 870–876. [Google Scholar] [CrossRef]
- Luo, L.; Wang, X.; Liu, C.; Guo, H.; Du, X. Integrated RS, GIS and GPS approaches to archaeological prospecting in the Hexi Corridor, NW China: A case study of the Royal Road to Ancient Dunhuang. J. Archaeol. Sci. 2014, 50, 178–190. [Google Scholar] [CrossRef]
- Agapiou, A.; Lysandrou, V.; Hadjimitsis, D. Optical remote sensing potentials for looting detection. Geosciences 2017, 7, 98. [Google Scholar] [CrossRef]
- Kennedy, D.; Bishop, M. Google earth and the archaeology of Saudi Arabia: A case study from the Jeddah area. J. Archaeol. Sci. 2011, 38, 1284–1293. [Google Scholar] [CrossRef]
- Kaimaris, D.; Georgoula, O.; Patias, P.; Stylianidis, E. Comparative analysis on the archaeological content of imagery from Google Earth. J. Cult. Herit. 2011, 12, 263–269. [Google Scholar] [CrossRef]
- Morehart, C. Mapping ancient Chinampa landscapes in the basin of Mexico: A remote sensing and GIS approach. J. Archaeol. Sci. 2012, 39, 2541–2551. [Google Scholar] [CrossRef]
- De Laet, V.; Paulissen, E.; Waelkens, M. Methods for the extraction of archaeological features from very high-resolution Ikonos-2 remote sensing imagery, Hisar (Southwest Turkey). J. Archaeol. Sci. 2007, 34, 830–841. [Google Scholar] [CrossRef]
- Trier, Ø.; Larsen, S.; Solberg, R. Automatic extraction of circular structures in high-resolution satellite images of agricultural land. Archaeol. Prospect. 2009, 16, 1–15. [Google Scholar] [CrossRef]
- Jahjah, M.; Ulivieri, C. Automatic archaeological feature extraction from satellite VHR images. Acta Astronaut. 2010, 66, 1302–1310. [Google Scholar] [CrossRef]
- Wonsok, K.; Nie, Y.; Zhu, J.; Deng, B.; Yu, L.; Liu, F.; Gao, H. Local orientation based extraction of circular soil marks of ancient graves by GA. J. Remote Sens. 2013, 17, 671–678. [Google Scholar]
- Schuetter, J.; Goel, P.; McCorriston, J.; Park, J.; Senn, M.; Harrower, M. Autodetection of ancient Arabian tombs in high-resolution satellite imagery. Int. J. Remote Sens. 2013, 34, 6611–6635. [Google Scholar] [CrossRef]
- D’Orazio, T.; Palumbo, F.; Guaragnell, C. Archaeological trace extraction by a local directional active contour approach. Pattern Recogn. 2012, 45, 3427–3438. [Google Scholar] [CrossRef]
- Figorito, B.; Tarantino, E. Semi-automatic extraction of linear archaeological traces from orthorectified aerial images. Int. J. Appl. Earth Obs. Geoinf. 2014, 26, 458–463. [Google Scholar] [CrossRef]
- Traviglia, A.; Torsello, A. Landscape pattern detection in archaeological remote sensing. Geosciences 2017, 7, 128. [Google Scholar] [CrossRef]
- Lasaponara, R.; Leucci, G.; Masini, N.; Persico, R.; Scardozzi, G. Towards an operative use of remote sensing for exploring the past using satellite data: The case study of Hierapolis (Turkey). Remote Sens. Environ. 2016, 174, 148–164. [Google Scholar] [CrossRef]
- Luo, L.; Wang, X.; Guo, H.; Liu, C.; Liu, J.; Li, L.; Du, X.; Qian, G. Automated extraction of the archaeological tops of Qanat Shafts from VHR imagery in Google Earth. Remote Sens. 2014, 6, 11956–11976. [Google Scholar] [CrossRef]
- D’Orazio, T.; Da Pelo, P.; Marani, R.; Guaragnella, C. Automated extraction of archaeological traces by a modified variance analysis. Remote Sens. 2015, 7, 3565–3587. [Google Scholar] [CrossRef]
- Xuanzang. Da Tang Xi Yu Ji; Zhonghua Book Company: Beijing, China, 645; reprint in 1985. (In Chinese) [Google Scholar]
- Oort, H. The Iconography of Chinese Buddhism in Traditional China; Brill Academic Publishers: Leiden, The Netherlands, 1986. [Google Scholar]
- Rhie, M. Early Buddhist Art of China and Central Asia; Brill Academic Publishers: Leiden, The Netherlands, 1999. [Google Scholar]
- Lin, L. A new study of the buddhist temples in Milan. Archaeol. Cult. Relics 2003, 3, 47–55. (In Chinese) [Google Scholar]
- Exelis VIS. ENVI 5.1; Exelis VIS: Boulder, CO, USA, 2013. [Google Scholar]
- Trimble. GeoExplorer 6000 Series GeoXR User Guide; Trimble: Sunnyvale, CA, USA, 2015. [Google Scholar]
- Kaufman, Y.; Remer, L. Detection of forests using Mid-IR Reflectance: An application for aerosol studies. IEEE Trans. Geosci. Remote Sens. 1994, 32, 672–683. [Google Scholar] [CrossRef]
- Reshitnyka, L.; Costab, M.; Robinsona, C.; Dearden, P. Evaluation of WorldView-2 and acoustic remote sensing for mapping Benthic habitats in temperate coastal Pacific waters. Remote Sens. Environ. 2014, 153, 7–23. [Google Scholar] [CrossRef]
- Soille, P. Morphological Image Analysis—Principles and Applications, 2nd ed.; Springer: Berlin, Germany, 2003. [Google Scholar]
- Li, H.; Sun, G.; Sun, H.; Liu, W. Watershed algorithm based on morphology for dental X-ray images segmentation. In Proceedings of the IEEE 11th International Conference on Signal Processing, Beijing, China, 21–25 October 2012; pp. 877–880. [Google Scholar]
- Maini, R.; Aggarwal, H. Study and comparison of various image edge extraction techniques. Int. J. Image Process. 2009, 3, 1–11. [Google Scholar]
- Canny, J. A computational approach to edge extraction. IEEE Trans. Pattern Anal. Mach. Intell. 1986, PAMI-8, 679–698. [Google Scholar] [CrossRef]
- Xie, L. Development of Oasis Agriculture and Ecology Environmental Changes of Loulan Kingdom. Agr. Hist. China 2001, 20, 16–26. (In Chinese) [Google Scholar]
- Yu, T. Historical Research of Western Regions from Western and Eastern Han, Wei and Jin, to the Northern and Southern Dynasties; Zhonghua Book Company: Beijing, China, 2003. (In Chinese) [Google Scholar]
© 2018 by the authors. Licensee MDPI, Basel, Switzerland. This article is an open access article distributed under the terms and conditions of the Creative Commons Attribution (CC BY) license (http://creativecommons.org/licenses/by/4.0/).