Article

Mapping the Individual Trees in Urban Orchards by Incorporating Volunteered Geographic Information and Very High Resolution Optical Remotely Sensed Data: A Template Matching-Based Approach

1
EcoGIS Lab, Graduate School of Media and Governance, Keio University, Fujisawa, Kanagawa 252-0882, Japan
2
Lab for Advanced Spatial Analysis, University of British Columbia, Vancouver, BC V6T 1Z2, Canada
3
Natural Resources and Ecosystem Services Area, Institute for Global Environmental Strategies, Hayama, Kanagawa 240-0115, Japan
4
Remote Sensing and Geospatial Analysis Lab, University of Washington, Seattle, WA 98195-2100, USA
5
Faculty of Environmental and Information Studies, Keio University, Fujisawa, Kanagawa 252-0882, Japan
*
Author to whom correspondence should be addressed.
Remote Sens. 2018, 10(7), 1134; https://doi.org/10.3390/rs10071134
Submission received: 23 April 2018 / Revised: 5 July 2018 / Accepted: 15 July 2018 / Published: 18 July 2018
(This article belongs to the Special Issue Citizen Science and Earth Observation II)

Abstract

:
This paper presents a collective sensing approach that integrates imperfect Volunteered Geographic Information (VGI) obtained through Citizen Science (CS) tree mapping projects with very high resolution (VHR) optical remotely sensed data for low-cost, fine-scale, and accurate mapping of trees in urban orchards. To this end, an individual tree crown (ITC) detection technique utilizing template matching (TM) was developed for extracting urban orchard trees from VHR optical imagery. To provide the training samples for the TM algorithm, remotely sensed VGI about trees including the crowdsourced data about ITC locations and their crown diameters was adopted in this study. A data quality assessment of the proposed approach in the study area demonstrated that the detected trees had a very high degree of completeness (92.7%), a high thematic accuracy (false discovery rate (FDR) = 0.090, false negative rate (FNR) = 0.073, and F 1 score ( F 1 ) = 0.918), and a fair positional accuracy ( root   mean   square   error ( R M S E ) = 1.02 m). Overall, the proposed approach based on the crowdsourced training samples generally demonstrated a promising ITC detection performance in our pilot project.

Graphical Abstract

1. Introduction

The various ecological, social, and economic benefits of tree orchards in urban environments have been discussed extensively in previous studies [1,2,3,4,5,6,7,8]. However, despite the contributions of urban orchards to forming sustainable urban systems, these green spaces often encounter critical threats and stresses in the urban landscape. Among the most prevalent factors threating urban orchards are the cutting, removal, and killing of trees on private properties, which often occur in the process of urban expansion (e.g., to provide space for construction) [6,8]. This destructive process is more clear in less developed countries, where the rapid rates of urban expansion and/or the informal and unplanned processes of the urban development result in the disappearance of urban orchards from the landscape [9]. Moreover, some other external factors such as water shortages, air pollution, and the presence of pests/plant diseases may critically threaten the existence or health of trees in urban orchards [10,11].
Compared to trees in public areas such as urban forests, public parks, streets, and highways in the urban environment, trees in urban orchards are mostly located on private properties. Therefore, local authorities usually have restricted access to these properties for the purposes of collecting information, periodically monitoring of the health and maintenance of trees, and recording the changes and damage occurring within the urban orchards. Furthermore, compared to public green spaces, the trees in urban orchards are often surrounded by physical barriers (e.g., walls or fences). This isolated and unexposed nature of urban orchards can limit the possibilities for authoritative and public ground-based observation supervision, and thus, the majority of the damage to (e.g., due to poor maintenance of the orchard) and (potentially illegal) destruction of the orchards may go undetected by the urban authorities and citizens. Consequently, in addition to the aforementioned risk factors that threaten the existence or health of trees in urban orchards, this lack or absence of supervision of urban orchards intensifies the risk of illegal damage and destruction of the trees on these properties.
Due to the significant functions of urban orchards and their high vulnerability in the urban environment, some governments have approved legal frameworks and measures at the national and local scales to manage, protect, and conserve the trees in urban orchards [12]. In this sense, conducting a fine-scale (i.e., at single-tree level) and updated tree inventory for urban orchards is one of the most vital steps for studying the environmental, social, and economic services provided by urban orchard trees, for making informed decisions about them, and for conducting successful management and conservation programs to protect these urban green spaces.
Four major types of mapping techniques exist for inventory of trees at the individual tree level, namely, (1) field surveys; (2) terrestrial scanning and close-range photogrammetry; (3) aerial and satellite remote sensing; and (4) crowdsourcing [12,13,14] (for more details, see Section 2.1). Depending on the nature of the adopted technique and the characteristics of the deployed sensor for mapping of the tree crowns, each technique has some strong points and limitations for capturing the information about the tree crowns (for more details, see Section 2.1). To overcome the limitations and to benefit from the advantages of each individual tree mapping technique, the hybrid approaches integrating different tree mapping techniques have been developed. Broadly categorized as a collective sensing (for more details see [15]) approach, the hybrid approach combines a possibly large set of data stream that is acquired by different types of sensors to extract new information which cannot be obtained from any single data stream [16], with the goal of providing more comprehensive and accurate characterization of the individual trees.
During recent years, the potential for integrating technical sensors [17,18] for means of individual tree detection have been explored in a number of previous studies (e.g., see [19,20,21,22]). The literature review indicates that the previous contributions on multi-technical-sensor fusion were mainly focused on the integration of airborne and spaceborne optical sensor data (mostly very high resolution (VHR) optical sensor data) with airborne LiDAR sensor data. The processing of both VHR optical and LiDAR data is often complex and computationally expensive when applied to large-scale problems [23,24]. Consequently, processing this combination of data can be very time consuming and may require access to very high computing power and data storage. Furthermore, despite the benefits of multi-technical-sensor fusion, adding an extra commercial data source to perform data fusion incurs extra costs on the project. Therefore, while a multi-technical-sensor data fusion approach appears to be effective in the GIScience research field [25,26], operationalizing the proposed hybrid approaches in practical large-scale individual tree mapping projects still remains a challenging issue.
Theoretically, the synergistic use of multi-sensor data for mapping individual trees can be extended beyond the hard infrastructure by the fusion of technical sensor data with human sensor [17,18,27] data (for more details see Section 2.1.3). However, the review of the literature revealed that despite the distinctive characteristics of Volunteered Geographic Information (VGI) [28] (for more details see Section 2.1.3) on individual trees collected through the crowdsourcing technique, until now, the possibility of collective sensing of trees at the single-tree level by integrating the technical sensor data with human sensor data has not been explored yet.
In this research project, we propose a collective sensing approach for mapping urban orchard trees at the single-tree level by incorporating VGI and VHR optical satellite data. Both of these types of data have their own strengths and weaknesses. While VGI is usually free and open to the public, it is widely known that the data often vary widely in terms of spatial data quality elements such as positional accuracy, thematic (attribute) accuracy, and completeness [29,30]. Therefore, the individual tree crown (ITC) detection solely based on a crowdsourcing approach, particularly in large-scale tree mapping projects that should be conducted during a limited period of time, may not achieve satisfactory results. On the other hand, the valuable spectral and contextual information that can be extracted from the optical data as well as the large-scale coverage of satellite remote sensing technique make this method a very useful data source for conducting ITC detection projects. However, previous studies indicate that ITC detection utilizing optical imagery and unsupervised classification approaches (e.g., see [31,32]) may not always reach to satisfactory results as classification performance can be severely affected by the complexity and heterogeneity of the scene, the existence of understory vegetation, and the overlapping of neighboring tree crowns (for more details see Section 2.1.2) [33,34]. In this context, to overcome these negative effects, previous studies [13,21,35] addressed the necessity of exploiting additional data sources in addition to optical data. To this end, several contributions [36,37] have studied the possibility of using supervised ITC detection approaches for processing optical imagery by employing authoritative training data. Nevertheless, the labor intensive, costly, and time-consuming nature of authoritative training data collection tasks by experts is considered the main weak point of this category of ITC detection approaches. On the other hand, some studies [20,22] mainly focused on utilizing the unsupervised approaches for processing of the accurate tree height information acquired through different technical remote sensors (e.g., LiDAR) alongside optical data for ITC detection. However, as high resolution elevation data are usually costly, computationally expensive, and not always available, the applicability of this category of ITC detection approaches for large-scale mapping projects is still a challenging issue (for more details, see Section 2.1.2).
The proposed approach in this study employs VGI on the individual trees obtained through the remote mapping approach [38,39] (for more details, see Section 2.1.3) for training a template matching (TM) algorithm [40] (for more details see Section 2.2) in order to extract the ITCs in VHR satellite optical imagery. The synergy of VGI and VHR optical remotely sensed data allow one to take the unique advantages of each of these data sources and eliminate the inherent limitations of each method. In this sense, the type and complementary nature of our multi-source data provides great opportunities for relatively low-cost, fine-scale, and accurate mapping of urban orchard trees, particularly the trees that are located on private isolated properties.

2. Background and Related Works

2.1. Typology of the Major Tree Crown Mapping Techniques: Pros and Cons

2.1.1. Field Surveys, Terrestrial Scanning, and Close-Range Photogrammetry

Ground-based methods for tree mapping, e.g., those based on conventional field surveys [12,41], those using in situ technical sensors (e.g., GPS receivers) [18], those using terrestrial scanning and close-range photogrammetry approaches [12,42,43,44], and those using terrestrial technical remote sensors (e.g., terrestrial laser scanners, digital cameras) [18], are all popular and usually deliver very accurate measurements [12,42,45,46] about the individual trees. However, the aforementioned techniques that are based on the direct or close-range on-the-ground measurements cannot always be deployed for inventorying trees in urban orchards due to land tenure issues and the isolated nature of urban orchards. Typically, due to the nature of ground-based measurements, these methods are only appropriate for mapping a few distributed locations infrequently [46]. However, mapping campaigns for establishing urban tree inventory systems usually have to be conducted over large areas. Moreover, in response to economic, social, and environmental forces, many changes may occur in urban green spaces over time. Therefore, deploying ground-based tree inventory techniques are costly, time consuming, and inefficient for large-scale tree mapping and regular/periodic updating of tree inventory databases [47].

2.1.2. Aerial and Satellite Remote Sensing

In recent decades, extensive studies have been conducted on the use of aerial and satellite remote sensing techniques for mapping individual trees over large areas and long periods of time. These remote sensing approaches can often provide reliable and robust alternatives for the conventional ground-based tree inventory techniques. In this sense, compared to ground-based techniques, airborne and spaceborne remote sensing techniques are not restricted by physical barriers on Earth and can provide time series measurements over large areas in a more cost- and time-effective manner.
Since the late 1990s, the data acquired from LiDAR airborne technical remote sensors have been broadly used for mapping of individual trees (for more details see [35]) since LiDAR sensors can capture vertical tree crown structure and provide accurate tree height information [35,48]. In this sense, LiDAR data have been applied for inventory of orchard trees in the various previous studies [13,49,50]. While more than half of the existing studies in the area of ITC detection/delineation employ LiDAR data [51], the majority of the existing applications of ITC detection/delineation use the data obtained from optical airborne or spaceborne technical remote sensors [51,52], at least for two main reasons. First, LiDAR surveys are still quite expensive to conduct across large areas, and LiDAR data are often not available for the case studies in the developing countries [52,53]. Second, optical imagery is often the only source of historical data available for understanding the changes in urban tree cover over time [52]. Furthermore, in complex and heterogeneous sites such as urban orchards, where the tree features may mix with other kinds of manmade and natural features, dependence solely on LiDAR-derived structural information for the extraction of individual trees without employing any other spectral or contextual information may negatively affect tree detection performance [34,54].
Advances in airborne and spaceborne optical remote sensing technologies and the increasing availability of VHR optical imagery (one meter or submeter in spatial resolution) [55] in the past few decades have enabled researchers and experts to conduct detailed tree inventory and analysis projects at the single-tree level. Among the numerous existing studies that examine the VHR products of airborne and spaceborne optical technical remote sensors for ITC detection/delineation [32,51,56,57,58,59,60,61], there is a considerable body of literature on using of VHR optical imagery for mapping and inventory of orchard trees [62,63,64,65].
Individual tree extraction using spectral and textural information derived from the optical data has been studied extensively over the past two decades [32,51,57,60]. However, despite the impressive developments in the algorithms for processing optical imagery as well as in the methods for incorporating spectral and contextual information for ITC detection/delineation, several factors still negatively affect tree detection performance, particularly in the urban context, including the complexity and heterogeneity of urban environments, the low spectral separability between tree crowns, and other types of understory vegetation (e.g., shrubs, grass), the large within-crown spectral variance in VHR imagery, the limited spatial resolution of satellite imageries with regard to the size of tree crowns, and the limitations for conducting fieldwork and providing ground reference datasets for the supervised ITC detection/delineation algorithms (particularly on private properties) [32,53,56,66,67].
In addition to using spectral and textural information derived from VHR optical images, some researchers have performed ITC detection/delineation by extracting canopy vertical structure using digital surface models (DSMs) computed from VHR optical stereo images [56,68,69,70,71,72]. However, there are several limitations to this approach for conducting the large-scale tree crown mapping projects. First, the existing photogrammetric methods for canopy height measurements are usually computationally expensive. Moreover, as discussed previously, in complex and heterogeneous environments, relying solely on height information without incorporating spectral or contextual information usually reduces the tree crown detection/delineation accuracy. Previous studies showed the limitations of vertical accuracy measurements based on the spaceborne imagery for ITC detection [70]. Furthermore, the existing relatively low-cost methods for extracting the ITCs based on the derived 3D information from the optical or LiDAR sensors mounted on unmanned aerial vehicle (UAV) platforms (e.g., [73,74]) are mostly suitable for small-scale inventory programs but are not sophisticated enough for conducting the tree mapping projects over the large areas [75].

2.1.3. Crowdsourcing

The rapid advancements in information and communications technology and the emergence of the Web 2.0 paradigm in the past decade have dramatically changed the way that informational content is generated on the web by allowing the creation of user-generated content (UGC) [76]. VGI [28] is a special case of UGC that can be simply defined as geographic information generated/collected voluntarily by citizens acting as human sensors (a.k.a, humans as sensors, people as sensors, and citizens as sensors) [18,27] through a crowdsourcing approach [28,77]. VGI can be collaboratively gathered by volunteers through the outdoor mapping or remote mapping (a.k.a, armchair mapping) approaches [38,39]. In the outdoor mapping approach, volunteers using low-cost technical sensors capture the in situ sensed VGI by visiting a location and performing some type(s) of field measurements [38,39]. On the other hand, with the remote mapping approach, the remotely sensed VGI (also referred to as remotely VGI [78]) is generated without volunteers’ physical presence at a location by way of the visual interpretation of geo-referenced VHR optical imagery or other spatial data sources (e.g., old maps) and modification/attribute enrichment of existing geo-data or the digitization of new geographical features [39,79].
In recent years, the use of crowdsourcing techniques for means of tree inventory has become increasingly popular, and many participatory web-based projects have been developed to facilitate the engagement of the volunteers in tree data collection. These detailed crowdsourced tree inventories record the coordinates of trees as well as their particular attributes (e.g., species, diameter at breast height, and height) according to the designated aims and purposes of the project.
The use of crowdsourcing for mapping trees at the single-tree level has been adopted for a wide range of purposes, such as inventorying trees along streets and in urban forests (e.g., Seattle Tree Map (http://www.seattletreemap.org), New York City Street Tree Map (https://tree-map.nycgovparks.org) and San Francisco Urban Forest Map (https://urbanforestmap.org)), biodiversity and phenology monitoring (e.g., Pericopsis (http://pericopsis.org), Track a Tree (http://trackatree.bio.ed.ac.uk) and TreeSnap (https://treesnap.org)), the protection of heritage trees (e.g., Ancient Tree Hunt (http://www.ancient-tree-hunt.org.uk)), finding edible fruit trees on public lands (e.g., Falling Fruit (https://fallingfruit.org)), and pest monitoring (e.g., Conker Tree Science (http://www.conkertreescience.org.uk)).
The usability of crowdsourcing tree inventory data based on outdoor mapping approaches are mostly limited to the mapping of trees on public lands (e.g., parks, street, etc.) where the volunteers can perform field observations and measurements. For the crowdsourcing of the trees located on private lands (e.g., in urban orchards), which are typically not accessible to volunteers for performing in situ measurements, in most cases, the only feasible solution is to conduct tree inventorying based on the remote mapping approach. In these cases, the type of information that volunteers can collect is mainly limited to the tree locations and some basic information on tree structure and condition (e.g., the tree crown size/shape) that can be determined based on the interpretation of VHR optical imagery or other spatial data sources.
The unprecedented growth in VGI [80] on the web in the recent years, as well as the numerous benefits of it such as its openness to the public, high availability, and diversity have made crowdsourced geospatial data an interesting source of information for an increasing number of application domains [81]. Furthermore, the participation of volunteers in the acquisition of VGI under the umbrella of Citizen Science (CS) [82,83] programs (e.g., crowdsourcing projects for inventorying trees in urban orchards) may bring excellent social benefits by increasing public engagement, scientific learning, and socialization [84], as well as enhancing public environmental awareness, advocacy, and conservation [85].
However, despite the considerable benefits and advantages in the using of VGI, there are still some concerns regarding the usability of the crowdsourced data for different scientific and professional applications. Human sensors perceive and express geographical phenomena and spatial relations imprecisely, and in the form of the vague concepts [86]. Hence, a degree of uncertainty is always associated with VGI. Furthermore, due to the complex bottom-up nature of VGI generation, and because there is loose coordination in terms of standards, it is very difficult to regulate and unify the process of VGI collection and production among amateur contributors [87]. Therefore, the issue of data quality remains a core concern for including VGI in authoritative databases [88]. The comprehensive assessment of the quality of the observations obtained through crowdsourcing in individual tree mapping projects is a multi-dimensional and complex task as several components of spatial data quality, including positional accuracy, thematic accuracy, completeness, logical consistency, temporal consistency, and semantic consistency [89] have to be examined using extrinsic or intrinsic spatial data quality indicators [90]. Moreover, to monitor tree resources temporally, the quality component of the timeliness of VGI has to be screened in the crowdsourced database (for more details [90]). Only four previous independent studies on VGI quality in tree inventories are recognized in the literature (for more details see [14,91,92,93]). These previous studies found that while some of the tree attributes (variables) were measured with lower accuracy by volunteers, generally, there was a high potential to use in situ crowdsourced data, particularly for tree inventory projects, where slightly lower quality levels are acceptable (for more details see [14,91,92,93]). It is notable that all of the previous studies focused on the quality assessment of crowdsourced data gathered through the outdoor mapping approach, while none have investigated the quality of data gathered through a remote mapping crowdsourcing approach, despite the popularity of the remote mapping approach for collecting individual tree inventory data.

2.2. Template Matching

TM is a class of pattern recognition techniques that generally aims to detect subimage(s) of a target image by comparing the target image with a predefined model so-called template based on a similarity measure to find the parts of the target image that match the template [40]. The template that is employed for TM is constructed through two main approaches, namely, (1) constructing the template by sampling of the real instances of object of interest (i.e., training samples) from the target image [36,94,95]; or (2) constructing the template by generating a synthetic model from the object of interest based on the geometric and radiometric characteristics of the object [96,97,98].
In the context of ITC detection, TM methods has been exploited in some previous studies [37,52,99,100,101,102,103,104,105]. A comparative study [52] involving six different ITC detection methods (TM, local maxima, valley following, region-growing, scale-space theory, and techniques based on stochastic frameworks) showed that TM had the best performance among other methods for the detection of isolated tree crowns, which are usually the predominant pattern of trees located in orchards [103].

2.3. VGI as a Source for Providing the Training Data for Remote Sensing Techniques

VGI is a relatively new source of information in the context of remote sensing. Many of the existing remote sensing studies utilizing VGI have focused on one of the two following lines: (1) the validation of remote sensing products by deploying the VGI as a reference dataset [106,107,108,109], or (2) enriching, refining, or updating remote sensing derived products through the direct integration (i.e., fusion) of VGI and remotely sensing data products [110,111,112,113]. However, it is also possible to generate entirely new remote sensing data products using VGI. For example, collecting high quality and up-to-date authoritative training data for supervised remote sensing image classification can be expensive, time consuming, and difficult [114], so recently, some studies [114,115,116,117,118,119,120,121] have explored the feasibility of using VGI as an alternative source of training data. While the majority of the previous studies deployed the OpenStreetMap (https://www.openstreetmap.org) (OSM) crowdsourced dataset [114,115,116] as an alternative nonauthoritative source for teaching the different supervised image classification algorithms to produce land use/land cover (LULC) maps, a few studies explored other fully or partially crowdsourced data sources such as the Global Biodiversity Information Facility (https://www.gbif.org) (GBIF) dataset (e.g., see [119]) or Virtual Interpretation of Earth Web-Interface Tool (VIEW-IT) dataset (e.g., see [120]) for these means.
Overall, the satisfactory mapping outcomes of the previous studies seem to indicate that VGI can serve as a useful source of training data for remote sensing techniques. However, various sources of error, bias (e.g., attribute or spatial errors in the sample data), and uncertainty (e.g., ambiguous class membership) in a training dataset may degrade the final mapping output, and the magnitude of this negative effect depends upon the nature and magnitude of the error and bias as well as the mapping method (e.g., classification algorithm) used [114,119]. Hence, although VGI can potentially be used to extract a training dataset for remote sensing mapping techniques, concerns over the quality of the crowdsourced training dataset may remain as a barrier to its adoption. In this sense, to address the existing concerns on the use of crowdsourced training data and to enhance the performance of the mapping projects that utilize these data, algorithm level approaches, e.g., employing noise-tolerant classification algorithms (for more details see [114]), as well as data level approaches, e.g., the methods used for eliminating errors and biases in the training data (e.g., see [116]), have been suggested in some of the previous studies.

3. Study Area and Data

3.1. Background

The City of Mashhad in Iran features a semiarid climate with hot summers and cold winters. Therefore, in such a hot and dry environment, any single tree plays a vital and functional role in the urban ecology and the citizens’ lives. However, the rapid population growth and high rate of urbanization in Mashhad city in recent decades has severely affected the existence of greenspaces, particularly in terms of trees within the private orchards in the city. A recent report [122] indicates that approximately 1200 hectares of the urban orchards in Mashhad region have been destroyed during the two past decades and that the remaining approximately 900 hectares suffer from inefficient inventorying and supervision. To protect and maintain urban trees and estimate their ecosystem services, the municipality of Mashhad has established a conventional tree inventory database through field surveys and tagging trees using metal labels. The coverage of this inventory program is currently limited to survey the trees in the public green spaces. Due to the nature of the tree inventory approach adopted in the city of Mashhad, this tree inventory program is very costly and time-consuming. Moreover, the limited accessibility of the trees on private property prevented the authorities from expanding the extent of the current tree inventory program to include the trees located in private urban orchards.
In Iran, urban trees, including the trees located on private orchards, are protected under the “Preservation and Expansion of Urban Green Spaces” act of parliament and other related by-laws. In this sense, the felling, uprooting, and killing of the trees and the conversion of the land use of private urban orchards were highly prohibited except in the cases that were permitted by the law. Even in the few cases where tree felling are allowable according to the law, any tree cutting or removal is illegal and carries a penalty unless a felling license was obtained from the municipality and the tree felling tariff was fully paid (if applicable). The law provides penalties for any other illegal tree cutting, removal, or destruction in breach of the law, and it compels municipalities to make provisions in relation to protecting and preserving the trees protected under this act on both the public and private properties. However, in practice, in the absence of a precise and up-to-date tree inventory database to map the trees and record the changes over time in the private urban orchards, the trees might be illegally cut down, removed, or killed gradually or suddenly by the owners to provide room for construction projects or for getting land use conversion permission in future.

3.2. Case Study

District 9 of Mashhad, Iran (located at 36°18′36″N, 59°30′0″E), is a good example of a fast growing zone in Mashhad city where some private orchards have been destroyed for the construction of residential and commercial buildings and complexes over the past 25 years.
For this study and to conduct a pilot project, we selected a test plot that covers 20.8 hectares in the inner part of a private urban orchard in district 9. This orchard is a well-maintained urban orchard that is hosting several fruit as well as non-fruit species. The selected orchard is surrounded by a wall and fence and is closed to public. Therefore, citizens usually have limited prior information about the trees in this orchard and their condition. Due to the restricted accessibility of this private orchard, we could not conduct a field survey to produce a detailed reference tree map for the study area.

3.3. Data

3.3.1. VHR Optical Satellite Data

A WorldView-3 (VW3) scene that was acquired on 30 September 2014, by Digital Globe, Inc. (Westminster, CO, USA), was exploited for this study. The imagery includes panchromatic and eight multi-spectral bands with a spatial resolution of 0.31 m and 1.24 m, respectively (Figure 1).
The panchromatic sensor collects surface reflectance between 450–800 nm, while the multi-spectral sensor captures the spectral bands in the coastal (C, 400–450 nm), blue (B, 450–510 nm), green (G, 510–580 nm), yellow (Y, 585–625 nm), red (R, 630-690 nm), red edge (RE, 705–745 nm), near-infrared 1 (NIR1, 770–895 nm), and near-infrared 2 (NIR2, 860–1040 nm) portions of the electromagnetic spectrum. The sun elevation, off-nadir angle, and cloud cover percentage at the time of image acquisition were 47.56°, 12.03°, and 0%, respectively.
To enhance the spatial resolution of multispectral bands of the image, the lower spatial resolution multispectral bands were mapped to high spatial resolution panchromatic bands based on the Gram-Schmidt pan-sharpening technique in ENVI 5.2 software [123].
To validate the quality of tree identification and detection tasks and generate reference dataset, VHR images from Google Earth were used alongside the VW3 data in this study.

3.3.2. Crowdsourced Tree Data

A total of 612 records of tree locations and corresponding crown diameters were collected by volunteers for the study area over the period when the crowdsourcing project was conducted (for more details, see Section 4.1.1). All of the crowdsourced purported tree records and their attribute data were adopted in this study for further analysis.

4. Methods

The following sections describe the methodology of the proposed ITC detection approach and data quality assessment in this study. In this sense, the backgrounds, components, and parameters of the proposed ITC detection approach based on crowdsourced training samples will be introduced and discussed in the Section 4.1. To evaluate the impact of deploying the imperfect crowdsourced training samples compare to the error-free training samples, the proposed ITC detection approach was also trained with reference (i.e., authoritative) training samples that will be explained in Section 4.2. To study the ITC detection performance of the proposed approach under the occurrence of a higher level of errors in the crowdsourced training samples, a preliminary study was conducted and is introduced and discussed in Section 4.3. Section 4.4 presents the details of the adopted reference data and measures for quality assessment of the crowdsourced tree data and evaluating the performance of the proposed approach when employing different types of training samples. The Cognition Developer 9.0 and ArcGIS 10.2 software were mainly used for processing the data and performing the analysis tasks in this study, and QGIS 2.18 software and R-3.4.2 were partially used for performing the pre- and post-processing tasks of this study.

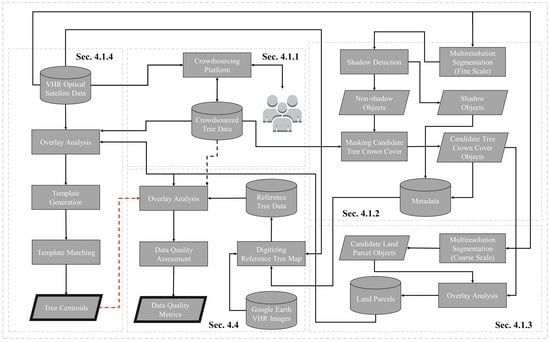
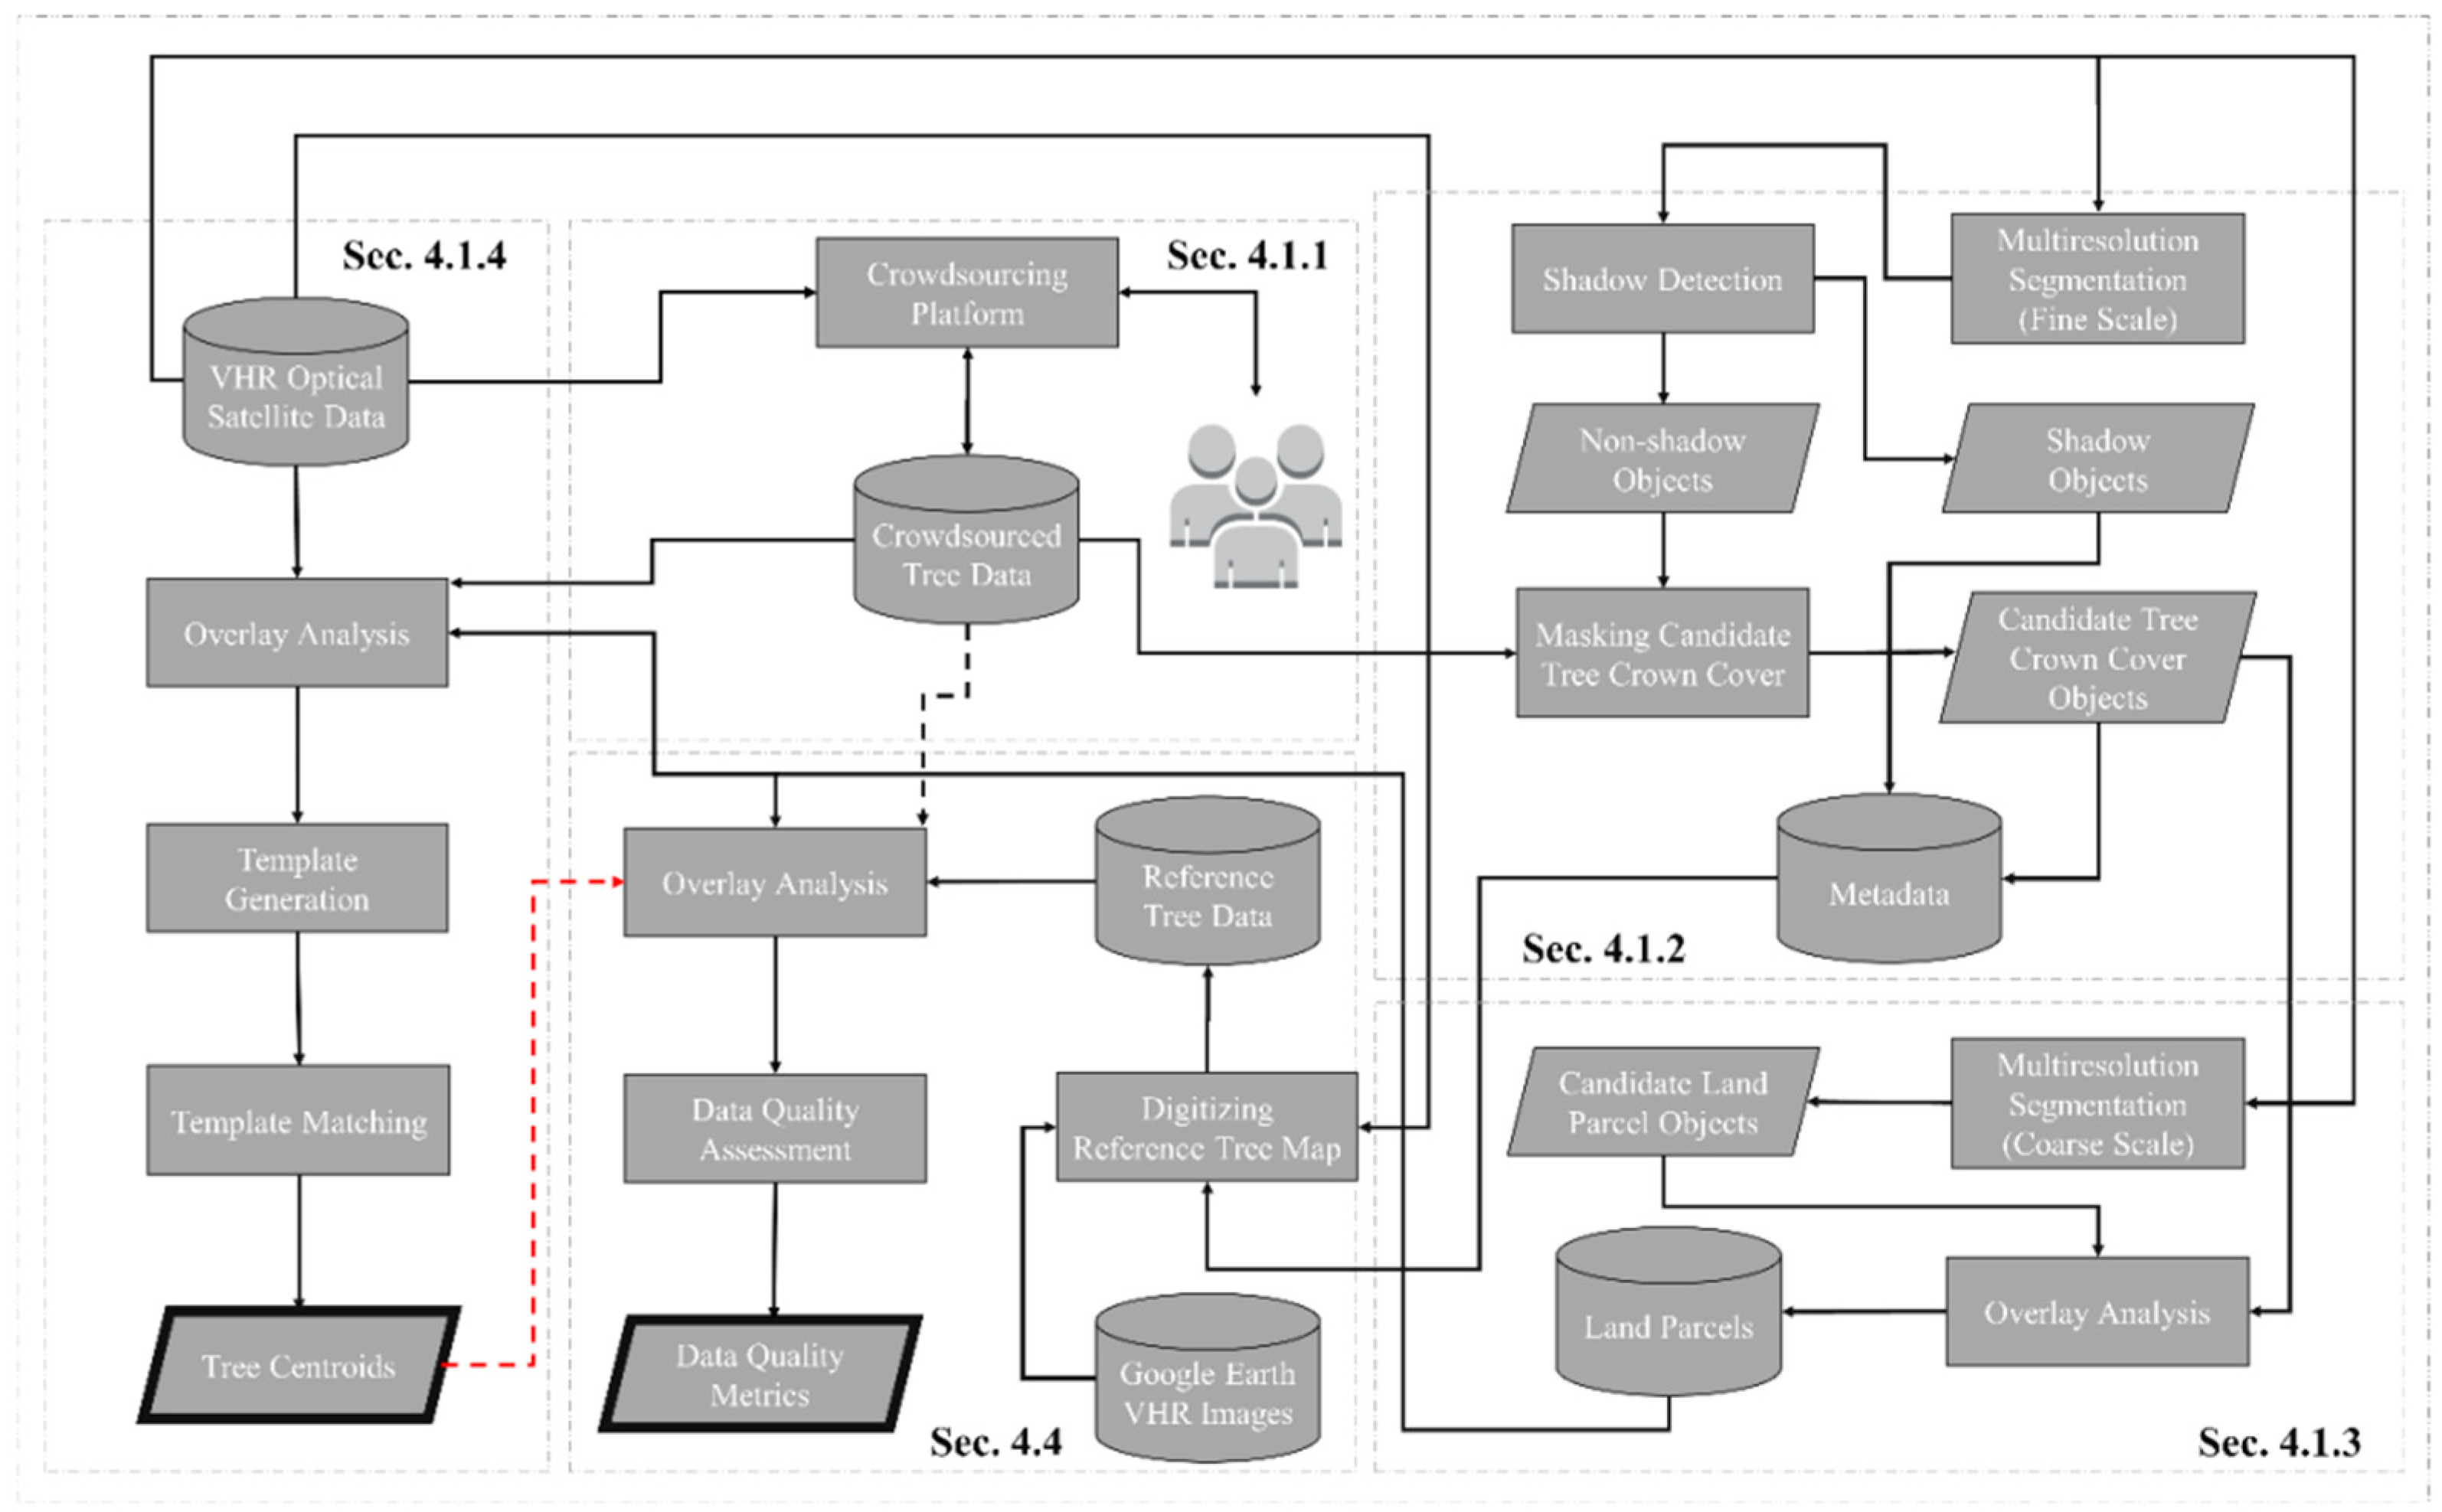
4.1. The Workflow of the Proposed Approach for ITC Detection (Based on Collective Sensing)

In this study, we deployed a collective sensing approach for ITC detection in urban private orchards. The proposed approach integrates the different spectral, spatial, and contextual information about the trees obtained by spaceborne technical remote sensor or human sensors for mapping the trees in the study area. The following subsections present the adopted workflow for conducting the proposed approach for ITC detection (based on collective sensing) (Figure 2).

4.1.1. Collecting Data on Trees through Crowdsourcing

A crowdsourcing platform was employed to facilitate the participatory mapping and visualization of trees in the study area. The platform allowed for the real-time dissemination of the VGI generated by the volunteers and enabled them to update and modify the features in the crowdsourced tree database. To conduct the crowdsourcing phase of our pilot project, we asked a local group of undergraduate and graduate civil engineering students to participate in our project. A brief (15 min) introduction on the tree identification and measurement task and platform was provided for the participants. The volunteers were asked to map the centroid of each tree they preferred to digitize and measure and record the length of the longest spread (i.e., diameter) of that tree crown and the longest spread perpendicular to it in the scene. It is widely known that appropriate false color composite imagery can provide a great amount of information for the interpreter as it can considerably improve visual perception. A study by Svatonova [124] showed that non-expert image interpreters can interpret false color satellite imagery very well. Specifically, Svatonova [124] recommended providing false color imagery alongside true color imagery in web mapping services to enhance the image interpretation performance of the non-experts. Hence, to collect spatial data (i.e., tree locations) and attribute data (i.e., tree basic geometrical property) about ITCs through crowdsourcing approach (i.e., tree identification, ITC identification) in this study, true color R-G-B and false color NIR1-R-G composites of the aforementioned VW3 imagery were produced for the test plot and provided to the volunteers through the developed platform.

4.1.2. Masking Candidate Tree Crown Land Cover

The first step of the proposed image analysis framework was concentrated on masking out the candidate tree crown (CTC) class from a non-tree crown (NTC) class (including the understory vegetation, bare soil, and man-made features) and shadow class in the scene. The low spectral separability of the tree crown pixels and the understory vegetation and shrubs made this step very challenging. To overcome this problem, the spectral and texture properties of the imagery were used to separate the CTC and NTC and shadow class pixels. To utilize this spectral and contextual information, we adopted an Object-based Image Analysis (OBIA) approach [125,126,127]) in Section 4.1.2 and Section 4.1.3.
Since the instances of each class occur at the different scales, hence in order to delineate image objects (i.e., image segments) in the scene for the aim of the CTC extraction, we adopted the multiresolution segmentation method. The multiresolution segmentation is a bottom-up region-merging segmentation technique that finds the image object of interest through an iterative object merging algorithm (for more details see [128,129]). For performing the image segmentation method, the parameters of the adopted segmentation method were set as scale parameter = 6, shape parameter = 0.2, and compactness parameter = 0.8 based on a trial and error approach involving visual interpretation of the generated boundaries of image objects vs. the actual condition for the target features at respective scale.
To classify the generated objects and finally extract the CTC class objects more accurately, several sub-steps have been considered. These sub-steps ensured that the CTC class was extracted from the scene with the minimum error in the inclusion of all CTC class objects and exclusion of the regions belonging to the NTC and shadow classes in the scene.
Shadow is considered as noise in some of the remote sensing existing literature [130], and considerable studies have been conducted to develop methods for detection and reduction or removal of shadow in remotely sensed imagery (for more details [131,132,133]). Nevertheless, one may employ shadows in the image as a valuable source of contextual information for enhancing the quality of tree identification tasks, as they provide a three-dimensional clue (i.e., proportional to width and height of the feature) on the existence of a tree feature adjacent to/in proximity to the shadow. The exploiting of contextual information from shadows for tree detection falls outside the scope of the current study. However, the shadow objects in the scene were extracted in this study for using as a metadata for promoting the performance of the visual tree identification task in the process of generating tree reference map in Section 4.4. To this end, the objects belonging to shadow class were classified by using the thresholding of the mean intensity band (RE-NIR1), mean brightness band (R-G-B-NIR1), and simple ratio (NIR1-B) using a trial and error approach (Table 1).
Next, the unclassified objects in the scene were assigned to non-shadow class (including CTC and NTC). In the absence of normalized digital surface model (nDSM) data, to mask CTC objects from NTC class objects, particularly the understory vegetation (i.e., grass and shrubs) objects, the following major steps were adopted in this study.
The roughness of the elevated vegetation layer (trees) is more than the understory vegetation layer in the image. Therefore, following [134], for separation of the elevated vegetation (rough texture) surface from the understory vegetation surface (smooth texture), initially, edge extraction Lee Sigma filtering [135,136] was performed for detecting of both bright and dark edges in the red band (sigma value = 5) to produce bright and dark edge Lee Sigma bands. Then, a new band (LeeSigmaSum) was generated by adding the bright edge Lee Sigma band into the dark edge Lee Sigma band that were calculated in the previous step. To compute the Roughness band, the Gaussian smoothing filter [137] with the kernel size of 25 × 25 pixels was applied to LeeSigmaSum band. The non-shadow objects were classified into CTC or NTC classes by thresholding of both R to Roughness ratio and normalized difference vegetation index (NDVI) (Table 1). The thresholds for R to Roughness ratio and NDVI were automatically calculated through the following procedure. First, the image objects overlapped with the purported tree centroids (i.e., crowdsourced trees) to find the objects that belong to tree crowns. Then, the mean ( μ I ) and standard deviation ( σ I ) values of the respective index for the all overlapped objects were calculated, and the threshold for the corresponding index (i.e., the R to roughness ratio and NDVI) were computed as follows:
T h r e s h o l d = μ I + c I   σ I
where c I is a coefficient that was set for the respective index (Table 1). The determination of the thresholds based on the mean and standard deviation values of the overlapped objects can address the within-crown spectral variances and reduce the negative effects of the existence of the errors (i.e., misidentified non-tree features as tree) within the crowdsourced dataset in the process of the automatic computation of the thresholds.
A cleaning process was applied to the extracted CTC objects to exclude some of the remaining misclassified NTC objects using the geometric and spatial relationship characteristics. Then, the processed CTC objects were used in the process of generating the land parcels in the test plot (Section 4.1.3) as well as metadata for enhancing the performance of the visual tree identification task in Section 4.4. Figure 3 illustrates the distribution of the detected shadow and CTC regions over the study area.

4.1.3. Delineation of Land Parcels in the Test Plot

To improve the productivity and management of orchards, orchard plots are usually subdivided into several smaller land parcels, and the trees are cultivated regularly in each parcel according to a selected layout system (e.g., square, rectangular, quincunx, triangular patterns, etc.). The trees in each orchard land parcel are mostly homogeneous in the terms of species and crown size, and therefore, they have mostly similar geometric, contextual, and spectral characteristics. This basic assumption is consistent with the insight from the Tobler’s first law of geography (TFL) that implies that “everything is related to everything else, but near things are more related than distant things [138]”.
In this study, the trees in the orchard are detected using the TM method. The TM algorithm employs a template that models the spectral and contextual properties of the target feature for detection of all instances of the target feature on the scene. To enhance the performance of the TM algorithm, for each homogenous group (i.e., class) of target objects (in terms of size, spectral, and contextual properties) in the population, a specific template using the obtained samples should be created. This process increases the correlation between the generated template and the samples [139,140] and enables the template to represent the different characteristics of the group more precisely. Furthermore, for improving the performance of the TM algorithm, the generated template has to be used only for detection of features in its corresponding group to increase the level of cross-correlation between the generated template and the image (for more details see Section 4.1.4 and Section 6.2.1.2).
In the absence of ground truth information about the characteristics (e.g., species, etc.) of the trees in the orchard, by using insights from TFL, one may assume that the trees in a homogeneous region in the image have more uniformity and similarity in terms of their characteristics. Therefore, to cover both of the aforementioned considerations for improving the TM algorithm performance, we subdivided the test plot into more homogeneous regions (i.e., land parcels) in terms of tree characteristics and limited the tasks of collecting the image samples and applying the TM algorithm for each group to the extent of the respective regions.
Therefore, to detect and delineate the land parcels within the test plot, the following main steps were followed. First, a multiresolution segmentation method was performed at the coarse scale (scale parameter = 300) on the image, as the trees are planted in the relatively large parcels in the orchards. The shape parameter and compactness parameters were determined as 0.2 and 0.5, respectively, by using the trial and error method. The segmented objects were then overlayed with the CTC objects that were extracted in the previous section to exclude the non-planted segments. Finally, the remaining segments (totally 6 segments) were assigned to the parcel class that subdivided the existing trees in the test plot into six subregions (i.e., 6 parcels) (Figure 4). The generated parcels are employed for partitioning the image, tree samples, and reference data into more homogeneous regions in the next sections for conducting the overlay analysis.

4.1.4. Tree Detection Using TM Algorithm Based on Crowdsourced Training Samples (TM-CS)

In this study, we adopted a TM algorithm for tree detection (ITC detection) in the urban orchard. To this end, first, a template image was generated for each parcel by sampling from the image at the locations of all the points tagged as “tree” in the parcel by the volunteers. The image samples were obtained from the NIR1 band because previous studies [105] have proven that the NIR band is the most appropriate band for obtaining the image samples about trees for training the TM algorithm. Then, the mean of all collected sample images for each parcel was calculated (the negative impacts of the noise can be reduced by averaging over a large number of samples). The sample width and height for each parcel was selected proportional to the mean tree crown diameter of parcel. To calculate the mean crown diameter of the parcel, first, we computed the diameter of tree crowns for each crowdsourced tree feature in a parcel. Let D l and D p represent the length of the longest spread of each purported tree crown and the longest spread perpendicular to it in the scene, respectively. The purported tree crown diameter (for an individual crowdsourced observation) ( D c ) (i.e., the average crown spread for an ITC for the crowdsourced observations) can be measured as follows:
D c = D l + D p 2
The mean tree crown diameter of parcel (for the crowdsourced observations) ( D c ¯ ) was computed as follows:
D c ¯ = 1 N c D c N c
where N c is the total number of purported tree crowns in the crowdsourced dataset by the volunteers in a parcel (i.e., the number of image samples collected based on the locations of all crowdsourced observations).
The size (i.e., dimensions) of all image samples in a parcel is equal to a square kernel with dimension ( np c × np c ), where np c is equivalent to the length of D c ¯ in pixels.
In total, six templates were created in this study, and each template was used only for the detection of the trees in its own respective parcel. Table 2 shows the total number of selected samples for generating the template in each parcel as well as the parcel mean tree crown diameter value of each parcel and the dimensional and quality specifications of the generated templates.
To detect tree crowns in the image by TM algorithm, the template kernel sliding on the image (in this study, the NIR1 band) and the similarity measure between the template and the image is calculated for each pixel, and the similarity image is generated. Among the different suggested similarity measures, such as normalized cross-correlation (NCC), the sum of squared differences, and Euclidean distance (for more details see [141]), we adopted the NCC measure as it showed a promising performance in previous remote sensing studies [142]. The NCC value ( c c ( u , v ) ) is computed as follows:
c c ( u , v ) = x , y [ i ( x , y ) i ¯ u , v ] [ t ( x u , y v ) t ¯ ] x , y [ i ( x , y ) i ¯ u , v ] 2 [ t ( x u , y v ) t ¯ ] 2
where i ( x , y ) is the intensity of the pixel, i ¯ u , v is the mean intensity for the pixels under the template, t ( x u , y v ) is the intensity for the corresponding pixel in the template, and t ¯ is the mean intensity for the template. The NCC value ranges from −1 to 1, where the higher values indicate a better match between the image and the template at that particular position.
The position of the occurrence of the best matches on the similarity image indicate the position of the pixels with the highest probability of being a tree crown centroid. Thus, to find the tree crown centroids in the adopted TM algorithm, the NCC values were thresholded (for more details see [52,102,143]). The template match threshold value should be selected with care to meet the requirements of the map users, as setting the threshold value too high leads to a large number of false negative (FN) errors (i.e., undetected tree crowns), while setting the threshold value too low leads to a high number of false positive (FP) errors (i.e., misdetection of non-tree features as tree crowns). In this study, it is desirable to increase the number of TP detections and decrease the number of FN and FP errors and the occurrence of FN errors is considered more unwanted than the occurrence of FP errors. Since we aimed to compare the performance of the tree detection task only in respect to the quality of the deployed templates created based on the crowdsourced samples, to consider all other conditions similar, the template match threshold was consistently selected as 0.65 for all the TM attempts in this study.
Finally, the detected tree crown centroid pixels were converted into the vector data format (i.e., point objects) to prepare the data for further data quality investigation in the next step.

4.2. Tree Detection Using TM Algorithm Based on Reference Training Samples (TM-REF)

To assess the impact of using imperfect crowdsourced sample data instead of error-free sample data for training the proposed approach, the TM algorithm was trained with the reference training samples (TM-REF), and the TM-CS performance was compared with it. To provide similar image sampling conditions in this comparison, corresponding reference tree centroids that were overlapped on the correctly identified crowdsourced trees in each parcel were selected for collecting the image samples for that parcel (i.e., we collected the sample at the tree centroid location on the image only if the tree crown was also marked in the crowdsourced data). The size of the image samples and the generated template in a parcel was selected as a square kernel with a dimension of np c (which is equal to the dimension of the kernel that was created based on the crowdsourced samples in a parcel) (for more details, see Table 2) rather than selecting the size according to the mean tree crown diameter of the parcel for the reference observation ( D r ¯ ) (for more details see Section 4.4.1) and its corresponding equivalent length in pixels ( np r ) (Table 3). This assumption was made because we mainly aimed to study the impacts of the positional and thematic mapping accuracy of crowdsourced data on the performance of the TM algorithm. Therefore, we selected the same TM parameters for both the crowdsourced and reference samples.
The template for each parcel was generated according to the instruction that was described in Section 4.1.4. Then, similar to the procedure that we followed in Section 4.1.4, the TM algorithm was applied on the image in each parcel to detect the tree crown centroids.

4.3. A Preliminary Experiment on the ITC Detection Performance of the Proposed Approach under a Higher Level of Uncertainty in the Crowdsourced Training Samples

Visual interpretation is a subjective process that is context-dependent and impacted by the different factors [144,145], and hence, one may expect that the occurrence rates of unintentional and intentional (i.e., vandalism) [146] errors in the remote mapping tasks are variable. Therefore, it is worth investigating the performance of the proposed approach for ITC detection (i.e., the quality of the TM-CS output) under the occurrence of higher level of errors in the crowdsourced training samples.
Depending on the source of the thematic or positional errors in the crowdsourced training samples, they could exhibit either random or spatially biased patterns. The modeling of the different patterns and scenarios of error occurrence in the crowdsourced tree data, as well as systematic assessment of the impact of these patterns and scenarios on the performance of the proposed TM-based approach, are beyond the scope of this paper. However, in the absence of an independent study in this area and to open a discussion for future works, we conducted a limited preliminary study on ITC detection performance of the proposed approach under the occurrence of the higher levels of misidentification errors in the crowdsourced training samples by modeling of errors using a simple random pattern.
To perform this preliminary study, we selected parcels 3, 6, and 5. The first two parcels were selected because they had the highest and lowest number of the contributions, respectively. Parcel 5 was selected because it was covered with very thick understory vegetation, leading to a very low spectral separability between tree crowns and their surrounding vegetation. To provide the required training datasets for evaluating the performance of the proposed approach for ITC detection under a higher level of uncertainty in the crowdsourced training samples, we gradually corrupted the initial quality of the original crowdsourced dataset in each parcel. In this sense, we generated the test training dataset (i.e., the synthetic crowdsourced training samples) at the following thresholds of the false positive to true positive (FP:TP) ratio: 0.25, 0.50, 0.75, 1.00, 1.25, 1.50, 1.75, 2.00, 5.00, 8.00, and for each selected parcel. In the following, we will briefly explain the adopted methodology for generating the test training dataset in this preliminary experiment. We considered the size of the test training dataset at each threshold of FP:TP ratio constant that is equal to the size of the original crowdsourced data ( = N c ) at the corresponding parcel (=215, 70, and 3 respectively for parcels 3, 5, and 6). The portion of the FP errors (and consequently, the portion of TP observations) for the test training dataset at each threshold of FP:TP ratio in each selected parcel was determined by solving of the following linear system under the following constraints:
{ FP TP = FP : TP   Ratio TP + FP = N c
To compute the values of the FP and TP observations, the values were rounded to the closest integer values. Then, the following error injection procedure was adopted to generate the test training dataset. In this context, to reduce the initial quality of the original crowdsourced data and generate a test training dataset with FP:TP ratio of 0.25, first a certain number of TP observations (according to the results of solving Equation (5)) were randomly selected by an automated approach and removed from the original crowdsourced data. Then, a certain number of FP errors (according to the results of solving Equation (5)) were created and randomly distributed in the areas that were classified as NTC and shadow land cover in the corresponding parcel through an automatic process. Next, the synthetically created FP records (i.e., FP errors) were added to the remaining TP observations to create a test training dataset with N c records. This test training dataset was used as the test training dataset for evaluating the approach’s performance for the FP:TP ratio of 0.25.
To create the corresponding test training dataset (with N c records) for the next FP:TP ratio (=0.50), the test training dataset that was created in the previous step (FP:TP ratio = 0.25) was corrupted by randomly removing a certain number of remaining TPs from the previous test training dataset and adding (and randomly distributing) a certain number of synthetic FPs (based on the results of solving Equation (5)) by adopting the similar method as the previous step. This procedure was repeated continuously to create the respective test training datasets for the thresholds in each parcel and ended after generating the respective test training dataset for FP:TP ratio equal to . It is clear that as the initial number of the original crowdsourced data in parcel 6 is very low ( N c = 3), it is not possible to create a test training dataset for all the thresholds in this parcel.
The generated test training dataset at each threshold were used for creating the templates. To this end, we adopted the same methodology and parameters as were adopted in Section 4.1.4. Finally, the TM-CS was conducted for each FP:TP ratio threshold at each selected parcel according to the procedure that was explained in Section 4.1.4. Then, the quality of TM-CS outputs for each selected parcel were evaluated using the introduced quality measures in Section 4.4.2 to investigate the changes in the performance of the proposed ITC detection approach (based on collective sensing) in the gradual increasing of the amount of error in the training samples.

4.4. Data Quality Assessment

4.4.1. Reference Data

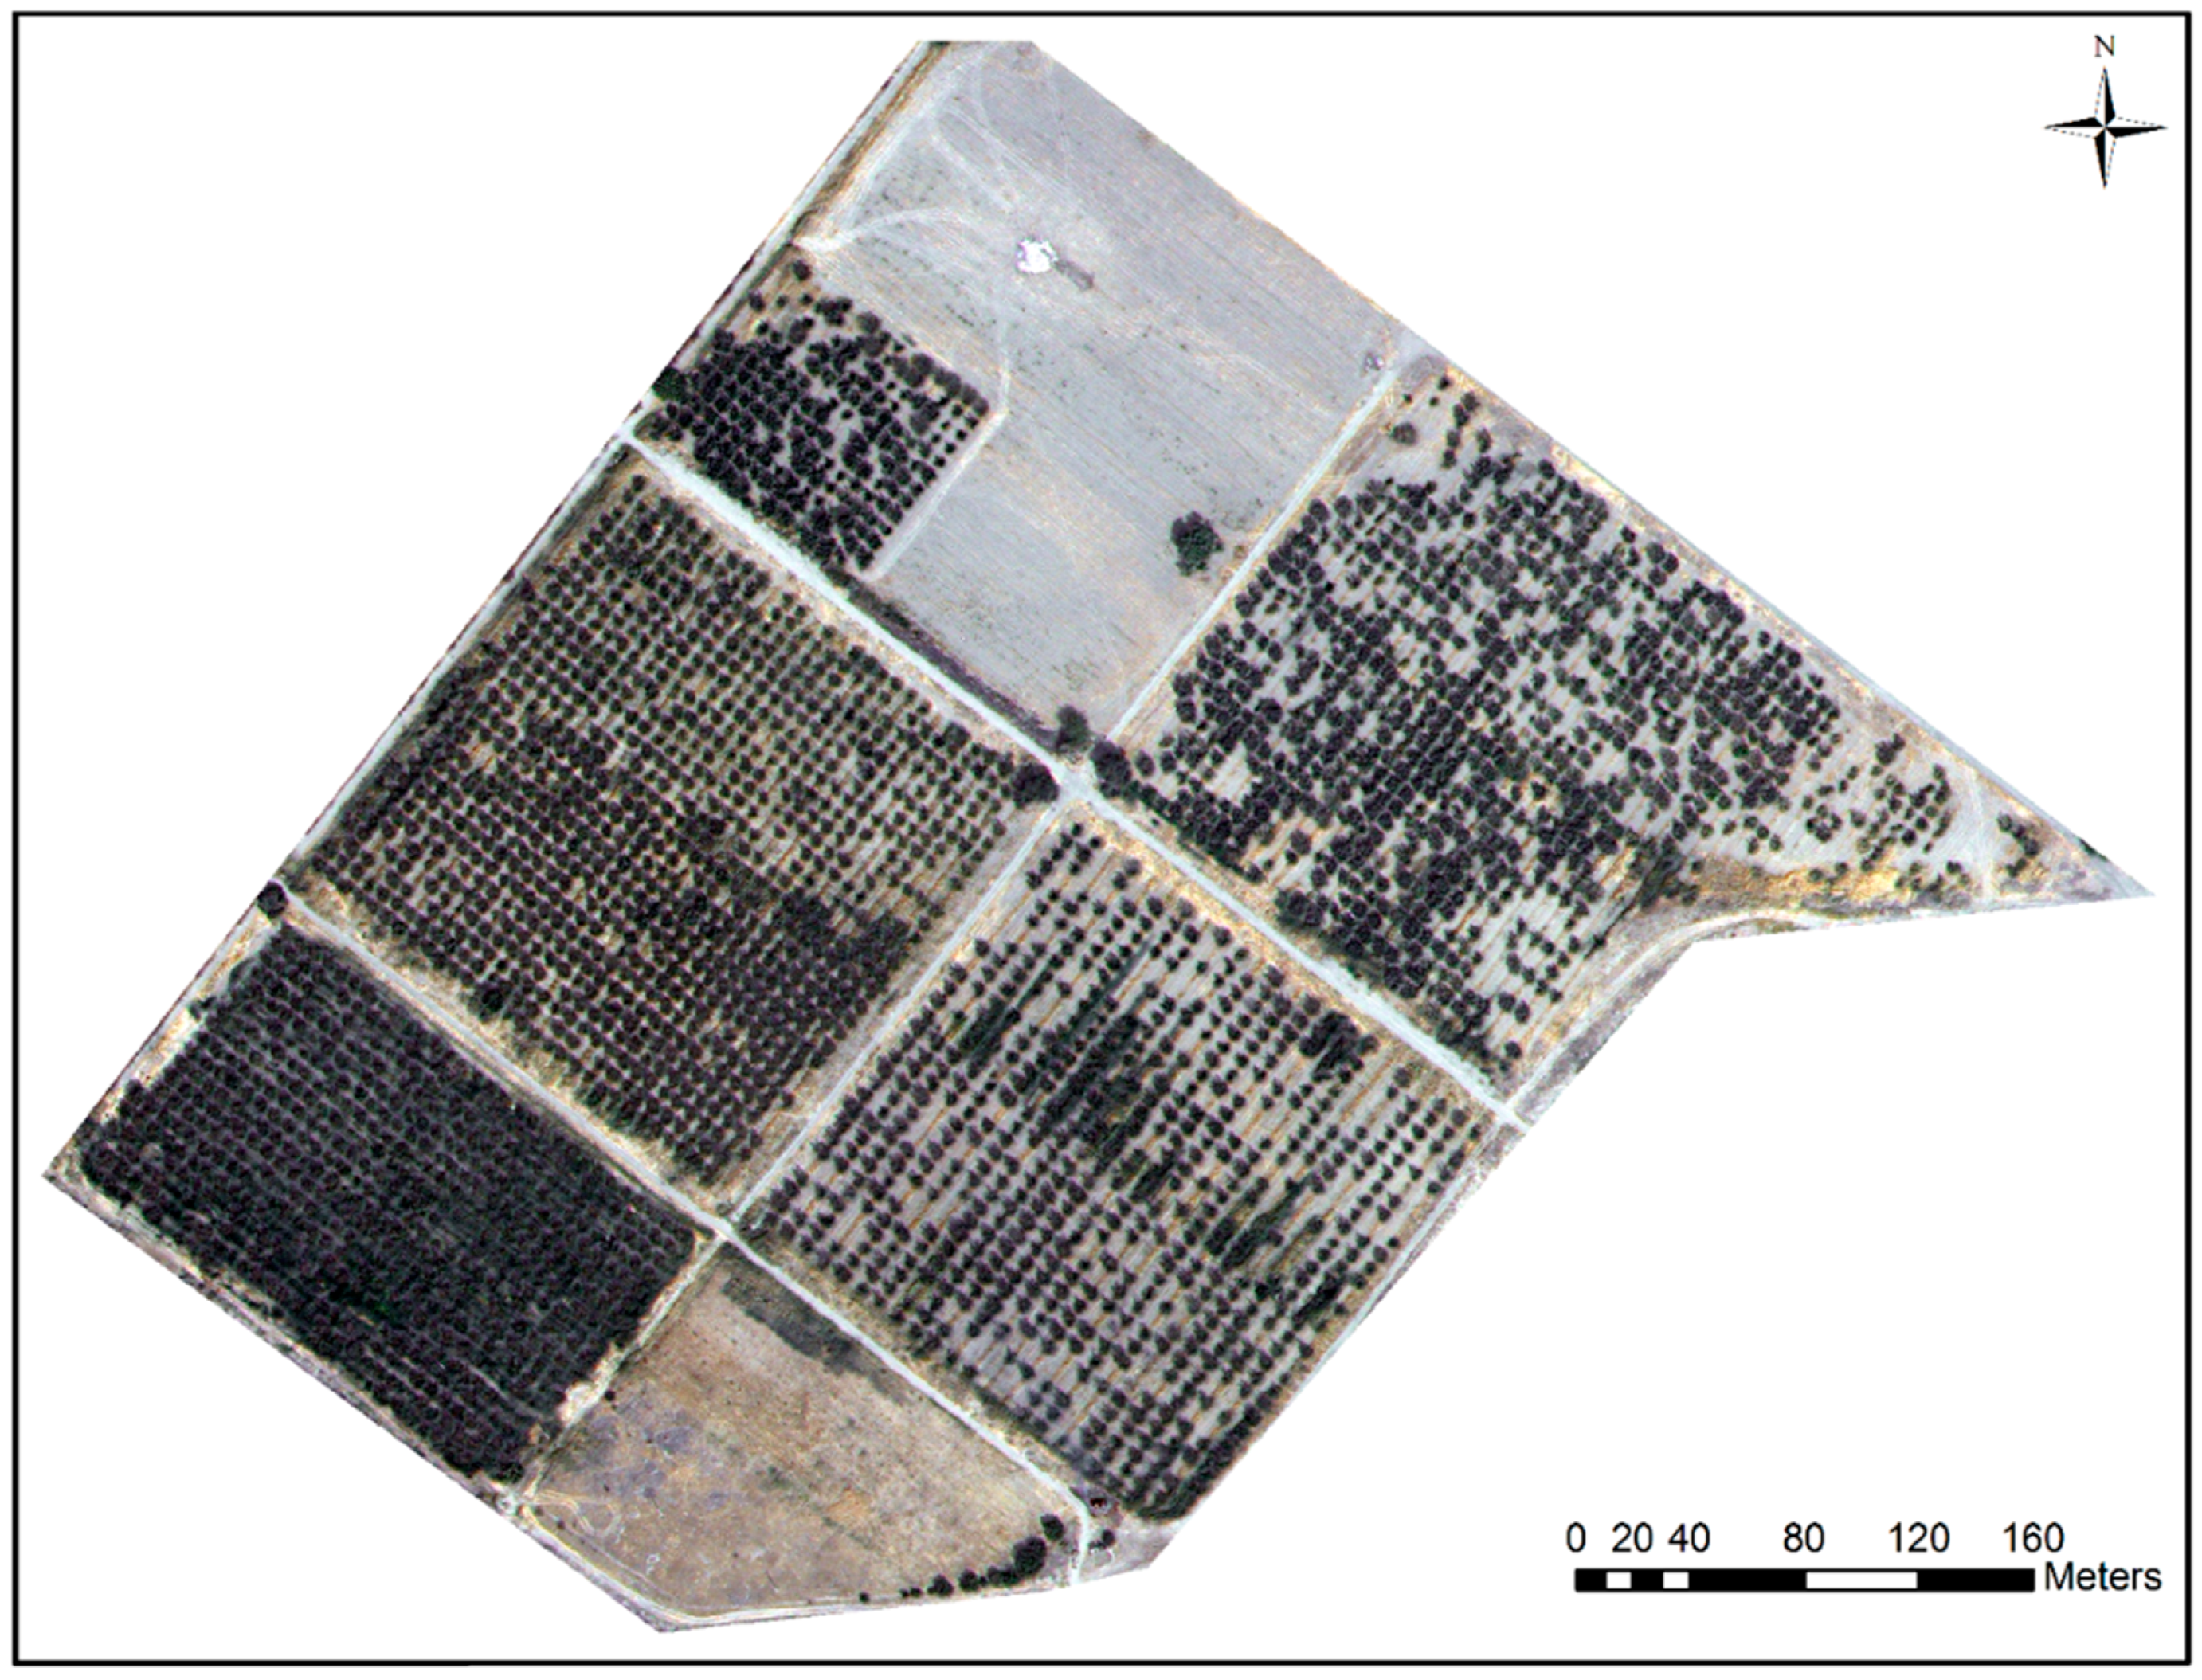
In the absence of the ground truth data, and due to the inability to conduct a field survey in the test plot (as it is located on private property), we asked an independent remote sensing expert to visually interpret the WV3 imagery of the test plot and mark the centroid positions of all tree crowns in the image (Figure 5). In the process of image interpretation, the expert used Google Earth image time series and the metadata that were produced in Section 4.1.2 as supplemental sources of information to ensure a high accuracy in the visual interpretation task. A total of 2640 trees were identified in the test plot by the expert.
Furthermore, the crowdsourced tree data were provided to the independent expert, and he was asked to digitize (as polygon features) the tree crowns in the image that overlapped with the crowdsourced observation in the study area.
To measure the reference value for the tree crown diameter ( D r ) for the tree crowns in the image that overlapped with the crowdsourced tree, we adopted the Spoke method [147], as it is indicated as the most accurate method for the computation of the average crown spread for an individual crown [147]. To this end, D r was computed using the following equation by measuring the distance of the crown centroid to the vertices of the crown polygon ( R i ).
D r = 2 × 1 n R i n v
where n v is the number of vertices of the polygon.
The mean tree crown diameter of the parcels (for the reference observation) ( D r ¯ ) was computed as follows:
D r ¯ = 1 N r D r N r
where N r is the total number of tree crowns in the corresponding reference dataset in the parcel. Table 3, shows the N r and the measured D r ¯ values for each parcel.
As the ground truth data were not available for the test plot, the data that were generated by the independent expert were assumed as the high-quality data and adopted as the reference data in this study.

4.4.2. Data Quality Measures

To assess the quality of the collected crowdsourced data (Section 3.3.2), the three spatial data quality elements of completeness, thematic accuracy (thematic mapping accuracy and quantitative attribute accuracy), and positional accuracy were measured by comparing the outputs against the reference dataset (Figure 2). To evaluate the quality of the crowdsourced data (Section 3.3.2), we assessed the data using the measures of completeness (C), positive predictive value (PPV), false discovery rate (FDR), diameter error for a correctly identified ITC ( e d ) , root mean square error (RMSE) for the tree crown diameter measurement for crowdsourced observation ( R M S E c d ), positional error (distance error) of the crown centroid for a correctly identified ITC ( e p ), and the RMSE for the tree crown centroid position measurement ( R M S E c c ).
To evaluate the quality of the generated test training datasets in Section 4.3, the two spatial data quality elements of thematic accuracy (thematic mapping accuracy) and positional accuracy were measured by comparing the outputs against the reference dataset. To assess the thematic mapping accuracy of the generated test training datasets (Section 4.3), the spatial data quality measure of FDR was employed. To quantify the TP and FP observations positional accuracies at each test training dataset in Section 4.3, we used μ T , μ F , σ T , and σ F indicators. The μ T , μ F , σ T , and σ F values indicate the mean of the positional errors ( e p ) for the TP observations, the mean of the positional errors ( e F ) for FP observations (i.e., the mean of Euclidian distances between FP observations and their nearest tree crown centroids in the reference dataset), the standard deviation of positional errors for TP observations, and the standard deviation of positional errors for FP observations, respectively.
To evaluate the quality of TM-CS output (Figure 2) and TM-REF output in Section 4.1.4 and Section 4.2, three spatial data quality elements of completeness, thematic accuracy (thematic mapping accuracy), and positional accuracy were measured by comparing the outputs against the reference dataset. The quality of the TM-CS output (i.e., the performance of the proposed approach for ITC detection (based on collective sensing)) (Section 4.1.4), and the TM-REF output (Section 4.2) were assessed using the spatial data quality measures of C, FDR, false negative rate (FNR), F 1 score ( F 1 ), and R M S E c c .
To assess the ITC detection performance of the proposed approach under higher levels of uncertainty in the crowdsourced training samples (Section 4.3), two spatial data quality elements of completeness and thematic accuracy (thematic mapping accuracy) were measured by comparing the outputs against the reference dataset. In this sense, the quality of the TM-CS output under the higher levels of uncertainty in the crowdsourced training samples (Section 4.3) was evaluated using the spatial data quality measures of C, FDR, FNR, and F 1 . The aforementioned data quality measures were calculated according the equations in Table 4.

5. Results

5.1. Quality of the Identified Trees Using Crowdsourcing Approach

The total number of purported trees in the crowdsourced dataset, the total number of counted trees in the reference dataset, and the quality elements of the crowdsourced dataset were measured for both parcels and the test plot in this study (Table 5). A total of 612 purported tree features were recorded by the volunteers for our test plot, which contained a total of 2640 trees. Cross-checking the crowdsourced data against the reference data showed that 594 out of the volunteers’ 612 purported trees were identified correctly (i.e., TP observations), with the remaining 18 purported tree features being false observations (i.e., FP error). The degree of completeness of the crowdsourced dataset for the test plot was relatively low, with only 22.5% of the trees in the test plot being mapped by the volunteers. The degree of completeness of the data varied in the different parcels, ranging from 14% in parcel 5 to 34.1% in parcel 1. The variability in the degree of completeness among the plots and the sparse contribution pattern of the VGI (Figure 4) mostly originated from the opportunistic nature (for more details, see [148,149]) of the voluntary contributions and affected by the different VGI completeness impacting factors (for more details, see Section 6.1.1). For instance, a visual interpretation of Figure 1 and Figure 4 demonstrated that generally, there were fewer contributions in areas where trees were surrounded by dense understory vegetation that had a high spectral similarity to tree crowns (i.e., low-contrast areas). Thus, the low degrees of completeness in parcel 5 could mainly have originated from the high level of the complexity because of the low contrast in this parcel.
The high PPV of crowdsourced data for the test plot (PPV = 0.971) indicated that the crowdsourced data in general had a very high thematic accuracy in terms of tree feature identification (i.e., thematic mapping accuracy). The PPV ranged from 0.926 (in parcel 4) to 1.000 (in parcels 2 and 6). The FDR, as a complement of the PPV, indicates the level of noise (originating from tree identification errors, the thematic mapping errors) in the crowdsourced data that were obtained without any correction for training of TM algorithm. The noise level of the crowdsourced training samples at the test plot level was very low (2.9%), and varied between 0% (for parcels 2 and 6) to 7.4% (for parcel 4). Figure 6 depicts the examples of the different types of occurred thematic mapping errors in the gathered VGI. In addition to the evident gross thematic mapping errors (referred to as type “A” errors) that occurred because of observers’ immense carelessness in the crowdsourcing task, some misidentification errors occurred because of the low contrast, limited spatial resolution, and existing complexities in the scene (particularly when the observer performed the visual interpretation task solely based on the true color image). In this context, the misidentification errors most frequently occurred in low-contrast areas (referred to as type “B” errors), in areas where the remains of removed trees were present (referred to as type “C” errors), and in areas with tree crown shadows (referred to as type “D” errors) (Figure 6).
Figure 7a shows the distribution of e p for the crowdsourced ITC observations using box plots. The average e p values for the crowdsourced tree observations of parcels 1 to 6 were 0.81 m, 0.73 m, 0.58 m, 0.77 m, 0.86 m, and 0.27 m respectively (the average of e p values for the test plot was 0.71 m i.e., 2.29 pixels). The medians and the average of the absolute e p values are approximately the same in all parcels (but with more fluctuations compare to diameter errors), except in parcel 6 where there were fewer crowdsourced contributions. In parcel 5, substantially more variation is observed in the box plot, possibly due to the higher level of the scene complexity (because of the low contrast) in this parcel that affected the quality of the tree centroid location task. While the e p was computed only for the correctly identified tree crowns, the visual screening of the outlier observations in the box plots (in Figure 7a) showed that the majority of the gross positional errors occurred in low-contrast areas, in areas where the tree crowns are overlapping, and in areas where the tree crowns were located near relatively larger shaded areas. The R M S E c c value was 0.83 m (i.e., 2.67 pixels) for the crowdsourced tree crowns in the test plot and ranged from 0.28 m (for parcel 6) to 1.01 m (for parcel 5). The e p values and R M S E c c value for the observations in the test plot indicated that the overall positional accuracy of the mapped crowdsourced tree crowns was not very high but was fair. According to the proposed mapping protocol for the volunteers in this study, we expected that the tagged points represented the centroids of tree crowns. Moreover, to create the templates, the image was sampled on the purported tagged tree points. Therefore, ideally, it is expected that the centroid of the tree crowns matches the centroid of the respective crowdsourced training samples and the respective template kernel. However, as crowdsourced observations were subjected to some positional errors, this assumption is violated. In this sense, the positional errors in the crowdsourced tree crowns centroids introduce some noise into TM algorithm.
The distributions of e d for the crowdsourced ITC observations are displayed in Figure 7b as box plots. The average of the absolute e d values for the crowdsourced ITC observations for the parcels 1 to 6 were 0.55 m, 0.50 m, 0.48 m, 0.55 m, 0.56 m, and 0.88 m, respectively (average of the absolute e d values for the test plot as a whole was 0.52 m, i.e., 1.67 pixels). The medians and the averages of the absolute e d values were approximately the same in all parcels (except in parcel 6, where fewer trees were observed by the volunteers). The box plots for parcels 1 to 5 are approximately balanced around the median value of 0 (with the similar variations) indicating that the chance of underestimation and overestimation of the diameter value was approximately the same over a large number of observations. While the e d was computed only for the correctly identified tree crowns, a visual screening of the outlier observations in the box plots shows, similarly to the e p errors, the majority of the gross diameter errors occurred in the low-contrast areas, areas with overlapping tree crowns, and areas where trees were adjacent to the large shaded areas. Furthermore, some gross errors seemed to have occurred because of the incorrect identification and measurement of the longest spread and the longest spread perpendicular to it. The R M S E c d was 0.76 m (i.e., 2.45 pixels) for the crowdsourced ITC observations in the entire test plot and ranged from 0.67 m (in parcel 2) to 0.93 m (in parcel 6). The e d values and R M S E c d value for the crowdsourced observations in the test plot indicated that the overall thematic accuracy of the measured diameters (i.e., the quantitative attribute accuracy) was fair.

5.2. ITC Detection Performance of the TM-CS

The quality of the tree crowns detected by TM-CS was evaluated. Table 6 presents the results. Quality measures were calculated for each individual parcel and at total parcel level (i.e., for all parcels combined). To assess the quality measures for all the parcels combined, we combined the trees detected by the TM algorithm in each parcel together into a single dataset.
The numbers of features detected by TM-CS as tree features (i.e., the number of TP and FP tree features) in each parcel ( N tm ) are reported in the Table 6. Using the six different TM templates, a total of 2690 tree features were detected over the six parcels (= i = 1 6 N tm ). A cross-checking of the TM outputs against the reference data showed that TM-CS was able to correctly detect (i.e., hit) 2448 trees over six parcels correctly (=number of TP tree features). Table 6 shows the degree of completeness of the detected trees by TM-CS. The degree of completeness ranged from 69.2% (in parcel 6) to 96.6% (in parcel 3). Overall, the TM-generated data achieved a relatively high degree of completeness (92.7%). Compared to the initial degrees of completeness of the crowdsourced data at the individual parcel and the total parcels level, the completeness of TM-CS was much higher in all parcels (from 45.3% in parcel 6 to 76.4% in parcel 5) and over the all parcels (70.2%). These results demonstrate the significant power and efficiency of the proposed approach for improving the degree of completeness of the gathered VGI in a crowdsourcing project for the remote mapping of urban orchard trees.
The cross-checking of the TM outputs against the reference data showed that a total of 192 existing trees over the all parcels remained undetected (i.e., missed) by TM-CS (= number of FN errors). A total of 242 features were incorrectly recognized as trees (= number of FP errors); 16 of which were overdetected trees (i.e., multiple hits within a single tree crown) and the rest (226 errors) were falsely detected trees (i.e., non-tree features incorrectly detected as tree features). Figure 8 illustrates some examples of the tree detection performance of the TM-CS. A visual interpretation of the error occurrences indicated that most of the FN errors occurred in locations with apparently unhealthy (e.g., trees with a low canopy density) or smaller (than the parcel’s average) trees. Overdetection FP errors occurred for trees with larger crown sizes (than the parcel’s average) or apparently multi-branches trees. Furthermore, our observations showed that the falsely detected FP errors frequently occurred at locations with dead (or almost dead) trees, locations with thick understory vegetation (e.g., shrubs), and locations on or close to the borders of a tree crown. Nevertheless, some of the falsely detected FP errors occurred far from non-vegetated areas. These types of FP errors mainly occurred in areas with sharp edges (particularly on the edges of passages exiting the test plot), where sharp variations in the intensity of the NIR1 band occurred, making the spectral and contextual pattern of the falsely detected feature resemble the spectral and contextual pattern of trees in the scene (where the bright pixels of the tree crown intersected with the dark pixels of the tree shadow in the NIR1 band). Figure 9a illustrates the spatial distribution of the detected, undetected, overdetected, and falsely detected trees by TM-CS.
The FDR, FNR, and F 1 values in Table 6 reflected the thematic mapping accuracy of the detected trees by TM-CS. The results of the accuracy evaluation show that the highest rate of FP errors (i.e., FDR) and FN errors (i.e., FNR) occurred in parcel 6 (0.550 and 0.308, respectively). In the other remaining parcels, the FDR and FNR values ranged from 0.037 in parcel 3 to 0.136 in parcel 2 and 0.033 in parcel 3 to 0.139 in parcel 1, respectively. The overall FDR (0.090) and FNR (0.073) values at the total parcels level indicated that the number of FP and FN errors were quite low (i.e., a low number of over- and under-detection errors occurred) compared to the number of successful ITC detections (TP detections). Table 6 shows that with the exception of parcel 6, which had a relatively low F 1 score (0.545), the F 1 scores in other parcels varied were quite high, ranging from 0.879 (in parcel 2) to 0.964 (in parcel 3). The TM-CS approach does not show a satisfactory ITC detection performance in parcel 6 because of the following reasons. The majority of the parcel 6 is covered by NTC land cover, and the existence of understory vegetation and sharp edges (the passage) caused the occurrence of FP errors (falsely detected trees). Furthermore, the previous studies showed that the TM algorithm-based NCC similarity measure could not perform well in the presence of the significant scale changes between the generated template and target feature [139]. In this sense, if the target tree crown is significantly larger than the modeled tree crown in the template, the TM algorithm produces FP error (overdetection error) or FP error (falsely detected trees) around the tree. On the other hand, if the target tree crown is significantly smaller than the template, the TM algorithm produces the FN error (under-detection error). The considerable variation in the sizes of the trees in parcel 6 resulted in the scale change problem that triggered the production of more FN and FP errors by the TM algorithm in this parcel. On the other hand, a limited number of trees in this parcel fit with the scale of the template that caused the production of few TP detections by TM algorithm. Therefore, the TM algorithm performance achieved a low signal-to-noise ratio.
At the total parcels level, TM-CS achieved a F 1 score of 0.918, which is also quite high. Based on these results, we generally concluded that the proposed ITC detection approach (based on collective sensing) in the urban orchards produced very satisfactory thematic mapping accuracy (i.e., achieved a high signal-to-noise ratio).
Ideally, a point feature generated by the TM algorithm should represent the centroid of the detected tree. However, different sources of error may lead to differences in the locations of the TM-detected tree centroids and the actual tree centroids (i.e., positional errors). Contrary to the thematic mapping accuracy of the detected trees, the positional accuracy of the correctly detected trees usually is not considered an important factor in most of the conventional tree inventory projects. However, as the imperfections in the VGI used in the proposed TM-CS approach could theoretically affect not only the thematic mapping accuracy but also the positional accuracy of the TM outputs, the positional accuracy of the correctly detected trees was evaluated in this study (using R M S E c c ) and is reported in Table 6. The R M S E c c values for the outputs of TM-CS ranged from 0.91 m (in parcel 3) to 1.27 m (in parcel 1). At all the parcels level, the proposed approach achieved an R M S E c c value of 1.02 m (i.e., 3.2 pixels), indicating that the tree crown centroids generated by TM-CS had a moderate positional accuracy overall.

5.3. The Impact of Using the Crowdsourced Training Samples Instead of the Reference Training Samples on the ITC Detection Performance of the Proposed Approach

The thematic and positional accuracies of ITCs detected by TM-CS are likely affected in part by thematic/positional inaccuracies of the crowdsourced training samples. To evaluate the potential impacts of these inaccuracies in the crowdsourced training samples, in this section, we calculated the quality measures for tree ITCs detected by TM-REF. Differences in the thematic/positional accuracies of TM-CS and TM-REF are likely due to differences in the accuracies of the crowdsourced and reference training datasets. As shown in Table 7, a total of 2691 features were detected as tree features over the 6 parcels by TM-REF (based on the reference training samples). Among these features, 2469 were correctly detected trees (= number of TP tree features), 172 were undetected trees (= number of FN tree features), and the remaining (i.e., 222 features) were incorrectly recognized as trees (= number of FP tree features).
The quality measures values (i.e., values of C (%), FDR and FNR, F 1 , and R M S E c c ) for the outputs of TM-CS (Table 6) and TM-REF (Table 7) were compared parcel by parcel and for all the parcels as a whole. As was expected, generally, the degree of completeness, thematic mapping accuracy, and positional accuracy of the detected trees were higher using the reference training samples. The main exceptions were the values of FDR in parcel 3 and 6 and the R M S E c c in parcel 6, which indicated slightly lower accuracies for TM-REF (because of the impact of the higher rate of FP errors generation in return for the generation of TP detections and the higher number of the generated TPs respectively). The cross-checking of the quality measures in the Table 6 and Table 7 at the total parcel level indicated that adopting the reference training samples for training the TM algorithm slightly increased the degree of completeness (by approximately 0.8%), and the thematic mapping accuracy in terms of reduced FDR and FNR (both by approximately −0.008) and increased F 1 (by approximately 0.008), and the positional accuracy of the output (by approximately 0.09 m). Figure 9b illustrates the spatial distribution of the detected, undetected, overdetected, and falsely detected trees by the TM-REF approach. The comparison of Figure 9a with Figure 9b revealed that the spatial distribution patterns of the detected, undetected, overdetected, and falsely detected trees by TM-CS and TM-REF were almost the same.
Errors in the outputs of the TM algorithm arise not only from the imprecision of the training samples but also the algorithm and the tuning of its parameters. As we used the same algorithm and the parameter settings for the both TM-CS and TM-REF, it seems that the small differences between the quality measure values in Table 6 and Table 7 at the total parcel level mainly originated from the existence of the thematic and positional errors in the crowdsourced training samples. At the test plot level, the prevalence of thematic mapping errors in the adopted crowdsourced training sample was 2.9%, the average positional error for these samples was 0.71 m, and the R M S E c c value for the samples is 0.83 m (for more details see Section 5.1). However, these levels of imperfections in the VGI resulted in a small difference in the performance of the proposed approach, TM-CS, compared to the performance of the TM-REF. Therefore, it can be generally concluded that the incorporation of VGI with VHR optical imagery through the proposed workflow results in promising performance in this pilot project and can pave the road for conducting further studies in this area.
While the TM-CS approach generally showed a promising performance in this pilot project, exploiting the solutions for enhancing the quality of TM-CS output allow us to remove/modify most of the existing inaccuracies in the TM-CS output. For example, a considerable number of the generated FP errors (falsely detected trees) in this study (e.g., the FP errors parcel 6) could be detected and filtered if the TM output is simply overlayed with the NTC and shadow layers (for more details, see Section 6.2).

5.4. The Results of the Preliminary Experiment on the ITC Detection Performance of the Proposed Approach under a Higher Level of Uncertainty in the Crowdsourced Training Samples

Table 8 presents the specifications and quality measures for the generated test training datasets and the created templates at the different FP:TP ratio thresholds in parcels 3, 5, and 6. It is logical that by increasing the level of noise in the test training datasets and reducing the TPs, the FDR should increase steadily. The values of μ T , μ F , σ T , and σ F fluctuated at the different thresholds as the TP records were randomly removed and TF records were randomly distributed in this experiment.
Table 9 demonstrates the result of the data quality measures for the output of the TM-CS under the different FP: TP ratio thresholds in parcels 3, 5, and 6. The results indicate that by increasing the FP: TP ratio value, the completeness and thematic mapping accuracy of the detected trees over the selected parcels generally decreased. Nevertheless, the random removal of the TP records and random generation and distribution of TF records at each step caused the occurrence of minor fluctuations in the values of some quality measures for some thresholds.
The adopted ITC detection approach generally showed a very good performance in terms of completeness and thematic mapping accuracy in the FP:TP ratio range of 0.25 to 2.00 in parcel 3. The quality assessment of TM-CS output at the FP: TP ratio value of 0.25 shows that the output has a very high degree of completeness (C = 96.5%) and thematic mapping accuracy (FDR = 0.040, FNR = 0.034, and F 1 = 0.962). The TM-CS output at the FP: TP ratio value of 2.00 achieved a high degree of completeness (C = 90.2%) and thematic mapping accuracy (FDR = 0.058, FNR = 0.097, and F 1 = 0.921). Table 9 shows that the quality of the detected trees deteriorated significantly at the FP:TP ratio value of 5.00 and above.
The proposed approach demonstrates a promising performance under the occurrence of the higher levels of errors in the training samples in parcel 5. The trees detected by TM-CS in parcel 5 had a high quality (C = 90.4%, FDR = 0.062, FNR = 0.096, and F 1 = 0.920), but the quality was lower than that of the trees detected by TM-CS in parcel 3 (C = 96.7%, FDR = 0.037, FNR = 0.033, and F 1 = 0.964). In this parcel, at the FP: TP ratio value of 0.25, the trees detected by the proposed approach achieved relatively high completeness and thematic mapping accuracy (C = 89.9%, FDR = 0.064, FNR = 0.100, and F 1 = 0.917). The TM-CS output at the FP: TP ratio value of 2.00 achieved an above average degree of completeness (C = 76.1%) and thematic mapping accuracy (FDR = 0.195, FNR = 0.238, and F 1 = 0.782).
Initially, the TM-CS output in parcel 6 has a relatively low quality (C = 69.2, FDR = 0.550, FNR = 0.308, and F 1 = 0.545). Consequently, the TM algorithm using the corrupted training samples did not achieve an acceptable quality level in this parcel.
The results of our preliminary experiment showed that the TM algorithm performance under the presence of synthetic errors in the training samples is not the same at the same FP:TP ratio values in the different parcels. In this context, it seems that several issues—e.g., the degree of homogeneity of TP image samples, the degree of heterogeneity of FP image samples, and the degree of homogeneity of the tree population in terms of geometric, contextual, and spectral characteristics in the parcel—affect the magnitude of the quality deterioration at each threshold FP:TP ratio in our study.

6. Discussion

6.1. The Feasibility of Large-Scale Remote Mapping of Urban Orchards Trees: Quality Assurance Issue

In addition to the sources of noise originating from the algorithms and methods that were adopted in the proposed framework, the imperfections in the different quality components (e.g., thematic accuracy, positional accuracy, completeness, and semantic consistency) of the crowdsourced training samples may introduce further noise into the proposed TM algorithm and affect its output quality. Nevertheless, it seems that among these different sources of introducing the noise (at the data level) into the TM algorithm, the thematic and positional uncertainties have more significance in our pilot project.
The quality assessment of the crowdsourced observations for the entire test plot showed that the obtained VGI overall had a relatively low level of completeness, a very high level of thematic mapping accuracy, and a fair positional accuracy. The quality assessment of the detected trees via the TM algorithm overall demonstrated a promising ITC detection performance regarding to the existing quality of crowdsourced training samples in our pilot project. The main goal of the pilot project was to develop and evaluate the feasibility of employing a collective sensing framework that can be used as a practical, accurate, and low-cost solution for inventory of orchard trees at the urban scale in future. Generally, the performance of the proposed TM-based ITC detection approach mainly depends on the quality of the input templates created using the crowdsourced training samples. Therefore, the success of a large-scale collective sensing project aiming to detect the ITC within the urban private orchards is tightly related the quality of the obtained VGI in the crowdsourcing phase of the project.
The approaches for improving VGI quality are categorized into ex-ante and ex-post approaches [150]. The ex-ante category refers to all the VGI quality improvement approaches in which the quality improvement task is performed before the submission of VGI. The ex-post category includes all the VGI quality improvement approaches in which the data quality improvement task is conducted after the submission of VGI [151]. The providing of training courses and auxiliary learning materials for the volunteers [14,152,153], using gamification [154,155,156], running BioBlitz [157] events, employing expert-based/community-based VGI quality screening methods (and removing/correcting the errors) [29,158], and using VGI quality screening methods (and removing/correcting the errors) based on intrinsic or extrinsic VGI quality indicators for detecting errors [30,90,150,158,159] are examples of ex-ante and ex-post approaches for VGI quality improvement. Nevertheless, before adopting any ex-ante or ex-post VGI quality improvement approaches, it is necessary to understand the initial impacts (positive and negative) of different factors on the quality level of the VGI, recognize their affecting mechanisms, and control them as best as possible to the achieve an acceptable quality level for conducting the supplementary quality improvement processes.
Contrary to the large body of literature that aimed to assess the quality of VGI in a particular crowdsourcing program (e.g., see [81,158,160,161,162]), fewer theoretical and experimental studies have explored the factors affecting the quality of the crowdsourced data (e.g., see [14,150,163,164]). Among the existing literature, to the best of our knowledge, no independent and comprehensive study has been conducted to explore the impacts of different internal and external factors on the quality of remotely sensed VGI. Furthermore, we found that up to now, no remote mapping program has been established to focus on the observation of trees in urban orchards. Therefore, the lack of sufficient information and similar practical experiences in this area make it difficult to draw robust conclusions or make concrete predictions about the expected quality of remotely sensed VGI for the large-scale mapping of trees in urban orchards. However, while conducting original research in this area fall outside the scope of the current study, it seems that exploring the feasibility of obtaining the minimum required VGI quality for conducting the proposed collective sensing framework in a large-scale orchard tree remote mapping program is still possible through reviewing and conceptually analyzing the outputs of existing relevant studies.

6.1.1. Remotely sensed VGI Completeness in an Orchard Tree Mapping Project: Impacting Factors and Vision

6.1.1.1. The Factors Impacting VGI Completeness

The participation of volunteers in CS projects has an opportunistic nature [148,149]. Volunteers mostly determine their preferred times for contributing, the locations of their contributions, and the amount of effort they would like to invest in a crowdsourcing project. Thus, there is no centralized control on a volunteer’s participation pattern in the process of crowdmapping. The degree of completeness of the VGI relies on the amount and pattern of these opportunistic contributions in a crowdsourcing project. Various factors may affect the volunteers’ participation rates and patterns, and consequently, the degree of completeness of the VGI. Previous empirical studies have shown that the completeness of the VGI may be correlated with demographic, social, economic, and human factors such as population density, experience, level of expertise, skill, motivations, mapping area preferences, mapping feature type, and the preferences, income, age, ethnicity, and education level of the residents of the neighborhood [87,160,165,166,167,168,169,170,171]. Furthermore, geographical factors such as distance from the centers and hubs, temporal factors such as temporal changes in participants’ activities, and environmental and physical factors such as the complexity of the mapping/measuring task may influence the degree of completeness of VGI [166,172,173,174].

6.1.1.2. The Vision for the VGI Completeness in Large-Scale Remote Mapping Orchard Tree Mapping Project

The interactions between the abovementioned impacting factors affect the volunteers’ participation rates and contribution patterns in a CS program and consequently influence the completeness degree of a large-scale crowdsourcing project. However, the previous studies have highlighted the importance of the motivational factors on the initial and long-term participation of volunteers in the CS projects [175,176] more significantly. The motivational factors highly impacting the engagement level of the volunteers in CS projects consequently affect the degree of completeness of the generated VGI. The destruction of private urban green spaces in Iran has raised many concerns, not only among environmental activists, but also among ordinary citizens. In this context, the high level of environmental awareness about the explicit and implicit effects of the urban orchard degradation among the environmental activists and their holistic perspective into the unique functions of urban orchard trees in sustaining the urban ecology may highly motivate this group of citizens to engage in orchard tree monitoring programs to address these concerns. On the other hand, many ordinary citizens may be interested engaging in such a program as they have experienced the negative consequences of the degradation of urban orchards (e.g., air and dust pollution) explicitly in their daily lives over the past years. Therefore, we expect that a large-scale remote mapping program for urban orchard tree inventories may attract a large number of contributions not only from the neophyte [150] volunteers but also from interested amateur [150] volunteers.
To our knowledge, so far, no study has been carried out to examine the VGI completeness in the large-scale remote mapping projects for inventory of urban trees (and specifically the urban orchard trees). However, one may expect that the aforementioned important motivational factors could sustain the engagement of the volunteers for continued participation in the proposed large-scale crowdsourcing project that consequently may lead to assuring the steady growth of the VGI completeness degree over time. Furthermore, a previous study [160] showed that a team of 150 volunteers, receiving minor help from another 1000 volunteers, were able to conduct a large-scale crowdmapping task (for approximately one-third of England) in a short period of time. Therefore, it can be generally concluded that reaching an acceptable degree of completeness in a reasonable period (to feed the TM ITC detection approach and the large-scale implementation of the proposed collective sensing framework) seems feasible, particularly if we employ ex-ante approaches (e.g., using gamification and running BioBlitz) for improving the completeness.

6.1.2. Remotely Sensed VGI Thematic and Positional Accuracy in Orchard Tree Mapping Project: Impacting Factors and Vision

6.1.2.1. The Factors Impacting VGI Thematic and Positional Accuracy

The VHR optical data disseminated through WebGIS are mostly the only available information channel for the volunteers for exploring the urban orchard environment in a remote mapping project for mapping of the trees in urban orchards. To extract the requested information by the remote mapping program, a volunteer visually examines the provided image and attempts to identify the target objects and measure their characteristics through a complex cognitive and logical process that comprises physical and mental activities [177]. Therefore, the thematic and positional accuracy of the generated remotely sensed VGI is mainly affected by the quality of performing the visual interpretation task by the volunteer.
Human factors play a critical role in visual interpretation of remotely sensed imagery [178]. The different characteristics of the image interpreter influence the performance of object recognition and classification and the measurement of qualitative and quantitative attributes of the identified object [124]. Therefore, visual interpretation is a subjective process [144,145], and the interpretation results of remote mapping tasks are variable among the different volunteers. Previous studies have demonstrated that the with human factors such as experience, expertise, education, motivations and willingness to obtain good results, short-term visual working memory capacity, age, gender, mental conditions, and fatigue may be correlated with the performance of visual interpretation of the imagery [124,145,179]. Contextual information, monocular cues, and image characteristics such as onsite knowledge from the remotely sensed environment, prior knowledge about the expected object types in the scene, texture, shadow, tone or color, size, shape, pattern, location, association, aspect, and spatial resolution are the other factors that may affect the visual interpretation performance [124,179,180,181,182,183,184]. Previous studies showed that the visual interpretation performance may be influenced by the feature type and the degree of the task complexity [124]. Furthermore, the external factors such as the working environment conditions and screen quality are the other impacting factors on the process of image interpretation [145].

6.1.2.2. The Vision for the VGI Thematic Mapping Accuracy in a Large-Scale Remote Mapping Orchard Tree Mapping Project

Van Coillie et al. [145] investigated the interpretation performance of a group of non-professional and professional volunteers in the digitization of six different types of features (lamp posts, water bodies, road networks, olive trees, olive parcels, and vine rows). In their experiment, the volunteers performed digitization using the provided VHR imageries and a developed web-based tool (for more details, see [145]). The findings of this study indicated that although the identification performance varied considerably across participants, on average, 94.73% of the purported trees (as point) detected by the participants were correctly identified (i.e., they were actually trees). This experiment showed that on average, the volunteers performed the tree identification task more accurately than five other identification tasks in the study. The authors argued that this very successful performance was mainly because of the lower degree of complexity of the tree identification task compared to the other image interpretation tasks assigned to the participants.
Similar to this study, we also observed in our pilot crowdsourcing project for mapping of the orchard trees that overall, the volunteers generated the VGI with a very high thematic mapping accuracy. Compared to a previous paper [145], we provided a supplementary source of information for volunteers by including the false color composite image alongside the true color image. The false color composite enhances the contrast between trees and the background, so one may expect that this arrangement reduced the degree of complexity of the tree identification task in low-contrast areas more significantly in our pilot study. Furthermore, the short training provided in our study introduced valuable prior knowledge about the expected characteristics of the tree features on the image; therefore, it seems that such an arrangement may have positively affected the quality of the volunteers’ tree identification performance. The existing monocular cues in our image (particularly the regular plantation pattern and the existence of the tree shadows) and the willingness of our interested amateur volunteers to produce high-quality observations can be considered other possible factors that helped the volunteers in performing the tree identification task more accurately.
So far, no study has examined the thematic mapping accuracy of VGI related to trees in remote mapping projects. However, we expect that the major factors impacting the thematic mapping accuracy of the trees mapped in a large-scale crowdsourcing project are similar to those we highlighted previously in relation to our pilot project. Generally, it is expected that the generated remotely sensed VGI in a large-scale orchard tree mapping project can achieve a high thematic mapping accuracy level, particularly if a set of ex-ante and ex-post approaches (e.g., training the participants and filtering the evident gross identification errors using the generated land use maps) are adopted to enhance the quality of the VGI.

6.1.2.3. The Vision for the VGI Positional Accuracy in a Large-Scale Remote Mapping Orchard Tree Mapping Project

As we discussed, similar to the tree identification task, the positional accuracy of the identified trees also relies on how well the volunteer performs the visual interpretation. Van Coillie et al. [145] also examined the positional accuracy of the trees correctly identified by volunteers. Similar to our findings, they found that the overall positional accuracy of the digitized trees (as point features) by the volunteers was decent but far from perfect.
As each of the assigned visual interpretation tasks in a previous work [38] were relatively monotonous tasks (like our crowdsourcing project), they also studied the changes in participants’ performance over time due to attention loss. Their findings demonstrated that the positional accuracy of the identified features by the nonprofessional and professional volunteers both considerably declined over time due to mental fatigue. Nevertheless, we generally expect that the willingness of the interested amateur to generate high-quality VGI is an effective factor for maintaining the positional accuracy of the VGI in the acceptable level in a large-scale orchard tree mapping project, particularly if ex-ante (e.g., providing incentives such as prize to maintain the participants’ motivation to perform well) and ex-post approaches (e.g., adopting the intrinsic approaches for filtering the gross positional errors) are adopted to enhance the positional accuracy of the generated remotely sensed VGI.

6.2. Solutions for Enhancing the Quality of the Proposed ITC Detection Approach Output (TM-CS Output)

In the following, we will briefly discuss the main solutions that can be adopted to enhance the quality of TM-CS output (while the currently used VHR optical remotely sensed data is employed). In this sense, the pre-mapping (i.e., pre-classification) level (stage), mapping (i.e., classification) level (stage), and post-mapping (i.e., post-classification) level (stage) solutions for enhancing the quality of the proposed ITC detection approach output will be introduced in the following sections.

6.2.1. Pre-Mapping Level and Mapping Level Solutions

6.2.1.1. Solutions for Dealing with the Uncertainty in Crowdsourced Training Samples

It is widely known that the uncertainties in the training samples may propagate to the output of the mapping algorithms [114,119,185,186]. In this context, to enhance the quality of the mapping output, a solution at data level or a solution at the algorithm level can be adopted. The data level solution refers to a pre-mapping level solution that enhances the quality of the mapping output through quality improvement of the inputted training data into the mapping algorithm. The algorithm level solution is a mapping level solution that enhances the quality of the mapping output by employing a proper mapping algorithm that can reduce the negative impact of the existing errors in the inputted training data into the mapping algorithm over the mapping output. In addition to these two main solutions, a hybrid approach by combining a set of both data level and algorithm level solutions can also be adopted for enhancing the quality of mapping output.
When the VGI is used for training a mapping algorithm, the ex-ante and ex-post approaches for VGI quality improvement (for more details see Section 6.1) are considered solutions at the data level for enhancing the quality of the mapping output. To enhance the quality of the TM algorithm’s output in this pilot study, we only used two following relatively simple ex-ante approaches for improving the quality of the crowdsourced samples: (1) we provided a short training for the volunteers, and (2) we provided the false color composite image alongside the true color image as a supplementary source of information for the volunteers (for more details see Section 6.1.2.2). However, a set of more effective ex-ante and ex-post VGI quality improvement approaches—particularly the approaches for flagging the errors in the crowdsourced data (e.g., the validation of VGI against land use/land cover map [162], and the validation of VGI using data and contributors’ indicators [158,187]) can be adopted to enhance the output quality of the adopted TM algorithm for ITC detection.
It is not always possible or computationally, labor, or time efficient [114] to deal with the errors in VGI solely by employing solutions at the data level (e.g., removing/correcting all of the errors in the crowdsourced data). Previous studies [114,188,189] have found that some classification and mapping algorithms are more tolerant to the occurrence of errors in the training data than others. Therefore, exploiting a solution at the algorithm level in terms of adopting the error tolerant (a.k.a. noise tolerant) algorithms may somewhat mitigate the effects of error propagation to the mapping output. It was proven that some of the similarity measures that are used for the TM algorithm are more noise robust compared to others (for more details see [190,191]). In particular, previous studies have discussed that the TM algorithm based on the NCC similarity measure, which we adopted in this study, is relatively robust to noise [190,192]. The results of our preliminary experiment generally support these previous findings (for more details see Section 5.4). However, more rigorous studies are needed in future to investigate the noise robustness degree of the different existing similarity measures for the TM algorithm in order to determine the best solutions at the algorithm level in this area for handling the imperfections in the crowdsourced training samples.

6.2.1.2. Solutions for Dealing with the Other Sources of Uncertainty

In addition to imperfections in the training data, other sources of error in the pre-processing and processing steps of a mapping task (for more details see [193]) may also cause the occurrence of errors in the mapping output. Different solutions can be adopted at the pre-mapping and mapping levels to enhance the quality of the adopted TM-CS output (based on NCC similarity measure) approach. While some of the solutions in this category of approaches for enhancing mapping output quality are common to all image classification approaches, we will mention to some more specific examples of this category of approaches according to the specifications of our project in this section.
In an ideal case where the tree population in the study area is perfectly homogeneous (in terms of the geometric, contextual, and spectral characteristics of the trees in the population), obtaining only one image sample from the study area would be sufficient for detecting all of the ITCs in that study area by the TM algorithm. However, as we discussed earlier, in practice, different degrees of heterogeneity can be observed in the tree populations. Therefore, a single sample from a heterogeneous tree population cannot fully represent all of the general instances (classes) of a diverse population. Consequently, the TM algorithm that was trained based on this sample may not successfully detect all of the ITCs in the population. On the other hand, applying a TM algorithm using a single template created based on the extremely diverse training samples obtained from a heterogeneous tree population may not produce a satisfactory output either. To enhance the performance of the TM-CS in heterogeneous tree populations, it is necessary to classify the trees into more homogeneous classes and then generate a specific template for each class of trees in the population (for more details see Section 4.1.3).
In this study, we adopted solutions at the pre-mapping and mapping levels. In this sense, we first classified the tree population into more homogeneous classes of trees (by subdividing the test plot into parcels). Then, we trained the TM-CS using template generated from the crowdsourced samples obtained for each class (i.e., each parcel). Finally, we implemented the TM-CS for each class to detect all of the ITCs from that class (i.e., all of the ITCs in that parcel) (for more details see Section 4.1.3). It is noteworthy that this solution is more suitable for case studies where each of the parcels in the study area is relatively homogenous (i.e., each parcel only hosts a single class of trees) and there is at least one crowdsourced sample for each parcel in the study area (i.e., the crowdsourced data is complete in terms of spatial completeness (coverage)).
A more sophisticated solution for enhancing the performance of tree mapping by TM-CS in this area is to use a multi-template matching approach [194] by generating a specific template for each class of trees and then applying the TM algorithm to the entire study area by using the multiple templates (to find the best match). Previous studies [100,102,105] have demonstrated that creating multiple templates may improve the tree detection performance of the TM algorithm in both single-species and mixed-species stands because doing so helps to compensate for variations in viewing geometry and tree size in both types of stands as well as tree shape and spectral characteristics in mixed-species stands. The multi-template matching solution is more suitable for case studies where there is at least one crowdsourced sample for each of the main classes of trees present in the study area (i.e., the crowdsourced data is complete in terms of thematic completeness (regarding to the tree classes)).
In this study, we implemented the TM-CS only on the planted segments (i.e., parcels), and nonplanted segments were masked out in the mapping process. As we discussed earlier, the FP error in the output of TM-CS occurred because of existence of a degree of similarity between the falsely detected features (greater than or equal to the selected match threshold). In this sense, our adopted solution at the mapping level may enhance the quality of TM-CS output by avoiding of the FP tree feature generation in nonplanted areas. The proper ancillary data on land use/land cover can be used to improve the excluding of nonplanted areas, which can serve as a mapping-level solution for enhancing TM-CS quality.

6.2.2. Post-Mapping Level Solutions

Regardless of the source of error, some of the errors in the TM-CS output can be simply detected and removed after conducting of TM-CS using a post-mapping level solution. For example, the quality of TM-CS output can be enhanced by validating the output against the land cover/land use map that was generated by classification of remotely sensed data or obtained from ancillary data sources.
Validating the detected tree features using a rule-based validation approach is another example of a post-mapping level solution. In this approach, contextual information and expert-knowledge (e.g., the relationship between a tree and its adjacent shadow) can be adopted to filter the errors within the output.
The crowdsourcing technique can be adopted for quality assessment and enhancement of TM outputs through a post-mapping approach. In this context, the trees detected by TM algorithm can be disseminated online as a base tree map alongside other information such as VHR satellite imagery from the study area to enable the volunteers to participate in screening and improving the thematic and positional accuracy of the detected trees through a community-based approach [29,158].

7. Conclusions and Future Works

This study proposed a collective sensing approach incorporating VGI and VHR optical remotely sensed data for the mapping of individual trees in urban orchards. The proposed approach detects trees in VHR optical imagery by training a TM algorithm using (imperfect) crowdsourced information on ITC locations. The trees detected using the proposed TM-CS approach achieved a relatively high degree of completeness, a very satisfactory thematic accuracy, and a moderate positional accuracy in our pilot study site. The promising ITC detection performance of the TM-CS approach in this pilot project and the necessity of developing low-cost and accurate fine-scale mapping approaches for constructing large-scale inventories of urban orchard trees (particularly trees located on private properties) justify the need for further large-scale studies in this area. Tuning the different parameters of the TM algorithm, including the template match threshold and the size of the image sample and the generated template, fall outside the scope of the current study; however, further investigation in this area is necessary to promote the ITC detection performance and error-tolerance of the proposed approach. In future works, the feasibility of using image analysis-based approaches for the automatic prediction of the mean tree crown diameter of parcels as well as a multi-template matching approach should be studied. A further investigation adopting a more rigorous model for simulating the different patterns of errors and employing a robust sensitivity analysis method is also needed in the future to further study the impact of imperfect crowdsourced samples on the ITC detection performance of TM algorithm. A broader set of solutions at different levels (pre-mapping, mapping, and post-mapping levels) can be adopted in the future to enhance the output quality of the proposed approach. Furthermore, the opportunity to exploit more noise-robust similarity measures for the TM algorithm should be investigated in future works as a potential algorithm level solution to the errors in the crowdsourced data. Finally, in future works, the proposed TM-based approach should be tested in more heterogeneous and complex scenes to determine its performance in such cases.

Author Contributions

Conceptualization, H.V.; Methodology, H.V.; Data curation, H.V.; Software, H.V.; Formal analysis, H.V.; Investigation, H.V.; Validation, H.V.; Project administration, H.V.; Resources, H.V.; Visualization, H.V.; Writing—original draft, H.V.; Supervision, W.Y. and B.K.; Writing—review & editing, H.V., B.K., B.A.J., L.M.M. and W.Y.

Funding

This research received no external funding.

Conflicts of Interest

The authors declare no conflicts of interest.

References

  1. Irvine, K.N.; Fuller, R.A.; Devine-Wright, P.; Tratalos, J.; Payne, S.R.; Warren, P.H.; Lomas, K.J.; Gaston, K.J. Ecological and psychological value of urban green space. In Dimensions of the Sustainable City; Jenks, M., Jones, C., Eds.; Springer: Dordrecht, The Netherlands, 2010; pp. 215–237. [Google Scholar]
  2. Dunnett, N.; Qasim, M. Perceived benefits to human well-being of urban gardens. HortTechnology 2000, 10, 40–45. [Google Scholar]
  3. Pearson, L.J.; Pearson, L.; Pearson, C.J. Sustainable urban agriculture: Stocktake and opportunities. Int. J. Agric. Sustain. 2010, 8, 7–19. [Google Scholar] [CrossRef]
  4. Lei, W.; Zhi, W.; Lianyou, L.; Si, H. Research in assessment and optimization for ecological functions of urban garden plants. Environ. Pollut. Control 2006, 1, 016. [Google Scholar]
  5. Marshman, K. The Fruits of Nature: Investigating the Prospects for Fruit Trees on Halifax School Grounds. Bachelor’s Thesis, Dalhousie University, Halifax, NS, Canada, 2015. [Google Scholar]
  6. McLain, R.; Poe, M.; Hurley, P.T.; Lecompte-Mastenbrook, J.; Emery, M.R. Producing edible landscapes in Seattle’s urban forest. Urban For. Urban Green. 2012, 11, 187–194. [Google Scholar] [CrossRef]
  7. Horák, J.; Rom, J.; Rada, P.; Šafářová, L.; Koudelková, J.; Zasadil, P.; Halda, J.P.; Holuša, J. Renaissance of a rural artifact in a city with a million people: Biodiversity responses to an agro-forestry restoration in a large urban traditional fruit orchard. Urban Ecosyst. 2017, 21, 263–270. [Google Scholar] [CrossRef]
  8. Cameron, R.W.; Blanuša, T.; Taylor, J.E.; Salisbury, A.; Halstead, A.J.; Henricot, B.; Thompson, K. The domestic garden—Its contribution to urban green infrastructure. Urban For. Urban Green. 2012, 11, 129–137. [Google Scholar] [CrossRef]
  9. Du, S.; Shi, P.; Van Rompaey, A. The relationship between urban sprawl and farmland displacement in the Pearl River Delta, China. Land 2013, 3, 34–51. [Google Scholar] [CrossRef]
  10. Lin, B.B.; Philpott, S.M.; Jha, S. The future of urban agriculture and biodiversity-ecosystem services: Challenges and next steps. Basic Appl. Ecol. 2015, 16, 189–201. [Google Scholar] [CrossRef]
  11. Tubby, K.; Webber, J. Pests and diseases threatening urban trees under a changing climate. For. Int. J. For. Res. 2010, 83, 451–459. [Google Scholar] [CrossRef] [Green Version]
  12. Nielsen, A.B.; Östberg, J.; Delshammar, T. Review of urban tree inventory methods used to collect data at single-tree level. Arboric. Urban For. 2014, 40, 96–111. [Google Scholar]
  13. Viau, A.A.; Jang, J.-D.; Payan, V.; Devost, A. The use of airborne LIDAR and multispectral sensors for orchard trees inventory and characterization. FRUTIC 2005, 5, 12–16. [Google Scholar]
  14. Roman, L.A.; Scharenbroch, B.C.; Östberg, J.P.A.; Mueller, L.S.; Henning, J.G.; Koeser, A.K.; Sanders, J.R.; Betz, D.R.; Jordan, R.C. Data quality in citizen science urban tree inventories. Urban For. Urban Green. 2017, 22, 124–135. [Google Scholar] [CrossRef]
  15. Blaschke, T.; Hay, G.J.; Weng, Q.; Resch, B. Collective sensing: Integrating geospatial technologies to understand urban systems—An overview. Remote Sens. 2011, 3, 1743–1776. [Google Scholar] [CrossRef]
  16. Atzmueller, M.; Becker, M.; Mueller, J. Collective Sensing Platforms. In Participatory Sensing, Opinions and Collective Awareness; Loreto, V., Haklay, M., Hotho, A., Servedio, V.D.P., Stumme, G., Theunis, J., Tria, F., Eds.; Springer International Publishing: Cham, Switzerland, 2017; pp. 115–133. [Google Scholar]
  17. Resch, B.; Blaschke, T. Fusing human and technical sensor data: Concepts and challenges. SIGSPATIAL Spec. 2015, 7, 29–35. [Google Scholar] [CrossRef]
  18. Sagl, G.; Resch, B.; Blaschke, T. Contextual sensing: Integrating contextual information with human and technical geo-sensor information for smart cities. Sensors 2015, 15, 17013–17035. [Google Scholar] [CrossRef] [PubMed]
  19. Heinzel, J.N.; Weinacker, H.; Koch, B. Full automatic detection of tree species based on delineated single tree crowns–a data fusion approach for airborne laser scanning data and aerial photographs. In Proceedings of the SilviLaser 2008, Edinburgh, UK, 17–19 September 2008. [Google Scholar]
  20. Leckie, D.; Gougeon, F.; Hill, D.; Quinn, R.; Armstrong, L.; Shreenan, R. Combined high-density lidar and multispectral imagery for individual tree crown analysis. Can. J. Remote Sens. 2003, 29, 633–649. [Google Scholar] [CrossRef] [Green Version]
  21. La, H.P.; Eo, Y.D.; Chang, A.; Kim, C. Extraction of individual tree crown using hyperspectral image and LiDAR data. KSCE J. Civ. Eng. 2015, 19, 1078–1087. [Google Scholar] [CrossRef]
  22. Secord, J.; Zakhor, A. Tree detection in urban regions using aerial lidar and image data. IEEE Geosci. Remote Sens. Lett. 2007, 4, 196–200. [Google Scholar] [CrossRef]
  23. Pehani, P.; Čotar, K.; Marsetič, A.; Zaletelj, J.; Oštir, K. Automatic geometric processing for very high resolution optical satellite data based on vector roads and orthophotos. Remote Sens. 2016, 8, 343. [Google Scholar] [CrossRef]
  24. Błaszczak-Bąk, W.; Janowski, A. Proposed Technology of LiDAR data processing to build DTM. Rep. Geod. 2009, 2009, 29–38. [Google Scholar]
  25. Zhang, J. Multi-source remote sensing data fusion: Status and trends. Int. J. Image Data Fusion 2010, 1, 5–24. [Google Scholar] [CrossRef]
  26. Pohl, C. Multisensor image fusion guidelines in remote sensing. IOP Conf. Ser. Earth Environ. Sci. 2016, 34, 012026. [Google Scholar] [CrossRef] [Green Version]
  27. Resch, B. People as sensors and collective sensing-contextual observations complementing geo-sensor network measurements. In Progress in Location-Based Services; Krisp, J.M., Ed.; Springer: Berlin/Heidelberg, Germany, 2013; pp. 391–406. [Google Scholar]
  28. Goodchild, M.F. Citizens as sensors: The world of volunteered geography. GeoJournal 2007, 69, 211–221. [Google Scholar] [CrossRef]
  29. Goodchild, M.F.; Li, L. Assuring the quality of volunteered geographic information. Spat. Stat. 2012, 1, 110–120. [Google Scholar] [CrossRef]
  30. Senaratne, H.; Mobasheri, A.; Ali, A.L.; Capineri, C.; Haklay, M. A review of volunteered geographic information quality assessment methods. Int. J. Geogr. Inf. Sci. 2017, 31, 139–167. [Google Scholar] [CrossRef]
  31. Skurikhin, A.N.; McDowell, N.G.; Middleton, R.S. Unsupervised individual tree crown detection in high-resolution satellite imagery. J. Appl. Remote Sens. 2016, 10, 010501. [Google Scholar] [CrossRef]
  32. Ardila, J.P.; Bijker, W.; Tolpekin, V.A.; Stein, A. Context-sensitive extraction of tree crown objects in urban areas using VHR satellite images. Int. J. Appl. Earth Obs. Geoinf. 2012, 15, 57–69. [Google Scholar] [CrossRef] [Green Version]
  33. Chen, L.; Chiang, T.; Teo, T. Fusion of LIDAR data and high resolution images for forest canopy modelling. In Proceedings of the 26th Asian Conference on Remote Sensing, Hanoi, Vietnam, 7–11 November 2005. [Google Scholar]
  34. Dogon-Yaro, M.; Kumar, P.; Abdul Rahman, A.; Buyuksalih, G. Semi-Automated Approach for Mapping Urban Trees from Integrated Aerial LiDAR Point Cloud and Digital Imagery Datasets. Master’s Thesis, Universiti Teknologi Malaysia, Faculty of Geoinformation and Real Estate, Johor Bahru, Malaysia, 2016. [Google Scholar]
  35. Zhen, Z.; Quackenbush, L.J.; Zhang, L. Trends in automatic individual tree crown detection and delineation—Evolution of LiDAR data. Remote Sens. 2016, 8, 333. [Google Scholar] [CrossRef]
  36. Quackenbush, L.J.; Hopkins, P.F.; Kinn, G.J. Using template correlation to identify individual trees in high resolution imagery. In Proceedings of the American Society for Photogrammetry & Remote Sensing (ASPRS) 2000 Annual Conference, Washington, DC, USA, 22–26 May 2000. [Google Scholar]
  37. Olofsson, K.; Wallerman, J.; Holmgren, J.; Olsson, H. Tree species discrimination using Z/I DMC imagery and template matching of single trees. Scand. J. For. Res. 2006, 21, 106–110. [Google Scholar] [CrossRef]
  38. OpenStreetMap Wiki. Pick Your Mapping Technique. Availabe online: http://wiki.openstreetmap.org/w/index.php?title=Pick_your_mapping_technique&oldid=1511301 (accessed on 11 October 2017).
  39. OpenStreetMap Wiki. Armchair Mapping. Availabe online: http://wiki.openstreetmap.org/w/index.php?title=Armchair_mapping&oldid=1497930 (accessed on 11 October 2017).
  40. Brunelli, R. Template Matching Techniques in Computer Vision: Theory and Practice; John Wiley & Sons: Hoboken, NJ, USA, 2009. [Google Scholar]
  41. Wood, J.P. Tree Inventories and GIS in Urban Forestry. Master’s Thesis, Virginia Polytechnic Institute and State University, Blacksburg, VA, USA, 1999. [Google Scholar]
  42. Liang, X.; Kankare, V.; Hyyppä, J.; Wang, Y.; Kukko, A.; Haggrén, H.; Yu, X.; Kaartinen, H.; Jaakkola, A.; Guan, F.; et al. Terrestrial laser scanning in forest inventories. ISPRS J. Photogramm. Remote Sens. 2016, 115, 63–77. [Google Scholar] [CrossRef] [Green Version]
  43. Jones, T.; Marzen, L.; Chappelka, A. Mapping, modeling, and estimating tree measurements of urban tree canopy structure using terrestrial LiDAR scanning. Pap. Appl. Geogr. 2016, 2, 236–242. [Google Scholar] [CrossRef]
  44. Mikita, T.; Janata, P.; Surový, P. Forest stand inventory based on combined aerial and terrestrial close-range photogrammetry. Forests 2016, 7, 165. [Google Scholar] [CrossRef]
  45. Moskal LM, Zheng G: Retrieving forest inventory variables with terrestrial laser scanning (TLS) in urban heterogeneous forest. Remote Sens. 2011, 4, 1–20.
  46. Pause, M.; Schweitzer, C.; Rosenthal, M.; Keuck, V.; Bumberger, J.; Dietrich, P.; Heurich, M.; Jung, A.; Lausch, A. In situ/remote sensing integration to assess forest health—A review. Remote Sens. 2016, 8, 471. [Google Scholar] [CrossRef]
  47. Ward, K.T.; Johnson, G.R. Geospatial methods provide timely and comprehensive urban forest information. Urban For. Urban Green. 2007, 6, 15–22. [Google Scholar] [CrossRef]
  48. Koch, B.; Heyder, U.; Weinacker, H. Detection of individual tree crowns in airborne lidar data. Photogramm. Eng. Remote Sens. 2006, 72, 357–363. [Google Scholar] [CrossRef]
  49. Hadaś, E. An overview of methods for tree geometric parameter estimation from ALS data in the context of their application for agricultural trees. Acta Scientiarum Polonorum Geodesia Descriptio Terrarum 2015, 14, 3–4. [Google Scholar]
  50. Mathews, A.J.; Jensen, J.L. An airborne LiDAR-based methodology for vineyard parcel detection and delineation. Int. J. Remote Sens. 2012, 33, 5251–5267. [Google Scholar] [CrossRef]
  51. Ke, Y.; Quackenbush, L.J. A review of methods for automatic individual tree-crown detection and delineation from passive remote sensing. Int. J. Remote Sens. 2011, 32, 4725–4747. [Google Scholar] [CrossRef]
  52. Larsen, M.; Eriksson, M.; Descombes, X.; Perrin, G.; Brandtberg, T.; Gougeon, F.A. Comparison of six individual tree crown detection algorithms evaluated under varying forest conditions. Int. J. Remote Sens. 2011, 32, 5827–5852. [Google Scholar] [CrossRef]
  53. Karlson, M.; Reese, H.; Ostwald, M. Tree crown mapping in managed woodlands (parklands) of semi-arid West Africa using WorldView-2 imagery and geographic object based image analysis. Sensors 2014, 14, 22643–22669. [Google Scholar] [CrossRef] [PubMed]
  54. Chen, Y.; Su, W.; Li, J.; Sun, Z. Hierarchical object oriented classification using very high resolution imagery and LIDAR data over urban areas. Adv. Space Res. 2009, 43, 1101–1110. [Google Scholar] [CrossRef]
  55. Wang, L. A multi-scale approach for delineating individual tree crowns with very high resolution imagery. Photogramm. Eng. Remote Sens. 2010, 76, 371–378. [Google Scholar] [CrossRef]
  56. Hirschmugl, M.; Ofner, M.; Raggam, J.; Schardt, M. Single tree detection in very high resolution remote sensing data. Remote Sens. Environ. 2007, 110, 533–544. [Google Scholar] [CrossRef]
  57. Ke, Y.; Quackenbush, L.J. A comparison of three methods for automatic tree crown detection and delineation from high spatial resolution imagery. Int. J. Remote Sens. 2011, 32, 3625–3647. [Google Scholar] [CrossRef]
  58. She, T.; Ehsani, R.; Robbins, J.; Leiva, J.N.; Owen, J. Applications of small UAV systems for tree and nursery inventory management. In Proceedings of the 12th International Conference on Precision Agriculture, Sacramento, CA, USA, 20–23 July 2014. [Google Scholar]
  59. Leiva, J.N.; Robbins, J.; Saraswat, D.; She, Y.; Ehsani, R. Evaluating remotely sensed plant count accuracy with differing unmanned aircraft system altitudes, physical canopy separations, and ground covers. J. Appl. Remote Sens. 2017, 11, 036003. [Google Scholar] [CrossRef]
  60. Gomes, M.F.; Maillard, P. Detection of tree crowns in very high spatial resolution images. In Environmental Applications of Remote Sensing; InTech: London, UK, 2016. [Google Scholar]
  61. Kuzmin, A.; Korhonen, L.; Manninen, T.; Maltamo, M. Automatic segment-level tree species recognition using high resolution aerial winter imagery. Eur. J. Remote Sens. 2016, 49, 239–259. [Google Scholar] [CrossRef]
  62. Recio, J.; Hermosilla, T.; Ruiz, L. Automated extraction of agronomic parameters in orchard plots from high-resolution imagery. Options Méditerranéennes, Série B Etudes et Recherches 2012, 67, 161–174. [Google Scholar]
  63. Recio, J.A.; Hermosilla, T.; Ruiz, L.A.; Palomar, J. Automated extraction of tree and plot-based parameters in citrus orchards from aerial images. Comput. Electron. Agric. 2013, 90, 24–34. [Google Scholar] [CrossRef]
  64. Mahour, M.; Tolpekin, V.; Stein, A. Tree detection in orchards from VHR satellite images using scale-space theory. In Proceedings of the SPIE Remote Sensing 2016, Edinburgh, UK, 26–29 September 2016; p. 100040. [Google Scholar]
  65. Srestasathiern, P.; Rakwatin, P. Oil palm tree detection with high resolution multi-spectral satellite imagery. Remote Sens. 2014, 6, 9749–9774. [Google Scholar] [CrossRef]
  66. Pouliot, D.A.; King, D.J.; Bell, F.W.; Pitt, D.G. Automated tree crown detection and delineation in high-resolution digital camera imagery of coniferous forest regeneration. Remote Sens. Environ. 2002, 82, 322–334. [Google Scholar] [CrossRef]
  67. Thomas, N.; Hendrix, C.; Congalton, R.G. A comparison of urban mapping methods using high-resolution digital imagery. Photogramm. Eng. Remote Sens. 2003, 69, 963–972. [Google Scholar] [CrossRef]
  68. Zarco-Tejada, P.J.; Diaz-Varela, R.; Angileri, V.; Loudjani, P. Tree height quantification using very high resolution imagery acquired from an unmanned aerial vehicle (UAV) and automatic 3D photo-reconstruction methods. Eur. J. Agron. 2014, 55, 89–99. [Google Scholar] [CrossRef] [Green Version]
  69. Korpela, I. Individual Tree Measurements by Means of Digital Aerial Photogrammetry. Ph.D. Thesis, University of Helsinki, Helsinki, Finland, 2004. [Google Scholar]
  70. Hobi, M.L.; Ginzler, C. Accuracy assessment of digital surface models based on WorldView-2 and ADS80 stereo remote sensing data. Sensors 2012, 12, 6347–6368. [Google Scholar] [CrossRef] [PubMed]
  71. Kattenborn, T.; Sperlich, M.; Bataua, K.; Koch, B. Automatic single tree detection in plantations using UAV-based photogrammetric point clouds. Int. Arch. Photogramm. Remote Sens. Spat. Inf. Sci. 2014, XL-3, 139–144. [Google Scholar] [CrossRef]
  72. Birdal, A.C.; Avdan, U.; Türk, T. Estimating tree heights with images from an unmanned aerial vehicle. Geomat. Nat. Hazards Risk 2017, 8, 1144–1156. [Google Scholar] [CrossRef]
  73. Gatziolis, D.; Lienard, J.F.; Vogs, A.; Strigul, N.S. 3D tree dimensionality assessment using photogrammetry and small unmanned aerial vehicles. PLoS ONE 2015, 10, e0137765. [Google Scholar] [CrossRef] [PubMed]
  74. Wallace, L.; Lucieer, A.; Watson, C.; Turner, D. Development of a UAV-LiDAR system with application to forest inventory. Remote Sens. 2012, 4, 1519–1543. [Google Scholar] [CrossRef]
  75. Puliti, S.; Ørka, H.O.; Gobakken, T.; Næsset, E. Inventory of small forest areas using an unmanned aerial system. Remote Sens. 2015, 7, 9632–9654. [Google Scholar] [CrossRef] [Green Version]
  76. Constantinides, E.; Fountain, S.J. Web 2.0: Conceptual foundations and marketing issues. J. Direct Data Digit. Market. Pract. 2008, 9, 231–244. [Google Scholar] [CrossRef]
  77. Fast, V.; Rinner, C. A systems perspective on volunteered geographic information. ISPRS Int. J. Geo-Inf. 2014, 3, 1278–1292. [Google Scholar] [CrossRef]
  78. Klonner, C.; Eckle, M.; Usón, T.; Höfle, B. Quality improvement of Remotely Volunteered Geographic Information via country-specific mapping instructions. In Proceedings of the 14th International Conference on Information Systems for Crisis Response and Management, Albi, France, 24 May 2017. [Google Scholar]
  79. Ebrahim, M.; Minghini, M.; Molinari, M.E.; Torrebruno, A. MiniMapathon: Mapping the world at 10 years old. In Proceedings of the 8th Annual International Conference on Education and New Learning Technologies (EDULEARN 2016), Barcelona, Spain, 4–6 July 2016; pp. 4200–4208. [Google Scholar]
  80. Jonietz, D.; Antonio, V.; See, L.; Zipf, A. Highlighting current trends in Volunteered Geographic Information. SPRS Int. J. Geo-Inf. 2017, 6, 202. [Google Scholar] [CrossRef]
  81. Keßler, C.; De Groot, R.T.A. Trust as a proxy measure for the quality of volunteered geographic information in the case of OpenStreetMap. In Geographic Information Science at the Heart of Europe; Springer: Berlin/Heidelberg, Germany, 2013; pp. 21–37. [Google Scholar]
  82. See, L.; Mooney, P.; Foody, G.; Bastin, L.; Comber, A.; Estima, J.; Fritz, S.; Kerle, N.; Jiang, B.; Laakso, M. Crowdsourcing, citizen science or volunteered geographic information? The current state of crowdsourced geographic information. ISPRS Int. J. Geo-Inf. 2016, 5, 55. [Google Scholar] [CrossRef]
  83. Haklay, M. Citizen science and volunteered geographic information: Overview and typology of participation. In Crowdsourcing Geographic Knowledge; Springer: Berlin/Heidelberg, Germany, 2013; pp. 105–122. [Google Scholar]
  84. Cunha, D.G.; Marques, J.F.; Resende, J.C.; Falco, P.B.; Souza, C.M.; Loiselle, S.A. Citizen science participation in research in the environmental sciences: Key factors related to projects’ success and longevity. Anais da Academia Brasileira de Ciências 2017, 89, 2229–2245. [Google Scholar] [CrossRef] [PubMed]
  85. Johnson, M.F.; Hannah, C.; Acton, L.; Popovici, R.; Karanth, K.K.; Weinthal, E. Network environmentalism: Citizen scientists as agents for environmental advocacy. Glob. Environ. Chang. 2014, 29, 235–245. [Google Scholar] [CrossRef]
  86. Montello, D.R.; Goodchild, M.F.; Gottsegen, J.; Fohl, P. Where’s downtown? Behavioral methods for determining referents of vague spatial queries. Spat. Cognit. Comput. 2003, 3, 185–204. [Google Scholar]
  87. Haklay, M.; Basiouka, S.; Antoniou, V.; Ather, A. How many volunteers does it take to map an area well? The validity of Linus’ law to volunteered geographic information. Cartogr. J. 2010, 47, 315–322. [Google Scholar] [CrossRef]
  88. de Albuquerque, J.P.; Fan, H.; Zipf, A. A conceptual model for quality assessment of VGI for the purpose of flood management. In Proceedings of the 19th AGILE Conference on Geographic Information Science, Helsinki, Finland, 14–17 June 2016. [Google Scholar]
  89. Servigne, S.; Lesage, N.; Libourel, T. Quality Components, Standards, and Metadata; ISTE/Hermes Science Publishing: London, UK, 2006; pp. 179–210. [Google Scholar]
  90. Vahidi, H.; Klinkenberg, B.; Yan, W. An Interactive System for Intrinsic Validation of Citizen Science Data for Species Distribution Mapping and Modelling Applications. In Proceedings of the 13th International Conference on Location-Based Services, Vienna, Austria, 14–16 November 2016. [Google Scholar]
  91. Fauzi, M.; Idris, N.; Din, A.; Osmana, M.; Ishak, M. Indigenous community tree inventory: Assessment of data quality. In Proceedings of the International Archives of the Photogrammetry, Remote Sensing and Spatial Information Sciences, Kuala Lumpur, Malaysia, 3–5 October 2016; pp. 307–314. [Google Scholar]
  92. Cozad, S.K.; McPherson, E.G.; Harding, J.A. STRATUM Case Study Evaluation in Minneapolis; Minnesota; University of California, Center for Urban Forest Research: Davis, CA, USA, 2006. [Google Scholar]
  93. Bloniarz, D.V.; Ryan, H. The use of volunteer initiatives in conducting urban forest resource inventories. J. Arboric. 1996, 22, 75–82. [Google Scholar]
  94. Stiteler, W.; Hopkins, P.F. Using genetic algorithms to select tree crown templates for finding trees in digital imagery. In Proceedings of the American Society for Photogrammetry & Remote Sensing (ASPRS) 2000 Annual Conference, Washington, DC, USA, 22–26 May 2000. [Google Scholar]
  95. Korpela, I. 3D treetop positioning by multiple image matching of aerial images in a 3D search volume bounded by lidar surface models. Photogramm. Fernerkund. Geoinform. 2007, 2007, 35. [Google Scholar]
  96. Pollock, R. Individual tree recognition based on a synthetic tree crown image model. In Proceedings of the International Forum on Automated Interpretation of High Spatial Resolution Digital Imagery for Forestry; Victoria, BC, Canada, 10–12 February 1998; pp. 25–34. [Google Scholar]
  97. Larsen, M. Crown modelling to find tree top positions in aerial photographs. In Proceedings of the Third International Airborne Remote Sensing Conference and Exhibition, Copenhagen, Denmark, 7–10 July 1997; p. 10. [Google Scholar]
  98. Sheng, Y.; Gong, P.; Biging, G. Model-based conifer-crown surface reconstruction from high-resolution aerial images. Photogramm. Eng. Remote Sens. 2001, 67, 957–966. [Google Scholar]
  99. Pollock, R. The Automatic Recognition of Individual Trees in Aerial Images of Forests Based on a Synthetic Tree crown Image Model. Ph.D. Thesis, University of British Columbia, Vancouver, BC, Canada, 1996. [Google Scholar]
  100. Larsen, M.; Rudemo, M. Optimizing templates for finding trees in aerial photographs. Pattern Recognit. Lett. 1998, 19, 1153–1162. [Google Scholar] [CrossRef]
  101. Hung, C.; Bryson, M.; Sukkarieh, S. Multi-class predictive template for tree crown detection. ISPRS J. Photogramm. Remote Sens. 2012, 68, 170–183. [Google Scholar] [CrossRef]
  102. Gomes, M.F.; Maillard, P. Identification of urban tree crown in a tropical environment using WorldView-2 data: Problems and perspectives. In Proceedings of the 2013 SPIE Remote Sensing, Dresden, Germany, 24 October 2013; p. 88930C. [Google Scholar]
  103. Maillard, P.; Gomes, M.F. Detection and counting of orchard trees from VHR images using a geometrical-optical model and marked template matching. ISPRS Ann. Photogramm. Remote Sens. Spat. Inf. Sci. 2016, 3, 75–82. [Google Scholar] [CrossRef]
  104. Pirotti, F. Assessing a template matching approach for tree height and position extraction from lidar-derived canopy height models of pinus pinaster stands. Forests 2010, 1, 194–208. [Google Scholar] [CrossRef]
  105. Quackenbush, L.J.; Hopkins, P.F.; Kinn, G.J. Developing forestry products from high resolution digital aerial imagery. PE RS Photogramm. Eng. Remote Sens. 2000, 66, 1337–1346. [Google Scholar]
  106. Foody, G.M.; Boyd, D.S. Using volunteered data in land cover map validation: Mapping West African forests. IEEE J. Sel. Top. Appl. Earth Obs. Remote Sens. 2013, 6, 1305–1312. [Google Scholar] [CrossRef]
  107. Xing, H.; Meng, Y.; Hou, D.; Cao, F.; Xu, H. Exploring point-of-interest data from social media for artificial surface validation with decision trees. Int. J. Remote Sens. 2017, 38, 6945–6969. [Google Scholar] [CrossRef]
  108. Fonte, C.C.; Martinho, N. Assessing the applicability of OpenStreetMap data to assist the validation of land use/land cover maps. Int. J. Geogr. Inf. Sci. 2017, 31, 2382–2400. [Google Scholar] [CrossRef]
  109. Fritz, S.; See, L.; McCallum, I.; Schill, C.; Perger, C.; Obersteiner, M. Building a crowd-sourcing tool for the validation of urban extent and gridded population. In Computational Science and Its Applications, Proceedings of the ICCSA 2011: International Conference, Santander, Spain, 20–23 June 2011; Murgante, B., Gervasi, O., Iglesias, A., Taniar, D., Apduhan, B.O., Eds.; Springer: Berlin/Heidelberg, Germany, 2011; pp. 39–50. [Google Scholar]
  110. Schnebele, E.; Cervone, G. Improving remote sensing flood assessment using volunteered geographical data. Nat. Hazards Earth Syst. Sci. 2013, 13, 669–677. [Google Scholar] [CrossRef] [Green Version]
  111. Klonner, C.; Barron, C.; Neis, P.; Höfle, B. Updating digital elevation models via change detection and fusion of human and remote sensor data in urban environments. Int. J. Digit. Earth 2015, 8, 153–171. [Google Scholar] [CrossRef]
  112. Gengler, S.; Bogaert, P. Integrating crowdsourced data with a land cover product: A Bayesian data fusion approach. Remote Sens. 2016, 8, 545. [Google Scholar] [CrossRef]
  113. Lesiv, M.; Moltchanova, E.; Schepaschenko, D.; See, L.; Shvidenko, A.; Comber, A.; Fritz, S. Comparison of data fusion methods using crowdsourced data in creating a hybrid forest cover map. Remote Sens. 2016, 8, 261. [Google Scholar] [CrossRef]
  114. Johnson, B.A.; Iizuka, K. Integrating OpenStreetMap crowdsourced data and Landsat time-series imagery for rapid land use/land cover (LULC) mapping: Case study of the Laguna de Bay area of the Philippines. Appl. Geogr. 2016, 67, 140–149. [Google Scholar] [CrossRef]
  115. Jokar Arsanjani, J.; Helbich, M.; Bakillah, M. Exploiting Volunteered Geographic Information to ease land use mapping of an urban landscape. In Proceedings of the International Archives of the Photogrammetry, Remote Sensing and Spatial Information Sciences, London, UK, 29–31 May 2013; Volume XL-4/W1, pp. 51–55. [Google Scholar]
  116. Wan, T.; Lu, H.; Lu, Q.; Luo, N. Classification of high-resolution remote-sensing image using OpenStreetMap information. IEEE Geosci. Remote Sens. Lett. 2017, 14, 2305–2309. [Google Scholar] [CrossRef]
  117. Yang, D.; Fu, C.-S.; Smith, A.C.; Yu, Q. Open land-use map: A regional land-use mapping strategy for incorporating OpenStreetMap with earth observations. Geo-Spat. Inf. Sci. 2017, 20, 269–281. [Google Scholar] [CrossRef]
  118. Geiß, C.; Schauß, A.; Riedlinger, T.; Dech, S.; Zelaya, C.; Guzmán, N.; Hube, M.A.; Arsanjani, J.J.; Taubenböck, H. Joint use of remote sensing data and volunteered geographic information for exposure estimation: Evidence from Valparaíso, Chile. Nat. Hazards 2017, 86, 81–105. [Google Scholar] [CrossRef]
  119. Foody, G.M.; Pal, M.; Rocchini, D.; Garzon-Lopez, C.X.; Bastin, L. The sensitivity of mapping methods to reference data quality: Training supervised image classifications with imperfect reference data. ISPRS Int. J. Geo-Inf. 2016, 5, 199. [Google Scholar] [CrossRef]
  120. Aide, T.M.; Clark, M.L.; Grau, H.R.; López-Carr, D.; Levy, M.A.; Redo, D.; Bonilla-Moheno, M.; Riner, G.; Andrade-Núñez, M.J.; Muñiz, M. Deforestation and reforestation of Latin America and the Caribbean (2001–2010). Biotropica 2013, 45, 262–271. [Google Scholar] [CrossRef]
  121. Molinier, M.; López-Sánchez, C.A.; Toivanen, T.; Korpela, I.; Corral-Rivas, J.J.; Tergujeff, R.; Häme, T. Relasphone—Mobile and participative in situ forest biomass measurements supporting satellite image mapping. Remote Sens. 2016, 8, 869. [Google Scholar] [CrossRef]
  122. Shoshtari, M. We have the adequate number of the legal acts, the problem is the violation of them: The violation of the urban master plans on protecting the urban orchards. In Shahrara; Mashhad Municipality Publishing: Mashhad, Iran, 2017; Volume 2348, p. 5. [Google Scholar]
  123. Maurer, T. How to pan-sharpen images using the Gram-Schmidt pan-sharpen method—A recipe. In Proceedings of the International Archives of the Photogrammetry, Remote Sensing and Spatial Information Sciences, Hannover, Germany, 21–24 May 2013; Volume XL-1/W1, pp. 239–244. [Google Scholar]
  124. Svatonova, H. Analysis of visual interpretation of satellite data. In Proceedings of the International Archives of the Photogrammetry, Remote Sensing and Spatial Information Sciences, 2016 XXIII ISPRS Congress Prague, Czech Republic, 12–19 July 2016; Volume XLI-B2, pp. 675–681. [Google Scholar]
  125. Blaschke, T. Object-based contextual image classification built on image segmentation. In Proceedings of the 2003 IEEE Workshop on Advances in Techniques for Analysis of Remotely Sensed Data, Greenbelt, MD, USA, 27–28 October 2003; pp. 113–119. [Google Scholar]
  126. Yu, Q.; Gong, P.; Clinton, N.; Biging, G.; Kelly, M.; Schirokauer, D. Object-based detailed vegetation classification with airborne high spatial resolution remote sensing imagery. Photogramm. Eng. Remote Sens. 2006, 72, 799–811. [Google Scholar] [CrossRef]
  127. Blaschke, T. Object based image analysis for remote sensing. ISPRS J. Photogramm. Remote Sens. 2010, 65, 2–16. [Google Scholar] [CrossRef]
  128. Baatz, M. Multiresolution segmentation: An optimization approach for high quality multi-scale image segmentation. In Angewandte Geographische Informations Verarbeitung XII; Wichmann: Osnabrück, Germany, 2000; pp. 12–23. [Google Scholar]
  129. Darwish, A.; Leukert, K.; Reinhardt, W. Image segmentation for the purpose of object-based classification. In Proceedings of the 2003 IEEE International Geoscience and Remote Sensing Symposium, Toulouse, France, 21–25 July 2003; pp. 2039–2041. [Google Scholar]
  130. Comber, A.; Umezaki, M.; Zhou, R.; Ding, Y.; Li, Y.; Fu, H.; Jiang, H.; Tewkesbury, A. Using shadows in high-resolution imagery to determine building height. Remote Sens. Lett. 2012, 3, 551–556. [Google Scholar] [CrossRef] [Green Version]
  131. Dare, P.M. Shadow analysis in high-resolution satellite imagery of urban areas. Photogramm. Eng. Remote Sens. 2005, 71, 169–177. [Google Scholar] [CrossRef]
  132. Adeline, K.R.M.; Chen, M.; Briottet, X.; Pang, S.K.; Paparoditis, N. Shadow detection in very high spatial resolution aerial images: A comparative study. ISPRS J. Photogramm. Remote Sens. 2013, 80, 21–38. [Google Scholar] [CrossRef]
  133. Zhou, W.; Huang, G.; Troy, A.; Cadenasso, M.L. Object-based land cover classification of shaded areas in high spatial resolution imagery of urban areas: A comparison study. Remote Sens. Environ. 2009, 113, 1769–1777. [Google Scholar] [CrossRef]
  134. Sohlbach, M. Elevated/Rough vs. Low/Smooth Vegetation/Surface. Availabe online: http://community.ecognition.com/home/ElevatedvsLowVegetation.zip/view?searchterm=Rough%20vs.%20Low (accessed on 1 August 2017).
  135. Lee, J.-S. Digital image smoothing and the sigma filter. Comput. Vis. Graph. Image Process. 1983, 24, 255–269. [Google Scholar] [CrossRef]
  136. Lee, J.S.; Wen, J.H.; Ainsworth, T.L.; Chen, K.S.; Chen, A.J. Improved Sigma Filter for speckle filtering of SAR imagery. IEEE Trans. Geosci. Remote Sens. 2009, 47, 202–213. [Google Scholar]
  137. Klette, R. Image processing. In Concise Computer Vision: An Introduction into Theory and Algorithms; Springer: London, UK, 2014; pp. 43–87. [Google Scholar]
  138. Tobler, W.R. A computer movie simulating urban growth in the Detroit region. Econ. Geogr. 1970, 46, 234–240. [Google Scholar] [CrossRef]
  139. Zhao, F.; Huang, Q.; Gao, W. Image matching by normalized cross-correlation. In Proceedings of the 2006 IEEE International Conference on Acoustics, Speech and Signal Processing, Toulouse, France, 14–19 May 2006. [Google Scholar]
  140. Tsai, D.-M.; Lin, C.-T. Fast normalized cross correlation for defect detection. Pattern Recognit. Lett. 2003, 24, 2625–2631. [Google Scholar] [CrossRef]
  141. Fouda, Y. One-dimensional vector based pattern matching. Int. J. Comput. Sci. Inf. Technol. 2014, 6, 47–58. [Google Scholar]
  142. Shen, X.; Bao, W. The remote sensing image matching algorithm based on the normalized cross-correlation and sift. J. Indian Soc. Remote Sens. 2014, 42, 417–422. [Google Scholar] [CrossRef]
  143. Lewis, J.P. Fast template matching. In Proceedings of the Fast Template Matching, Vision Interface 95, Canadian Image Processing and Pattern Recognition Society Vision interface, Quebec City, QC, Canada, 15–19 May 1995; pp. 15–19. [Google Scholar]
  144. Hall, R.J. The roles of aerial photographs in forestry remote sensing image analysis. In Remote Sensing of Forest Environments: Concepts and Case Studies; Wulder, M.A., Franklin, S.E., Eds.; Springer: Boston, MA, USA, 2003; pp. 47–75. [Google Scholar]
  145. Van Coillie, F.M.; Gardin, S.; Anseel, F.; Duyck, W.; Verbeke, L.P.; De Wulf, R. Variability of operator performance in remote-sensing image interpretation: The importance of human and external factors. Int. J. Remote Sens. 2014, 35, 754–778. [Google Scholar] [CrossRef]
  146. Antoniou, V.; See, L.; Foody, G.; Fonte, C.C.; Mooney, P.; Bastin, L.; Fritz, S.; Liu, H.-Y.; Olteanu-Raimond, A.-M.; Vatseva, R. The Future of VGI. In Mapping and the Citizen Sensor; Ubiquity Press: London, UK; pp. 377–390.
  147. Blozan, W. Tree measuring guidelines of the eastern native tree society. Bull. East. Nativ. Tree Soc. 2006, 1, 3–10. [Google Scholar]
  148. Jacobs, C.; Zipf, A. Completeness of citizen science biodiversity data from a volunteered geographic information perspective. Geo-Spat. Inf. Sci. 2017, 20, 3–13. [Google Scholar] [CrossRef]
  149. van Strien, A.J.; van Swaay, C.A.M.; Termaat, T. Opportunistic citizen science data of animal species produce reliable estimates of distribution trends if analysed with occupancy models. J. Appl. Ecol. 2013, 50, 1450–1458. [Google Scholar] [CrossRef] [Green Version]
  150. Bordogna, G.; Carrara, P.; Criscuolo, L.; Pepe, M.; Rampini, A. On predicting and improving the quality of Volunteer Geographic Information projects. Int. J. Digit. Earth 2016, 9, 134–155. [Google Scholar] [CrossRef]
  151. Bordogna, G.; Carrara, P.; Criscuolo, L.; Pepe, M.; Rampini, A. A linguistic decision making approach to assess the quality of volunteer geographic information for citizen science. Inf. Sci. 2014, 258, 312–327. [Google Scholar] [CrossRef]
  152. Cohn, J.P. Citizen Science: Can volunteers do real research? BioScience 2008, 58, 192–197. [Google Scholar] [CrossRef]
  153. Gommerman, L.; Monroe, M.C. Lessons Learned from Evaluations of Citizen Science Programs; University of Florida: Gainesville, FL, USA, 2012. [Google Scholar]
  154. Martella, R.; Kray, C.; Clementini, E. A gamification framework for volunteered geographic information. In AGILE 2015; Springer: Berlin/Heidelberg, Germany, 2015; pp. 73–89. [Google Scholar]
  155. Fritz, S.; See, L.; Brovelli, M. Motivating and sustaining participation in VGI. In Mapping and the Citizen Sensor; Ubiquity Press: London, UK, 2017. [Google Scholar]
  156. Mooney, P.; Minghini, M. A review of OpenStreetMap data. In Mapping and the Citizen Sensor; Ubiquity Press: London, UK, 2017; pp. 37–59. [Google Scholar]
  157. Consortium, D. BioBlitz: Promoting Cross Border Research and Collaborative Practices for Biodiversity Conservation. Availabe online: http://discovery.ucl.ac.uk/1573359/1/DITOs%20Policy%20Brief%20BioBlitz.pdf (accessed on 15 December 2017).
  158. Vahidi, H.; Klinkenberg, B.; Yan, W. Trust as a proxy indicator for intrinsic quality of Volunteered Geographic Information in biodiversity monitoring programs. GISci Remote Sens. 2018, 55, 502–538. [Google Scholar] [CrossRef]
  159. Vahidi, H.; Klinkenberg, B.; Yan, W. A fuzzy system for quality assurance of crowdsourced wildlife observation geodata. In Proceedings of the 2017 International Electronics Symposium on Knowledge Creation and Intelligent Computing (IES-KCIC), Surabaya, Indonesia, 26–27 September 2017; pp. 55–58. [Google Scholar]
  160. Haklay, M. How good is volunteered geographical information? A comparative study of OpenStreetMap and Ordnance Survey datasets. Environ. Plan. B Plan. Des. 2010, 37, 682–703. [Google Scholar] [CrossRef]
  161. Dorn, H.; Törnros, T.; Zipf, A. Quality evaluation of VGI using authoritative data—A comparison with land use data in Southern Germany. ISPRS Int. J. Geo-Inf. 2015, 4, 1657–1671. [Google Scholar] [CrossRef]
  162. Arsanjani, J.J.; Mooney, P.; Zipf, A.; Schauss, A. Quality assessment of the contributed land use information from OpenStreetMap versus authoritative datasets. In OpenStreetMap in GIScience; Springer: Berlin/Heidelberg, Germany, 2015; pp. 37–58. [Google Scholar]
  163. Crall, A.W.; Newman, G.J.; Stohlgren, T.J.; Holfelder, K.A.; Graham, J.; Waller, D.M. Assessing citizen science data quality: An invasive species case study. Conserv. Lett. 2011, 4, 433–442. [Google Scholar] [CrossRef]
  164. Salk, C.F.; Sturn, T.; See, L.; Fritz, S.; Perger, C. Assessing quality of volunteer crowdsourcing contributions: Lessons from the Cropland Capture game. Int. J. Digit. Earth 2016, 9, 410–426. [Google Scholar] [CrossRef] [Green Version]
  165. Mullen, W.F.; Jackson, S.P.; Croitoru, A.; Crooks, A.; Stefanidis, A.; Agouris, P. Assessing the impact of demographic characteristics on spatial error in volunteered geographic information features. GeoJournal 2015, 80, 587–605. [Google Scholar] [CrossRef]
  166. Fonte, C.C.; Antoniou, V.; Bastin, L.; Bayas, L.; See, L.; Vatseva, R. Assessing VGI Data Quality; Ubiquity Press: London, UK, 2017; p. 137. [Google Scholar]
  167. Zielstra, D.; Zipf, A. A comparative study of proprietary geodata and volunteered geographic information for Germany. In Proceedings of the 13th AGILE International Conference on Geographic Information Science, Guimarães, Portugal, 11–14 May 2010. [Google Scholar]
  168. Jokar Arsanjani, J.; Bakillah, M. Understanding the potential relationship between the socio-economic variables and contributions to OpenStreetMap. Int. J. Digit. Earth 2015, 8, 861–876. [Google Scholar] [CrossRef]
  169. Foster, A.; Dunham, I.M.; Kaylor, C. Citizen Science for urban forest management? Predicting the data density and richness of urban forest Volunteered Geographic Information. Urban Sci. 2017, 1, 30. [Google Scholar] [CrossRef]
  170. Bégin, D.; Devillers, R.; Roche, S. Assessing volunteered geographic information (VGI) quality based on contributors’ mapping behaviours. In Proceedings of the 8th International Symposium on Spatial Data Quality ISSDQ, Hong Kong, China, 19–20 September 2017; pp. 149–154. [Google Scholar]
  171. Neis, P.; Zielstra, D.; Zipf, A. Comparison of volunteered geographic information data contributions and community development for selected world regions. Future Int. 2013, 5, 282–300. [Google Scholar] [CrossRef]
  172. Mashhadi, A.; Quattrone, G.; Capra, L. The impact of society on Volunteered Geographic Information: The case of OpenStreetMap. In OpenStreetMap in GIScience: Experiences, Research, and Applications; Jokar Arsanjani, J., Zipf, A., Mooney, P., Helbich, M., Eds.; Springer International Publishing: Cham, Switzerland, 2015; pp. 125–141. [Google Scholar]
  173. Gröchenig, S.; Brunauer, R.; Rehrl, K. Estimating completeness of VGI datasets by analyzing community activity over time periods. In Connecting a Digital Europe through Location and Place; Springer: Berlin/Heidelberg, Germany, 2014; pp. 3–18. [Google Scholar]
  174. Hecht, R.; Kunze, C.; Hahmann, S. Measuring completeness of building footprints in OpenStreetMap over space and time. ISPRS Int. J. Geo-Inf. 2013, 2, 1066–1091. [Google Scholar] [CrossRef]
  175. Rotman, D.; Hammock, J.; Preece, J.; Hansen, D.; Boston, C.; Bowser, A.; He, Y. Motivations affecting initial and long-term participation in citizen science projects in three countries. In Proceedings of the iConference 2014, Berlin, Germany, 4–7 March 2014. [Google Scholar]
  176. Jackson, C.B.; Østerlund, C.; Mugar, G.; Hassman, K.D.; Crowston, K. Motivations for sustained participation in crowdsourcing: Case studies of citizen science on the role of talk. In Proceedings of the 2015 48th Hawaii International Conference on System Sciences (HICSS), Kauai, HI, USA, 5–8 January 2015; pp. 1624–1634. [Google Scholar]
  177. Singh, O. Frontiers in Environmental Geography; Concept Publishing Company: New Delhi, India, 1993. [Google Scholar]
  178. Hoffman, R.R.; Markman, A.B. Interpreting Remote Sensing Imagery: Human Factors; CRC Press: Boca Raton, FL, USA, 2001. [Google Scholar]
  179. Svatoňová, H.; Šikl, R. Cognitive aspects of interpretation of image data. In Mathematical-Statistical Models and Qualitative Theories for Economic and Social Sciences; Hošková-Mayerová, Š., Maturo, F., Kacprzyk, J., Eds.; Springer International Publishing: Cham, Switzerland, 2017; pp. 161–175. [Google Scholar]
  180. Hollingworth, A.; Henderson, J.M. Object identification is isolated from scene semantic constraint: Evidence from object type and token discrimination. Acta Psychol. 1999, 102, 319–343. [Google Scholar] [CrossRef]
  181. Chun, M.M. Contextual cueing of visual attention. Trends Cogn. Sci. 2000, 4, 170–178. [Google Scholar] [CrossRef]
  182. Kubíček, P.; Šašinka, Č.; Stachoň, Z.; Štěrba, Z.; Apeltauer, J.; Urbánek, T. Cartographic design and usability of visual variables for linear features. Cartogr. J. 2017, 54, 91–102. [Google Scholar] [CrossRef]
  183. Porwal, M.C. Remote Sensing Analysis of Environmental Resources for Planning and Development; APH Publishing: Louisville, KY, USA, 1997. [Google Scholar]
  184. Gibson, J.J. The Ecological Approach to Visual Perception: Classic Edition; Psychology Press: London, UK, 2014. [Google Scholar]
  185. Heuvelink, G.B. Error Propagation in Environmental Modelling with GIS; CRC Press: Boca Raton, FL, USA, 1998. [Google Scholar]
  186. Sexton, J.O.; Noojipady, P.; Anand, A.; Song, X.-P.; McMahon, S.; Huang, C.; Feng, M.; Channan, S.; Townshend, J.R. A model for the propagation of uncertainty from continuous estimates of tree cover to categorical forest cover and change. Remote Sens. Environ. 2015, 156, 418–425. [Google Scholar] [CrossRef]
  187. Antoniou, V.; Skopeliti, A. Measures and indicators of VGI quality: An overview. In Proceedings of the ISPRS Annals of Photogrammetry, Remote Sensing and Spatial Information Sciences, La Grande Motte, France, 28 September–3 October 2015; Volume II-3/W5, pp. 345–351. [Google Scholar]
  188. John, G.H.; Langley, P. Estimating continuous distributions in Bayesian classifiers. In Proceedings of the Eleventh Conference on Uncertainty in Artificial Intelligence, Montréal, QC, Canada, 18–20 August 1995; pp. 338–345. [Google Scholar]
  189. Nettleton, D.F.; Orriols-Puig, A.; Fornells, A. A study of the effect of different types of noise on the precision of supervised learning techniques. Artif. Intell. Rev. 2010, 33, 275–306. [Google Scholar] [CrossRef]
  190. Elboher, E.; Werman, M. Asymmetric correlation: A noise robust similarity measure for template matching. IEEE Trans. Image Process. 2013, 22, 3062–3073. [Google Scholar] [CrossRef] [PubMed]
  191. Napoli, N.; Leach, K.; Barnes, L.; Weimer, W. A MapReduce framework to improve template matching uncertainty. In Proceedings of the 2016 International Conference on Big Data and Smart Computing (BigComp); Hong Kong, China, 18–20 January 2016; pp. 77–84. [Google Scholar]
  192. Fouda, Y.; Khan, A.R. Normalize cross correlation algorithm in pattern matching based on 1-D information vector. Trends Appl. Sci. Res. 2015, 10, 195–206. [Google Scholar] [CrossRef]
  193. Lu, D.; Weng, Q. A survey of image classification methods and techniques for improving classification performance. Int. J. Remote Sens. 2007, 28, 823–870. [Google Scholar] [CrossRef] [Green Version]
  194. Wang, D.-Z.; Wu, C.-H.; Ip, A.; Chan, C.-Y.; Wang, D.-W. Fast multi-template matching using a particle swarm optimization algorithm for PCB inspection. In Proceedings of the Workshops on Applications of Evolutionary Computation, Naples, Italy, 26–28 March 2008; pp. 365–370. [Google Scholar]
Figure 1. R, G, B true color composite for the study area (satellite image courtesy of the DigitalGlobe Foundation).
Remotesensing 10 01134 g001
Figure 2. The proposed approach for ITC detection (based on collective sensing) and data quality assessment in this study.
Remotesensing 10 01134 g002
Figure 3. Map of the CTCs and shadows in the study area.
Remotesensing 10 01134 g003
Figure 4. Map of the crowdsourced trees over the parcels of the study area.
Remotesensing 10 01134 g004
Figure 5. Reference map for the trees over the parcels of the study area.
Remotesensing 10 01134 g005
Figure 6. Example of (a) type “A” error; (b) type “B” error; (c) type “C” error; (d) type “D” error (top: crowdsourced observation overlaid on true color composite; bottom: crowdsourced observation overlaid on NIR1, R, and G false color composite; blue circle and the black cross symbols show the location of misidentified and correctly identified trees in the crowdsourced dataset, respectively).
Remotesensing 10 01134 g006
Figure 7. (a) Box plot of positional error (m) of individual tree crowns; (b) box plot of diameter errors (m) of an individual tree crowns; the plots represent the minimum, first quartile, median, third quartile, maximum, and outliers for the respective errors in the crowdsourced data over the parcels.
Remotesensing 10 01134 g007
Figure 8. Examples of the tree detection performance of the TM-CS (the black cross, red circle, yellow circle, and blue circle symbols show the location of detected, undetected, overdetected, and falsely detected trees, respectively; a white color outline was added around the red circle symbol to enhance the contrast with the background).
Remotesensing 10 01134 g008
Figure 9. (a) Map of the ITC detection performance of the TM-CS; (b) map of ITC detection performance of the TM-REF.
Remotesensing 10 01134 g009
Table 1. Indices and class description for shadow and CTC objects detection.
ClassIndexEquation μ I σ I c I Threshold
ShadowMean Intensity ( RE NIR 1 ) RE + NIR 1 2 ---<21
Mean Brightness R + G + B + NIR 1 4 ---<15.5
Candidate Tree CrownR to Roughness band Ratio R Roughness 9.692.161.5 12.93
NDVI NIR 1 R NIR 1 + R 0.560.07−2 0.42
Table 2. Specifications of the templates created based on the crowdsourced samples.
Parcel 1Parcel 2Parcel 3Parcel 4Parcel 5Parcel 6
N c 56120215148703
D c ¯   ( m ) 5.35.24.44.84.64.8
np c   ( p x ) 181815171617
Table 3. Specifications of the reference templates.
Parcel 1Parcel 2Parcel 3Parcel 4Parcel 5Parcel 6
N r 54120214137663
D r ¯   ( m ) 5.45.34.54.84.53.9
np r   ( p x ) 191816171614
Table 4. The adopted spatial data quality measures in this study (where TP : true positive; FP : false positive; FN : false negative; N t : total number of counted tree crowns in the reference data for the study unit (parcel or test plot); ( X c , Y c ): coordinates of a tree crown centroid for the crowdsourced observations; ( X r , Y r ): coordinates of a tree crown centroid for the reference observations; e : error ( e p or e d ); and n e : total number of errors).
Data Quality ElementMeasureEquation
Completeness C ( % ) TP N t × 100
Thematic Mapping Accuracy PPV TP TP + FP
FDR FP TP + FP
FNR FN TP + FN
F 1 2 TP 2 TP + FP + FN
Positional Accuracy/Quantitative Attribute Accuracy e p   ( m ) ( X c X r ) 2 + ( Y c Y r ) 2
e d   ( m ) ( D c D r )
R M S E   ( m ) 1 n e e 2 n e
Table 5. Data quality measures results for crowdsourced data about ITC locations.
MeasureParcel 1Parcel 2Parcel 3Parcel 4Parcel 5Parcel 6Test Plot
N c 56120215148703612
N t 158665807528469132640
C (%)34.11826.525.91423.922.5
PPV0.9651.0000.9950.9260.9431.0000.971
FDR0.0350.0000.0050.0740.0570.0000.029
R M S E c c   ( m ) 0.910.850.680.891.010.280.83
R M S E c d   ( m ) 0.810.670.800.710.850.930.76
Table 6. Data quality measures results for TM-CS.
MeasureParcel 1Parcel 2Parcel 3Parcel 4Parcel 5Parcel 6Total Parcels
N tm 148690810570452202690
C (%)86.189.696.795.390.469.292.7
FDR0.0810.1360.0370.1180.0620.5500.090
FNR0.1390.1040.0330.0470.0960.3080.073
F 1 0.8880.8790.9640.9160.9200.5450.918
R M S E c c   ( m ) 1.271.040.911.071.071.251.02
Table 7. Data quality measures results for TM-REF.
MeasureParcel 1Parcel 2Parcel 3Parcel 4Parcel 5Parcel 6Total Parcels
N tm 148681816569454232691
C (%)86.290.897.096.091.376.993.5
FDR0.0740.1130.0400.1090.0570.5650.082
FNR0.1380.0920.0300.0400.0870.2310.065
F 1 0.8920.8970.9640.9240.9270.5550.926
R M S E c c   ( m ) 1.070.920.840.901.021.340.93
Table 8. Specifications and quality measures for the generated test training datasets and the created templates at the different FP:TP ratio thresholds in parcels 3, 5, and 6 (the column highlighted in gray indicates the respective values for the original crowdsourced data).
Parcel 3 FP:TP Ratio
0.0040.2500.5000.7501.0001.2501.5001.7502.0005.0008.000
FP 1437292107119129137143179191215
FDR0.0040.2000.3340.4270.4970.5530.6000.6370.6650.8320.8881
μ T   ( m ) 0.650.640.650.650.670.670.670.650.660.680.70-
σ T   ( m ) 0.410.420.420.440.440.440.440.450.470.560.49-
μ F   ( m ) 5.143.463.763.853.753.733.683.723.703.763.813.75
σ F   ( m ) 00.821.521.661.571.521.471.491.471.711.751.67
Parcel 5 FP:TP Ratio
0.0600.2500.5000.7501.0001.2501.5001.7502.0005.000 8.000
FP 41423303539424547586270
FDR0.0570.2000.3280.4280.5000.5570.6000.6420.6710.8280.8851
μ T   ( m ) 0.820.850.860.820.840.770.740.660.670.620.59-
σ T   ( m ) 0.500.500.510.460.470.390.390.280.290.230.17-
μ F   ( m ) 2.503.623.463.914.294.184.094.184.114.054.094.35
σ F   ( m ) 1.172.001.602.212.792.672.602.622.592.372.322.68
Parcel 6 FP:TP Ratio
0.0000.2500.5000.7501.0001.2501.5001.7502.0005.0008.000
FP 0-1-----2--3
FDR0.000-0.333-----0.666--1.000
μ T   ( m ) 0.43-0.33-----0.24---
σ T   ( m ) 0.15-0.08-----0.00---
μ F   ( m ) --57.09-----35.61--34.07
σ F   ( m ) --0.00-----21.47--17.66
Table 9. Data quality measures results for different FP:TP ratio thresholds in parcels 3, 5, and 6 (the highlighted column in gray indicates the respective values for TM-CS).
Parcel 3 FP:TP Ratio
0.0040.2500.5000.7501.0001.2501.5001.7502.0005.0008.000
C (%)96.796.596.596.796.596.294.793.690.20.90.80.9
FDR0.0370.0400.0390.0360.0380.0390.0440.0490.0580.9890.9910.989
FNR0.0330.0340.0340.0320.0340.0370.0520.0630.0970.9900.9910.990
F 1 0.9640.9620.9620.9650.9630.9610.9510.9430.9210.0100.0080.009
Parcel 5 FP:TP Ratio
0.0600.2500.5000.7501.0001.2501.5001.7502.0005.0008.000
C (%)90.489.986.785.583.182.581.877.676.147.117.42.9
FDR0.0620.0640.0810.0920.1170.1220.1330.1760.1950.4710.8020.970
FNR0.0960.1000.1320.1440.1680.1740.1810.2230.2380.5620.8250.970
F 1 0.9200.9170.8920.8800.8560.8500.8420.7990.7820.4780.1850.029
Parcel 6 FP:TP Ratio
0.0000.2500.5000.7501.0001.2501.5001.7502.0005.0008.000
C (%)69.2-38.4-----7.6--0.0
FDR0.550-0.285-----0--1
FNR0.308-0.615-----0.923--1
F 1 0.545-0.500-----0.142--0

