Decreasing Rice Cropping Intensity in Southern China from 1990 to 2015


1
Key Laboratory of Land Surface Pattern and Simulation, Institute of Geographic Sciences and Natural Resources Research, Chinese Academy of Sciences, Beijing 100101, China
2
University of Chinese Academy of Sciences, Beijing 100049, China
*
Author to whom correspondence should be addressed.
Remote Sens. 2019, 11(1), 35; https://doi.org/10.3390/rs11010035
Submission received: 30 October 2018
/
Revised: 17 December 2018
/
Accepted: 19 December 2018
/
Published: 26 December 2018
(This article belongs to the Special Issue High Resolution Image Time Series for Novel Agricultural Applications)
Abstract
:Assessing changes in rice cropping systems is essential for ensuring food security, greenhouse gas emissions, and sustainable water management. However, due to the insufficient availability of images with moderate to high spatial resolution, caused by frequent cloud cover and coarse temporal resolution, high-resolution maps of rice cropping systems at a large scale are relatively limited, especially in tropical and subtropical regions. This study combined the difference of Normalized Difference Vegetation Index (dNDVI) method and the Normalized Difference Vegetation Index (NDVI) threshold method to monitor changes in rice cropping systems of Southern China using Landsat images, based on the phenological differences between different rice cropping systems. From 1990–2015, the sown area of double cropping rice (DCR) in Southern China decreased by 61054.5 km2, the sown area of single cropping rice (SCR) increased by 20,110.7 km2, the index of multiple cropping decreased from 148.3% to 129.3%, and the proportion of DCR decreased by 20%. The rice cropping systems in Southern China showed a “double rice shrinking and single rice expanding” change pattern from north to south, and the most dramatic changes occurred in the Middle-Lower Yangtze Plain. This study provided an efficient strategy that can be applied to moderate to high resolution images with deficient data availability, and the resulting maps can be used as data support to adjust agricultural structures, formulate food security strategies, and compile a greenhouse gas emission inventory.
1. Introduction
Rice feeds more than half of the world’s population, and paddy rice areas account for approximately 12% of global cropland areas [1]. Planting paddy rice consumes a huge amount of water resources, approximately one quarter to one third of the world’s developed freshwater resources are used for rice irrigation [2]. Due to the flooded environment caused by irrigation, paddy rice fields are important sources of methane (CH4) emissions, which account for more than 10% of the total CH4 flux in the atmosphere [3,4,5]. The timely and explicit mapping of spatiotemporal changes in rice cropping systems is essential for food security, greenhouse gas emissions, and water resource management [6]. The traditional method of acquiring rice cropping system distribution information relies on statistical data [7]. However, statistical data can be easily disturbed by human factors, and it is difficult to characterize spatial variation within administrative units, which restrict their application [8].
The potential of using remote sensing for the extraction of crop type distribution has been demonstrated [9,10,11], and it is now widely used for paddy rice mapping [12,13]. Paddy rice mapping algorithms can be divided into four categories [6]: (1) Reflectance data and image statistic-based approaches; (2) vegetation index (VI) data and enhanced image statistic-based approaches; (3) vegetation index or Radio Detection and Ranging (RADAR) backscatter-based temporal analysis approaches; and (4) phenology-based approaches based on the remote sensing recognition of key growth phases. Among these algorithms, the transplanting-phenology-based algorithm, which is based on the relationship between VIs (Normalized Difference Vegetation Index (NDVI), Enhanced Vegetation Index (EVI), or Two-band Enhanced Vegetation Index 2 (EVI2) and the Land Surface Water Index (LSWI), is the most representative method, and it is widely utilized to map paddy rice [14,15,16,17,18,19].
Most phenology-based algorithms employ Moderate Resolution Imaging Spectroradiometer (MODIS) time series datasets to extract paddy rice distribution, and MODIS holds great potential for describing paddy rice fields over large areas with relatively simple cropping systems due to its high temporal resolution [20,21]. However, due to their coarse spatial resolution, MODIS data have serious mixed pixel effects in complex topographic regions where paddy rice fields are much smaller than the MODIS pixels, which increases the uncertainties of the extraction results [15,22,23]. Compared with MODIS data, Landsat data have a much finer spatial resolution, which can effectively reduce the mixed pixel problem in complex topographic regions and clearly improve the extraction accuracy of paddy rice fields [24]. Therefore, an increasing number of studies have utilized Landsat data to extract the spatiotemporal distribution of paddy rice [25,26,27,28]. Nevertheless, due to prevailing cloud cover, it is difficult to acquire a sufficient amount of good observations for Landsat images with a temporal gap of 16 days, especially in tropical and subtropical areas, which hampers the use of Landsat images at a large scale. Recent studies based on Landsat data have primarily been conducted in northern China and East Asia, which have simple cropping patterns and less cloud coverage [28,29,30]. Few studies have been reported in tropical and subtropical areas with complex cropping systems and more cloud coverage [24,31]. In addition, the large amount of preprocessing work required by Landsat images also hampers their application in the extraction of rice fields at a large scale [32]. Weather-independent SAR can overcome the drawback of cloud cover and is gradually being applied to rice cropping monitoring [33,34], especially after the availability of Sentinel-1 data [35,36]. However, due to a short history, it cannot be applied to a long time-series monitoring at a large scale now.
China plants and consumes a large amount of rice. In 2016, rice sown areas and rice production accounted for 19% and 28% of global rice sown areas and rice production, respectively [1]. Southern China is an important rice-producing region, and its rice sown area accounts for more than 60% of the total sown area of China. Due to urbanization, rising labor wages, and agricultural policy adjustment, Southern China has experienced obvious changes in rice cropping systems in recent decades, and the rice sown area and the index of multiple cropping have both shown a downward trend [37,38]. The Landsat Thematic Mapper (TM)/ Enhanced Thematic Mapper Plus (ETM+)/ Operational Land Imager (OLI) pixel size (900 m2) is close to the size of a paddy rice field in many regions of Southern China, thus it can adequately describe changes in rice cropping systems [24]. However, due to limited data availability, few studies have used Landsat data to monitor changes in rice cropping systems in Southern China, and most of them have focused on local areas, such as Poyang Lake [24,31] and the Jitai Basin [39]. The lack of specific information on rice cropping systems in Southern China at a large scale inevitably limits our understanding of the patterns and related impacts of changes in rice cropping systems.
To better understand the recent paddy rice agriculture dynamics in Southern China, the objective of this study is two-fold: (1) To map and monitor rice cropping systems in Southern China with Landsat images; and (2) to analyze the spatiotemporal variations in rice cropping systems from 1990 to 2015 in Southern China.
2. Materials and Methods
2.1. Study Area
In our study, Southern China refers to eight provinces, including Zhejiang, Anhui, Hubei, Fujian, Jiangxi, Hunan, Guangdong, and Guangxi. It is located between 104°28′ E ~ 122°57′ E longitude, 20°14′ N ~ 34°40′ N latitude and covers an area of 1,343,700 km2 (Figure 1). This region is primarily located in the subtropics with a long warm season and abundant precipitation [16]. The annual accumulated temperature is between 4500 °C and 8000 °C, and the coldest month is between −8 °C and 0 °C. The annual precipitation is generally between 1000 mm and 1500 mm. The topography is complex and variable, including plains, hills, basins, and mountains. It is one of the main rice production regions in China. This region can be divided into two cropping system areas from north to south [40], these include: (1) A double and single rice mixed cropping production area (Anhui, Hubei, Hunan, Jiangxi, Zhejiang); and (2) a double rice dominated cropping production area (Fujian, Guangdong, Guangxi).
2.2. Datasets
2.2.1. Landsat Data and Preprocessing
Image Data Acquisition
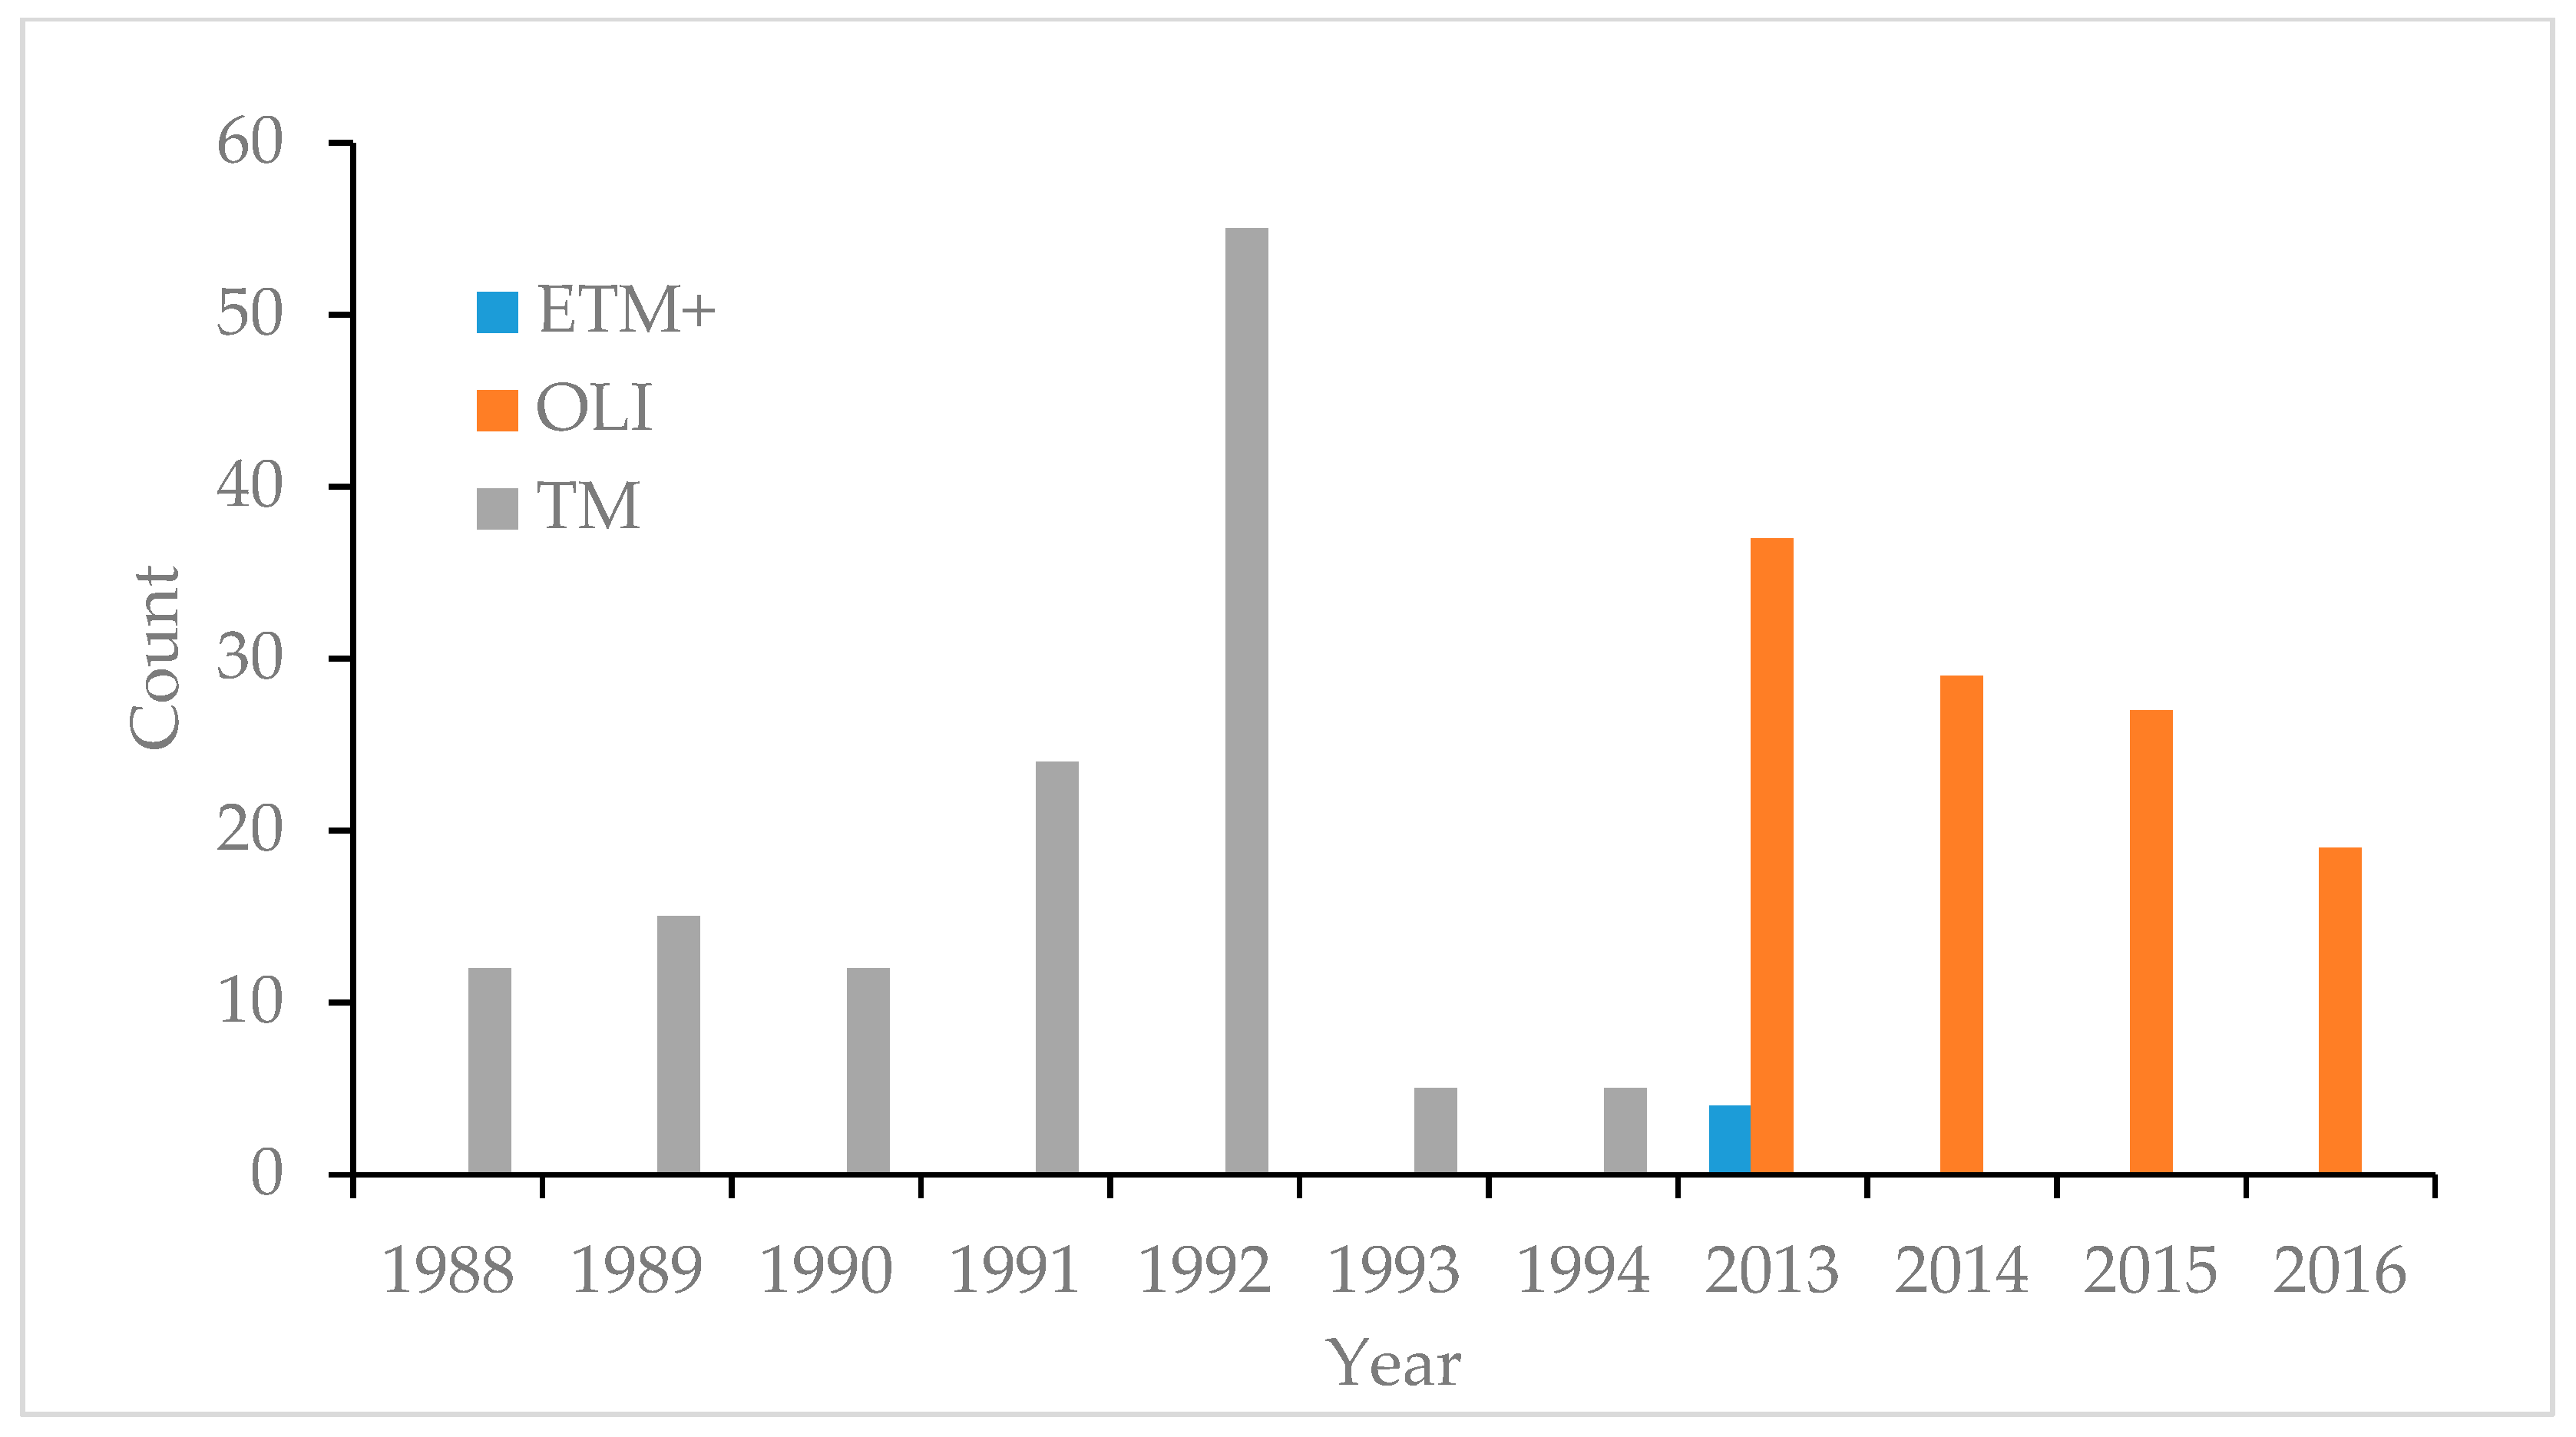
Landsat TM\ETM+\OLI images were downloaded from the U.S. Geological Survey Center for Earth Resources Observation and Science (https://glovis.usgs.gov). There are 67 path/rows—paths range from 118 to 127, rows range from 36 to 46—that cover the entire study area of Southern China. We obtained a total of 244 images with little or low cloud cover (less than 10%) during two periods (from 1988 to 1994 and from 2013 to 2016). All images were standard Level 1 terrain-corrected (L1T) products, which had undergone systematic radiometric and geometric corrections and overall geometric fidelity using ground control points and a digital elevation model. Figure 2 shows the annual distribution of these images during the two periods.
Atmospheric Correction
After the images underwent thorough radiometric calibration, atmospheric correction was conducted to generate surface reflectance by using Fast Line-of-sight Atmospherically Analysis of Spectral Hypercubus (FLAASH) in ENVI 5.3 (the Environment for Visualizing Images, version 5.3, Exelis Visual Information Solutions, Boulder, Colorado, USA). FLAASH incorporates the Moderate Resolution Transmission (MODTRAN) 4 radiative transfer code [41], which is widely used for the atmospheric correction of Landsat images.
Clouds and Cloud Shadows
The detection of clouds and cloud shadows is crucial for optical remote sensing monitoring. Although we had chosen Landsat images with low cloud cover, there were still small amounts of cloud and cloud shadow residues. In this study, we employed Fmask [42,43], provided by ENVI5.3, to detect clouds and cloud shadows to generate cloud and cloud shadow maps. Fmask has the advantage of processing a large amount of images in a more computationally efficient way [28]. Pixels contaminated by clouds or cloud shadows were not involved in monitoring rice cropping systems.
ETM+ SLC-off Pixels
The Scan Line Corrector (SLC) mechanism on-board Landsat ETM+ permanently failed on May 31st, 2003, which caused approximately 22% of the pixels in each image to disappear [44]. We applied a multi-image adaptive local regression to fill in these gaps to improve ETM+ data usability. The method was proposed by the International Scientific Data Service Platform, Computer Network Information Center, Chinese Academy of Sciences (http://datamirror.csdb.cn).
Calculation of NDVI
NDVI is a useful indicator of plant growth conditions, and it was calculated using the Landsat surface reflectance based on the following equations and spectral bands [15,45]:
where and are the surface reflectance values of the near-infrared and red bands, respectively. They in turn correspond to the fourth and third bands of the Landsat TM/ETM+ images, and the fifth and fourth bands of the Landsat OLI images, respectively.
2.2.2. Crop Phenology Data
We collected the crop phenology data in our study area from household surveys and the provincial farming database created by the Ministry of Agriculture of China (http://www.zzys.moa.gov.cn/). The crop phenology data included sowing dates, flooding and transplanting dates, heading dates, and harvest dates. We used the crop calendar to select the optimum time windows to discriminate between different rice cropping systems.
In our study area, there were two characteristic rice cropping systems, namely, double cropping rice (DCR) and single cropping rice (SCR). DCR consists of early rice and late rice that are sequentially cultivated in the same paddy field. Early rice is generally sown in late March, transplanted from late April to early May, and harvested in middle and late July. Late rice is transplanted in late July and early August and harvested in middle and late October. Due to insufficient accumulated temperature, DCR requires an extraordinary amount of work, especially during the harvesting of early rice and the transplanting of late rice. Most of this work must be done within a short time window (usually in middle and late July), which is called “shuangqiang” or “rush-harvesting and rush-planting”. SCR is often locally referred to as middle rice. It is generally sown in late May, transplanted in middle June, and harvested in early October.
2.2.3. Rice Cropping System Samples
During 2016–2017, we conducted field surveys on different paddy rice cropping systems in Anhui, Jiangxi, Zhejiang, and Guangxi. A total of 143 rice cropping system samples were collected, including 45 DCR samples and 98 SCR samples. All the samples stayed in DCR or SCR in the recent decade. In addition to the 143 ground truth data points obtained from field surveys, the identification of paddy rice cropping systems was also performed directly through the visual interpretation of Landsat images associated with Google Earth images based on the difference in the phenological features of DCR and SCR. SCR fields are covered by shallow water or exposed soils or a mixture during the period of late May to middle June, and covered by rice plants during the period of late July to early August, while DCR fields are contrary, covered by rice plants in the former and shallow water or exposed soils or a mixture in these two periods, respectively. The differences in the phenological features can be clearly observed in Google Earth images and Landsat images. In the 2015s, the samples were digitized referring to historical imagery archive from Google Earth despite the incomplete coverage in the study area. For the samples without available historical imagery from Google Earth, Landsat ETM+/OLI images were used as reference data. In the 1990s, due to limited available Google Earth images, samples were digitized referring to Landsat TM images. The year of images used to collected samples in each scene is consistent with the image acquisition year used to monitor rice cropping systems in the scene.
A total of 1053 samples (692 DCR and 361 SCR) around 1990 and 1109 samples (470 DCR and 639 SCR) around 2015 were collected (Figure 1). Additionally, these samples were independent from one period to the other. These samples were randomly divided into two groups in a proportion of 30% and 70%. The first group (30% of these samples) was used as training samples to determine the monitoring rules of rice cropping systems. The other group was utilized for the assessment of accuracy.
2.2.4. Land Use Data and Provincial Statistical Data of Rice Sown Areas
We applied the 1990 and 2015 land use dataset (i.e., the China Cover dataset) to generate paddy field masks to avoid interference from other land cover types. The China Cover dataset was provided by the Institute of Remote Sensing and Digital Earth. Its resolution was 30 m, and its accuracy was higher than 94%.
2.3. Methodology
To map rice cropping systems at a large scale, we developed an automatic rice cropping system mapping procedure (ARCSM), combining the difference of NDVI (dNDVI) method and NDVI threshold method, based on the key time windows of rice growth. The ARCSM procedure included the following modules: 1) The Landsat image preprocessing module; 2) the pixel- and phenology-based paddy rice cropping systems auto mapping module; and 3) the accuracy assessment and analysis of mapping results (Figure 3). The ARCSM procedure was executed using the ENVI 5.3 and Interactive Data Language (IDL) 8.5 platform (www.exelisvis.com).
2.3.1. Difference of NDVI (dNDVI) Approach
The land cover of rice fields has three main stages: (1) Flooding and transplanting; (2) growing rice plants, including tillering, panicle initiation, and head, and filling and milky; and (3) exposed soil after harvest [49]. The spectrum features in the 3 stages are significantly different. Specifically, the NDVI curve of a paddy rice field shows a low-high-low trend during the rice growth period. NDVI is low after transplantation in stage 1. In stage 2, it increases rapidly in the reviving to tillering, and reaches its peak value during the panicle initiation and heading stage. Then, when rice growth enters the filling and milky, NDVI begins to decrease, and declines to a low value after the harvest in stage 3.
Due to differences in phenology, the temporal profiles of NDVI differ significantly between DCR and SCR (Figure 4). Specifically, the NDVI curve of DCR has two peaks, while that of SCR only has one peak. From late May to early August (141 day of year (DOY) to 222 DOY), early rice is in the mature stage and its NDVI decreases, whereas SCR is in the growing stage and its NDVI increases. Sequentially, from late July to early October (202 DOY to 283 DOY), the NDVI of late rice increases while the NDVI of SCR decreases. Therefore, the inverse changes in NDVIs during a given time window can be detected to quickly and efficiently discriminate between DCR and SCR. Based on the paddy rice phenology, we can find two given time windows in which the NDVIs shows inverse changes: One is late May to early August (141 DOY to 222 DOY, time window 1), and the other is late July to early October (202 DOY to 283 DOY, time window 2) (Figure 4). In each time window, two images (acquired on t1 and t2) were used to calculate the difference of NDVIs to discriminate between DCR and SCR. To maximize the differences between NDVI changes in DCR and SCR, the t1 and t2 were limited to the early and final stage of the selected time window, respectively. For time window 1, t1 is in the period of late May to early June (141 DOY to 161 DOY) and t2 in the period of late July to early August (202 DOY to 222 DOY). Additionally, for time window 2, t1 is in the period of late July to early August (202 DOY to 222 DOY) and t2 is in the period of late September to early October (264 DOY to 283 DOY). If there were several proper images in the early or final stage of the selected time window, the image with less cloud cover was chosen.
If two time windows were both available for one scene, only one time window (time window 1 or time window 2) was selected depending on two criterions, including the image quality, mainly referring to the cloud cover ratio, and the interval of the acquisition time of two images (t1 and t2). The window with less cloud cover and long interval images was chosen. The less cloud cover can reduce the interference from cloud and cloud shadow, and a long interval of the two images in one window can maximize the differences between NDVI changes in DCR and SCR.
The dNDVI (difference of NDVIs) index was proposed to capture the differences in NDVI changes to discriminate between the DCR and SCR. The dNDVI was calculated using the following equation:
where NDVIt1 and NDVIt2 represent the NDVI values of images acquired on t1 and t2.
The value of dNDVI ranges from −2.0 to 2.0. A negative dNDVI value indicates that the NDVI of the candidate rice pixel increased in the selected time window and thus reflects a growing period, while a positive dNDVI value indicates a decreasing trend and thus reflects a mature period. Then, DCR or SCR is distinguished. For instance, if the two images are in time window 1, a pixel in the mature period represents DCR (early rice), while a pixel in the growing period represents SCR.
2.3.2. Single Image Threshold Method
The dNDVI approach highlights the difference in phenology between DCR and SCR and only requires two images in crucial time windows, which significantly reduces the demand for the amount of Landsat images. However, our goal was to monitor paddy rice cropping systems at a large scale in Southern China, which is located in the subtropics. Due to cloud and rain contamination, two images were not always available in crucial time windows in some regions, thus the dNDVI approach did not work. To overcome this problem, we used the single image threshold method proposed by Li [24] as a substitute to map rice cropping systems in these regions with insufficient images. This method is also a phenology-based algorithm. Figure 4 shows that the NDVI of DCR and SCR fields differs obviously during different growth periods. In early June (152 DOY to 161 DOY), the early rice is in the panicle initiation phase and has a high NDVI value, while the SCR is in the sowing phase and waterlogged with a low NDVI value. In late July (202 DOY to 212 DOY), the DCR is harvested or transplanted and has a low NDVI value, while the SCR is in the tillering phase and has a high NDVI value. In early October (274 DOY to 283 DOY), the DCR is in the grain fill phase and has a high NDVI value, while the SCR is harvested and has a low NDVI. Therefore, based on the NDVI differences, three optimum time windows can be used to discriminate the DCR and SCR. If a scene had available images in more than one time windows, one time window was selected depending on the quality of the image in each time window. Then, the typical sample sites obtained by field survey or visual interpretation were used to quantify the corresponding NDVI ranges of DCR and SCR in the selected time window. The proper threshold was determined through comparing the differences in ranges of DCR and SCR. The threshold value with a high classification accuracy (overall accuracy > 80%) was used to discriminate the DCR and SCR. Based on many tests, the threshold values were obtained for the different scenes and they varied from 0.55 to 0.7. This threshold method can effectively extract the distribution of paddy rice cropping systems at a local scale. However, because this threshold varies from region to region, it is not easy to apply this method at a large scale. Therefore, we used it as a substitute to the dNDVI approach.
2.3.3. Regional Implementation of the Rice Cropping System Mapping Methods
Due to insufficient Landsat images in Southern China, a joint strategy, based on the dNDVI approach and supplemented by the threshold method was applied to regionally map rice cropping systems. At first, the dNDVI approach or threshold method was chosen for each scene depending on the quantity of available images in crucial time windows. The dNDVI approach took precedence, while the threshold method substituted. Then, the chosen method was applied to the corresponding scene and the single map of the rice cropping system distribution was generated. Finally, we mosaicked all single distribution maps into a final whole distribution map. Figure 5 shows the distributions of scenes to which the threshold method or dNDVI approach was applied.
2.3.4. Accuracy Assessment
We used the validation sites collected via field surveys and the visual interpretation of Landsat images and Google Earth images to access resultant maps of 1990 and 2015. Each final distribution map was validated as a whole to access the feasibility and effectiveness of the joint strategy. A confusion matrix was created to calculate conventional classification accuracy statistics (i.e., overall accuracy and kappa index). In addition, we compared the Landsat-derived proportion of the DCR area to the total rice sown area with that from the statistical data to assess the mapping results.
3. Results
3.1. Landsat-Derived Rice Cropping System Maps in 1990 and 2015
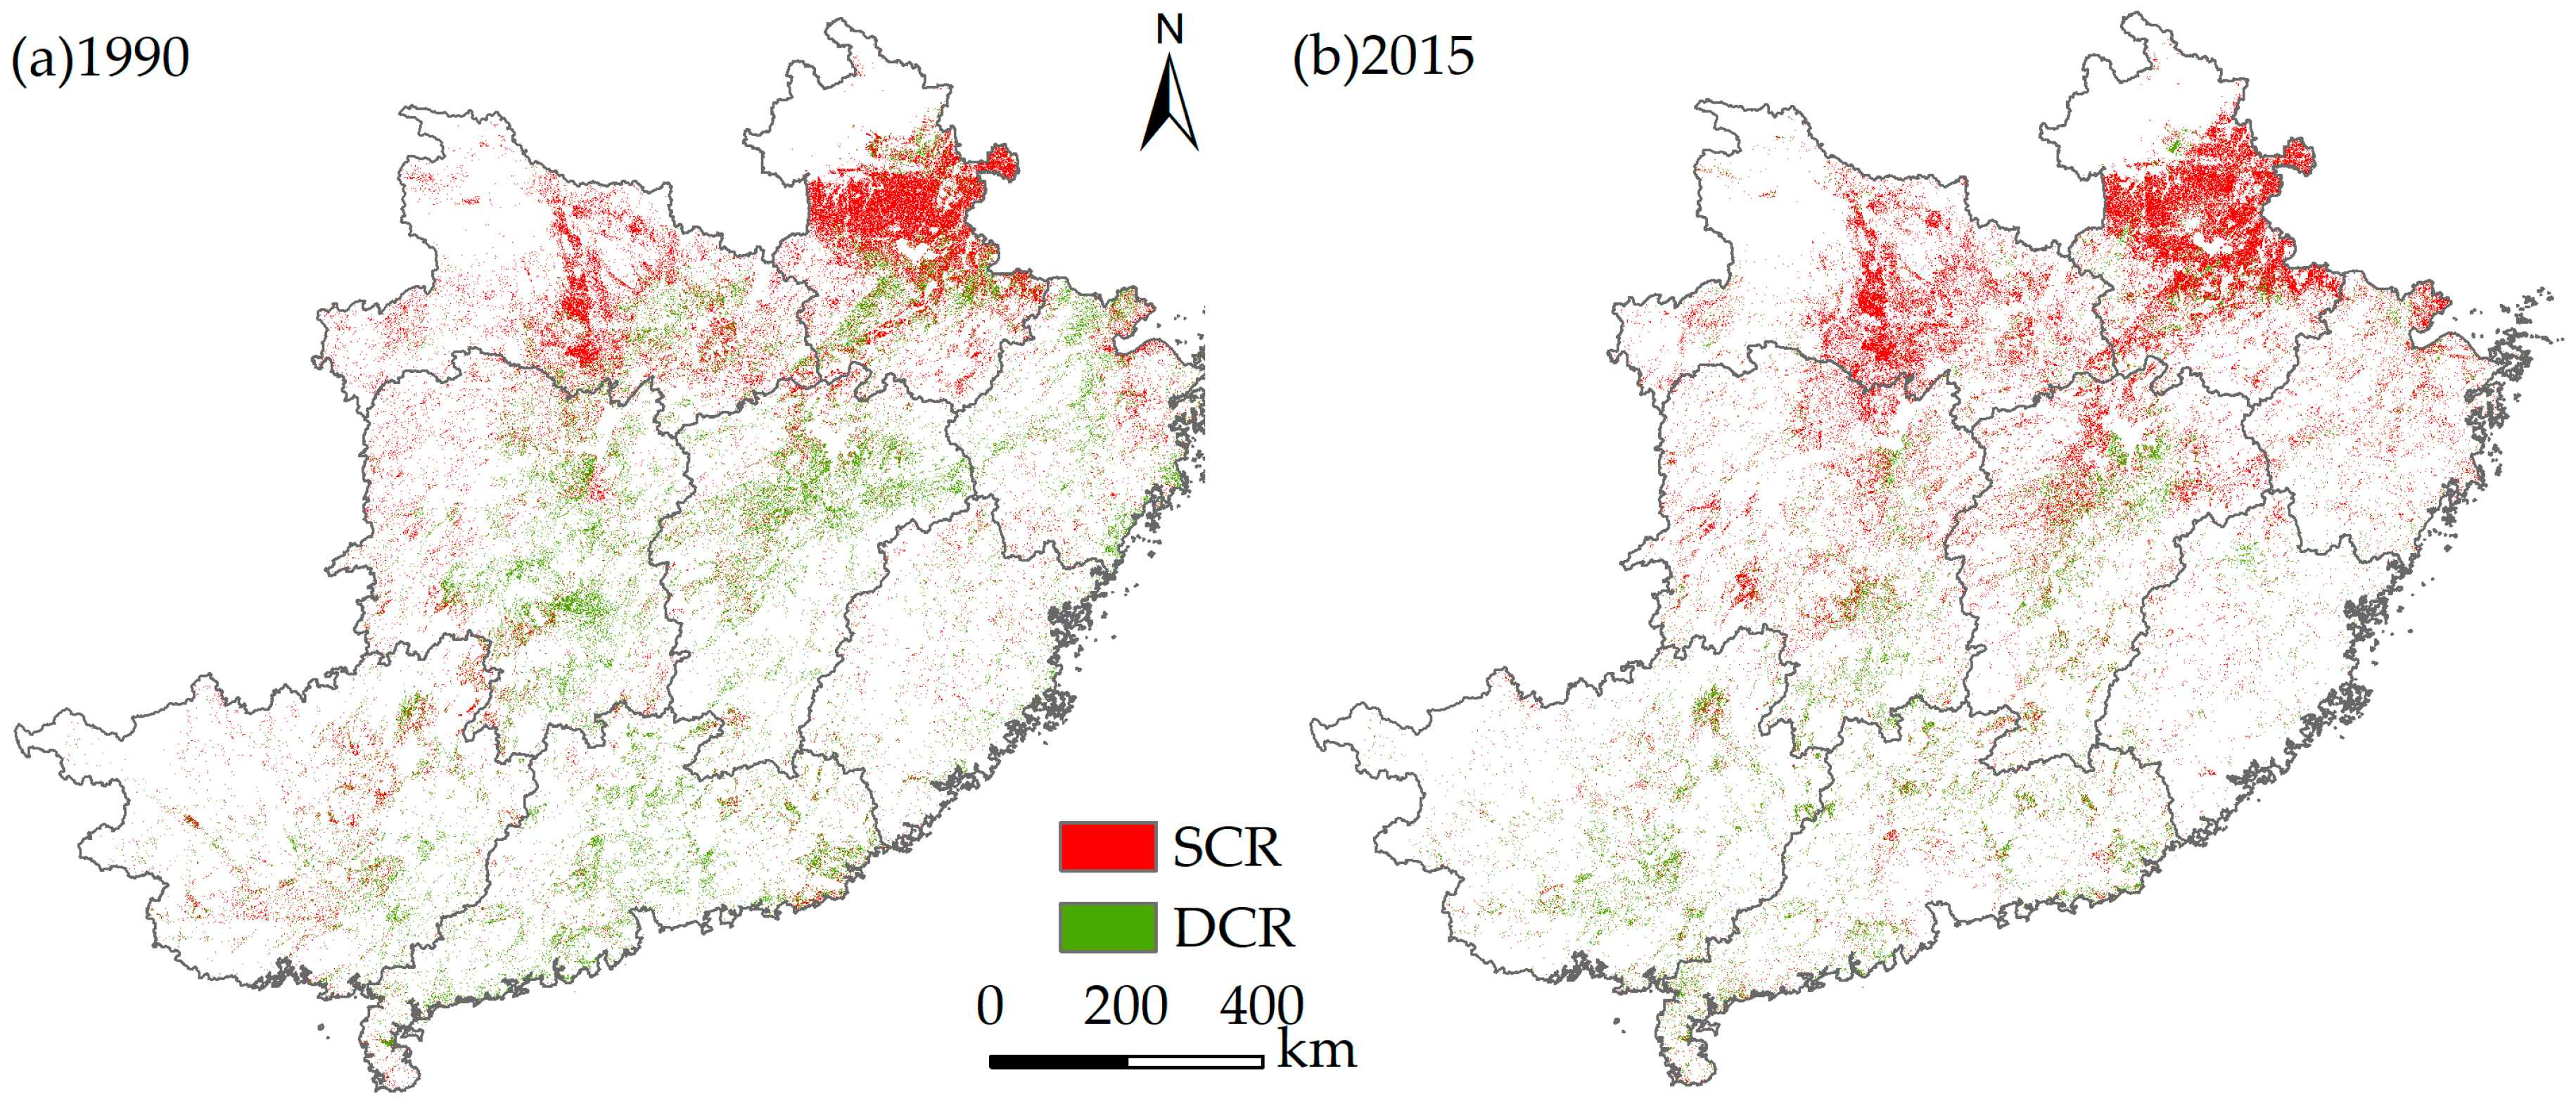
In 1990, double and single rice planting areas in Southern China were 71,605.65 km2 and 76,677.71 km2, respectively. The total rice sown area was 219,889.01 km2, and the index of multiple cropping was 148.29%. From the perspective of spatial distribution (Figure 6a), DCR areas were mainly distributed in eastern Guangxi, Guangdong, the Jianghan Plain, the Dongting Lake Plain, the Poyang Lake Plain, Southern Anhui, and northern Zhejiang. SCR areas were mainly distributed in the Jianghuai Plain, the western mountain areas of Hubei and Hunan, the Zhejiang-Fujian hilly region, and the mountain areas in western Guangxi.
Compared with 1990, in 2015, DCR planting areas decreased to 41,078.4 km2, while SCR planting areas increased to 96,788.45 km2. The total rice sown area decreased to 178,945.24 km2, and the index of multiple cropping decreased to 129.8%. In terms of spatial distribution (Figure 6b), DCR areas were mainly distributed in the southern region of the study area, including Guangdong and Guangxi, the northern and coastal areas of Fujian, the Dongting Lake Plain, the Poyang Lake Plain, Southern Jiangxi, and Southern Hunan. SCR areas were mainly located in the northern region of the study area, including the Jianghan Plain, the Jianghuai Plain, the western mountain areas of Hubei and Hunan, the southern hilly areas of Anhui and Zhejiang, and the middle hilly areas of Fujian.
3.2. Accuracy Assessment
The accuracy assessments of the resultant rice cropping system maps in 1990 and 2015 were conducted using the validation of sites through the confusion matrix; the results indicated that the resultant rice cropping system maps had high accuracies (Table 1). The overall accuracies were 88.83% and 86.55% in 1990 and 2015, respectively, while the Kappa coefficients were 0.75 and 0.72, respectively. The user accuracies and producer accuracies were all greater than 80%. The overall accuracy in 1990 was higher than that in 2015 because of the relatively sufficient numbers of high quality Landsat images in 1990, which was consistent with previous research in Northern China [28] This study also indicated that the ACRSM strategy is reliable when a sufficient amount of good Landsat images are available.
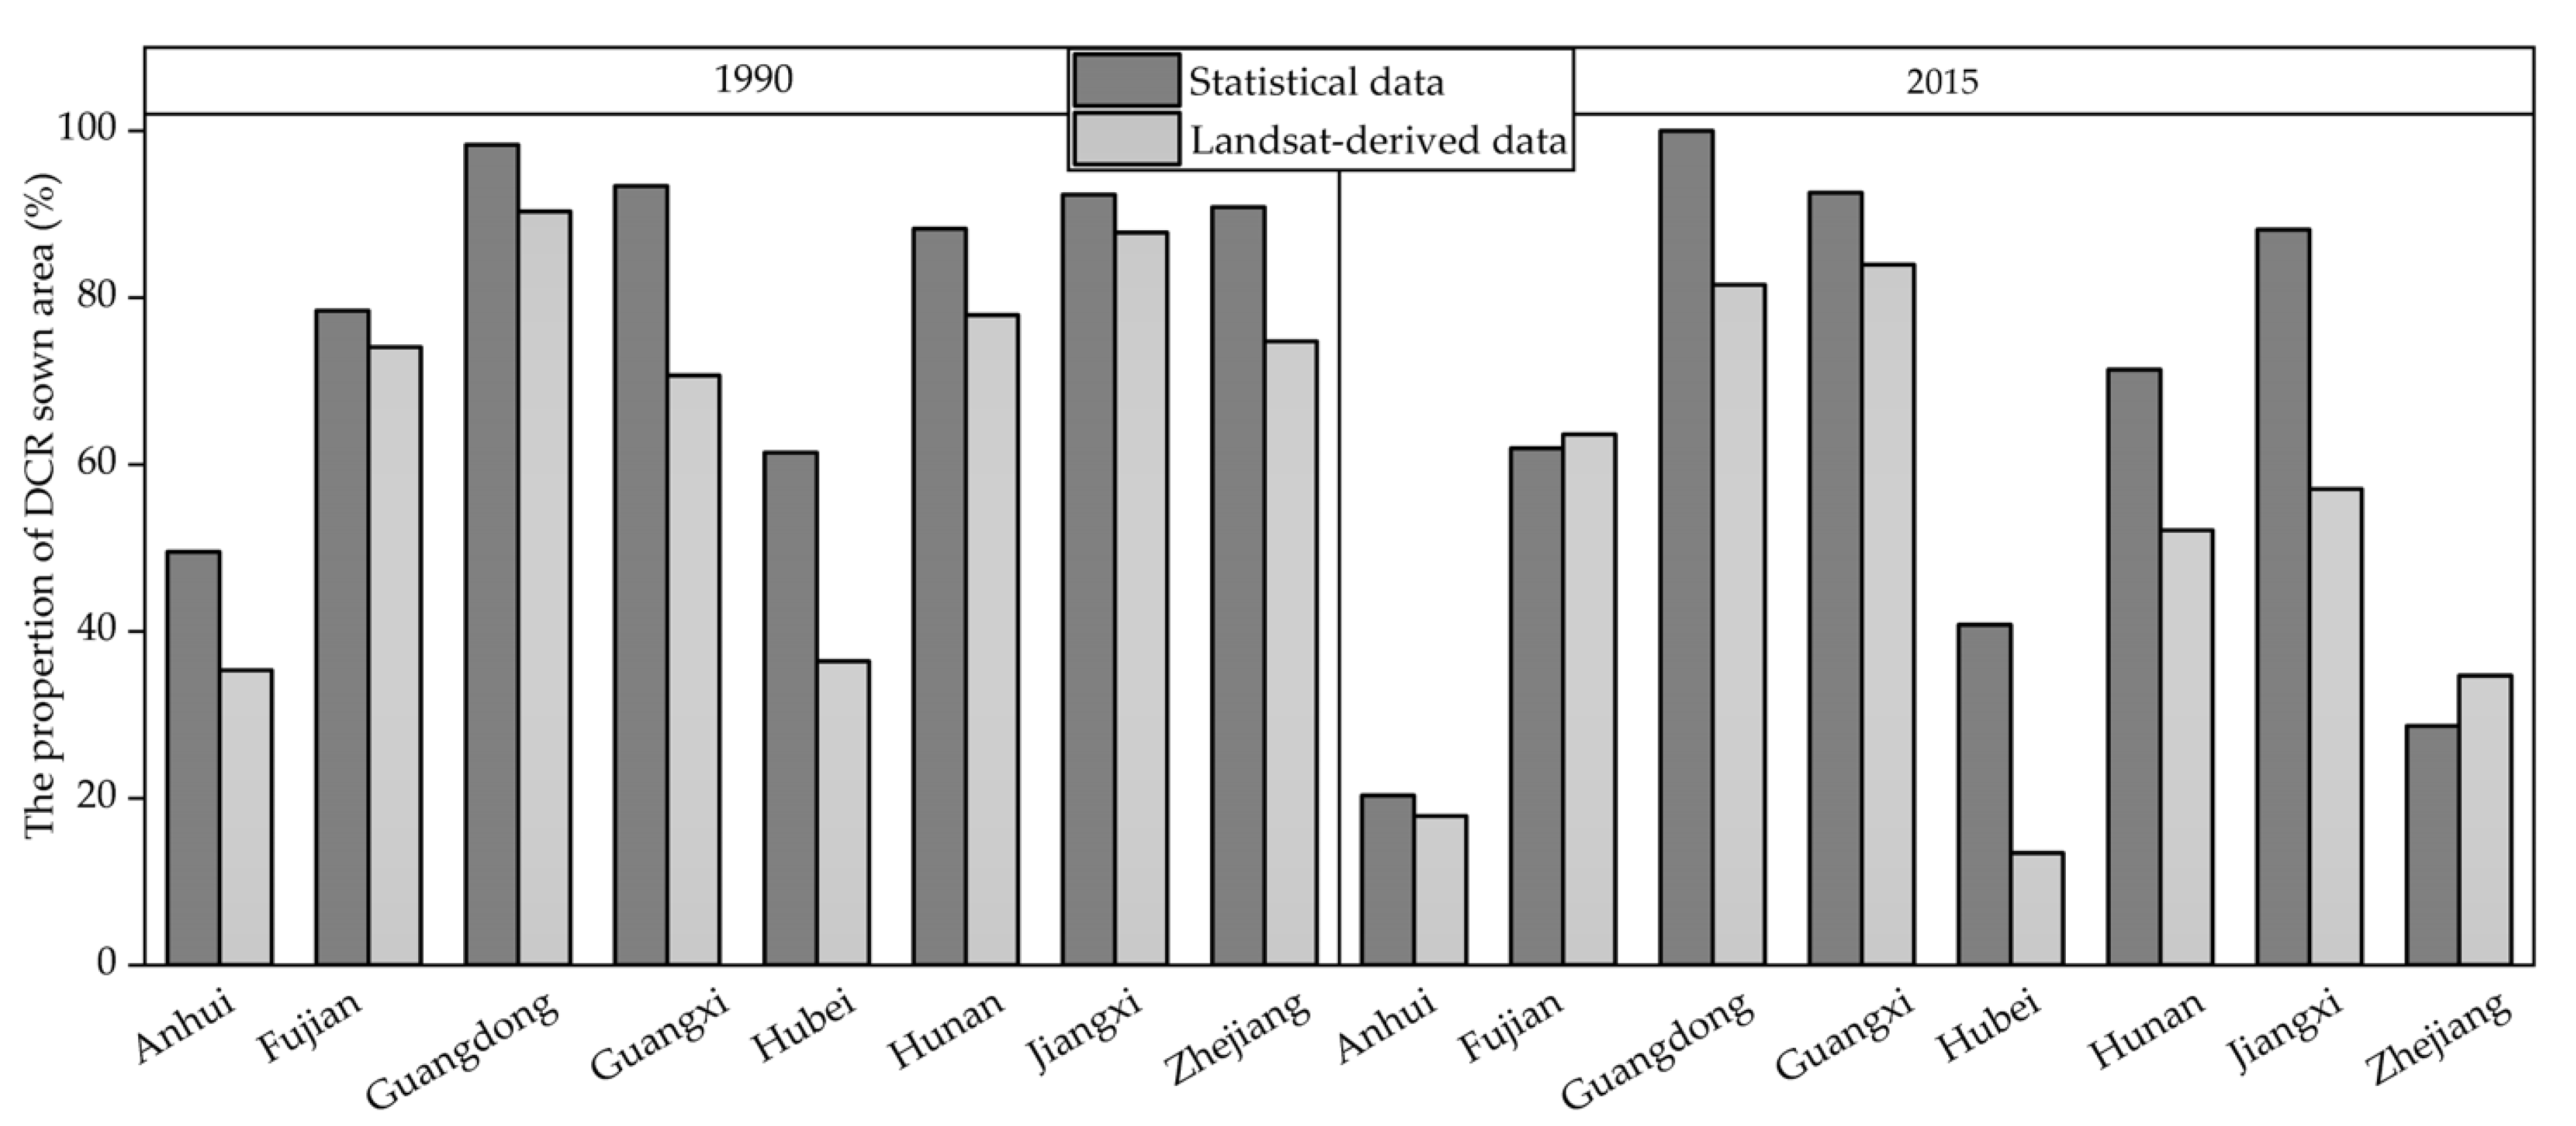
To further assess the accuracy of the resultant rice cropping system maps, the Landsat-derived proportions of the DCR area to the total rice sown area were compared to that from the statistical data at the provincial level. Figure 7 shows that the Landsat-derived results have good correlations with statistical data at the provincial scale, which indicates that the Landsat-derived cropping system maps adequately described the rice cropping system patterns of Southern China. The Landsat-derived DCR area proportions of the entire study region in 1990 and 2015 were both underestimated, with differences of 0.18% and 0.21%, respectively. The discrepancy between the Landsat-derived and the statistic DCR area proportions may be due to: (1) The limited ability of the 30-m spatial resolution of Landsat images to identify small patches of paddy rice; or (2) the failure of statistical data to monitor the changes from DCR to SCR in a timely manner, leading to the overestimation of DCR areas in some regions. For example, statistical data show that there was no single cropping rice in Guangdong in 2015, whereas Google Earth images demonstrated that single cropping rice was planted in the northern mountainous areas of Guangdong.
3.3. Spatiotemporal Changes in Rice Cropping Systems in Southern China during 1990–2015
From 1990–2015, the proportion of DCR sown areas in Southern China decreased from 65.1% to 45.9%, and the spatial distribution of rice cropping systems showed a “double rice shrinking and single rice expanding” (DSSE) change pattern from north to south.
From the perspective of the conversion between DCR and SCR, the most dramatic DSSE changes occurred in the Middle-Lower Yangtze Plain, including the Hubei and Hunan Plain, the Poyang Lake Plain, the Yangtze River coast in Southern Anhui, and Zhejiang, where traditional DCR and SCR mixed cropping areas were located. These regions experienced a shift from DCR-dominated cropping system patterns to SCR-dominated cropping system patterns from 1990–2015. The hilly area of Fujian and the suburban area around Guangzhou City also showed a pattern of changing from DCR to SCR. Only middle and eastern Guangxi showed an inverse change, transitioning from SCR to DCR. A total field area of 25,421.27 km2 transformed from DCR to SCR in Southern China from 1990 to 2015, which accounted for 26% of the total area of the fields in which rice was continuously planted from 1990 to 2015, while a total field area of 7530.24 km2 transformed from SCR to DCR, which only accounted for 7.73%.
In terms of the conversion between paddy rice fields and non-paddy rice (NCR) fields, the field area that transformed from NCR to SCR (27,211.65 km2) was twice as large as the area that transformed from NCR to DCR (13,291.67 km2); the field area that transformed from DCR to NCR (25,964.85 km2) was larger than the area that transformed from SCR to NCR (24,996.9 km2). The decrease in DCR fields and increase in SCR fields indicated that the pattern of DSSE was prevalent in Southern China.
At the provincial scale (Table 2), from 1990–2015, most provinces in Southern China exhibited the same cropping system change trend, i.e., the shift from DCR to SCR. Specifically, in terms of rice sown areas, all provinces, except for Guangxi and Fujian, showed a “double rice decreased and SCR increased” change pattern. Guangxi experienced an inverse change pattern, where DCR increased and SCR decreased. The double and single rice sown areas of Fujian both decreased. In terms of the proportion of DCR sown areas, all seven provinces except for Guangxi showed a decreasing trend. Among them, the largest decrease in the DCR sown area proportion occurred in Zhejiang, which reached 40.3%, thus indicating that the change in the rice cropping system in Zhejiang was more intensive; the smallest decrease of 8.75% occurred in Guangdong, which indicated that its cropping system was relatively stable.
4. Discussion
4.1. Advantages of the ARCSM Procedure
Due to limited data availability, only a few previous studies have focused on the monitoring of rice cropping systems at a large scale [16,29]. Previous efforts to perform large-scale paddy rice mapping have generally focused on tropical or subtropical regions using MODIS datasets with high temporal resolution [17,37]. However, the coarse spatial resolution of MODIS reduces the accuracy of maps in Southern China, where paddy rice patches are fragmented and smaller than MODIS pixels and cropping systems are more complex. The ARCSM procedure combined the dNDVI method and NDVI threshold method to monitor the distribution of rice cropping systems in Southern China, which only needs one or two Landsat images in proper phenology time windows. The procedure provided an efficient strategy to remove the limitation of image quantity compared with approaches with a higher temporal resolution. Therefore, this approach can map rice cropping systems in Southern China at a large-scale using Landsat images. Compared with MODIS data, the spatial resolution of a Landsat image is similar to the area of most land patches in Southern China, which can reduce the effect of mixed pixels and improve the reliability of mapping results. Finer-resolution maps reveal changes in rice cropping systems in Southern China more explicitly and accurately.
Especially, the dNDVI method highlights the differences in temporal changes in NDVI in critical time windows. Compared with the threshold method, which involves using subjective judgements to determine thresholds, the dNDVI approach is not only more scientific and objective, but also dramatically reduces the workload by omitting the step of determining thresholds.
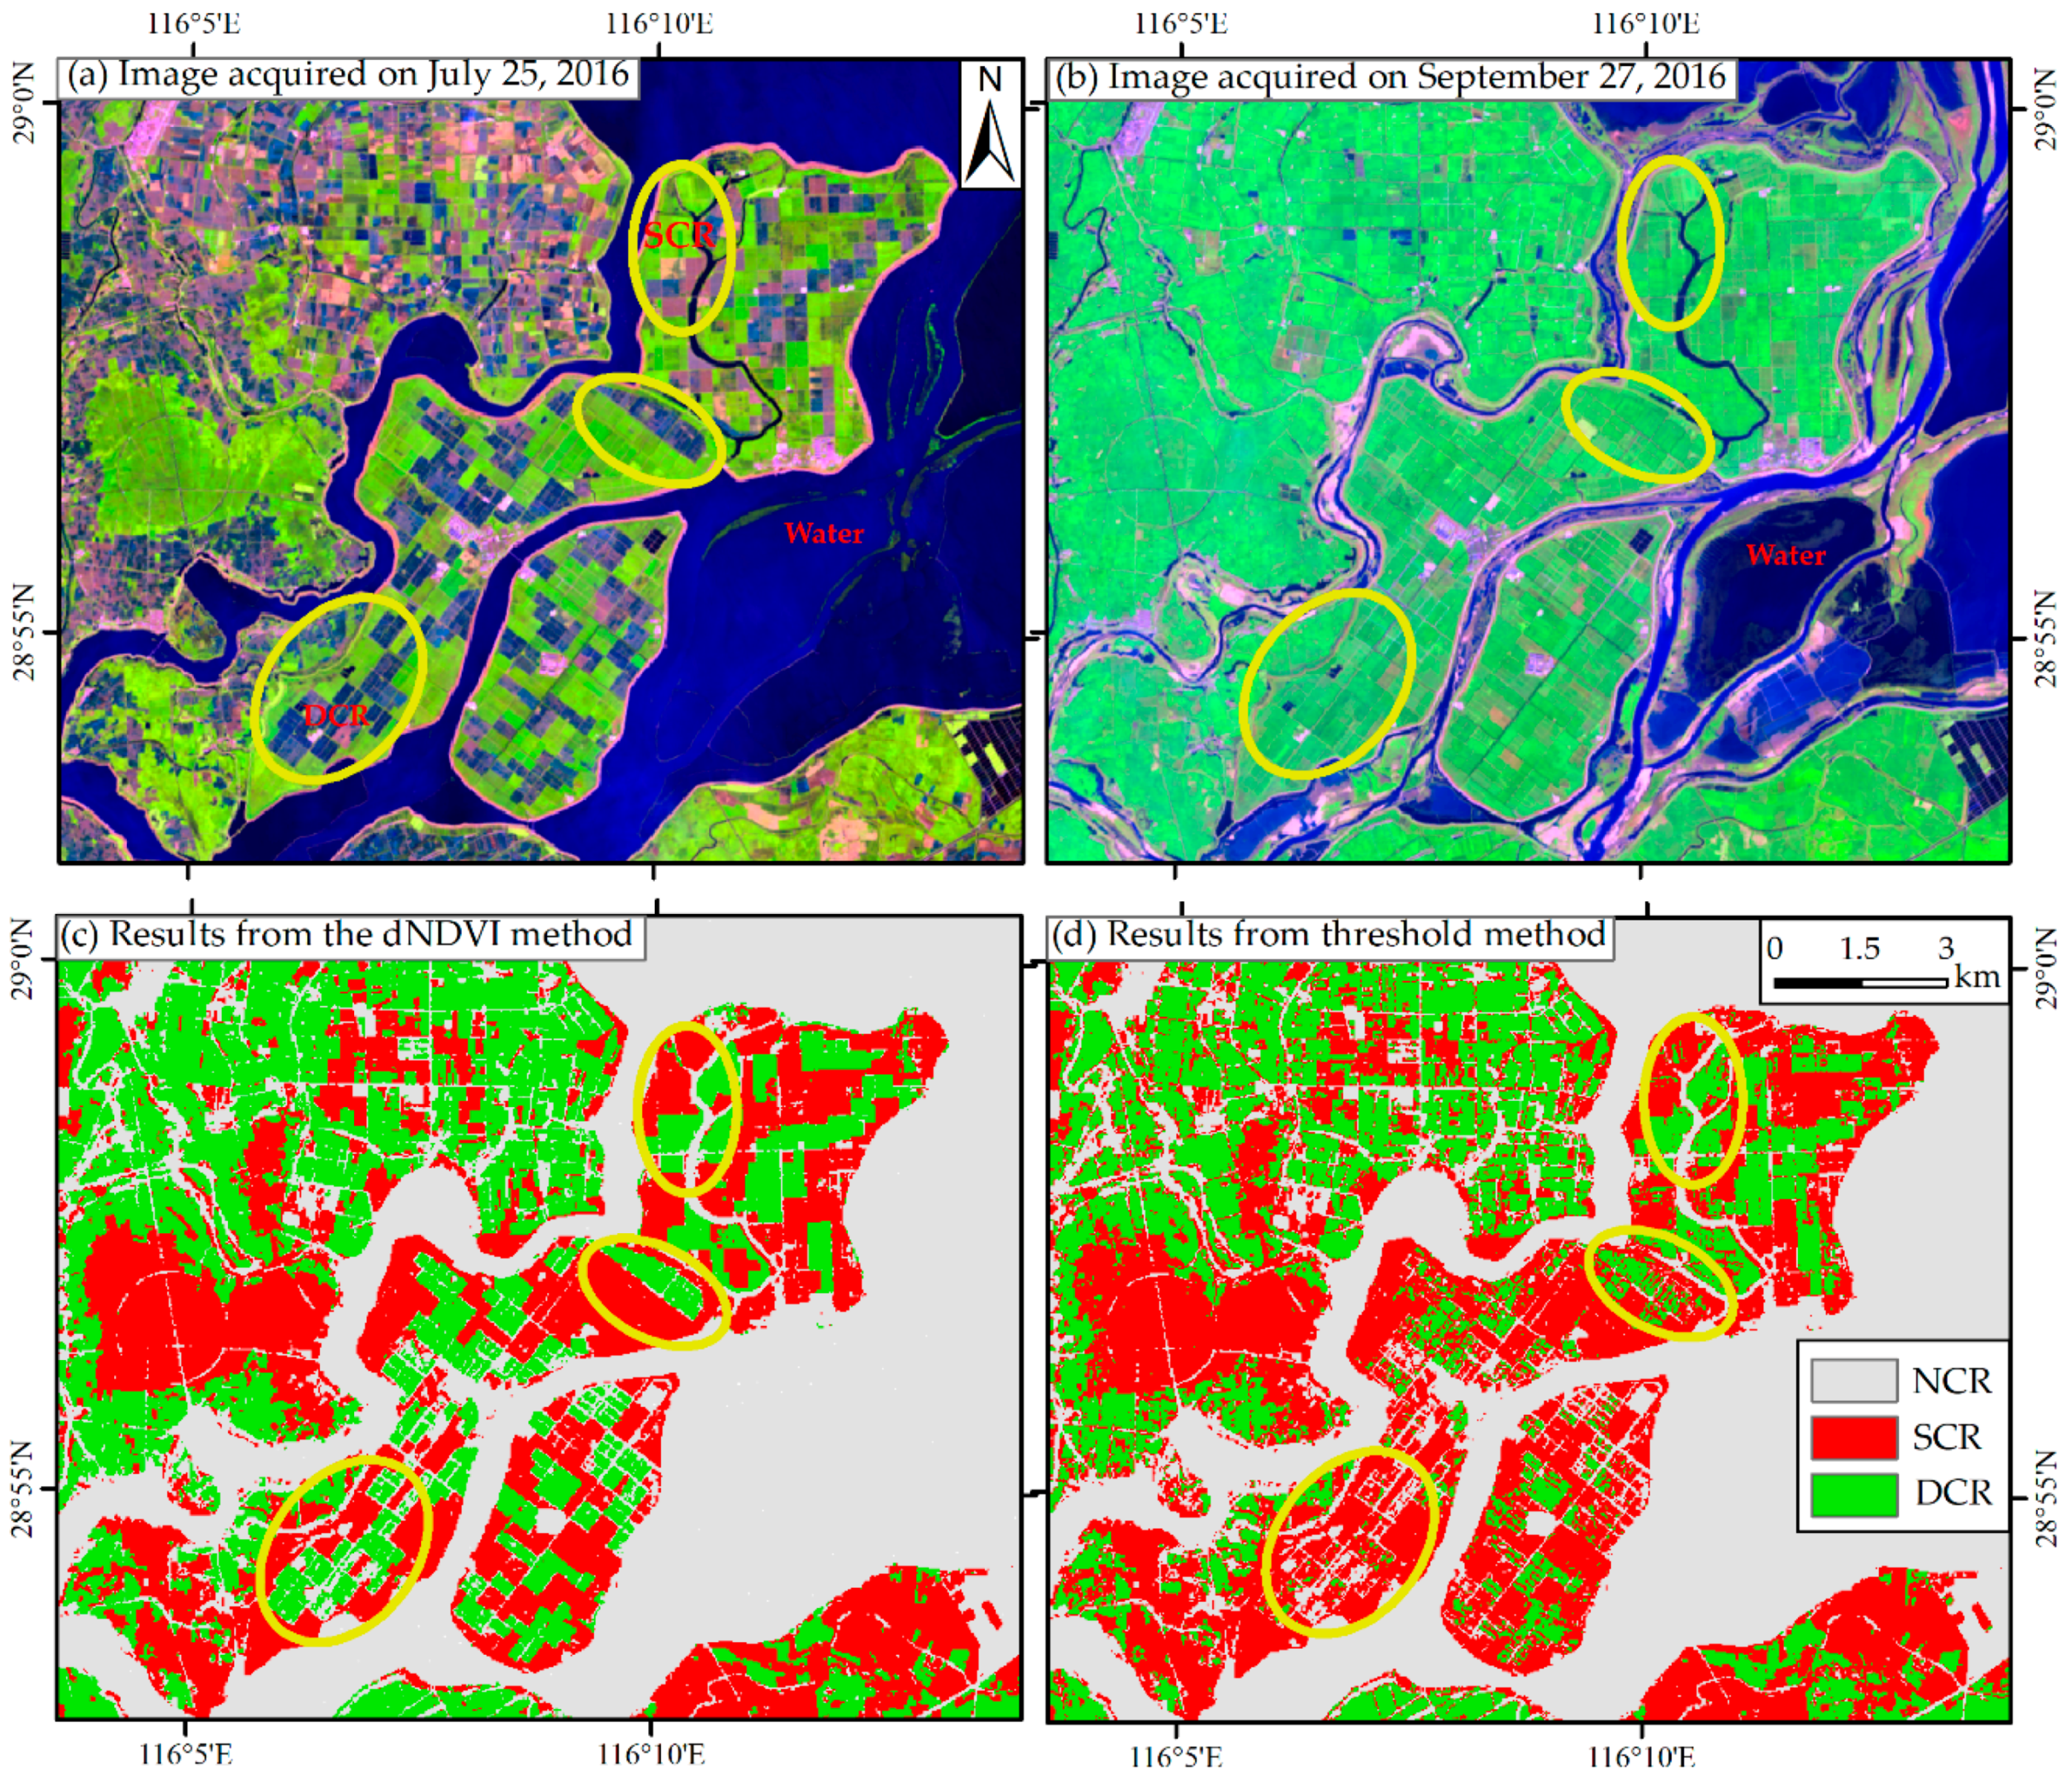
To further compare the efficiency of the dNDVI method and the threshold method, we monitored the distribution of DCR and SCR for a sample scene (path/row 121/40) using both methods. Based on the phenological features of DCR and SCR, 50 regions of interest (ROI) of DCR and SCR (5682 pixels) in the sample scene were randomly and evenly generated from Landsat 8 images (acquired on July 25 and September 27, 2016) to carry out accuracy assessments. The overall accuracies of the dNDVI method and the threshold method were 93.4% and 83.3%, respectively. Figure 8 shows the detailed pattern of DCR and SCR distribution in part of the sample scene. The green areas and dark blue or pink areas within the yellow ellipse are SCR and DCR fields in Figure 8a, respectively, and the sage green to gray areas and bright green within the yellow ellipse are corresponding SCR and DCR fields in Figure 8b. It is obvious that the resultant map derived from the dNDVI (Figure 8c) is closer to the actual situation than that derived from the threshold method (Figure 8d). Therefore, the dNDVI method performs much better than the threshold method in discriminating rice cropping systems.
4.2. Sources of Uncertainty
Because our study area was large, this study requires the use of many images to discriminate between rice cropping systems. It is difficult or impossible to generate an annual paddy rice map from a single year of Landsat images, due to the limited number of images per year (associated with the long revisit cycle of 16 days) and variable data quality (i.e., clouds, cloud shadows, SLC-off in Landsat 7). Therefore, we combined the images in an epoch near 1990 or 2015 to measure changes in the distribution of rice cropping systems in Southern China. However, using images from different years may introduce uncertainties due to inter-annual variations in rice cropping systems. To minimize the impact of inter-annual fluctuations in rice cropping systems, we limited the images to the periods of 1988–1994 and 2013–2016, when the rice sown areas were relatively stable according to statistical data.
We used the paddy maps in 1990 and 2015 as masks to reduce interferences from other land cover types. However, the uncertainties of paddy rice maps might affect the accuracy of rice cropping system maps. Using paddy rice maps with a higher spatial resolution could significantly improve the reliability of the rice cropping system classification.
4.3. Reasons for Changes in Rice Cropping Systems
From 1990 to 2015, Southern China experienced changes in rice cropping systems from DCR to SCR, exhibiting a DSSE spatial change pattern from north to south. These changes were in line with the grain transport pattern, which changed from “south to north” to “north to south” throughout all of China [7,8,23]. Previous studies have indicated that rapidly rising labor costs and labor scarcity due to economic growth and urbanization were the key driving forces of the “double-to-single” rice cropping system changes [50,51,52]. Rising labor costs contribute to rising rice planting costs. Meanwhile, rising labor costs increase off-farm work opportunities, attracting more of the labor force to non-agricultural industries and resulting in agricultural labor scarcity. Older adults and women then become the main agricultural labor force, resulting in the shift from highly labor-intensive DCR to less labor-intensive SCR. To encourage the planting of DCR, the Chinese government has implemented a series of strong policies, such as the elimination of agricultural taxes and subsidies in the form of cash, high-quality grain seeds, and machinery. However, those polices only slightly increased the rice sown area, and the “double to single” trend did not stop.
In addition, the changes in cropping systems in different regions showed different patterns in the context of “double to single” changes in Southern China. DCR requires an extraordinary amount of work, especially during the harvesting of early rice and the transplanting of late rice (called “shuangqiang” or “rush-harvesting and rush-planting”). Most of this work must be completed in a “rush-harvesting and rush-planting” period in a short time window, thus creating an urgent need for labor. Due to variations in the accumulated temperature, the length of the “rush-harvesting and rush-planting” time window varies, resulting in differences in labor intensity. The transformation from DCR to SCR was more dramatic in the regions where “rush-harvesting and rush-planting” occurred within a short time window, such as Anhui, Hubei, Jiangxi, and Zhejiang; this transformation was much less dramatic in regions with a relatively long time window, such as Guangdong and Guangxi.
Considering the process of urbanization, further increases in labor wages, and the aged tendency of the population, "double to single" changes may become aggravated in the future. However, the dominant factors and inner driving mechanism of these changes are still unclear and require further analysis.
5. Conclusions
This study developed the ARCSM procedure, combining the dNDVI method and NDVI threshold method, to monitor the distribution of rice cropping systems in Southern China using Landsat images. The ARCSM procedure is an efficient strategy to track changes in paddy rice cropping systems in subtropical and tropical regions, and the overall accuracies in 1990 and 2015 were both high. This procedure can reduce the limitations of Landsat data caused by cloud coverage and shadows.
From 1990–2015, rice cropping systems in Southern China showed a DSSE change pattern from north to south. DCR sown areas decreased by 61,054.5 km2, SCR sown areas increased by 20,110.74 km2, and the proportion of DCR sown areas decreased by approximately 20%. The most dramatic DSSE changes occurred in the Middle-Lower Yangtze Plain.
Due to the limited data availability, the ARCSM approach used the dNDVI method and the threshold method to map rice cropping systems based on the available number of images. However, using the combination of these two methods in ARCSM introduced uncertainties. In further studies, we will use more images with finer spatial resolution, such as Sentinel images, to enhance our data sources; then, we will only employ the more scientific and subjective dNDVI method to map rice cropping systems. In addition, the dominant factors and inner driving mechanism of changes in rice cropping system will be discussed in order to provide a scientific basis for optimizing planting structures and water resource allocation in Southern China.
Author Contributions
Conceptualization, M.J. and X.L.; Data curation, M.J.; Formal analysis, M.J. and X.L.; Funding acquisition, X.L.; Investigation, M.J. and R.W.; Methodology, M.J. and L.X.; Project administration, X.L.; Resources, X.L. and M.T.; Software, M.J.; Supervision, X.L.; Validation, M.J. and R.W.; Visualization, M.J.; Writing—original draft, M.J.; Writing—review & editing, L.X., X.L. and M.T.
Funding
This research was funded by the National Natural Science Foundation of China (Grant Nos. 41571095 and 41161140352).
Acknowledgments
We thank Professor Bingfang Wu from the Institute of Remote Sensing and Digital Earth, CAS, for providing the land use data.
Conflicts of Interest
The authors declare no conflict of interest.
References
- FAOSTAT. FAOSTAT Database. Food and Agriculture Organization of the United Nations. 2016. Available online: http://www.fao.org/faostat/en/#data/QC (accessed on 24 December 2018).
- Bouman, B. How much water does rice use? Rice Today 2009, 8, 28–29. [Google Scholar]
- Neue, H.U. Fluxes of methane from rice fields and potential for mitigation. Soil Use Manage 1997, 13, 258–267. [Google Scholar] [CrossRef]
- Sass, R.L.; Fisher, F.M.; Ding, A.; Huang, Y. Exchange of methane from rice fields: National, regional, and global budgets. JGR Atmos. 1999, 104, 26943–26951. [Google Scholar] [CrossRef] [Green Version]
- Tian, Z.; Niu, Y.; Fan, D.; Sun, L.; Ficsher, G.; Zhong, H.; Deng, J.; Tubiello, F.N. Maintaining rice production while mitigating methane and nitrous oxide emissions from paddy fields in China: Evaluating tradeoffs by using coupled agricultural systems models. Agric. Syst. 2018, 159, 175–186. [Google Scholar] [CrossRef]
- Dong, J.; Xiao, X. Evolution of regional to global paddy rice mapping methods: A review. ISPRS J. Photogramm. Remote Sens. 2016, 119, 214–227. [Google Scholar] [CrossRef]
- Li, Z.; Liu, Z.; Anderson, W.; Yang, P.; Wu, W.; Tang, H.; You, L. Chinese Rice Production Area Adaptations to Climate Changes, 1949–2010. Environ. Sci. Technol. 2015, 49, 2032–2037. [Google Scholar] [CrossRef]
- Liu, Z.; Li, Z.; Tang, P.; Li, Z.; Wu, W.; Yang, P.; You, L.; Tang, H. Change analysis of rice area and production in China during the past three decades. J. Geogr. Sci. 2013, 23, 1005–1018. [Google Scholar] [CrossRef]
- Wardlow, B.D.; Egbert, S.L. Large-area crop mapping using time-series MODIS 250 m NDVI data: An assessment for the U.S. Central Great Plains. Remote Sens. Environ. 2008, 112, 1096–1116. [Google Scholar] [CrossRef]
- Chang, J.; Hansen, M.C.; Pittman, K.; Carroll, M.; DiMiceli, C. Corn and Soybean Mapping in the United States Using MODIS Time-Series Data Sets. Agron. J. 2007, 99, 1654–1664. [Google Scholar] [CrossRef] [Green Version]
- Ganguli, A.C.; Vermeire, L.T.; Mitchell, R.B.; Wallace, M.C. Comparison of Four Nondestructive Techniques for Estimating Standing Crop in Shortgrass Plains. Agron. J. 2000, 92, 1211–1215. [Google Scholar] [CrossRef]
- Singha, M.; Wu, B.; Zhang, M. An Object-Based Paddy Rice Classification Using Multi-Spectral Data and Crop Phenology in Assam, Northeast India. Remote Sens. 2016, 8, 479. [Google Scholar] [CrossRef]
- Chen, C.F.; Chen, C.R.; Son, N.T.; Chang, L.Y. Delineating rice cropping activities from MODIS data using wavelet transform and artificial neural networks in the Lower Mekong countries. Agric. Ecosyst. Environ. 2012, 162, 127–137. [Google Scholar] [CrossRef]
- Dong, J.; Xiao, X.; Zhang, G.; Menarguez, M.A.; Choi, C.Y.; Qin, Y.; Luo, P.; Zhang, Y.; Moore, B. Northward expansion of paddy rice in northeastern Asia during 2000–2014. Geophys. Res. Lett. 2016, 43, 3754–3761. [Google Scholar] [CrossRef] [PubMed]
- Xiao, X.; Boles, S.; Frolking, S.; Li, C.; Babu, J.Y.; Salas, W.; Moore Iii, B. Mapping paddy rice agriculture in South and Southeast Asia using multi-temporal MODIS images. Remote Sens. Environ. 2006, 100, 95–113. [Google Scholar] [CrossRef]
- Xiao, X.; Boles, S.; Liu, J.; Zhuang, D.; Frolking, S.; Li, C.; Salas, W.; Moore Iii, B. Mapping paddy rice agriculture in southern China using multi-temporal MODIS images. Remote Sens. Environ. 2005, 95, 480–492. [Google Scholar] [CrossRef]
- Qiu, B.; Li, W.; Tang, Z.; Chen, C.; Qi, W. Mapping paddy rice areas based on vegetation phenology and surface moisture conditions. Ecol. Indic. 2015, 56, 79–86. [Google Scholar] [CrossRef]
- Qiu, B.; Zhong, M.; Tang, Z.; Wang, C. A new methodology to map double-cropping croplands based on continuous wavelet transform. Int. J. Appl. Earth Obs. Geoinf. 2014, 26, 97–104. [Google Scholar] [CrossRef]
- Peng, D.; Huete, A.R.; Huang, J.; Wang, F.; Sun, H. Detection and estimation of mixed paddy rice cropping patterns with MODIS data. Int. J. Appl. Earth Obs. Geoinf. 2011, 13, 13–23. [Google Scholar] [CrossRef]
- Zhang, M.; Zhou, Q.; Chen, Z.; Jia, L.; Yong, Z.; Cai, C. Crop discrimination in Northern China with double cropping systems using Fourier analysis of time-series MODIS data. Int. J. Appl. Earth Obs. Geoinf. 2008, 10, 476–485. [Google Scholar]
- Bridhikitti, A.; Overcamp, T.J. Estimation of Southeast Asian rice paddy areas with different ecosystems from moderate-resolution satellite imagery. Agric. Ecosyst. Environ. 2012, 146, 113–120. [Google Scholar] [CrossRef]
- Zhang, G.; Xiao, X.; Biradar, C.M.; Dong, J.; Qin, Y.; Menarguez, M.A.; Zhou, Y.; Zhang, Y.; Jin, C.; Wang, J.; et al. Spatiotemporal patterns of paddy rice croplands in China and India from 2000 to 2015. Sci. Total Environ. 2017, 579, 82–92. [Google Scholar] [CrossRef]
- Sun, H.; Huang, J.; Huete, A.R.; Peng, D.; Zhang, F. Mapping paddy rice with multi-date moderate-resolution imaging spectroradiometer (MODIS) data in China. J. Zhejiang Univ. Sci. A 2009, 10, 1509–1522. [Google Scholar] [CrossRef]
- Li, P.; Feng, Z.; Jiang, L.; Liu, Y.; Xiao, X. Changes in rice cropping systems in the Poyang Lake Region, China during 2004–2010. J. Geogr. Sci. 2012, 22, 653–668. [Google Scholar] [CrossRef] [Green Version]
- Liu, J.; Liu, M.; Tian, H.; Zhuang, D.; Zhang, Z.; Zhang, W.; Tang, X.; Deng, X. Spatial and temporal patterns of China’s cropland during 1990–2000: an analysis based on Landsat TM data. Remote Sens. Environ. 2005, 98, 442–456. [Google Scholar] [CrossRef]
- Zhou, Y.; Xiao, X.; Qin, Y.; Dong, J.; Zhang, G.; Kou, W.; Jin, C.; Wang, J.; Li, X. Mapping paddy rice planting area in rice-wetland coexistent areas through analysis of Landsat 8 OLI and MODIS images. Int. J. Appl. Earth Obs. Geoinf. 2016, 46, 1–12. [Google Scholar] [CrossRef] [PubMed] [Green Version]
- Pan, X.; Uchida, S.; Liang, Y.; Hirano, A.; Sun, B. Discriminating different landuse types by using multitemporal NDXI in a rice planting area. Int. J. Remote Sens. 2010, 31, 585–596. [Google Scholar] [CrossRef]
- Dong, J.; Xiao, X.; Kou, W.; Qin, Y.; Zhang, G.; Li, L.; Jin, C.; Zhou, Y.; Wang, J.; Biradar, C.; et al. Tracking the dynamics of paddy rice planting area in 1986–2010 through time series Landsat images and phenology-based algorithms. Int. J. Remote Sens. 2015, 160, 99–113. [Google Scholar] [CrossRef] [Green Version]
- Dong, J.; Xiao, X.; Menarguez, M.A.; Zhang, G.; Qin, Y.; Thau, D.; Biradar, C.; Iii, B.M. Mapping paddy rice planting area in northeastern Asia with Landsat 8 images, phenology-based algorithm and Google Earth Engine. Int. J. Remote Sens. 2016, 185, 142. [Google Scholar] [CrossRef] [PubMed]
- Qiu, B.; Lu, D.; Tang, Z.; Chen, C.; Zou, F. Automatic and adaptive paddy rice mapping using Landsat images: Case study in Songnen Plain in Northeast China. Sci. Total Environ. 2017, 598, 581. [Google Scholar] [CrossRef]
- Liu, Y.; Xiao, C.; Li, P.; Jiang, L. Monitoring Rice Cropping System Changes in the Major Rice-producing Area of Poyang Lake Plain Using Landsat Images during 2005-2013. J. Nat. Resour. 2016, 31, 2086–2098. (In Chinese) [Google Scholar]
- Liu, Y.; Song, W.; Deng, X. Changes in crop type distribution in Zhangye City of the Heihe River Basin, China. Appl. Geogr. 2016, 76, 22–36. [Google Scholar] [CrossRef] [Green Version]
- Lam-Dao, N. Rice Crop Monitoring Using New Generation Synthetic Aperture Radar (SAR) Imagery. Ph.D. Thesis, University of Southern Queensland, Queensland, Australia, 2009. [Google Scholar]
- Bouvet, A.; Le Toan, T. Use of ENVISAT/ASAR wide-swath data for timely rice fields mapping in the Mekong River Delta. Remote Sens. Environ. 2011, 115, 1090–1101. [Google Scholar] [CrossRef] [Green Version]
- Setiyono, T.; Holecz, F.; Khan, N.; Barbieri, M.; Quicho, E.; Collivignarelli, F.; Maunahan, A.; Gatti, L.; Romuga, G. Synthetic Aperture Radar (SAR)-based paddy rice monitoring system: Development and application in key rice producing areas in Tropical Asia. In IOP Conference Series: Earth and Environmental Science, Proceedings of the 3rd International Symposium on LAPAN-IPB Satellite For Food Security and Environmental Monitoring, Bogor, Indonesia, 25–26 October 2016; IOP Publishing: Bristol, UK, 2016; Volume 54, p. 012015. [Google Scholar]
- Lasko, K.; Vadrevu, K.P.; Tran, V.T.; Justice, C. Mapping Double and Single Crop Paddy Rice With Sentinel-1A at Varying Spatial Scales and Polarizations in Hanoi, Vietnam. IEEE J. Sel. Top. Appl. Earth Obs. Remote Sens. 2018, 11, 498–512. [Google Scholar] [CrossRef] [PubMed]
- Qiu, B.; Qi, W.; Tang, Z.; Chen, C.; Wang, X. Rice cropping density and intensity lessened in southeast China during the twenty-first century. Environ. Monit. Assess. 2016, 188, 5. [Google Scholar] [CrossRef] [PubMed]
- Liu, J.; Kuang, W.; Zhang, Z.; Xu, X.; Qin, Y.; Ning, J.; Zhou, W.; Zhang, S.; Li, R.; Yan, C. Spatiotemporal characteristics, patterns, and causes of land-use changes in China since the late 1980s. J. Geogr. Sci. 2014, 24, 195–210. [Google Scholar] [CrossRef]
- Yang, Y.; Zheng, Y.; Jiang, L.; Liu, X.; Li, P. Rice Cropping System Extraction Using Remote Sensing in Jitai Basin. Geogr. Geo-Inf. Sci. 2014, 30, 16–20. (in Chinese). [Google Scholar]
- Frolking, S.; Qiu, J.; Boles, S.; Xiao, X.; Liu, J.; Zhuang, Y.; Li, C.; Qin, X. Combining remote sensing and ground census data to develop new maps of the distribution of rice agriculture in China. Glob. Biogeochem. Cycles 2002, 16, 38-1–38-10. [Google Scholar] [CrossRef]
- Adler-Golden, S.M.; Matthew, M.W.; Bernstein, L.S.; Levine, R.Y.; Berk, A.; Richtmeier, S.C.; Acharya, P.K.; Anderson, G.P.; Felde, J.W.; Gardner, J.A.; et al. Atmospheric correction for short-wave imagery based on MODTRAN 4. In Proceedings of the SPIE’s International Symposium on Optical Science, Engineering, and Instrumentation, Denver, CO, USA, 18–23 July 1999; pp. 61–69. [Google Scholar]
- Zhu, Z.; Woodcock, C.E. Object-based cloud and cloud shadow detection in Landsat imagery. Remote Sens. Environ. 2012, 118, 83–94. [Google Scholar] [CrossRef]
- Zhu, Z.; Wang, S.; Woodcock, C.E. Improvement and expansion of the Fmask algorithm: cloud, cloud shadow, and snow detection for Landsats 4–7, 8, and Sentinel 2 images. Remote Sens. Environ. 2015, 159, 269–277. [Google Scholar] [CrossRef]
- Arvidson, T.; Goward, S.; Gasch, J.; Williams, D. Landsat-7 long-term acquisition plan: Development and validation. Photogramm. Eng. Remote Sens. 2006, 72, 1137–1146. [Google Scholar] [CrossRef]
- Tucker, C.J. Red and Photographic Infrared Linear Combinations for Monitoring Vegetation. Remote Sens. Environ. 1979, 8, 127–150. [Google Scholar] [CrossRef]
- Ministry of Agricultrual and Rural Affairs of the People’s Republic of China. Chinese Crop Area Dataset. Available online: http://zzys.agri.gov.cn/nongqing_result.aspx?year=2015,2014,2013,1994,1993,1992,1991,1990,1989,1988&prov=33%20%20%20,34%20%20%20,35%20%20%20,36%20%20%20,42%20%20%20,43%20%20%20,44%20%20%20,45%20%20%20&item=05,06,07,08&type=2&radio=1&order1=year_code&order2=prov_code&order3=item_code (accessed on 24 December 2018). (In Chinese)
- Statistics Bureau of Hubei Province. Hubei Rural Statistical Yearbook; China Statistical Press: Beijing, China, 1991,1992,1993,1994,1995,2014,2015,2016. (In Chinese)
- Statistics Bureau of Guangdong Province. Guangdong Statistical Yearbook; China Statistics: Beijing, China, 1989,1990,1991,1992,1993,1994,1995, 2014, 2015, 2016. (In Chinese)
- Le Toan, T.; Ribbes, F.; Wang, L.-F.; Floury, N.; Ding, K.-H.; Kong, J.A.; Fujita, M.; Kurosu, T. Rice crop mapping and monitoring using ERS-1 data based on experiment and modeling results. IEEE Trans. Geosci. Remote Sens. 1997, 35, 41–56. [Google Scholar] [CrossRef]
- Wang, Q.; Chen, H.; Zhang, Q.; Zhou, H. Planting Pattern Switch from Double-cropped to Single-cropped Rice and Income Increase: A Study on the Effects of Social Services in Rural Areas. China Popul. Resour. Environ. 2015, 153–162. (In Chinese) [Google Scholar] [CrossRef] [PubMed]
- Xin, L.; Li, X. Changes of Multiple Cropping in Double Cropping Rice Area of Southern China and Its Policy Implications. J. Nat. Resour. 2009, 24, 58–65. (In Chinese) [Google Scholar]
- Wang, R.; Li, X.; Tan, M.; Xin, L.; Wang, X.; Wang, Y.; Jiang, M. Inter-provincial Differences in Rice Multi-cropping Changes in Main Double-cropping Rice Area in China: Evidence from Provinces and Households. Chin. Geogr. Sci. 2018. [Google Scholar] [CrossRef]
Figure 1.
Study area and spatial distribution of rice samples (1053 samples in 1990s and 1109 samples in 2015s).
Figure 1.
Study area and spatial distribution of rice samples (1053 samples in 1990s and 1109 samples in 2015s).

Figure 2.
The annual distribution of Landsat images during two periods (the 1990s and 2015s).

Figure 3.
Overview of methodology. The dNDVI donates differences of Normal Difference Vegetation Index (NDVI), and statistical data refers to provincial statistical data of rice sown areas.
Figure 3.
Overview of methodology. The dNDVI donates differences of Normal Difference Vegetation Index (NDVI), and statistical data refers to provincial statistical data of rice sown areas.

Figure 4.
Temporal profiles of NDVI for different rice cropping systems and the rice calendar. NDVI values were calculated from the Landsat images of P121R40 from 2013 to 2016. The double cropping rice site is located in 28°52.39″ N, 116°33.12′ E and the single cropping rice site in 28°56.85′ N, 116°4.97′ E. Note: DOY = day of year.

Figure 5.
The distribution of scenes to which the single image threshold method or the difference of Normalized Difference Vegetation Index (dNDVI) approach was applied: (a) 1990; (b) 2015.
Figure 5.
The distribution of scenes to which the single image threshold method or the difference of Normalized Difference Vegetation Index (dNDVI) approach was applied: (a) 1990; (b) 2015.

Figure 6.
Resultant maps of rice cropping systems of: (a) 1990; (b) 2015. Note: DCR = double cropping rice, SCR = single cropping rice.
Figure 6.
Resultant maps of rice cropping systems of: (a) 1990; (b) 2015. Note: DCR = double cropping rice, SCR = single cropping rice.

Figure 7.
Comparison of proportions of double-cropping rice (DCR) sown area to the total rice sown area in Southern China from Landsat and statistical data at the provincial level.
Figure 7.
Comparison of proportions of double-cropping rice (DCR) sown area to the total rice sown area in Southern China from Landsat and statistical data at the provincial level.

Figure 8.
The detailed comparison of the resultant rice maps for a sample scene (path/row 121/40) derived from the threshold method and that derived from the difference of Normalized Difference Vegetation Index (dNDVI) method: (a) double-cropping rice (DCR) and single-cropping rice (SCR) in Landsat 8 image acquired on July 25, 2016 (R/G/B = Band 6/5/2); (b) DCR and SCR in Landsat 8 image acquired on September 27, 2016 (R/G/B = Band 6/5/2); (c) results derived from the dNDVI method; (d) results derived from the threshold method. Note: NCR = non-rice.


Table 1.
Classification accuracy assessment.
| Year | Classified Results | Overall Accuracy | Kappa Coefficient | ||||
|---|---|---|---|---|---|---|---|
| Single Rice | Double Rice | Producer Accuracy | |||||
| 1990 | Validation Samples | Single rice | 207 | 46 | 81.82% | 88.83% | 0.75 |
| Double rice | 35 | 437 | 92.58% | ||||
| User accuracy | 85.54% | 90.48% | |||||
| 2015 | Validation Samples | Single rice | 394 | 48 | 89.14% | 86.55% | 0.72 |
| Double rice | 53 | 256 | 82.85% | ||||
| User accuracy | 88.14% | 84.21% | |||||
Table 2.
Variations in rice cropping systems at the provincial scale in Southern China from 1990 to 2015.
Table 2.
Variations in rice cropping systems at the provincial scale in Southern China from 1990 to 2015.
| Province | 1990 | 2015 | ||||
|---|---|---|---|---|---|---|
| Sown Area (km2) | The Proportion of DCR | Sown Area (km2) | The Proportion of DCR | |||
| SCR | DCR | SCR | DCR | |||
| Anhui | 30,138.47 | 16,469.15 | 35.34% | 34,310.24 | 7,475.32 | 17.89% |
| Fujian | 1,930.42 | 5,501.38 | 74.02% | 1,819.39 | 3,181.00 | 63.62% |
| Guangdong | 2,686.31 | 25,048.08 | 90.31% | 4,034.72 | 17,847.02 | 81.56% |
| Guangxi | 6,100.48 | 14,714.55 | 70.69% | 3,353.39 | 17,522.80 | 83.94% |
| Hubei | 19,311.81 | 11,068.54 | 36.43% | 22,485.99 | 3,491.61 | 13.44% |
| Hunan | 8,135.42 | 28,706.21 | 77.92% | 13,122.67 | 14,297.56 | 52.14% |
| Jiangxi | 3,943.25 | 28,379.95 | 87.80% | 11,209.26 | 14,911.11 | 57.09% |
| Zhejiang | 4,431.55 | 13,323.44 | 75.04% | 6,452.77 | 3,430.36 | 34.71% |
| Study area | 76,677.71 | 143,211.3 | 65.13% | 96,788.45 | 82,156.79 | 45.91% |
© 2018 by the authors. Licensee MDPI, Basel, Switzerland. This article is an open access article distributed under the terms and conditions of the Creative Commons Attribution (CC BY) license (http://creativecommons.org/licenses/by/4.0/).
Share and Cite
MDPI and ACS Style
Jiang, M.; Xin, L.; Li, X.; Tan, M.; Wang, R. Decreasing Rice Cropping Intensity in Southern China from 1990 to 2015. Remote Sens. 2019, 11, 35. https://doi.org/10.3390/rs11010035
AMA Style
Jiang M, Xin L, Li X, Tan M, Wang R. Decreasing Rice Cropping Intensity in Southern China from 1990 to 2015. Remote Sensing. 2019; 11(1):35. https://doi.org/10.3390/rs11010035
Chicago/Turabian StyleJiang, Min, Liangjie Xin, Xiubin Li, Minghong Tan, and Renjing Wang. 2019. "Decreasing Rice Cropping Intensity in Southern China from 1990 to 2015" Remote Sensing 11, no. 1: 35. https://doi.org/10.3390/rs11010035
Note that from the first issue of 2016, this journal uses article numbers instead of page numbers. See further details here.