Article

Long-Term Spatiotemporal Dynamics of Terrestrial Biophysical Variables in the Three-River Headwaters Region of China from Satellite and Meteorological Datasets

1
State Key Laboratory of Remote Sensing Science, Faculty of Geographical Science, Beijing Normal University, Beijing 100875, China
2
Faculty of Geo-Information and Earth Observation (ITC), University of Twente, Enschede 7500 AE, The Netherlands
3
State Key Laboratory of Earth Surface Processes and Resource Ecology, Faculty of Geographical Science, Beijing Normal University, Beijing 100875, China
*
Author to whom correspondence should be addressed.
Remote Sens. 2019, 11(14), 1633; https://doi.org/10.3390/rs11141633
Submission received: 19 June 2019 / Revised: 5 July 2019 / Accepted: 8 July 2019 / Published: 10 July 2019
(This article belongs to the Special Issue Remote Sensing Applications in Monitoring of Protected Areas)

Abstract

:
Terrestrial biophysical variables play an essential role in quantifying the amount of energy budget, water cycle, and carbon sink over the Three-River Headwaters Region of China (TRHR). However, direct field observations are missing in this region, and few studies have focused on the long-term spatiotemporal variations of terrestrial biophysical variables. In this study, we evaluated the spatiotemporal dynamics of biophysical variables including meteorological variables, vegetation, and evapotranspiration (ET) over the TRHR, and analyzed the response of vegetation and ET to climate change in the period from 1982 to 2015. The main input gridded datasets included meteorological reanalysis data, a satellite-based vegetation index dataset, and the ET product developed by a process-based Priestley–Taylor algorithm. Our results illustrate that: (1) The air temperature and precipitation over the TRHR increased by 0.597 °C and 41.1 mm per decade, respectively, while the relative humidity and surface downward shortwave radiation declined at a rate of 0.9% and 1.8 W/m2 per decade during the period 1982–2015, respectively. We also found that a ‘dryer warming’ tendency and a ‘wetter warming’ tendency existed in different areas of the TRHR. (2) Due to the predominant ‘wetter warming’ tendency characterized by the increasing temperature and precipitation, more than 56.8% of areas in the TRHR presented a significant increment in vegetation (0.0051/decade, p < 0.05), particularly in the northern and western meadow areas. When energy was the limiting factor for vegetation growth, temperature was a considerably more important driving factor than precipitation. (3) The annual ET of the TRHR increased by 3.34 mm/decade (p < 0.05) with an annual mean of 230.23 mm/year. More importantly, our analysis noted that ET was governed by terrestrial water supply, e.g., soil moisture and precipitation in the arid region of the western TRHR. By contrast, atmospheric evaporative demand derived by temperature and relative humidity was the primary controlling factor over the humid region of the southeastern TRHR. It was noted that land management activities, e.g., irrigation, also had a nonnegligible impact on the temporal and spatial variation of ET.

Graphical Abstract

1. Introduction

The variability of terrestrial biophysical variables influences the function of ecosystem components, which is likely to alter terrestrial ecological processes [1]. As one of the largest Chinese nature reserves, the Three-River Headwaters Region (TRHR) has a relatively high altitude and severe climate conditions, which makes its ecosystem extremely sensitive and vulnerable [2]. In the last few decades, due to intensified climate change and uncontrolled development activities, several ecological issues, including the recession of glaciers and tundra, wetland shrinkage, and grassland desertification, have emerged over the TRHR, resulting in complex biophysical interactions and an irreversible effect on the ecosystem [3]. Noticing the importance and urgency of environment protection, the Chinese government has implemented a series of environmental protection policies over the TRHR since the early 21st century [4]. The Sanjiangyuan National Nature Reserve (SNNR) [5] as well as the Ecological Protection and Restoration Program (EPRP) [6] were established to conserve and rehabilitate the ecological environment, including retiring livestock, restoring degraded grassland, and ecological migration. Although these projects have greatly improved the resilience of the ecosystems, there are still large uncertainties in the spatiotemporal dynamics of the terrestrial biophysical variables. Therefore, comprehensive assessment of the terrestrial biophysical variation is a prerequisite for studying the interaction among ecological environment dynamics and provides instructive information about the hydrology, geographical ecology, and water resource management.
The air temperature (Ta) of the TRHR is undergoing significant warming, and has done over the last few decades [7,8]. Previous studies have shown that the rising trend of temperature over the TRHR is obviously larger than that in other regions in China [9,10]. The obvious warming trend, coupled with the accelerated carbon cycle between the land and atmosphere, has a significant impact on the biophysical processes, including the water cycle and energy exchange [11]. Recently, several studies based on ground observations found that the TRHR experienced a sustained warming and wetting trend over the past few decades [12]. For instance, Chong et al. [13] revealed that both Ta and precipitation (P) showed a significant upward trend (0.31 °C and 10.6 mm per decade, respectively) based on ground measurements from 21 meteorological sites distributed in the TRHR during 1956–2012. Significant warming and intensified P were also detected by Tong et al. [14], who suggested that Ta and P had increased by 0.9 °C and 102 mm in the past 20 years, respectively. The reduction of terrestrial relative humidity (RH) and solar radiation (Rs) were also captured during observations of the Tibetan Plateau, which correlate with rapid climate warming. However, in situ observations have their stubborn limitations as their representativeness of regional-scale climatic parameters remains problematic due to the terrestrial heterogeneity [15]. Fortunately, data assimilation techniques can provide optimal integrated information from site measurements, weather forecast products, and remote sensing data [16]. With the continuous accumulation of emerging forcing datasets produced by the data assimilation technique, it has become meaningful to further evaluate the long-term spatiotemporal information regarding climate change over the TRHR.
The pronounced climate warming along with the redistribution of precipitation patterns significantly influences the vegetation through a series of biophysical processes [17]. In this context, the remotely sensed normalized difference vegetation index (NDVI) has been widely used to detect the temporal variation of vegetation in the TRHR at multiple scales [18]. In past decades, the TRHR was under pressure to sustain increasing livestock grazing and suffered from an alpine grassland degradation problem. Liu et al. [19] reported that continuous and obvious grassland degradation had occured since the 1970s, experiencing fragmentation, desertification, and degradation to “black soil beach” [20]. In order to protect the grassland resource, a series of national nature reserve projects and ecological policies were established within the TRHR during the 21st century [21]. Recent studies have indicated that the slight increment in vegetation density (0.047/decade) is mainly attributed to the implementation of ecological restoration programs over the TRHR during 2001–2010 [22]. These findings were also demonstrated by Liu et al. [23], who found that the NDVI of the TRHR increased by 0.012/decade over the past 12 years (2000–2011), which is consistent with the ongoing “warm and moist” trend. Understanding the variation in vegetation is often limited by the relatively brief dataset sequences, resulting in inconsistent accepted conclusions about the definite tendency of vegetation coverage in the TRHR. Therefore, it is critical to analyze the detailed variation of vegetation cover and the response of vegetation to climate change.
The fluctuation of climate and vegetation also has significant impacts on the surface water budget, particularly for evapotranspiration (ET), a crucial component of the terrestrial hydrological cycle [24]. ET is the sum of the evaporation from the land surface and the transpiration from plants into the atmosphere, and links the water budget, carbon sink, and energy exchange [25,26]. Therefore, the long-term variation of regional ET is of significance to monitor the biophysical processes and climate change. However, accurate simulations of the long-term ET of the TRHR remain a major challenge due to the lack of adequate and robust ground observations to determine regional ET over the TRHR. Moreover, datasets, such as the MOD16 product, from some global ET datasets are missing over the TRHR due to their existing gaps [27]. Recently, several satellite-based models and approaches have been developed to estimate the spatiotemporal ET in the TRHR over the last few decades [28]. For instance, based on a revised semi-empirical algorithm, Yao et al. [29] illustrated that there was no statistically significant trend in ET over the TRHR during the period 1982–2010. Xu et al. [30] found that ET showed a slight decreasing trend at the rate of 3.3 mm/decade from 2000 through 2014 in the TRHR by using an enhanced surface energy balance system (SEBS) algorithm. The simulated results were limited by the relatively short time span of the dataset and the uncertainties of model parameterization [31,32]. There are still large uncertainties about the spatiotemporal dynamics of ET over the complicated topography and heterogeneous surface of the TRHR. Thus, a robust assessment of the long-term variation of ET at a regional scale over the TRHR is in great demand for understanding the water cycle under an environment of rapid climate change.
As one of the most sensitive areas for climate change with complex terrain and high altitude, the TRHR is an ideal natural experimental area for investigating the response of terrestrial processes to climate change. Numerous studies have attempted to evaluate the interaction of the terrestrial biophysical variables (including climate, vegetation indices, and ET) by using different algorithms and datasets at multiple scales. For example, Zhang et al. [33] estimated the net primary productivity (NPP) of the TRHR using the Carnegie-Ames-Stanford approach (CASA) model, and found that the vegetation had a general increasing trend from 1982 to 2012, and pointed out that solar radiation was the primary factor controlling the increment of vegetation, with an average contribution of 0.73. Based on Gravity Recovery and Climate Experiment (GRACE) satellite data and Moderate Resolution Imaging Spectroradiometer (MODIS) NDVI data, Xu et al. [30] suggested that soil moisture and total water storage were major determining drivers in vegetation greening. However, large discrepancies still exist in the spatiotemporal variation of terrestrial biophysical variables over the TRHR due to the differences in temporal series, spatial scale, algorithm, and data sources, which have hampered attempts to accurately evaluate long-term biophysical variation. Moreover, the spatial–temporal dynamics of climate change, vegetation growth, and water cycling have seldom been simultaneously discussed over the TRHR. As a result, little is accurately known about the spatiotemporal characterization of the response of terrestrial biophysical variables over the TRHR to climate change on large spatial scales and over long time periods.
In this study, we analyzed the spatiotemporal dynamics of terrestrial biophysical variables over the TRHR using a meteorological dataset, satellite-based vegetation index dataset, and a satellite-derived ET product from 1982 through to 2015, and investigated the main influencing factors accounting for biophysical variation. We had three major objectives. First, we analyzed the spatial patterns and trends of climate factors including Ta, P, RH, and Rs from 1982 through to 2015 over the TRHR of China. Second, we analyzed the spatiotemporal variation in the NDVI and ET from 1982 to 2015. Finally, we detected the response of vegetation and ET to climate change.

2. Materials and Methods

2.1. Study Area

The Three-River Headwaters Region (31°38′–36°20′N, 89°31′–102°14′E) is located in southern Qinghai Province, the hinterland of the Tibetan Plateau (TP) (Figure 1). This region is the headstream of three major Asian rivers, including the Yellow, Yangtze, and Lantsang Rivers, and is known as the “Chinese water tower”, supporting approximately 40% of the world’s population [34]. The TRHR covers an area of 350,000 km2, which supplies 49% of the total water of the Yellow River, 25% of the total water of the Yangtze River, and 15% of the total water of the Lantsang River. The TRHR is a central part of the highest and largest plateau in the world, and constitutes mountainous landforms with an average elevation of more than 4000 m. Due to its unique location and complex topography, the TRHR is characterized by a typical plateau climate with a low air temperature, high daily temperature range, and strong solar radiation. The climate of the TRHR is wet and moist in summers, and cool and dry in winters, with distinct wet and dry seasons. The average mean temperature ranges from −5.6 to 3.8 °C and the annual rainfall ranges from 262.2 to 772.8 mm with a notably decreasing trend from southeast to northwest [35]. The TRHR has the richest biodiversity, and contains the largest Chinese alpine wetlands ecosystem. The main ecosystem type of the TRHR is grassland including alpine meadow and alpine steppe, accounting for approximately 76% and 23% of the grasslands, respectively [36].

2.2. Climate Data

In this study, the China Meteorological Forcing Dataset (CMFD) was developed by the Institute of Tibetan Plateau Research, Chinese Academy of Sciences [37,38]. This product covers the period of 1982–2015, with a spatial and temporal resolution of 0.1° every 3 h. The instantaneous 2 m air temperature, surface pressure, specific humidity, and wind speed were produced by merging 740 meteorological observations and environmental data sources. The precipitation dataset was developed by merging three precipitation datasets including the in situ observations dataset, the Tropical Rainfall Measuring Mission (TRMM) 3B42 precipitation products, and the Asian Precipitation—Highly Resolved Observational Data Integration Towards Evaluation of the Water Resources project. The CMFD downward shortwave radiation dataset was constructed by the Global Energy and Global Energy and Water cycle Experiment-Surface Radiation Budget (GEWEX-SRB) radiation data and meteorological station measurements [39].
To obtain the surface net radiation (Rn), we calculated Rn using the method proposed by Wang et al. [40]. This method accurately simulates the Rn value combined shortwave radiation measurement with meteorological observations, which is suitable for various land cover types with a correlation coefficient of 0.99. We also used the model-derived soil moisture (SM) dataset provided by the National Centers for Environmental Prediction (NCEP), which contains monthly SM from 1982 to 2015, with a spatial resolution of 0.5° × 0.5°. The specific dataset sources and detailed information on the datasets are provided in Table 1.

2.3. Satellite Data

2.3.1. GIMMS NDVI Product

To quantify the variation of vegetation dynamics at regional scales, we used the Global Inventory Modeling and Mapping Studies (GIMMS) NDVI3g product derived from the Advanced Very High Resolution Radiometer (AVHRR) sensor National Oceanic and Atmospheric Administration (NOAA) polar satellite series with a spatial resolution of 8 km and a 15-day interval [41,42]. The GIMMS NDVI product has already been corrected to minimize the effects of clouds and aerosols using the maximum value composite (MVC) method. Previous studies have demonstrated that this dataset can reflect the real response of vegetation to climate change and provides more accuracy when evaluating the long-term trends of vegetation activity [43]. In this study, we extracted the subset of coverage in the TRHR from the global bimonthly NDVI for the period 1982–2015 and resampled the bimonthly NDVI of the study area to a daily value with a resolution of 0.1° × 0.1°.

2.3.2. ET Product

Considering that the MOD16 ET product is missing in the TRHR, we used the ET product produced by the modified satellite-based Priestley–Taylor algorithm (Appendix A) driven by net radiation (Rn), air temperature (Ta), diurnal temperature range (DT), and the NDVI [44]. This product has been validated at 16 eddy covariance (EC) flux tower sites, and performed better than MODIS ET products at a regional scale, with a higher squared correlation coefficient (R²) and a lower root mean square error (RMSE) [45]. The modified satellite-based Priestley–Taylor (MS-PT) product has provided more reliable and long-term spatiotemporal variations of the ET estimations of China [46].

2.3.3. DEM Data

We used the global digital elevation model (DEM) data with a spatial resolution of 250 m acquired from 90 m Shuttle Radar Topography Mission (SRTM) images (version 004) (http://srtm.csi.cgiar.org/) in Geo-TIFF format.

2.3.4. Land Cover Data

The GlobeLand30 product developed by the National Geomatics Center of China (NGCC) provides detailed land cover information about a global coverage of high-resolution imagery at 30 m for the years 2000 and 2010 [47]. It is generated from the Thematic Mapper (TM), Enhanced Thematic Mapper plus (ETM+) of America Land Resources Satellite (Landsat) and the multispectral images of the China Environmental Disaster Alleviation Satellite (HJ-1) developed by integrating the pixel-object knowledge-based approach with other auxiliary datasets. This dataset is freely available and consists of 10 land cover types, including forest, grassland, shrubland, wetland, water bodies, tundra, bare land, artificial surfaces, cultivated land, permanent snow, and ice, with an overall accuracy of 80.33% [48].

2.4. Data Analysis

The Mann–Kendall test, as a nonparametric method for testing trends, and is also satisfactory for examining the significance of trends in a time series [49]. The statistics of variance can be described as follows:
S = n = 1 i 1 m = n + 1 i s g n ( x m x n ) ,
s g n ( x m x n ) = { 1 x m x n > 0 0 x m x n = 0 0 x m x n < 0 ,
Z = { s 1 V a r ( S ) S > 0 0 S = 0 s + 1 V a r ( S ) S < 0 ,
V a r ( S ) = 1 18 [ i ( i + 1 ) ( 2 i + 5 ) i = 1 n t i ( t i 1 ) ( 2 t i + 5 ) ] ,
where i is the number of data points in the sequence, and ti is the number of data values. Statistic Z , as a standard normal variable, was used to evaluate the statistical significance. The Mann–Kendall test is applied on a time series for all biophysical variables, and if the Z value is less than or equal to the significance level ( α = 0.05 ), a significant trend of the variable will be detected. In this study, the Mann–Kendall test for trends and linear regression analysis was used to detect and estimate the annual and seasonal trend of biophysical variables, with significance defined as p <   0.05 .
Pearson’s Correlation Coefficient was used to evaluate the correlation between the climate variables and vegetation index as well as between the climate variables and ET to determine the response of vegetation and ET to climate change.
r = i = 1 n ( X i X ¯ ) ( Y i Y ¯ ) i = 1 n ( X i X ¯ ) 2 i = 1 n ( Y i Y ¯ ) 2 ,
where X represents the climate variables, Y represents the vegetation index or ET, and n is the number of samples.

3. Results

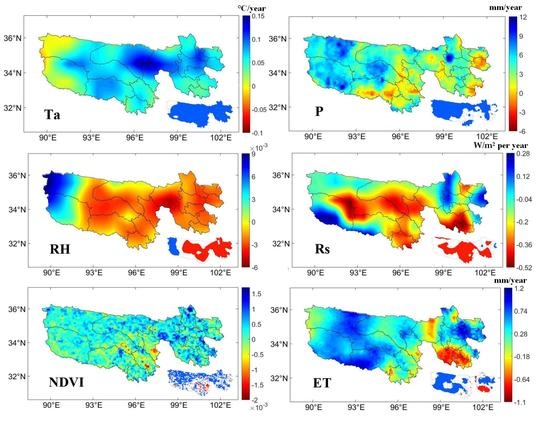
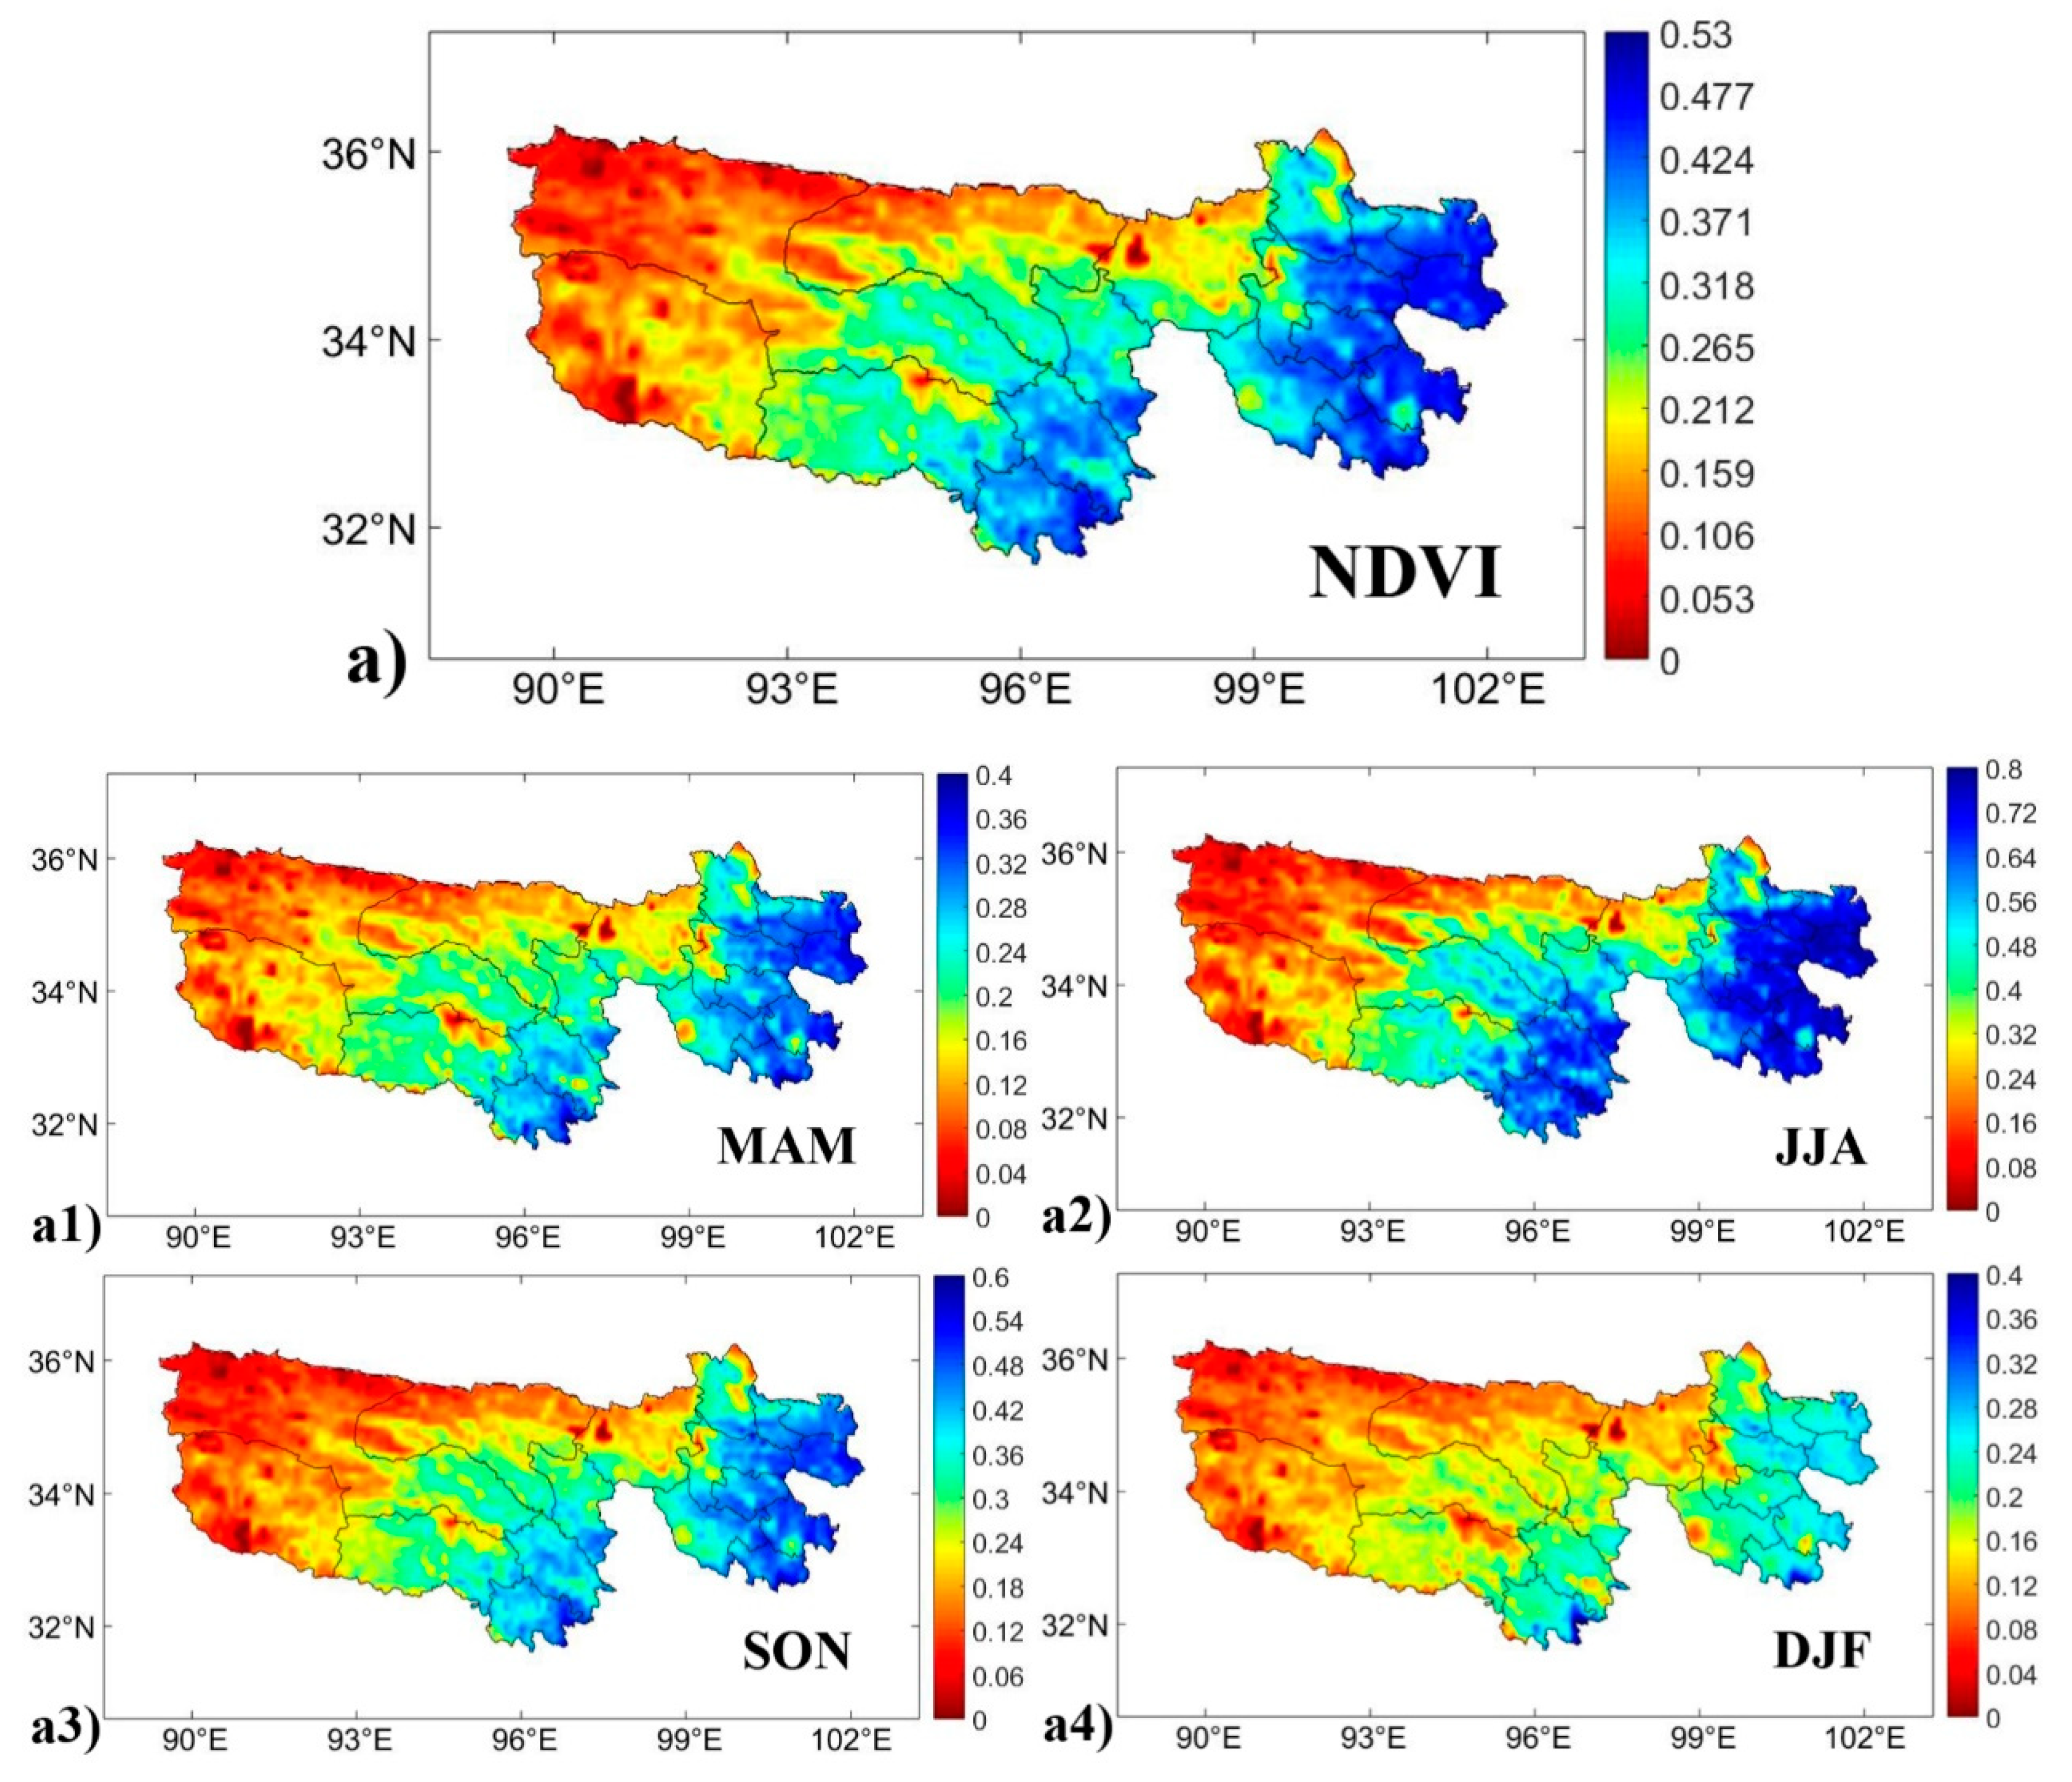
3.1. Spatial and Seasonal Patterns of Terrestrial Biophysical Variables in the Three-River Headwaters Region

3.1.1. Climate Variables

Figure 2 shows the spatial distribution of the climate variables (Ta, P, RH, and Rs) over the TRHR at annual and seasonal scales during 1982–2015. Influenced by the typical plateau continental climate, the climate variables have distinctly different spatial patterns. On an annual basis, the annual mean Ta (Figure 2a) of the TRHR ranged from −12 to 6 °C, with an average of −4.2 °C. The multiyear average P (Figure 2b) varied from 162 to 781 mm, with an average of 424 mm. Both Ta and P presented obvious decreasing trends from the southeast to the northwest, which corresponded to the water and energy gradients of the TRHR. The 400 mm contour lines of annual precipitation roughly divide the TRHR into semi-arid and semi-humid climates from northwest to southeast. As a major part of the Tibetan Plateau, the climate of the TRHR is also influenced by atmospheric circulation and topographical features [50]. Figure 2c shows the spatial distribution of annual mean RH over the TRHR, with an average value of 52.3%. The decreasing trend of RH is noticeable from southeast to northwest, which is consistent with the distribution pattern of cloud cover [51]. By contrast, the annual mean Rs spatially decreased from west to east, ranging from 196 to 232 W/m2. There were abundant solar energy resources in the TRHR due to the high altitude, thin atmosphere, and few anthropogenic activities [52].
On a seasonal basis, the climate of the TRHR is characterized by cold and dry winters, and cool and rainy summers. The spatial distributions of seasonal Ta and P were similar to the multiyear patterns of Ta and P as averaged during 1982–2015. The mean Ta was below −5 °C, and the P was less than 10 mm/month in winter (DJF, December, January, and February), whereas in summer (JJA, June, July, and August), the average P accounted for more than 80% of the total annual P, and the average Ta was about 5 °C. Moreover, we also found an obvious and clear distinction between dry and wet season over the TRHR. The southeastern area of TRHR remained the most humid region in other seasons with the exception of winter. During the Asian summer monsoon period, the mean surface RH of JJA was relatively higher than that of other seasons. The seasonal mean Rs of MAM (March, April, and May) and JJA were approximately 230–290 W/m2, which were much higher than the values of SON (September, October, and November) and DJF.

3.1.2. Normalized Difference Vegetation Index

Figure 3a illustrates the annual mean NDVI, which presents an increasing trend from northwest to southeast over the TRHR during the period 1982–2015. Higher NDVI values were mainly distributed in the southeastern part of the TRHR, where the main land use type is forest and temperate grassland. Meanwhile, this region has sufficient precipitation and warmer temperatures that are suitable for vegetation growth. By contrast, the northwestern part of the TRHR has a relatively cold and dry climate, resulting in a lower NDVI value. Our findings are consistent with those of Zhong et al. [53], who also found that the spatial distribution of the NDVI was influenced by the Asian monsoon over the Tibetan Plateau.
As shown in Figure 3, seasonal NDVI has a decreasing trend from southeast to northwest across all four seasons. However, there were distinctive differences in the seasonal average of the NDVI value. During winter (DJF), the NDVI value was below 0.24 in the majority of the region under the dormancy condition of vegetation and lower air temperature. The NDVI reached a maximum value of 0.8, accompanied by increasing precipitation and rising temperatures in summer (JJA). When the rainy season had passed, the NDVI value began to decrease in autumn (SON) and winter (DJF), with an average of 0.15 and 0.09, respectively.

3.1.3. Evapotranspiration

Figure 4a shows the spatial distribution of the multiyear (1982–2015) average ET over the TRHR, and the annual mean ET was approximately 230.23 mm/year. As shown in Figure 4a, the multiyear average ET decreased from southeast to northwest, which was similar to the spatial patterns of Ta and P. Higher ET mainly occurred in the moister and warmer regions, including the eastern and southern parts of the TRHR, whereas the northwestern part of the TRHR with less P and lower Ta had the lowest ET value. Furthermore, the spatial pattern of ET was also affected by land management, such as agricultural irrigation, that caused a positive trend of ET in the cropland areas.
As shown in Figure 4, the multiyear average seasonal patterns of ET exhibited obvious seasonality with reasonable seasonal cycles (higher ET in the summer wet season and lower ET in the winter dry season). Distinct fluctuations of ET throughout the four seasons corresponded to the plateau mountain climate system. In spring (MAM) and autumn (SON), the ET was less than 26 mm/month due to the lack of available energy and temperature. The seasonal ET reached the largest value (26–66 mm/month) in summer (JJA), accompanied by the maximum Ta and P in the whole year. By contrast, ET dropped to its lowest value in winter (DJF), which is when vegetation turns to dormancy, and the temperature declines.

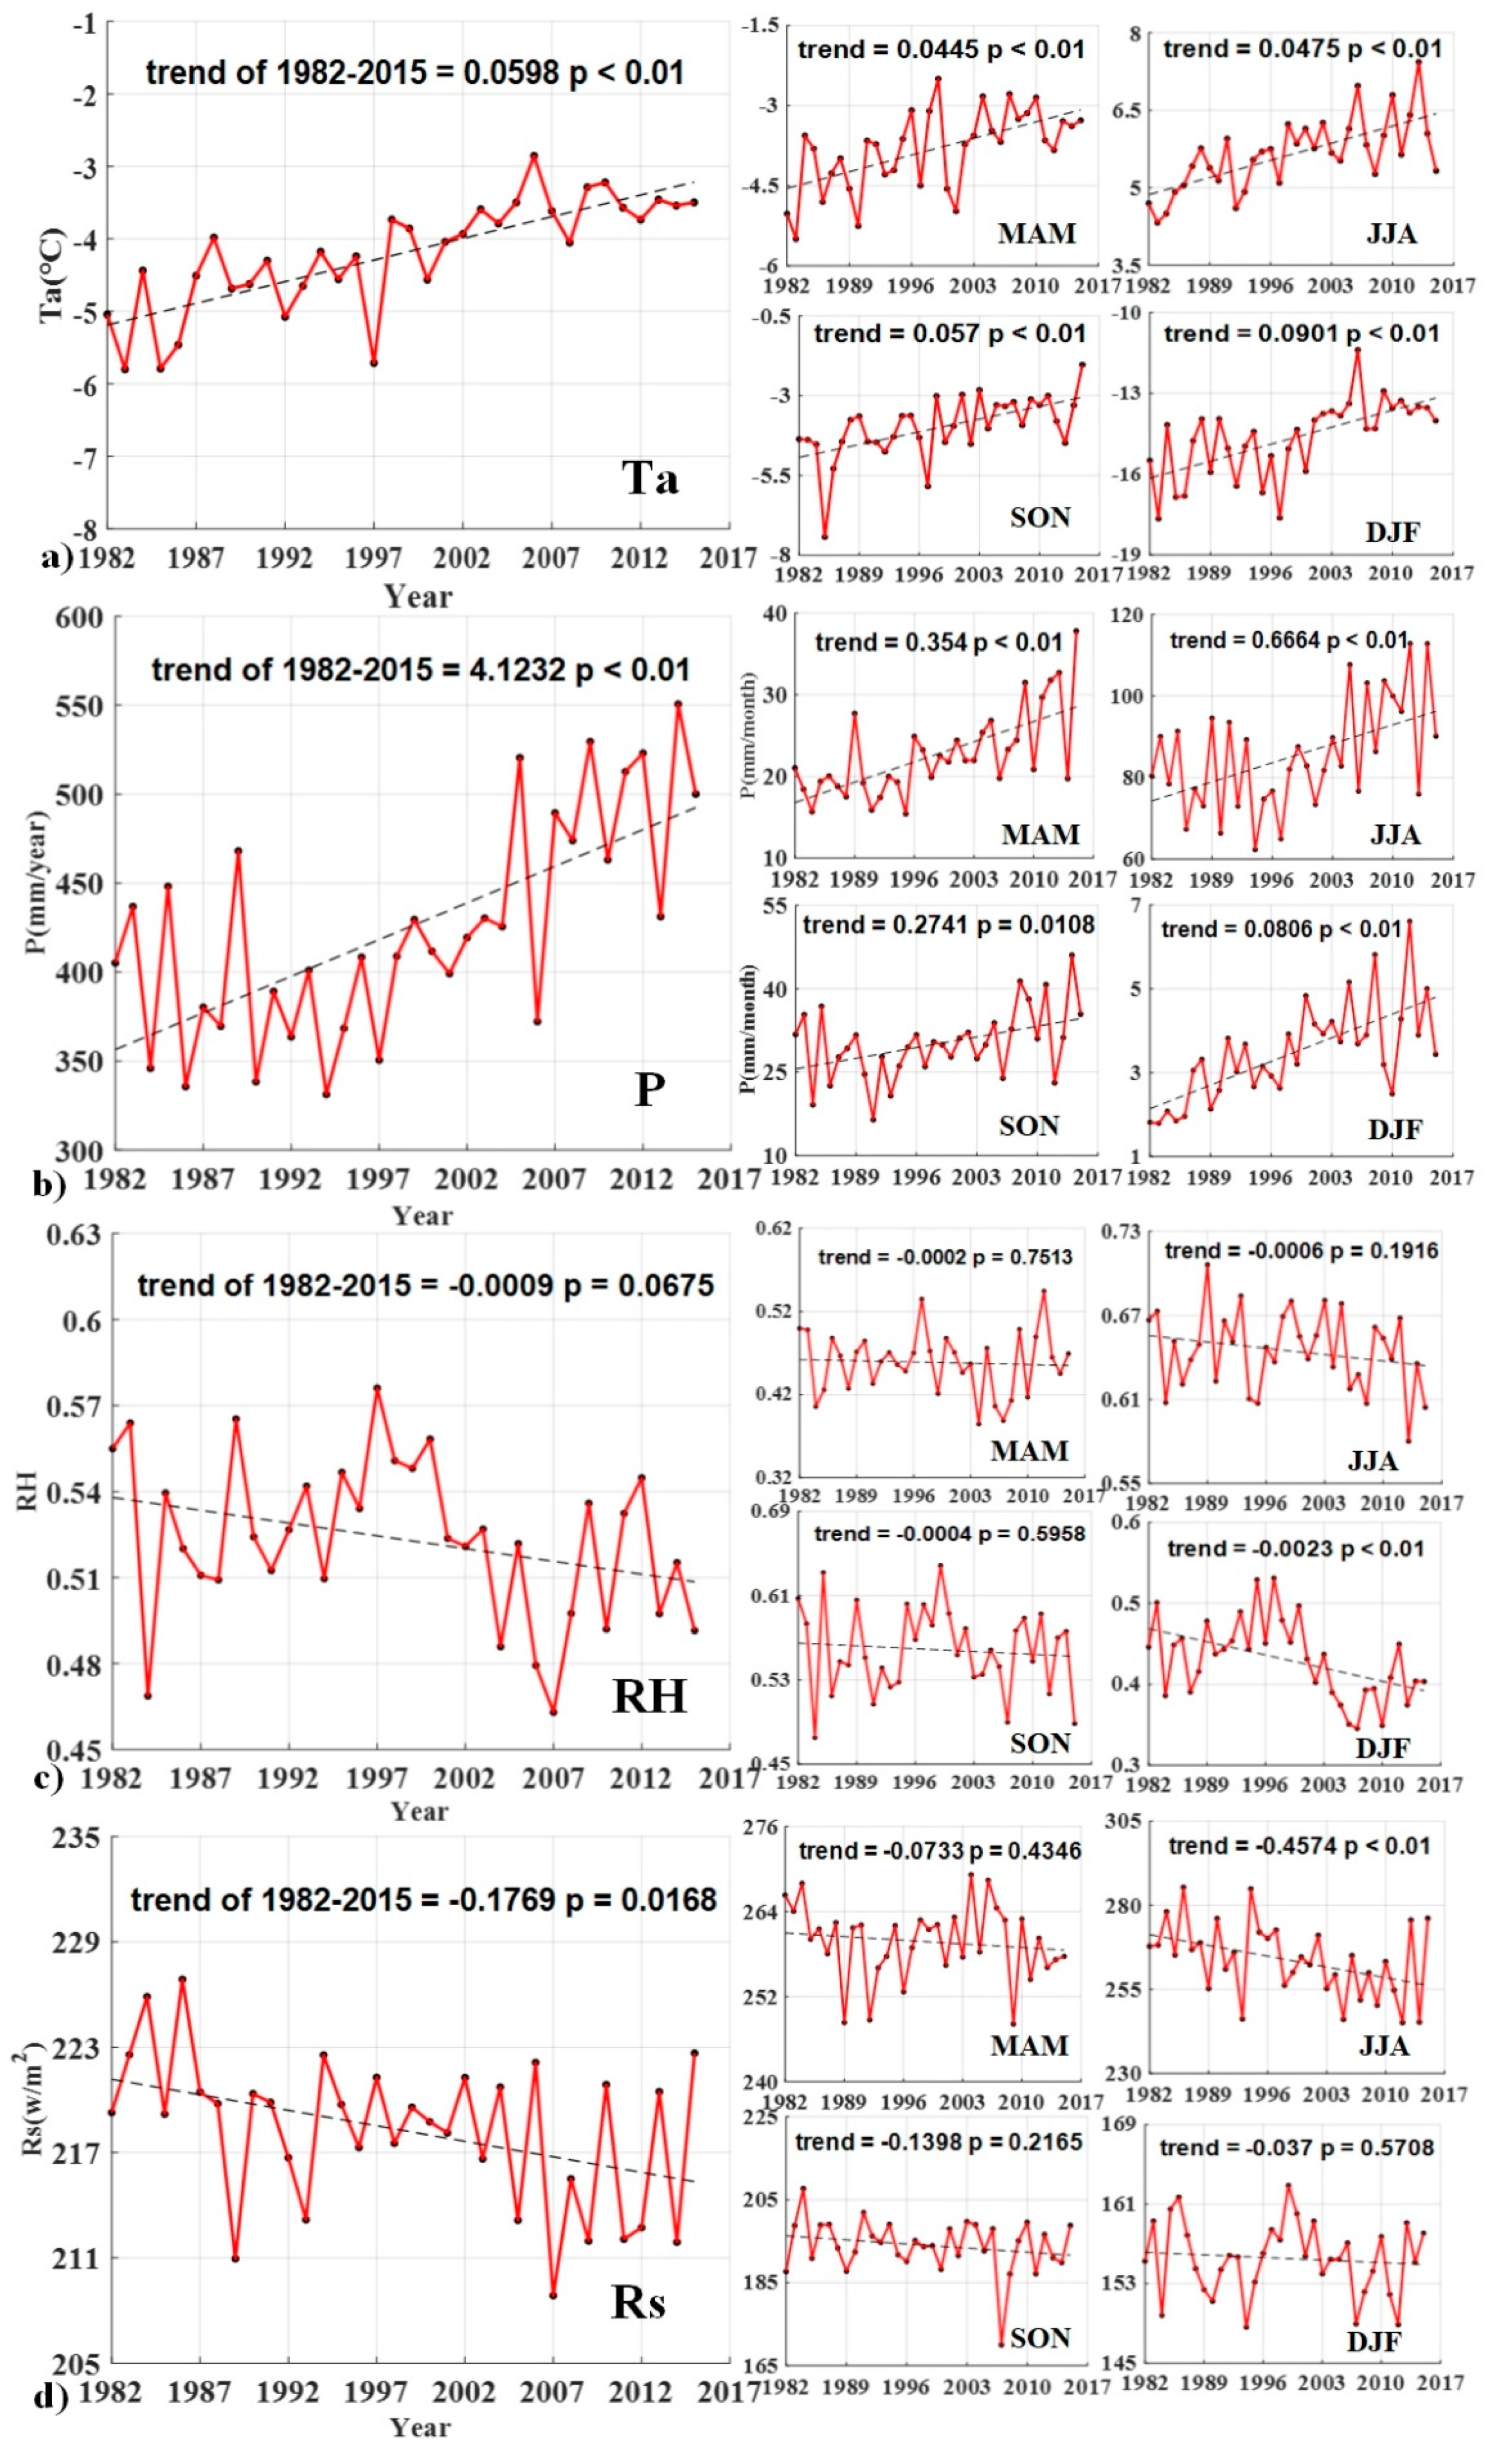
3.2. Interannual and Seasonal Variation of Terrestrial Biophysical Variables in the Three-River Headwaters Region

3.2.1. Climate Variables

Figure 5 shows the variation trend of the meteorological variables (Ta, P, RH, and Rs) over the TRHR during 1982–2015. An increasing trend in Ta appeared over the TRHR with an average value of 0.597 °C/decade, which is much higher than the global warming average of 0.12 °C/decade [54], and 96.3% of the pixels showed a significant increasing trend ( p < 0.05 ). The trend of Ta over Maduo, the north of Chengduo, and the east of Qumalai was relatively higher than in other areas and the maximum reached 1.47 °C/decade. As shown in Figure 5b, P also experienced a positive trend during the period of 1982–2015 over the TRHR. We found that the P substantially increased in arid areas, with a linear tendency of 41.1 mm/decade ( p < 0.05 ). By contrast, a significant decreasing trend of RH over the majority of the region was evident, which corresponded to the warming tendency over the TRHR. A negative Rs trend occurred in the southeastern region, with an average of 3.05 W/m2 per decade ( p < 0.05 ). Some scientists suggested that the decline in Rs is consistent with solar dimming over the TP due to an increase in the amount of water vapor and the atmospheric concentrations of aerosols [55].
Figure 6 shows the interannual and seasonal climate variables (Ta, P, RH, and Rs) of the TRHR during 1982–2015. Both annual and seasonal mean Ta and P showed a significant positive trend, with a linear trend of 0.6 °C/decade and 41.2 mm/decade, respectively. Figure 6a illustrates that a significantly increasing Ta has occurred since 1998, coincident with the last major El Nino event in 1998. During this period, the most significant increase in Ta occurred in the winter (0.901 °C/decade, p < 0.01 ), followed by autumn (0.57 °C/decade, p < 0.01 ), summer (0.475 °C/decade, p < 0.01 ), and spring (0.445 °C/decade, p < 0.01 ). Similarly, P also showed a significant positive trend in all four seasons ( p < 0.01 ), with the largest P increases in summer (6.67 mm/decade, p < 0.01 ), and the rates for spring, autumn, and winter were 3.54, 2.74, and 0.806 mm per decade ( p < 0.01 ), respectively. In addition, a severe drought was also detected in the summer of 2006, and the annual P decreased to 370 mm/year due to the abnormally high Ta and low P [14]. By contrast, the interannual RH and Rs of the TRHR showed a decreasing trend over the whole period. The largest decline in the regional mean surface RH occurred in winter (DJF) at 2.3%/decade ( p < 0.01 ), which corresponded with the temperature rising in winter. A significant decrease of Rs occurred in summer (4.57 W/m² per decade, p < 0.01 ), while in other seasons, Rs presented a slight negative trend with no statistical significance.

3.2.2. Normalized Difference Vegetation Index

Figure 7a shows the spatial distribution of the NDVI trend over the TRHR during 1982–2015. Our results showed that the vegetation in the TRHR experienced slight greening and over 77.6% of the area showed a slight increasing trend, of which 56.8% significantly increased at a rate of 0.0051/decade ( p < 0.05 ). In particular, a significant increase in the annual NDVI occurred in the northern and western part of the TRHR, where the main land use type is alpine and subalpine meadows. Only a tiny portion of the region had a significant decreasing trend, which was mainly distributed in Chengduo and Yushu counties, and the majority of the midland region did not exhibit significant changes in vegetation cover. The increasing trend of NDVI was similar to the findings of Xu et al. [56], who found that the vegetation coverage of the TRHR showed a consistent and slight increase in the period of 1982–2006.
The annual and seasonal NDVI also presented a slightly enhanced trend, particularly after the implementation of the TRHR project (2005 to 2012) [57]. This indicated that the implementation of ecological projects also promotes vegetation growth and gradually reverses the degradation of grassland ecosystems. Specifically, the largest significant increase in the NDVI occurred in spring at the rate of 0.003/decade ( p < 0.01 ), which contributed most to the interannual NDVI increase trend.

3.2.3. Evapotranspiration

Spatial patterns of the ET trend over the TRHR were detected from 1982 through 2015. There were significant differences in the ET between the southeastern and northwestern parts of the region. Figure 8a shows that the ET has increased, on average, by 3.34 mm/decade over the TRHR, which corresponded to the expected acceleration associated with rising air temperature. About 26.5% of the pixels showed a significant increasing trend over the TRHR, while only 3.81% of the pixels showed a significantly decreasing trend ( p < 0.05 ). A significant positive ET trend was mainly distributed in the core of the Sanjiangyuan National Nature Reserve, namely, the east and west regions of the TRHR, with a linear tendency of 1.2 mm/year per decade, while the Dari and Banma counties showed a negative ET trend.
As shown in Figure 8b, the spatially averaged ET has increased, on average, by 3.3 W/m2 per decade ( p < 0.05 ) over the entire TRHR during 1982–2015. The value of ET has obviously fluctuated since 2000, indicative of strong regional variations controlled by the monsoon climate system and the arid climate system. Considering the seasonal difference in climatic conditions, we further calculated the trend of ET across four seasons. Figure 8c illustrates that the ET trend in winter had a significant increase with a linear tendency of 0.154 ( p < 0.05 ), while in other seasons, the ET presented a slight increasing trend with no statistical significance ( p >   0.05 ). It is evident that the temperature warming in winter had a significant positive effect on water cycling. The trend magnitudes of the annual and seasonal terrestrial biophysical variables are summarized in Table 2.

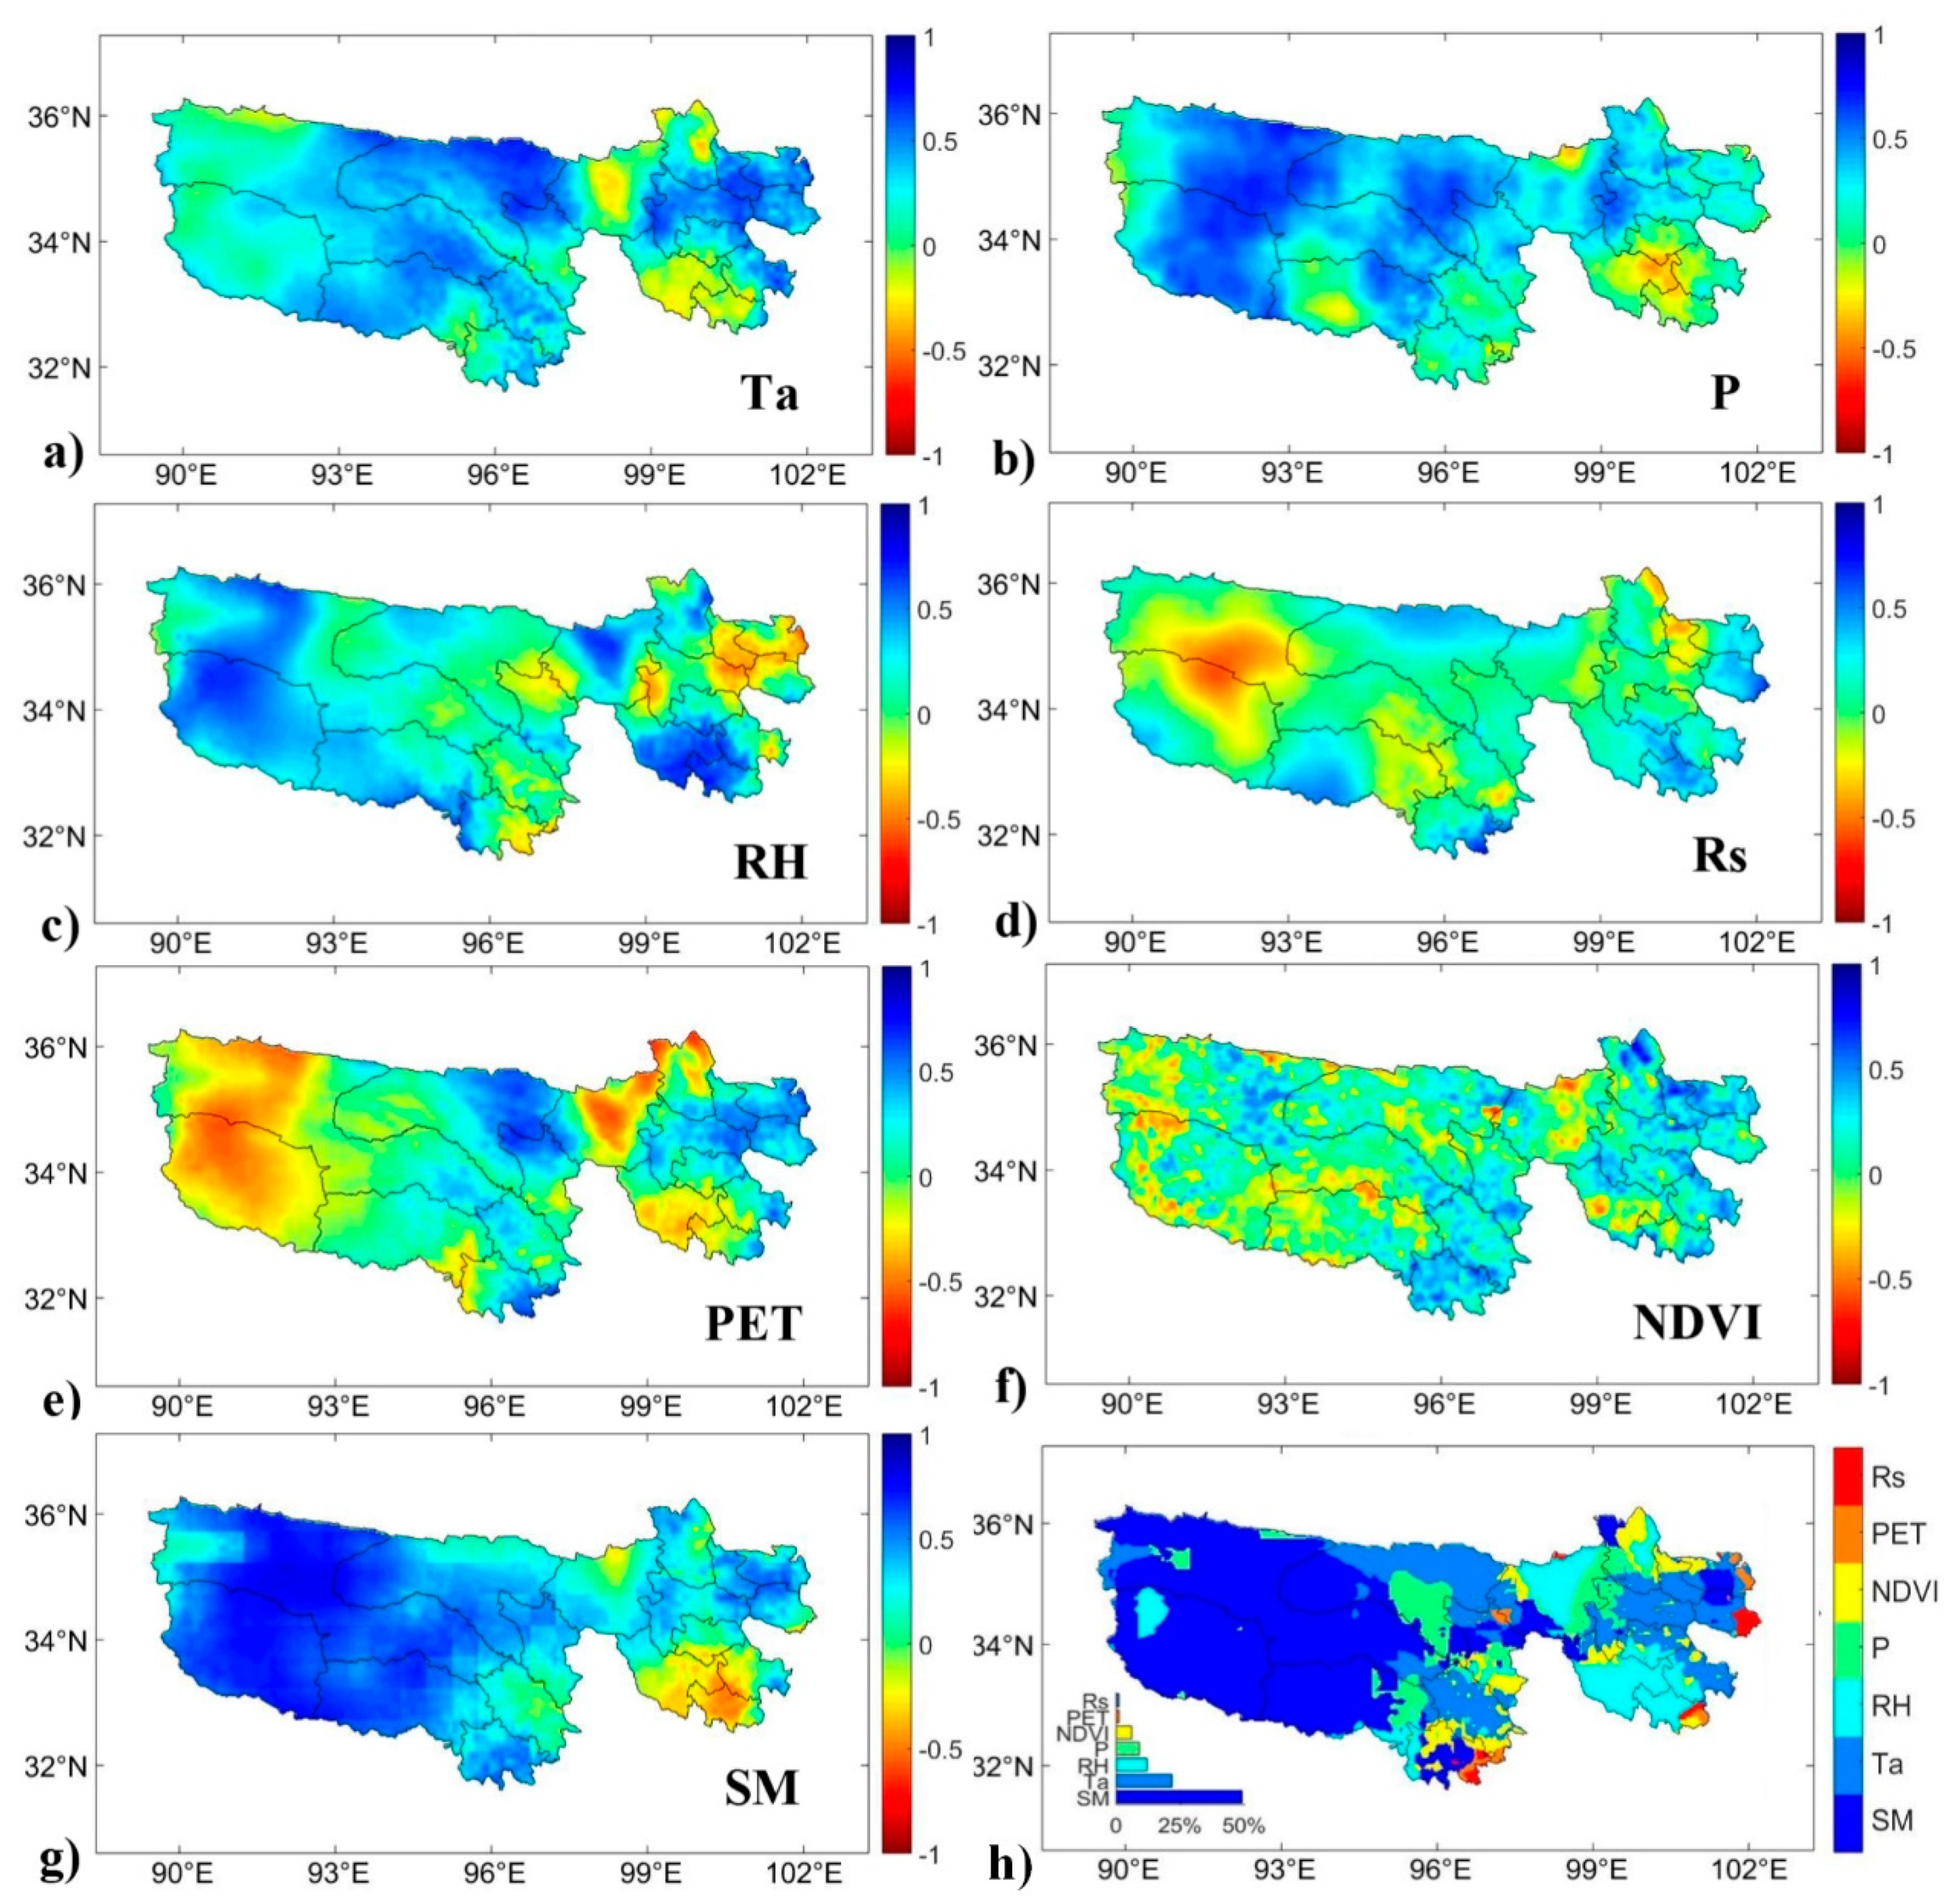
3.3. Vegetation Greening and ET Variation Response to Climate Change

Correlation analysis was used to investigate the relationship between each climate factor (Ta, P, RH, Rs) and the NDVI over the TRHR during 1982–2015. We found that over 57.54% of the area of the TRHR had a moderate positive correlation between the NDVI and Ta, and the maximum coefficient was about 0.89 (Figure 9a). When water was the limiting factor for vegetation growth in the western part of the TRHR, a strong correlation existed between the NDVI and P with a maximum coefficient of 0.74 (Figure 9b). The relationship between the NDVI and P was much weaker than that between the NDVI and Ta, which indicated that increasing temperature appeared to be the driving factor for vegetation greening, and better at explaining this phenomenon in comparison to P. Compared with Ta and P, no strong coherent spatial patterns were found in the relationship between the NDVI and annual Rs and annual RH, with a negative correlation coefficient of 0.3 (Figure 10).
We further conducted a correlation analysis between the ET and each energy- or water-limiting factor (Ta, P, RH, Rs, NDVI, potential ET (PET), and soil moisture (SM)) (Figure 11). The results showed that SM was the primary factor in controlling ET change in the western TRHR during the period 1982–2015. Given the fact that this area is located at arid and semi-arid climatic zones, the terrestrial moisture limitation is expected to be the most important driver of ET variation [58]. Similarly, over 55.21% of pixels showed a moderate positive correlation between precipitation and ET (Figure 11b), which can be attributed to the fact that ET corresponds well with surface moisture supply in a region with scarce water. The infrequent rainfall causes shortages in soil moisture and further feedbacks to the decreases in ET.
In the relatively humid area of the TRHR, ET showed a positive correlation with Ta, accounting for approximately 55.3%. Ta was the primary indicator governing ET variation in the unrestricted water region, where ET corresponded well to atmospheric energy demand. The NDVI was also an important dominant factor in controlling the increasing ET in the southern part of the TRHR. The relatively higher plant transpiration and canopy conductance contributed to the increment of ET [59]. As shown in Figure 10c, the decline of RH has continuously contributed to the decrease in ET over the southeastern part of the TRHR. The rising temperature was expected to feedback to the atmosphere and consequently decreased the RH and ET, which implied that this area is projected to be drier. Previous studies have proposed that there is a complementary relationship in the ET and potential ET (PET) [60]. Zhang et al. [61] point out that vapor transfer power was suppressed due to the low Ta and vapor pressure deficit (VPD) in the TRHR. The negative correlation between the ET and PET revealed by this study supports their findings.
Land use and land cover change can also have substantial influences on the biophysical variables in hydrologic processes and terrestrial energy exchange by affecting the patterns of ET. We further investigated responses in the distribution of the multiyear average ET to the difference of land cover and use type. As shown in Figure 12, cropland had the highest ET values. The lowest annual ET occurred in the artificial surface and bare land. For each vegetation type, forest had the highest ET, followed by grassland and shrubland. This can be explained by forest ecosystems having relatively higher total root biomass and deeper effective rooting depth, thereby having the potential to create positive transpiration forcing [62]. The ET value of cropland was generally higher than that of forest, where it was noted that artificial management, e.g., agriculture irrigation, has a nonnegligible impact on the variation of ET.

4. Discussion

This study analyzed the long-term spatiotemporal dynamics of terrestrial climate variables from an interannual and seasonal perspective over the TRHR of China. The rising Ta and P and decline in the RH and Rs over the TRHR were similar to the trends observed over the Tibetan Plateau (TP), where annual Ta and P increased by 0.447 °C and 9.97 mm per decade at the 27 meteorological stations during 1961–2001, as reported by Xu et al. [50]. Using observations from 78 China Meteorological Administration (CMA) stations, Yang et al. [63] also demonstrated that the TP experienced a rapid warming and wetting tendency in the period of 1984–2006. The overall rapid climate warming tendency over the TP has been demonstrated in numerous studies by observing stations [51,64,65], by oxygen isotope analysis of ice cores [66], and by satellite remote sensing products [67,68], with the observed warming rate ranging from 0.16 to 0.67 °C per decade during the past few decades [69]. In comparison with previous studies regarding climate change, our findings improve the spatial information over heterogeneous landscapes and present long-term distribution patterns of annual and seasonal climate variables at a regional scale and provide a new understanding of the climate change in the TRHR in recent years.
Climate change has an inevitable and significant impact on vegetation dynamics, particularly in the extremely sensitive ecosystem of the TRHR. The response of vegetation to climate change has been discussed by many studies, where the results differed according to the different vegetation types, the plant physiological processes, and environmental factors. Previous studies have pointed out that CO2 fertilization effects explain 70% of the observed greening trend in the tropics, whereas climate change contributes most to the vegetation greening of the TP [70]. Du et al. [71] proposed that solar radiation was the key factor governing the vegetation greening on the TP. This result is reasonable because sufficient solar radiation can promote the photosynthesis and respiration of vegetation, which is beneficial to plant growth [72]. According to Xu et al. [30], the averaged NDVI of the growing season was positively correlated with the summer Ta in the high-cold region, which indicated that the response of vegetation to temperature was likely to be more intense under climate warming. This conclusion supported our results to a certain extent. We found that when energy was the limiting factor for vegetation growth, Ta was a considerably more important driving factor than water. However, the effect of temperature on vegetation was obviously less than that of moisture in the water limiting area. These results can be explained by the fact that the climate condition in the TRHR is characterized by relatively abundant P during the growing season and lower temperature across the whole year [73]. We can conclude that increases in either Ta or P are predicted to have a positive influence on vegetation greening. These findings are in line with emerging evidence that the potential benefits from the climate “warming and moisture” trend are closely related to the increment of vegetation through alteration of vegetation phenology and prolonged growing season length in the TRHR [74].
The upward trend of ET we reported is consistent with long-term trend analysis, which indicated that the ET has significantly increased since the 1960s, especially in the central area of the TP [61,69,75]. The rising trend of ET corresponded to the significant increase in precipitation, the reduction of RH, and sunshine duration during the same period over the TP [76]. Yin et al. [77] suggested that the upward trend of ET was mainly constrained by the soil water supply, and linked with increased P, which is consistent with our results. In the arid and semi-arid regions, the increased P promoted the water availability for ET, resulting in the increment of ET. The pattern of increasing ET was matched by an increasing P in the western part of the TRHR, which was also confirmed by Yao et al. [29], who reported that P was the primary contributor to increasing ET during 1982–2010. However, in well-watered regions, climate (Ta, RH) and vegetation factors were considered to be related more to the ET dynamic. This result also agrees well with the study by Song et al. [78] on the TP, where dependencies of ET on leaf area index (LAI) and Ta appeared to be largely independent of moisture supply. Atmospheric demand was recognized as an important controlling factor on the long-term variations of ET. This inconsistent result can be explained by the different atmospheric energy demand or surface moisture supply in different regions [79]. In addition, the land use and land cover change (LUCC), and anthropogenic activities, such as agriculture irrigation and afforestation projects, also have a substantial influence on the variation of ET [80].
A long-term spatiotemporal biophysical dynamic provides more accurate estimates of climate change, vegetation greening, and ET variation in the TRHR. Although several products have been extensively validated and confirmed in different scales and regions, considerable uncertainties still exist. Regarding the climate forcing dataset, the accuracy of the reanalysis may be limited by the scarce measurements in the TRHR. Yang [81] et al. compared the shortwave radiation data of the CMFD product against the 579 in situ observations in China and found that the CMFD provided the closest match with ground measurements, with a 0.02 relative bias and a 5.6 root-mean-square error (RMSE) during 2008–2010. However, the precipitation data were detected to have an abnormal underestimation after August 2014. The inaccuracy of the precipitation data was also evaluated by Wang et al. [82], who found that the precipitation was overestimated at 90 stations over the TP. The biases of the CMFD dataset led to substantial errors in climate variation. Aside from the climate dataset, the uncertainties were also associated with the GIMMS NDVI data series driven by AVHRR. Kern et al. [83] suggested that there was a significant disagreement relationship between AVHRR NDVI3g and the MODIS NDVI dataset. Moreover, the influence of the canopy and soil background, aerosol effects, and cloud contamination were not completely eliminated due to the limitations of the AVHRR instruments [43,84]. The modified satellite-based Priestley–Taylor (MS-PT) algorithm produced a more accurate product as daily ET estimates exhibited a higher R2 (0.87) and lower RMSE (12.5 W/m2) than the original PT algorithm in regional ET simulations. However, there are still large uncertainties due to the different parameterization schemes of evaporation constraint. One limitation of the MS-PT product is that it shows large differences in daily ET estimates among the different ecosystem types [85]. Yao et al. [86] evaluated the performance of PT products at different biomes and demonstrated that the MS-PT model performed better in forest and village sites, with a higher R2 of 0.93 and lower RMSE of 11.9 W/m2, whereas in grassland sites, the algorithms may not capture the soil moisture constraint, resulting in underestimating the ET value, which makes the simulated ET value uncertain in the alpine grassland ecosystems of the TRHR.

5. Conclusions

In this study, we applied satellite data products in combination with meteorological reanalysis datasets to evaluate the interannual and seasonal dynamics of terrestrial biophysical variables, including the meteorological variables, vegetation, and evapotranspiration (ET) over the Three-River Headwaters Region (TRHR). We then further investigated the response of vegetation and ET to climate change during the period 1982–2015. Our results showed that the Ta and P increased by 0.597 °C and 41.1 mm per decade, while the RH and Rs declined at a rate of 0.9% and 1.8 W/m2 per decade, respectively. The largest upward movement of Ta associated with the decline in RH occurred in winter (0.901/decade and 0.6%/decade, respectively), and the increment of P and the reduction of Rs were largest in summer (6.66 mm/decade and 4.57 W/m2, respectively). A ‘dryer warming’ tendency and a ‘wetter warming’ tendency exist in different areas of the TRHR. Generally, most areas of the TRHR became warmer and moister, except for some areas in the southern TRHR, with a trend of being dryer and warmer.
Our findings illustrate that the NDVI of the TRHR fluctuated in the period 1982–2015, with a slight increase (0.0051/decade) particularly in the northern and western meadow areas. The NDVI significantly increased over 56.8% of the TRHR, and the largest increment occurred in spring, followed by summer. In well-watered regions, Ta was the primary driver of vegetation greening, while in the water limiting areas, vegetation growth was mainly governed by the variation of P. Our results suggest that the warming and wetting tendencies of the climate characterized by increasing Ta and P contribute most to the increment of vegetation in the TRHR.
The annual mean terrestrial ET was about 230.23 mm/year and varied 162 mm/year to 362 mm/year from the northwest to southeast over the TRHR in the period from 1982 to 2015. The ET of the TRHR showed a significant increasing trend at a rate of 3.34 mm/decade, particularly in winter (0.154 mm/decade), which corresponded to the expected acceleration associated with climate warming. In the arid region of western TRHR, ET was limited by the terrestrial water supply, which includes soil moisture (SM) and P. By contrast, atmospheric evaporative demand derived from Ta and relative humidity (RH) were the main controlling factors over the relatively humid region of southeastern TRHR. In addition, the intensification of agriculture irrigation is also responsible for the temporal and spatial variation of ET. Moreover, the impacts of carbon flux and anthropogenic disturbance on the biophysical variables need further exploration.

Author Contributions

Conceptualization, Y.Y.; Formal analysis, K.J.; Investigation, X.C.; Methodology, K.S.; Software, L.Z.; Supervision, T.X.; Validation, J.X.; Visualization, X.Z.; Writing—original draft, X.B.

Funding

This work was also partially supported by the National Key Research and Development Program of China (No. 2016YFB0501404) and the Natural Science Fund of China (41671331).

Acknowledgments

The authors thank Xianhong Xie and Bo Jiang from Beijing Normal University for their helpful suggestions. The authors thank Jie He and Kun Yang from the Institute of Tibetan Plateau Research, Chinese Academy of Sciences (http://westdc.westgis.ac.cn/) for providing the China Meteorological Forcing Dataset. The GIMMS NDVI product was obtained from NOAA (http://islscp2.sesda.com/ISLSCP21/data), and the land cover type product of GlobeLand30 was obtained online (http://www.globallandcover.com). The Climate Prediction Center soil moisture dataset was obtained online (http://www.esrl.noaa.gov/psd/).

Conflicts of Interest

The authors declare no conflict of interest.

Appendix A. Algorithms

The MS-PT algorithm can be described as
E T = E T s + E T c + E T i c + E T w s ,
E T s = ( 1 f w e t ) f s m α Δ Δ + γ ( R n s G ) ,
E T c = ( 1 f w e t ) f c f T α Δ Δ + γ R n v ,
E T i c = f w e t α Δ Δ + γ R n v ,
E T w s = f w e t α Δ Δ + γ ( R n s G ) ,
where E T c is the canopy transpiration, E T s is the unsaturated soil evaporation, E T i c is the canopy interception evaporation, and E T w s is the saturated wet soil surface evaporation. Moreover, f w e t is the relative surface wetness ( f s m 4 ), in which f s m refers to soil moisture constraint and can be derived from A T I ( A T I = ( 1 D T ) D T / D T m a x , D T m a x = 40 °C), f T represents plant temperature constraint ( exp (   ( T m a x T o p t ) / T o p t ) 2 ), T o p t is an optimum temperature (25 °C), R n s is the surface net radiation to the soil ( R n s = R n ( 1 f c ) ), G is soil heat flux ( μ R n ( 1 f c ) , μ = 0.18), R n v represents the surface net radiation to the vegetation ( R n v = R n f c ), f c is the vegetation cover fraction ( f c = ( N D V I     N D V I m i n / ( N D V I m a x N D V I m i n ) ), and N D V I m i n and N D V I m a x are the minimum and maximum NDVI, respectively. Δ is the slope of the saturate vapor pressure curve, and γ is the psychrometric constant (0.066 kPa/ °C).

References

  1. Duveiller, G.; Hooker, J.; Cescatti, A. The mark of vegetation change on Earth’s surface energy balance. Nat. Commun. 2018, 9, 679. [Google Scholar] [CrossRef]
  2. Jiang, C.; Zhang, L. Ecosystem change assessment in the Three-river Headwater Region, China: Patterns, causes, and implications. Ecol. Eng. 2016, 93, 24–36. [Google Scholar] [CrossRef]
  3. Li, W.H.; Zhao, X.Q.; Zhang, X.Z.; Shi, P.L.; Wang, X.D.; Zhao, L. Change mechanism in main ecosystems and its effect of carbon source/sink function on the Qinghai-Tibetan Plateau. Chin. J. Nat. 2013, 35, 172–178. [Google Scholar]
  4. Wang, Z.; Song, K.; Hu, L. China’s Largest Scale Ecological Migration in the Three-River Headwater Region. Ambio 2010, 39, 443–446. [Google Scholar] [CrossRef] [PubMed]
  5. Shao, Q.; Liu, J.; Huang, L.; Fan, J.; Xinliang, X.U.; Wang, J. Integrated assessment on the effectiveness of ecological conservation in Sanjiangyuan National Nature Reserve. Geogr. Res. 2013, 32, 1645–1656. [Google Scholar]
  6. Li, X.-L.; Brierley, G.; Shi, D.-J.; Xie, Y.-L.; Sun, H.-Q. Ecological Protection and Restoration in Sanjiangyuan National Nature Reserve, Qinghai Province, China. In Perspectives on Environmental Management and Technology in Asian River Basins; Springer: Berlin/Heidelberg, Germany, 2012; pp. 93–120. [Google Scholar]
  7. Zhang, Y.; Zhang, S.; Zhai, X.; Xia, J. Runoff variation and its response to climate change in the Three Rivers Source Region. J. Geogr. Sci. 2012, 22, 781–794. [Google Scholar] [CrossRef]
  8. Liu, X.; Zhu, X.; Pan, Y.; Zhu, W.; Zhang, J.; Zhang, D. Thermal growing season and response of alpine grassland to climate variability across the Three-Rivers Headwater Region, China. Agric. For. Meteorol. 2016, 220, 30–37. [Google Scholar] [CrossRef]
  9. Chen, H.; Zhu, Q.; Peng, C.; Wu, N.; Wang, Y.; Fang, X.; Gao, Y.; Zhu, D.; Yang, G.; Tian, J. The impacts of climate change and human activities on biogeochemical cycles on the Q inghai-T ibetan P lateau. Glob. Chang. Biol. 2013, 19, 2940–2955. [Google Scholar] [CrossRef]
  10. Jiang, C.; Li, D.; Gao, Y.; Liu, W.; Zhang, L. Impact of climate variability and anthropogenic activity on streamflow in the Three Rivers Headwater Region, Tibetan Plateau, China. Theor. Appl. Climatol. 2017, 129, 667–681. [Google Scholar] [CrossRef]
  11. Yao, Y.; Liang, S.; Li, X.; Chen, J.; Wang, K.; Jia, K.; Cheng, J.; Jiang, B.; Fisher, J.B.; Mu, Q. A satellite-based hybrid algorithm to determine the Priestley–Taylor parameter for global terrestrial latent heat flux estimation across multiple biomes. Remote Sens. Environ. 2015, 165, 216–233. [Google Scholar] [CrossRef]
  12. Jiang, C.; Zhang, L. Climate Change and Its Impact on the Eco-Environment of the Three-Rivers Headwater Region on the Tibetan Plateau, China. Int. J. Environ. Res. Public Health 2015, 12, 12057–12081. [Google Scholar] [CrossRef] [PubMed] [Green Version]
  13. Chong, J.; Li, D.; Gao, Y.; Liu, X.; Liu, W.; Zhang, L. Spatiotemporal variability of streamflow and attribution in the Three-Rivers Headwater Region, northwest China. J. Water Clim. Chang. 2016, 7, 637–649. [Google Scholar] [Green Version]
  14. Tong, L.; Xu, X.; Fu, Y.; Li, S. Wetland Changes and Their Responses to Climate Change in the “Three-River Headwaters” Region of China since the 1990s. Energies 2014, 7, 2515–2534. [Google Scholar] [CrossRef]
  15. Liu, S.; Li, X.; Xu, Z.; Che, T.; Xiao, Q.; Ma, M.; Liu, Q.; Jin, R.; Guo, J.; Wang, L. The Heihe Integrated Observatory Network: A basin-scale land surface processes observatory in China. Vadose Zone J. 2018, 17. [Google Scholar] [CrossRef]
  16. Zhao, T.; Congbin, F.U.; Zongjian, K.E.; Guo, W. Global Atmosphere Reanalysis Datasets: Current Status and Recent Advances. Adv. Earth Sci. 2010, 25, 242–254. [Google Scholar]
  17. Gao, Q.; Guo, Y.; Xu, H.; Ganjurjav, H.; Li, Y.; Wan, Y.; Qin, X.; Ma, X.; Liu, S. Climate change and its impacts on vegetation distribution and net primary productivity of the alpine ecosystem in the Qinghai-Tibetan Plateau. Sci. Total Environ. 2016, 554, 34–41. [Google Scholar] [CrossRef] [PubMed]
  18. Liang, T.; Yang, S.; Feng, Q.; Liu, B.; Zhang, R.; Huang, X.; Xie, H. Multi-factor modeling of above-ground biomass in alpine grassland: A case study in the Three-River Headwaters Region, China. Remote Sens. Environ. 2016, 186, 164–172. [Google Scholar] [CrossRef]
  19. Liu, J.; Xu, X.; Shao, Q. The spatil and temporal characteristics of grassland degradation in the three-river headwaters region in Qinghai Province. Acta Geogr. Sin. 2008, 63, 364–376. [Google Scholar]
  20. Chen, Q. Causes of Grassland Degradation in Dari County of Qinghai Province. Acta Pratac. 1998, 7, 44–48. [Google Scholar]
  21. Cai, H.; Yang, X.; Xu, X. Human-induced grassland degradation/restoration in the central Tibetan Plateau: The effects of ecological protection and restoration projects. Ecol. Eng. 2015, 83, 112–119. [Google Scholar] [CrossRef]
  22. Huixia, L.I.; Liu, G.; Bojie, F.U. Response of vegetation to climate change and human activity based on NDVI in the Three-River Headwaters region. Acta Ecol. Sin. 2011, 31, 5495–5504. [Google Scholar]
  23. Liu, X.; Zhang, J.; Zhu, X.; Pan, Y.; Liu, Y.; Zhang, D.; Lin, Z. Spatiotemporal changes in vegetation coverage and its driving factors in the Three-River Headwaters Region during 2000–2011. J. Geogr. Sci. 2014, 24, 288–302. [Google Scholar] [CrossRef]
  24. Yao, Y.; Liang, S.; Li, X.; Chen, J.; Liu, S.; Jia, K.; Zhang, X.; Xiao, Z.; Fisher, J.B.; Mu, Q. Improving global terrestrial evapotranspiration estimation using support vector machine by integrating three process-based algorithms. Agric. For. Meteorol. 2017, 242, 55–74. [Google Scholar] [CrossRef]
  25. Wang, K.; Dickinson, R.E. A review of global terrestrial evapotranspiration: Observation, modeling, climatology, and climatic variability. Rev. Geophys. 2012, 50. [Google Scholar] [CrossRef]
  26. Yao, Y.; Hong, Y.; Zhang, N.; Chen, J.; Cheng, J.; Zhao, S.; Zhang, X.; Jiang, B.; Sun, L.; Jia, K. Bayesian multimodel estimation of global terrestrial latent heat flux from eddy covariance, meteorological, and satellite observations. J. Geophys. Res. Atmos. 2014, 119, 4521–4545. [Google Scholar] [CrossRef]
  27. Chang, Y.; Qin, D.; Ding, Y.; Zhao, Q.; Zhang, S. A modified MOD16 algorithm to estimate evapotranspiration over alpine meadow on the Tibetan Plateau, China. J. Hydrol. 2018, 561, 16–30. [Google Scholar] [CrossRef]
  28. Liu, W. Evaluating remotely sensed monthly evapotranspiration against water balance estimates at basin scale in the Tibetan Plateau. Hydrol. Res. 2018, 49, 1977–1990. [Google Scholar] [CrossRef] [Green Version]
  29. Yao, Y.; Zhao, S.; Wan, H.; Zhang, Y.; Jiang, B.O.; Jia, K.; Liu, M.; Jinhui, W.U. Satellite evidence for no change in terrestrial latent heat flux in the Three-River Headwaters region of China over the past three decades. J. Earth Syst. Sci. 2016, 125, 1245–1253. [Google Scholar] [CrossRef] [Green Version]
  30. Xu, M.; Kang, S.; Chen, X.; Wu, H.; Wang, X.; Su, Z. Detection of hydrological variations and their impacts on vegetation from multiple satellite observations in the Three-River Source Region of the Tibetan Plateau. Sci. Total Environ. 2018, 639, 1220–1232. [Google Scholar] [CrossRef]
  31. Peng, J.; Loew, A.; Chen, X.; Ma, Y.; Su, Z. Comparison of satellite based evapotranspiration estimates over the Tibetan Plateau. Hydrol. Earth Syst. Sci. 2016, 20, 3167–3182. [Google Scholar] [CrossRef]
  32. Yao, Y.; Liang, S.; Yu, J.; Chen, J.; Liu, S.; Lin, Y.; Fisher, J.B.; McVicar, T.R.; Cheng, J.; Jia, K. A simple temperature domain two-source model for estimating agricultural field surface energy fluxes from Landsat images. J. Geophys. Res. Atmos. 2017, 122, 5211–5236. [Google Scholar] [CrossRef]
  33. Zhang, Y.; Zhang, C.; Wang, Z.; Chen, Y.; Gang, C.; An, R.; Li, J. Vegetation dynamics and its driving forces from climate change and human activities in the Three-River Source Region, China from 1982 to 2012. Sci. Total Environ. 2016, 563, 210–220. [Google Scholar] [CrossRef] [PubMed]
  34. Li, L.; Li, F.X.; Guo, A.H.; Zhu, X.D. Study on the Climate Change Trend and Its Catastrophe over “Sanjiangyuan” Region in Recent 43 Years. J. Nat. Resour. 2006, 21, 79–85. [Google Scholar]
  35. Fang, Y. Managing the Three-Rivers Headwater Region, China: From Ecological Engineering to Social Engineering. Ambio 2013, 42, 566–576. [Google Scholar] [CrossRef] [PubMed] [Green Version]
  36. Wu, J.; Feng, Y.; Zhang, J.; Zhang, X.; Song, C. Identifying the Relative Contributions of Climate and Grazing to Both Direction and Magnitude of Alpine Grassland Productivity Dynamic from 1993 to 2011 on the Northern Tibetan Plateau. In Proceedings of the EGU General Assembly Conference, Vienna, Austria, 23–28 April 2017; p. 136. [Google Scholar]
  37. Chen, Y.; Yang, K.; Jie, H.; Qin, J.; Shi, J.; Du, J.; He, Q. Improving land surface temperature modeling for dry land of China. J. Geophys. Res. Atmos. 2011, 116. [Google Scholar] [CrossRef]
  38. He, J.; Yang, K. China Meteorological Forcing Dataset; Cold and Arid Regions Science Data Center: Lanzhou, China, 2011. [Google Scholar]
  39. Yang, K.; Koike, T.; Ye, B. Improving estimation of hourly, daily, and monthly solar radiation by importing global data sets. Agric. For. Meteorol. 2006, 137, 43–55. [Google Scholar] [CrossRef]
  40. Wang, K.; Liang, S. Estimation of Surface Net Radiation from Solar Shortwave Radiation Measurements. In Proceedings of the IGARSS 2008—IEEE International Geoscience and Remote Sensing Symposium, Boston, MA, USA, 7–11 July 2008; pp. 483–486. [Google Scholar]
  41. Tucker, C.J.; Newcomb, W.W.; Dregne, H.E. AVHRR data sets for determination of desert spatial extent. Int. J. Remote Sens. 1994, 15, 3547–3565. [Google Scholar] [CrossRef]
  42. Tucker, C.J.; Pinzon, J.E.; Brown, M.E.; Slayback, D.A.; Pak, E.W.; Mahoney, R.; Vermote, E.F.; Saleous, N.E. An extended AVHRR 8 m NDVI dataset compatible with MODIS and SPOT vegetation NDVI data. Int. J. Remote Sens. 2005, 26, 4485–4498. [Google Scholar] [CrossRef]
  43. Zeng, F.-W.; Collatz, G.; Pinzon, J.; Ivanoff, A. Evaluating and quantifying the climate-driven interannual variability in Global Inventory Modeling and Mapping Studies (GIMMS) Normalized Difference Vegetation Index (NDVI3g) at global scales. Remote Sens. 2013, 5, 3918–3950. [Google Scholar] [CrossRef]
  44. Yao, Y.; Liang, S.; Cheng, J.; Liu, S.; Fisher, J.B.; Zhang, X.; Jia, K.; Zhao, X.; Qin, Q.; Zhao, B. MODIS-driven estimation of terrestrial latent heat flux in China based on a modified Priestley–Taylor algorithm. Agric. For. Meteorol. 2013, 171–172, 187–202. [Google Scholar] [CrossRef]
  45. Yao, Y.; Liang, S.; Zhao, S.; Zhang, Y.; Qin, Q.; Cheng, J.; Jia, K.; Xie, X.; Zhang, N.; Liu, M. Validation and application of the modified satellite-based Priestley-Taylor algorithm for mapping terrestrial evapotranspiration. Remote Sens. 2014, 6, 880–904. [Google Scholar] [CrossRef]
  46. Zhang, L.; Yao, Y.; Wang, Z.; Jia, K.; Zhang, X.; Zhang, Y.; Wang, X.; Xu, J.; Chen, X. Satellite-Derived Spatiotemporal Variations in Evapotranspiration over Northeast China during 1982–2010. Remote Sens. 2017, 9, 1140. [Google Scholar] [CrossRef]
  47. Chen, J.; Chen, J.; Liao, A.; Cao, X.; Chen, L.; Chen, X.; He, C.; Han, G.; Peng, S.; Lu, M. Global land cover mapping at 30 m resolution: A POK-based operational approach. ISPRS J. Photogr. Remote Sens. 2015, 103, 7–27. [Google Scholar] [CrossRef]
  48. Jun, C.; Ban, Y.; Li, S. China: Open access to Earth land-cover map. Nature 2014, 514, 434. [Google Scholar] [CrossRef] [PubMed]
  49. Atta-ur-Rahman; Dawood, M. Spatio-statistical analysis of temperature fluctuation using Mann–Kendall and Sen’s slope approach. Clim. Dyn. 2017, 48, 783–797. [Google Scholar] [CrossRef]
  50. Xu, Z.; Gong, T.; Li, J. Decadal trend of climate in the Tibetan Plateau—Regional temperature and precipitation. Hydrol. Process. Int. J. 2008, 22, 3056–3065. [Google Scholar] [CrossRef]
  51. You, Q.; Min, J.; Lin, H.; Pepin, N.; Kang, S. Observed climatology and trend in relative humidity in the central and eastern Tibetan Plateau. J. Geophys. Res. Atmos. 2015, 120, 3610–3621. [Google Scholar] [CrossRef] [Green Version]
  52. Feng, Y.; Li, Y. Estimated spatiotemporal variability of total, direct and diffuse solar radiation across China during 1958–2016. Int. J. Climatol. 2018, 38, 4395–4404. [Google Scholar] [CrossRef]
  53. Zhong, L.; Ma, Y.; Salama, M.S.; Su, Z. Assessment of vegetation dynamics and their response to variations in precipitation and temperature in the Tibetan Plateau. Clim. Chang. 2010, 103, 519–535. [Google Scholar] [CrossRef]
  54. Ji, F.; Wu, Z.; Huang, J.; Chassignet, E.P. Evolution of land surface air temperature trend. Nat. Clim. Chang. 2014, 4, 462–466. [Google Scholar] [CrossRef]
  55. Yang, K.; Ding, B.; Qin, J.; Tang, W.; Lu, N.; Lin, C. Can aerosol loading explain the solar dimming over the Tibetan Plateau? Geophys. Res. Lett. 2012, 39. [Google Scholar] [CrossRef] [Green Version]
  56. Xu, G.; Zhang, H.; Chen, B.; Zhang, H.; Innes, J.; Wang, G.; Yan, J.; Zheng, Y.; Zhu, Z.; Myneni, R. Changes in vegetation growth dynamics and relations with climate over China’s landmass from 1982 to 2011. Remote Sens. 2014, 6, 3263–3283. [Google Scholar] [CrossRef]
  57. Shao, Q.; Fan, J.; Liu, J.; Lin, H.; Wei, C.; Xinliang, X.U.; Jinsong, G.E.; Dan, W.U.; Zhiqiang, L.I.; Gong, G. Assessment on the effects of the first-stage ecological conservation and restoration project in Sanjiangyuan region. Acta Geogr. Sin. 2016, 71, 3–20. [Google Scholar]
  58. Zeng, Z.; Wang, T.; Zhou, F.; Ciais, P.; Mao, J.; Shi, X.; Piao, S. A worldwide analysis of spatiotemporal changes in water balance-based evapotranspiration from 1982 to 2009. J. Geophys. Res. Atmos. 2014, 119, 1186–1202. [Google Scholar] [CrossRef]
  59. Liu, X.; Zhu, X.; Zhu, W.; Pan, Y.; Zhang, C.; Zhang, D. Changes in Spring Phenology in the Three-Rivers Headwater Region from 1999 to 2013. Remote Sens. 2014, 6, 9130–9144. [Google Scholar] [CrossRef] [Green Version]
  60. Yao, Y.; Zhao, S.; Zhang, Y.; Jia, K.; Liu, M. Spatial and Decadal Variations in Potential Evapotranspiration of China Based on Reanalysis Datasets during 1982–2010. Atmosphere 2014, 5, 737–754. [Google Scholar] [CrossRef]
  61. Zhang, Y.; Liu, C.; Tang, Y.; Yang, Y. Trends in pan evaporation and reference and actual evapotranspiration across the Tibetan Plateau. J. Geophys. Res. Atmos. 2007, 112. [Google Scholar] [CrossRef]
  62. Yang, Y.; Donohue, R.J.; Mcvicar, T.R. Global estimation of effective plant rooting depth: Implications for hydrological modelling. Water Resources Res. 2016, 52, 8260–8276. [Google Scholar] [CrossRef]
  63. Yang, K.; Zhou, D.; Wu, B.; Foken, T.; Qin, J.; Zhou, Z. Response of hydrological cycle to recent climate changes in the Tibetan Plateau. Clim. Chang. 2011, 109, 517–534. [Google Scholar] [CrossRef]
  64. Guo, D.; Wang, H. The significant climate warming in the northern Tibetan Plateau and its possible causes. Int. J. Climatol. 2012, 32, 1775–1781. [Google Scholar] [CrossRef]
  65. Li, L.; Yang, S.; Wang, Z.; Zhu, X.; Tang, H. Evidence of warming and wetting climate over the Qinghai-Tibet Plateau. Arct. Antarct. Alp. Res. 2010, 42, 449–457. [Google Scholar] [CrossRef]
  66. An, W.; Hou, S.; Zhang, W.; Wang, Y.; Liu, Y.; Wu, S.; Pang, H. Significant recent warming over the northern Tibetan Plateau from ice core δ18O records. Clim. Past 2016, 11, 2701–2728. [Google Scholar] [CrossRef]
  67. Salama, M.S.; Van der Velde, R.; Zhong, L.; Ma, Y.; Ofwono, M.; Su, Z. Decadal variations of land surface temperature anomalies observed over the Tibetan Plateau by the Special Sensor Microwave Imager (SSM/I) from 1987 to 2008. Clim. Chang. 2012, 114, 769–781. [Google Scholar] [CrossRef] [Green Version]
  68. Gao, Y.; Lan, C.; Zhang, Y. Changes in Moisture Flux over the Tibetan Plateau during 1979–2011 and Possible Mechanisms. J. Clim. 2014, 27, 1876–1893. [Google Scholar] [CrossRef]
  69. Kuang, X.; Jiao, J.J. Review on climate change on the Tibetan Plateau during the last half century. J. Geophys. Res. Atmos. 2016, 121, 3979–4007. [Google Scholar] [CrossRef]
  70. Zhu, Z.; Piao, S.; Myneni, R.B.; Huang, M.; Zeng, Z.; Canadell, J.G.; Ciais, P.; Sitch, S.; Friedlingstein, P.; Arneth, A. Greening of the Earth and its drivers. Nat. Clim. Chang. 2016, 6, 791–795. [Google Scholar] [CrossRef]
  71. Du, J.; Zhao, C.; Shu, J.; Jiaerheng, A.; Yuan, X.; Yin, J.; Fang, S.; Ping, H. Spatiotemporal changes of vegetation on the Tibetan Plateau and relationship to climatic variables during multiyear periods from 1982–2012. Environ. Earth Sci. 2016, 75, 1–18. [Google Scholar] [CrossRef]
  72. Gu, F.; Zhang, Y.; Huang, M.; Tao, B.; Guo, R.; Yan, C. Effects of climate warming on net primary productivity in China during 1961–2010. Ecol. Evolut. 2017, 7, 6736–6746. [Google Scholar] [CrossRef]
  73. Xu, W.; Gu, S.; Zhao, X.; Xiao, J.; Tang, Y.; Fang, J.; Zhang, J.; Jiang, S. High positive correlation between soil temperature and NDVI from 1982 to 2006 in alpine meadow of the Three-River Source Region on the Qinghai-Tibetan Plateau. Int. J. Appl. Earth Obs. Geoinf. 2011, 13, 528–535. [Google Scholar] [CrossRef]
  74. Han, Z.; Song, W.; Deng, X.; Xu, X. Grassland ecosystem responses to climate change and human activities within the Three-River Headwaters region of China. Sci. Rep. 2018, 8, 9079. [Google Scholar] [CrossRef]
  75. Zhang, T.; Gebremichael, M.; Meng, X.; Wen, J.; Iqbal, M.; Jia, D.; Yu, Y.; Li, Z. Climate-related trends of actual evapotranspiration over the Tibetan Plateau (1961–2010). Int. J. Climatol. 2018, 38, e48–e56. [Google Scholar] [CrossRef]
  76. Zhang, H.; Sun, J.; Xiong, J. Spatial-Temporal Patterns and Controls of Evapotranspiration across the Tibetan Plateau (2000–2012). Adv. Meteorol. 2017, 2017. [Google Scholar] [CrossRef]
  77. Yin, Y.; Wu, S.; Zhao, D. Past and future spatiotemporal changes in evapotranspiration and effective moisture on the Tibetan Plateau. J. Geophys. Res. Atmos. 2013, 118. [Google Scholar] [CrossRef]
  78. Song, L.; Zhuang, Q.; Yin, Y.; Zhu, X.; Wu, S. Spatio-temporal dynamics of evapotranspiration on the Tibetan Plateau from 2000 to 2010. Environ. Res. Lett. 2017, 12, 014011. [Google Scholar] [CrossRef]
  79. Jung, M.; Reichstein, M.; Ciais, P.; Seneviratne, S.I.; Sheffield, J.; Goulden, M.L.; Bonan, G.; Cescatti, A.; Chen, J.; Jeu, R.D. Recent decline in the global land evapotranspiration trend due to limited moisture supply. Nature 2010, 467, 951–954. [Google Scholar] [CrossRef]
  80. Xiao, J. Satellite evidence for significant biophysical consequences of the “Grain for Green” Program on the Loess Plateau in China. J. Geophys. Res. Biogeosci. 2015, 119, 2261–2275. [Google Scholar] [CrossRef]
  81. Yang, F.; Lu, H.; Yang, K.; He, J.; Wang, W.; Wright, J.S.; Li, C.; Han, M.; Li, Y. Evaluation of multiple forcing data sets for precipitation and shortwave radiation over major land areas of China. Hydrol. Earth Syst. Sci. 2017, 21, 5805–5821. [Google Scholar] [CrossRef] [Green Version]
  82. Wang, Y.; Nan, Z.; Chen, H.; Wu, X. Correction of Daily Precipitation Data of ITPCAS Dataset over the Qinghai-Tibetan Plateau with KNN Model. In Proceedings of the 2016 IEEE International Geoscience and Remote Sensing Symposium (IGARSS), Beijing, China, 10–15 July 2016; pp. 593–596. [Google Scholar]
  83. Kern, A.; Marjanović, H.; Barcza, Z. Evaluation of the Quality of NDVI3g Dataset against Collection 6 MODIS NDVI in Central Europe between 2000 and 2013. Remote Sens. 2016, 8, 955. [Google Scholar] [CrossRef]
  84. Pinzon, J.; Tucker, C. A non-stationary 1981–2012 AVHRR NDVI3g time series. Remote Sens. 2014, 6, 6929–6960. [Google Scholar] [CrossRef]
  85. Yao, Y.; Liang, S.; Li, X.; Zhang, Y.; Chen, J.; Jia, K.; Zhang, X.; Fisher, J.B.; Wang, X.; Zhang, L. Estimation of high-resolution terrestrial evapotranspiration from Landsat data using a simple Taylor skill fusion method. J. Hydrol. 2017, 553, 508–526. [Google Scholar] [CrossRef]
  86. Yao, Y.; Liang, S.; Jian, Y.; Zhao, S.; Yi, L.; Jia, K.; Zhang, X.; Jie, C.; Xie, X.; Liang, S. Differences in estimating terrestrial water flux from three satellite-based Priestley-Taylor algorithms. Int. J. Appl. Earth Obs. Geoinf. 2017, 56, 1–12. [Google Scholar] [CrossRef]
Figure 1. Maps showing the location of the study sites. (A) The distribution of land cover types. (B) The Tibetan Plateau (TP) and Three-River Headwaters Region (TRHR). (C) The digital elevation model (DEM) data of the TRHR with a spatial resolution of 250 m. The study area consists of 17 counties and cities delineated by the Ecological Protection and Restoration Program, including Zeku, Tongde, Henan, Xinghai, Maqin, Gande, Jiuzhi, Dari, Banma, Maduo Chengduo, Yushu, Nangqian, Qumalai, Zaduo, Zhiduo, and Tanggulashan.
Remotesensing 11 01633 g001
Figure 2. Multiyear average and seasonal spatial patterns of the climate variables: (a) temperature, (b) precipitation, (c) relative humidity, (d) downward shortwave radiation. (1) MAM (March, April, and May); (2) JJA (June, July, and August); (3) SON (September, October, and November); (4) DJF (December, January, and February). Precipitation is in units of mm/month. Radiation is in units of W/m2.
Remotesensing 11 01633 g002
Figure 3. (a) Spatial patterns of the multiyear average NDVI in the TRHR. (a1) MAM (March, April, and May); (a2) JJA (June, July, and August); (a3) SON (September, October, and November); (a4) DJF (December, January, and February).
Remotesensing 11 01633 g003
Figure 4. (a) Spatial patterns of the multiyear ET of the TRHR. Multiyear seasonal patterns of ET: (a1) MAM (March, April, and May); (a2) JJA (June, July, and August); (a3) SON (September, October, and November); (a4) DJF (December, January, and February). ET is in units of mm/month.
Remotesensing 11 01633 g004
Figure 5. Spatial distributions of climate variable trends in the TRHR over the period 1982–2015: (a) temperature; (b) precipitation; (c) relative humidity; (d) downward shortwave radiation. The inset panels show the area where the climate variables trends were statistically significant ( p < 0.05 ). Blue represents a significant increase and red represents a significant decrease.
Remotesensing 11 01633 g005
Figure 6. Interannual and seasonal variability of climate variables trends over TRHR in the period 1982–2015 (a) temperature; (b) precipitation; (c) relative humidity; (d) downward shortwave radiation.
Remotesensing 11 01633 g006
Figure 7. (a) Spatial distributions of the NDVI trends. (b) Interannual and seasonal variability of the NDVI trends. The inset panel shows the area where the NDVI trend was statistically significant ( p < 0.05 ). Blue represents a significant increase and Red represents a significant decrease.
Remotesensing 11 01633 g007
Figure 8. (a) Spatial distributions of the ET trends; (b) Interannual and seasonal variability of the ET trends. The inset panel shows the area where the ET trend was statistically significant ( p < 0.05 ). Red represents a significant increase and blue represents a significant decrease.
Remotesensing 11 01633 g008
Figure 9. Maps of the relationship between the NDVI and climate variables: (a) temperature; (b) precipitation; (c) relative humidity; (d) downward shortwave radiation.
Remotesensing 11 01633 g009
Figure 10. The frequency of correlation coefficient with (a) NDVI, (b) ET. The degree correlation was classified into six ranks: Strong Negative (−1 < R < −0.7); Moderate Negative (−0.7 < R < −0.3); Weak Negative (−0.3 < R < 0); Weak Positive (0 < R < 0.3); Moderate Positive (0.3 < R < 0.7); and Strong Positive (0.7 < R < 1).
Remotesensing 11 01633 g010
Figure 11. Maps of the spatial distribution of correlation coefficient (r) between annual ET: (a) temperature, (b) precipitation, (c) relative humidity, (d) downward shortwave radiation, (e) potential evapotranspiration, (f) NDVI, (g) soil moisture, (h) spatial distribution of most related driving variables for annual ET during 1982–2015 over the TRHR.
Remotesensing 11 01633 g011
Figure 12. Box plots of per pixel annual average ET (mm/year) for each land cover type from 1982 to 2015 over the TRHR. CRO: cropland; FOR: forest; GRA: grassland; SHR: shrubland; BAR: bare land; ART: artificial surfaces.
Remotesensing 11 01633 g012
Table 1. Datasets for the meteorological reanalysis data and satellite data used in this study. NDVI, normalized difference vegetation index; ET, evapotranspiration.
Data NameSpatial ResolutionTemporal ResolutionUnitPeriod
Climate DataPrecipitation0.1° × 0.1°3 hmm/hour1982–2015
Pressure0.1° × 0.1°3 hPa1982–2015
Specific Humidity0.1° × 0.1° 3 hkg/kg1982–2015
Wind Speed0.1° × 0.1°3 hm/s1982–2015
Shortwave radiation0.1° × 0.1°3 hW/m21982–2015
Longwave radiation0.1° × 0.1°3 hW/m21982–2015
Temperature0.1° × 0.1°3 hK1982–2015
Soil moisture0.5° × 0.5°1 month-1982–2015
Satellite DataNDVI8 km16 day-1982–2015
ET0.1° × 0.1°dailymm/day1982–2015
DEM90 myearlym2003
Land Cover30 myearly-2010
Table 2. The Mann–Kendall test results for the terrestrial biophysical variable trends.
Biophysical VariableSeasonZβR/A
TaMAM3.32070.0441A
JJA4.09150.0475A
SON3.38000.0476A
DJF4.21010.0844A
Year5.22750.0568A
PMAM4.03220.3319A
JJA2.54980.6663A
SON2.46090.2943A
DJF4.50660.0820A
Year4.09150.3755A
RH MAM−0.5336−0.0002R
JJA−1.1415−0.0005R
SON−0.5633−0.0004R
DJF−2.4905−0.0022R
Year−1.69−0.0009R
RsMAM−0.8302−0.0750R
JJA−2.6091−0.5360A
SON−0.770−0.0715R
DJF−0.5929−0.0300R
Year−1.9865−0.1776A
NDVIMAM1.66030.0003R
JJA1.30460.0003R
SON1.14150.0002R
DJF0.429910.0000R
Year1.73450.0002R
ETMAM1.24530.0233R
JJA1.51210.0528R
SON1.00810.0219R
DJF2.57950.0146A
Year1.92720.3501R
R: reject hypothesis H0; A: accept hypothesis H0.

