Figure 1.
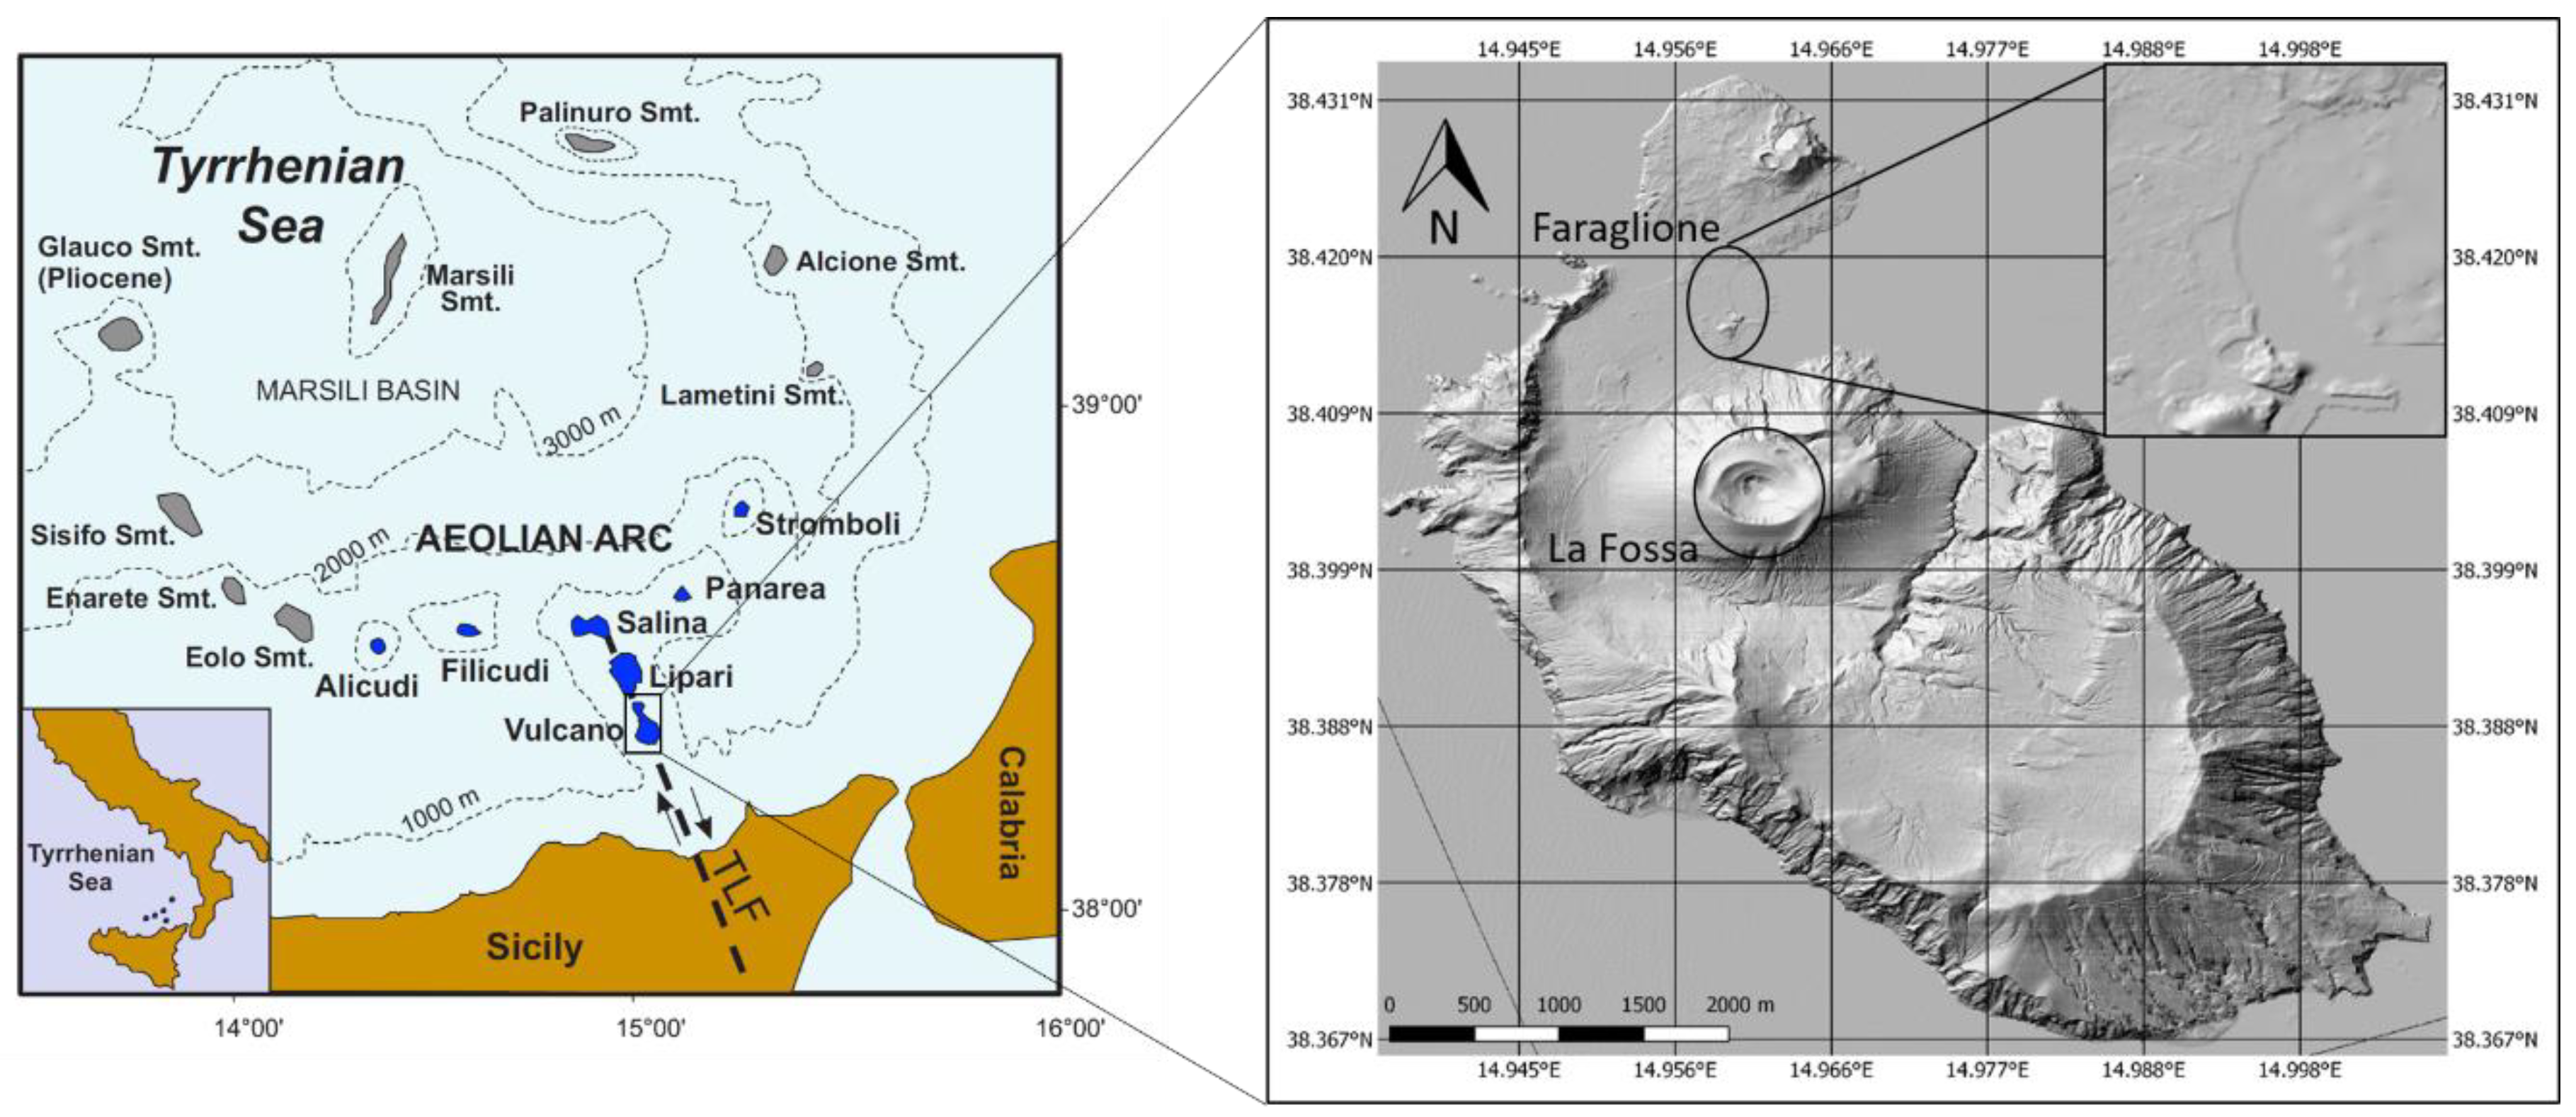
Location of the Island of Vulcano in the Aeolian archipelago, southern Tyrrhenian Sea and zoomed image of Vulcano based on a Lidar-derived DEM-shaded relief image [
47].
Figure 1.
Location of the Island of Vulcano in the Aeolian archipelago, southern Tyrrhenian Sea and zoomed image of Vulcano based on a Lidar-derived DEM-shaded relief image [
47].
Figure 2.
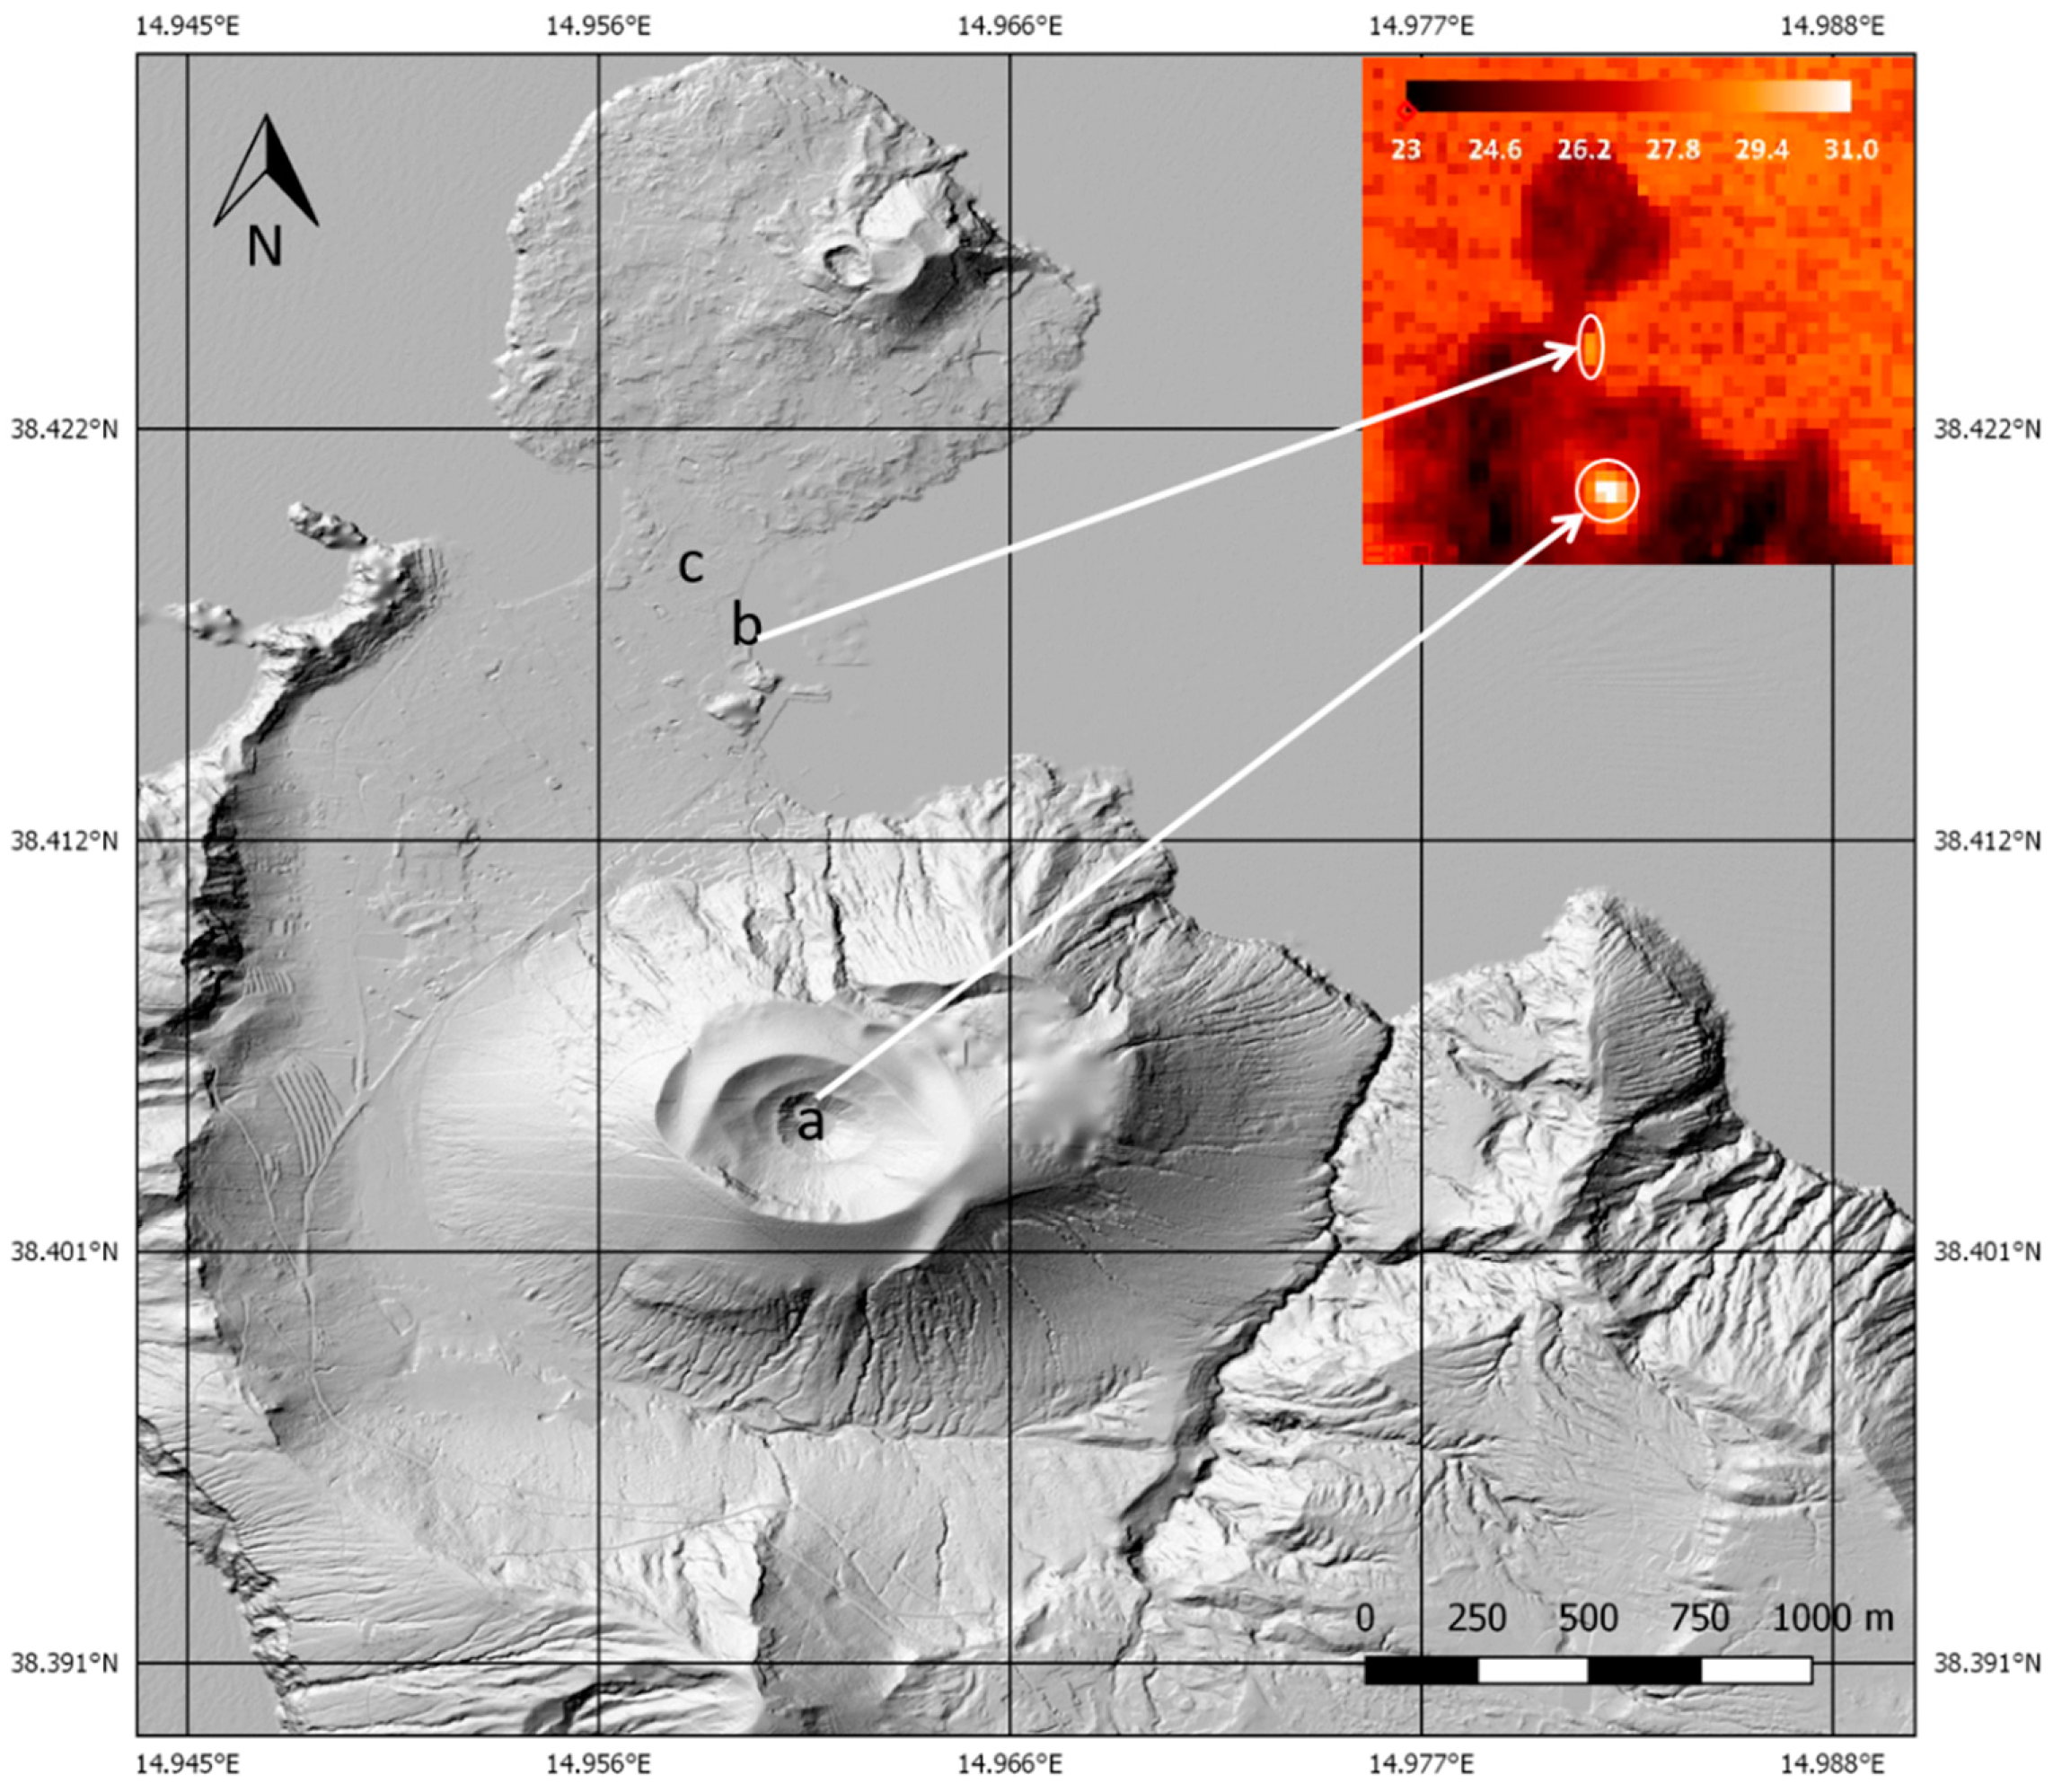
The two sites selected for the analysis: La Fossa crater (a), “Fangaia” mud pool (b) and Vulcano weather station (c). In the box the two areas viewed by L8 on 8 July 2017.
Figure 2.
The two sites selected for the analysis: La Fossa crater (a), “Fangaia” mud pool (b) and Vulcano weather station (c). In the box the two areas viewed by L8 on 8 July 2017.
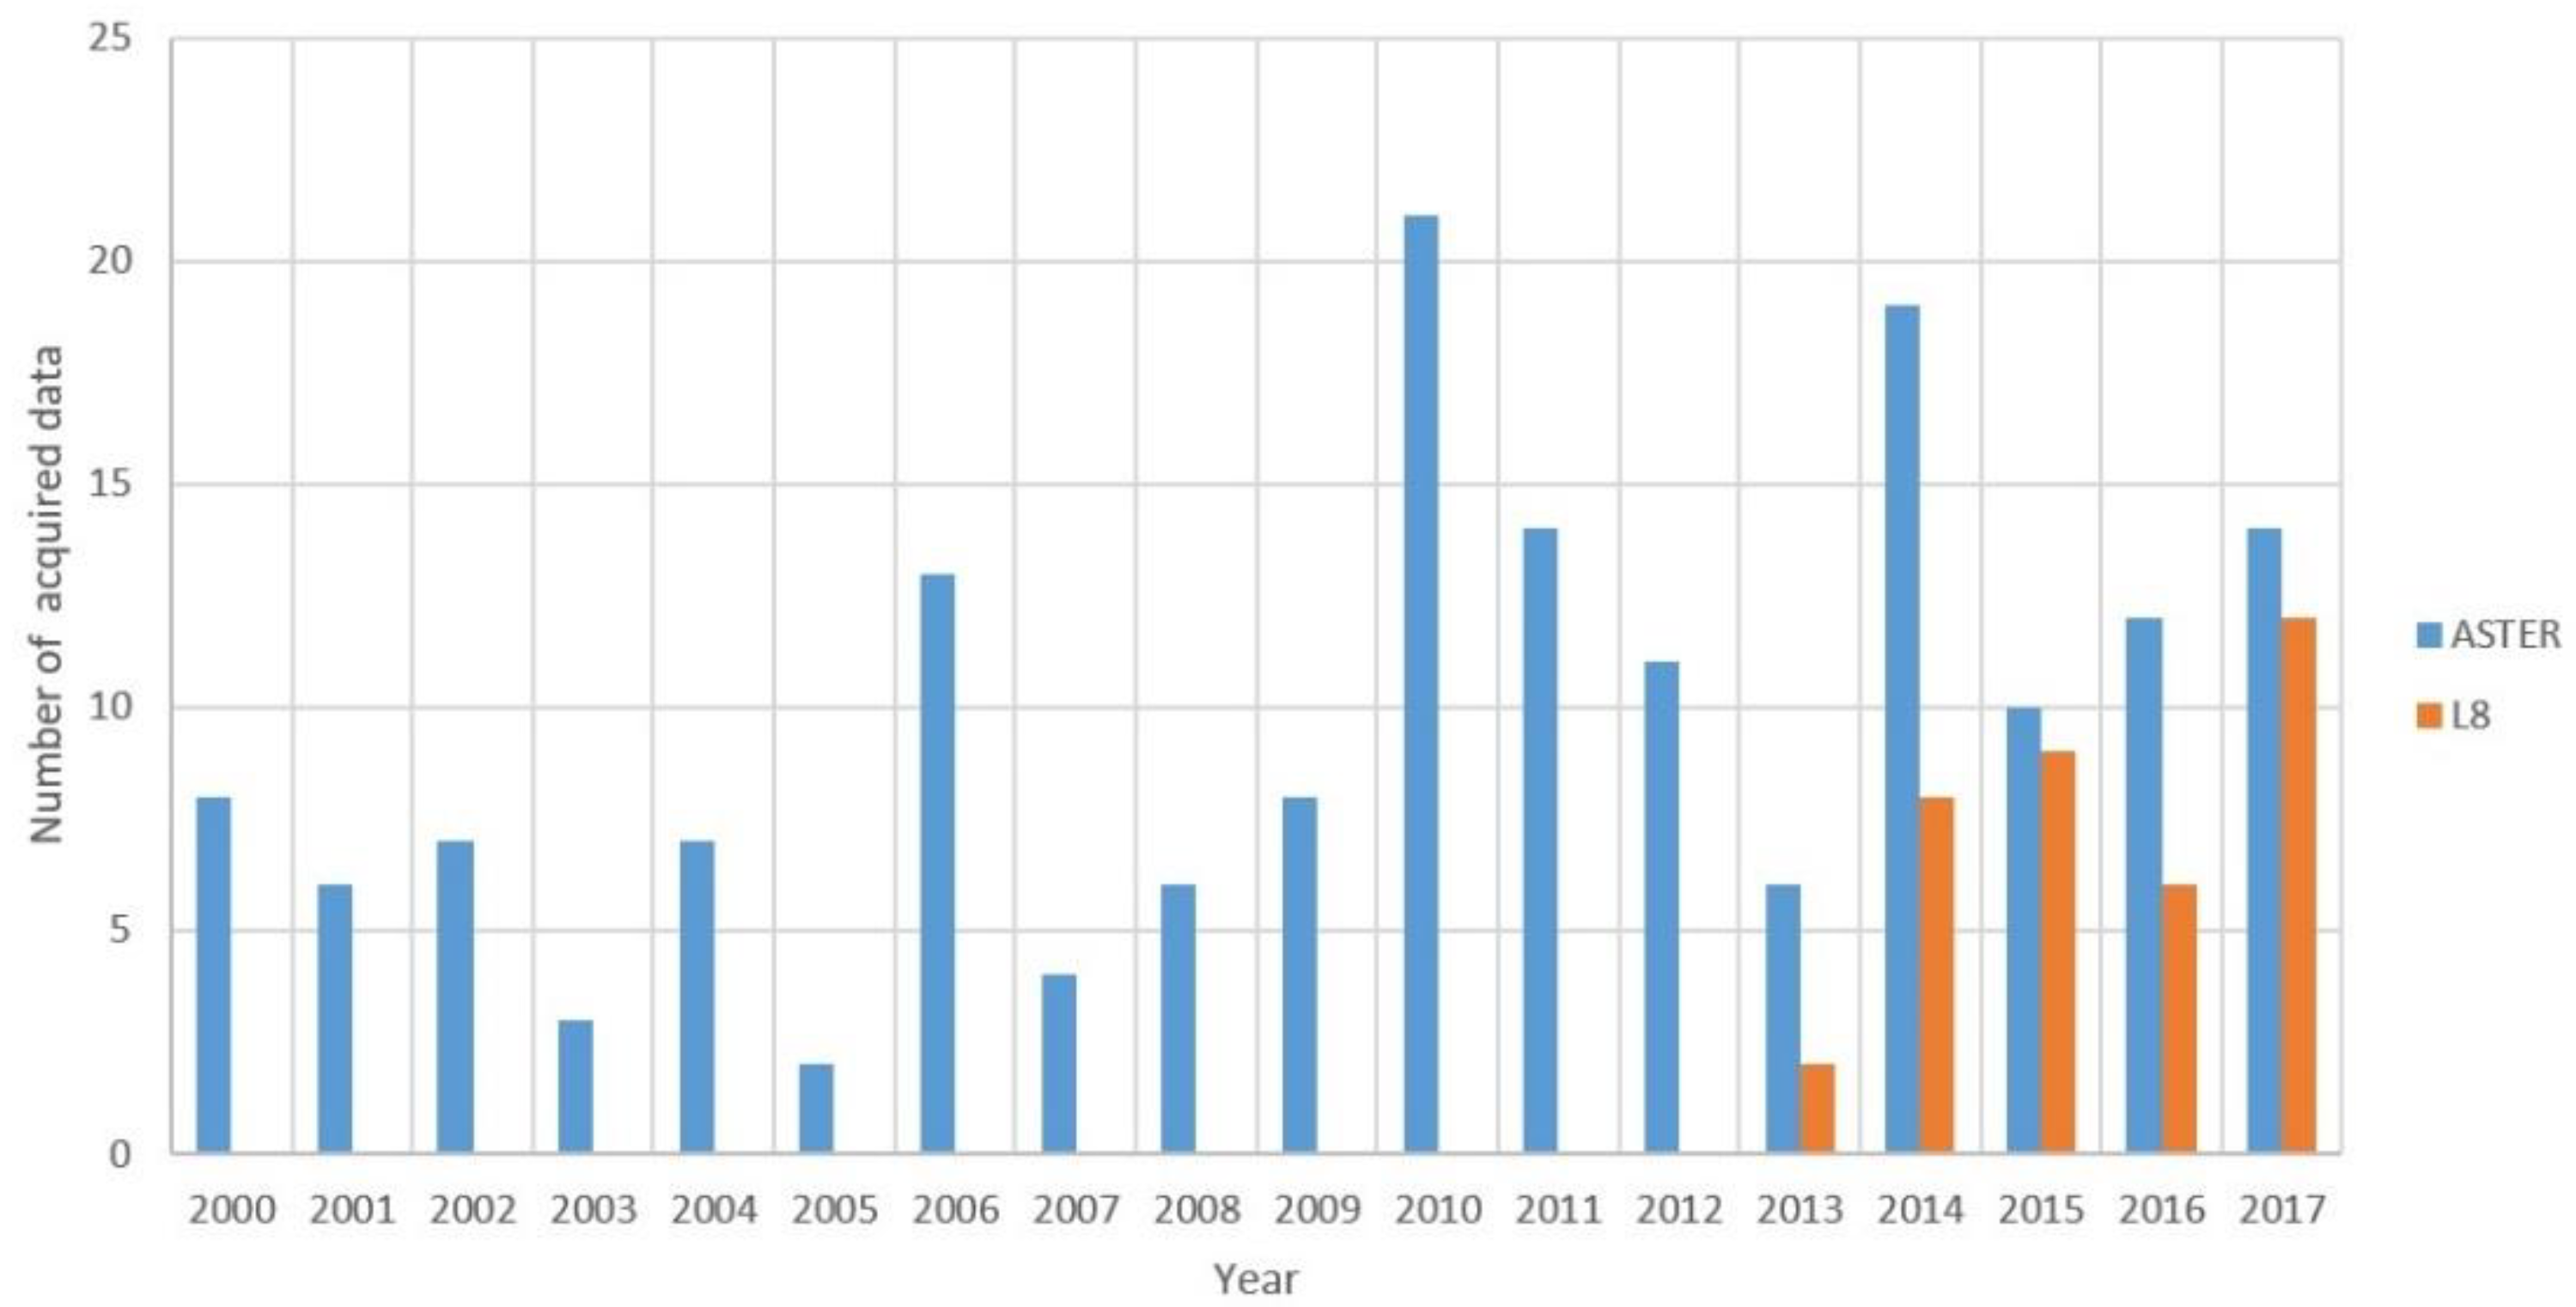
Figure 3.
Histogram with the number of satellite acquisitions per year.
Figure 3.
Histogram with the number of satellite acquisitions per year.
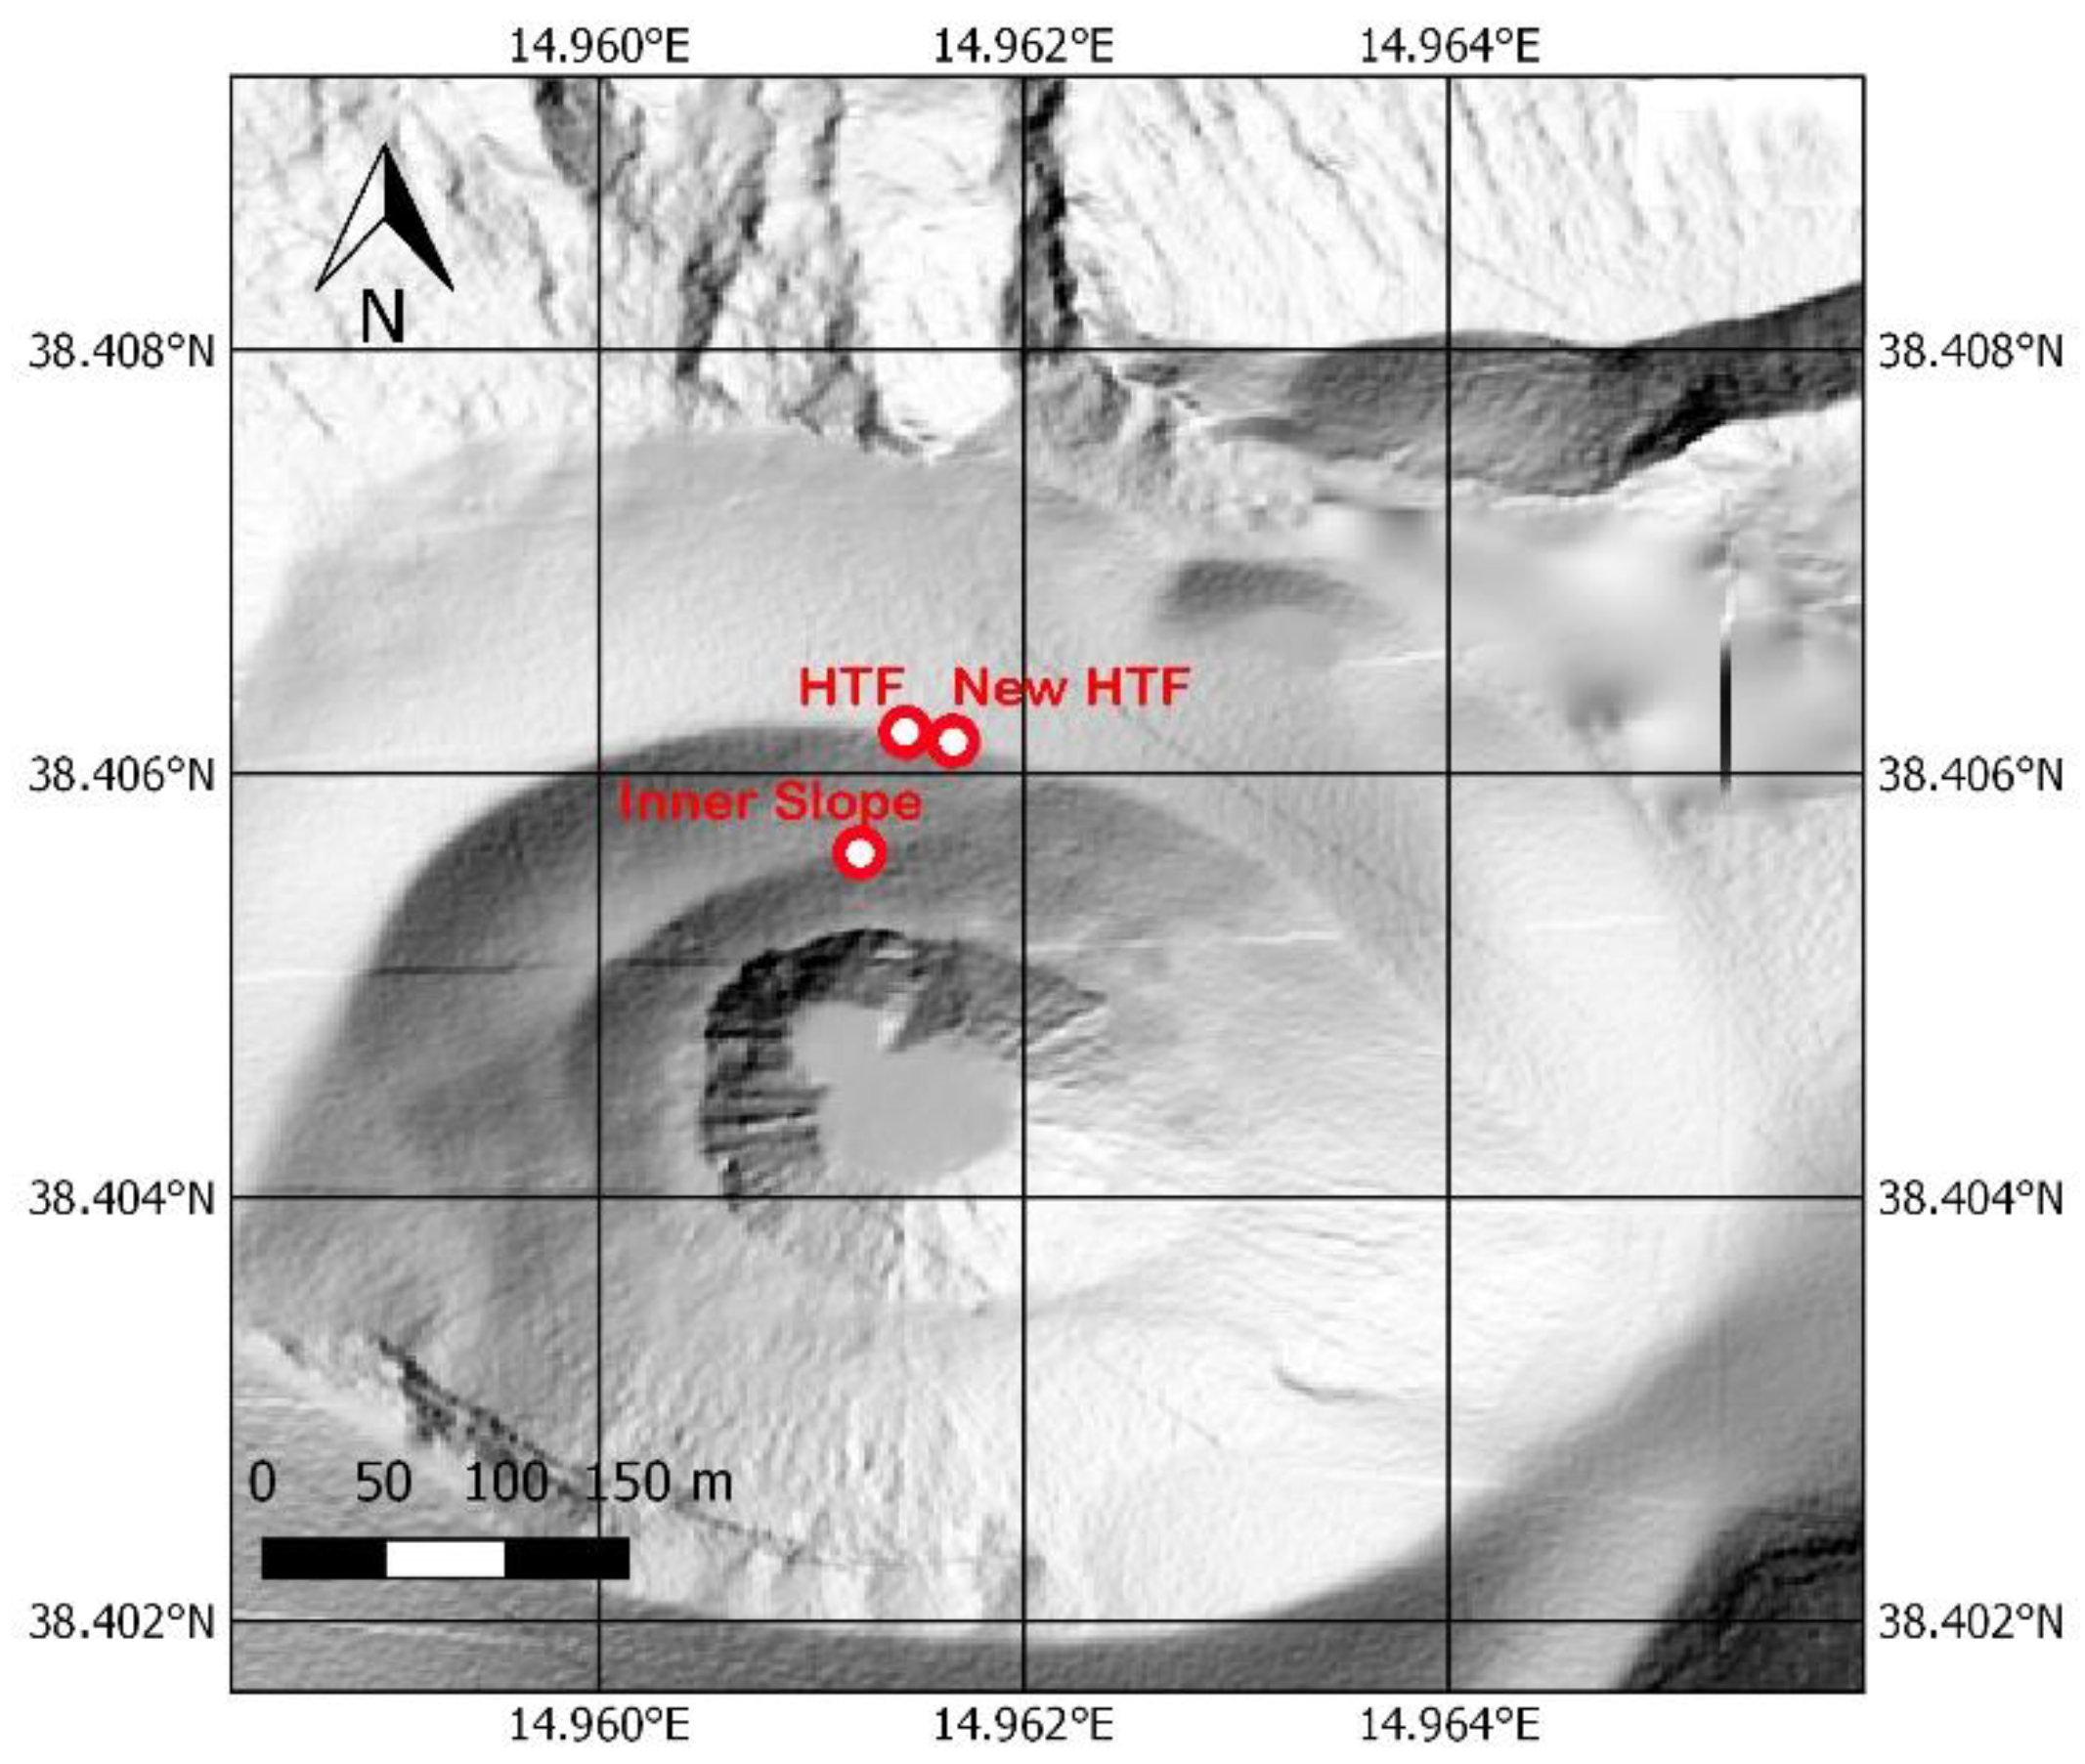
Figure 4.
Location on the top of
La Fossa Cone of the sensors for the thermal monitoring included in the INGV network (on a Lidar-derived DEM-shaded relief image [
47]). The interval of acquisition is one hour.
Figure 4.
Location on the top of
La Fossa Cone of the sensors for the thermal monitoring included in the INGV network (on a Lidar-derived DEM-shaded relief image [
47]). The interval of acquisition is one hour.
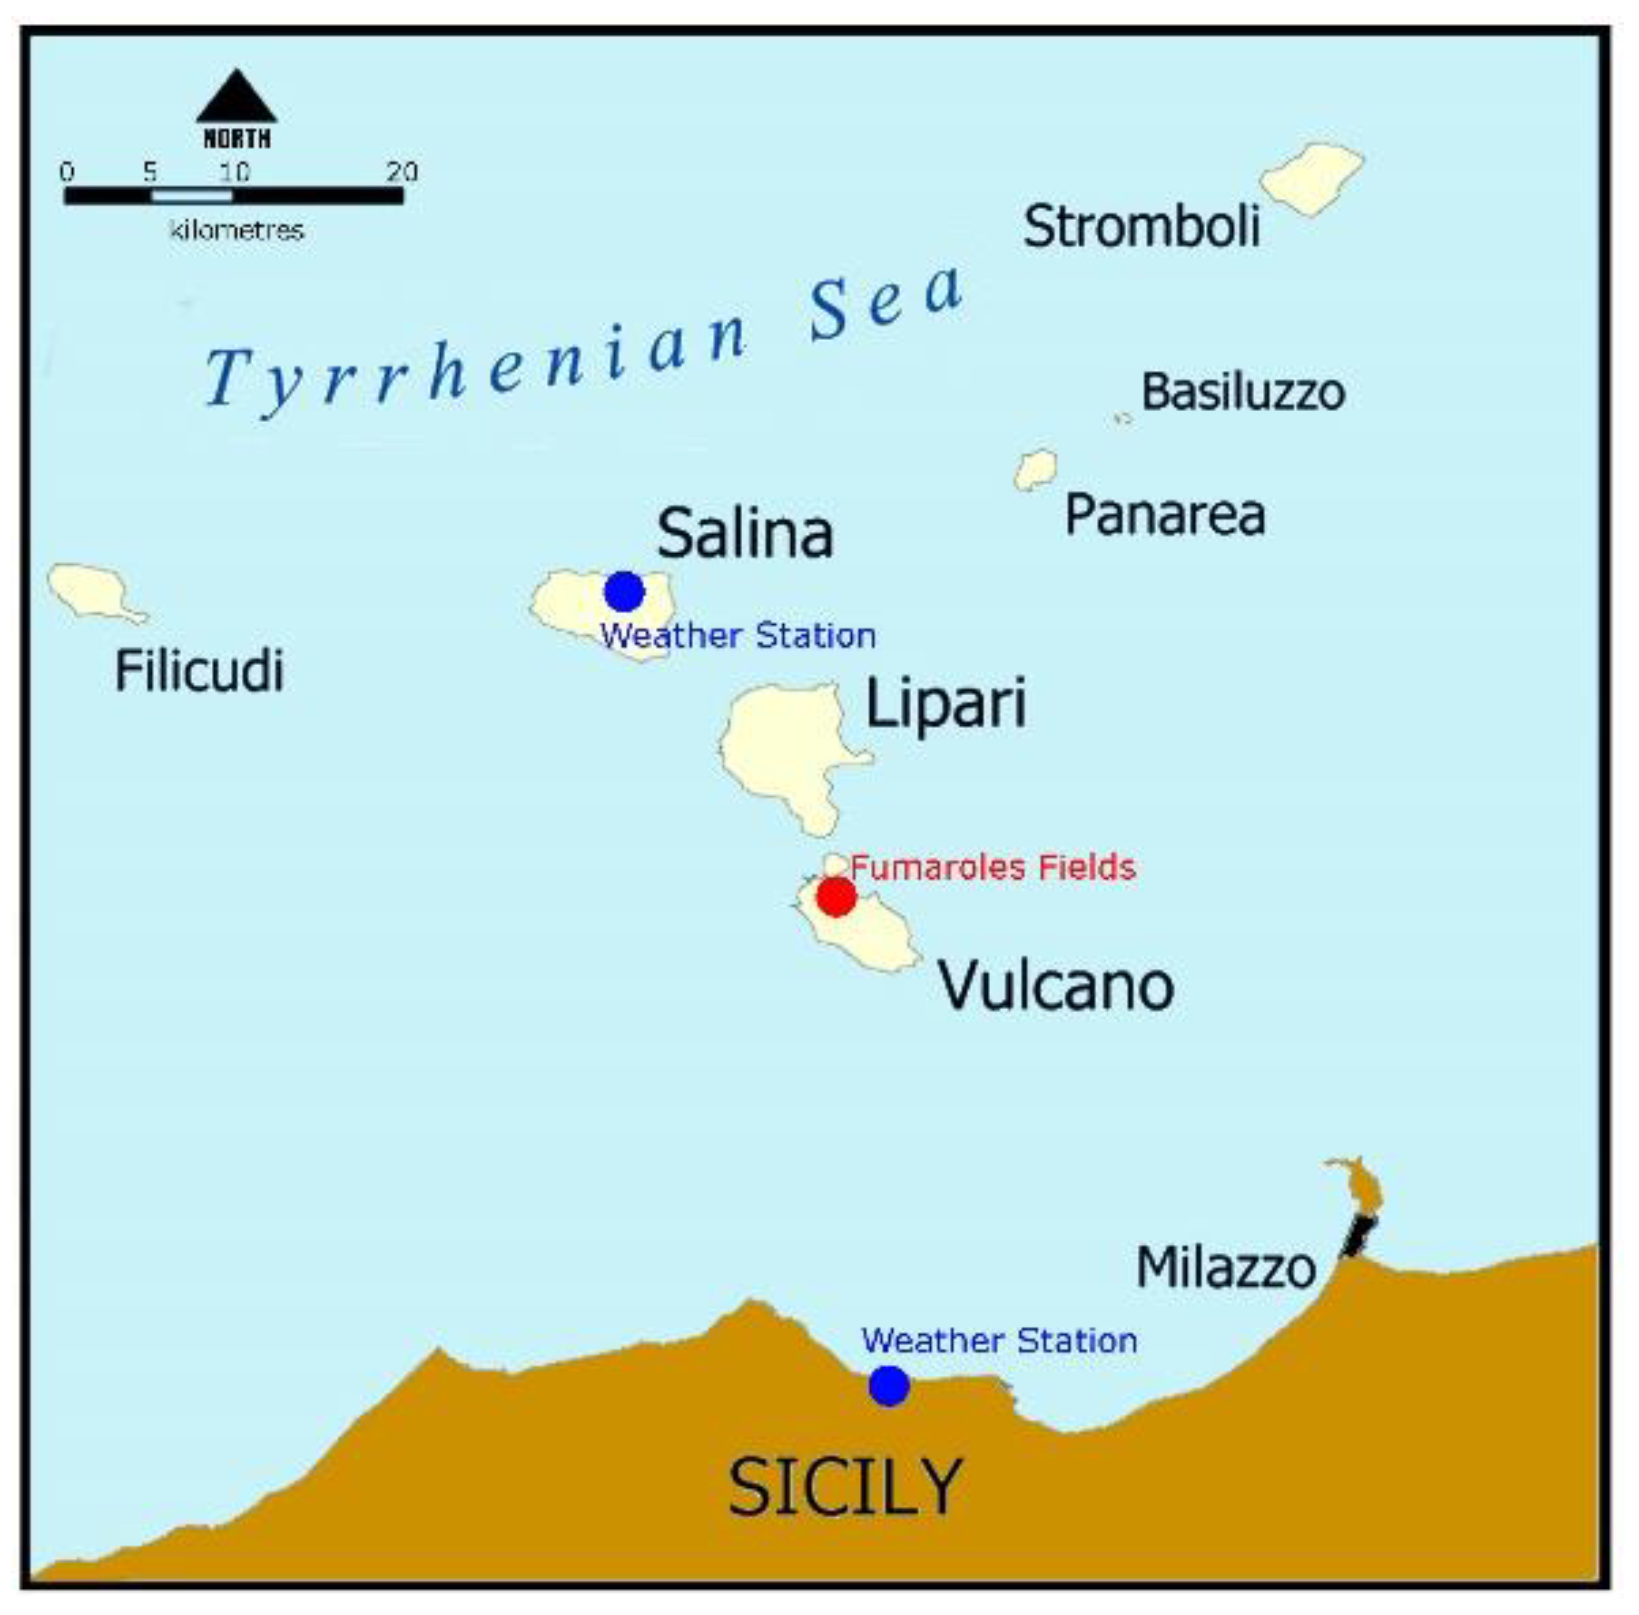
Figure 5.
Weather station and fumaroles fields.
Figure 5.
Weather station and fumaroles fields.
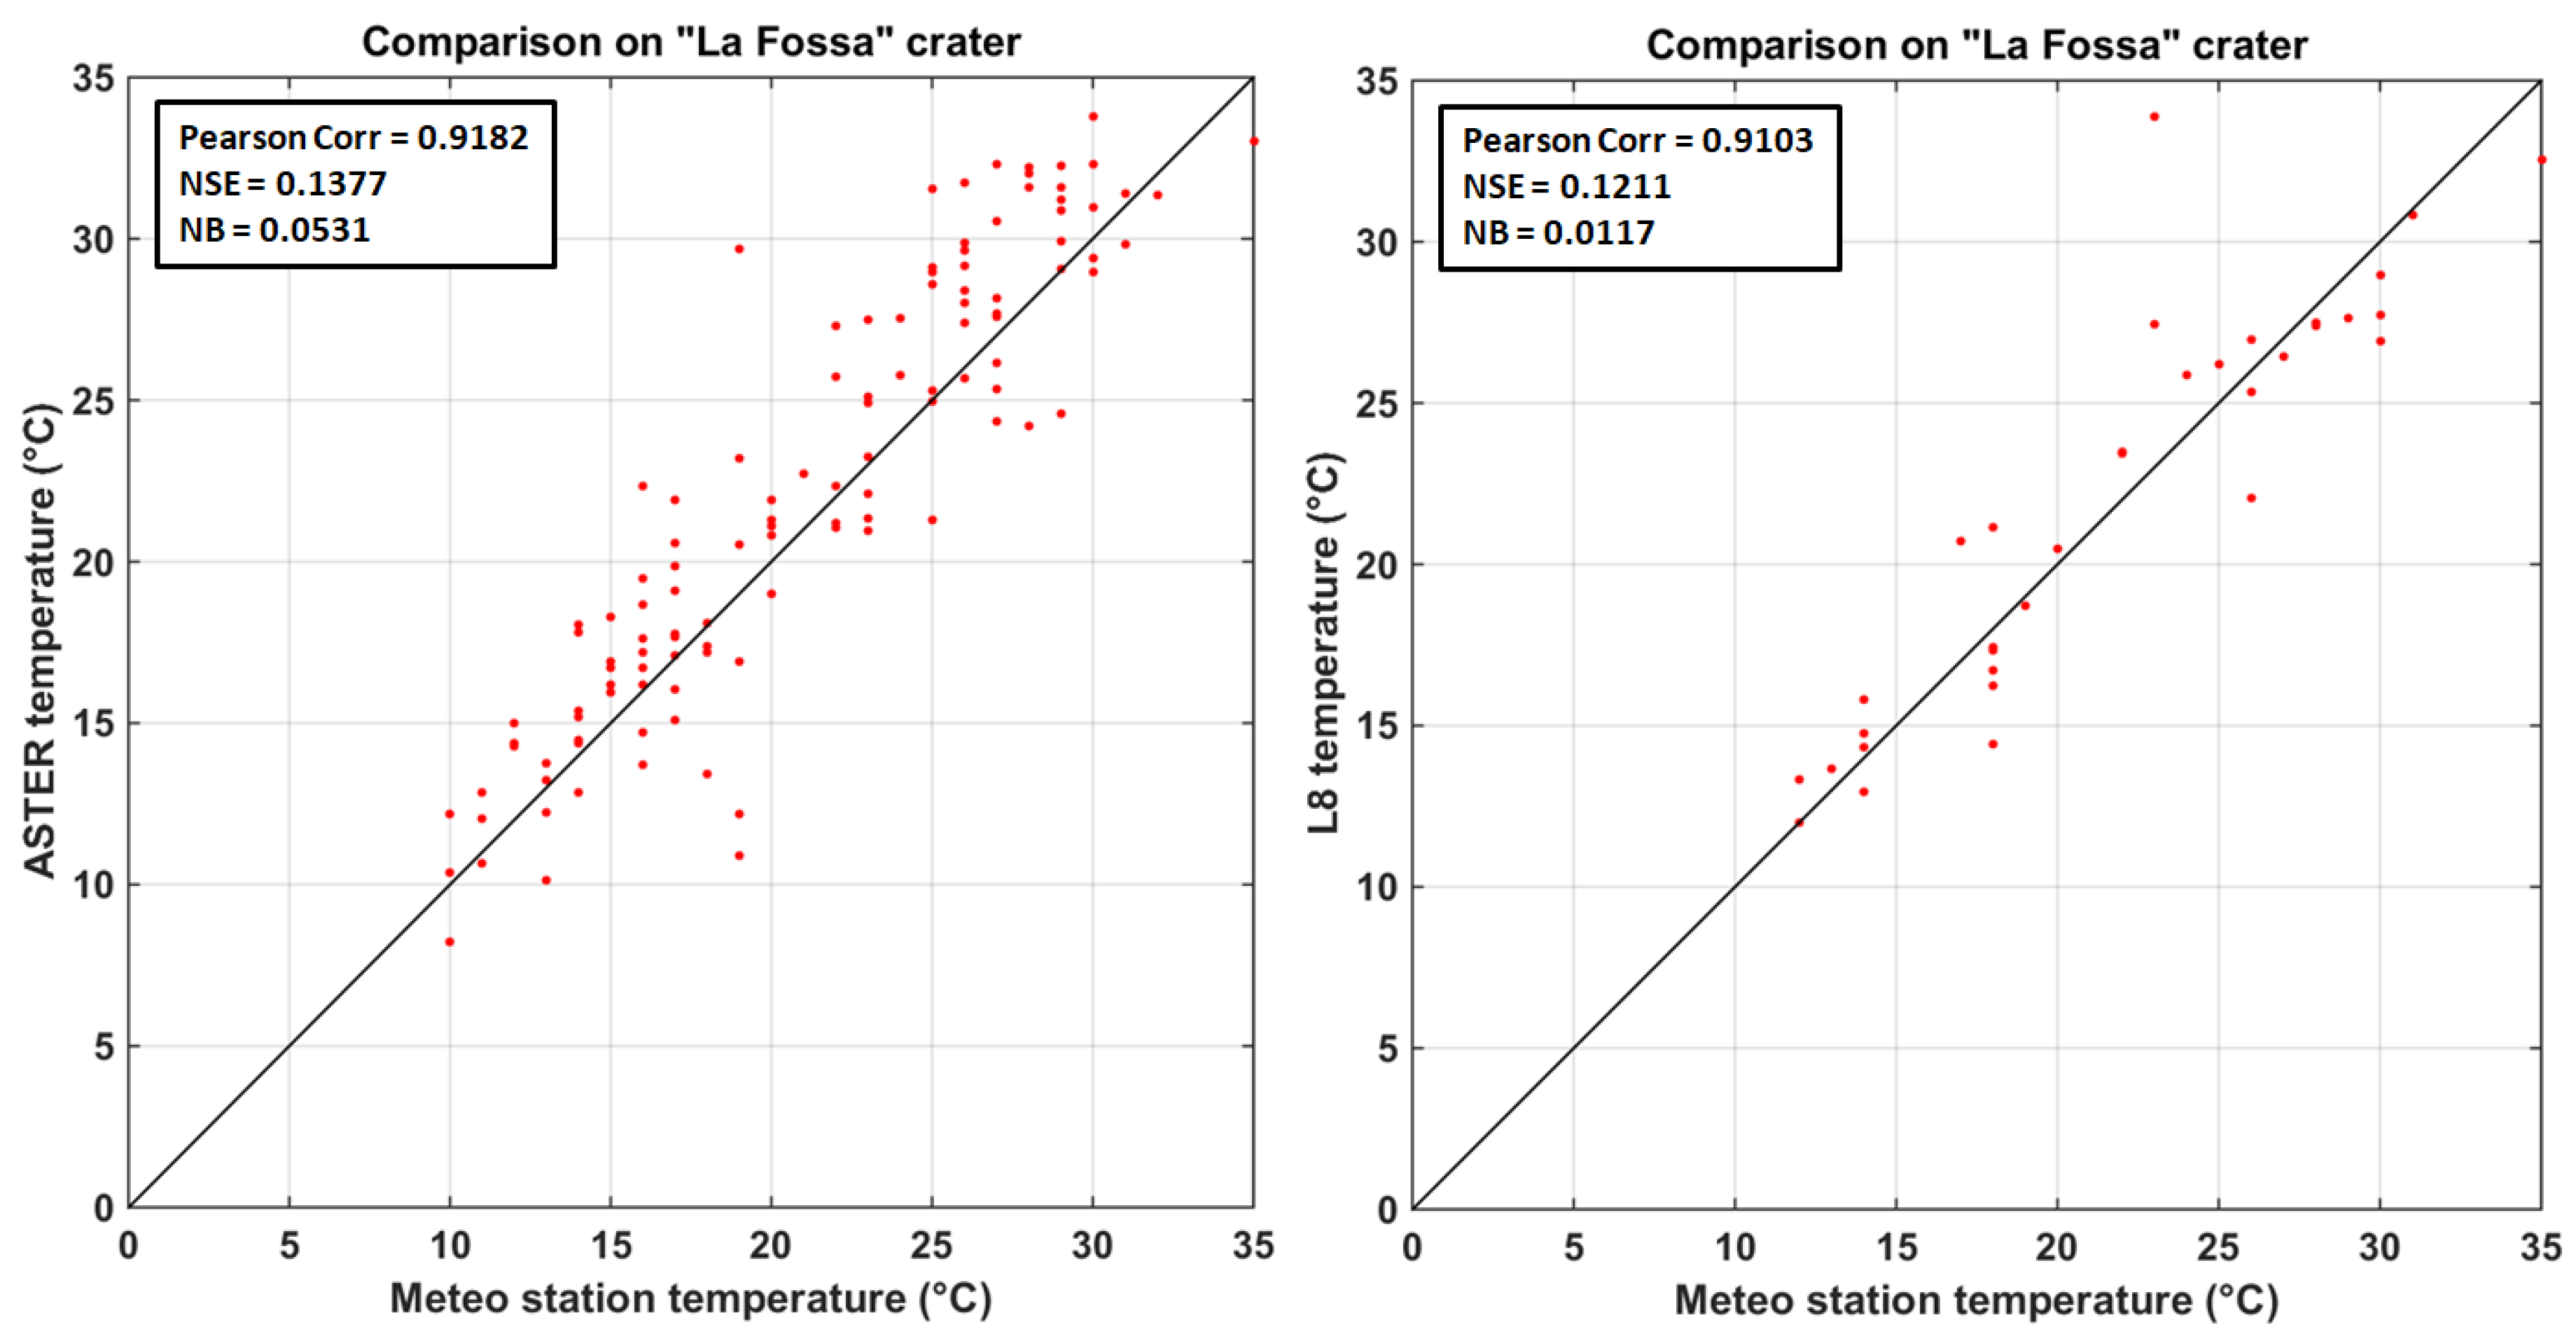
Figure 6.
Scatter plots of surface temperature retrieved by ASTER (left) and L8 (right) data and temperature measured by the meteo station on La Fossa crater.
Figure 6.
Scatter plots of surface temperature retrieved by ASTER (left) and L8 (right) data and temperature measured by the meteo station on La Fossa crater.
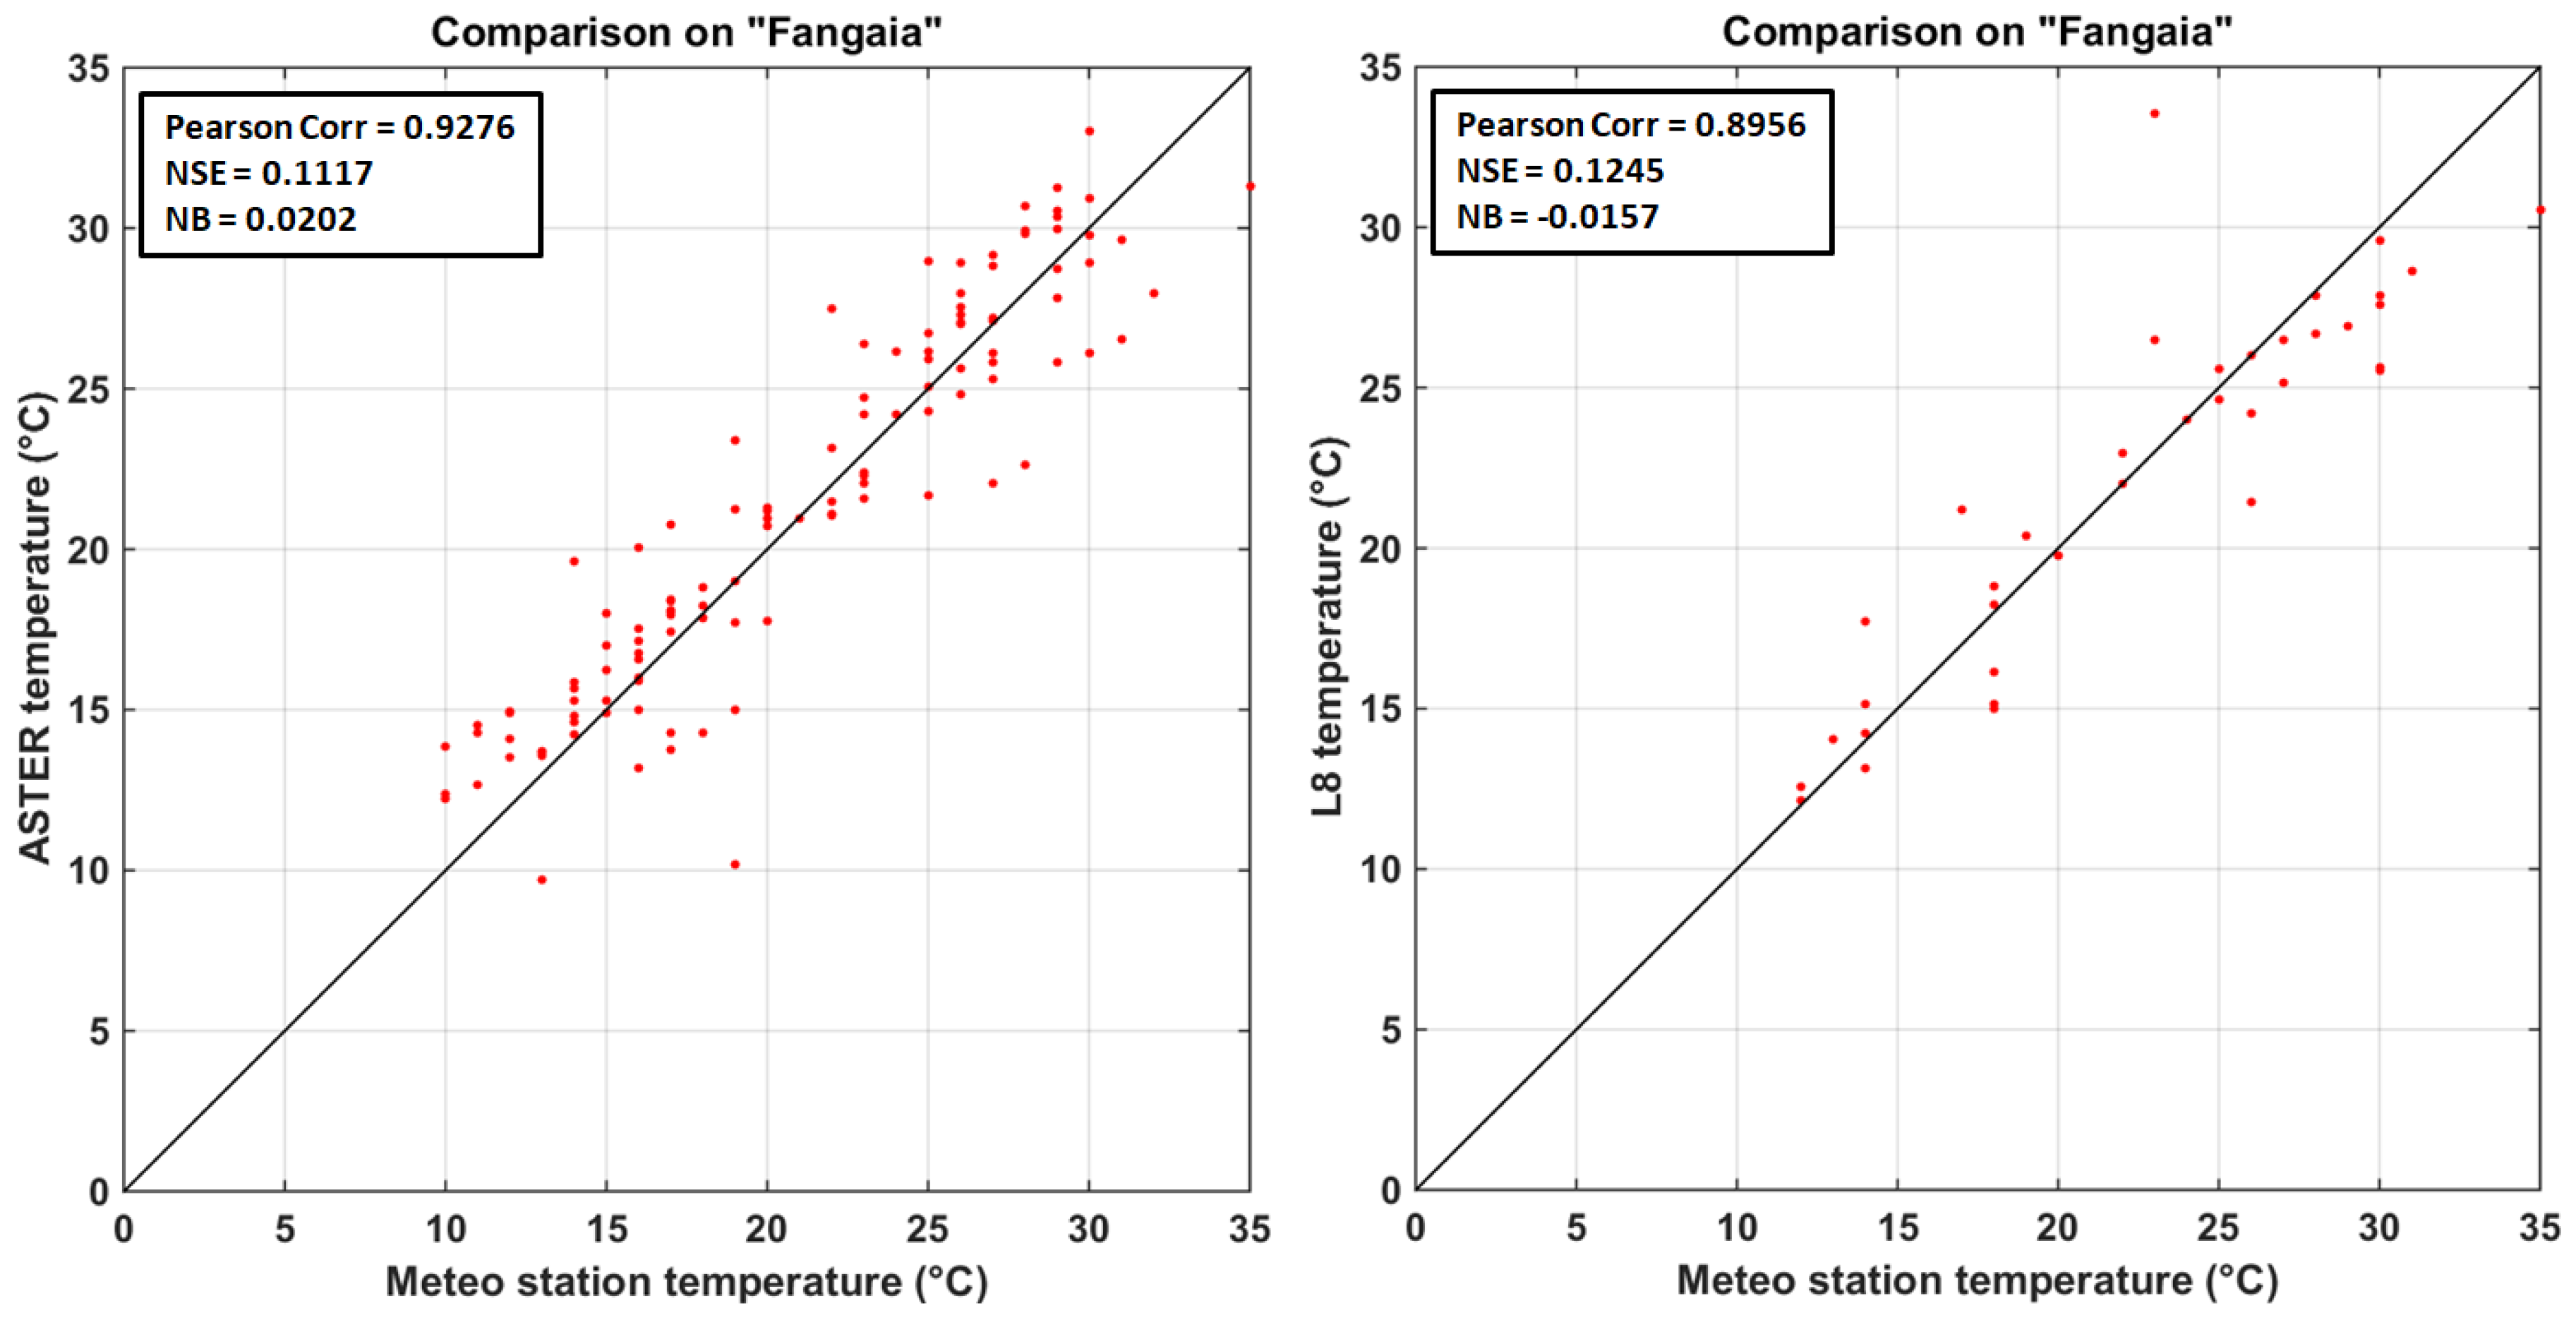
Figure 7.
Scatter plots of surface temperature retrieved by ASTER (left) and L8 (right) data and temperature measured by the meteo station in “Fangaia” mud pool.
Figure 7.
Scatter plots of surface temperature retrieved by ASTER (left) and L8 (right) data and temperature measured by the meteo station in “Fangaia” mud pool.
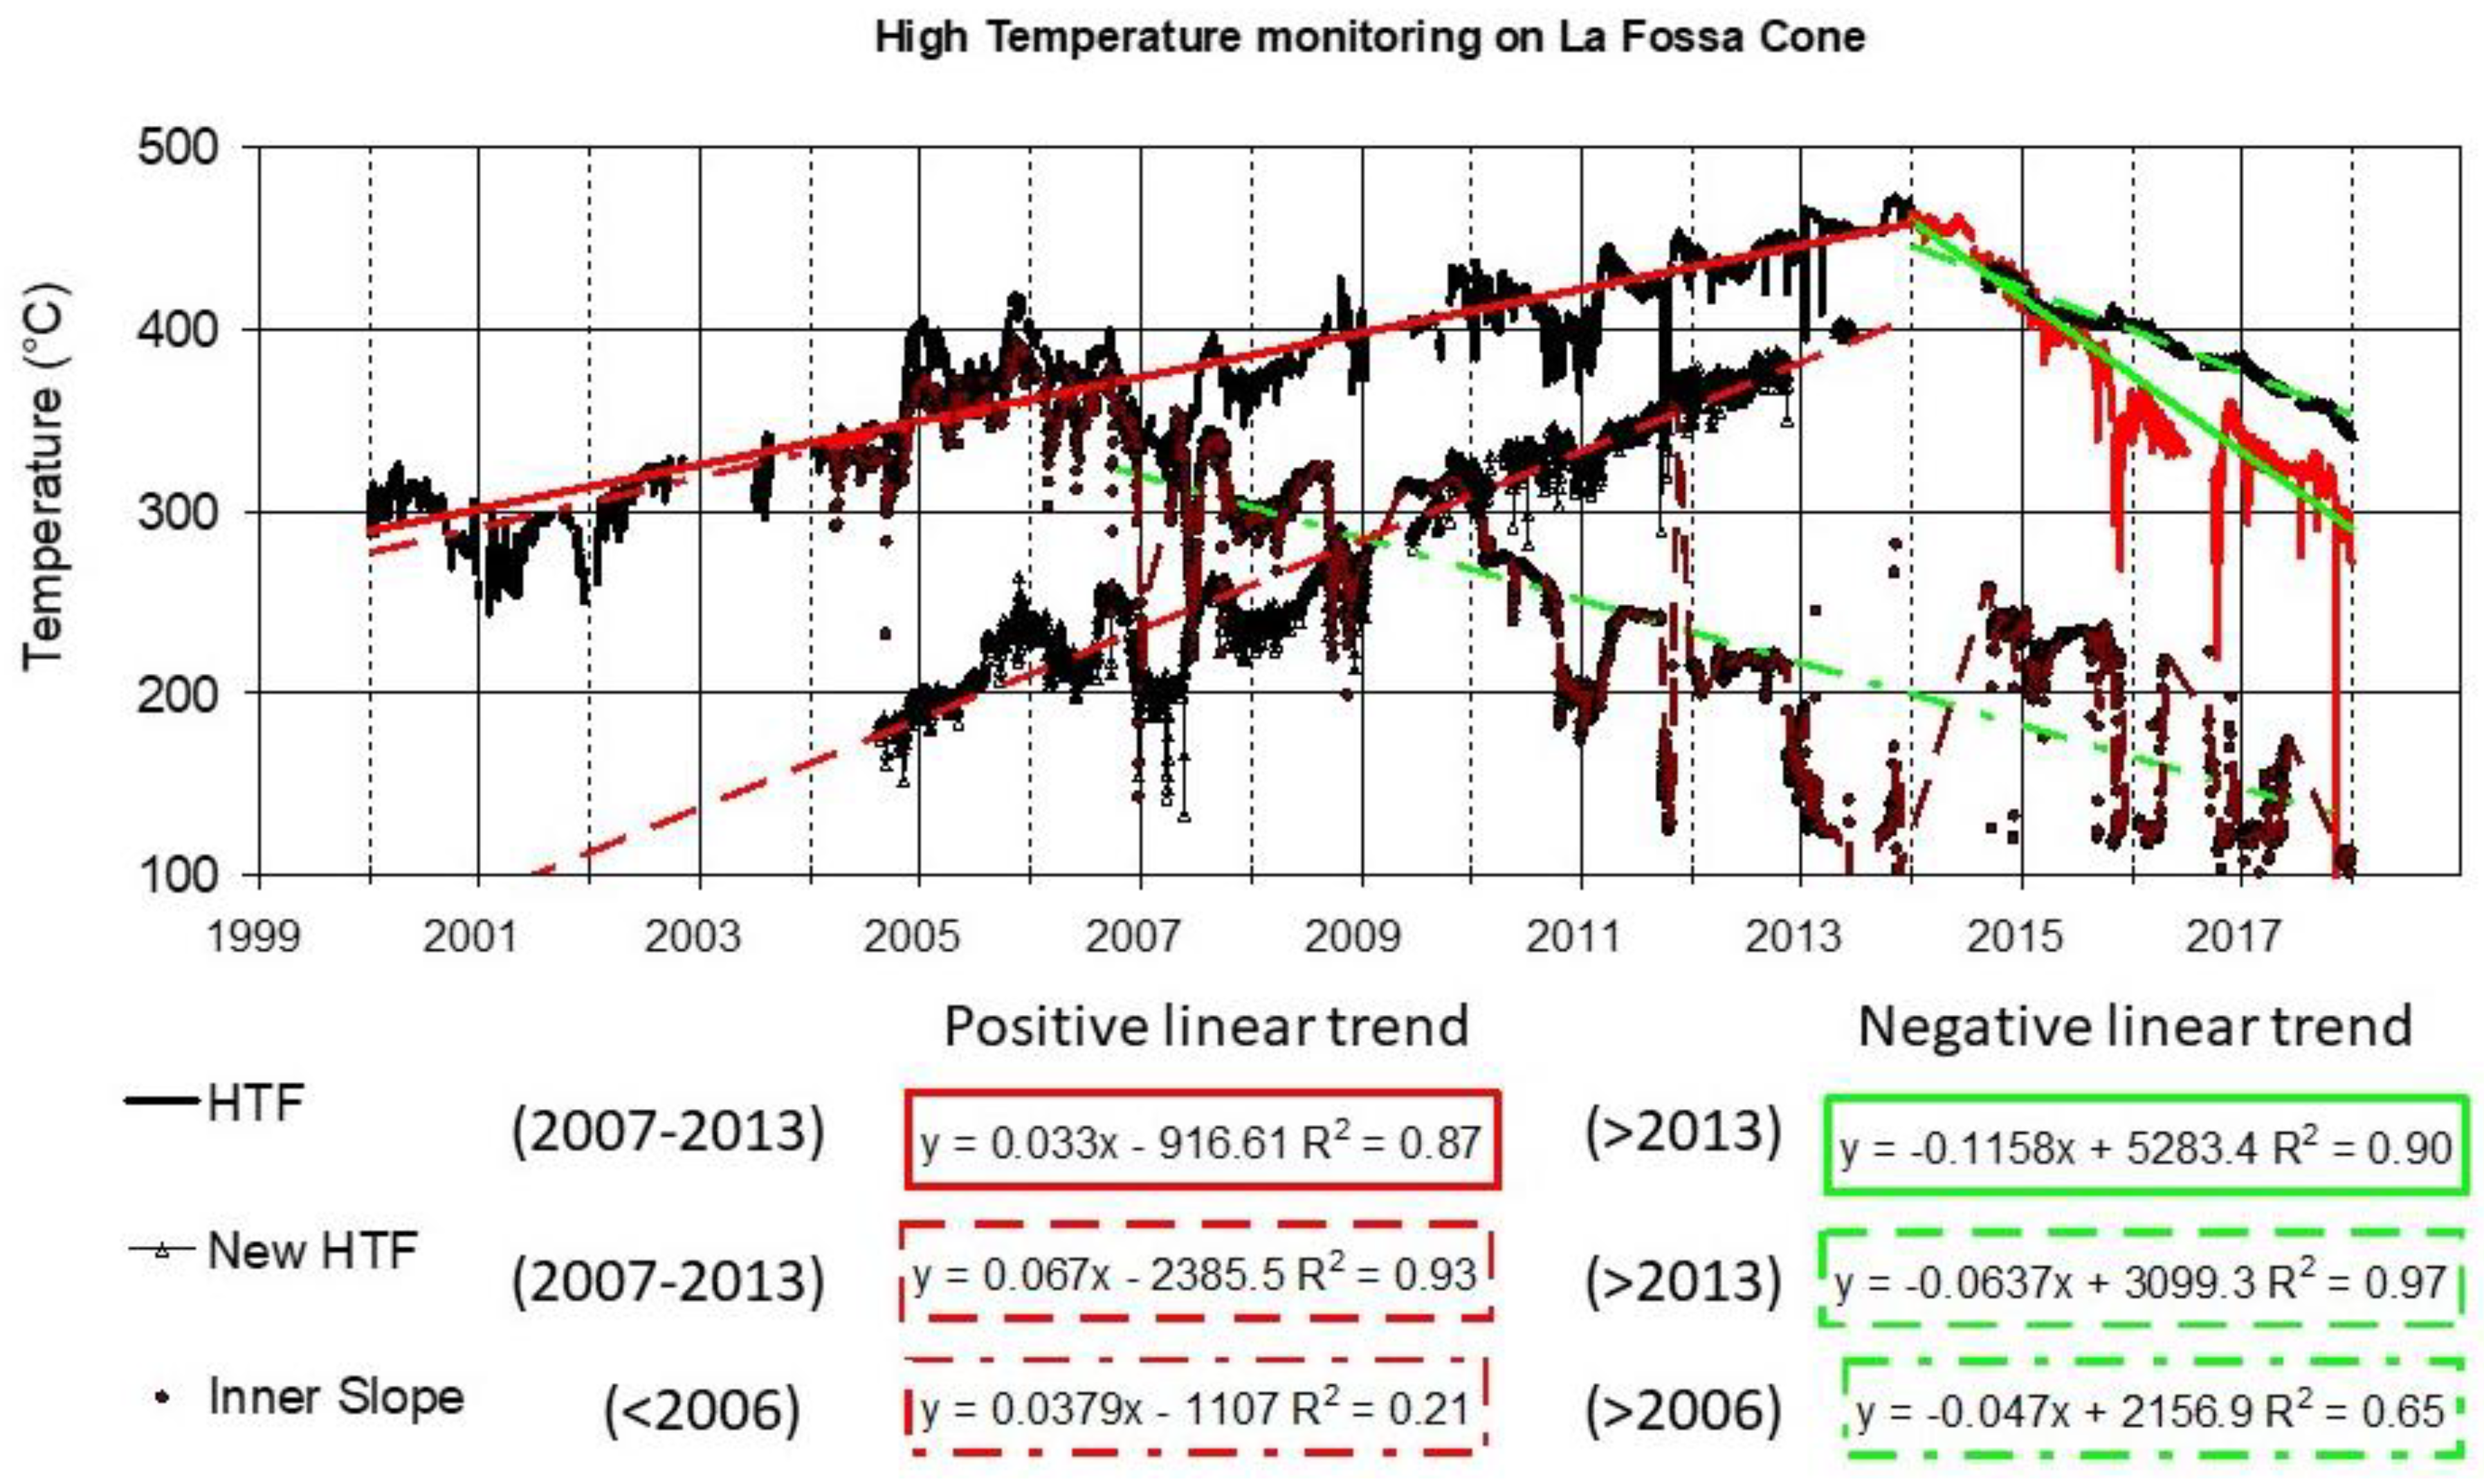
Figure 8.
Time series of temperature selected from the continuous monitoring network of INGV.
Figure 8.
Time series of temperature selected from the continuous monitoring network of INGV.
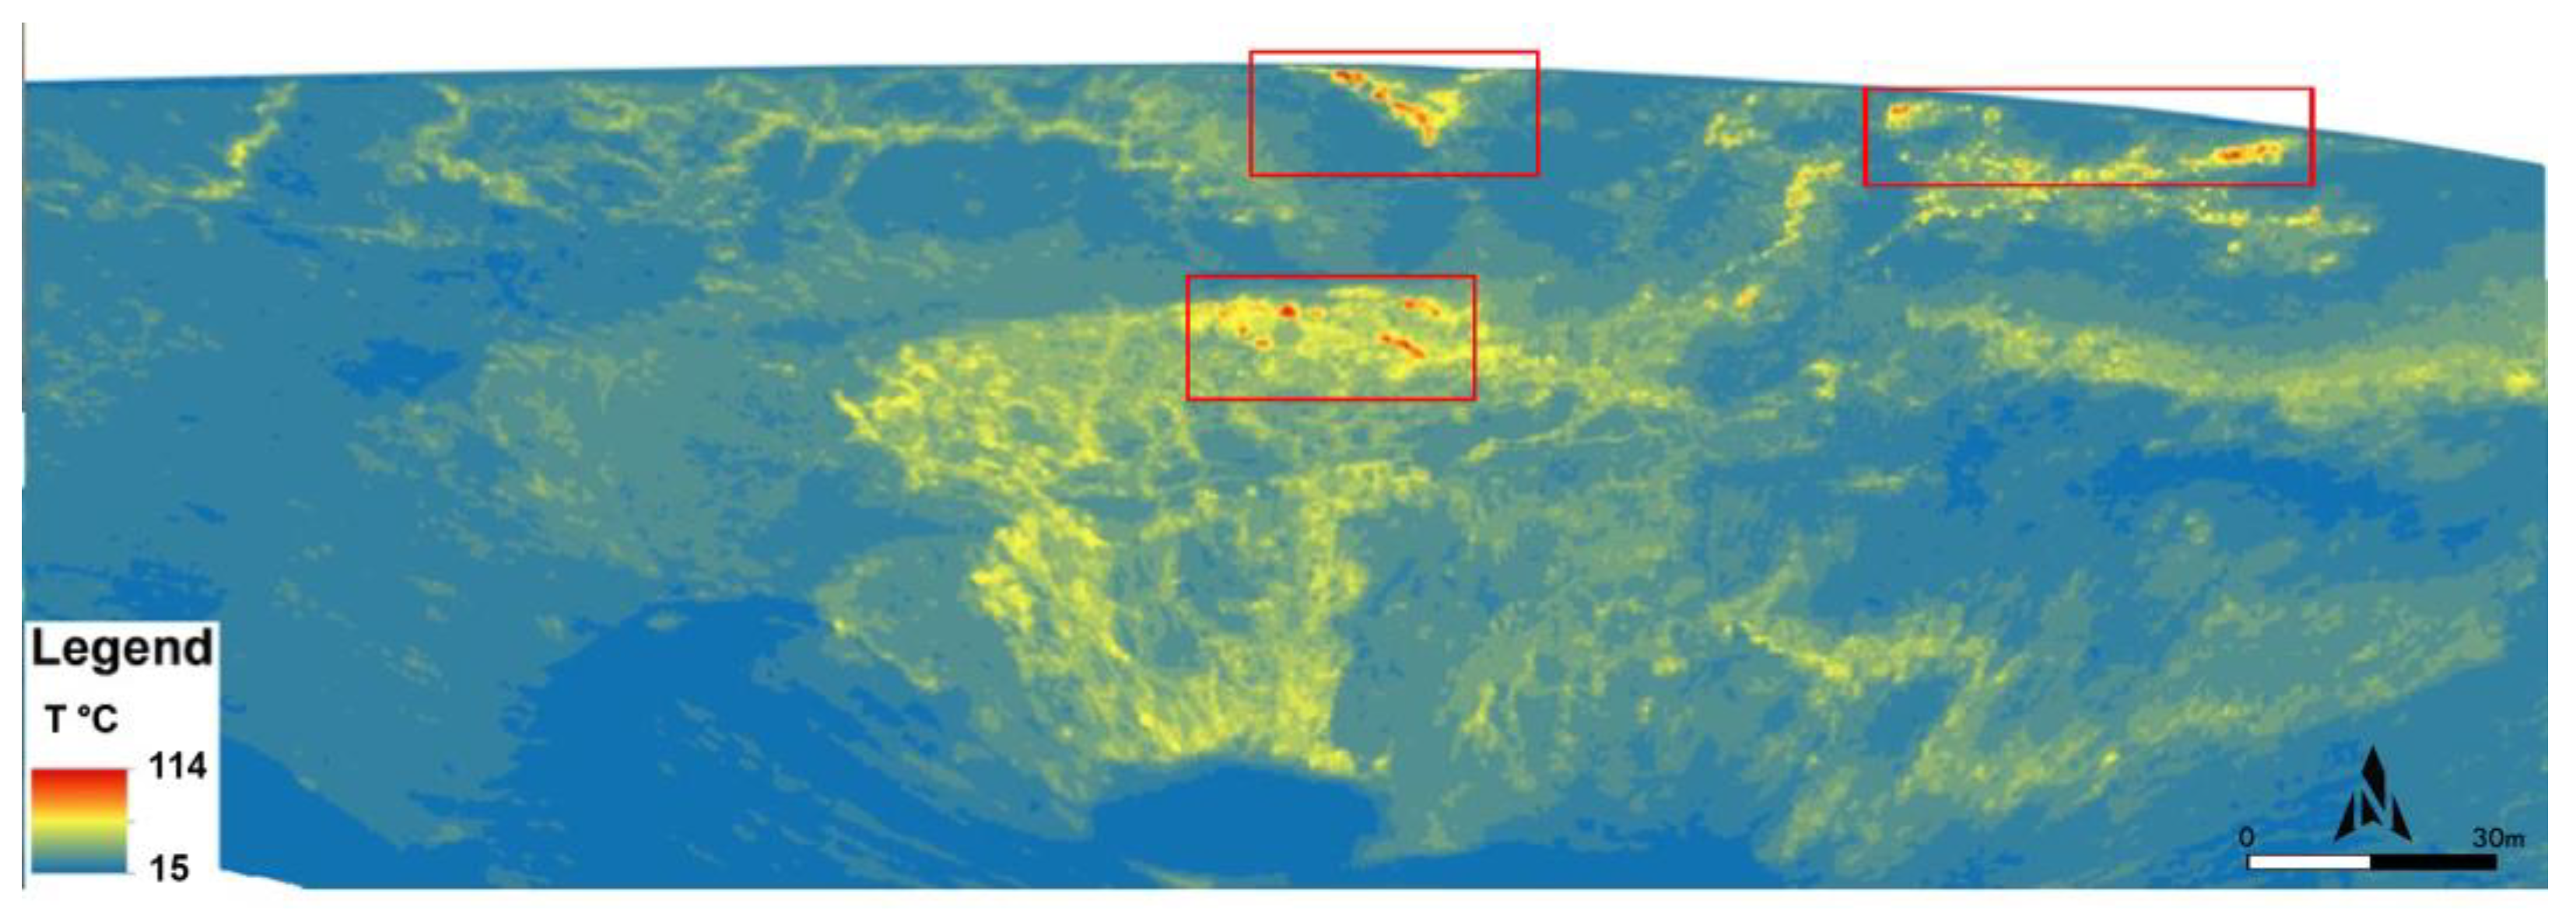
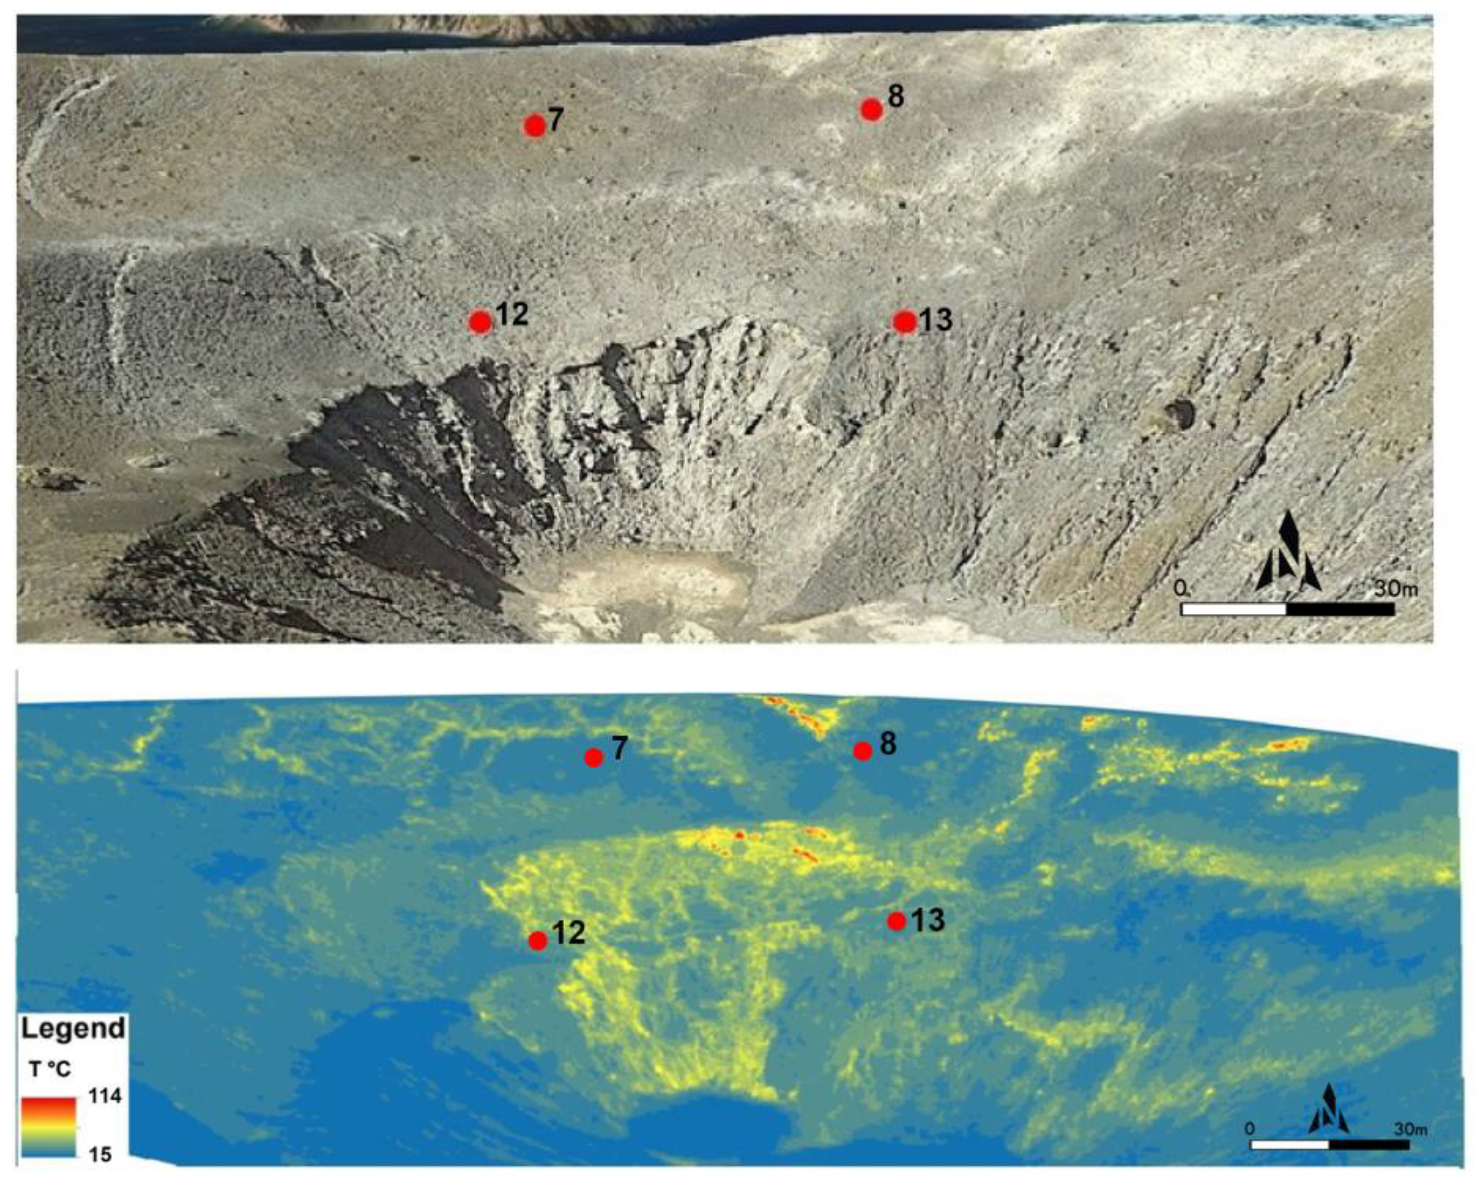
Figure 9.
Thermographic map of the La Fossa crater rim acquired on16/07/2014 with a hand-held IR camera. The red boxes mark the craters showing high thermal anomalies.
Figure 9.
Thermographic map of the La Fossa crater rim acquired on16/07/2014 with a hand-held IR camera. The red boxes mark the craters showing high thermal anomalies.
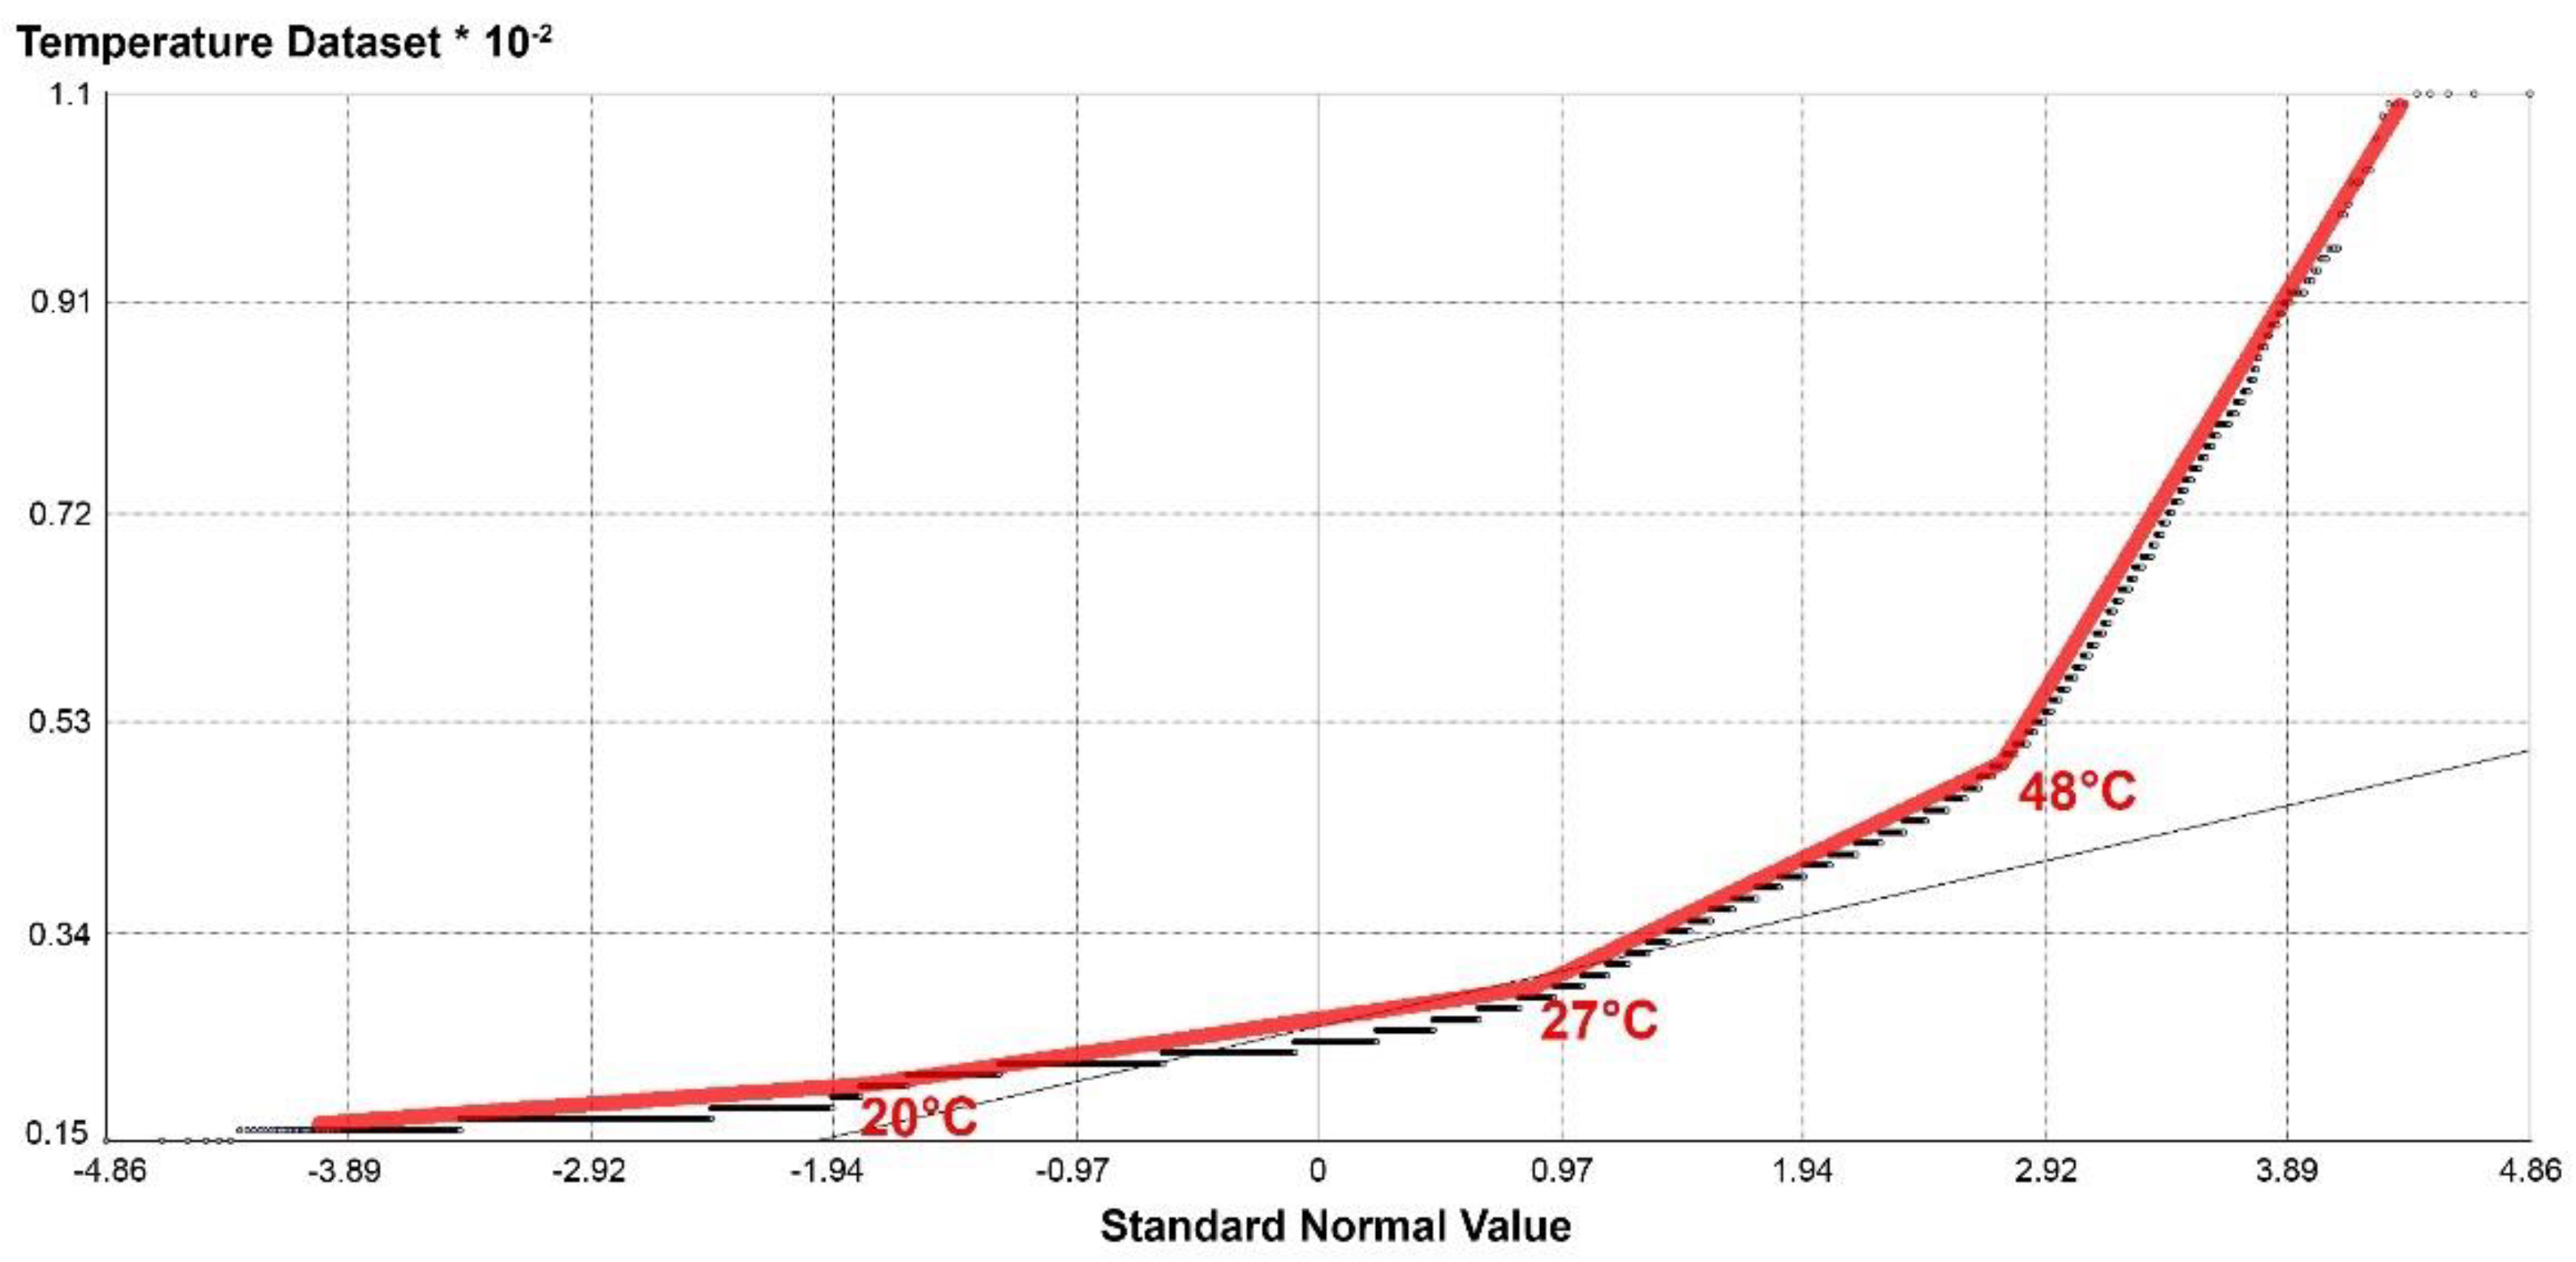
Figure 10.
qq-plot of the infrared temperature measurements (La Fossa crater rim). The red line identifies the thermal quantile groups of dataset and the range temperature; the black line is the reference line to assess the Normal Gaussian distribution assumption).
Figure 10.
qq-plot of the infrared temperature measurements (La Fossa crater rim). The red line identifies the thermal quantile groups of dataset and the range temperature; the black line is the reference line to assess the Normal Gaussian distribution assumption).
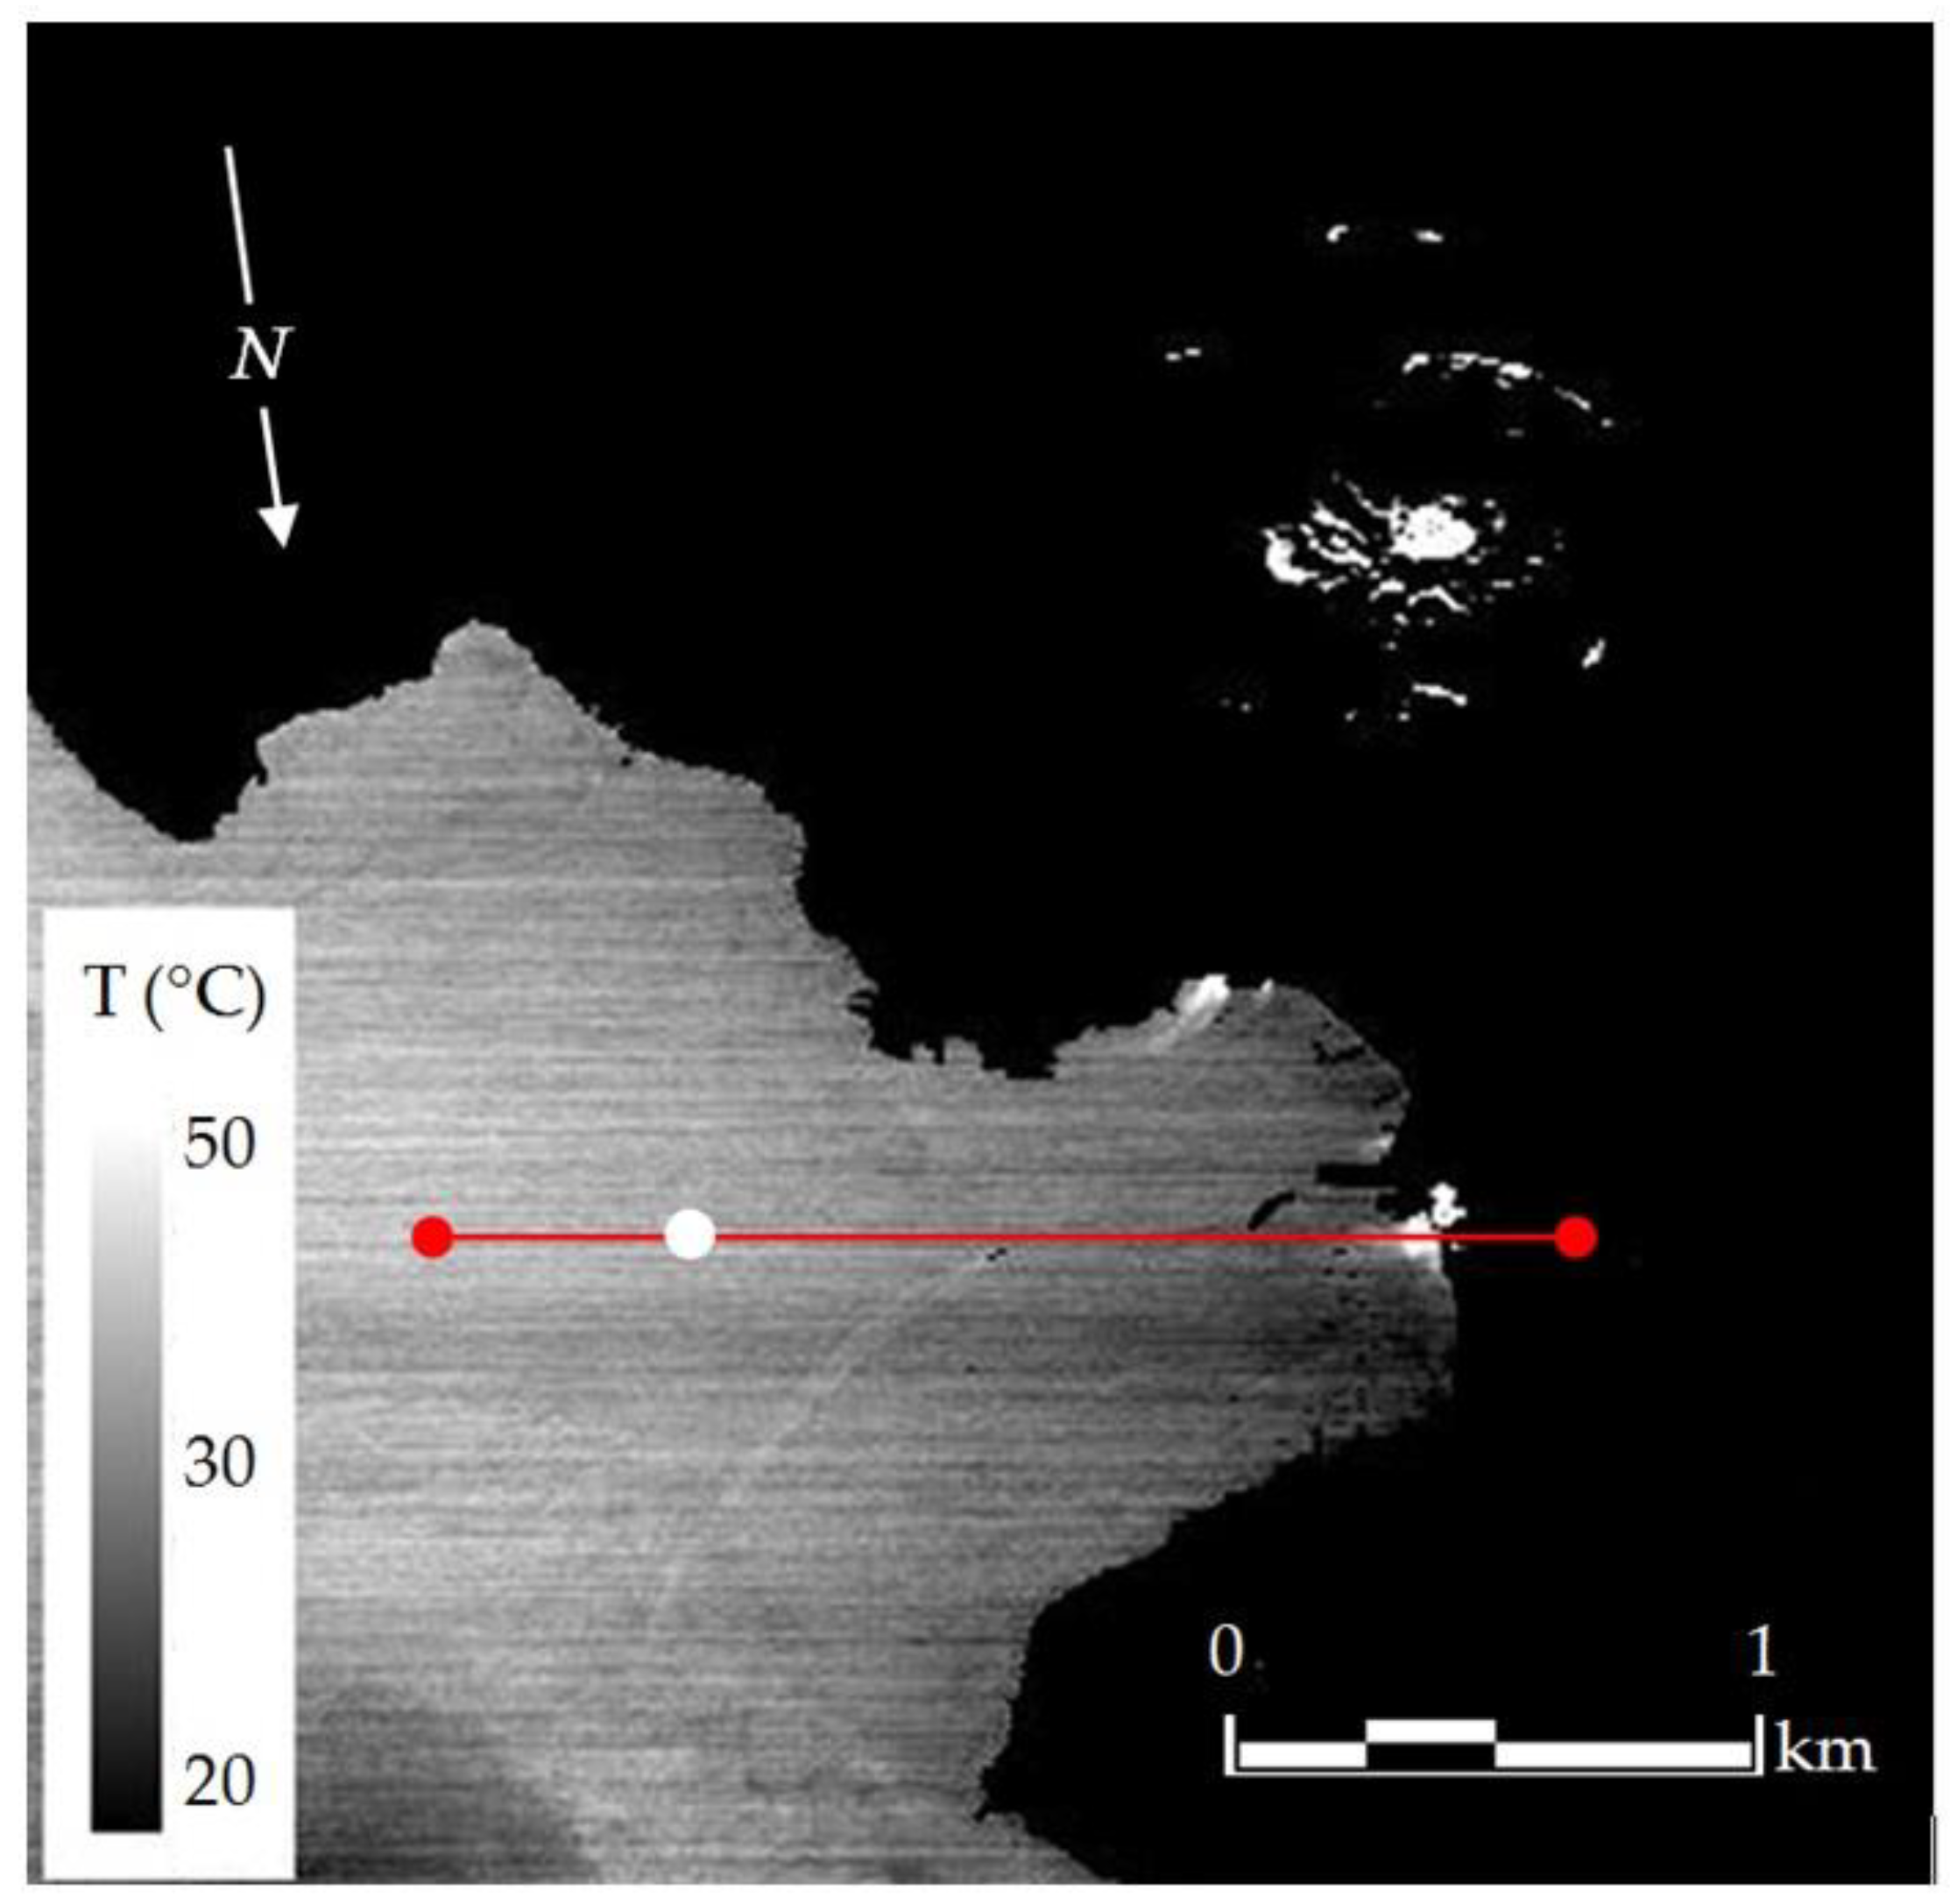
Figure 11.
Surface temperature retrieved by ATM from the 12 September 2010 predawn flight. Higher temperatures relate to fumaroles distributed within the
La Fossa crater and along the coast of the Volcano bay. The red line corresponds to the temperature profile of
Figure 12 and the white dot to the measurement location of
Figure 13.
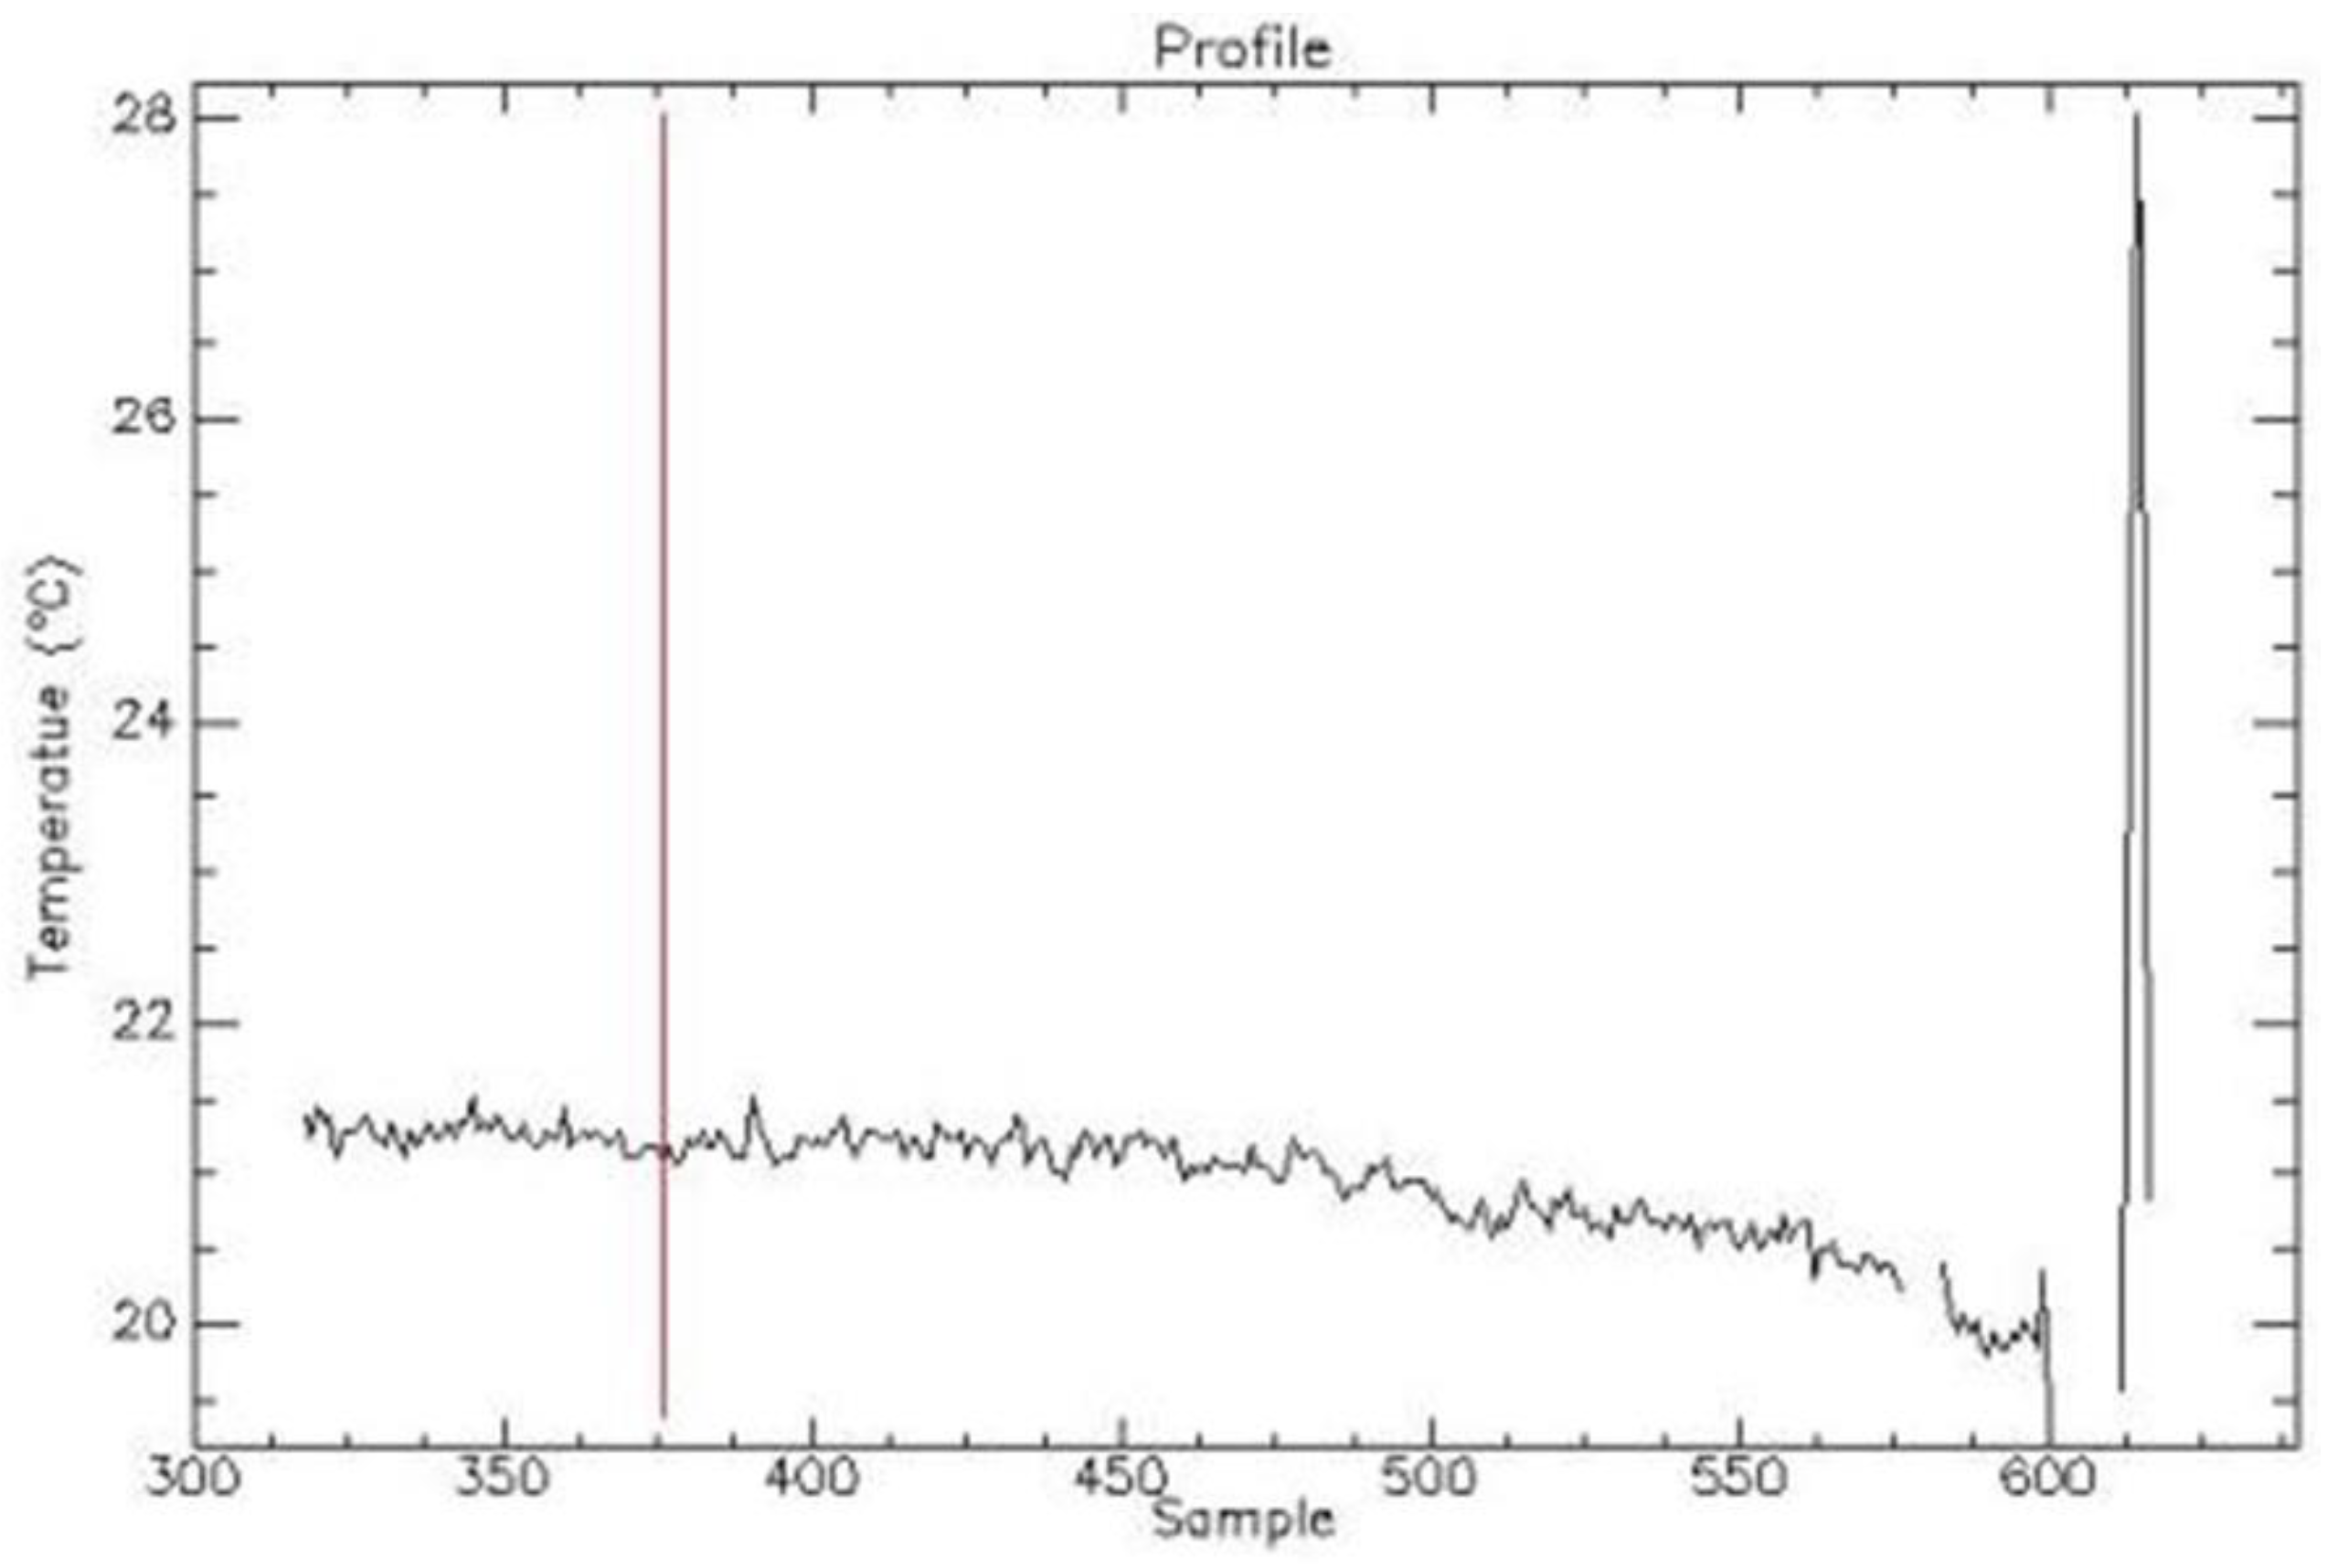
Figure 12.
Sea water temperature profile along the red line shown in
Figure 11. The red line intersects the temperature value estimated at that location of
Figure 13.
Figure 12.
Sea water temperature profile along the red line shown in
Figure 11. The red line intersects the temperature value estimated at that location of
Figure 13.
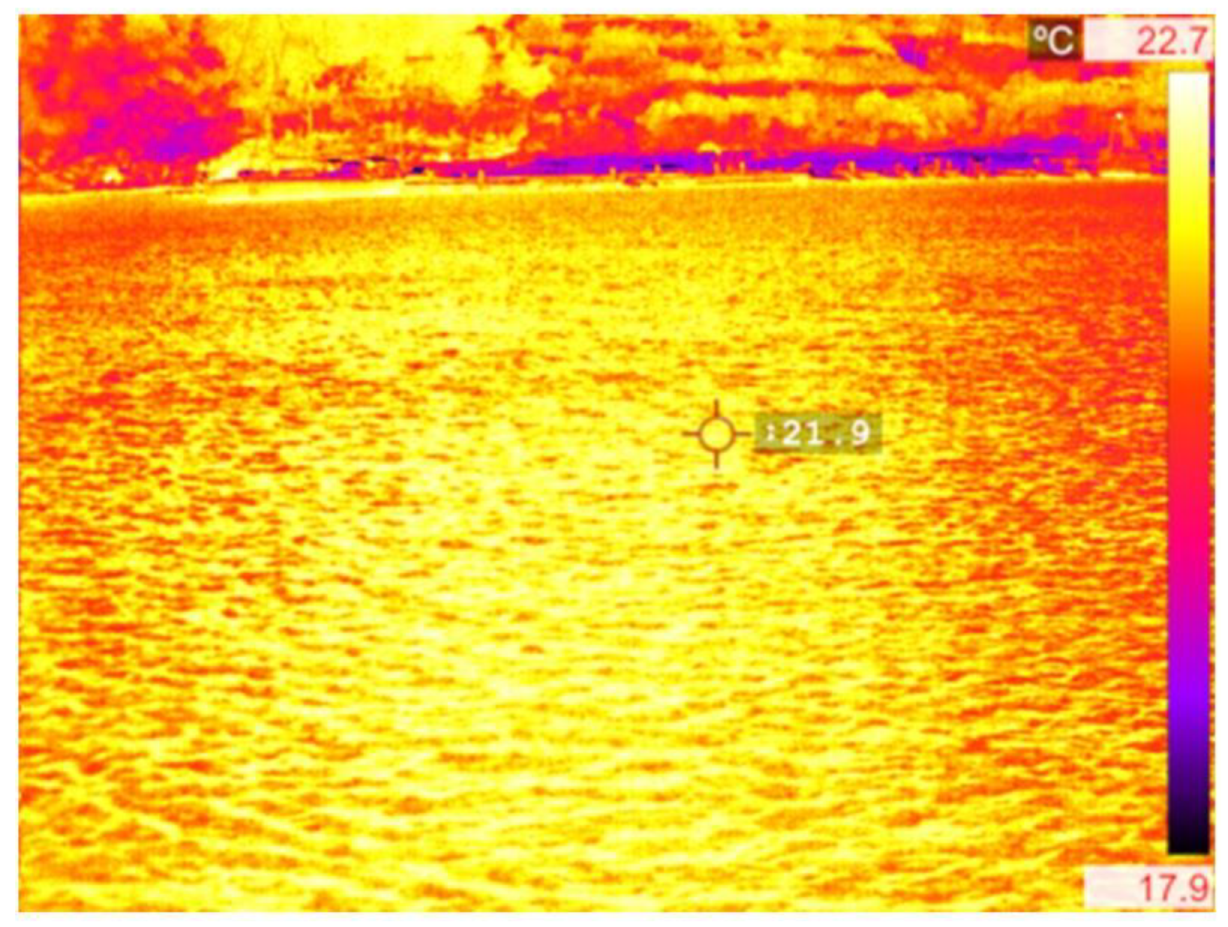
Figure 13.
Sea water measured from the thermo camera.
Figure 13.
Sea water measured from the thermo camera.
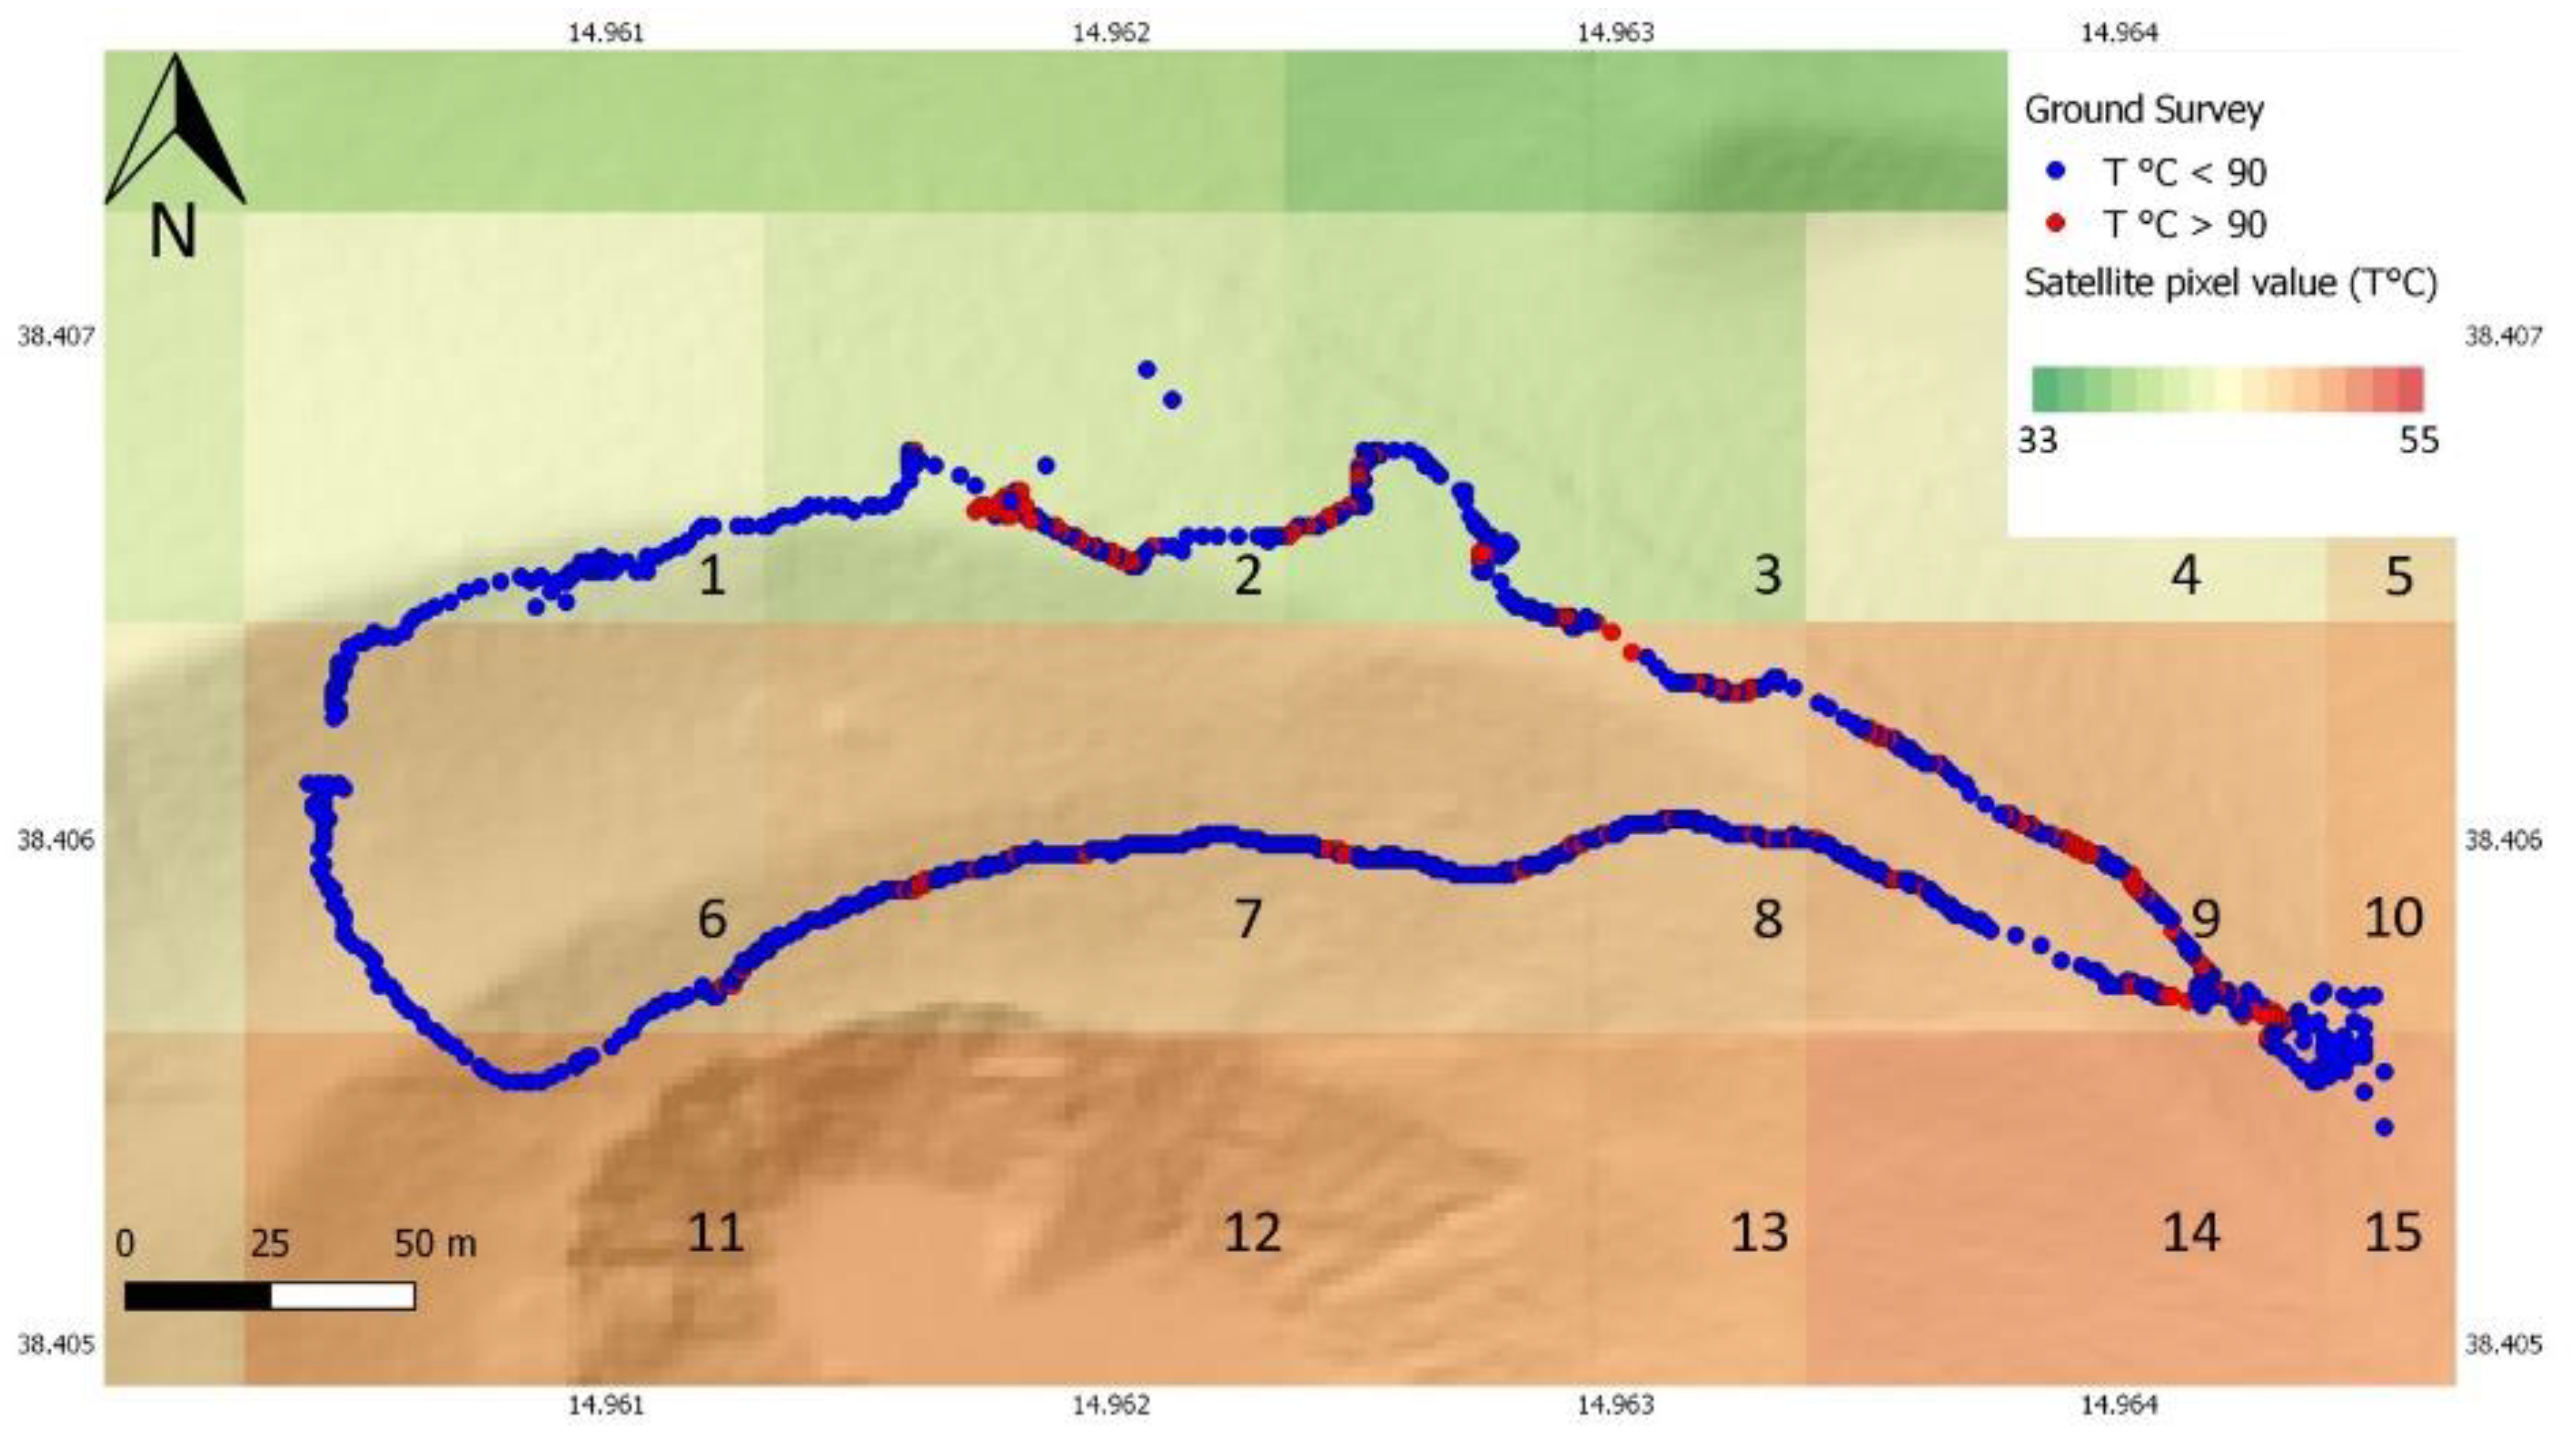
Figure 14.
Ground survey point distribution inside the satellite images pixel boundary. Data of survey 12/06/2012 and ASTER acquisition on 16/06/2012.
Figure 14.
Ground survey point distribution inside the satellite images pixel boundary. Data of survey 12/06/2012 and ASTER acquisition on 16/06/2012.
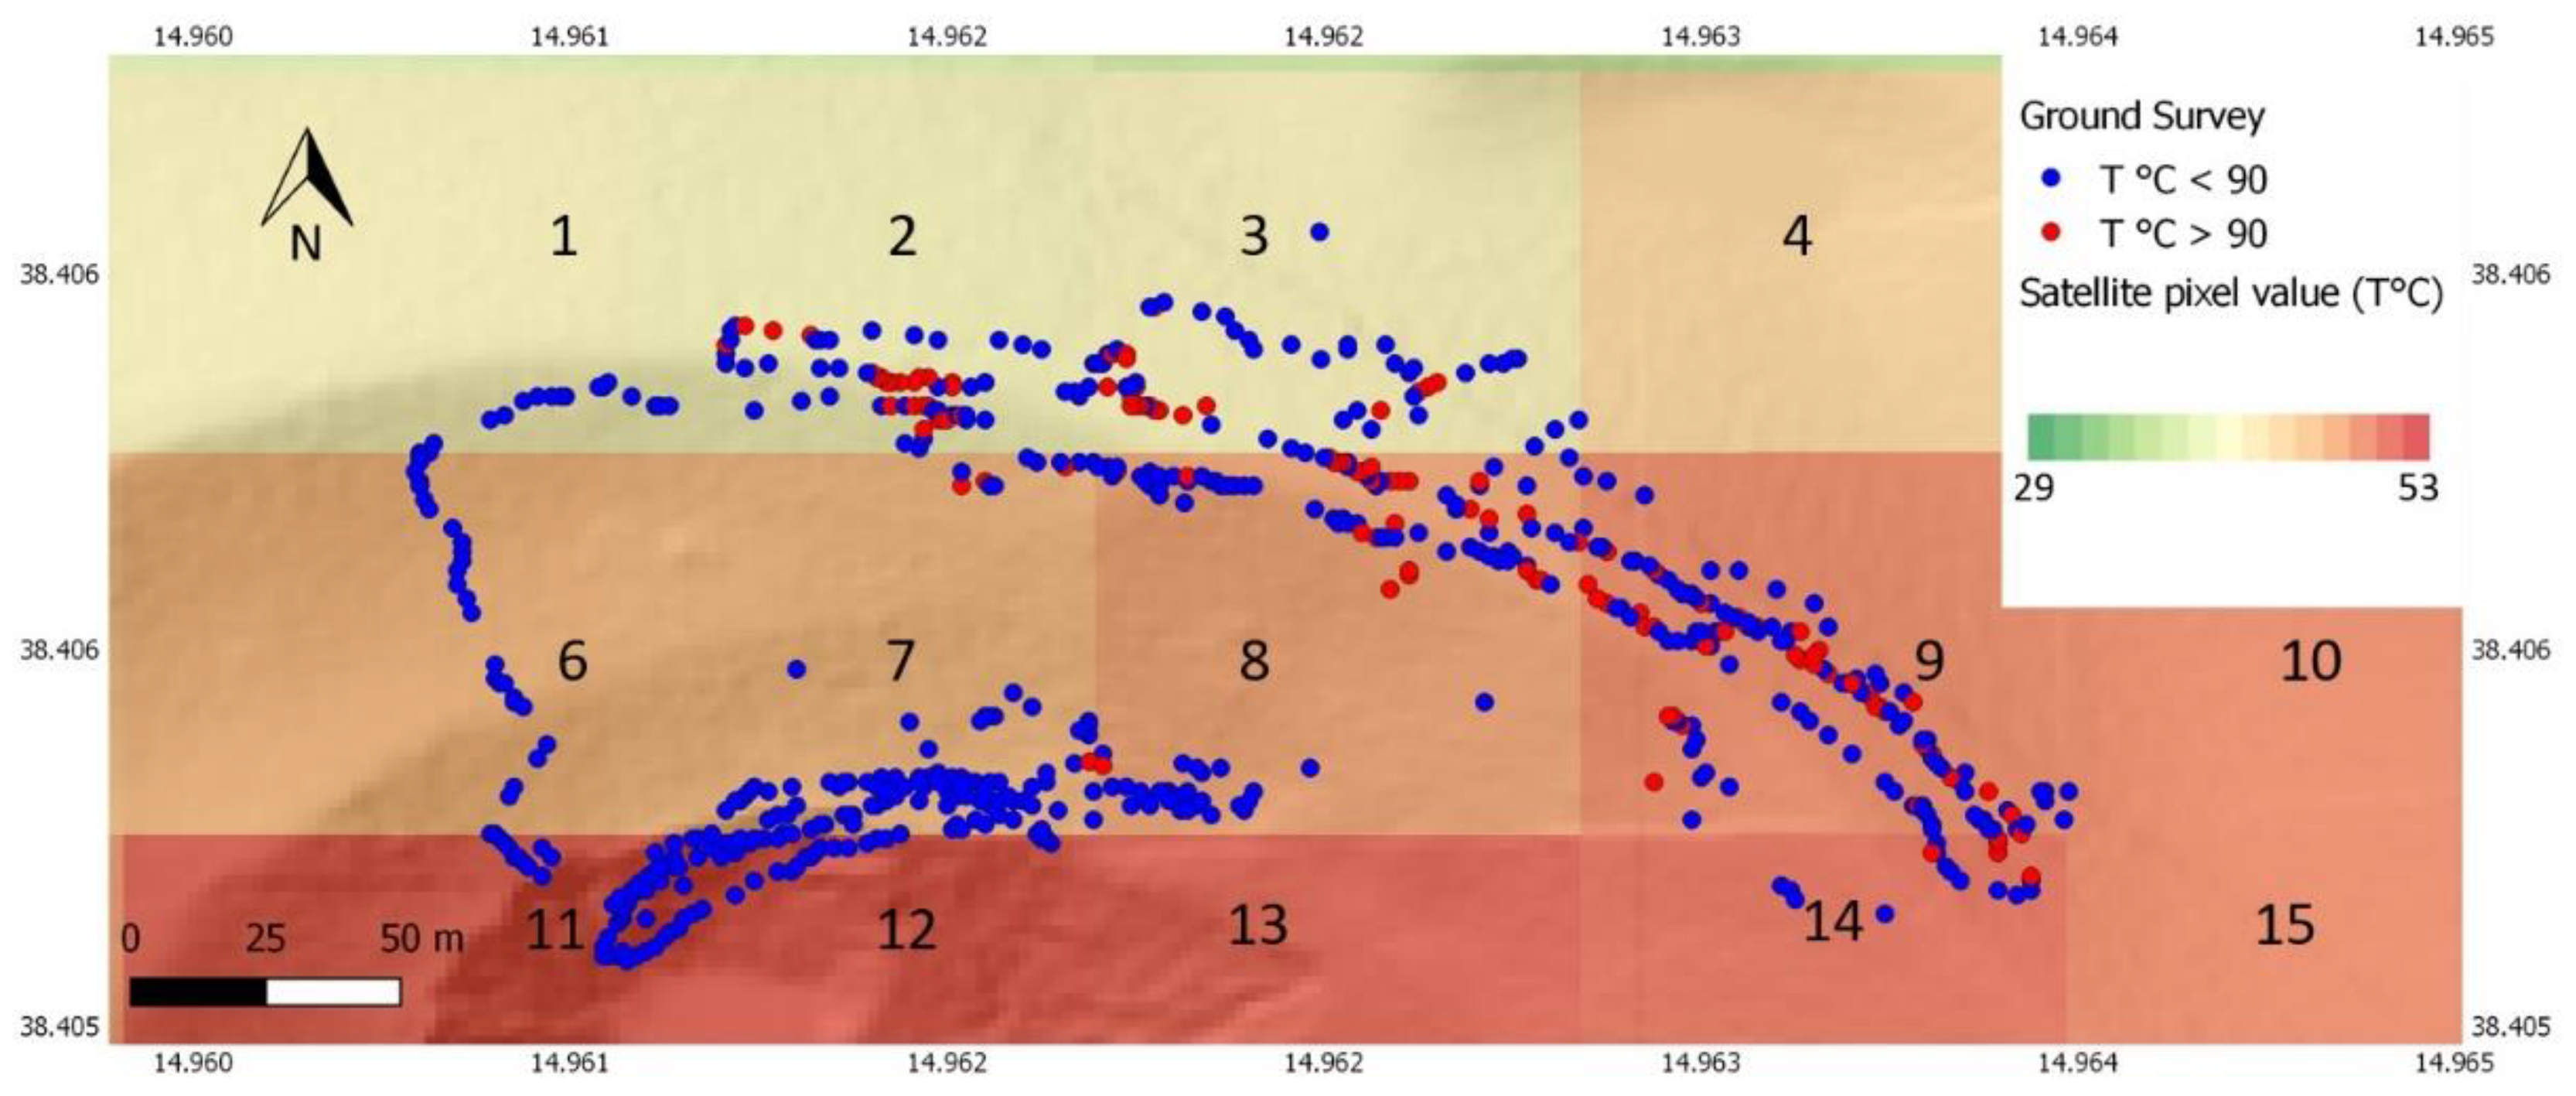
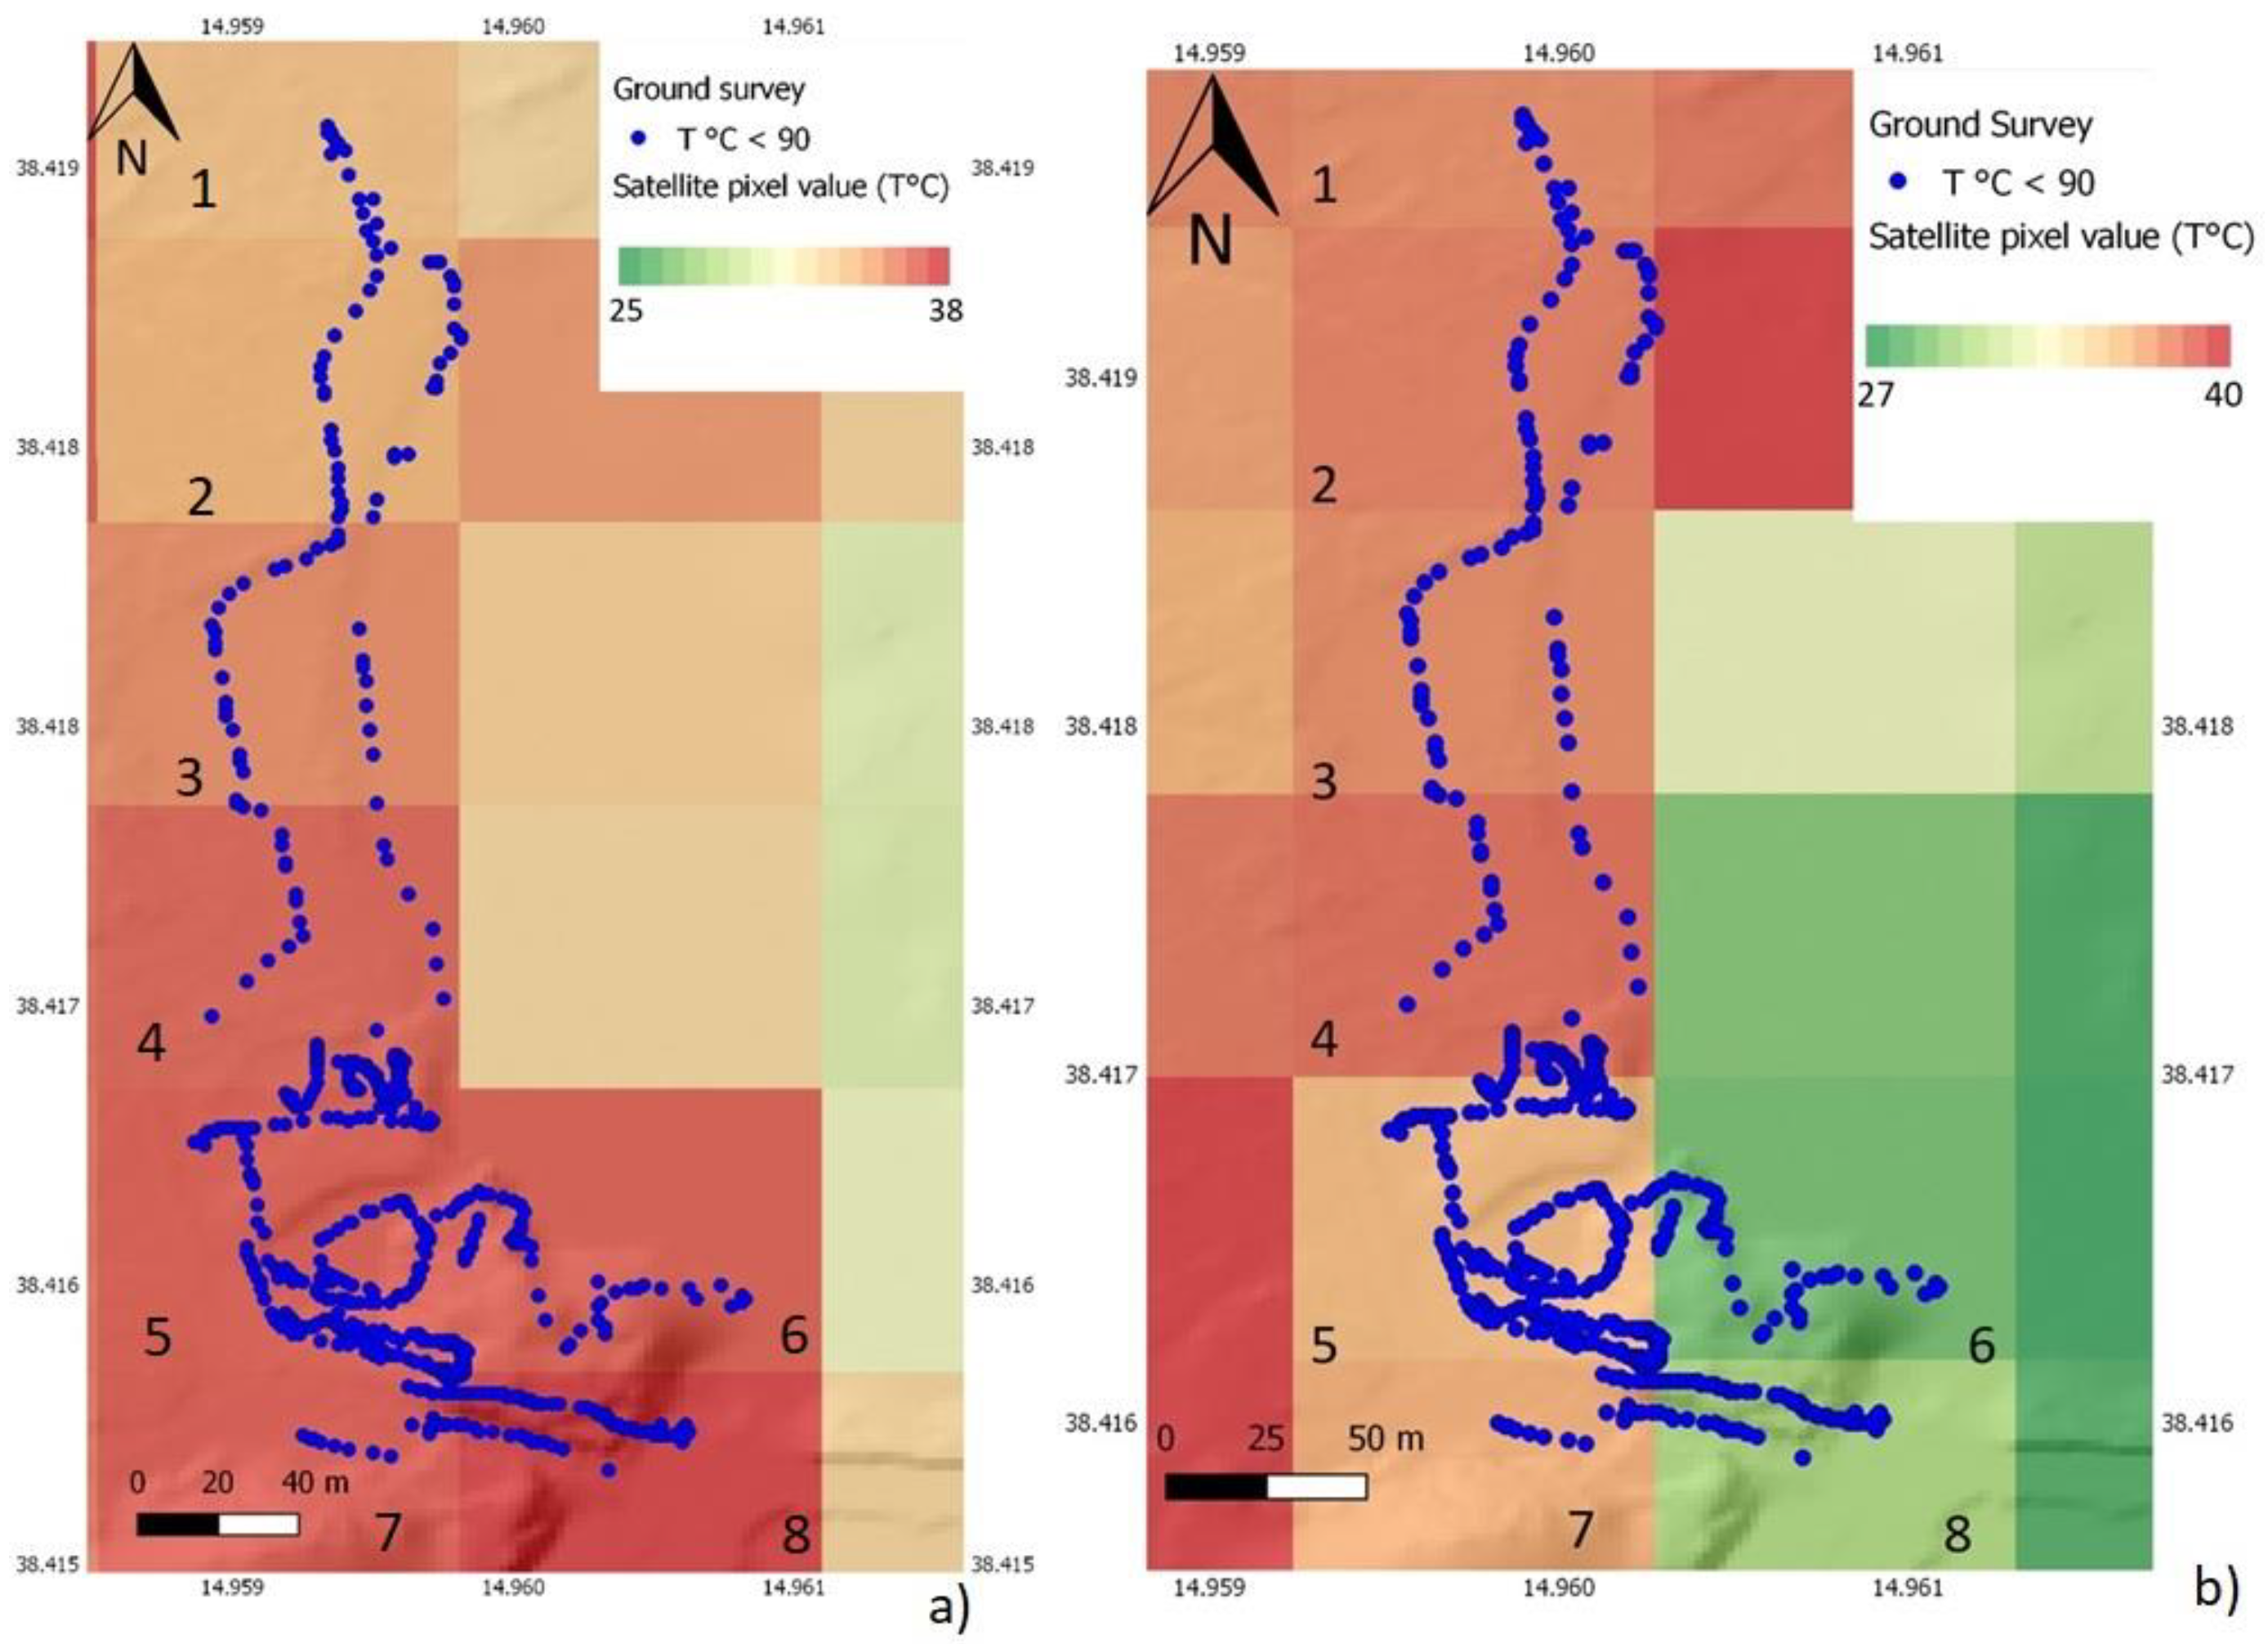
Figure 15.
Ground survey point distribution inside the satellite images pixel boundary. Data of survey 15/09/2014 and ASTER acquisition on 19/09/2014.
Figure 15.
Ground survey point distribution inside the satellite images pixel boundary. Data of survey 15/09/2014 and ASTER acquisition on 19/09/2014.
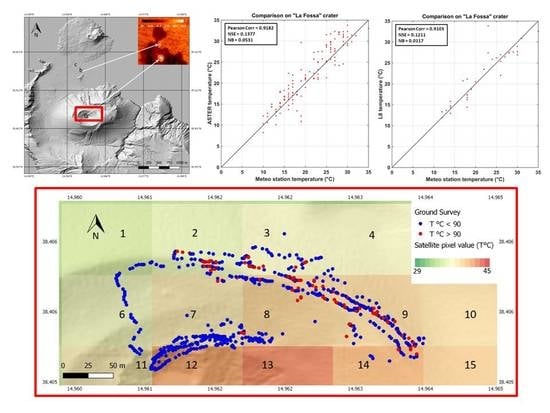
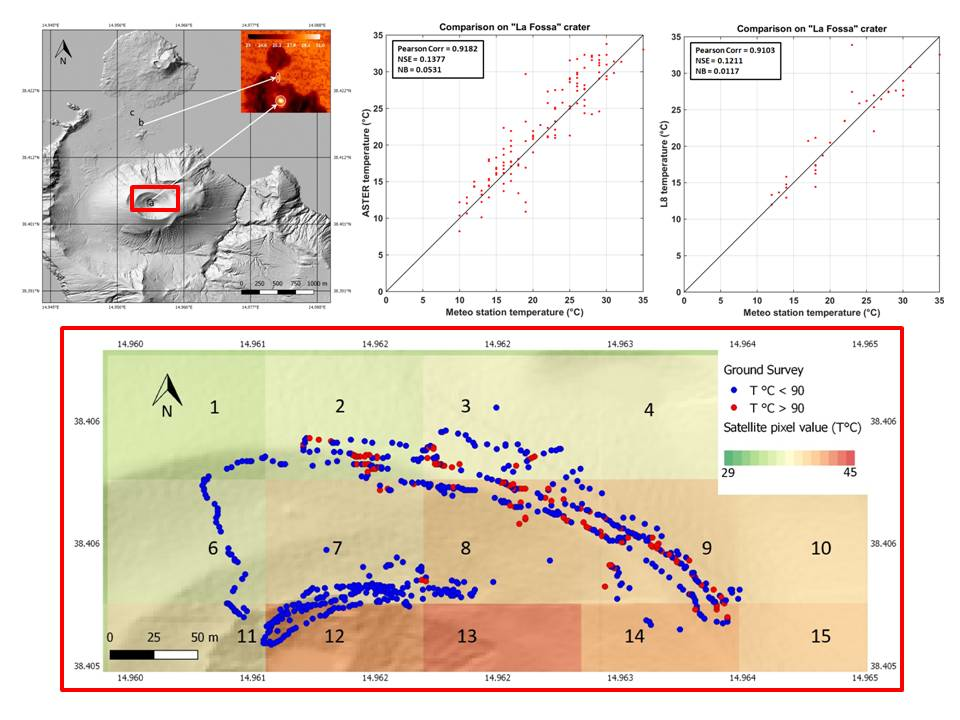
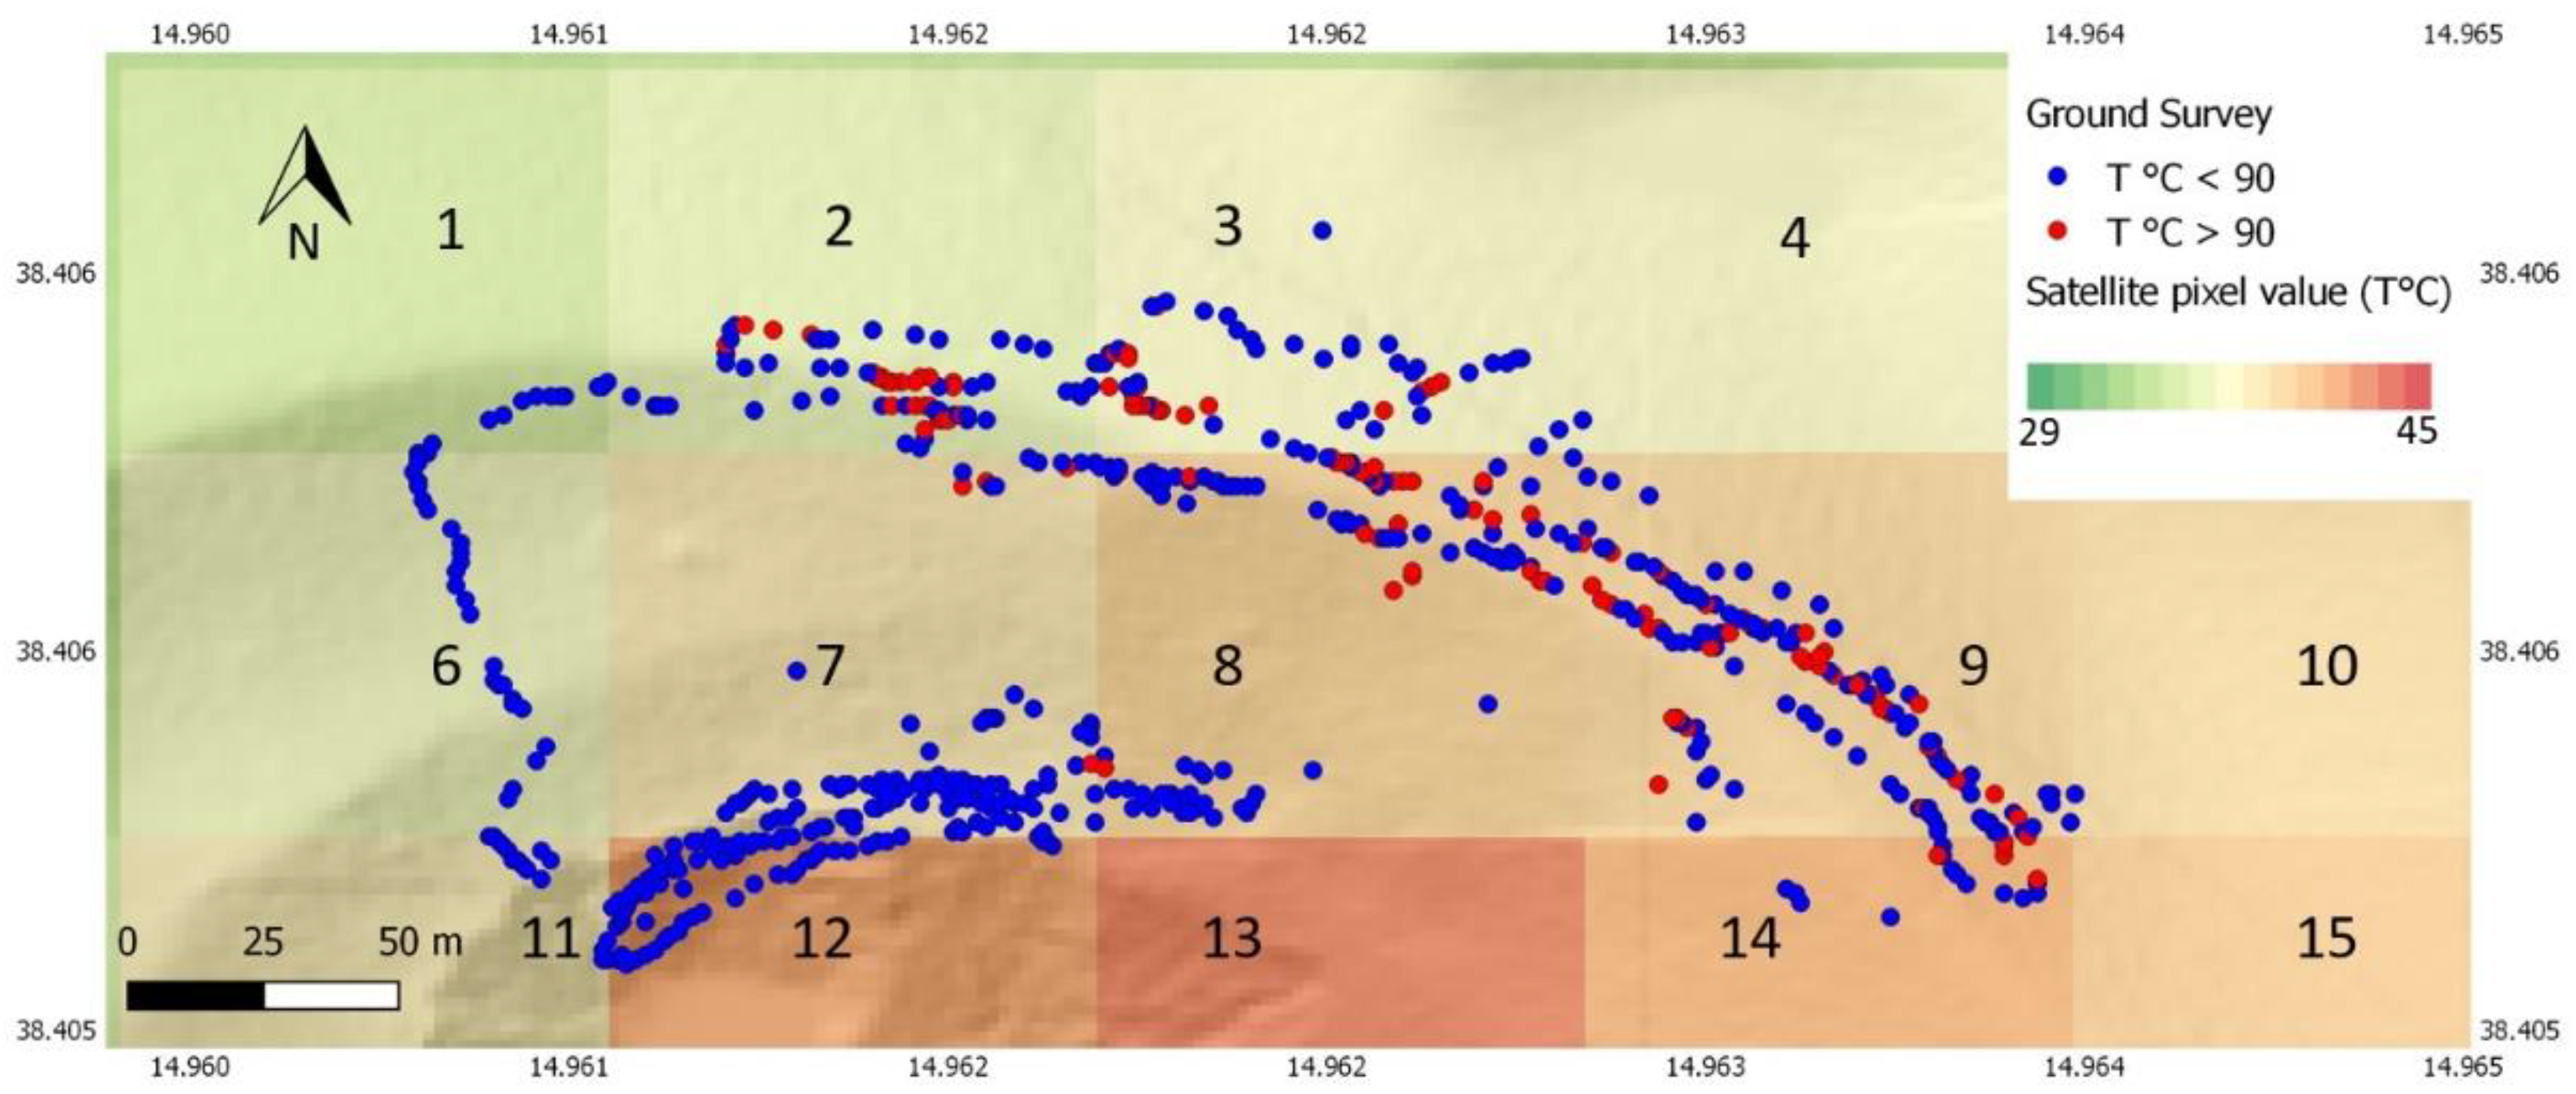
Figure 16.
Ground survey point distribution inside the satellite images pixel boundary. Data of survey 15/09/2014 and L8 acquisition on 11/09/2014.
Figure 16.
Ground survey point distribution inside the satellite images pixel boundary. Data of survey 15/09/2014 and L8 acquisition on 11/09/2014.
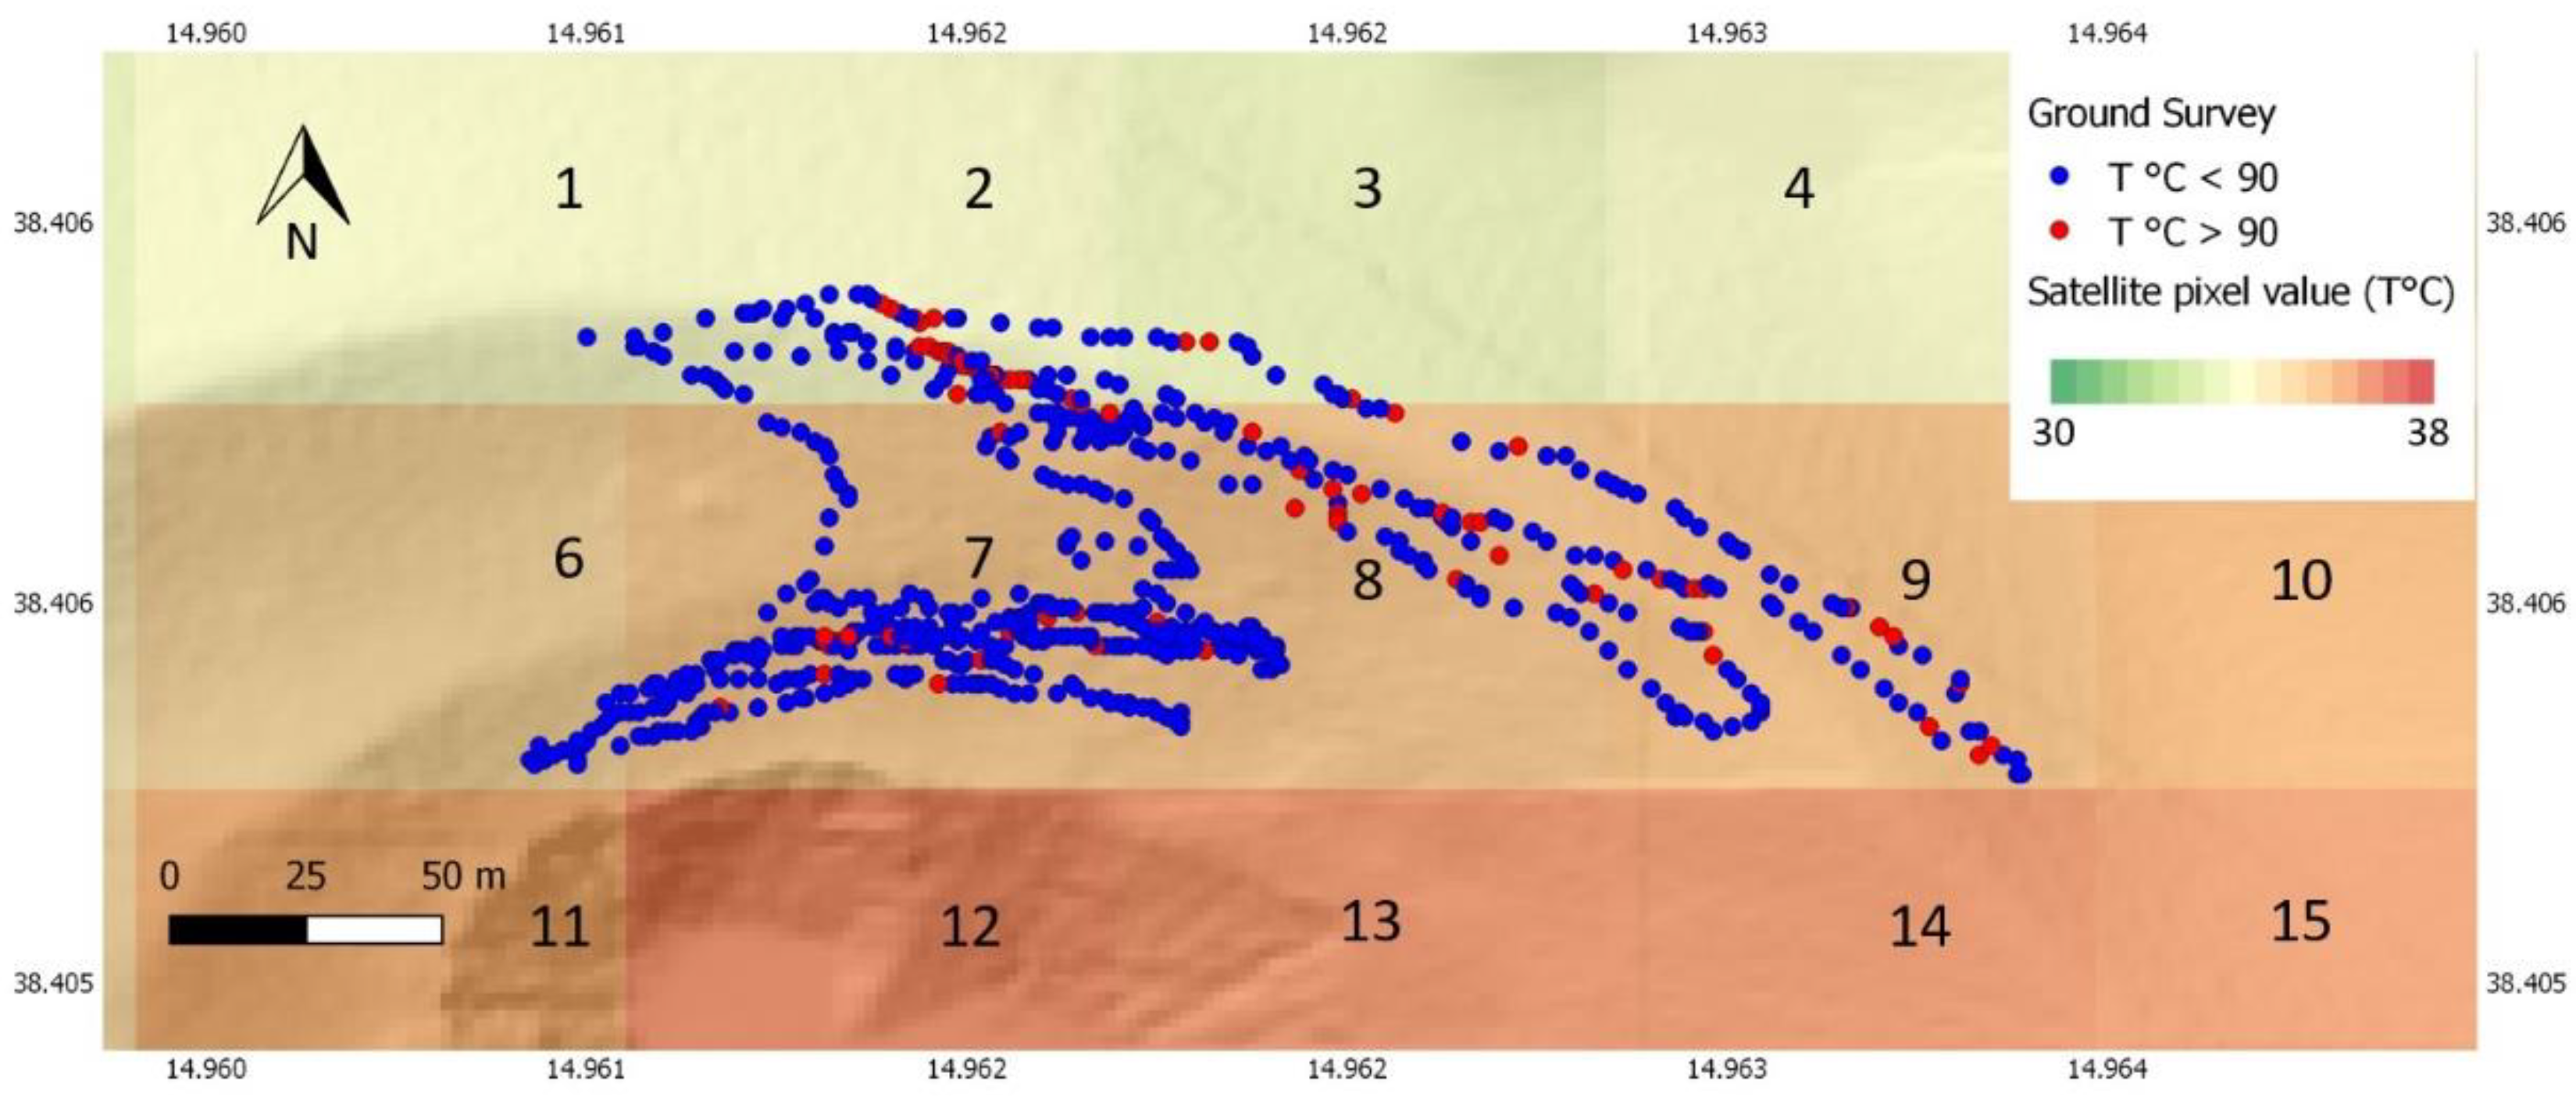
Figure 17.
Ground survey point distribution inside the satellite images pixel boundary. Data of survey 26/04/2017 and L8 acquisition on 28/04/2017.
Figure 17.
Ground survey point distribution inside the satellite images pixel boundary. Data of survey 26/04/2017 and L8 acquisition on 28/04/2017.
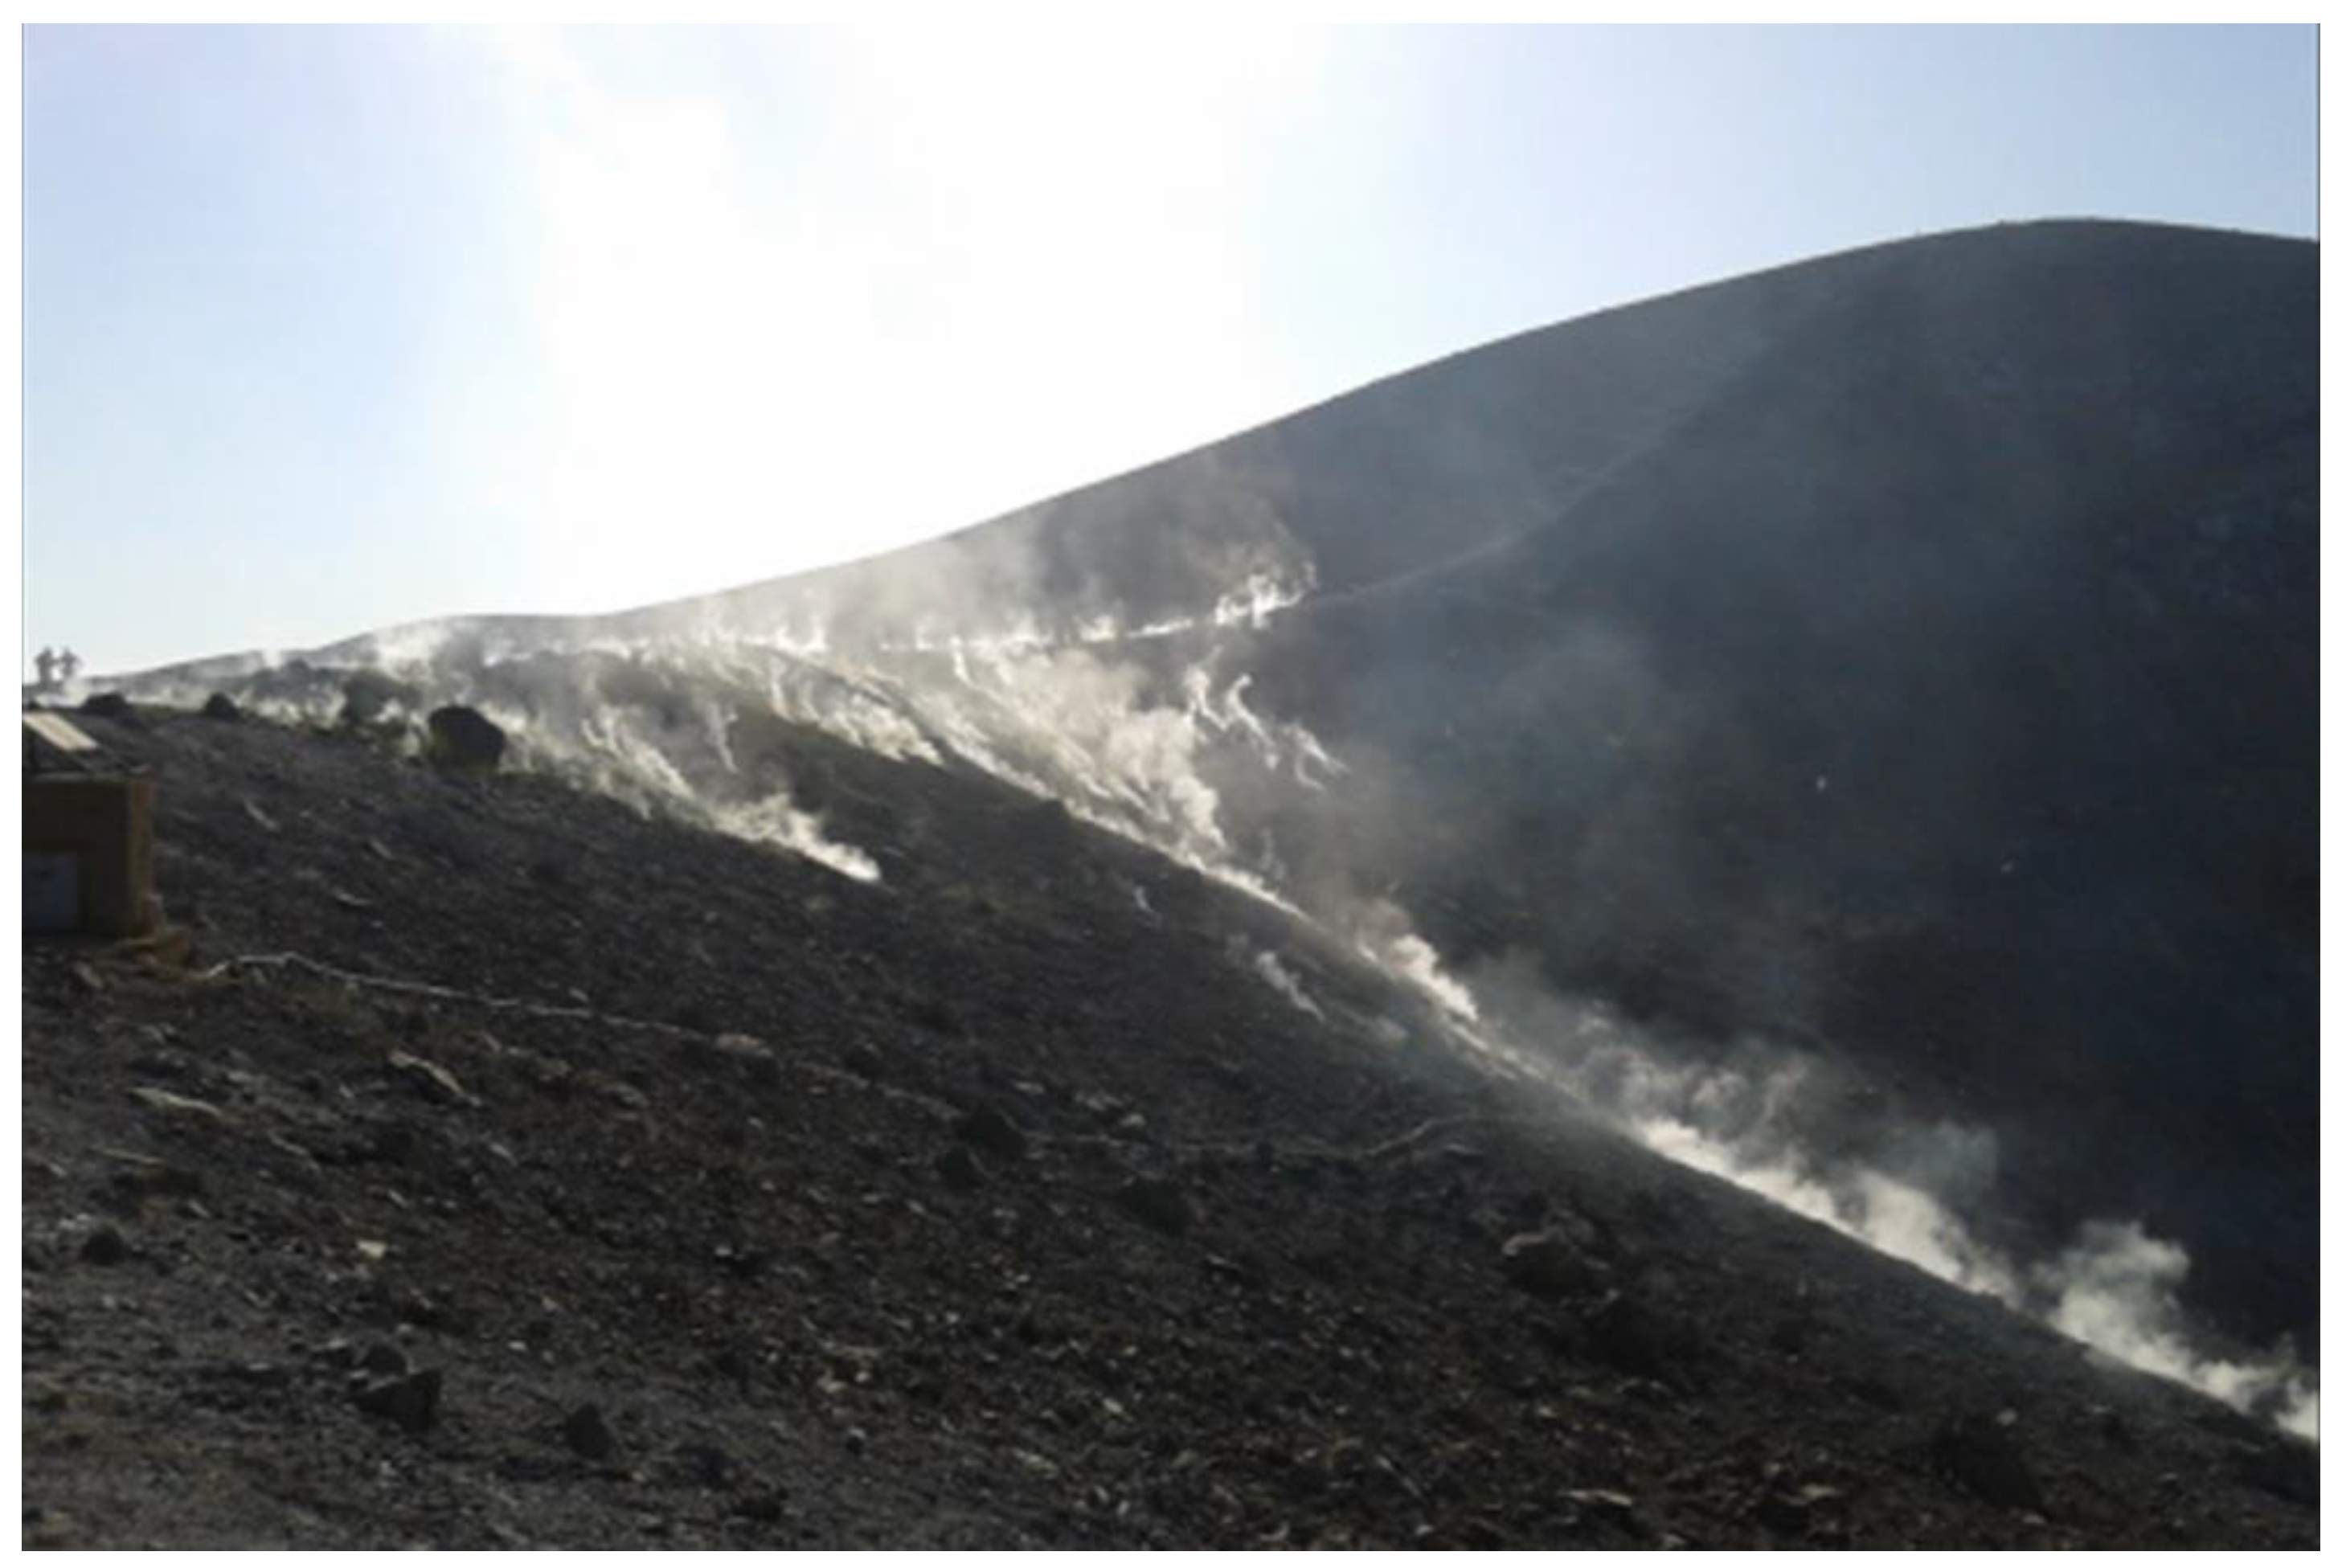
Figure 18.
Fumaroles on the inner slope of the La Fossa cone. (Silvestri, M.-Photographer, 2015).
Figure 18.
Fumaroles on the inner slope of the La Fossa cone. (Silvestri, M.-Photographer, 2015).
Figure 19.
Ground survey point distribution inside the satellite images pixel boundary. Data of survey 15/09/2014 and L8 acquisition on 11/09/2014 (a) and ASTER acquisition 19/09/2014 (b).
Figure 19.
Ground survey point distribution inside the satellite images pixel boundary. Data of survey 15/09/2014 and L8 acquisition on 11/09/2014 (a) and ASTER acquisition 19/09/2014 (b).
Figure 20.
IR map acquired on
La Fossa crater during the 16/07/2014 with a hand-held IR camera with satellite pixel. Red dots indicate the number of pixels as described in
Figure 14,
Figure 15,
Figure 16 and
Figure 17.
Figure 20.
IR map acquired on
La Fossa crater during the 16/07/2014 with a hand-held IR camera with satellite pixel. Red dots indicate the number of pixels as described in
Figure 14,
Figure 15,
Figure 16 and
Figure 17.
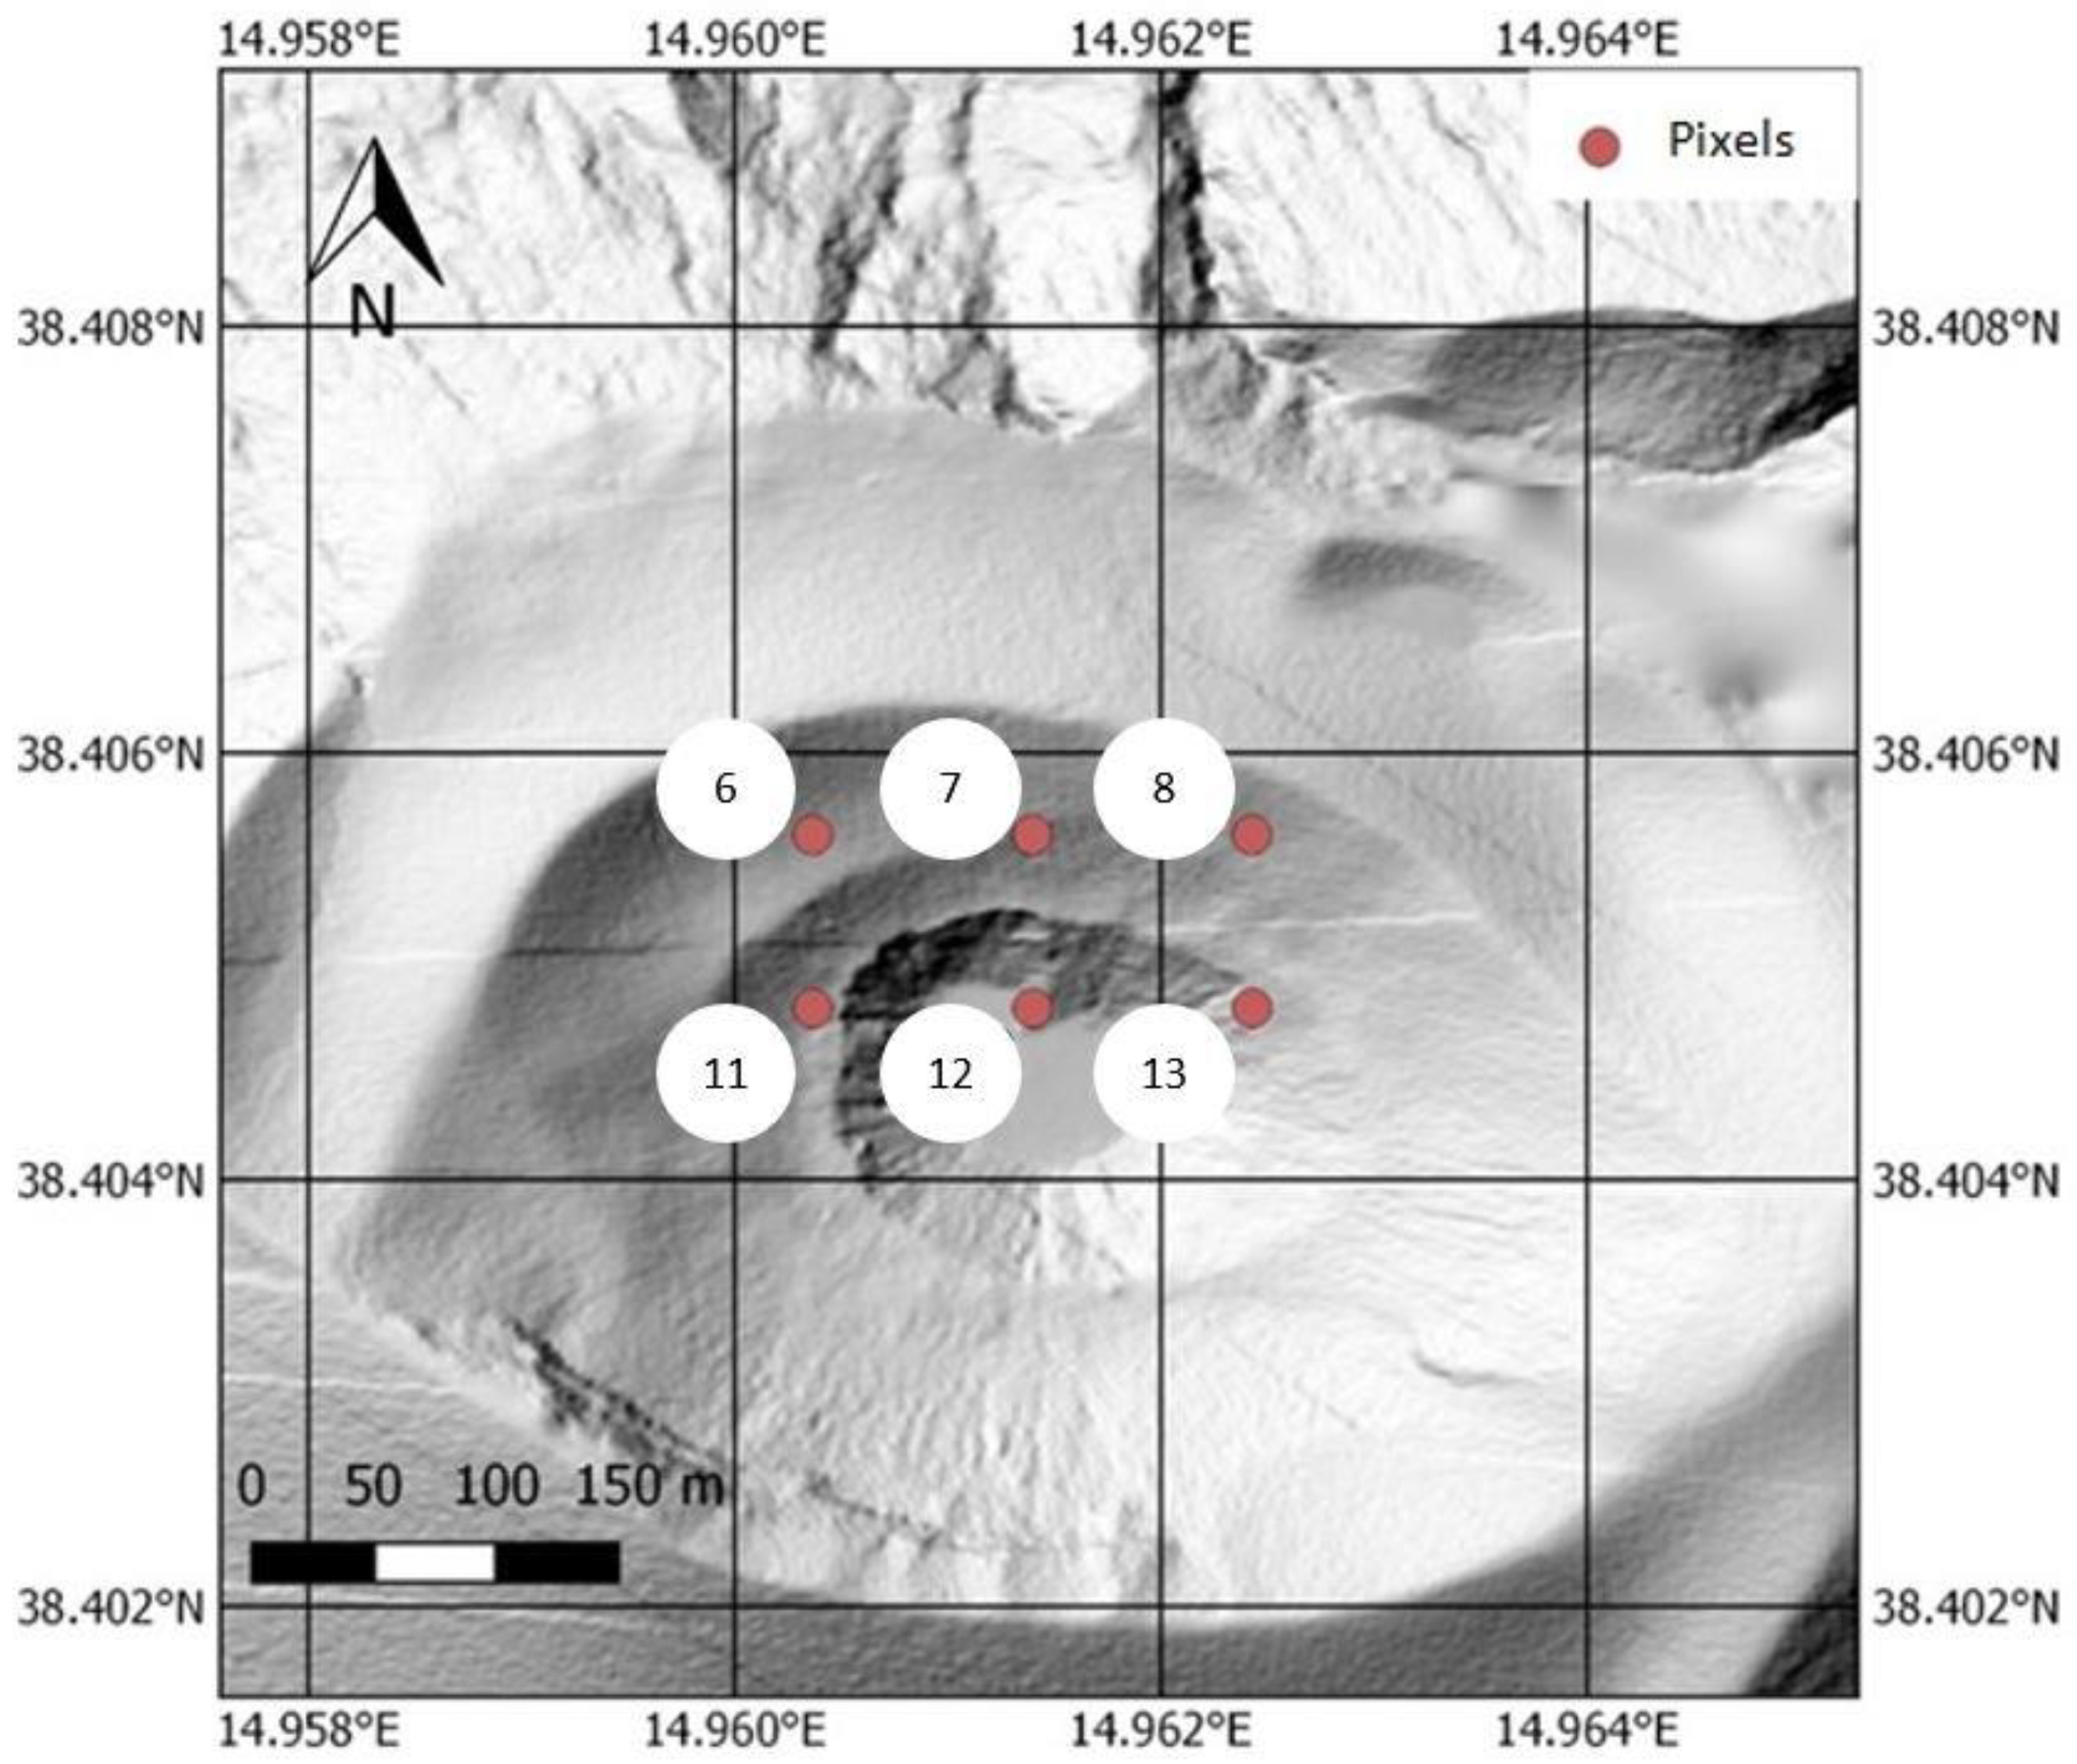
Figure 21.
Red points represent the geographical position of the hottest pixels derived by time series satellite data for La Fossa crater.
Figure 21.
Red points represent the geographical position of the hottest pixels derived by time series satellite data for La Fossa crater.
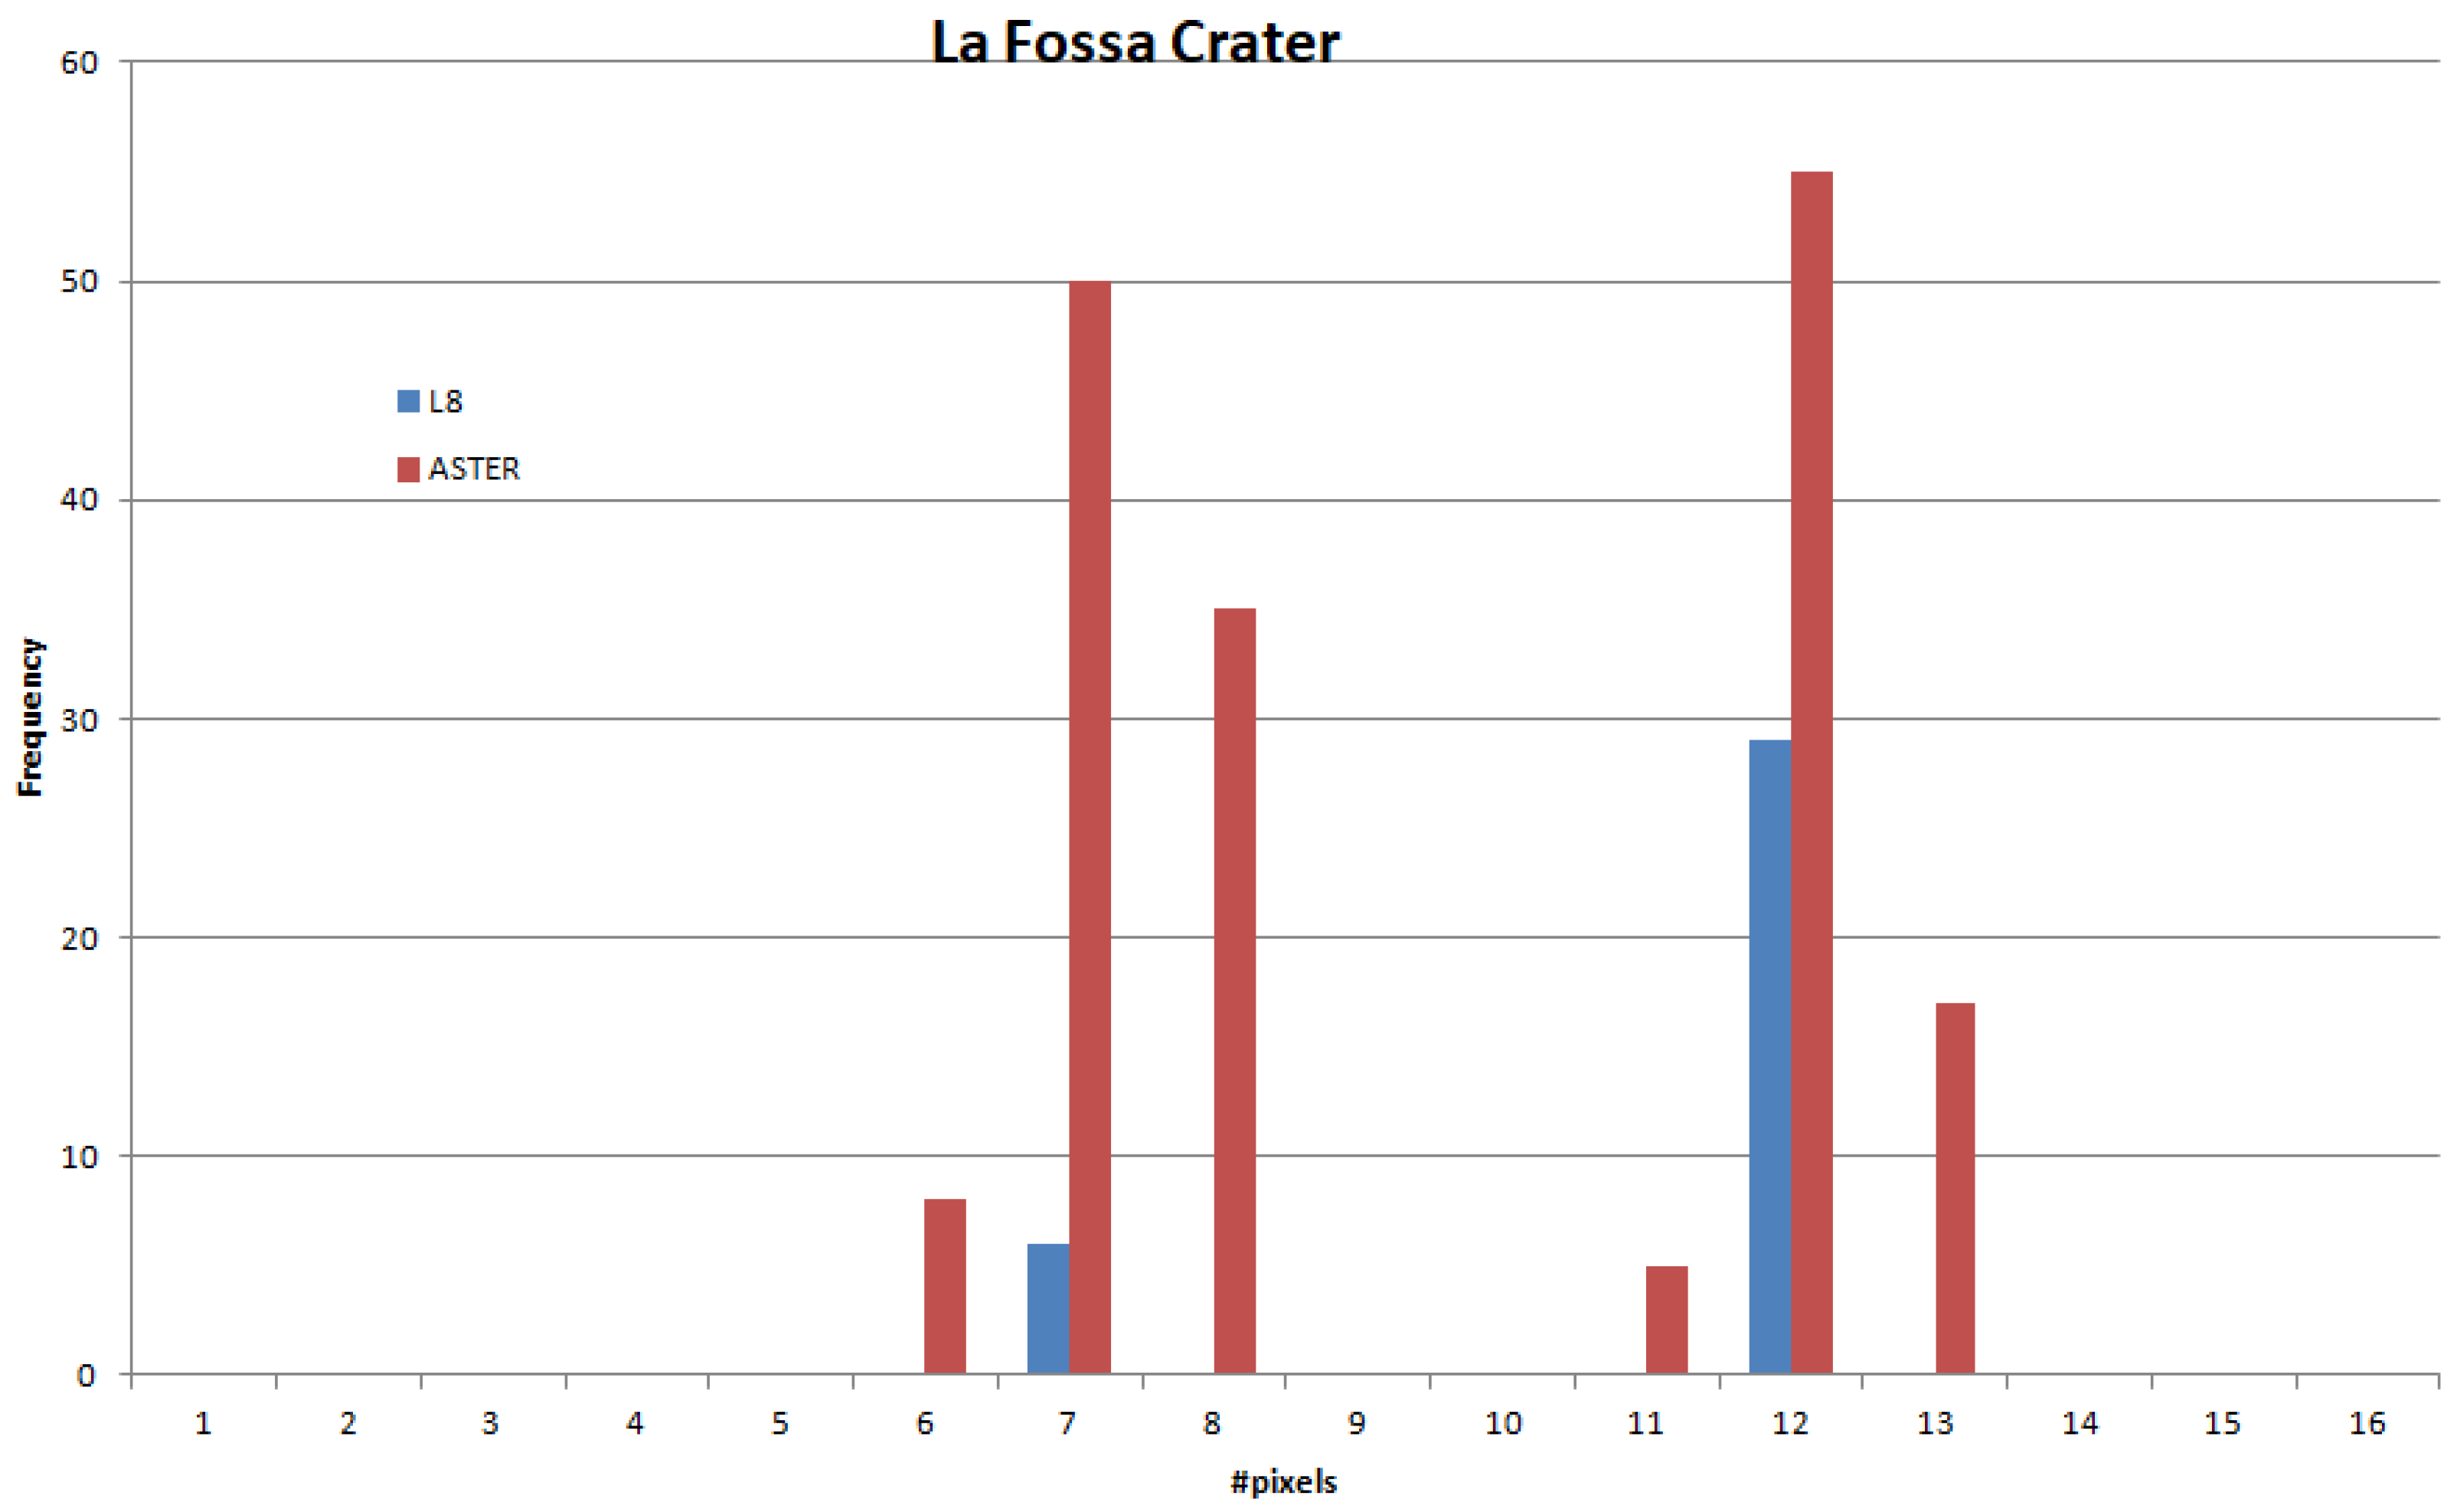
Figure 22.
Histogram reports the numbering of the satellite pixel along the x-axis and the occurrence of the hottest pixels along the y-axis for La Fossa crater.
Figure 22.
Histogram reports the numbering of the satellite pixel along the x-axis and the occurrence of the hottest pixels along the y-axis for La Fossa crater.
Figure 23.
Red points represent the geographical position of the hottest pixels derived by time series satellite data for the “Fangaia”mud pool.
Figure 23.
Red points represent the geographical position of the hottest pixels derived by time series satellite data for the “Fangaia”mud pool.
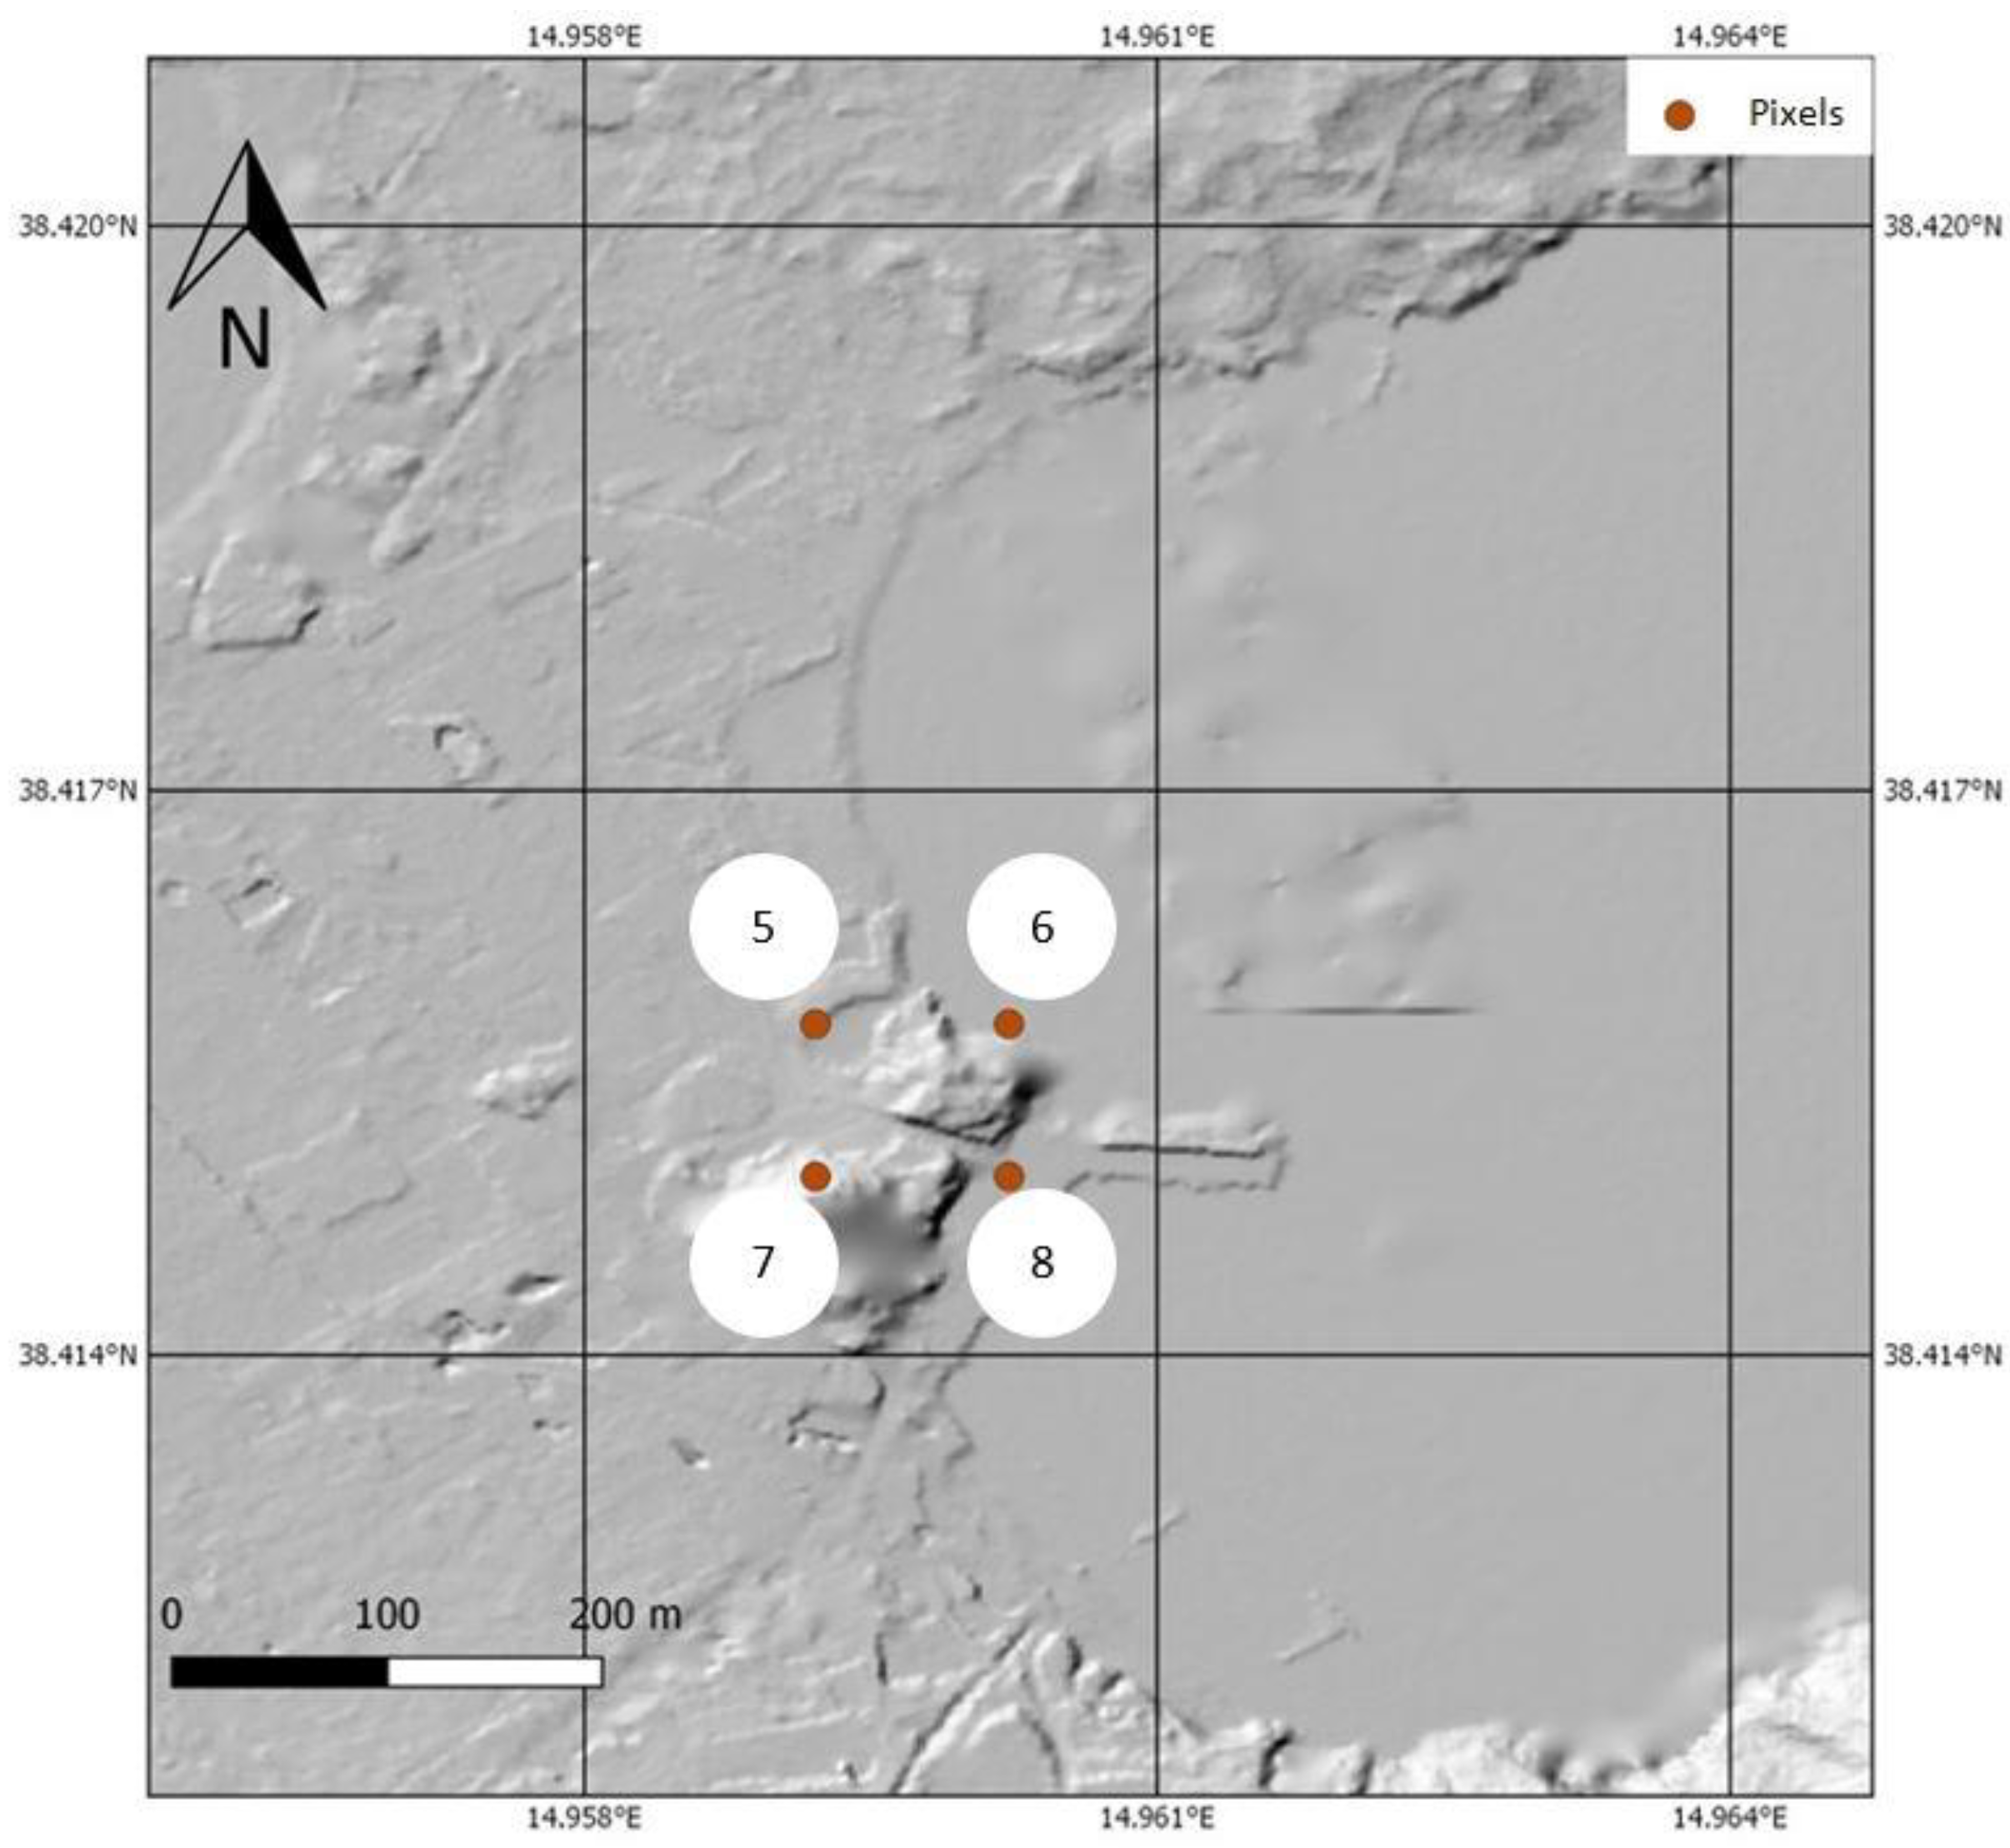
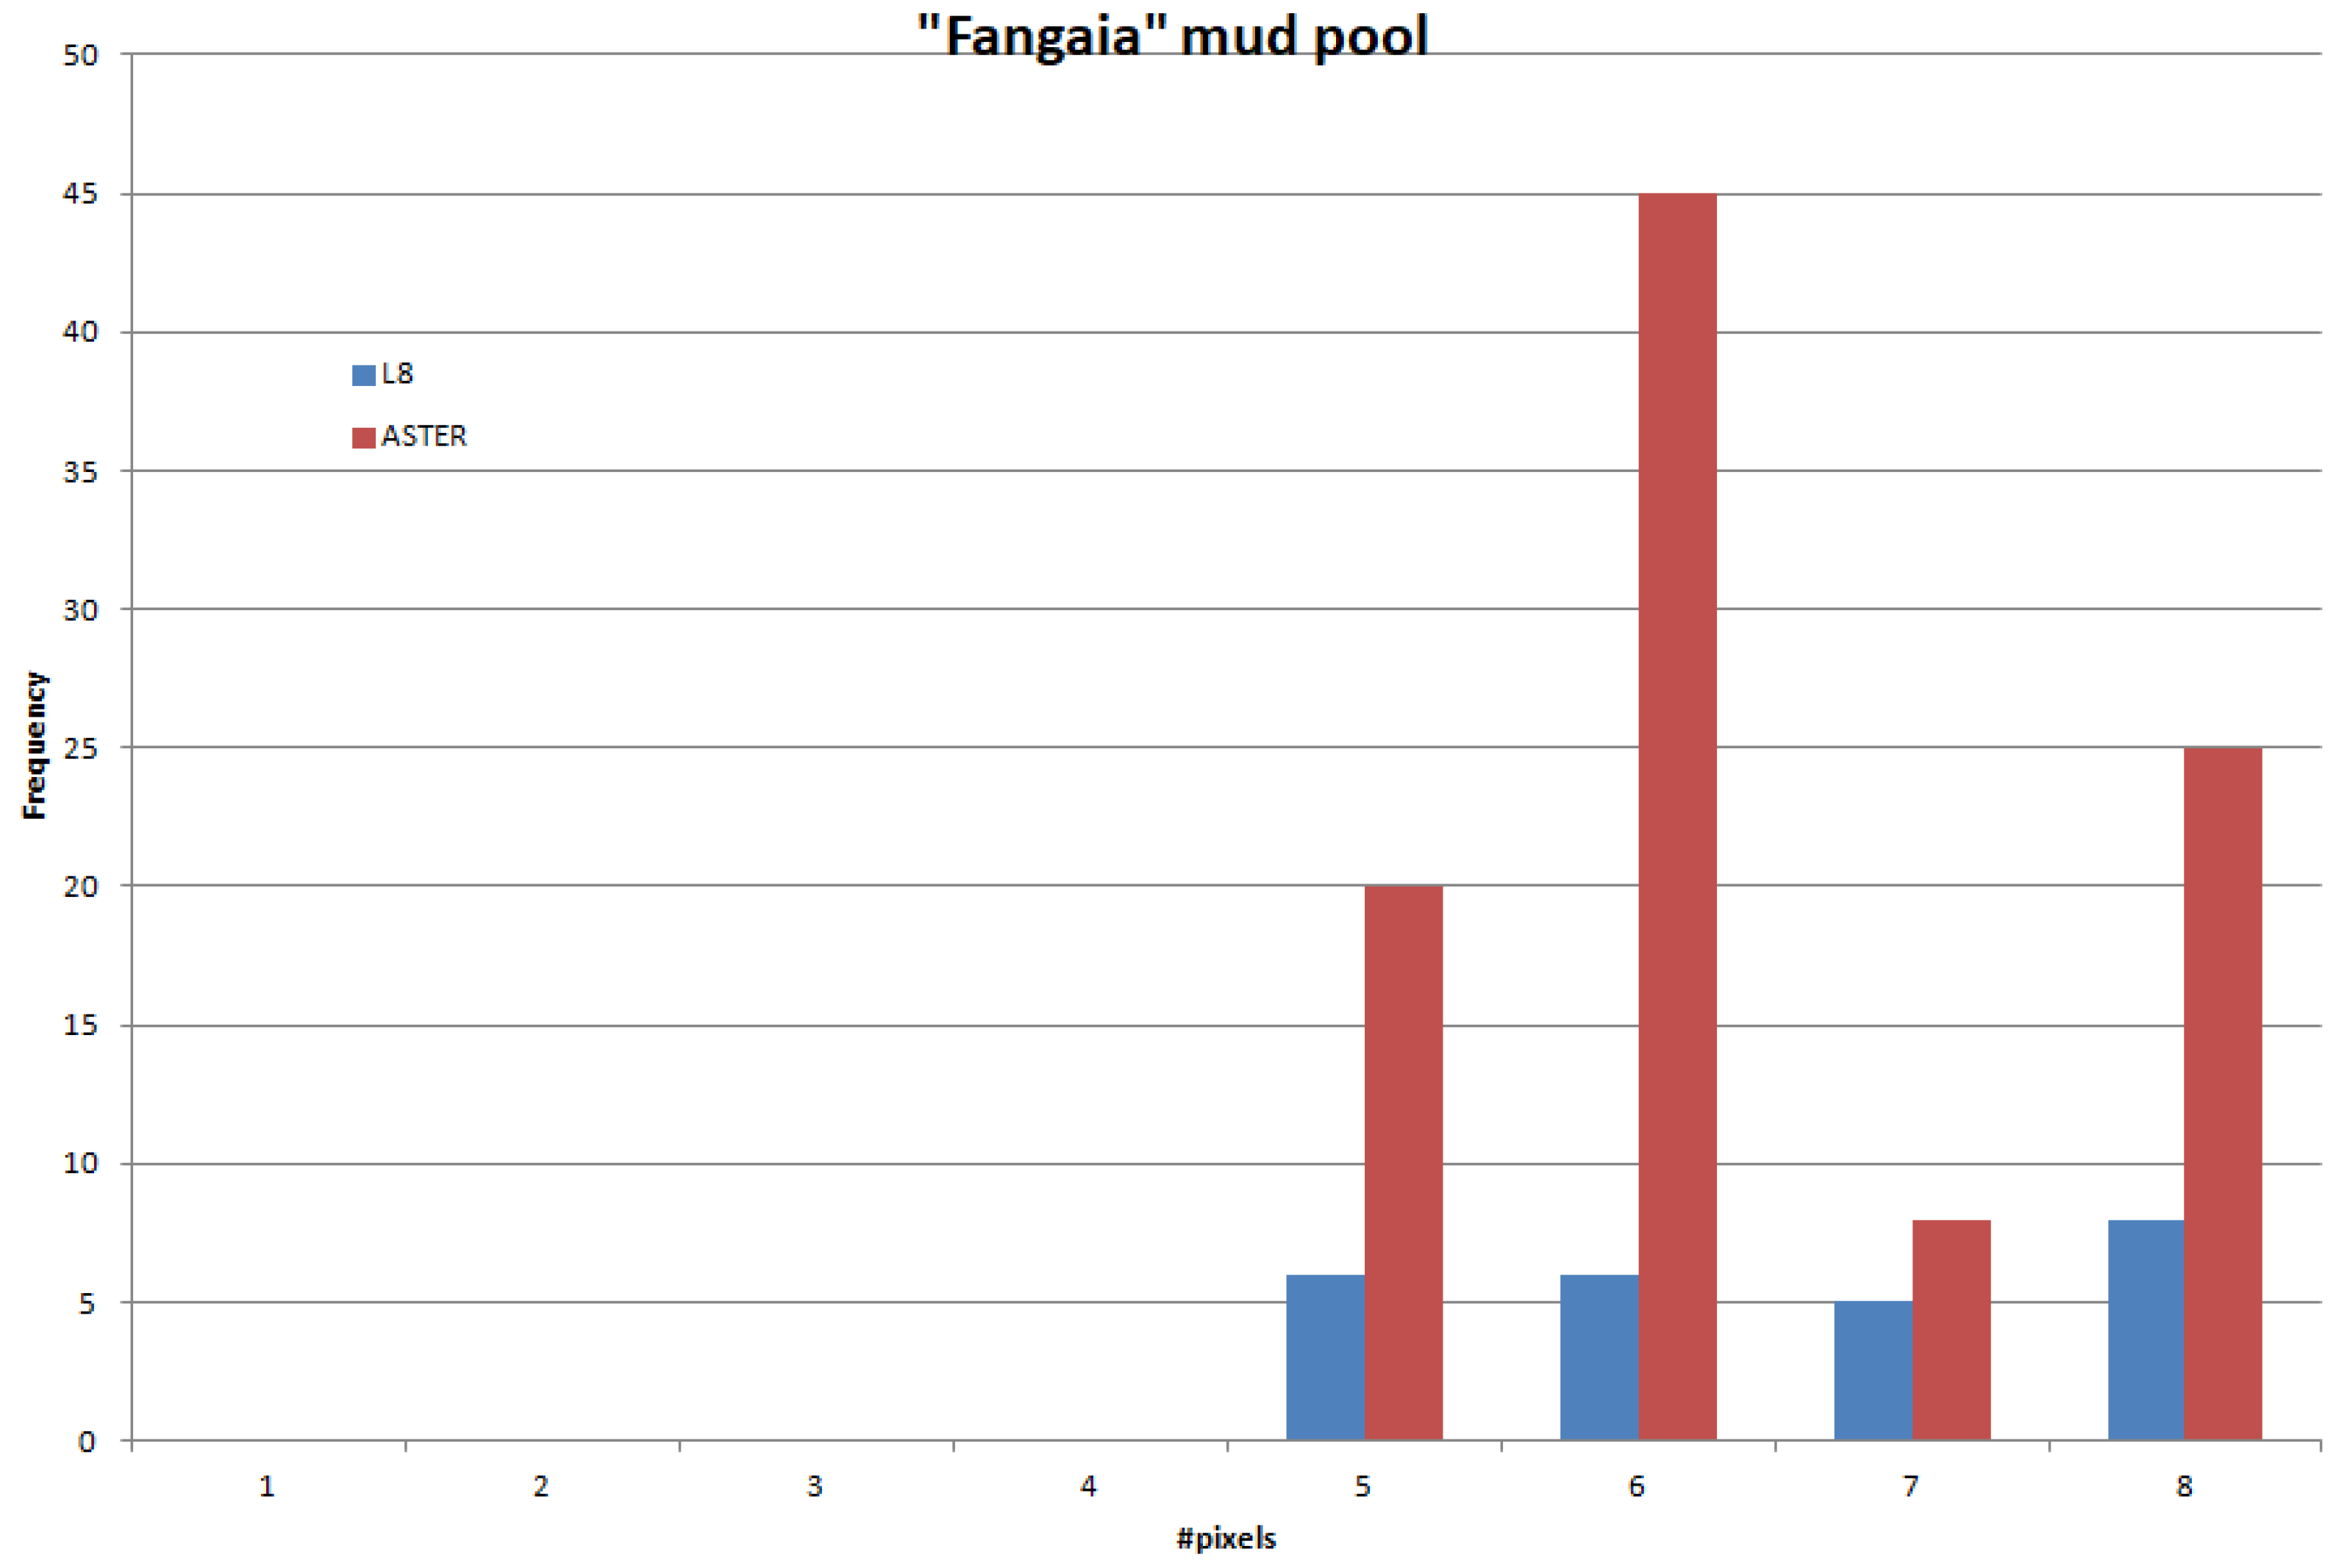
Figure 24.
Histogram reports the numbering of the satellite pixel along the x-axis and the occurrence of the hottest pixels along the y-axis for “Fangaia” mud pool.
Figure 24.
Histogram reports the numbering of the satellite pixel along the x-axis and the occurrence of the hottest pixels along the y-axis for “Fangaia” mud pool.
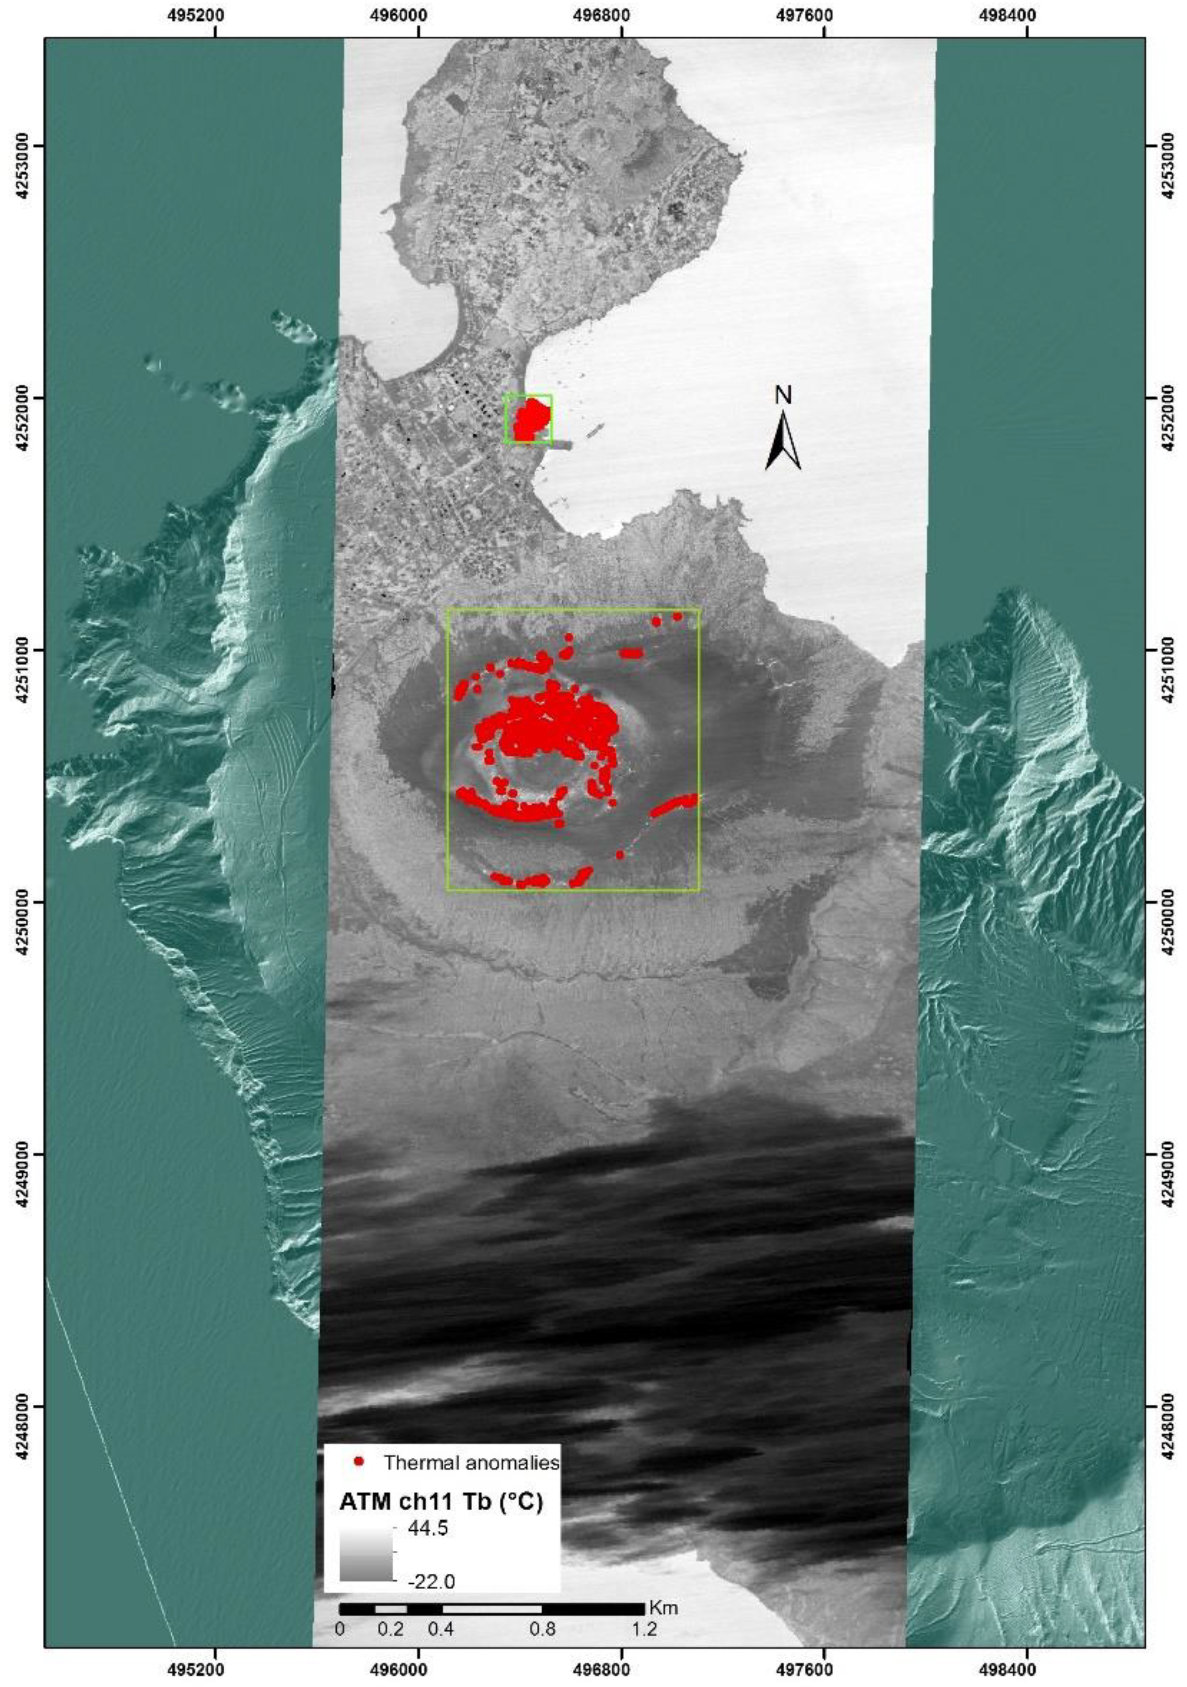
Figure 25.
Thermal anomalies detected by ATM Thermal data (Red dots). The two green boxes are the area considered for the temperature meaning. Brightness temperature of ATM Thermal channel 11 over the Vulcano island is represented in grey scale with shaded relief represented in green.
Figure 25.
Thermal anomalies detected by ATM Thermal data (Red dots). The two green boxes are the area considered for the temperature meaning. Brightness temperature of ATM Thermal channel 11 over the Vulcano island is represented in grey scale with shaded relief represented in green.
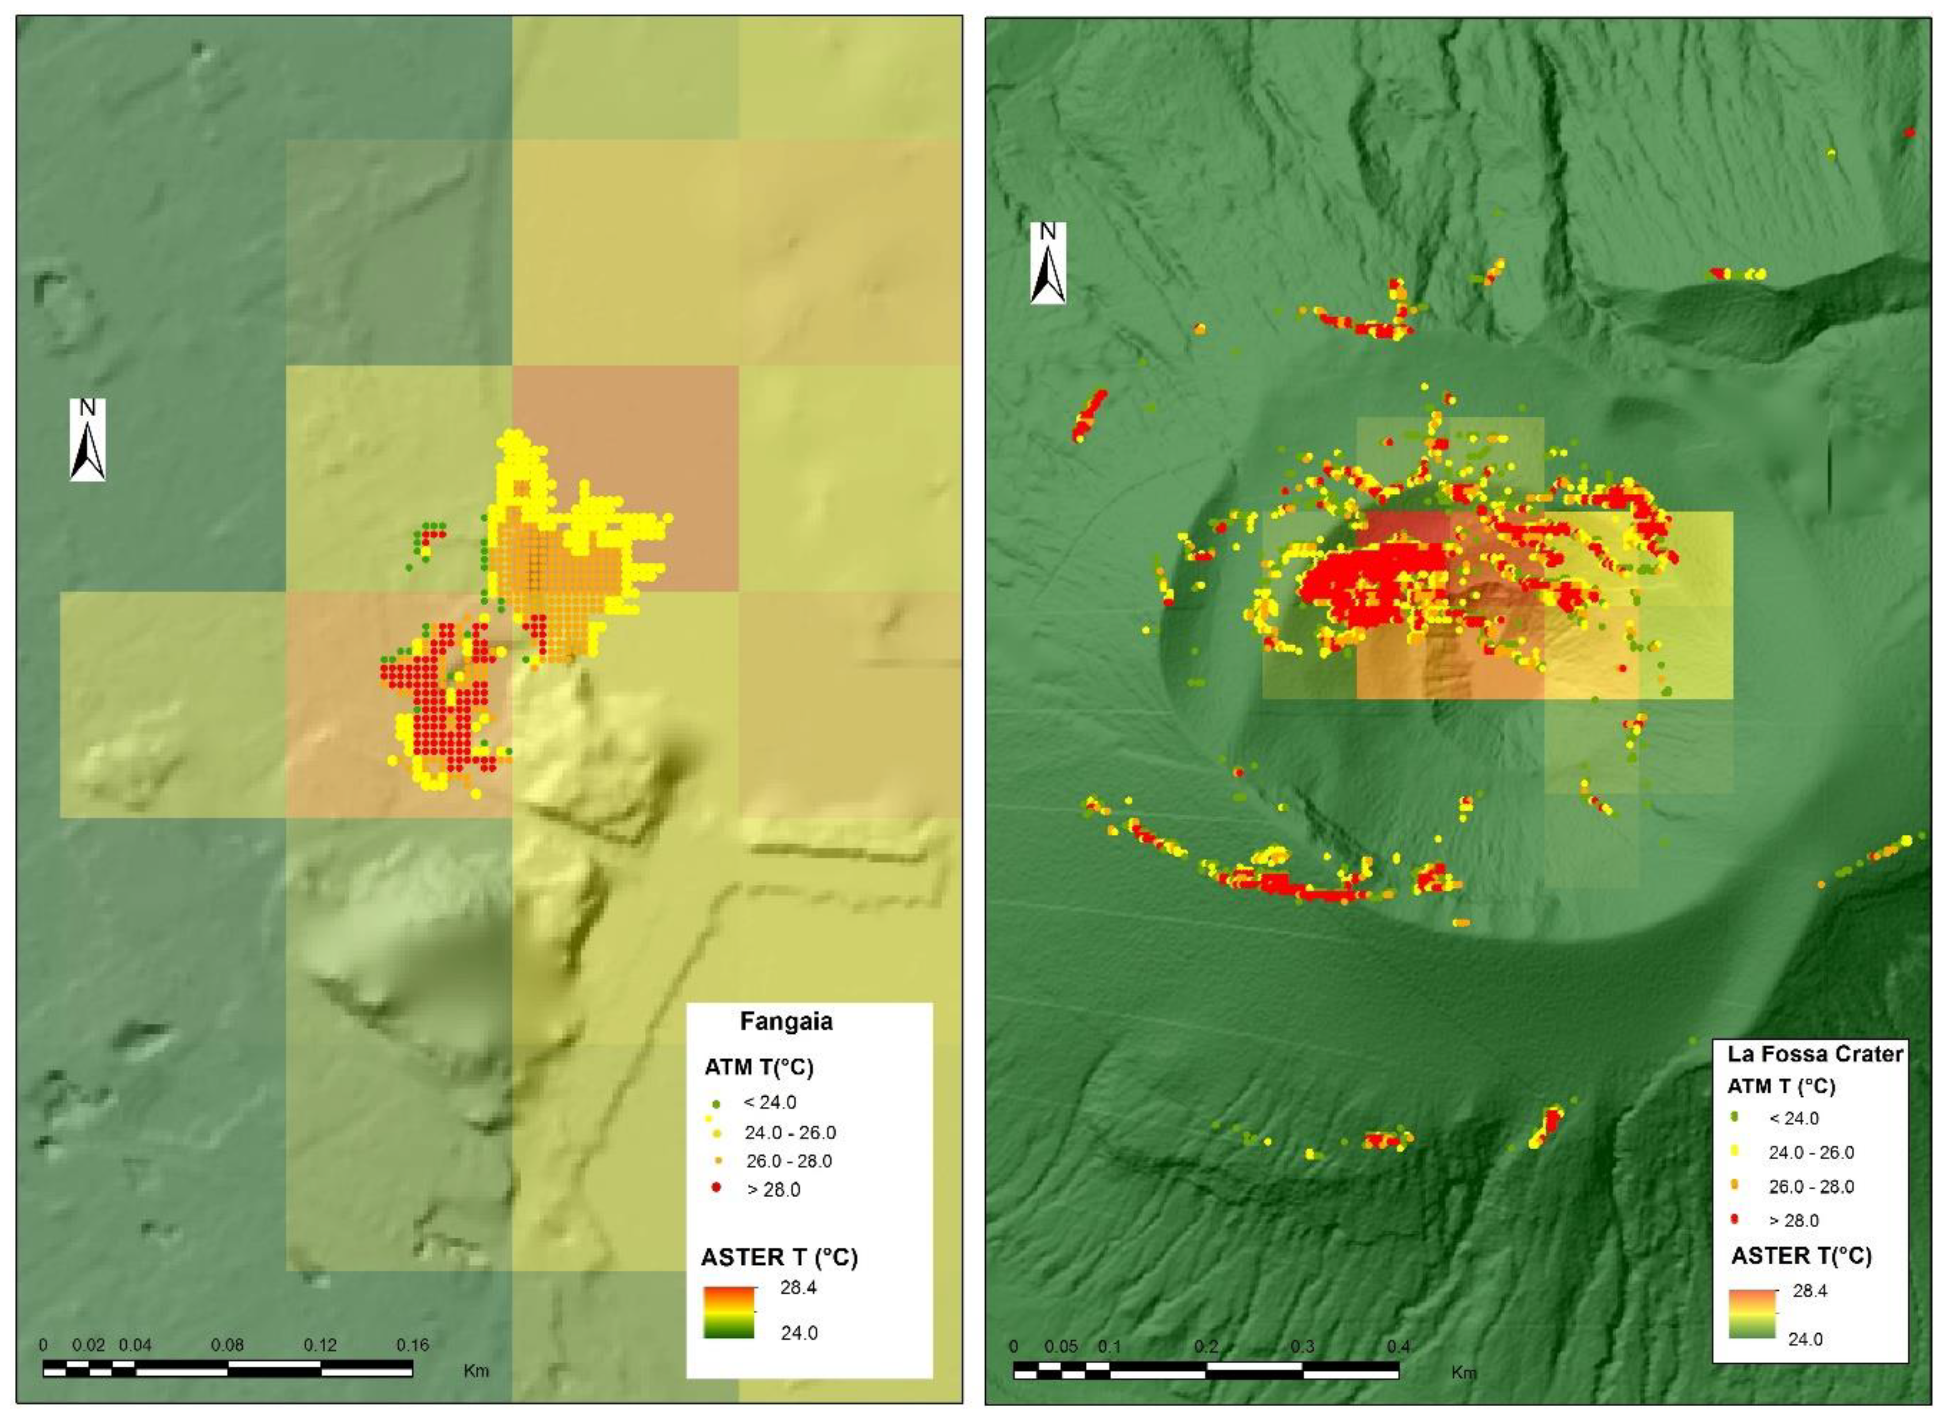
Figure 26.
ASTER acquired on 6 September and ATM-retrieved temperature comparison of the “Fangaia” area (left) and La Fossa Crater (right).
Figure 26.
ASTER acquired on 6 September and ATM-retrieved temperature comparison of the “Fangaia” area (left) and La Fossa Crater (right).
Table 1.
Ground and Satellite data.
Table 1.
Ground and Satellite data.
| Ground Survey | Satellite Data |
|---|
| Date | Site | ASTER | L8 |
|---|
| 12/06/2012 | La Fossa Crater | 16/06/2012 | -------- |
| 15/09/2014 | La Fossa Crater | 19/09/2014 | 11/09/2014 |
| 26/04/2017 | La Fossa Crater | -------- | 28/04/2017 |
| 15/09/2014 | Fangaia | 19/09/2014 | 11/09/2014 |
Table 2.
Hand-held IR camera features.
Table 2.
Hand-held IR camera features.
| IR Camera Features |
|---|
| Temperature range | 20 °C to 650 °C |
| Field of view/min focus distance | 25° × 19°/9.8″ (0.25 m) |
| detector type-Focal plane array | 640 × 480 pixels (FPA) uncooled microbolometer |
| Spectral range | 7.5 to 14 µm |
| Lens | 25° |
| Accuracy | ±2 °C |
Table 3.
Main characteristics of the predawn ATM flight.
Table 3.
Main characteristics of the predawn ATM flight.
| ATM Airborne Characteristics |
|---|
| Data and time | 12/09/10 03:07 GMT |
| Flight height | 4000 ft |
| Plane velocity | 161 nodes |
| IFOV | 2.5 mrad |
| FOV | 85.92° |
| Scan line | 712 pixels |
| Scan Speed | 25 scan/s |
| Ground pixel | ~3 m |
Table 4.
Comparison of temperature derived from the web site, field campaign and L8 data.
Table 4.
Comparison of temperature derived from the web site, field campaign and L8 data.
| Point Lat/Lon | Time UTC | Oplao Web Site 5/9/2015 | Field Campaign 3/9/2015 | L8 5/9/2015 |
|---|
| 38.40612°, 14.96066 | 5:43 AM | 29 °C | 28.4° | 29.69 |
Table 5.
Comparison between ground measurements and satellite estimation temperatures on La Fossa crater (Field campaign 12/06/2012 and ASTER data 16/06/2012).
Table 5.
Comparison between ground measurements and satellite estimation temperatures on La Fossa crater (Field campaign 12/06/2012 and ASTER data 16/06/2012).
| N° Pixel | Ground T (°C) | ASTER T (°C) |
|---|
| 1 | 23.94 | 41.10 ± 4.87 |
| 2 | 101.32 | 44.30 ± 4.51 |
| 3 | 69.08 | 46.50 ± 4.30 |
| 4 | - | - |
| 5 | - | - |
| 6 | 48.49 | 43.00 ± 4.65 |
| 7 | 60.93 | 46.40 ± 4.31 |
| 8 | 63.91 | 48.90 ± 4.09 |
| 9 | 74.10 | 49.10 ± 4.07 |
| 10 | 31.80 | 49.10 ± 4.07 |
| 11 | 43.24 | 46.40 ± 4.31 |
| 12 | | |
| 13 | | |
| 14 | 60.76 | 52.40 ± 3.82 |
| 15 | 35.21 | 49.10 ± 4.07 |
Table 6.
Comparison between ground measurements and satellite estimation temperatures on La Fossa crater (Field campaign 15/09/2014, ASTER data 19/09/2014 and L8 data 11/09/2014).
Table 6.
Comparison between ground measurements and satellite estimation temperatures on La Fossa crater (Field campaign 15/09/2014, ASTER data 19/09/2014 and L8 data 11/09/2014).
| | Ground T (°C) | ASTER T (°C) | L8 T (°C) |
|---|
| 1 | 43.00 | 48.30 ± 4.14 | 35.60 ± 5.62 |
| 2 | 87.00 | 48.50 ± 4.12 | 36.80 ± 5.43 |
| 3 | 87.90 | 48.31 ± 4.14 | 37.90 ± 5.28 |
| 4 | - | - | - |
| 5 | - | - | - |
| 6 | 37.64 | 52.62 ± 3.80 | 37.30 ± 5.36 |
| 7 | 49.12 | 52.68 ± 3.80 | 39.00 ± 5.13 |
| 8 | 69.90 | 50.06 ± 4.00 | 40.40 ± 4.95 |
| 9 | 77.18 | 47.50 ± 4.21 | 40.10 ± 4.99 |
| 10 | - | - | - |
| 11 | 30.92 | 51.57 ± 3.88 | 38.70 ± 5.17 |
| 12 | 42.00 | 49.84 ± 4.01 | 43.00 ± 4.65 |
| 13 | | | |
| 14 | 65.55 | 45.59 ± 4.39 | 42.30 ± 4.73 |
| 15 | ---- | ---- | |
Table 7.
Comparison between ground measurements and satellite estimation temperatures on La Fossa crater (Field campaign 26/04/2017 and L8 data 28/04/2017).
Table 7.
Comparison between ground measurements and satellite estimation temperatures on La Fossa crater (Field campaign 26/04/2017 and L8 data 28/04/2017).
| N° Pixel | Ground T (°C) | L8 T (°C) |
|---|
| 1 | 24.40 | 34.50 ± 5.80 |
| 2 | 74.66 | 34.50 ± 5.80 |
| 3 | 65.00 | 33.80 ± 5.92 |
| 4 | - | - |
| 5 | - | - |
| 6 | 49.07 | 36.08 ± 5.54 |
| 7 | 58.40 | 37.50 ± 5.33 |
| 8 | 56.65 | 37.60 ± 5.32 |
| 9 | 68.30 | 37.90 ± 5.28 |
| 10 | - | - |
| 11 | - | - |
| 12 | - | - |
| 13 | - | - |
| 14 | - | - |
| 15 | - | - |
Table 8.
Comparison between ground measurements and satellite estimation temperatures in the mud pool “Fangaia”.
Table 8.
Comparison between ground measurements and satellite estimation temperatures in the mud pool “Fangaia”.
| N° Pixel | Ground T (°C) | ASTER T (°C) | L8 T (°C) |
|---|
| 1 | 29.44 | 37.95 ± 5.27 | 34.41 ± 5.81 |
| 2 | 32.74 | 38.74 ± 5.16 | 34.80 ± 5.75 |
| 3 | 34.20 | 36.61 ± 5.46 | 35.67 ± 5.61 |
| 4 | 33.74 | 37.04 ± 5.40 | 36.52 ± 5.48 |
| 5 | 38.97 | 42.00 ± 4.76 | 36.68 ± 5.45 |
| 6 | 39.18 | 35.36 ± 5.66 | 36.63 ± 5.46 |
| 7 | 40.59 | 42.06 ± 4.76 | 36.75 ± 5.44 |
| 8 | 38.53 | 37.44 ± 5.34 | 37.22 ± 5.37 |
Table 9.
ASTER data of 15 July 2014 at 20:45 UTC, temperature measured with a hand-held IR camera and rescaled on ASTER pixel size, percentage of ground measured points falling in the 90 × 90 m ASTER pixel.
Table 9.
ASTER data of 15 July 2014 at 20:45 UTC, temperature measured with a hand-held IR camera and rescaled on ASTER pixel size, percentage of ground measured points falling in the 90 × 90 m ASTER pixel.
| N° Pixel | ASTER T (°C) | Thermal Camera T (°C) | % of Thermal Camera Pixels |
|---|
| 7 | 28.00 | 29.38 | 75 |
| 12 | 26.23 | 26.86 | 100 |
| 13 | 26.13 | 24.71 | 100 |
| 8 | 28.61 | 27.28 | 75 |
Table 10.
Number of satellite (ASTER and L8) images for which the points are the hottest for the La Fossa area.
Table 10.
Number of satellite (ASTER and L8) images for which the points are the hottest for the La Fossa area.
| N° Pixel | ASTER Frequency | L8 Frequency |
|---|
| 7 | 50 | 9 |
| 8 | 35 | - |
| 12 | 55 | 26 |
| 13 | 17 | |
Table 11.
Number of satellite (ASTER and L8) images for which the points are the hottest for “Fangaia” area.
Table 11.
Number of satellite (ASTER and L8) images for which the points are the hottest for “Fangaia” area.
| N° Pixel | ASTER Frequency | L8 Frequency |
|---|
| 5 | 20 | 6 |
| 6 | 45 | 6 |
| 7 | 8 | 5 |
| 8 | 25 | 8 |
Table 12.
Comparison of the mean temperature derived from ATM and ASTER considering the areas of La Fossa crater and “Fangaia”.
Table 12.
Comparison of the mean temperature derived from ATM and ASTER considering the areas of La Fossa crater and “Fangaia”.
| Site | ASTER Mean T (°C)
06/09/2010 | ASTER Mean T (°C)
22/09/2010 | ATM Mean T (°C)
12/09/2010 |
|---|
| La Fossa Crater | 24.90 ± 2.50 | 24.30 ± 2.40 | 28.70 ± 2.80 |
| Fangaia | 26.70 ± 2.70 | 25.70 ± 2.60 | 27.20 ± 2.70 |

 ,
, 


