Assessment of Precipitation Estimation from the NWP Models and Satellite Products for the Spring 2019 Severe Floods in Iran


1
Department of Civil Engineering, Chalous Branch, Islamic Azad University, Chalous 46615/397, Iran
2
Department of Civil Engineering, Science and Research Branch, Islamic Azad University, Tehran 1477893855, Iran
3
Institute of Meteorology and Climatology, University of Natural Resources and Life Sciences (BOKU), Vienna 1180, Austria
4
Department of Meteorology and Geophysics, University of Vienna, Vienna 1090, Austria
*
Author to whom correspondence should be addressed.
Remote Sens. 2019, 11(23), 2741; https://doi.org/10.3390/rs11232741
Submission received: 5 October 2019
/
Revised: 13 November 2019
/
Accepted: 20 November 2019
/
Published: 21 November 2019
(This article belongs to the Special Issue Remote Sensing of Precipitation: Part II)
Abstract
:Precipitation monitoring and early warning systems are required to reduce negative flood impacts. In this study, the performance of ensemble precipitation forecasts of three numerical weather prediction (NWP) models within the THORPEX interactive grand global ensemble (TIGGE) as well as the integrated multi-satellite retrievals for global precipitation measurement (GPM), namely IMERG, for precipitation estimates were evaluated in recent severe floods in Iran over the March–April 2019 period. The evaluations were conducted in three aspects: spatial distribution of precipitation, mean areal precipitation in three major basins hard hit by the floods, and the dichotomous evaluation in four precipitation thresholds (25, 50, 75, and 100 mm per day). The results showed that the United Kingdom Met Office (UKMO) model, in terms of spatial coverage and satellite estimates as well as the precipitation amount, were closer to the observations. Moreover, with regard to mean precipitation at the basin scale, UKMO and European Center for Medium-Range Weather Forecasts (ECMWF) models in the Gorganrud Basin, ECMWF in the Karkheh Basin and UKMO in the Karun Basin performed better than others in flood forecasting. The National Centers for Environmental Forecast (NCEP) model performed well at low precipitation thresholds, while at high thresholds, its performance decreased significantly. On the contrary, the accuracy of IMERG improved when the precipitation threshold increased. The UKMO had better forecasts than the other models at the 100 mm/day precipitation threshold, whereas the ECMWF had acceptable forecasts in all thresholds and was able to forecast precipitation events with a lower false alarm ratio and better detection when compared to other models.
Keywords:
TIGGE; precipitation; numerical weather prediction; satellite; IMERG; flood; spring 2019; Iran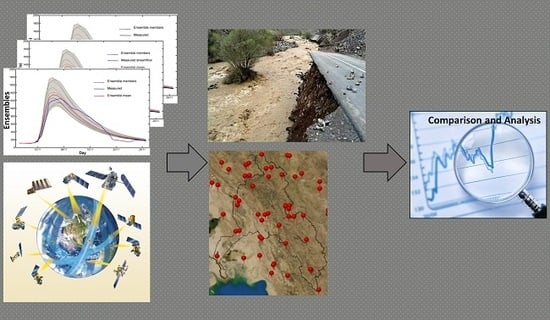
1. Introduction
In recent decades, observed climate trends have shown an increase in temperature worldwide so that extreme precipitation has increased in some specific areas (e.g., eastern half of North America, Eastern Europe, Asia, and South America) [1,2,3,4,5]. Due to rising temperatures, particularly over the Arctic, the sea-ice retreat allows for increased transport of heat and momentum from the ocean up to the tropo- and stratosphere. In the upper atmosphere, these waves deposit the momentum transported, disturbing the stratospheric polar vortex, which can lead to a breakdown of this circulation with the potential to also significantly impact the troposphere in mid- to late-winter and early spring [6,7].
Iran’s climate is generally semi-arid and is subject to frequent flooding, causing major damage to people and society. In spring 2019, major floods occurred almost concurrently in different parts of the country. The first flood event occurred in late winter to early spring 2019 in the northeastern provinces due to heavy precipitation over the March 17–22 period. In at least one station, over 280 mm of precipitation was recorded over the six-day period. The subsequent second and third flood events occurred in the March 24–26 and March 31–April 2 periods, respectively, where most of the precipitation fell in the southwest, causing widespread damage to the people and infrastructure while filling/causing an overflow of most reservoirs. The total economic cost of these floods is estimated to be $3.5 billion U.S. dollars. Studies on the causes of the March–April 2019 severe floods are still ongoing, although exceptional precipitation and climate change attribution are on the minds of most experts.
Given the heavy negative impacts imposed by the 2019 flood events, the monitoring and forecasting of precipitation remain major challenges for hydrologists and reservoir managers. The availability of global ensemble forecast models in the THORPEX Interactive Grand Global Ensemble (TIGGE) database [8] as well as high-resolution satellite estimates creates new opportunities for flood monitoring/forecasting. Extensive research has been conducted on the application of satellite precipitation estimates for motoring purposes and numerical weather prediction (NWP) models for forecast objectives. In terms of the latter, using TIGGE forecasts for a flood alarm system in China [9], flood early warning with European Centre for Medium-Range Weather Forecasts (ECMWF) model forecasts under Global Flood Awareness System (GLoFAS) in global scale, European Flood Awareness System (EFAS) for Europe projects [10], and African Flood Forecasting System (AFFS) [11] are some examples of NWP applications in flood forecasting.
Numerous studies have been conducted to evaluate the estimated precipitation from NWP models and satellite-based precipitation estimates (SPEs). For example, the results of TIGGE precipitation forecasting in flood-prone areas of China showed that the ensemble forecast model is more proficient than the single forecast models [12]. He et al. [13] showed that TIGGE ensemble forecasts are suitable for forecasting flood events. The rapid alert system was developed from four operational NWP models: UKMO (United Kingdom Met Office), NCEP (National Centers for Environmental Forecast), ECMWF, and JMA (Japan Meteorological Agency). The probability of severe weather events was forecasted based on the climatological probability density function in each model. Numerous case studies have shown that these products successfully forecasted severe events such as the Russian heat wave in 2010, the Pakistan flood in 2010, and Hurricane Sandy in 2012 [14]. In West Africa, evaluating the forecasts of seven TIGGE meteorological databases against the Tropical Precipitation Measuring Mission (TRMM) Multi-satellite Precipitation Analysis (TMPA) product assumed as the observed precipitation over the 2008 to 2012 period showed that ECMWF and UKMO performed better than the other models [15]. In Iran, the forecasts of ECMWF, UKMO, and NCEP centers for thirteen synoptic stations in eight different precipitation regions over a 1–3 day lead time over the 2008 to 2016 period showed that ECMWF in most regions, UKMO in mountainous areas, and NCEP along the Persian Gulf coast performed the best, while, as expected, the model skill decreased with increasing lead time [16].
The accuracy of SPEs is influenced by their spatiotemporal resolution, which in turn impacts the prediction of natural hazards. Therefore, the assessment of new precipitation products is often recommended before the product can be employed in research and decision-making. Several studies have been conducted to evaluate the SPEs over Iran. Moazzami et al. [17] and Javanmard et al. [18] examined different SPEs products at a daily time-scale over diverse climate conditions in Iran. Overall, the results showed that 3B42V7 outperformed other SPEs. Sharifi et al. [19] evaluated the first version of the integrated multi-satellite retrievals for global precipitation measurement (IMERG) version-03 in comparison with the TMPA and ERA-Interim products across different parts of Iran and found that IMERG generally outperformed the other products. They later improved the spatial resolution and accuracy of the SPEs through downscaling and bias-correction techniques [20,21]. In another study, Beck et al. [22] evaluated 26 precipitation datasets and compared them with gauge-radar data over the United States. Among the gauge-corrected products, the best overall performance was obtained by Multi-Source Weighted-Ensemble Precipitation (MSWEP)-V2.2, followed by IMERGDF-V05 and MERRA-2. However, IMERG real-time V05 performed substantially better than TMPA-3B42-real-time V7 and ERA5-HRES, particularly, in regions dominated by convective storms. In another study, Sharifi et al. [23] examined the accuracy of six SPEs and gridded precipitation models against a dense network of 872 stations over Austria, in terms of extreme events and different altitude categories. They also found that the latest version of IMERG-V06A performed better than the other products (except MSWEP-2.2), which was consistent with the study results by Beck et al. [22]. With respect to extreme precipitation events, Fang et al. indicated that although IMERG well captured the spatial pattern of extreme precipitation over China, the topography and climate condition had a significant influence on its performance [24]. In another study, Sunikumar et al. demonstrated the ability of IMERG to follow the intraseasonal variability with minor differences observed in the maximum values of precipitation during the rainy season over Japan, Philippines, and Nepal [25]. Mazzoglio et al. improved an extreme precipitation detection system using IMERG data and stated that this product guarantees good results when the precipitation aggregation interval is equal to or greater than 12 h [26]. However, no comparison has been made so far between the ensemble forecasts with IMERG product for extreme flood events over Iran.
The purpose of this study was to evaluate the performance of ensemble precipitation forecasting models and IMERG products for three severe 2019 flood events in Iran to determine whether these products have potential in (major) flood warning applications over Iran. According to ground precipitation data, the highest precipitation occurred in Gorganrud, Karkheh, and Karun Basins. These three basins constitute the study area.
2. Data and Methods
Daily in situ accumulated precipitation data from 100 meteorological synoptic stations and 221 Ministry of Energy rain gauges between 15 March 2019 to 2 April 2019 were collected. The collected data have been quality controlled by the respective organization. Ensemble precipitation forecasts of three major global meteorological centers, namely ECMWF, NCEP and UKMO, were then extracted from the TIGGE database in a 24-h lead time (https://confluence.ecmwf.int/display/TIGGE). TIGGE is part of the THORPEX project, which includes ensemble forecasts of 11 NWP world centers. Ensemble forecasts include multiple individual forecasts generated by different physical parameterizations or different initial conditions. Based on the results of NWP evaluation in several studies, the three selected models performed better than the others in different regions of Iran/the world [9,27]. As a result, the NCEP, UKMO, and ECMWF models were evaluated as numerical forecasts in this study. The NWP data are in the GRIB2 format with a resolution of 50 km. Furthermore, daily IMERG-V06B-RT satellite estimates with an approximate 10-km spatial resolution for the whole of Iran were downloaded in NetCDF format for the study time period. Figure 1 shows the spatial distribution of the in situ observations overlaid on the elevation map. Table 1 shows the characteristics of the three NWP models and IMERG product.
In this study, the evaluations were conducted in three steps. In the first step, the performance of the three NWP models and SPEs in terms of capturing the spatial distribution of precipitation for the three flood events (17–22 March, 24–26 March, and 31 March to 2 April 2019, respectively) were compared. The numerical forecast and SPE data have a 50 × 50 km and ~10 × 10 km spatial resolution, respectively. Therefore, spatial aggregation from 10 km to 50 km was performed using the cubic convolution resampling method, which is based on the weighted average of 16 nearest neighboring pixels [28]. An in situ observation map was also constructed using inverse distance weighting (IDW) interpolation with a 50 × 50 km resolution. Moreover, for a more robust comparison of the spatial distribution of precipitation, the isohyet contours over the three respective basins for all three flood events were obtained.
For detailed insight into the second step, the mean, maximum, and minimum precipitation values for each individual event were also determined.
In the third step, the NWP forecasts and satellite data were interpolated with the aim of a direct comparison of precipitation with the in situ measurements. The IDW method used for interpolation involved four grid-points around each station. Then the interpolated precipitation at each station was evaluated against the observation. The dichotomous (yes/no) evaluation of daily precipitation was further examined. For this purpose, 25, 50, 75, and 100 mm/day thresholds were set and the number of correct events determined by the satellite and NWP models in each threshold were compared. Precipitation events were counted if at least one of the stations operating in each basin recorded precipitation. Otherwise, if none of the stations recorded precipitation, a “no-precipitation” event was assigned to the whole basin. Accordingly, the probability of detection (POD) and false alarm ratio (FAR) as well as the equitable threat score (ETS) criterion were used to examine the capability of the products to detect the precipitation events. POD and ETS values vary between 0 to 1, with 1 as a perfect score, while the FAR perfect score is 0. In addition, the average results of the dichotomous evaluation of the stations in each basin were calculated in four precipitation thresholds. Interested readers are referred to Wilks (2011) for further detail on the dichotomous (yes/no) evaluation [29]. Table 2 indicates the metrics used to measure the effectiveness of precipitation estimations.
It should be noted that the evaluations of the first and second step were based on the total precipitation in each flood event. To clarify this, the first precipitation/flood event consisted of the precipitation accumulation of six days from 17 March to 22 March 2019; the second event in three days from 24 March to 26 March 2019; and the third event in three days from 31 March to 2 April 2019. A tertiary evaluation for the daily accumulation precipitations from 15 March to 2 April 2019 was conducted.
3. Results
By presenting the results, this section provides insights into where the model/satellite systematically differ and discusses the possible causes.
Spatial distribution of precipitation accumulation during the flood days (15 March to 2 April 2019) corresponding to the in situ observations, satellite, and three NWP models are shown in Figure 2. It is clear that high precipitation areas extended from the northeast along the Alborz Mountains to the southeastern Caspian Sea; and from the west to southwest along the Zagros Mountains. Overall, the precipitation spatial patterns in all products were correctly captured, although there were differences in the precipitation magnitude among the products. In more specific terms, IMERG precipitation product (IMERG-RT V05) reasonably captured the precipitation distribution for most parts of the country when compared with the in situ observations. Moreover, the in situ observations highlighted four precipitation hotspots along the Zagros Mountain in the west of Iran with the largest precipitation amount. IMERG outperformed the other products to capture these hotspots. The remarkable precipitation gradients were well-captured by IMERG, possibly due to its native higher spatial IMERG resolution (~10 km × ~10 km) when compared with those of the NWP models (50 km × 50 km). Among the NWP models, the NCEP model forecasted much lower precipitation, while UKMO generally overestimated the in situ observations. In general, most of the precipitation products could capture the basic precipitation characteristics in terms of the observed spatial pattern, however, it is unknown as to whether the overestimation/underestimation was really derived by the product structure or if it was due to lack of dense in situ observations. It should be noted that the mean of the ensemble NWP forecasts was used in Figure 2.
3.1. Spatial Distribution of Precipitation
In this section, the differences between the in situ observations and NWP/satellite are shown with a 50 km spatial resolution in Figure 3. In the first flood event in northeastern Iran, the UKMO model outperformed other models and indicated lower precipitation differences with the observations. Moreover, the NCEP underestimated the extreme precipitation over the southeast of the Caspian Sea, while IMERG displayed differences over the southeast and no difference over the southwest part of the Caspian Sea. In the second flood event in western and southwestern Iran, the ECMWF outperformed other products. The NCEP performed better in this flood event than it did in the first flood event. However, all models/satellite, especially UKMO, generally overestimated the precipitation amount. In the third flood event in western Iran, IMERG reasonably captured the spatial precipitation for most parts of the region, except in a few pixels in the west. In addition, IMERG indicated a smoother trend in precipitation differences from the northwest to the eastern part of Iran, while it is evident that other products had larger errors in terms of the difference with the in situ observations.
Table 3 presents the quantitative evaluation of precipitation products. Based on this table, during the first flood event, ECMWF and IMERG were closer to the in situ observation data with respect to the Correlation Coefficient (CC) and maximum precipitation amount. Although the NCEP showed the least correlation in the first event, this model indicated relatively close forecasts to the observations for the second and third events. In general, the ECMWF showed slightly better skill in terms of the correlation, min, and max values of precipitation in comparison with the other products (Table 3).
For a more in-depth evaluation of the spatial pattern, the isohyet contours indicate that for the first flood event, which mostly impacted the Gorganrud Basin in northeast Iran, the UKMO and ECMWF models performed similarly, whereas the UKMO model better forecasted the location of heavy precipitation, followed by the satellite (IMERG). The NCEP model, although recognizing the location of heavy precipitation, underestimated the amount of heavy precipitation (Figure 4).
According to Figure 5 for the second flood event, the UKMO in the Karkheh Basin yielded better results in comparison with other products in the detection of heavy precipitation. In the Karun Basin, although the UKMO and IMERG products overestimated precipitation, they generally demonstrated better skills than the other two NWP models. The NCEP model in the southeast of the Karun Basin better forecasted heavy precipitation than the other products. With respect to the third flood event in the Karkheh Basin, the UKMO and IMERG showed better performance in the detection of the location of heavy precipitation. In the Karun Basin, although all products showed acceptable performance, the UKMO and ECMWF models outperformed the other products (Figure 6).
3.2. Mean, Minimum and Maximum Basin Precipitation
In order to compare the performances of the precipitation products in each individual basin within the three flood events that occurred from March to April 2019, the mean, minimum, and maximum precipitations were plotted, as shown in Figure 7. The first flood event occurred in the Gorganrud Basin in northeastern Iran. As Figure 7a shows, in terms of mean, maximum, and minimum precipitation, the ECMWF and UKMO models performed approximately the same and well forecasted the min, max, and mean of precipitation. The NCEP model also forecasted less precipitation than the observations with respect to mean precipitation. However, the maximum in situ observations in this basin was higher than all the NWP and IMERG satellite products. Although all evaluated precipitation products were rather close to the in situ measurements, it is evident that ECMWF and UKMO, followed by IMERG, compared well with the corresponding in situ measurements in terms of mean precipitation through the first event.
Figure 7b shows the mean, min, and max value of precipitation obtained from all products and in situ observations over the southwest of Iran within the Karkheh and Karun Basins. The mean precipitation values indicated that generally all of the models and satellite well estimated the mean areal precipitation with a slight underestimation during this event over the Karkheh Basin. However, in terms of maximum precipitation, the UKMO overestimated, while the satellite and other models showed underestimation over the Karkheh Basin during the second flood event. This might be due to high moisture in the atmosphere and the occurrence of small scale precipitation systems that were dominant during this event [23]. Additionally, from the median and the 25th and 75th percentiles of the box-plots, one can infer that the precipitation estimated by IMERG, followed by ECMWF, was more accurate than the other products in both basins, while the UKMO whiskers extended to the highest extreme data points in comparison to the other products.
According to Figure 7c, the mean areal precipitation values of all products were rather close to the in situ observations over the Karkheh Basin, while the box-plots confirmed that the IMERG and NCEP values were in a larger and smaller precipitation ranges in comparison to the in situ observations, respectively. However, in the Karun Basin, the UKMO greatly overestimated the precipitation, while IMERG, followed by NCEP, showed improvement in heavy daily precipitation in comparison with the in situ observations.
3.3. Dichotomous Evaluation
With respect to dichotomous evaluation, Figure 8 compares the number of 24-h extreme precipitation events recorded at all stations in different precipitation thresholds. As the main emphasis of this study was on the evaluation of extreme events, the maximum of ensemble forecasts was carefully determined. Based on Figure 8, at a threshold of 25 mm, NWP models estimated precipitation better than IMERG, while among the NWP models, ECMWF was closer to in situ observations. However, all products underestimated the number of events above 25 mm. At the 50 mm threshold, the UKMO predictions of the number of events were closer to the observations. However, in terms of mean ensemble forecast, IMERG estimated the number of events closer to the observations than the NWP models. It is worth noting that the performance of the NCEP model decreased significantly with an increase in the threshold. At the 75 mm threshold, UKMO was better than the other products, whereas NCEP had difficulty in forecasting the precipitation amount at this threshold. From 15 March 2019 to 2 April 2019, precipitation amounts of over 100 mm were reported for a number of days. At this threshold, in situ observations recorded 22 events, while NCEP detected none. However, the UKMO and ECMWF maximum ensembles as well as IMERG detected 11, 10, and 4 events, respectively.
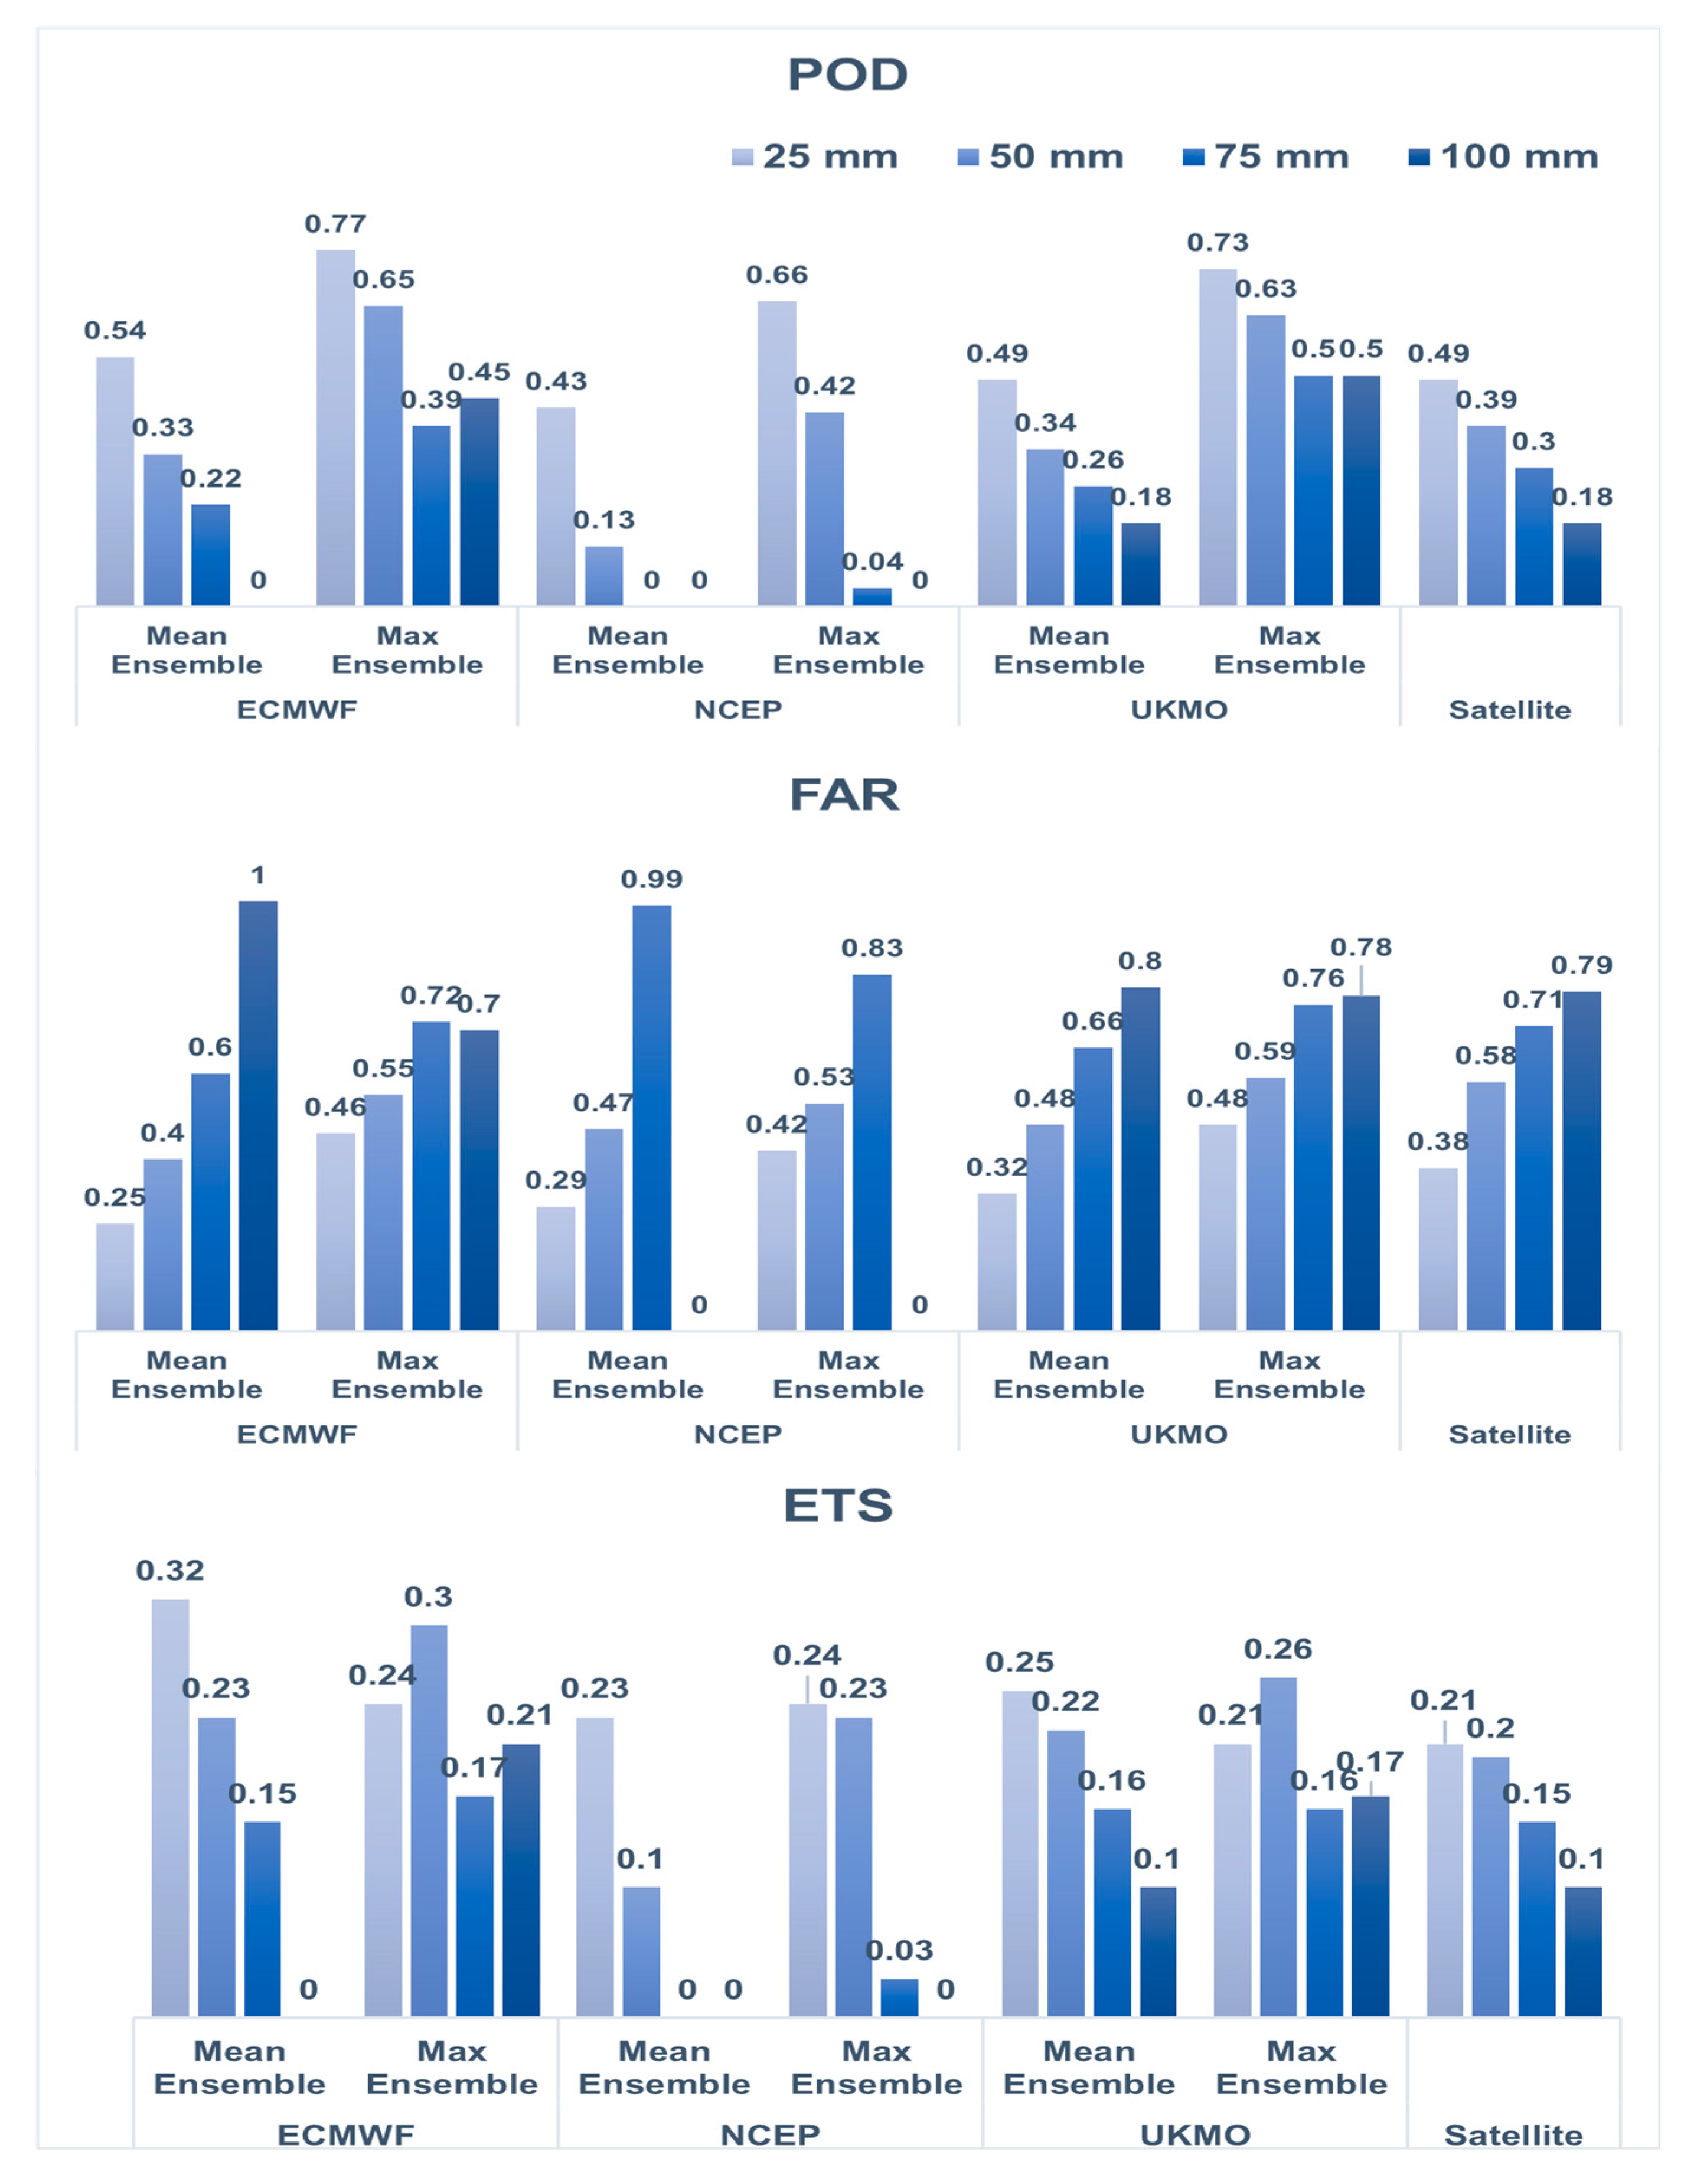
The performance of all precipitation products was then evaluated using dichotomous evaluation criteria (Figure 9). Based on the POD metric, which measures the percentage of the accurate detection of events, the ECMWF in the 25 mm threshold and the UKMO in 50, 75, and 100 mm thresholds showed the highest PODs over Iran. The decline in the performance of NCEP with an increase in the threshold is clearly evident in this criterion. However, based on the FAR metric, which expresses the percentage of false alarms, ECMWF obtained the lowest FAR in maximum ensemble forecasts within all thresholds, although it did not perform well in high thresholds in the mean ensemble forecast mode. Based on the ETS, which measures the forecast quality of detecting occurrence and non-occurrence of an event, the mean ensemble forecast of the ECMWF model achieved the best score in the 25 mm threshold. In the other thresholds, the maximum ensemble forecast of the ECMWF model achieved the highest ETS scores.
Finally, the evaluation with respect to the number of events estimated by the precipitation products at different thresholds was conducted. According to Figure 10, in Gorganrud basin in 25 mm threshold, both UKMO and ECMWF models performed well. Satellite (IMERG) and NCEP obtained rather similar performances with the detection of seven events among the 13 events in these thresholds, while the ECMWF and UKMO performances were more robust and closer to the in situ observations with the detection of 12 events. In the 50 mm threshold, both ECMWF and UKMO still performed better than the other products with the detection of seven events among the 11 events detected by the in situ observations, while the skill of NCEP declined and IMERG showed an improvement with the detection of two and six events, respectively. At a threshold of 75 mm, both ECMWF and UKMO models performed well and could forecast almost 80% of events (five out of seven events) in the 75 mm threshold. The NCEP model did not record any event and IMERG estimated only one event out of seven events. In the 100 mm threshold, both ECMWF and UKMO forecasted five events out of six events above 100 mm. The satellite and NCEP model were weak in this segment and did not estimate any events in northeast Iran in the Gorganroud Basin.
In the Karkheh Basin, the NCEP model performed well in the 25 mm threshold and was able to estimate the number of events better than the other products. However, the performance of NCEP decreased dramatically with an increase in the threshold (e.g., in the 75 mm (100 mm) threshold only one (zero) event out of 15 (5) events were forecasted). Meanwhile, IMERG performed better at higher thresholds. Generally, the ECMWF revealed better results than the other products in all precipitation categories.
In Karun Basin, NCEP again performed better at lower thresholds than at higher thresholds, whereas UKMO was slightly better than ECMWF. However, extreme precipitation greater than 100 mm was only recorded once in this basin.
4. Discussion
In this study, the evaluation of three precipitation forecast models, namely ECMWF, NCEP, and UKMO as well as the IMERG-RT V05B satellite product provided new insight into how errors vary with extreme precipitation events within different climate zones of Iran. Overall, the examined products in this study sometimes agreed well with in situ observations while in some other instances, showed significant differences. As far as possible causes for model performances, precipitation is a function of available atmospheric moisture while derived from moisture convergence. Thus, the models need to be correctly initialized and parameterized through several factors such as (i) gross condensation rate, (ii) latent heat energy exchange within the atmosphere, and (iii) the microphysical behavior of clouds [30]. However, individual clouds typically occur at subgrid scales and must be parameterized based on resolved variables such as average humidity and temperature [31]. The parameterization of cloud, and thus precipitation, continues to be one of the greatest sources of uncertainty in NWP models [32].
Another is the significant differences in the detection of extreme precipitation amounts among the products when compared with the in situ observations. Although, in general, the models captured the spatial distribution of heavy precipitation events, the hot spots were not located in the correct area. Moreover, orography and local effects can affect the accuracy of the products. These issues should be addressed by improving the models’ algorithms [33].
Another factor in the interpretation of the differences between the model/satellite products and in situ observations might be related to the precipitation thresholds. As such, overestimation or underestimation in each precipitation threshold means that a given precipitation product was not able to estimate/detect precipitation within that particular threshold, while they could have estimated/detected the precipitation within a lower or higher threshold.
5. Conclusions
In this study, the performance of ensemble precipitation forecasts of three NWP models within the TIGGE database, namely ECMWF, NCEP, and UKMO, and a satellite-based precipitation product, IMERG, for three severe flood events in Iran in March–April 2019 period were evaluated. In the first step, the performance of the precipitation products in capturing the spatial distribution of precipitation was evaluated. The results showed that all of the products could generally capture the main features of the precipitation system, including the spatial distribution, total accumulation, and extreme values (Figure 2). In general, UKMO, followed by IMERG and ECMWF, showed better performance than other products in capturing the spatial distribution of the accumulated precipitation during the 19 days of extreme precipitation events over Iran. However, the in situ observations identified four precipitation hotspots along the Zagros Mountain in western Iran with the largest precipitation amount; IMERG outperformed other products to capture these hotspots.
In the second step, all of the products were examined in comparison with the in situ observations in three major basins that were most affected by the floods. It was evident that ECMWF and UKMO, followed by IMERG, compared well with the corresponding in situ measurements in terms of mean precipitation through the first event in the Gorganrud Basin (Figure 7a). With respect to the second flood event, the box-plots indicated that IMERG, followed by ECMWF, outperformed other products in both the Karkheh and Karun Basins, while the UKMO whiskers extended to the most extreme data points (Figure 7b). In the third flood event, the mean areal precipitation values of all products were rather close to in situ observations over the Karkheh Basin, while box-plots confirmed that the IMERG pixels were in a larger range in comparison with the observations. However, almost all products overestimated the precipitation over the Karkheh and Karun Basins (Figure 7c).
In the third evaluation step, four daily precipitation thresholds of 25 mm, 50 mm, 75 mm, and 100 mm were selected to evaluate the skill of the products in capturing precipitation within the specified thresholds via dichotomous evaluation methods. The results showed that when the threshold was increased, the performance of the NCEP model was greatly reduced, while the IMERG estimates improved at higher thresholds. At the 50 mm threshold, UKMO predicted a closer number of events in comparison with the observations. At the 75 mm threshold, UKMO revealed better results than the other products, whereas NCEP had difficulty in forecasting the precipitation amount at this threshold. At the 100 mm threshold, the in situ observations recorded 22 events, while NCEP detected none. The maximum ensemble forecasts of UKMO in higher thresholds could estimate a larger number of precipitation events than other models and the satellite. As such, UKMO detected 11 out of 22 events (Figure 8). However, in terms of the contingency table, ECMWF outperformed other products with a higher POD and lower FAR (Figure 9).
Overall, the results of this study show that the IMERG precipitation estimates and NWP ensemble forecasts performed well in the three major flood events in spring 2019 in Iran. Given the widespread damage caused by the floods, the necessity of establishing an efficient flood warning system using the best precipitation products is advised.
The overestimation/underestimation of precipitation by forecast models and satellite-based precipitation products still remains a challenge, particularly for extreme precipitation events. Short-time and extreme precipitation events are much more variable than moderate precipitation events. However, studies on the impact of the uncertainty of precipitation products are needed to obtain a better understanding of how and why precipitation products succeed or fail in the detection of heavy precipitation. Moreover, it is important to note that this study was conducted based on a short period of data (i.e., 19 precipitation days containing three severe flood events) limited to Iran. Thus, further studies using a longer dataset at the global scale in different climate regimes/geophysical features is essential to assess the impacts of the aforementioned limitations.
Author Contributions
Conceptualization: S.A., B.S. and E.S.; Methodology: B.S., S.A. and E.S.; Analysis: S.A. and E.S.; Writing—original draft: S.A. and E.S.; Writing—review and editing: B.S., S.A. and E.S.; Supervision: B.S.
Funding
This research received no external funding.
Acknowledgments
The open access publishing was supported by the BOKU Vienna Open Access Publishing Fund.
Conflicts of Interest
The authors declare no conflicts of interest.
References
- Wehner, M.F.; Arnold, J.R.; Knutson, T.; Kunkel, K.E.; LeGrande, A.N. Ch. 8: Droughts, Floods, and Wildfires. In Climate Science Special Report: Fourth National Climate Assessment; U.S. Global Change Research Program: Washington, DC, USA, 2017; Volume I. [Google Scholar]
- Sein, K.K.; Chidthaisong, A.; Oo, A.K.L. Observed Trends and Changes in Temperature and Precipitation Extreme Indices over Myanmar. Atmosphere 2018, 9, 477. [Google Scholar] [CrossRef]
- Alexander, L.V.; Zhang, X.; Peterson, T.C.; Caesar, J.; Gleason, B.; Klein Tank, A.M.G.; Haylock, M.; Collins, D.; Trewin, B.; Rahimzadeh, F.; et al. Global observed changes in daily climate extremes of temperature and precipitation. J. Geophys. Res. 2006, 111. [Google Scholar] [CrossRef]
- Easterling, D.R. Maximum and Minimum Temperature Trends for the Globe. Science 1997, 277, 364–367. [Google Scholar] [CrossRef]
- Kiktev, D.; Sexton, D.M.H.; Alexander, L.; Folland, C.K. Comparison of Modeled and Observed Trends in Indices of Daily Climate Extremes. J. Clim. 2003, 16, 3560–3571. [Google Scholar] [CrossRef]
- Romanowsky, E.; Handorf, D.; Jaiser, R.; Wohltmann, I.; Dorn, W.; Ukita, J.; Cohen, J.; Dethloff, K.; Rex, M. The role of stratospheric ozone for Arctic-midlatitude linkages. Sci. Rep. 2019, 9, 7962. [Google Scholar] [CrossRef] [PubMed]
- Francis, J.A.; Vavrus, S.J. Evidence linking Arctic amplification to extreme weather in mid-latitudes. Geophys. Res. Lett. 2012, 39. [Google Scholar] [CrossRef]
- Swinbank, R.; Kyouda, M.; Buchanan, P.; Froude, L.; Hamill, T.M.; Hewson, T.D.; Keller, J.H.; Matsueda, M.; Methven, J.; Pappenberger, F.; et al. The TIGGE Project and Its Achievements. Bull. Am. Meteorol. Soc. 2016, 97, 49–67. [Google Scholar] [CrossRef]
- He, Y.; Wetterhall, F.; Cloke, H.L.; Pappenberger, F.; Wilson, M.; Freer, J.; McGregor, G. Tracking the uncertainty in flood alerts driven by grand ensemble weather predictions. Meteorol. Appl. 2009, 16, 91–101. [Google Scholar] [CrossRef]
- Thielen, J.; Bartholmes, J.; Ramos, M.-H.; Roo, A.D. The European Flood Alert System—Part 1: Concept and development. Hydrol. Earth Syst. Sci. 2009, 13, 125–140. [Google Scholar] [CrossRef]
- Thiemig, V.; Bisselink, B.; Pappenberger, F.; Thielen, J. A pan-African medium-range ensemble flood forecast system. Hydrol. Earth Sys. Sci. 2015, 19, 3365–3385. [Google Scholar] [CrossRef]
- Krishnamurti, T.N.; Sagadevan, A.D.; Chakraborty, A.; Mishra, A.K.; Simon, A. Improving multimodel weather forecast of monsoon rain over China using FSU superensemble. Adv. Atmos. Sci. 2009, 26, 813–839. [Google Scholar] [CrossRef]
- He, Y.; Wetterhall, F.; Bao, H.; Cloke, H.; Li, Z.; Pappenberger, F.; Hu, Y.; Manful, D.; Huang, Y. Ensemble forecasting using TIGGE for the July-September 2008 floods in the Upper Huai catchment: A case study. Atmos. Sci. Lett. 2010, 11, 132–138. [Google Scholar] [CrossRef]
- Matsueda, M.; Nakazawa, T. Early warning products for severe weather events derived from operational medium-range ensemble forecasts. Meteorol. Appl. 2015, 22, 213–222. [Google Scholar] [CrossRef]
- Louvet, S.; Sultan, B.; Janicot, S.; Kamsu-Tamo, P.H.; Ndiaye, O. Evaluation of TIGGE precipitation forecasts over West Africa at intraseasonal timescale. Clim. Dyn. 2016, 47, 31–47. [Google Scholar] [CrossRef]
- Aminyavari, S.; Saghafian, B.; Delavar, M. Evaluation of TIGGE Ensemble Forecasts of Precipitation in Distinct Climate Regions in Iran. Adv. Atmos. Sci. 2018, 35, 457–468. [Google Scholar] [CrossRef]
- Moazami, S.; Golian, S.; Hong, Y.; Sheng, C.; Kavianpour, M.R. Comprehensive evaluation of four high-resolution satellite precipitation products under diverse climate conditions in Iran. Hydrol. Sci. J. 2015, 61, 420–440. [Google Scholar] [CrossRef]
- Javanmard, S.; Yatagai, A.; Nodzu, M.I.; BodaghJamali, J.; Kawamoto, H. Comparing high-resolution gridded precipitation data with satellite rainfall estimates of TRMM_3B42 over Iran. Adv. Geosci. 2010, 25, 119–125. [Google Scholar] [CrossRef]
- Sharifi, E.; Steinacker, R.; Saghafian, B. Assessment of GPM-IMERG and Other Precipitation Products against Gauge Data under Different Topographic and Climatic Conditions in Iran: Preliminary Results. Remote Sens. 2016, 8, 135. [Google Scholar] [CrossRef]
- Sharifi, E.; Saghafian, B.; Steinacker, R. Downscaling Satellite Precipitation Estimates With Multiple Linear Regression, Artificial Neural Networks, and Spline Interpolation Techniques. J. Geophys. Res. Atmos. 2019, 124, 789–805. [Google Scholar] [CrossRef]
- Sharifi, E.; Saghafian, B.; Steinacker, R. Copula-based stochastic uncertainty analysis of satellite precipitation products. J. Hydrol. 2019, 570, 739–754. [Google Scholar] [CrossRef]
- Beck, H.E.; Wood, E.F.; Pan, M.; Fisher, C.K.; Miralles, D.G.; van Dijk, A.I.J.M.; McVicar, T.R.; Adler, R.F. MSWEP V2 Global 3-Hourly 0.1° Precipitation: Methodology and Quantitative Assessment. Bull. Am. Meteorol. Soc. 2019, 100, 473–500. [Google Scholar] [CrossRef]
- Sharifi, E.; Eitzinger, J.; Dorigo, W. Performance of the State-Of-The-Art Gridded Precipitation Products over Mountainous Terrain: A Regional Study over Austria. Remote Sens. 2019, 11, 2018. [Google Scholar] [CrossRef]
- Fang, J.; Yang, W.; Luan, Y.; Du, J.; Lin, A.; Zhao, L. Evaluation of the TRMM 3B42 and GPM IMERG products for extreme precipitation analysis over China. Atmos. Res. 2019, 223, 24–38. [Google Scholar] [CrossRef]
- Sunilkumar, K.; Yatagai, A.; Masuda, M. Preliminary Evaluation of GPM-IMERG Rainfall Estimates Over Three Distinct Climate Zones With APHRODITE. Earth Space Sci. 2019, 6, 1321–1335. [Google Scholar] [CrossRef]
- Mazzoglio, P.; Laio, F.; Balbo, S.; Boccardo, P.; Disabato, F. Improving an Extreme Rainfall Detection System with GPM IMERG data. Remote Sens. 2019, 11, 677. [Google Scholar] [CrossRef]
- Tao, Y.; Duan, Q.; Ye, A.; Gong, W.; Di, Z.; Xiao, M.; Hsu, K. An evaluation of post-processed TIGGE multimodel ensemble precipitation forecast in the Huai river basin. J. Hydrol. 2014, 519, 2890–2905. [Google Scholar] [CrossRef]
- Gebregiorgis, A.S.; Kirstetter, P.-E.; Hong, Y.E.; Gourley, J.J.; Huffman, G.J.; Petersen, W.A.; Xue, X.; Schwaller, M.R. To What Extent is the Day 1 GPM IMERG Satellite Precipitation Estimate Improved as Compared to TRMM TMPA-RT? J. Geophys. Res. Atmos. 2018, 123, 1694–1707. [Google Scholar] [CrossRef]
- Wilks, D.S. Statistical Methods in the Atmospheric Sciences, 3rd ed.; Oxford Academic: New York, NY, USA, 2011; ISBN 9780123850225. [Google Scholar]
- McGuffie, K.; Henderson-Sellers, A. The Climate Modelling Primer, 4th ed.; Wiley-Blackwell: Chichester, UK, 2014; ISBN 9781119943365. [Google Scholar]
- Trenberth, K.E. Climate Diagnostics from Global Analyses: Conservation of Mass in ECMWF Analyses. J. Clim. 1991, 4, 707–722. [Google Scholar] [CrossRef]
- Kidd, C.; Dawkins, E.; Huffman, G. Comparison of Precipitation Derived from the ECMWF Operational Forecast Model and Satellite Precipitation Datasets. J. Hydrometeorol. 2013, 14, 1463–1482. [Google Scholar] [CrossRef]
- Wang, J.; Wang, H.-J.; Hong, Y. Comparison of satellite-estimated and model-forecasted rainfall data during a deadly debris-flow event in Zhouqu, Northwest China. Atmos. Ocean. Sci. Lett. 2016, 9, 139–145. [Google Scholar] [CrossRef] [Green Version]
Figure 1.
The spatial distribution of in situ observations on the elevation map of Iran.

Figure 2.
Spatial distribution of accumulated precipitation (mm) from the observational, ECMWF, NCEP, UKMO, and IMERG satellite for 19 precipitation days over Iran.
Figure 2.
Spatial distribution of accumulated precipitation (mm) from the observational, ECMWF, NCEP, UKMO, and IMERG satellite for 19 precipitation days over Iran.

Figure 3.
Differences between the accumulated precipitation in situ observations, NWP, and IMERG satellite data.
Figure 3.
Differences between the accumulated precipitation in situ observations, NWP, and IMERG satellite data.

Figure 4.
Isohyet contours in the Gorganrud Basin during the first flood event.

Figure 5.
Isohyet contours in the Karkheh (top) and Karun (bottom) Basins during the second flood event.
Figure 5.
Isohyet contours in the Karkheh (top) and Karun (bottom) Basins during the second flood event.

Figure 6.
Isohyet contours in Karkheh (top) and the Karun (bottom) Basins during the third flood event.
Figure 6.
Isohyet contours in Karkheh (top) and the Karun (bottom) Basins during the third flood event.

Figure 7.
Mean, maximum, minimum precipitation amounts and box-plots in the (a) Gorganrud, Karkheh, and Karun Basins for the a) first, (b) second, and (c) third flood events. The center-line of each boxplot depicts the median value (50th percentile) and the box encompasses the 25th and 75th percentiles of the sample data, while the whiskers represent the extreme values, respectively.

Figure 8.
Comparison of the number of extreme events estimated by the NWP models and IMERG satellite with observations in different precipitation thresholds.
Figure 8.
Comparison of the number of extreme events estimated by the NWP models and IMERG satellite with observations in different precipitation thresholds.

Figure 9.
Verification statistics (POD, FAR, and ETS) between ECMWF, NCEP, UKMO, IMERG, and the in situ observations for different thresholds over Iran for 15 March 2019 to 2 April 2019.
Figure 9.
Verification statistics (POD, FAR, and ETS) between ECMWF, NCEP, UKMO, IMERG, and the in situ observations for different thresholds over Iran for 15 March 2019 to 2 April 2019.

Figure 10.
Comparison of the number of extreme events estimated by ECMWF, NCEP, UKMO, and IMERG with in situ observations.
Figure 10.
Comparison of the number of extreme events estimated by ECMWF, NCEP, UKMO, and IMERG with in situ observations.


Table 1.
Characteristics of the studied NWP models and IMERG satellite.
| Products | Base Time (UTC) | No. of Ensemble Members | Spatial Resolution | Temporal Resolution | Forecast Length (day) |
|---|---|---|---|---|---|
| ECMWF | 00/12 | 50 + 1 | ~0.28° × (~0.56°) | 6 h | 0–15 |
| NCEP | 00/06/12/18 | 20 + 1 | 1.0° × 1.0° | 6 h | 0–16 |
| UKMO | 00/12 | 17 + 1 | 0.83° × 0.56° | 6 h | 0–15 |
| IMERG | ---- | ---- | 0.1° × 0.1° | 30 min | ---- |
Table 2.
Summary of the assessment criteria used in this study [27].
Table 2.
Summary of the assessment criteria used in this study [27].
| Verification Measure | Formula | Description | Perfect/no Skill |
|---|---|---|---|
| Pearson’s correlation coefficient | Linear dependency between forecast and observation | 1/0 | |
| Probability of detection (Hit Rate) | POD = A/(A + C) | What fraction of the observed “yes” events were correctly forecasted? | 1/0 |
| False alarm ratio | FAR = B/(B + C) | What fraction of the predicted “yes” events actually did not occur | 0/1 |
| Equitable threat score | ETS = (A − Arandom)/(A + B + C − Arandom) Arandom = (A + C)(A + B)/N | How well did the forecasted “yes” events correspond to the observed “yes” events? | 1/0 |
Notes: F and O denote the forecast and corresponding observation, respectively. Similarly, and denote the forecast average and observation average, respectively. A, B, C, and D were obtained from the contingency table.
Table 3.
Statistical characteristics of the observations, NWP, and IMERG satellite precipitation data.
Table 3.
Statistical characteristics of the observations, NWP, and IMERG satellite precipitation data.
| MEAN (mm) | MAX (mm) | STD (mm) | Correlation | ||
|---|---|---|---|---|---|
| Flood event 1 | Observation | 18.38 | 237 | 21.1 | --- |
| ECMWF | 18.24 | 168 | 20.84 | 0.8 | |
| UKMO | 18.02 | 177 | 22.1 | 0.77 | |
| NCEP | 13.65 | 101 | 12.2 | 0.73 | |
| IMERG | 15.34 | 191 | 20.68 | 0.73 | |
| Flood event 2 | Observation | 24.64 | 208 | 27.3 | --- |
| ECMWF | 25.12 | 239 | 29.62 | 0.82 | |
| UKMO | 26.13 | 298 | 38.16 | 0.72 | |
| NCEP | 21.85 | 161 | 24.37 | 0.85 | |
| IMERG | 31.6 | 240 | 30.73 | 0.79 | |
| Flood event 3 | Observation | 15.15 | 197 | 26.14 | --- |
| ECMWF | 14.73 | 173 | 25.88 | 0.87 | |
| UKMO | 15.53 | 194 | 27.13 | 0.78 | |
| NCEP | 13.39 | 113 | 23.42 | 0.87 | |
| IMERG | 20.67 | 298 | 31.77 | 0.85 |
© 2019 by the authors. Licensee MDPI, Basel, Switzerland. This article is an open access article distributed under the terms and conditions of the Creative Commons Attribution (CC BY) license (http://creativecommons.org/licenses/by/4.0/).
Share and Cite
MDPI and ACS Style
Aminyavari, S.; Saghafian, B.; Sharifi, E. Assessment of Precipitation Estimation from the NWP Models and Satellite Products for the Spring 2019 Severe Floods in Iran. Remote Sens. 2019, 11, 2741. https://doi.org/10.3390/rs11232741
AMA Style
Aminyavari S, Saghafian B, Sharifi E. Assessment of Precipitation Estimation from the NWP Models and Satellite Products for the Spring 2019 Severe Floods in Iran. Remote Sensing. 2019; 11(23):2741. https://doi.org/10.3390/rs11232741
Chicago/Turabian StyleAminyavari, Saleh, Bahram Saghafian, and Ehsan Sharifi. 2019. "Assessment of Precipitation Estimation from the NWP Models and Satellite Products for the Spring 2019 Severe Floods in Iran" Remote Sensing 11, no. 23: 2741. https://doi.org/10.3390/rs11232741
Note that from the first issue of 2016, this journal uses article numbers instead of page numbers. See further details here.