Article

Assessing Spatiotemporal Drought Dynamics and Its Related Environmental Issues in the Mekong River Delta

1
Centre for Climate Changes Studies, University of Social Sciences and Humanities, VNU-HCM, Ho Chi Minh City 70000, Vietnam
2
Faculty of Geography, Ho Chi Minh City University of Education, Ho Chi Minh City 70000, Vietnam
3
School of Agriculture and Environment, Massey University, Palmerston North 4442, New Zealand
4
School of Geographical Sciences and Urban Planning, Arizona State University, Tempe, AZ 85287-0104, USA
5
Institute of New Imaging Technologies, Universitat Jaume I, 12071 Castelló de la Plana, Spain
6
Ho Chi Minh City Institute of Resources Geography, Vietnam Academy of Science and Technology, Ho Chi Minh City 70000, Vietnam
7
Faculty of Geography, Hanoi National University of Education, Hanoi 10000, Vietnam
*
Author to whom correspondence should be addressed.
Remote Sens. 2019, 11(23), 2742; https://doi.org/10.3390/rs11232742
Submission received: 2 October 2019 / Revised: 5 November 2019 / Accepted: 18 November 2019 / Published: 21 November 2019

Abstract

:
Drought is a major natural disaster that creates a negative impact on socio-economic development and environment. Drought indices are typically applied to characterize drought events in a meaningful way. This study aims at examining variations in agricultural drought severity based on the relationship between standardized ratio of actual and potential evapotranspiration (ET and PET), enhanced vegetation index (EVI), and land surface temperature (LST) derived from the Moderate Resolution Imaging Spectroradiometer (MODIS) platform. A new drought index, called the enhanced drought severity index (EDSI), was developed by applying spatiotemporal regression methods and time-series biophysical data derived from remote sensing. In addition, time-series trend analysis in the 2001–2018 period, along with the Mann–Kendal (MK) significance test and the Theil Sen (TS) slope, were used to examine the spatiotemporal dynamics of environmental parameters (i.e., LST, EVI, ET, and PET), and geographically weighted regression (GWR) was subsequently applied in order to analyze the local correlations among them. Results showed that a significant correlation was discovered among LST, EVI, ET, and PET, as well as their standardized ratios (|r| > 0.8, p < 0.01). Additionally, a high performance of the new developed drought index, showing a strong correlation between EDSI and meteorological drought indices (i.e., standardized precipitation index (SPI) or the reconnaissance drought index (RDI)), measured at meteorological stations, giving r > 0.7 and a statistical significance p < 0.01. Besides, it was found that the temporal tendency of this phenomenon was the increase in intensity of drought, and that coastal areas in the study area were more vulnerable to this phenomenon. This study demonstrates the effectiveness of EDSI and the potential application of integrating spatial regression and time-series data for assessing regional drought conditions.
Keywords:
drought index; LST; EVI; ET; PET; Mekong

Graphical Abstract

1. Introduction

Drought originates from precipitation shortage in a region over an extended period of time and it can be considered as an abnormal climatic event aligned with water resource deficits [1,2]. Drought is a serious natural disaster that has adverse effects on the environment and human activities [3,4,5]. Depending on the causes, droughts are often classified into four categories, including meteorological, agricultural, hydrological, and socioeconomic drought [6,7]. Meteorological drought is mainly affected by the reduction of precipitation and high temperature, while agricultural drought is caused by soil moisture deficit [8,9]. The hydrological drought occurs as a consequence of stream flow shortage and groundwater reduction and socioeconomic drought takes place when water demand for socioeconomic activities cannot be fulfilled by water supply [9]. Historically, most drought studies were conducted using data from hydro-meteorological stations [10,11,12]. The amount and quality of the meteorological data, however, vary between individual meteorological stations, creating challenges in monitoring and evaluating the drought events in the case of large-scale studies [13,14,15]. It is widely accepted that drought is a regional phenomenon and occurs in virtually all climatic regimes [16]. Hence, it is necessary to conduct a space and time analysis of this issue.
Drought indices are efficient measurements for examining the drought categories in a particular area [17]. There is a difficulty in determining agricultural drought due to the direct consequences of meteorological drought on agriculture [7,9,18]. Therefore, to understand and examine better agricultural drought variation, the computation of a drought monitoring index is performed prior to the first step [9]. Numerous drought indices have been proposed to estimate drought variations [19,20,21]. Progress in drought observation can be categorized into climatological and ecosystem groups [2,14]. The climatological perspective focuses on several parameters, including rainfall, air temperature, soil moisture, potential evapotranspiration, and snow, while characteristics of plant and land cover from remotely sensed data are the main factors from an ecosystem point of view. Several studies have proved that an efficient drought measurement strategy should be based on composite and multi-index drought models since the range of vegetation responses to drought (and its variation) should be analyzed in order to take ecosystem diversity into account [22,23,24]. The multi-index drought perspective, therefore, plays an important role in monitoring agricultural drought efforts in this study.
The need to explore more appropriate and efficient agricultural drought indices is increasing and currently being studied by scientists around the world [2]. Compared to the commonly used drought indices, the Palmer drought severity index (PDSI) was the first effective index applied to explain agricultural drought [24,25]. The parameters to compute the PDSI consist of precipitation, temperature, and soil moisture. However, the index is difficult to formulate a universal drought index due to the complexity of drought over space and time, as documented by Keyantash and Dracup [26] and Mu et al. [24]. Additionally, the standardized precipitation index (SPI), which was developed by McKee et al. [19], has been used to examine meteorological drought. As it uses only precipitation for drought assessment, the calculation process for this index is simple and flexible based on the time scale, and hence, has been applied internationally [25,27]. The index, however, is limited when using it for agricultural areas [8], because it does not consider other critical variables such as evapotranspiration and soil moisture, which can significantly influence drought conditions [28].
Besides, wide ranges of drought indices have been developed using remote sensing data [16,29,30,31] for large-scale ecosystem drought monitoring due to its advantage for surface soil moisture detection [32,33]. Among these, many indices are based on a single parameter [14], such as the normalized difference vegetation index (NDVI) [34,35], the enhanced vegetation index (EVI) [36], the vegetation condition index (VCI) [37], the standardized vegetation index (SVI) [38,39], the temperature condition index (TCI) [40], and the normalized difference temperature index [41,42]. More recently, drought indices that use a combination of land surface temperature (LST) and NDVI [29,33], or NDVI and the ratio of evapotranspiration (ET) to potential evapotranspiration (PET) [20,24,25,43] have been developed. For instant, the drought severity index (DSI)—a worldwide applicable drought index—was developed and first published in 2013 by Mu et al. [24,25], integrating the MOD16 ET/PET and MOD13 NDVI products, based on a series of composite and multi-index models. It was efficiently used for drought monitoring and mitigation efforts in all vegetated areas from 2000 to 2011 [25]. However, NDVI has lower sensitivity than EVI, which limits it when being applied to the detection of the vegetation greenness in high biomass regions [44,45]. Several subsequent studies modified the DSI by replacing factors around the drought algorithm for EVI2 [30] or climate data derived from the advanced very high resolution radiometer (AVHRR) [25] and applied them for their typical regions. Hence, the analysis of the input factors that have a role in drought modeling is vital for the assessment of the drought status at the area of analysis. Moreover, drought variations are varied between geographic regions depending on the climatic conditions and characteristic of land cover and land use [25,27]. Hence, this study aims at developing an efficient drought index using multiple parameters at a regional scale in order to estimate its drought status. Mekong River Delta (MRD) in Vietnam is selected to implement the study as it is a pivotal agricultural region of Vietnam and drought is a significant problem in the dry season along with salinity. The drought conditions in the MRD have a coherent pattern with total annual water supply of the Mekong River over the last 45 years [46], causing water shortages for agricultural land, especially severe during the dry season (from November to April). Extreme drought events were recorded in the study area in 1992, 1993, 1998, and 1999 [47]. The recently extreme drought occurrences had taken place in 2003, 2006, and 2017 [48].
There are various types of remotely sensed data available to examine drought severity across various regions in the world, such as the advanced very high resolution radiometer (AVHRR) [44,49,50], the moderate resolution imaging spectroradiometer (MODIS) [24,33], Landsat [51,52], or Sentinel [53]. Among these sensors, MODIS has great temporal resolution of 1–2 days with high radiometric resolution image (12 bit) and collects data for 36 spectral bands [54,55]. Whereas, higher spatial resolution data such as Landsat (30 m) is challenged in providing an appropriate number of high-quality images [51,56] and Sentinel data is not sufficient to investigate long-term analysis as it has only been available since 2015 [57]. In fact, several studies revealed the effectiveness of MODIS data for agricultural drought assessment in tropical delta, particularly in the Mekong River Delta (MRD) as adapting to challenges of persistent cloud cover due to its advantages of temporal resolution [33,58,59]. Therefore, with a spatial resolution ranging from 0.25 to 1 km, MODIS data is appropriate for examining drought issues in the case study of Mekong River Delta [33,44,60,61]. In this study, multi-temporal MODIS imagery was applied for analyzing spatiotemporal drought variations in the MRD.
Different types of spatiotemporal regression methods have been utilized to examine the spatiotemporal variations of environmental factors derived from remotely sensed data [62,63,64,65,66]. The Mann-Kendal significance test and the Theil Sen slope estimator are powerful tools for determining the trend of variations in environmental factors because of their innovations, as compared to ordinary least-squares (OLS) regression [66,67]. In addition, the Pearson correlation coefficient has been widely applied for investigating the relationship among variables in OLS regression [66]. However, relationships among physical variables are applied at different spatial scales and in separate geographical locations. Hence, and in order to gain some insight into this process, local differences are thus needed to be considered [68]. Brunsdon et al. [69] developed a local form of the standard linear regression method, called geographically weighted regression (GWR). It has been applied efficiently for evaluating the spatial non-stationarity and local correlation coefficient at the pixel level [70,71,72]. Our study, therefore, proposed and applied the enhanced drought severity index (EDSI) algorithm—developed from MODIS satellite-derived LST, ET, PET, and EVI factors—and applied the Mann-Kendal and Theil Sen (MK-TS) as well as GWR, in order to conduct a spatiotemporal analysis of drought situations.
Overall, our research aimed at the (i) analysis of the spatiotemporal variations of a series of environmental parameters of interest (i.e. ET, PET, EVI, and LST), (ii) assessment of the local correlation among each other (considering also their standardized values), (iii) development of a new drought index based on the concept of the drought severity index (DSI) [24], and (iv) pattern dynamics and trend analysis in agricultural drought. The Mekong River Delta was selected as a case study because of the impact of drought along with salinity during the dry season on the region [57,73]. Besides, the comparison of EDSI and other drought indices was performed to test our hypothesis and to enhance its capabilities.

2. Materials and Methods

2.1. Study Area

The Mekong River Delta (MRD) (located between 8°34′N-10°24′N and 104°27’E-106°48′E), which covers an area of approximately 40,000 km2, is a major agricultural region in the Lower Mekong River Delta (LMRD) (Figure 1). This delta attains several advantages, such as having a large area of fluvial soil, a criss-crossing river system, and the regularization of river runoff by Tonlé Sap Lake in Cambodia. The agricultural land accounts for 72.68% (approximately 31,283.14 km2) and more than 90% of this land use type is used for rice production [33,58]. Open water, urban, and other land use types occupy 5.17%, 10.27%, and 11.88% of the total area, respectively. Besides, the major productive crops accounted for more than 50% of the rice-cultivated area, 71% of the aquaculture area, 30% of the value of agricultural production, and 54% of fisheries in Vietnam in 2015 [74]. This delta is therefore, generally considered crucial for food security and the economic development of Vietnam. Most of the locations in the delta have similar climatic conditions (i.e., air temperature, precipitation, and evapotranspiration) as the major landform in the delta is flat plain. Besides, the air temperature remains stable through the whole year with a mean value of over 26 °C [12,75]. This is an advantage condition for agricultural production.
Regarding the landscape in the study area, it can be divided into upper (inner) delta and lower (outer) delta plain [76], and the land elevation between these parts is not significant. However, with elevations’ difference in the range from 0.5 to 1.5 m above the sea level [77], the delta is identified as a low-lying area, which are extremely vulnerable to climate change impacts [58,78]. In addition, located in a tropical monsoon and sub-equator region, climate in the MRD has two seasons. The rainy season lasts from May to October and the dry season begins in November and ends in April, with less than 20% of the total annual precipitation. Consequently, drought in MRD occurs significantly in the dry season and the most damaging effect of drought takes place in the last week of March and the first week of April. Therefore, it is recommended that examining drought events in the study site should focus on the dry season. The spatial variations of drought may be influenced by the character of the land surface rather than climatic factors.
In recent years, however, droughts, along with salinization in the dry season, have created a serious adverse impact on agriculture and water supply as a result of global warming and upstream hydropower dams [79,80,81]. The study area, for instance, was affected by the most intense drought and salinity on record in 2016–2017, leading to a serious fresh water shortage and a decrease in cultivated area, especially severe in paddy land which is a form of rice-farming [10]. Hence, it is necessary to examine the variations in drought intensity over time as a predictor of agricultural development.

2.2. Data

Earth observation data from the different satellite sensors used in this research is shown in Table 1. A range of MODIS products, including LST (MOD11A2), ET, PET (MOD16A2), and EVI (MOD13A1), obtained from the Land Processes Distributed Active Archive Center (LP DAAC), were the main sources when computing the EDSI, based on the spatiotemporal relationship between these factors. With a spatial resolution of 0.5–1 km, using MODIS products is appropriate as it enables us to map drought severity at a map scale of 1:2,000,000–1:1,000,000 [82]. Whereas, there are only eleven weather stations in the study area, so using meteorological data is difficult for mapping spatial drought pattern.
The MODIS products (i.e., MOD16A2, MOD13A1, and MOD11A2) were used to obtain ET, PET, EVI, and LST and their spatiotemporal trends, respectively. According to Running et al. [83], the MOD16 ET/PET algorithm used the well-known Penman–Monteith (PM) equation to calculate global remotely sensed ET [20,25], and integrate both PM and Priestley–Taylor methods to estimate PET [20,83] with a combination of remote sensing [84] and global meteorological data. The reflections of MOD16 ET/PET (i.e., evaporation from canopy interception, wet and moist soil surfaces, and transpiration from canopy stomata) and its relations to both surface energy partitioning and environmental constraints on ET are also described in several studies [20,24,25,83]. Besides, the MOD13A1 provides a piece of information about vegetation indices (i.e., normalized difference vegetation index and enhanced vegetation index) and its potential associated with climate changes (e.g., increasing frequency increase and drought severity). The vegetation responses can be observed through vegetation greenness changes with land–atmosphere water, carbon and energy fluxes, and linked climate feedbacks [24,30,85]. Additionally, the LST derived from MOD11A2 has been used as a key factor to examine drought severity [33,40,86] as a response of soil moisture and its texture [29]. Based on the relationship among parameters and the subsequent computation of the drought severity index (DSI) [24], an integration of the operational MOD16 ET/PET, MOD13 EVI, and MOD11 LST products was employed to develop a remotely sensed agricultural drought index for the MRD as an enhancing piece of information of water stress.
A transformations are performed such that derived standardized factors of each environmental variable follow a normal distribution and reduce the deviations of long-term mean values because 8 day environmental variables are not normally distributed [4,87]. In addition to satellite data, the meteorological data obtained from eleven meteorological stations on the ground (Figure 1) were used to calculate the reconnaissance drought index (RDI) [17] and the standardized precipitation index (SPI) [19]. The RDI and SPI were then applied to examine the performance of remotely sensed drought indices. Then, either the locally spatial relationship among environmental parameters or its standardized values were explored to discover the significant probability of input data and drought model. Finally, a time-series of the EDSI was conducted to assess drought variations between space and time.

2.3. Enhanced Drought Severity Index

Drought variations, in fact, depend on various factors such as precipitation, soil moisture, and ET. Several studies [29,88,89] have reported that there is a significant relationship between drought and other relevant parameters (e.g., vegetation indices, LST, rainfall, ET). The ET reflects the status of ecosystem function and is directly related to water, carbon, and energy cycles of the land surface [45]. Besides, LST is a major factor controlling the physical processes that are responsible for the land surface balance of water, energy, and CO2 [33,40]. Additionally, LST is often used to indicate drought intensity because the surface water loss by evapotranspiration increased under high thermal conditions [31,56]. Besides, the behavior of LST in response to soil moisture provides information about its texture [90,91]. Several studies have used LST as the main source of satellite-derived information in order to develop different types of drought indices [5,40,42]. We therefore consider that these factors should be integrated into drought modeling, in order to increase their accuracy, because they enable us to provide more pieces of appropriate information on surface moisture and water deficits.
From the correlation among environmental factors, we have developed an integrated index, the enhanced drought severity index (EDSI), using standardized ratios of ZRT, ZLST, and ZEVI, as given in Equations (1) and (2).
Z * = Z R T + Z L S T + Z E V I = R T R T ¯ σ R T + L S T L S T ¯ σ L S T + E V I E V I ¯ σ E V I
E D S I = Z i * Z ¯ * σ Z *
In Equations (1) and (2), σ R T , σ L S T , σ E V I , and σ Z * are the standard deviation of RT, LST, EVI, and Z* respectively, and R T ¯ , L S T ¯ , E V I ¯ , and Z ¯ * are the average value of RT, LST, EVI, and Z*, respectively.
R T = E T P E T
The EDSI anomaly is dimensionless and might vary in ,   + for rainy to dry period variations, respectively. The ratio (RT) between ET and PET in any given month, was developed by Yao et al. [92] and employs reanalysis of meteorological data and remotely sensed data, and the MODIS data MOD16 ET/PET products were used as a factor of the terrestrial water availability and the atmosphere [30,45]. This indicator manifests a condition of wetness or dryness [24,25], as shown within Equation (3). Besides, both the vegetation and LST reflect the water–energy balance of the surface [29,33], and thus, are good indicators for drought assessment. Consequently, the additional environment variables (i.e., ET, PET, EVI, and LST) provide information about water content as an effective indicator of agricultural drought monitoring. Moreover, it is necessary to apply remotely sensed data for analyzing drought in a large area like the Mekong River Delta because only 11 meteorological stations have been used to monitor weather conditions of around a 40,000 km2 area.
In addition, in this study, the performance of EDSI was subsequently assessed by performing regression analysis between EDSI and DSI developed from remotely sense data [24] versus RDI [27,93] and SPI [16,19,27] measured at the meteorological stations.
The drought severity index (DSI), which combines NDVI and the ET/PET ratio [24,25], is derived by the operational MOD 16 ET/PET and MOD13 NDVI products. The DSI is estimated using the standardized ratios of RT (ZRT) and NDVI (ZNDVI), as shown in Equations (4) and (5).
Z = Z R T + Z N D V I
D S I = Z i Z ¯ σ Z
In Equations (4) and (5), σ Z and Z ¯ are the standard deviation (SD) and mean respectively, of Z.
Both of the meteorological drought indices (i.e., RDI and SPI) are computed by the following Equations, from (6) to (7):
α k ( i ) = i = 1 k R i j = 1 k P E T i j , i = 1 , N ,   j = 1 , k
S P I i = R i R ¯ δ
The RDI was developed to detect the water deficit in a more accurate way, representing a balance between input and output parameters in a water system [27,93]. It is based on both cumulative rainfall (R) and potential evapotranspiration (PET). In Equation (6), the initial value α k i of RDI is calculated for the i-th year in a time basis of k (months), P E T i j is the precipitation and potential evapotranspiration of the j-th month from January to December of the i-th year, Ri is annual rainfall of i-th year respectively, and N is the available interval of years. Besides, the SPI was proposed by McKee et al. [19,27]. It is based solely on precipitation measurements and accounted for how much rainfall for a given period of time has deviated from historically established norms [16], shown in Equation (7). R ¯ and δ are the average and standard deviation of rainfall in the whole period. This study used RDI and SPI to compare the performance of our newly developed drought index (EDSI) and the previous drought index (DSI).

2.4. Spatiotemporal Regression Analysis

A pixel-based time-series trend analysis of drought parameters was performed to examine the environmental factors and drought variations in the study area. In this model, the year sequence of input factors from 2001 to 2018 is treated as an independent variable and each image stack values of EVI, LST, ET, and PET and the drought index images (for the same period) are the corresponding dependent variables.
The space-time model can be used to examine the trend of environmental changes in the sense that the analysis generates slope coefficient values that represent the mean annual change of each environmental parameter [57]. In addition, the model includes the Mann–Kendal (MK) significance test, a tool to evaluate the statistical significance of the spatiotemporal trend. The MK test [94] is an effective method for examining trends in time series analysis. Unlike the linear regression model, the MK test enables the detection of monotonic (not only linear) trends without any assumption about the data distribution [63,95]. The MK test was first used to analyze trends in hydro-meteorological data [96,97]. It statistically evaluates if the change in the values of a variable over a given period followed an upward or a downward trend. In our study, only the pixels which have statistically significant changes (p < 0.01) are further considered for analysis. This provided us with results to determine if each of these environmental measures has significantly changed (positively or negatively) at each pixel in the study area over the examined 18 year period.
Afterward, local correlation among ET, PET, EVI, and LST, as well as these values and drought indices, were conducted using geographically weighted regression (GWR). The GWR, developed by Brunsdon [69], is a spatial multivariate regression and has been widely employed to characterize spatially varying relationships [98]. It is a nonparametric model of spatial drift that relies on a sequence of locally linear regressions to produce estimates for every point in space by using a subset of information from nearby observations [99]. It is a relatively simple technique that extends the traditional regression framework of equation:
y i = a 0 + k = 1 , m a k x i k + ε i
where, yi is the i-th observation of the dependent variable, xik is the i-th observation of the k-th independent variable, the εi are independent normally distributed error terms with zero means, and each ak must be determined from a sample of n observations. The method can be used to spatialize discrete point data on the assumption that auxiliary, independent variables are known and continuous in space, or, technically, they can be provided as raster layers. The main results from this model are obtained considering a local r-value and slope coefficients within a p-value less than 0.01, which was then used to obtain the relationship among environmental parameters and drought indices.

3. Results and Discussion

3.1. Assessment of the Enhanced Drought Severity Index

The results of the regression analysis for the correlation among drought indices are presented in Table 2. Strong positive relationships between measured indices at ground observation and spectral indices were found. All regression models showed high r values that were above 0.6. However, EDSI illustrated a higher performance compared to DSI as it achieved better r and p values.
We therefore analyzed the correlation among EDSI, SPI, and RDI to adjust the drought categories for EDSI (Table 3). Besides, with a majority of local r values around 0.9, strongly positive spatial correlation values across the Mekong River Delta between the EDSI and DSI, computed by remotely sensed data, are illustrated in Figure 2 using the geographically weighted regression. Areas with yellow to orange represent a certain level of differences between EDSI and DSI. In general, the EDSI classification scale is somewhat similar to DSI up to a certain extent. It also revealed that the performance of a single drought index may depend on specific circumstances. Although many drought indices have been developed in the world, none of them is comprehensive enough to be applicable to all regions of an enlarged nation [100], especially like Vietnam due to the differences in climatic conditions, topography, and local characteristic of land cover and land use. Vietnam is extended along the longitude (8°–23.5°N) leading to air temperature and precipitation patterns which are various from North to South. Most of the developed agricultural drought indices, which approached a single parameter or used the long-term deference between the rainfall and evapotranspiration, cannot fundamentally represent the water shortage processes [101,102]. Besides, a limited number of meteorological stations in the MRD also creates a challenge to monitor drought at the pixel level. Although the climatic conditions and vegetation are quite similar over this delta, criteria such as land use and land cover (LULC) types and pattern play a crucial role in drought variations [57,73,80]. Hence, it is recommended to define appropriate drought index for the region based on the multi-parameter perspective and through the application of remote sensing data and techniques.

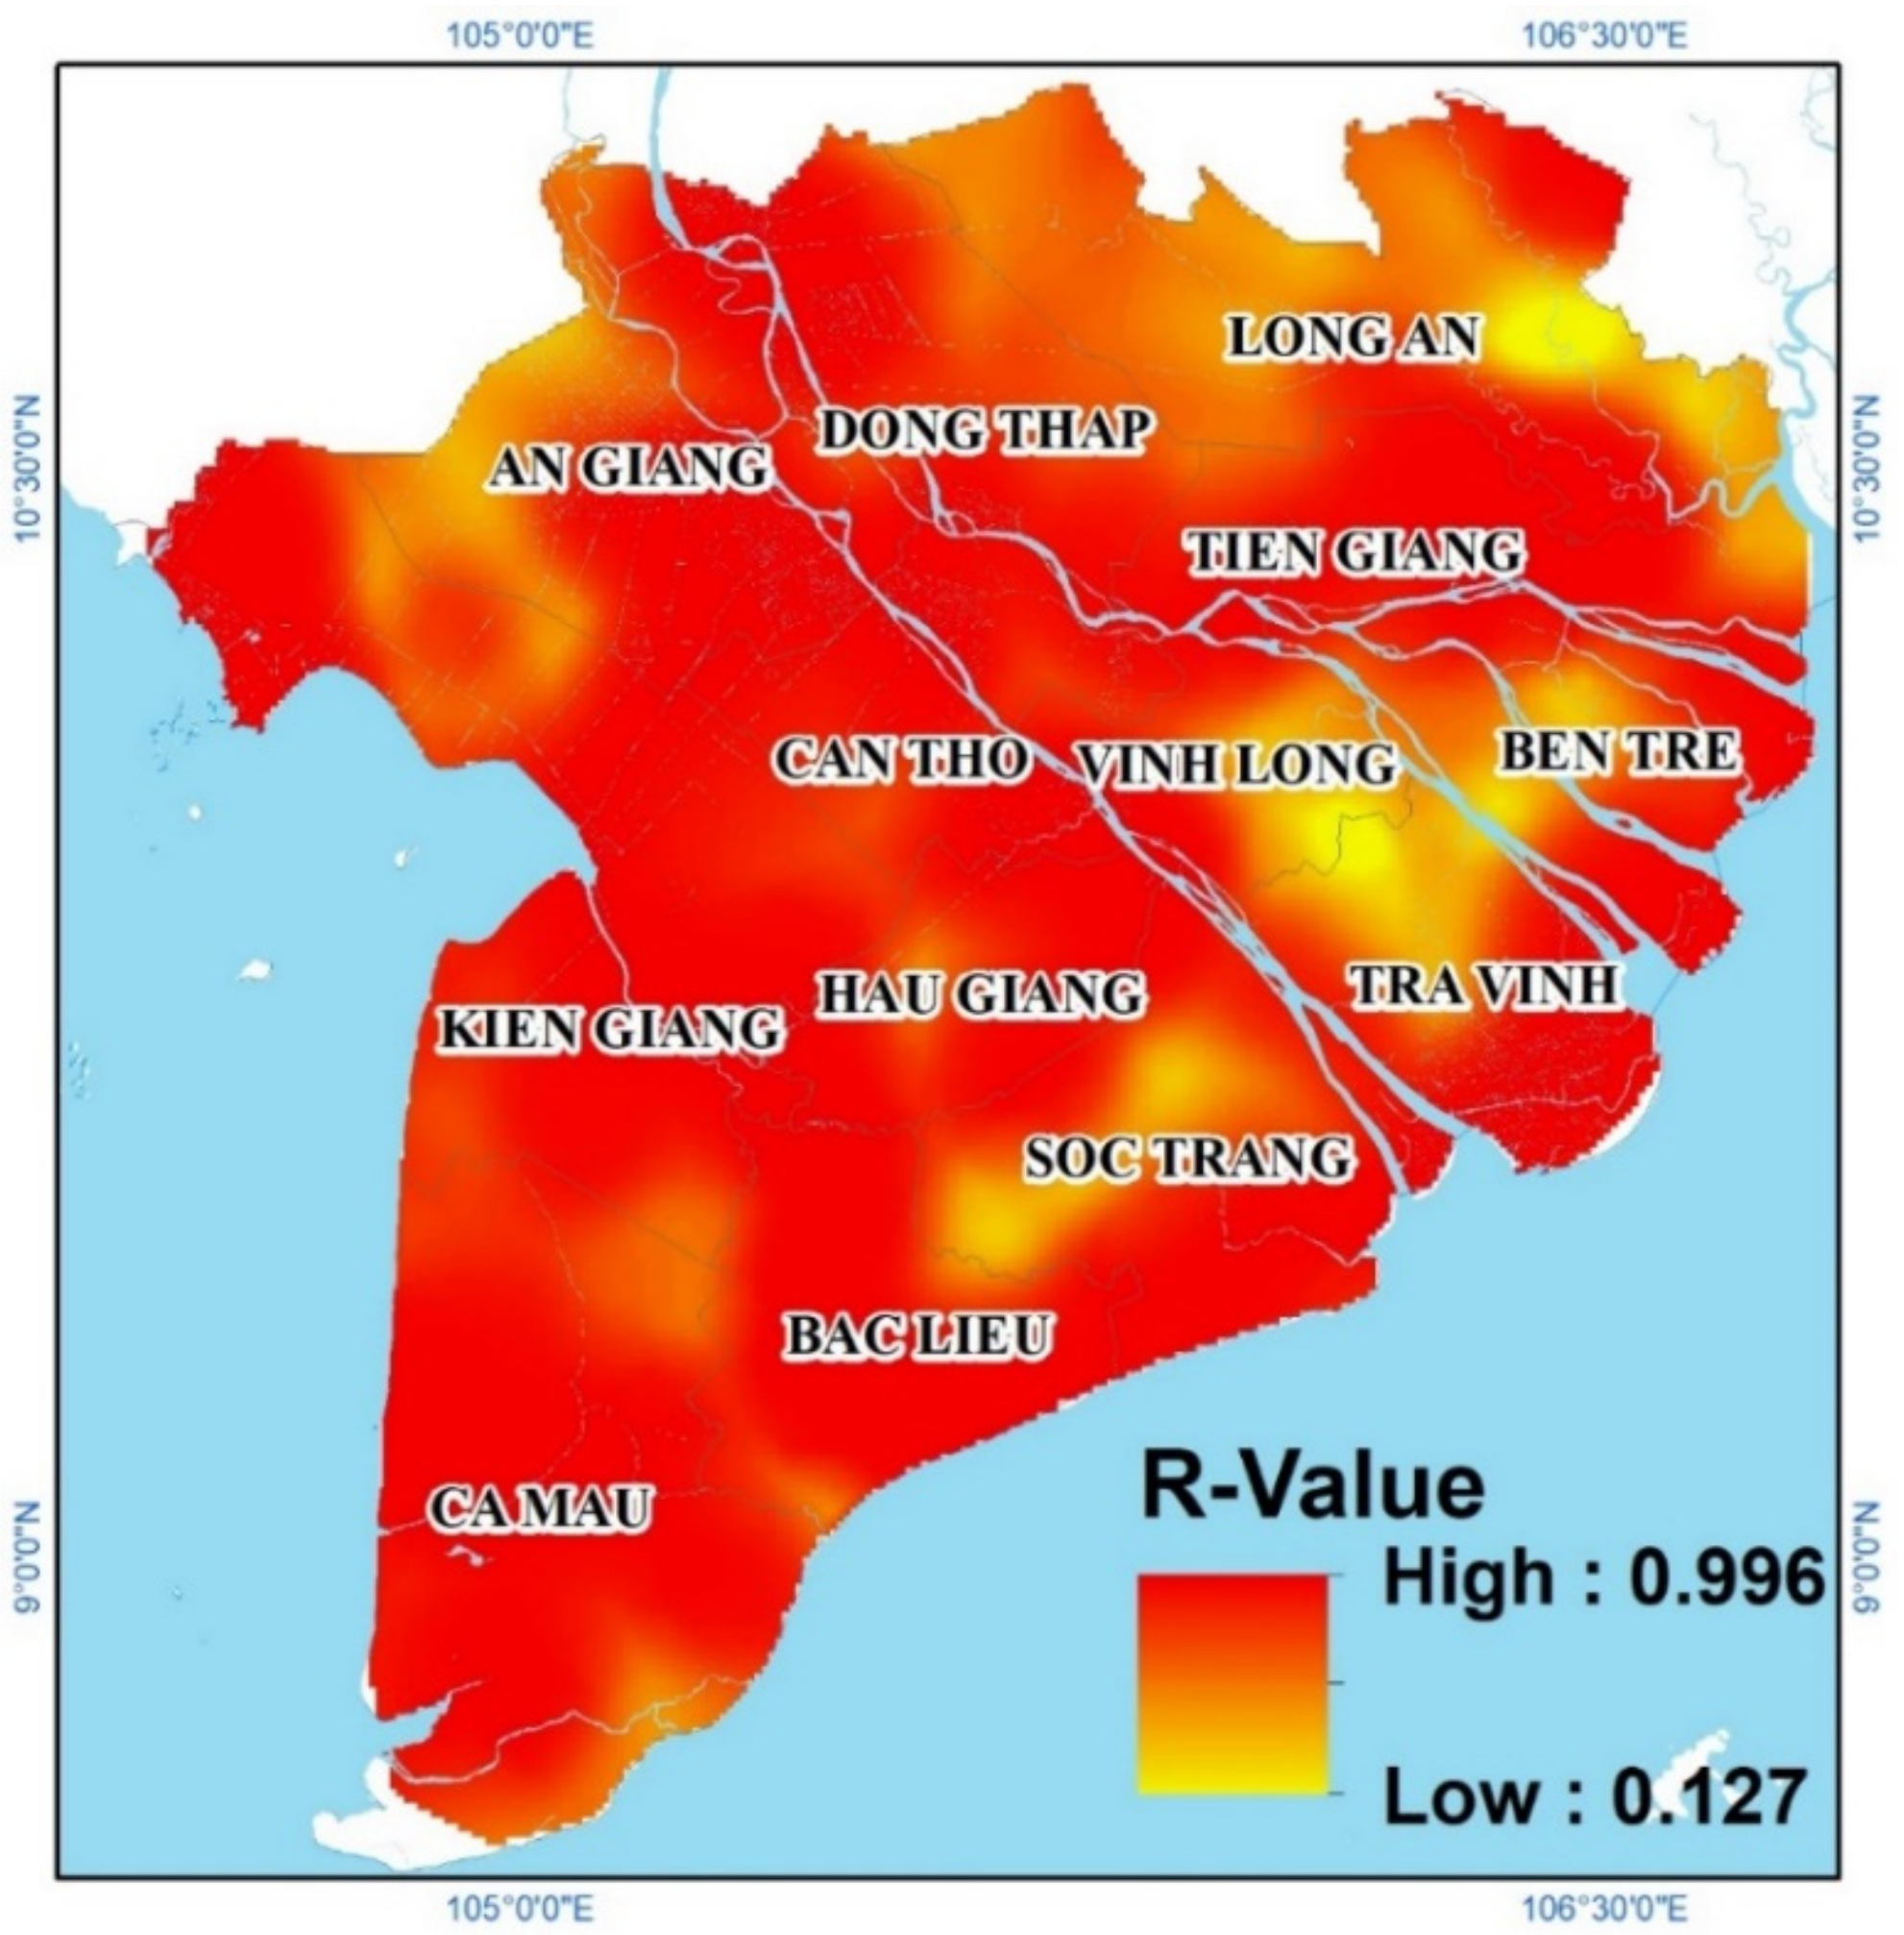
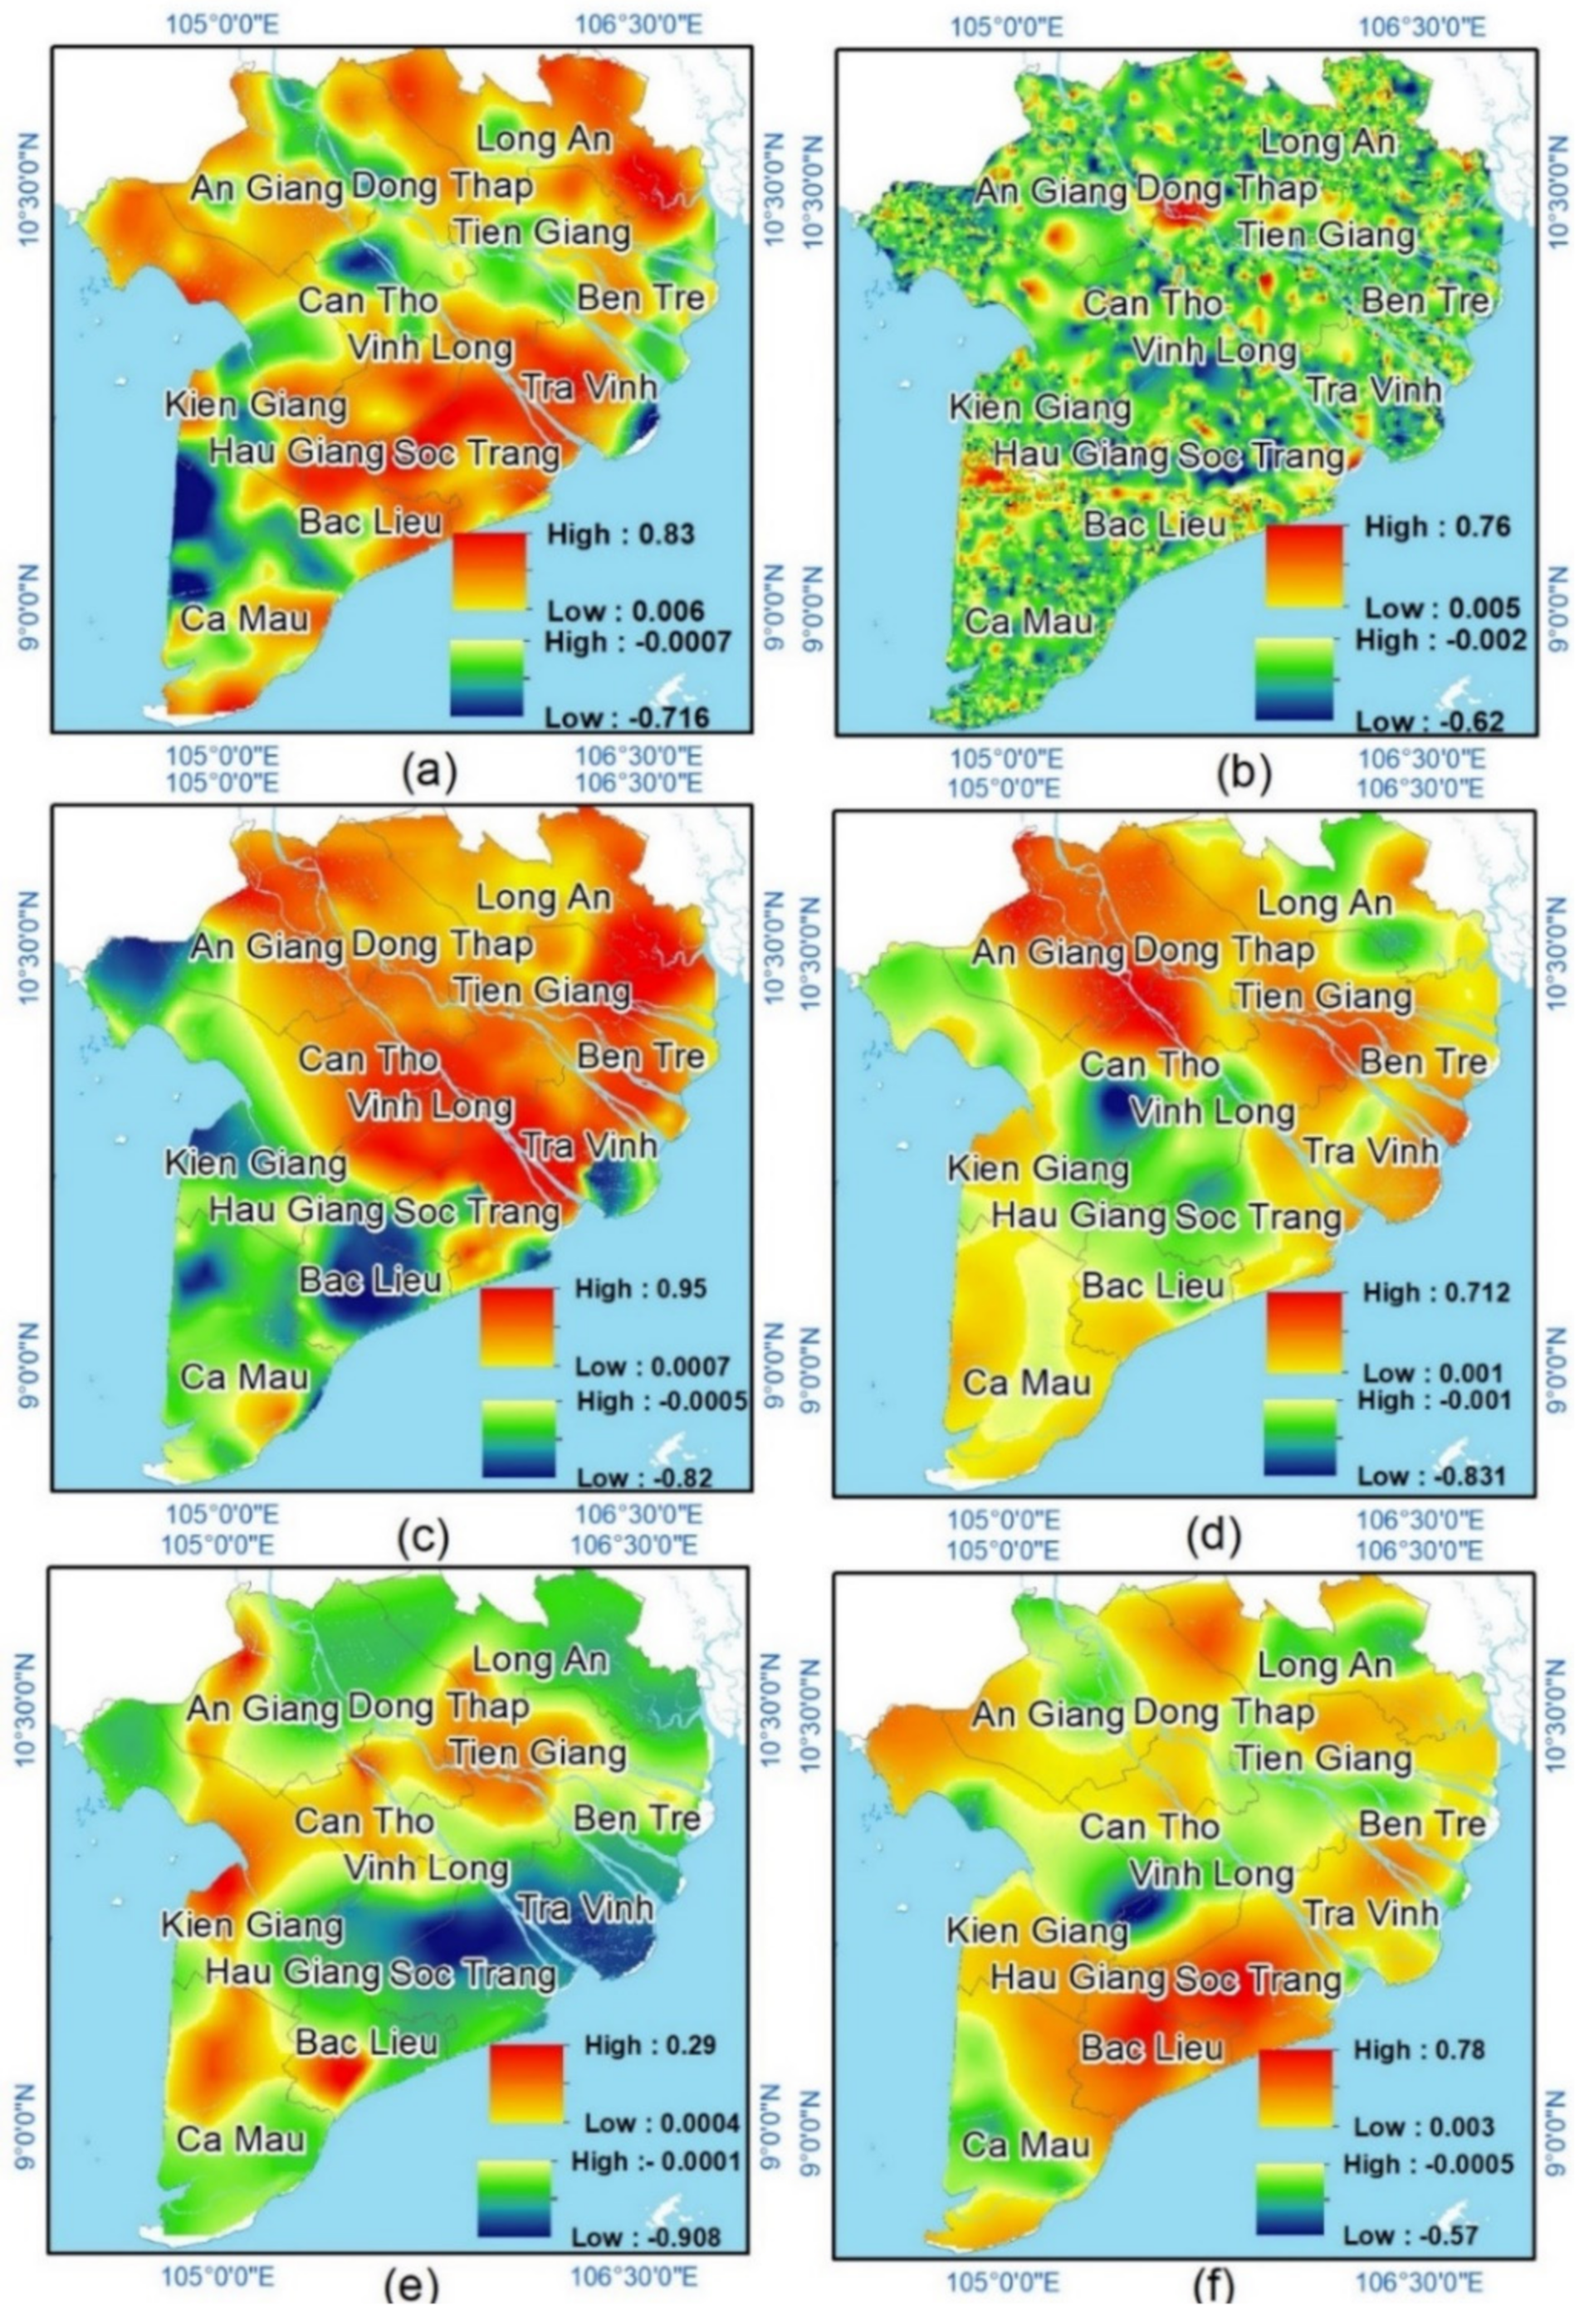
3.2. Relationships among the Enhanced Vegetation Index (EVI), Land Surface Temperature (LST), Evapotranspiration (ET), and Potential Evapotranspiration (PET)

A general understanding of the correlation among environmental indicators is illustrated in Table 4. Overall, there was a high correlation among them, showing by the R2 values from 0.64 to 0.93. However, it is observed that the correlation differs across space, as shown in Figure 3.
These maps show both positive and negative spatial correlation between EVI, LST, and evapotranspiration. The negative correlation between LST and evapotranspiration is unusual compared to conclusions obtained in previous studies [30,33,40]. Several authors explored that PET or ET (which are measured from meteorological stations) are generally positively correlated to temperature (including water temperature and air temperature) [103,104,105,106,107]. However, some observations suggest that the correlation between LST and evapotranspiration may be different in particular circumstances. Recently, a number of studies revealed that under limited solar energy, water conditions due to high moisture constraint and low, non-uniform vegetation cover in a dry season, the relationship between evapotranspiration and LST may show a negative correlation [66,108,109]. We therefore consider, that the negative correlation performed in our study makes sense as it was implemented during the dry season, a similar context to those mentioned in the above referenced studies. In addition, the influence of LST on air temperature, and the strong relationship between them, has been shown in several studies [110,111,112,113,114]. Consequently, the changes in LST and PET in the study area showed a dependent behaviour in relation to EVI.
Moreover, it is obvious that there was a significant correlation among secondary factors when compared to the original parameters (i.e., ET/PET, LST, and EVI) and a difference in local coefficients (presented in Figure 4). This contributed to concluding that adding LST as an input of the arithmetic is of great importance to conduct in the study area.

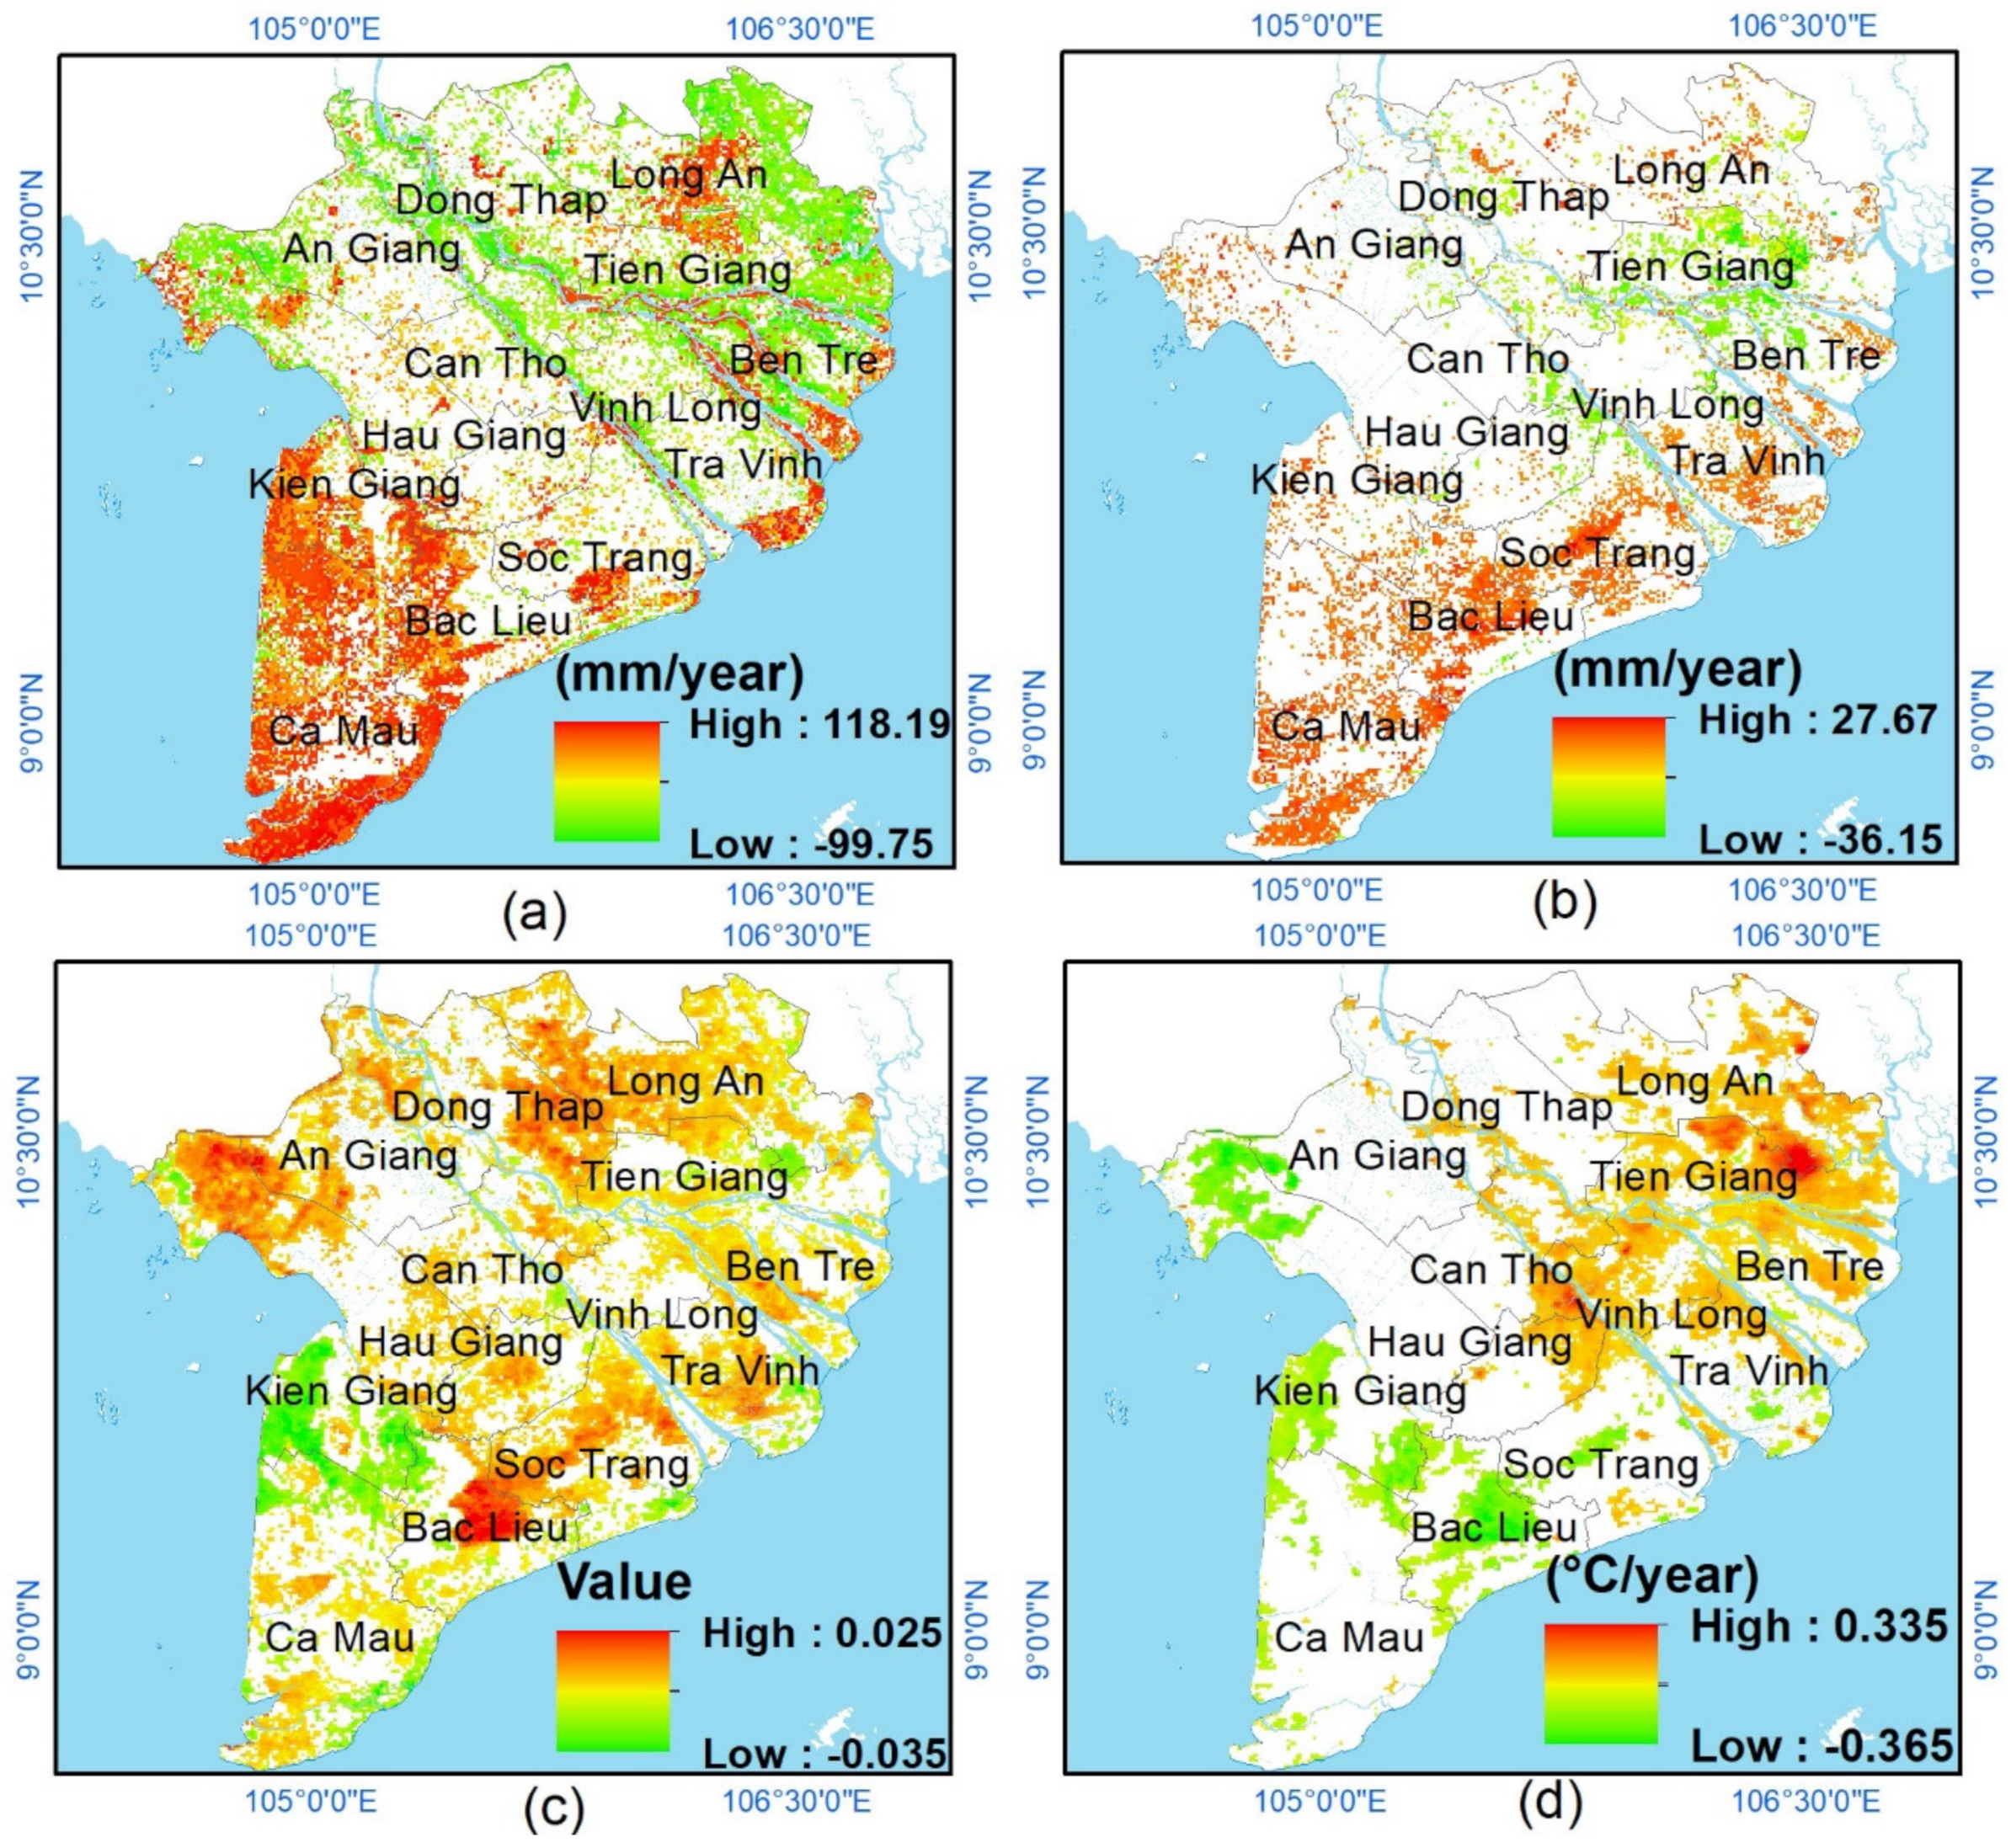
3.3. The Spatio-temporal Variations of Environmental Factors in the Study Area

The spatio-temporal pattern of variation for each factor in the study area is seen in Figure 5. Overall, there was a significant change in ET, PET, EVI, and LST from 2001 to 2018, with an upward trend for coastal provinces and a downward trend for inland provinces.
From 2001 to 2018, ET increased across most of the study area, the total land area with ET increase (6725.71 km2) was considerably larger than the total land area of ET decrease (2417.08 km2). There was an increase in ET in Ben Tre, Tien Giang, and Dong Thap provinces with the green shown on the Figure 5a. Besides, a raising trend of PET pattern (shown in red and yellow) mostly distributed in Long An, Dong Thap, Tien Giang, and Ben Tre with a total area of PET increase of 12,537.47 km2, while a declining area of 8897.18 km2 concentrated in a part of coastal areas, Ca Mau and Kien Giang. Regarding the spatiotemporal pattern of EVI changes, it is highlighted that, across the delta, the total area of significant EVI increase was 4.2 times greater than the area of significant EVI decrease (3976.9 km2 versus 16,757.07 km2). This can be explained by the transformation of rice cultivation to dragon fruit, pineapples, and other kinds of annual plants that aims to adapt to natural hazards and contributes to agricultural development. Moreover, these plants grow over several years and their leaf canopy is larger than the paddy fields, leading to a significant EVI increase.
LST increased significantly across an even larger area of the delta—a total area of LST increase of 7784.54 km2 versus LST decrease of 3849.71 km2. The area of decrease was mainly concentrated on provinces of lower delta, including Ca Mau, Kien Giang, and Bac Lieu, while the areas of increase were provinces of upper delta.
The amount of decrease in PET and increase in LST was distributed across most of the provinces in the upper delta, while there was a significant variation in ET and EVI between the western and eastern parts of the study area.
Areas of significant changes for each measure at the provincial level are shown in Table 5. All provinces experienced an increasing trend in environmental factors. Several provinces (Dong Thap, Can Tho, and Vinh Long) did not have a decreasing trend in LST. The largest areas of ET and PET increase (which accounted for 67.29% and 66.40% of total increased evapotranspiration area, respectively) were found in Ca Mau, Bac Lieu, Kien Giang, and Soc Trang. The highest area of EVI increase was discovered in Long An, Kien Giang, and Soc Trang, with an enlarged percentage of 39.16%. However, Long An, Ben Tre, and Tien Giang showed the biggest area of LST increase (10.68%) in comparison with the rest of the provinces.
The main reason may be due to the switch from paddy rice to tropical fruits, including dragon fruit growing and pineapples [115]. These fruit leaves’ area is small, and the cultivated distance is about 2.5 meters, so it has an arid area or water surface among them without vegetation. At the provincial level, Ca Mau and Kien Giang provinces had the highest significant increase in ET, PET, and EVI area because these regions were covered by the largest mangrove forest compared to other provinces in the delta [116,117]. In contrast, the decreased value in ET, PET, and EVI in Long An and Tien Giang provinces can be found due to changes in land use from rice to dragon fruit and rapid urban sprawl.

3.4. The Spatiotemporal Variations of the EDSI in the Study Area

The annual drought risk from 2001 to 2018 was the period used to apply Equations (1)–(6). An EDSI value below zero is treated as an annual change toward drought, while areas with EDSI values above zero were treated as annual change toward wetness. There were changes in the drought index along the study period according to the categories presented in Table 3, and annual drought appeared in the west and then expanded toward the coastal areas in later years (Figure 6). The annual drought increased in intensity and in coverage along some years and decreased along others during the 2001–2016 period. From 2016 to 2018, the level of drought became more severe, concentrated in the south coastal areas, especially in Ca Mau and Kien Giang. It is important to note that the increase in drought area in coastal areas reflects negative human influences [80,81].
Looking closely at the EDSI in 2017, a major drought level occurred across almost the entire study area, demonstrated by the fierce drought experienced in the dry season of 2016–2017 under the combined impact of upstream dams, climate change, and El Niño [80,118,119]. Regarding drought impacts, it damaged 10,000 ha of rice in the winter season at a cost of 60 million USD during the period of 2003–2005 [33] and this figure for the 2015–2017 period was estimated up to 360 million USD [75]. In addition, it was reported that the influenced area, in the dry season of 2015–2016 [120], can be detailed as: 238,276 hectares of rice crop, 29,277 hectares of annual plants, 6575 hectares of vegetables, and 79,000 hectares of shrimp farming. The total number of households facing water shortage was estimated by the Ministry of Agriculture and Rural Development at 211,261 (over approximately one million inhabitants) and the cost to implement the temporary solutions for water supply was more than 22.5 million USD [121].
The changes in area within each drought category from 2001 to 2018 are illustrated in Figure 7. It explains Figure 6 in terms of drought variations of each category at the provincial scale. Generally, the drought levels D1 area increased from 2002 to 2009 and reached the highest value in 2010 before decreasing along the period of 2011–2018. Accordingly, a contrast was seen in drought levels from D2 and D4 as drought areas tended to decrease in the period of 2001–2010 and then started increasing in the next period.
The trend of drought areas in each category during the 2001–2018 period is shown in Table 6 by using the slope and correlation coefficients corresponding to the drought areas. The spatial distribution of the areas where the drought index increased was reflected upon D3 and D4 levels in all provinces, while the decreased areas were observed in D1 drought levels. The change in the drought area of D2 decreased in Long An, Tra Vinh, Vinh Long, and Soc Trang provinces, whereas this figure increased in the rest of the provinces. Regarding the extreme drought areas, the trend of the increasing areas with the higher values were found for the Ca Mau, Kien Giang, Long An, and Tra Vinh provinces. These values, however, were lower for a few provinces in inland and the western part of the study area, such as Hau Giang, Can Tho, and Dong Thap, at slope of 0.36, 1.11, and 2.39, respectively. The explanation to this difference may be that the inland provinces have been rapidly moving toward growing annual plants, especially dragon fruit and pineapples [115,122,123] and developing ecotourism.
Besides, the changes in pattern of the EDSI over space by types of land use are presented in Table 7. The most obviously increased trend in variations of drought area discovered around the rice paddy land with an increased area of 6951.7 km2, followed by the built-up land and annual crops with the enlarged area of 1276.22 km2 and 866.15 km2, respectively. The largest decreased area (2309.73 km2) of drought severity was explored around rice paddy land. Hence, the dynamics of drought severity in the MRD mainly occurred on the agricultural land. These results have been quite similar to those found by Son et al. in their paper [33] by using the temperature–vegetation drought index without ET/PET in the MRD.
Detailed analysis of the spatiotemporal trends in drought at the pixel level proved the advantage of using EDSI in drought assessment. The spatial resolution of meteorological drought data remains weak due to the limited number of weather stations, whereas substantial amounts of continuous data can be acquired over a relatively short period of time by remote sensing. In addition, several weaknesses were discovered by Mu et al., in particular that SPI with the single parameter as rainfall is unreliable and may change with long duration and the RDI faces the challenge when used across separate basins and computed seasonally. Besides, the typical features of location are challenges for DSI as a universal drought index.

4. Conclusions

The spatiotemporal changes of ET, PET, EVI, LST, and EDSI during 2001–2018 were investigated using spatial regression in the Mekong River Delta (MRD). Positive and negative relationships between each parameter were explored across space and time. It was found that the changes in PET and LST are coherent with the EVI change in the study area. Additionally, the combination of the factors reflected better water stress as a response to agricultural drought, compared to other applied drought indices in the MRD. ET/PET is a key factor for surface water and the combination of EVI and LST reflected the soil moisture texture. Moreover, EDSI is composed of components with a direct physical meaning and improves water deficit assessment on ground surface, as compared to the DSI. Therefore, EDSI inherits the advantages of DSI, enhancing soil moisture information, by adding new factors, and was effectively applied in the MRD.
The study computed and mapped the spatiotemporal variation of drought based on the EDSI using MODIS products. This method assessed drought situations in the study area, more broadly than using a single parameter. The effectiveness of the index was shown by examining spatiotemporal correlation among the other drought indices (i.e., SPI, SDI, and DSI). The relationships of both drought indices (i.e., SPI and RDI) are significant, with r values ranging above 0.7. This contributes to consider that the EDSI plays pivotal importance in monitoring drought events, compared to the other applied drought indices in the study area. In addition, the analyzed results showed that drought is becoming more serious in coastal areas—especially in the category of above-moderate drought (D2). It was clearly demonstrated that the regions with larger areas with severe drought index are Ca Mau, Kien Giang, and Ben Tre. Besides, the agricultural drought events occurred mainly on the rice paddy land which accounts for most of the area and is recognized as a major resource of agricultural production in the study site. The government and residents, therefore, should take appropriate actions to minimize or mitigate the negative drought impacts in these areas. Moreover, the testing of the newly developed EDSI for assessing authentic drought conditions at each meteorological station and upon the types of land use was found to be accurate and operational. Consequently, it informs that there is an urgent need to invest an efficient and sustained drought warning system for the MRD. This will enable the local government to prepare better plans for drought mitigation.
These MODIS-derived indices, using a spatial-temporal approach, are suitable for the assessment and monitoring of environmental degradation in connection with drought on a broad scale. These results encourage applying the approach adopted in this study to monitoring spatial distribution and change over time in drought conditions around other tropical deltas in the world, which exhibit similar physical characteristics. The index is also aimed at improving drought index assessment, conducted daily in the world, from the authentic meaning of EDSI. A seasonal assessment, hence, is able to be implemented in the future for ESDI as a process of monitoring and forecasting drought events on a large scale in the MRD. Besides, replacing other study sites with application of the EDSI can be conducted to assess its effectiveness for various regions.

Author Contributions

T.V.T., D.X.T. conceived the idea of the study. T.V.T., D.X.T., H.N.D., D.D.H., and P.H.T. conducted the field work. T.V.T., D.X.T., S.W.M., and P.L.-C. processed the data and analyzed the results. All authors contributed to the writing and revision of the manuscript.

Funding

This study was funded by the Ministry of Education and Training (5652/QĐ-BGDĐT) in Vietnam under the grant number B2019 –SPH - 03. P.H.T was supported by Vietnam Academy of Science and Technology (VAST) under grant number VAST05.04/16-17.

Acknowledgments

The authors owe a debt of gratitude to University of Social Sciences and Humanities, VNU-HCM, Ho Chi Minh City Institute of Resources Geography, Vietnamese Academy of Science and Technology, and Hanoi National University of Education for supporting software and data. We also thank the USGS and NASA for the freely accessible MODIS data products.

Conflicts of Interest

The authors declare no conflict of interest. The funders had no role in the design of the study; in the collection, analyses, or interpretation of data; in the writing of the manuscript, or in the decision to publish the results.

References

  1. Park, S.; Im, J.; Jang, E.; Rhee, J. Drought assessment and monitoring through blending of multi-sensor indices using machine learning approaches for different climate regions. Agric. For. Meteorol. 2016, 216, 157–169. [Google Scholar] [CrossRef]
  2. Petropoulos, G.P.; Islam, T. Remote Sensing of Hydrometeorological Hazards; CRC Press: Boca Raton, FL, USA, 2017; ISBN 1-351-65097-1. [Google Scholar]
  3. Murad, H.; Islam, A.S. Drought assessment using remote sensing and GIS in north-west region of Bangladesh. In Proceedings of the 3rd International Conference on Water and Flood Management, Dhaka, Bangladesh, 8–10 January 2011; pp. 2797–2804. [Google Scholar]
  4. Tigkas, D.; Vangelis, H.; Tsakiris, G. DrinC: A software for drought analysis based on drought indices. Earth Sci. Inf. 2015, 8, 697–709. [Google Scholar] [CrossRef]
  5. Zormand, S.; Jafari, R.; Koupaei, S.S. Assessment of PDI, MPDI and TVDI drought indices derived from MODIS Aqua/Terra Level 1B data in natural lands. Nat. Hazards 2017, 86, 757–777. [Google Scholar] [CrossRef]
  6. Heim, R.R., Jr. A review of twentieth-century drought indices used in the United States. Bull. Am. Meteorol. Soc. 2002, 83, 1149–1166. [Google Scholar] [CrossRef]
  7. Yang, T.; Zhou, X.; Yu, Z.; Krysanova, V.; Wang, B. Drought projection based on a hybrid drought index using Artificial Neural Networks. Hydrol. Process. 2014, 29, 2635–2648. [Google Scholar] [CrossRef]
  8. Park, S.; Seo, E.; Kang, D.; Im, J.; Lee, M.-I. Prediction of drought on pentad scale using remote sensing data and MJO index through random forest over East Asia. Remote Sens. 2018, 10, 1811. [Google Scholar] [CrossRef]
  9. Hua, L.; Wang, H.; Sui, H.; Wardlow, B.; Hayes, M.J.; Wang, J. Mapping the spatial-temporal dynamics of vegetation response lag to drought in a semi-arid region. Remote Sens. 2019, 11, 1873. [Google Scholar] [CrossRef]
  10. Hung, N.D.; Thuong, V.T.; Hieu, T.N. The spatial distribution of drought index in dry season in Tien Giang province under representative concentration pathways scenarios 4.5 and 8.5. Disaster Adv. 2017, 10, 27–33. [Google Scholar]
  11. Huynh, H.; Chi, Q.T.; Dan, T. Application the MODIS images to monitor the change of land surface temperature and drought situation in the Mekong Delta. Cantho Univ. J. Sci. 2012, 2012, 49–59. [Google Scholar]
  12. Ty, V.T.; Hoai, T.T.D.; Minh, V.T.H. Mapping meteorological drought in the Mekong Delta under climate change. Cantho Univ. J. Sci. 2015, 2025, 1980–2012. [Google Scholar]
  13. AghaKouchak, A.; Nakhjiri, N. A near real-time satellite-based global drought climate data record. Environ. Res. Lett. 2012, 7, 044037. [Google Scholar] [CrossRef]
  14. AghaKouchak, A.; Farahmand, A.; Melton, F.S.; Teixeira, J.; Anderson, M.C.; Wardlow, B.D.; Hain, C.R. Remote sensing of drought: Progress, challenges and opportunities. Rev. Geophys. 2015, 53, 452–480. [Google Scholar] [CrossRef]
  15. Easterling, D.R. Global data sets for analysis of climate extremes. In Extremes in a Changing Climate; Springer: Dordrecht, The Netherlands, 2013; pp. 347–361. [Google Scholar]
  16. Zarch, M.A.A.; Sivakumar, B.; Sharma, A. Droughts in a warming climate: A global assessment of standardized precipitation index (SPI) and reconnaissance drought index (RDI). J. Hydrol. 2015, 526, 183–195. [Google Scholar] [CrossRef]
  17. Tigkas, D.; Vangelis, H.; Tsakiris, G. The RDI as a composite climatic index. Eur. Water 2013, 41, 17–22. [Google Scholar]
  18. Elhag, K.; Zhang, W. Monitoring and assessment of drought focused on its impact on sorghum yield over Sudan by using meteorological drought indices for the period 2001–2011. Remote Sens. 2018, 10, 1231. [Google Scholar] [CrossRef]
  19. McKee, T.B.; Doesken, N.J.; Kleist, J. The relationship of drought frequency and duration to time scales. In Proceedings of the 8th Conference on Applied Climatology, Anaheim, CA, USA, 17–22 January 1993; Volume 17, pp. 179–183. [Google Scholar]
  20. Mu, Q.; Zhao, M.; Running, S.W. Improvements to a MODIS global terrestrial evapotranspiration algorithm. Remote Sens. Environ. 2011, 115, 1781–1800. [Google Scholar] [CrossRef]
  21. Palmer, W.C. Meteorological Drought; US Department of Commerce, Weather Bureau: Washington, DC, USA, 1965; Volume 30.
  22. Hao, Z.; AghaKouchak, A. Multivariate standardized drought index: A parametric multi-index model. Adv. Water Resour. 2013, 57, 12–18. [Google Scholar] [CrossRef]
  23. Hao, Z.; Singh, V.P. Drought characterization from a multivariate perspective: A review. J. Hydrol. 2015, 527, 668–678. [Google Scholar] [CrossRef]
  24. Mu, Q.; Zhao, M.; Kimball, J.S.; McDowell, N.G.; Running, S.W. A remotely sensed global terrestrial drought severity index. Bull. Am. Meteorol. Soc. 2013, 94, 83–98. [Google Scholar] [CrossRef]
  25. Um, M.-J.; Kim, Y.; Park, D. Evaluation and modification of the Drought Severity Index (DSI) in East Asia. Remote Sens. Environ. 2018, 209, 66–76. [Google Scholar] [CrossRef]
  26. Keyantash, J.; Dracup, J.A. The quantification of drought: An evaluation of drought indices. Bull. Am. Meteorol. Soc. 2002, 83, 1167–1180. [Google Scholar] [CrossRef]
  27. Tsakiris, G.; Pangalou, D.; Vangelis, H. Regional drought assessment based on the Reconnaissance Drought Index (RDI). Water Resour. Manag. 2007, 21, 821–833. [Google Scholar] [CrossRef]
  28. Francis, K. Reconnaissance drought index as potential drought monitoring tool in a Deccan plateau, hot semi-arid climatic zone. Int. J. Agric. Sci. 2017, 9, 2183–2186. [Google Scholar]
  29. Amani, M.; Salehi, B.; Mahdavi, S.; Masjedi, A.; Dehnavi, S. Temperature-vegetation-soil moisture dryness index (TVMDI). Remote Sens. Environ. 2017, 197, 1–14. [Google Scholar] [CrossRef]
  30. Dorjsuren, M.; Liou, Y.-A.; Cheng, C.-H. Time series MODIS and in situ data analysis for Mongolia drought. Remote Sens. 2016, 8, 509. [Google Scholar] [CrossRef]
  31. Ryu, J.-H.; Han, K.-S.; Lee, Y.-W.; Park, N.-W.; Hong, S.; Chung, C.-Y.; Cho, J. Different agricultural responses to extreme drought events in neighboring counties of South and North Korea. Remote Sens. 2019, 11, 1773. [Google Scholar] [CrossRef]
  32. Schmugge, T. Remote Sensing of Soil Moisture; Goddard Space Flight Center: Greenbelt, MD, USA, 1976.
  33. Son, N.T.; Chen, C.F.; Chen, C.R.; Chang, L.Y.; Minh, V.Q. Monitoring agricultural drought in the Lower Mekong Basin using MODIS NDVI and land surface temperature data. Int. J. Appl. Earth Obs. Geoinf. 2012, 18, 417–427. [Google Scholar] [CrossRef]
  34. Funk, C.; Budde, M.E. Phenologically-tuned MODIS NDVI-based production anomaly estimates for Zimbabwe. Remote Sens. Environ. 2009, 113, 115–125. [Google Scholar] [CrossRef]
  35. Karnieli, A.; Agam, N.; Pinker, R.T.; Anderson, M.; Imhoff, M.L.; Gutman, G.G.; Panov, N.; Goldberg, A. Use of NDVI and land surface temperature for drought assessment: Merits and limitations. J. Clim. 2010, 23, 618–633. [Google Scholar] [CrossRef]
  36. Huete, A.; Didan, K.; Miura, T.; Rodriguez, E.P.; Gao, X.; Ferreira, L.G. Overview of the radiometric and biophysical performance of the MODIS vegetation indices. Remote Sens. Environ. 2002, 83, 195–213. [Google Scholar] [CrossRef]
  37. Kogan, F.; Sullivan, J. Development of global drought-watch system using NOAA/AVHRR data. Adv. Space Res. 1993, 13, 219–222. [Google Scholar] [CrossRef]
  38. Park, J.-S.; Kim, K.-T.; Choi, Y.-S. Application of vegetation condition index and standardized vegetation index for assessment of spring drought in South Korea. In Proceedings of the International Geoscience and Remote Sensing Symposium (IGARSS), Boston, MA, USA, 7–11 July 2008; pp. 774–777. [Google Scholar]
  39. Peters, A.J.; Walter-Shea, E.A.; Ji, L.; Vina, A.; Hayes, M.; Svoboda, M.D. Drought monitoring with NDVI-based standardized vegetation index. Photogramm. Eng. Remote Sens. 2002, 68, 71–75. [Google Scholar]
  40. Kogan, F.N. Application of vegetation index and brightness temperature for drought detection. Adv. Space Res. 1995, 15, 91–100. [Google Scholar] [CrossRef]
  41. McVicar, T.R.; Jupp, D.L. Estimating one-time-of-day meteorological data from standard daily data as inputs to thermal remote sensing based energy balance models. Agric. For. Meteorol. 1999, 96, 219–238. [Google Scholar] [CrossRef]
  42. McVicar, T.R.; Jupp, D.L. Using covariates to spatially interpolate moisture availability in the Murray–Darling Basin: A novel use of remotely sensed data. Remote Sens. Environ. 2002, 79, 199–212. [Google Scholar] [CrossRef]
  43. Anderson, M.C.; Hain, C.; Wardlow, B.; Pimstein, A.; Mecikalski, J.R.; Kustas, W.P. Evaluation of drought indices based on thermal remote sensing of evapotranspiration over the continental United States. J. Clim. 2011, 24, 2025–2044. [Google Scholar] [CrossRef]
  44. Caccamo, G.; Chisholm, L.A.; Bradstock, R.A.; Puotinen, M.L. Assessing the sensitivity of MODIS to monitor drought in high biomass ecosystems. Remote Sens. Environ. 2011, 115, 2626–2639. [Google Scholar] [CrossRef]
  45. Mu, Q.; Heinsch, F.A.; Zhao, M.; Running, S.W. Development of a global evapotranspiration algorithm based on MODIS and global meteorology data. Remote Sens. Environ. 2007, 111, 519–536. [Google Scholar] [CrossRef]
  46. Hundertmark, W. Building drought management capacity in the Mekong River basin. Irrig. Drain. J. Int. Comm. Irrig. Drain. 2008, 57, 279–287. [Google Scholar] [CrossRef]
  47. Mekong River Commisson (MRC). Overview of the Hydrology of the Mekong Basin; Mekong River Commisson: Phnom Penh, Cambodia, 2005; pp. 73–75. [Google Scholar]
  48. Guo, H.; Bao, A.; Liu, T.; Ndayisaba, F.; He, D.; Kurban, A.; de Maeyer, P. Meteorological drought analysis in the Lower Mekong Basin using satellite-based long-term CHIRPS product. Sustainability 2017, 9, 901. [Google Scholar] [CrossRef] [Green Version]
  49. Bayarjargal, Y.; Karnieli, A.; Bayasgalan, M.; Khudulmur, S.; Gandush, C.; Tucker, C.J. A comparative study of NOAA–AVHRR derived drought indices using change vector analysis. Remote Sens. Environ. 2006, 105, 9–22. [Google Scholar] [CrossRef]
  50. Jain, S.K.; Keshri, R.; Goswami, A.; Sarkar, A.; Chaudhry, A. Identification of drought-vulnerable areas using NOAA AVHRR data. Int. J. Remote Sens. 2009, 30, 2653–2668. [Google Scholar] [CrossRef]
  51. Dlamini, T.; Songsom, V. Landsat-based drought phenomenon evaluation of cassava and sugar cane in Northeast Thailand. J. Eng. Sci. Res. 2019, 3, 6–13. [Google Scholar]
  52. Van den Hoek, J.; Getirana, A.; Jung, H.C.; Okeowo, M.A.; Lee, H. Monitoring reservoir drought dynamics with landsat and radar/lidar altimetry time series in persistently cloudy Eastern Brazil. Remote Sens. 2019, 11, 827. [Google Scholar] [CrossRef] [Green Version]
  53. Urban, M.; Berger, C.; Mudau, T.; Heckel, K.; Truckenbrodt, J.; Odipo, V.O.; Smit, I.; Schmullius, C. Surface moisture and vegetation cover analysis for drought monitoring in the Southern Kruger National Park using sentinel-1, sentinel-2, and landsat-8. Remote Sens. 2018, 10, 1482. [Google Scholar] [CrossRef] [Green Version]
  54. Beaton, A.; Whaley, R.; Corston, K.; Kenny, F. Identifying historic river ice breakup timing using MODIS and Google Earth Engine in support of operational flood monitoring in Northern Ontario. Remote Sens. Environ. 2019, 224, 352–364. [Google Scholar] [CrossRef]
  55. Bajgain, R.; Xiao, X.; Basara, J.; Wagle, P.; Zhou, Y.; Zhang, Y.; Mahan, H. Assessing agricultural drought in summer over Oklahoma Mesonet sites using the water-related vegetation index from MODIS. Int. J. Biometeorol. 2016, 61, 377–390. [Google Scholar] [CrossRef] [Green Version]
  56. Son, N.T.; Chen, C.F.; Chen, C.R.; Masferrer, M.G.M.; Recinos, L.E.M. Multitemporal Landsat-MODIS fusion for cropland drought monitoring in El Salvador. Geocarto Int. 2019, 34, 1363–1383. [Google Scholar] [CrossRef]
  57. Tran, T.V.; Tran, D.X.; Myint, S.W.; Huang, C.; Pham, H.V.; Luu, T.H.; Vo, T.M.T. Examining spatiotemporal salinity dynamics in the Mekong River Delta using Landsat time series imagery and a spatial regression approach. Sci. Total Environ. 2019, 687, 1087–1097. [Google Scholar] [CrossRef]
  58. Chen, C.-F.; Son, N.-T.; Chang, L.-Y.; Chen, C.-C. Monitoring of soil moisture variability in relation to rice cropping systems in the Vietnamese Mekong Delta using MODIS data. Appl. Geogr. 2011, 31, 463–475. [Google Scholar] [CrossRef]
  59. Frey, C.M.; Kuenzer, C. Analysing a 13 years MODIS land surface temperature time series in the Mekong Basin. In Remote Sensing Time Series; Springer: Cham, Switzerland, 2015; pp. 119–140. [Google Scholar]
  60. Ceccato, P.; Flasse, S.; Tarantola, S.; Jacquemoud, S.; Grégoire, J.-M. Detecting vegetation leaf water content using reflectance in the optical domain. Remote Sens. Environ. 2001, 77, 22–33. [Google Scholar] [CrossRef]
  61. Gao, B. NDWI—A normalized difference water index for remote sensing of vegetation liquid water from space. Remote Sens. Environ. 1996, 58, 257–266. [Google Scholar] [CrossRef]
  62. Hu, M.; Xia, B. A significant increase in the normalized difference vegetation index (NDVI) during the rapid economic development in the Pearl River Delta of China. Land Degrad. Dev. 2018, 30, 359–370. [Google Scholar]
  63. Ishtiaque, A.; Myint, S.W.; Wang, C. Examining the ecosystem health and sustainability of the world’s largest mangrove forest using multi-temporal MODIS products. Sci. Total Environ. 2016, 569, 1241–1254. [Google Scholar] [CrossRef] [PubMed]
  64. Liu, Y.; Wang, Y.; Peng, J.; Du, Y.; Liu, X.; Li, S.; Zhang, D. Correlations between urbanization and vegetation degradation across the world’s metropolises using DMSP/OLS nighttime light data. Remote Sens. 2015, 7, 2067–2088. [Google Scholar] [CrossRef] [Green Version]
  65. Schucknecht, A.; Erasmi, S.; Niemeyer, I.; Matschullat, J. Assessing vegetation variability and trends in north-eastern Brazil using AVHRR and MODIS NDVI time series. Eur. J. Remote Sens. 2013, 46, 40–59. [Google Scholar] [CrossRef] [Green Version]
  66. Wang, C.; Myint, S.W. Environmental concerns of deforestation in Myanmar 2001–2010. Remote Sens. 2016, 8, 728. [Google Scholar] [CrossRef] [Green Version]
  67. Wang, G.; Yu, M.; Xue, Y. Modeling the potential contribution of land cover changes to the late twentieth century Sahel drought using a regional climate model: Impact of lateral boundary conditions. Clim. Dyn. 2016, 47, 3457–3477. [Google Scholar] [CrossRef] [Green Version]
  68. Zhou, X.; Wang, Y.-C. Dynamics of land surface temperature in response to land-use/cover change. Geogr. Res. 2011, 49, 23–36. [Google Scholar] [CrossRef]
  69. Brunsdon, C.; Fotheringham, A.S.; Charlton, M.E. Geographically weighted regression: A method for exploring spatial nonstationarity. Geogr. Anal. 1996, 28, 281–298. [Google Scholar] [CrossRef]
  70. Ivajnšič, D.; Kaligarič, M.; Žiberna, I. Geographically weighted regression of the urban heat island of a small city. Appl. Geogr. 2014, 53, 341–353. [Google Scholar] [CrossRef]
  71. Mondal, B.; Das, D.N.; Dolui, G. Modeling spatial variation of explanatory factors of urban expansion of Kolkata: A geographically weighted regression approach. Model. Earth Syst. Environ. 2015, 1, 29. [Google Scholar] [CrossRef]
  72. Szymanowski, M.; Kryza, M. Application of geographically weighted regression for modelling the spatial structure of urban heat island in the city of Wroclaw (SW Poland). Procedia Environ. Sci. 2011, 3, 87–92. [Google Scholar] [CrossRef] [Green Version]
  73. Hoa, P.V.; Giang, N.V.; Binh, N.A.; Hai, L.V.H.; Pham, T.-D.; Hasanlou, M.; Bui, D.T. Soil salinity mapping using SAR sentinel-1 data and advanced machine learning algorithms: A case study at Ben Tre Province of the Mekong River Delta (Vietnam). Remote Sens. 2019, 11, 128. [Google Scholar] [CrossRef] [Green Version]
  74. Nguyen, K.A.T.; Pongthanapanich, T. Aquaculture Insurance in Viet Nam: Experiences from the Pilot Programme; Food and Agriculture Organization (FAO): Roma, Italy, 2016. [Google Scholar]
  75. Nguyen, N.A. Historic drought and salinity intrusion in the Mekong Delta in 2016: Lessons learned and response solutions. Vietnam J. Sci. Technol. Eng. 2017, 59, 93–96. [Google Scholar] [CrossRef]
  76. Nguyen, V.L.; Ta, T.K.O.; Tateishi, M. Late Holocene depositional environments and coastal evolution of the Mekong River Delta, Southern Vietnam. J. Asian Earth Sci. 2000, 18, 427–439. [Google Scholar] [CrossRef]
  77. Ta, T.K.O.; Nguyen, V.L.; Tateishi, M.; Kobayashi, I.; Saito, Y. Holocene Delta Evolution and Depositional Models of the Mekong River Delta, Southern Vietnam; Society for Sedimentary Geology: Tulsa, OK, USA, 2005. [Google Scholar]
  78. Son, N.T.; Chen, C.F.; Chen, C.R.; Chang, L.Y.; Duc, H.N.; Nguyen, L.D. Prediction of rice crop yield using MODIS EVI−LAI data in the Mekong Delta, Vietnam. Int. J. Remote Sens. 2013, 34, 7275–7292. [Google Scholar] [CrossRef]
  79. Kantoush, S.; Binh, D.V.; Sumi, T.; Trung, L.V. Impact of upstream hydropower dams and climate change on hydrodynamics of Vietnamese Mekong Delta. Annu. J. Hydraul. Eng. JSCE 2017, 61, I_109–I_114. [Google Scholar] [CrossRef] [Green Version]
  80. Le, T.V.H.; Nguyen, H.N.; Wolanski, E.; Tran, T.C.; Haruyama, S. The combined impact on the flooding in Vietnam’s Mekong River delta of local man-made structures, sea level rise, and dams upstream in the river catchment. Estuar. Coast. Shelf Sci. 2007, 71, 110–116. [Google Scholar] [CrossRef]
  81. Tuan, L.A. Impacts of Climate Change and Sea Level Rise to the Integrated Agriculture-Aquaculture System in the Mekong River Basin—A case study in the Lower Mekong River Delta in Viet Nam; Can Tho University: Can Tho, Vietnam, 2010. [Google Scholar]
  82. Tobler, W. Resolution, Resampling, and All That; Taylor and Francis: New York, NY, USA, 1988. [Google Scholar]
  83. Running, S.W.; Mu, Q.; Zhao, M. MOD16A2 MODIS/Terra Net Evapotranspiration 8-Day L4 Global 500 m SIN Grid V006 [Data Set]; Archived by National Aeronautics and Space Administration; U.S. Government, LP DAAC: Sioux Falls, SD, USA, 2019. [CrossRef]
  84. Cleugh, H.A.; Leuning, R.; Mu, Q.; Running, S.W. Regional evaporation estimates from flux tower and MODIS satellite data. Remote Sens. Environ. 2007, 106, 285–304. [Google Scholar] [CrossRef]
  85. Didan, K.; Munoz, A.B.; Solano, R.; Huete, A. MODIS Vegetation Index User’s Guide (MOD13 Series); The University of Arizona: Tucson, AZ, USA, 2015; pp. 1–38. [Google Scholar]
  86. Wan, Z. Collection-6 MODIS Land Surface Temperature Products Users’ Guide; University of California, Santa Barbara: Santa Barbara, CA, USA, 2013. [Google Scholar]
  87. Tan, C.; Yang, J.; Li, M. Temporal-spatial variation of drought indicated by SPI and SPEI in Ningxia Hui Autonomous Region, China. Atmosphere 2015, 6, 1399–1421. [Google Scholar] [CrossRef] [Green Version]
  88. Holzman, M.E.; Rivas, R.; Piccolo, M.C. Estimating soil moisture and the relationship with crop yield using surface temperature and vegetation index. Int. J. Appl. Earth Obs. Geoinf. 2014, 28, 181–192. [Google Scholar] [CrossRef]
  89. Vlassova, L.; Perez-Cabello, F.; Nieto, H.; Martín, P.; Riaño, D.; de la Riva, J. Assessment of methods for land surface temperature retrieval from Landsat-5 TM images applicable to multiscale tree-grass ecosystem modeling. Remote Sens. 2014, 6, 4345–4368. [Google Scholar] [CrossRef] [Green Version]
  90. Sayão, V.M.; Demattê, J.A.; Bedin, L.G.; Nanni, M.R.; Rizzo, R. Satellite land surface temperature and reflectance related with soil attributes. Geoderma 2018, 325, 125–140. [Google Scholar] [CrossRef]
  91. Müller, B.; Bernhardt, M.; Jackisch, C.; Schulz, K. Estimating spatially distributed soil texture using time series of thermal remote sensing-a case study in central Europe. Hydrol. Earth Syst. Sci. 2016, 20, 3765–3775. [Google Scholar] [CrossRef] [Green Version]
  92. Yao, Y.; Liang, S.; Qin, Q.; Wang, K. Monitoring drought over the conterminous United States using MODIS and NCEP Reanalysis-2 data. J. Appl. Meteorol. Climatol. 2010, 49, 1665–1680. [Google Scholar] [CrossRef]
  93. Tsakiris, G.; Vangelis, H. Establishing a drought index incorporating evapotranspiration. Eur. Water 2005, 9, 3–11. [Google Scholar]
  94. Hawtree, D.; Nunes, J.P.; Keizer, J.J.; Jacinto, R.; Santos, J.; Rial-Rivas, M.E.; Boulet, A.-K.; Tavares-Wahren, F.; Feger, K.-H. Time series analysis of the long-term hydrologic impacts of afforestation in the Águeda watershed of north-central Portugal. Hydrol. Earth Syst. Sci. 2015, 19, 3033–3045. [Google Scholar] [CrossRef] [Green Version]
  95. Ahmad, I.; Tang, D.; Wang, T.; Wang, M.; Wagan, B. Precipitation trends over time using Mann-Kendall and spearman’s rho tests in swat river basin, Pakistan. Adv. Meteorol. 2015, 2015, 431860. [Google Scholar] [CrossRef] [Green Version]
  96. Gocic, M.; Trajkovic, S. Analysis of changes in meteorological variables using Mann-Kendall and Sen’s slope estimator statistical tests in Serbia. Glob. Planet. Chang. 2013, 100, 172–182. [Google Scholar] [CrossRef]
  97. Shadmani, M.; Marofi, S.; Roknian, M. Trend analysis in reference evapotranspiration using Mann-Kendall and Spearman’s Rho tests in arid regions of Iran. Water Resour. Manag. 2012, 26, 211–224. [Google Scholar] [CrossRef] [Green Version]
  98. Gallo, K.P.; Owen, T.W. Satellite-based adjustments for the urban heat island temperature bias. J. Appl. Meteorol. 1999, 38, 806–813. [Google Scholar] [CrossRef] [Green Version]
  99. Szymanowski, M.; Kryza, M. Local regression models for spatial interpolation of urban heat island—An example from Wrocław, SW Poland. Theor. Appl. Climatol. 2012, 108, 53–71. [Google Scholar] [CrossRef] [Green Version]
  100. Svoboda, M.; Fuchs, B. Handbook of Drought Indicators and Indices; World Meteorological Organization: Geneva, Switzerland, 2016. [Google Scholar]
  101. Cao, Y.; Chen, S.; Wang, L.; Zhu, B.; Lu, T.; Yu, Y. An agricultural drought index for assessing droughts using a water balance method: A case study in Jilin Province, Northeast China. Remote Sens. 2019, 11, 1066. [Google Scholar] [CrossRef] [Green Version]
  102. Vicente-Serrano, S.M.; Beguería, S.; Lorenzo-Lacruz, J.; Camarero, J.J.; López-Moreno, J.I.; Azorin-Molina, C.; Revuelto, J.; Morán-Tejeda, E.; Sanchez-Lorenzo, A. Performance of drought indices for ecological, agricultural, and hydrological applications. Earth Interact. 2012, 16, 1–27. [Google Scholar] [CrossRef] [Green Version]
  103. Hamon, W.R. Estimating Potential Evapotranspiration. Ph.D. Thesis, Massachusetts Institute of Technology, Cambridge, MA, USA, 1960. [Google Scholar]
  104. McGuinness, J.L.; Bordne, E.F. A Comparison of Lysimeter-Derived Potential Evapotranspiration with Computed Values; US Department of Agriculture: Washington, DC, USA, 1972.
  105. Blaney, H.F. Determining Water Requirements in Irrigated Areas from Climatological and Irrigation Data; U.S. Soil Conservation Service: Washington, DC, USA, 1952.
  106. Oudin, L.; Hervieu, F.; Michel, C.; Perrin, C.; Andréassian, V.; Anctil, F.; Loumagne, C. Which potential evapotranspiration input for a lumped rainfall–runoff model? Part 2—Towards a simple and efficient potential evapotranspiration model for rainfall–runoff modelling. J. Hydrol. 2005, 303, 290–306. [Google Scholar] [CrossRef]
  107. Thornthwaite, C.W. An approach toward a rational classification of climate. Geogr. Rev. 1948, 38, 55–94. [Google Scholar] [CrossRef]
  108. Sun, Z.; Wang, Q.; Batkhishig, O.; Ouyang, Z. Relationship between evapotranspiration and land surface temperature under energy-and water-limited conditions in dry and cold climates. Adv. Meteorol. 2016, 2016, 1835487. [Google Scholar] [CrossRef] [Green Version]
  109. Xiong, Y.; Zhao, S.; Yin, J.; Li, C.; Qiu, G. Effects of evapotranspiration on regional land surface temperature in an arid oasis based on thermal remote sensing. IEEE Geosci. Remote Sens. Lett. 2016, 13, 1885–1889. [Google Scholar] [CrossRef]
  110. Kawashima, S.; Ishida, T.; Minomura, M.; Miwa, T. Relations between surface temperature and air temperature on a local scale during winter nights. J. Appl. Meteorol. 2000, 39, 1570–1579. [Google Scholar] [CrossRef]
  111. Song, J.; Wang, Z.-H.; Myint, S.W.; Wang, C. The hysteresis effect on surface-air temperature relationship and its implications to urban planning: An examination in Phoenix, Arizona, USA. Landsc. Urban Plan. 2017, 167, 198–211. [Google Scholar] [CrossRef]
  112. Xu, Y.; Knudby, A.; Ho, H.C. Estimating daily maximum air temperature from MODIS in British Columbia, Canada. Int. J. Remote Sens. 2014, 35, 8108–8121. [Google Scholar] [CrossRef]
  113. Xu, Y.; Qin, Z.; Shen, Y. Study on the estimation of near-surface air temperature from MODIS data by statistical methods. Int. J. Remote Sens. 2012, 33, 7629–7643. [Google Scholar] [CrossRef]
  114. Yan, H.; Zhang, J.; Hou, Y.; He, Y. Estimation of air temperature from MODIS data in east China. Int. J. Remote Sens. 2009, 30, 6261–6275. [Google Scholar] [CrossRef]
  115. Dũng, T.V.; Linh, T.N.; Vũ, P.H.; Nguyện, P.C.; Vũ, P.T. Tài nguyên đất đai và đề xuất phát triển vùng chuyên canh khóm trên địa bàn huyện Tân Phước, tỉnh Tiền Giang. Tạp Chí Khoa Học Trường Đại Học Cần Thơ 2016. [Google Scholar] [CrossRef]
  116. Ma, H.; Lin, C.; Hai, P.N. Applying an object-based SVM classifier to explore canopy closure of mangrove forest in the Mekong Delta using sentinel-2 multispectral images. In Proceedings of the IGARSS 2018 IEEE International Geoscience and Remote Sensing Symposium, Valencia, Spain, 22–27 July 2018; pp. 5402–5405. [Google Scholar]
  117. Truong, T.D.; Do, L.H. Mangrove forests and aquaculture in the Mekong river delta. Land Use Policy 2018, 73, 20–28. [Google Scholar] [CrossRef]
  118. Chopra, P. Drought Risk Assessment Using Remote Sensing and GIS: A Case Study of Gujarat; Master Thesis Submitted to the International Institute for Geo-Information Science and Earth Observation; ITC: Enschede, The Netherlands, 2006. [Google Scholar]
  119. Hung, B.V. Identify the major reasons to cause vulnerability to Mekong delta under the impacts of drought and climate change. In Trends in Asian Water Environmental Science and Technology; Springer: Cham, Switzerland, 2017; pp. 211–222. [Google Scholar]
  120. Ministry of Agriculture and Rural Development. Drought and Salinity in the Mekong River Delta; Ministry of Agriculture and Rural Development: Hanoi, Vietnam, 2017.
  121. CGIAR Research Program on Climate Change, Agriculture and Food Security. The Drought and Salinity Intrusion in the Mekong River Delta of Vietnam: Assessment Report; CGIAR Research Program on Climate Change, Agriculture and Food Security: Hanoi, Vietnam, 2016; Available online: https://ccafs.cgiar.org/publications/drought-and-salinity-intrusion-mekong-river-delta-vietnam-assessment-report (accessed on 7 November 2018).
  122. Nghi, N.Q. Phân tích chuỗi giá trị sản phẩm Khóm của Nông hộ tỉnh Tiền Giang. Tạp Chí Khoa Học Trường Đại Học Cần Thơ 2015, 40, 75–82. [Google Scholar]
  123. Trinh, X.H.; Mai, V.Q.; Nguyen, T.H.; Nguyen, T.B.N.; Ha, M.T.; Nguyen, V.L. Dragon Fruit Production in Vietnam: Achievements and Challenges; FFTC Agricultural Policy Platform: Taipei, Taiwan, 2018. [Google Scholar]
Figure 1. Location of the study area and list of meteorological stations in the Mekong River Delta (MRD).
Remotesensing 11 02742 g001
Figure 2. The spatiotemporal correlation between EDSI and DSI in the MRD during the time period of analysis using the geographically weighted regression (GWR).
Remotesensing 11 02742 g002
Figure 3. The GWR analysis between: (a) EVI and ET; (b) EVI and PET; (c) EVI and LST; (d) LST and ET; (e) LST and PET; (f) ET and PET local correlation coefficients (p < 0.01).
Remotesensing 11 02742 g003
Figure 4. GWR analysis between (a) ZRT and ZEVI; (b) ZRT and ZLST, and (c) ZLST and ZEVI local correlation coefficients (p < 0.01).
Remotesensing 11 02742 g004
Figure 5. Spatiotemporal changes in (a) ET (mm/year), (b) PET (mm/year), (c) EVI, and (d) LST (°C/year) in MRD (p < 0.01).
Remotesensing 11 02742 g005
Figure 6. The spatiotemporal distribution of the annual drought index.
Remotesensing 11 02742 g006
Figure 7. Variations in drought levels in different provinces during the 2001–2018 period. The points show the real values in each province and the lines are the polynomial fitting of these points respectively, for each drought category.
Remotesensing 11 02742 g007
Table 1. Earth observation data used in the study site.
DatasetProductsResolution (m)Temporal Resolution
Land Surface Temperature (LST)MOD11A210008 Day Composites
Enhanced Vegetation Index (EVI)MOD13A1500 * (1000)16 Day Composites
Evapotranspiration (ET) and Potential evapotranspiration (PET)MOD16A2500 * (1000)8 Day Composites
* Data at different resolution were resampled to 1000 m resolution pixels.
Table 2. The relationship between the enhanced drought severity index (EDSI), the drought severity index (DSI) and the reconnaissance drought index (RDI), the standardized precipitation index (SPI) measured at the meteorological stations in the study area during the 2001–2018 period.
SPIRDI
r-Valuep-Valuer-Valuep-Value
DSI0.790.0040.780.038
EDSI0.820.0020.780.005
Table 3. The EDSI dynamic range and relative categories for dry conditions.
CategoryDescriptionSPIRDIEDSI
D1Near Drought0.0 to −0.990.50 to 0.650.0 to −0.79
D2Moderate drought−1 to −1.490.20 to 0.49−0.80 to −1.09
D3Severe drought−1.5 to −1.990.03 to 0.20−1.10 to −1.39
D4Extreme drought−2 or less0.03 or less−1.40 or less
Table 4. Summary of results when applying GWR analysis.
Variable NameEVI versus ETEVI versus PETLST versus EVILST versus ETLST versus PETET versus PET
Bandwidth9120.828510.219742.7713,849.1914,969.7413,775.28
Residual Squares0.060.116.247.478.84300,523.43
Effective Number351.28435.44236.98135.49129.64170.10
Sigma0.000.000.030.040.047.68
AICc−61,757.06−98,176.36−27,497.98−19,755.56−26,073.3936.447.66
R20.780.780.930.860.870.64
Where, EVI, ET, PET, and LST are the enhanced vegetation index, the actual evapotranspiration, the potential evapotranspiration; and the land surface temperature, respectively.
Table 5. Concluding changes of environmental factors in the study area using Theil Sen slope analysis with p < 0.01.
ProvinceArea Decrease (Square km)Area Increase (Square km)
ETPETEVILSTETPETEVILST
An Giang129.171140.0439.14116.45169.29334.671514.83222.14
Bac Lieu29.3696.88326.84993.251020.651299.54988.366.85
Ben Tre370.88929.6489.0539.14374.79804.391217.34987.38
Ca Mau18.59119.391025.54583.231823.083963.221447.3116.64
Can Tho123.3149.72134.06--24.46246.6354.24313.14
Dong Thap358.161088.17116.45--210.39415.891601.92640.96
Hau Giang124.2896.8889.055.8787.09309.23681.09478.52
Kien Giang26.42921.821208.541613.67657.62168.522102.9519.57
Long An304.341991.39182.0123.49451.12802.432839.821689.99
Soc Trang99.81293.57214.31292.591024.57893.441618.56357.18
Tien Giang633.141130.25260.315.66124.28543.11882.671595.07
Tra Vinh74.37368.92238.77166.36682.06567.571053.92495.16
Vinh Long125.26570.5152.84--76.33188.86454.06961.94
Total2417.088897.183976.93849.716725.7112,537.4716,757.077784.54
% of MRD6.0422.249.949.6216.8131.3441.8919.46
Table 6. Summary of the results corresponding to the trend of area slope and correlation coefficients among different drought categories by provincial level. All cases: p < 0.01.
ProvinceD1D2D3D4
SlopeR2SlopeR2SlopeR2SlopeR2
Long An−6.410.35−0.210.620.940.648.760.78
Tien Giang−3.090.320.150.460.690.493.710.81
Ben Tre−0.210.180.740.410.680.352.860.85
Dong Thap−3.710.090.020.310.960.342.390.26
Tra Vinh−5.090.35−0.370.350.840.376.780.72
Vinh Long−2.370.24−0.090.410.360.382.480.75
Can Tho−2.040.080.380.080.710.141.110.16
An Giang−4.760.120.470.141.570.233.520.23
Soc Trang−5.120.12−0.210.260.310.294.830.39
Hau Giang−4.670.281.020.19−0.560.170.360.10
Bac Lieu−3.310.111.710.082.032.202.910.19
Kien Giang−13.40.330.840.013.400.2214.80.51
Ca Mau−4.240.123.520.253.980.3011.10.57
Table 7. The spatiotemporal changes in EDSI area (km2) by types of land use in the 2000–2018 period.
No.Land Use TypesIncreased AreaDecreased Area
1Rice Paddy Land6951.72309.73
2Annual Crops866.15374.84
3Perennial Industrial Tree220.21176.17
4Built-up1276.22198.68
5Forest275.99239.78
6Water Bodies48.93488.37

