Article

Monitoring Oil Exploitation Infrastructure and Dirt Roads with Object-Based Image Analysis and Random Forest in the Eastern Mongolian Steppe

by
Batnyambuu Dashpurev
1,2,*,
Jörg Bendix
2 and
Lukas W. Lehnert
1
1
Department of Geography, Ludwig-Maximilians-University Munich, 80333 Munich, Germany
2
Faculty of Geography, Philipps-University of Marburg, 35032 Marburg, Germany
*
Author to whom correspondence should be addressed.
Remote Sens. 2020, 12(1), 144; https://doi.org/10.3390/rs12010144
Submission received: 21 November 2019 / Revised: 14 December 2019 / Accepted: 25 December 2019 / Published: 1 January 2020
(This article belongs to the Special Issue Remote Sensing in Dryland Assessment and Monitoring)

Abstract

:
Information on the spatial distribution of human disturbance is important for assessing and monitoring land degradation. In the Eastern Mongolian Steppe Ecosystem, one of the major driving factors of human-induced land degradation is the expansion of road networks mainly due to intensifications of oil exploration and exploitation. So far, neither the extents of road networks nor the extent of surrounding grasslands affected by the oil industry are monitored which is generally labor consuming. This causes that no information on the changes in the area which is affected by those disturbance drivers is available. Consequently, the study aim is to provide a cost-effective methodology to classify infrastructure and oil exploitation areas from remotely sensed images using object-based classifications with Random Forest. By combining satellite data with different spatial and spectral resolutions (PlanetScope, RapidEye, and Landsat ETM+), the product delivers data since 2005. For the classification variables, segmentation, spectral characteristics, and indices were extracted from all above mentioned imagery and used as predictors. Results show that overall accuracies of land use maps ranged 73%–93% mainly depending on satellites’ spatial resolution. Since 2005, the area of grassland disturbed by dirt roads and oil exploitation infrastructure increased by 88% with its highest expansion by 47% in the period 2005–2010. Settlements and croplands remained relatively constant throughout the 13 years. Comparison of multiscale classification suggests that, although high spatial resolutions are clearly beneficial, all datasets were useful to delineate linear features such as roads. Consequently, the results of this study provide an effective evaluation for the potential of Random Forest for extracting relatively narrow linear features such as roads from multiscale satellite images and map products that are possible to use for detailed land degradation assessments.

Graphical Abstract

1. Introduction

Land degradation is defined by Food and Agriculture Organization of the United Nations [1] as “a reduction in the capacity of the land to provide ecosystem goods and services over a period of time for its beneficiaries”. Degradation is commonly caused by the mismanagement or over-exploitation of natural resources, such as vegetation clearance, nutrient deplete on, overgrazing, inappropriate irrigation, excessive use of agrochemicals, urban sprawl, pollution, or other direct impacts, such as mining, quarrying, trampling, or vehicle off-roading [2]. Consequently, the drivers of land degradation can be separated into those caused by nature (e.g., landslides, drought, floods) or by anthropogenic activities (i.e., human-induced). In particular, the usage of all-terrain vehicles for off-road transportation as a consequence of mining and recreational activities is increasing worldwide, directly resulting in linear degradation pattern in landscapes [3]. The poor infrastructure in the Eastern Mongolian Steppe’s rural areas fosters off-road vehicle travel and transport that consequently induces grassland degradation which is to date a big environmental challenge.
Recent studies report the negative environmental impacts of all forms of linear infrastructure required for natural resources extraction in Mongolia [4,5]. The expansion of dirt road networks as a main type of linear infrastructure has become more apparent in recent decades, mainly due to the rapid economic development [6]. At the same time, approximately 76.8% of the Mongolian countryside is affected by land degradation while 6.1% of the land is extremely degraded due to human activities [7,8]. Both developments are related: The usage of dirt roads accelerates the land degradation process in Mongolian grasslands through vehicle travel that causes the destruction of the surface vegetation, soil compaction, loss of soil aggregation, changes in soil texture, partial or complete removal of the top layer of soil, and loss of soil organisms [9]. Frequent and repeated usage of a track reduces the dirt road condition and leads to the generation of large ruts and corrugations [10]. As a consequence, drivers avoid the usage of bad conditioned old dirt roads and introduce new ones, which can increase the area affected by road transportation year by year. The adverse change of the abandoned roads mentioned above, however, prohibits a fast ecological rehabilitation of the area.
The detection of degradation due to dirt roads in extended and remote areas as the Eastern Mongolian Steppe is hardly possible with ground based surveys. The reasons are that GPS based land surveys are difficult in this remote area and dirt road networks may change rapidly across short time scales. Remote sensing, however, can provide powerful tools to derive accurate and timely information on the spatial distribution of land use/land cover changes over large areas across-scales and the related process of degradation [11,12], e.g., by means of change detection methods.
Assessing the possible environmental impact of dirt road usage by remote sensing is important for environmental conservation and land management in Mongolia. However, high resolution satellite data such as those acquired by WorldView are usually very expensive especially for developing countries [13]. Fortunately, there are several data sources which deliver satellite data free of charge. For regional scale, platforms such as Landsat and Sentinel provide increasing long-term records of continuous, consistent, and freely available imagery [14]. These satellite platforms are often complicated for mapping the dirt road and narrow linear features at local scale because their spatial resolution is coarser than the width of typical dirt roads. Recent studies combined high resolution PlanetScope and RapidEye data free of charge with other satellite imagery and achieved promising results for pixel-based classifications [15,16]. Therefore, such approaches could be straightforward and cost effective methods to detect linear features such as dirt roads and other infrastructure which have not been done so far. The disadvantage of such new satellite data sources is that data is only available for the recent years. Therefore, changes over longer time scales cannot be assessed. An alternative could be to combine high resolution data with data from long-term archives such as Landsat. Obviously, the classification results based on multi resolution remote sensing data have different accuracies which might depend on the spatial resolution of the satellite data [17].
The most common remote sensing classification techniques are pixel-based approaches. However, several studies showed that land-use classifications based on high spatial resolution data are challenging if the size of the target to classify is larger in comparison to the spatial resolution of the imagery [18]. As alternative, those studies suggest that object-oriented approaches may achieve highly accurate results [19]. Furthermore, modern machine learning techniques such as Random Forest now entered the field and have become popular within the remote sensing community due to the their good performance [20]. Recently, a comprehensive review summarized different methods to detect paved roads from high resolution imagery and found generally high accuracies for machine learning techniques [21]. The literature review confirmed that a few studies achieved to extract the oil exploitation infrastructures and dirt roads using different methods through Landsat ETM+ and RapidEye data [22,23,24]. To our knowledge, there is no study on land cover classification of linear features which was conducted combining PlanetScope and RapidEye as high spatial resolution data with Landsat data providing a longer time series.
The major aim of the study is to provide a satellite based land-use classification monitoring product which is useful to detect land-use types such as infrastructure which are attributed to grassland degradation in the Eastern Mongolian Steppe Ecosystem. In this respect, we only use data which is free of charge in order to minimize the future monitoring costs. Specifically, this study aimed to (i) evaluate the suitability of machine learning based supervised object-oriented classification techniques and multiscale and multispectral remote sensing data to detect grasslands disturbed by dirt roads, road construction, oil extraction field and other infrastructure. (ii) The predictive power of multispectral bands, spectral indices and segment properties provided by PlanetScope, RapidEye, and Landsat were examined for linear object classification and (iii) the drivers of land degradation were assessed by analysing recent land use changes in the Eastern Mongolian Steppe. Special care is taken, to quantify the uncertainty arising from the combination of data from different sensors in their spectral and spatial configurations.

2. Materials and Methods
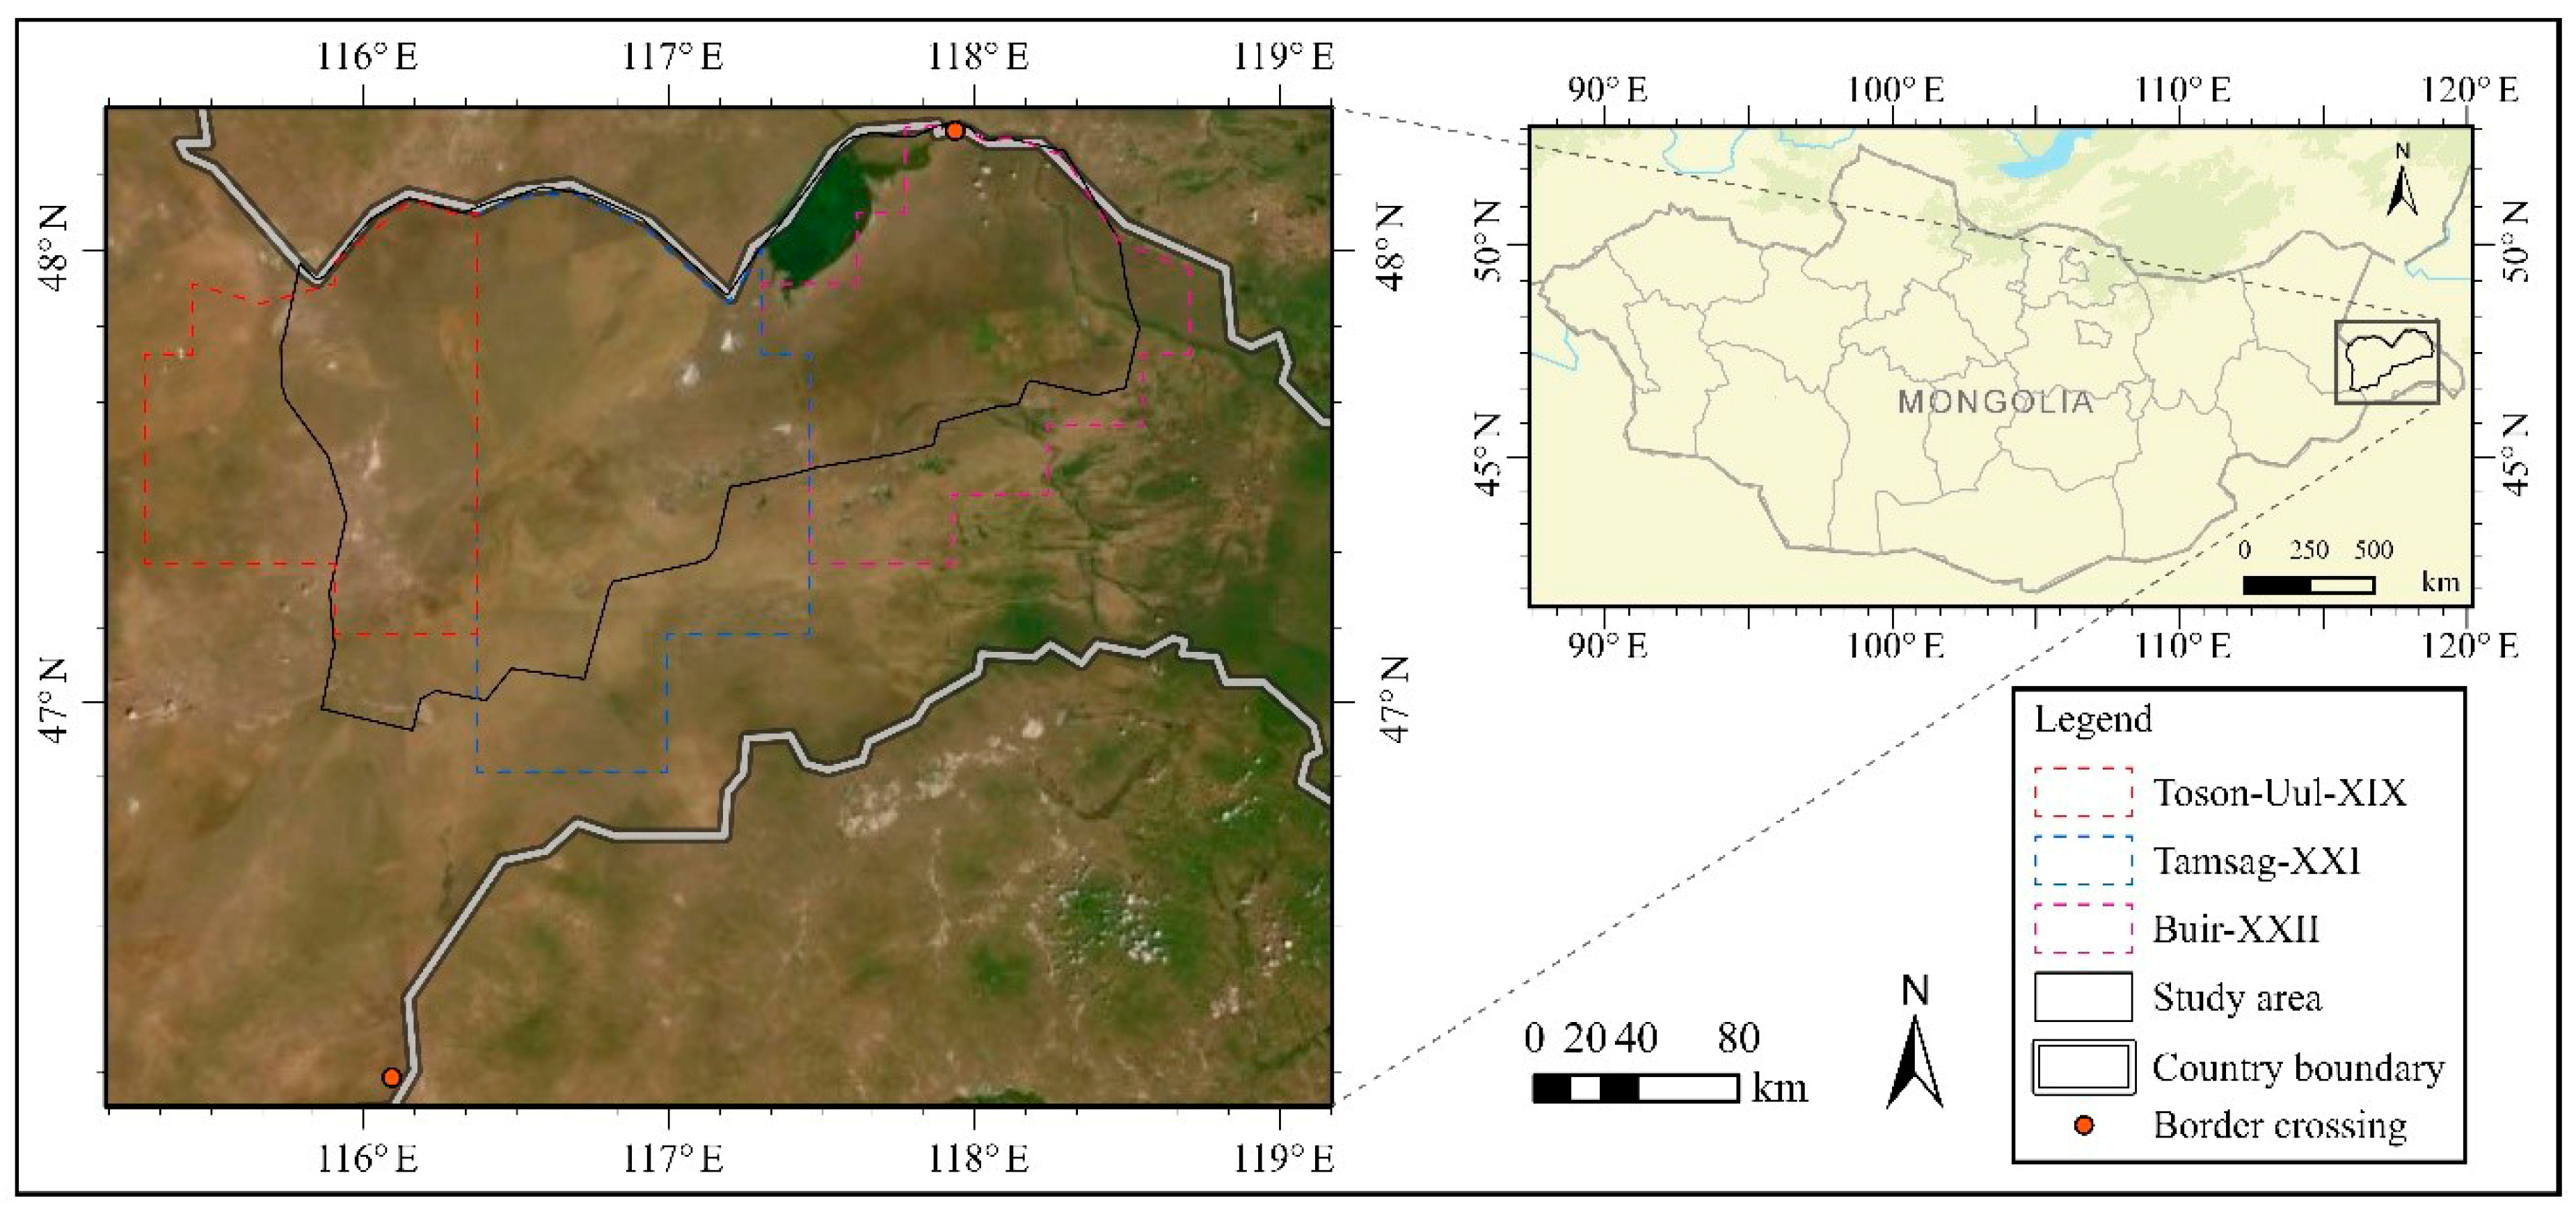
2.1. Study Area

The study was conducted in the Menen Steppe (Menengyn Tal) and the Khalkh river area (Khalkh Gol) which are part of the Eastern Mongolian Steppe in the Dornod province of Mongolia (Figure 1). The study area comprises approximately 20,000 km2 between 46°33′N–48°02′N in latitude and 115°46′E–118°48′E in longitude. The steppe mainly consists of broad plains and rolling hills where the vegetation is dominated by Artemisia sp. and bunch grasses like Stipa sp. The area is characterized by an extremely continental climate. The average monthly temperature minimum reaches from −20 to −24 °C in January, the average maximum monthly temperature of 18–22 °C occurs in July. The average annual precipitation amounts to 200–300 mm, with monthly maxima mainly occurring in boreal summer.
The major land use types in this area are rangelands, croplands, mines and a few permanent settlements [25,26]. The whole study area is covered by the oil exploration licenses divided into several blocks encompassing different areas granted in different years. For instance, block XIX, XXI, and XXII, were issued under the production sharing contract in 1993 and 1995 (Figure 1). In addition, two oil extraction sites were constructed in the Toson Uul XIX and Matad XXI in 2003 and 2005 [27,28].

2.2. Data Collection

The satellite data used for this study are depicted in Table 1. In order to estimate the recent change in transportation infrastructure, a set of 310 multispectral PlanetScope and RapidEye scenes were downloaded free-of-charge from the Planet Labs, Inc. as part of the Education and Research program website (www.planet.com) for the years 2010–2018 [29]. The imagery was selected according to its acquisition date, spatial resolution, and cloud coverage. To avoid major differences in phenology, all selected satellite scenes are acquired during summer and autumn. The satellite images were already georeferenced to the Universal Transverse Mercator (UTM) projection WGS84 zone 50 north.
The information about disturbed grassland change in the study area was obtained by examining a composite of cloud-free multispectral images acquired in 2005 and 2007 by Landsat Enhanced Thematic Mapper Plus (ETM+; bands 1–8). The data were downloaded free-of-charge from the United States Geological Survey’s (USGS) website (https://earthexplorer.usgs.gov/) [30]. For each year, two Landsat scenes (path/row 124/27 and 125/27) covered the study area which were selected that cloud cover was below 10%. They have been merged to achieve one complete datasets.

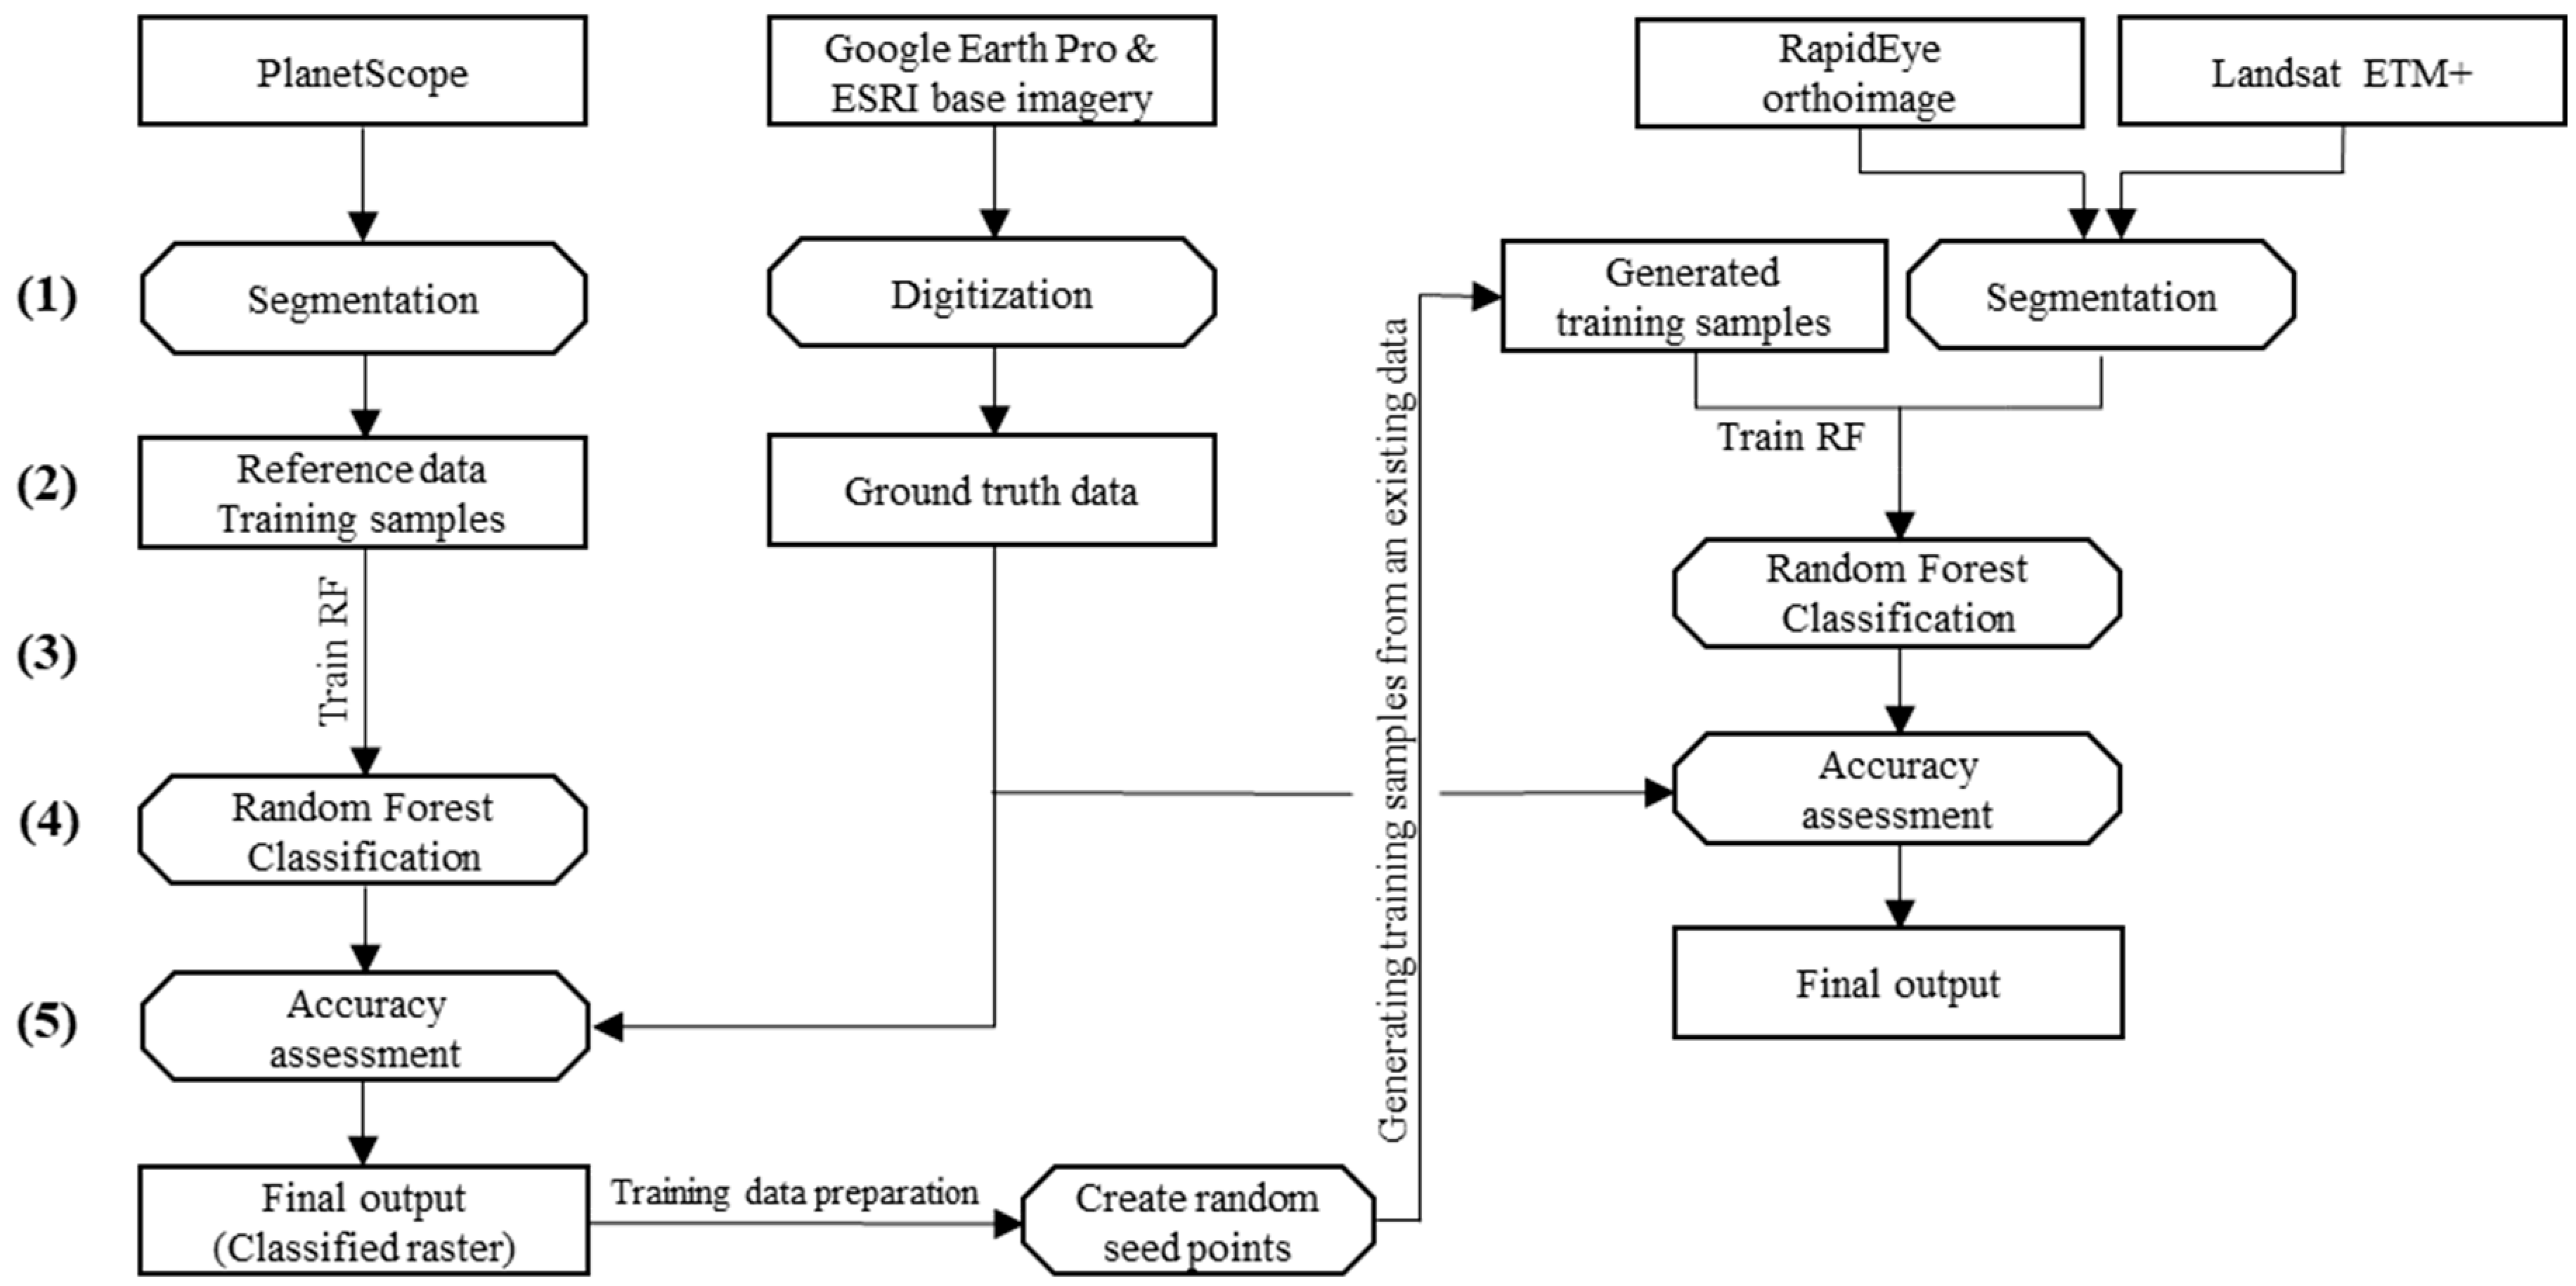
Data Preparation and Pre-Processing

Since the area of investigation was covered by multiple scenes irrespective of the sensor, the top of atmosphere reflectance calibration was applied to all data in each year using sun elevation at the acquisition time, sensor gain and bias for each band and scene. Consequently, single scenes of the same satellite were merged into separate mosaics to achieve datasets covering the entire area of investigation. For Landsat ETM+ data, two additional steps were performed. (1) To fill missing data due to the scan line failure of Landsat ETM+, a global linear histogram matching technique (called SLC Gap-Filled Products Phase One Methodology) was applied [31]. (2) Afterwards, the spatial resolution of the Landsat images was enhanced to 15 m applying the Gram-Schmidt spectral-sharpening algorithm which is a pansharpening technique to increase the spatial resolution of the multispectral images [32].

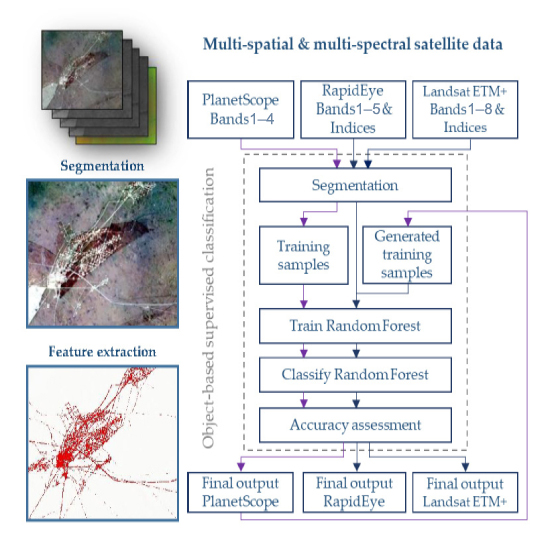
2.3. Supervised Classification Approach

To investigate the change in road networks in Eastern Mongolia during the last decade, supervised classification approaches were performed on all acquired imagery. In contrast to widely used pixel-based approaches, we performed an object-oriented classification to avoid the well-known “salt and pepper effect” if the size of the target to classify is larger in comparison to the spatial resolution of the imagery [18]. Recently, a comprehensive review summarized the supervised object-based land-cover image classification and found the development of the Random Forest (RF) in the supervised object-based framework is experiencing rapid advances and, which shows the best performance in land cover classification [19]. The following four land cover classes were distinguished because they represent the dominant land use categories of the study area: (1) dirt roads and petroleum extraction infrastructure sites, (2) croplands, (3) natural grasslands, and (4) settlement areas. The supervised classification approach involved five main steps (Figure 2): (i) the segmentation of the whole study area into objects, (ii) feature extraction on a segment basis to build a training samples database, (iii) using the training samples database to train Random Forest classifier models, (iv) classify each segment into dirt roads or other land-use, and (v) using Equalized Stratified Random and Cohen’s Kappa scores to determine the accuracy of classified results.
The satellite data in this study feature different spatial resolutions which might have an effect on the accuracy of the classification results and could therefore distort the analysis of land-use changes over time. To quantify this uncertainty, the spatial resolutions of the PlanetScope (3 m) and RapidEye (5 m) images are reduced to 15 m to fit the resolution of Landsat. Those images are termed “spatially binned” datasets in the following. Afterward, the same analysis was performed with the images with artificially reduced spatial resolution and the results were compared to the classifications obtained from the data with original and high spatial resolutions. To save computational time, this was only conducted within a test area instead of the full Eastern Mongolian Steppe ecosystem.

2.3.1. Segmentation

Segmentation is key of any object-based classification workflow. This process groups neighboring pixels together into objects if pixels are similar in spectral and spatial characteristics. In our study, the images of PlanetScope, RapidEye, and Landsat ETM+ were segmented using the mean shift algorithm implemented in version 2.3 of the ArcGIS Pro software, which was developed by Fukunaga and Hostetler and generalized by Cheng [33,34]. After testing several band combinations for their suitability to segment roads in the images, a true color RGB composite was chosen as best option for segmentation based on visual interpretation of the results and expert knowledge. Mean shift is an iterative procedure that shifts each data point to the average of data points in its neighborhood. In this study, the segmentation process used a moving window within which average pixel values were calculated to decide which pixels are grouped into objects. As the window moves over the image, it iteratively re-computes a value to examine that each segment is concise. The characteristics of the image segments are determined by adjusting three parameters which are (i) spectral detail, (ii) spatial detail, and (iii) minimum segment size. In order to specify the spectral and spatial differences of features in each image, the values of segmentation parameters were adjusted on the basis of previous experience, visual analysis of different results and literature reviews. For instance, it is suggested that a higher value of spatial and spectral detail is appropriate in the case that the classified object is smaller than the spatial resolution of satellite image [35,36]. Therefore, values of spectral and spatial detail were set to 18 for all imagery (possible range: 1–20). The size of objects is defined by the parameter of minimum segment size, which merges segments smaller than this criterion with their best fitting neighboring segment. This parameter was adjusted to 30 pixels for PlanetScope, 20 pixels for RapidEye, and 10 pixels for Landsat ETM, which was determined by the minimum mapping unit as average width of linear features. As a result of the segmentation process, a set of attributes was generated for each segment within the input image. This set includes mean, standard deviation, segment size, active chromaticity color, rectangularity, and compactness. “Segment size” indirectly defines the scale of the segments, and rectangularity and compactness are defined by the degree to which a segment is compact or circular. Active chromaticity color is the average RGB color value that is derived from the input image. The segmentation quality was evaluated by means of visual inspection of the results and expert knowledge.

2.3.2. Training Samples

The feature samples were collected from segmented images of PlanetScope to build training datasets. Therefore, segments derived from PlanetScope data in 2018 were randomly and manually chosen and their boundary, homogeneity and heterogeneity values were included in the training dataset. The data of training samples was generated with 500 objects, which were assigned into dirt roads and oil extraction infrastructure (200), for natural grassland (100), cropland (100), and settlement area (100). The merging process was performed using the training tools available in ArcGIS Pro 2.3, which combined the training polygons of each of the four land use types with the selection of optimal object features and segmented layer. The training datasets for the classifications of previous years’ RapidEye and Landsat images were generated from the classified data of PlanetScope images in 2018 (for further details on the classification see previous subsection, Figure 2). The selection of the training samples was repeated for each year using the classified results of the next year as reference. Fifty thousand randomly selected seed points were used to generate training data from an existing classified raster of PlanetScope imagery (Figure 2). In generating the training sample by seed points, the parameters of maximum sample radius and minimum sample area were needed to adjust. After testing several combinations of parameter values, the maximum sample radius was set to 50 meters, which defined the longest distance from any point within the training sample to its center seed point. The minimum sample area was set to 30 square meters. Furthermore, the spectral characteristics and indices were captured by a set of attributes extracted separately from the time series of multispectral images.
In particular several predictor variables were calculated from the four, five, and eight multispectral bands of PlanetScope, RapidEye and, Landsat ETM+ images, respectively. The multispectral bands were associated with polygons corresponding to the segmented image.

2.3.3. Random Forest Classifier

The random forest classification method [37] was applied to all satellite scenes of each year. It is an extension of the classification trees algorithm [38], belonging to the ensemble learning methods. The classification tree algorithm creates individual decision trees automatically based on tree-wise randomly chosen samples and subsets of the training data. For a random forest model, many classification trees are grown and the classification result is derived by a vote of each tree. Each classification tree is constructed separately by using an individual learning algorithm from a random sample of the training data set. At each node of classification trees, the best split is performed based on random subsets of the predictor variables. All trees are grown to the largest possible extent that is controlled by the node size set by the user. To run the random forest classification, it is necessary to define several important adjustable parameters. The primary parameters are the number of classification trees in the forest to run (ntree), number of randomly selected variables to use for building each tree (mtry) and depth of each tree in the forest. The predictor variables are listed in Table 2. Please note that the total number depended on the number of bands of the respective satellite.
The importance of a certain variable to the overall model was calculated by the percentage of tree votes for the correct class in overall trees. In this study, the random forest algorithm [43] implemented in version 2.3 of the ArcGIS Pro software was used. The number of trees (ntree) was set to 2000 for each classification. Default values were used for the number of samples to be used for defining each class and the maximum depth of each tree in the forest. Classification of satellite imageries was performed separately using spectral and spatial variables and collection of training sample data which are delineated from the single date and multi-temporal imagery, respectively.

2.3.4. Accuracy Assessment and Validation

To assess the accuracy of the classification results, a stratified random sampling was applied to create a set of 500 random points independent from the training samples. Each point was manually assigned to its class based on the high-resolution satellite imagery and expert knowledge. The performance of the classifications was assessed by constructing confusion matrices and calculating overall accuracies, Cohen’s Kappa scores, and quantity and allocation disagreement [44,45,46,47,48].
Two different sources for validation were used: (1) The base map images of ESRI (Environmental Systems Research Institute) and (2) Google Earth Pro images [49,50]. Both datasets differ in the temporal information and detail regarding the land use classes. The ground truth data for validation was generated using manual digitization. The objects were carefully selected by the basis of qualitative data of land use of Dornod provice in Mongolia [51]. The values of points were manually extracted and collected from high-resolution imagery of Google Earth Pro and ESRI (Figure 2).

3. Results

3.1. Classification Results and Accuracy

Supervised classification was performed using the random forest classification algorithm on each image to calculate the disturbed grassland due to dirt road and petroleum extraction infrastructure and other land uses for years 2005, 2007, 2010, 2014, and 2018. As a prerequisite to supervised classification, training samples were generated for all the land use classes mentioned above for each image. Three-meter spatial resolution images of PlanetScope enabled the generation of training samples and validation data for the classification. The training samples for RapidEye and Landsat ETM+ were created from an existing result of PlanetScope classification using seed points. The accuracy reports for each classified imagery included a confusion matrix and estimates of overall accuracy, kappa coefficient, user accuracy, producer accuracy, quantity, and allocation disagreement for each land use class. Summary of these metrics are shown in Table 1 for selected classification periods, with the full time series provided in Appendix A Table A1 and Table A2.
For the classification of PlanetScope imagery, the basic information of dirt road and petroleum extraction infrastructure, and other land use classes were extracted from a 3-meter RGB-color mosaic which comprised 200 different PlanetScope scenes acquired in 2018 (Figure 3e). Accuracy assessment on the results revealed good overall classification accuracies and kappa coefficients between 0.85 and 0.91 for all classifications.
In the classification of RapidEye imagery, all land use classes were extracted from a 5-meter natural-color orthoimage that comprised 105 different scenes acquired in 2010 and 2014 (Figure 3c,d). Cohen’s Kappa scores of RapidEye imagery classification were rated between 0.85 and 0.93. To obtain the land use change data in the period 2005 and 2007, the training samples for Landsat ETM+ raster prediction were generated from the classified maps based on PlanetScope acquired in year 2018. The land use classes were assigned to and predicted from a 15-meter mosaic which comprised 2 different Landsat ETM+ scenes acquired in 2007 and 2005 (Figure 3a,b). The Cohen’s Kappa scores were rated 0.65 and 0.75. Some narrow dirt roads or linear features were detected which were not connected to the main network. Those features are most probably falsely classified as roads.

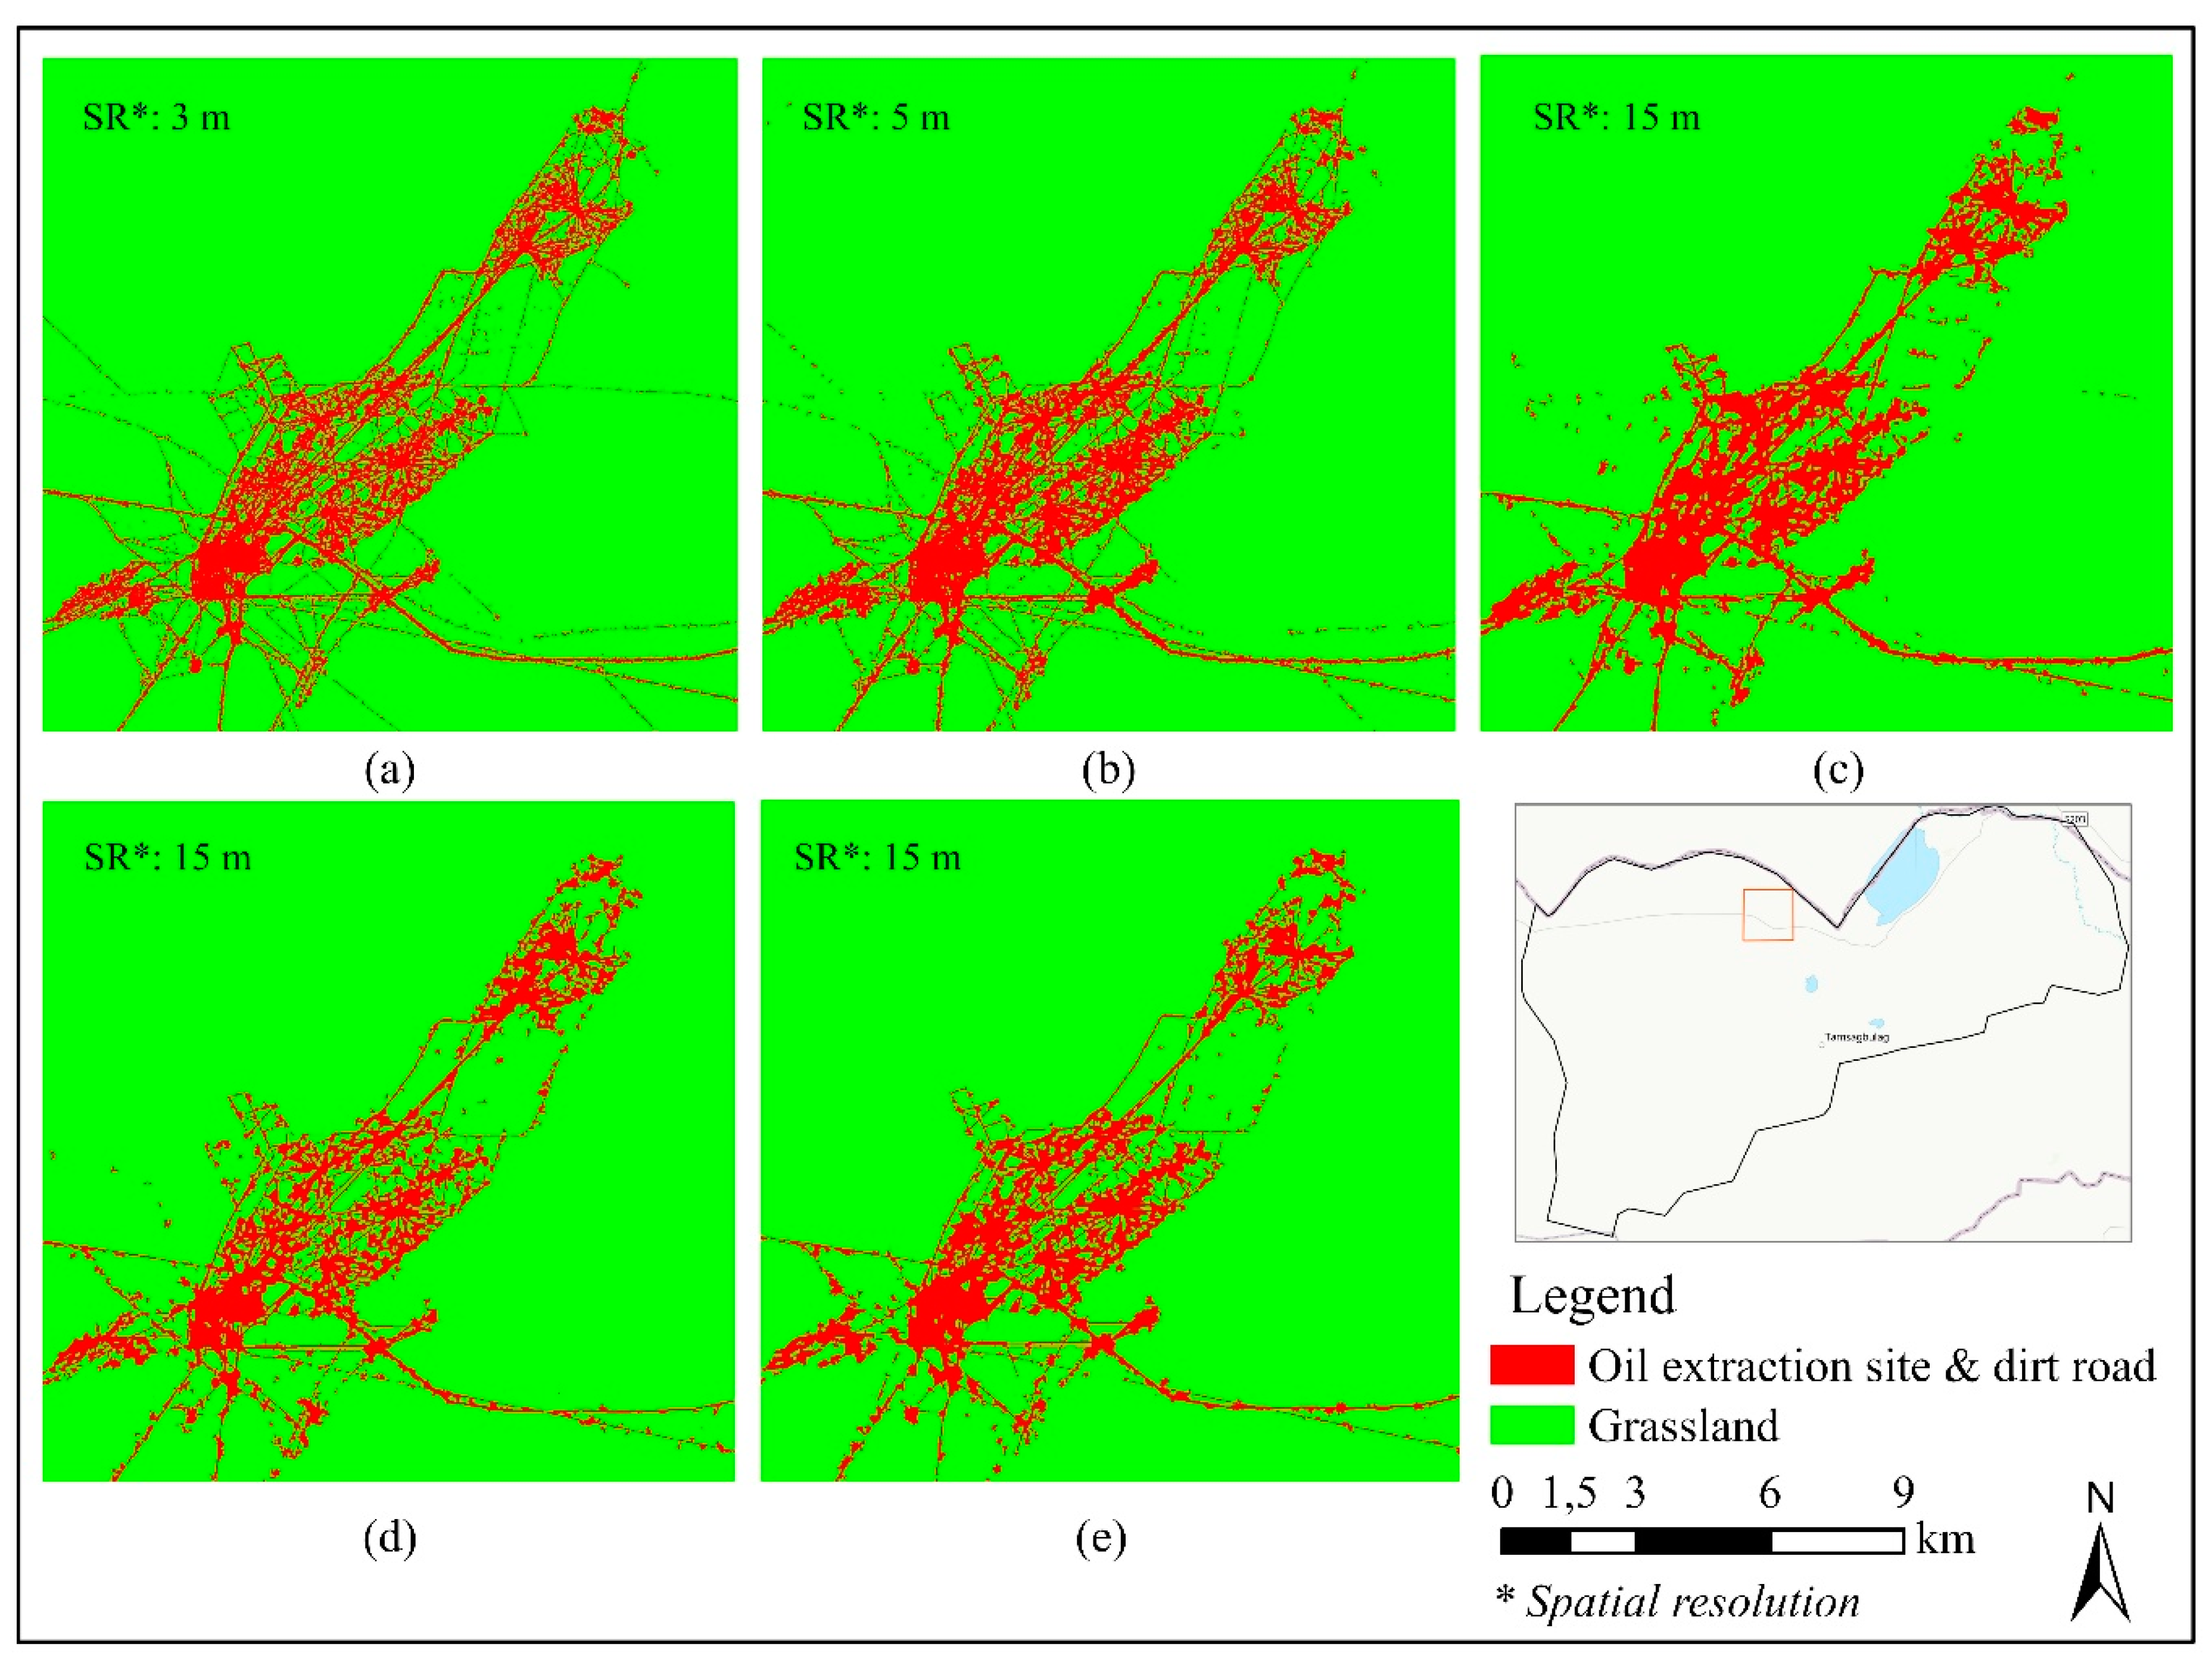
3.2. Comparison of Multiscale Classification by Satellite Images and Up-Scaling Images

The overall accuracies of native satellite imagery were 92.6% for PlanetScope, 87.2% for RapidEye, and 83.2% for Landsat ETM+. Regarding the overall accuracy of spatially binned satellite imagery was 81.8% for PlanetScope (15 m) and 84.6% for RapidEye (15 m). The comparison of original imageries shows that PlaneScope (3 m) has a higher accuracy than RapidEye (5 m) and Landsat (15 m). Comparing the original and spatially binned imagery of PlanetScope, the overall accuracy decreased by 10% as consequence of the reduced spatial resolution. The kappa value declined by 20% from original to spatially binned imagery. For the RapidEye classifications, both overall accuracy and kappa values decreased by 3–5% if the spatial resolution was reduced from 5 m to 15 m (confusion matrices of the classification accuracy are shown in Table A2).
To analyze the dependence of the detection of linear features on spatial resolution, maps were compiled allowing a direct comparison. Figure 4 shows the classified result as dirt roads and oil extraction site, and grassland in the comparison plot of Menen Steppe in 2018. From the difference maps, minimum widths of feature were calculated which are required in relation to the spatial resolution in order to allow a reliable detection. For instance, PlanetScope (3 m) correctly detected linear features >6 m in width, while RapidEye (5 m) correctly detected >10 m wide. Landsat ETM+ (15 m) started to correctly detect linear features >25 m width as well as the spatially binned imagery of PlanetScope (15 m) and RapidEye (15 m). Consequently, a narrow linear feature of below 20 m in width was missed with Landsat ETM+ and all spatially binned imageries. Beside widths of features, their lengths also influenced the probability to be correctly classified. Consequently, narrow linear features below 20 m in widths were correctly classified based on Landsat 15 m data if they were long enough.
Areas with high road densities such as those where multiple parallel dirt road lanes exist, are commonly classified as the linear features in classification of RapidEye (5 m), Landsat ETM+ (15 m), and spatially binned imageries. This overlapping leads to an increase in the size of classified area because pixels between then different lanes are not counted as grasslands. Table 3 provides the total area represented by the class. The result of linear feature class in all original finer resolution imageries was quite similar among the different image sources. For instance, the total area of dirt road and oil extraction infrastructure site was 2532 ha for PlanetScope (3 m) and 2602 ha for RapidEye (5 m), while lower resolution Landsat ETM+ (15 m) detected 2806 ha. Linear feature class in spatially binned imageries varied considerably if compared to original imagery results. As expected, the total area of linear features decreased to 2393 ha for PlanetScope (15 m) and 2473 ha for RapidEye (15 m). Consequently, narrow linear features were missed.

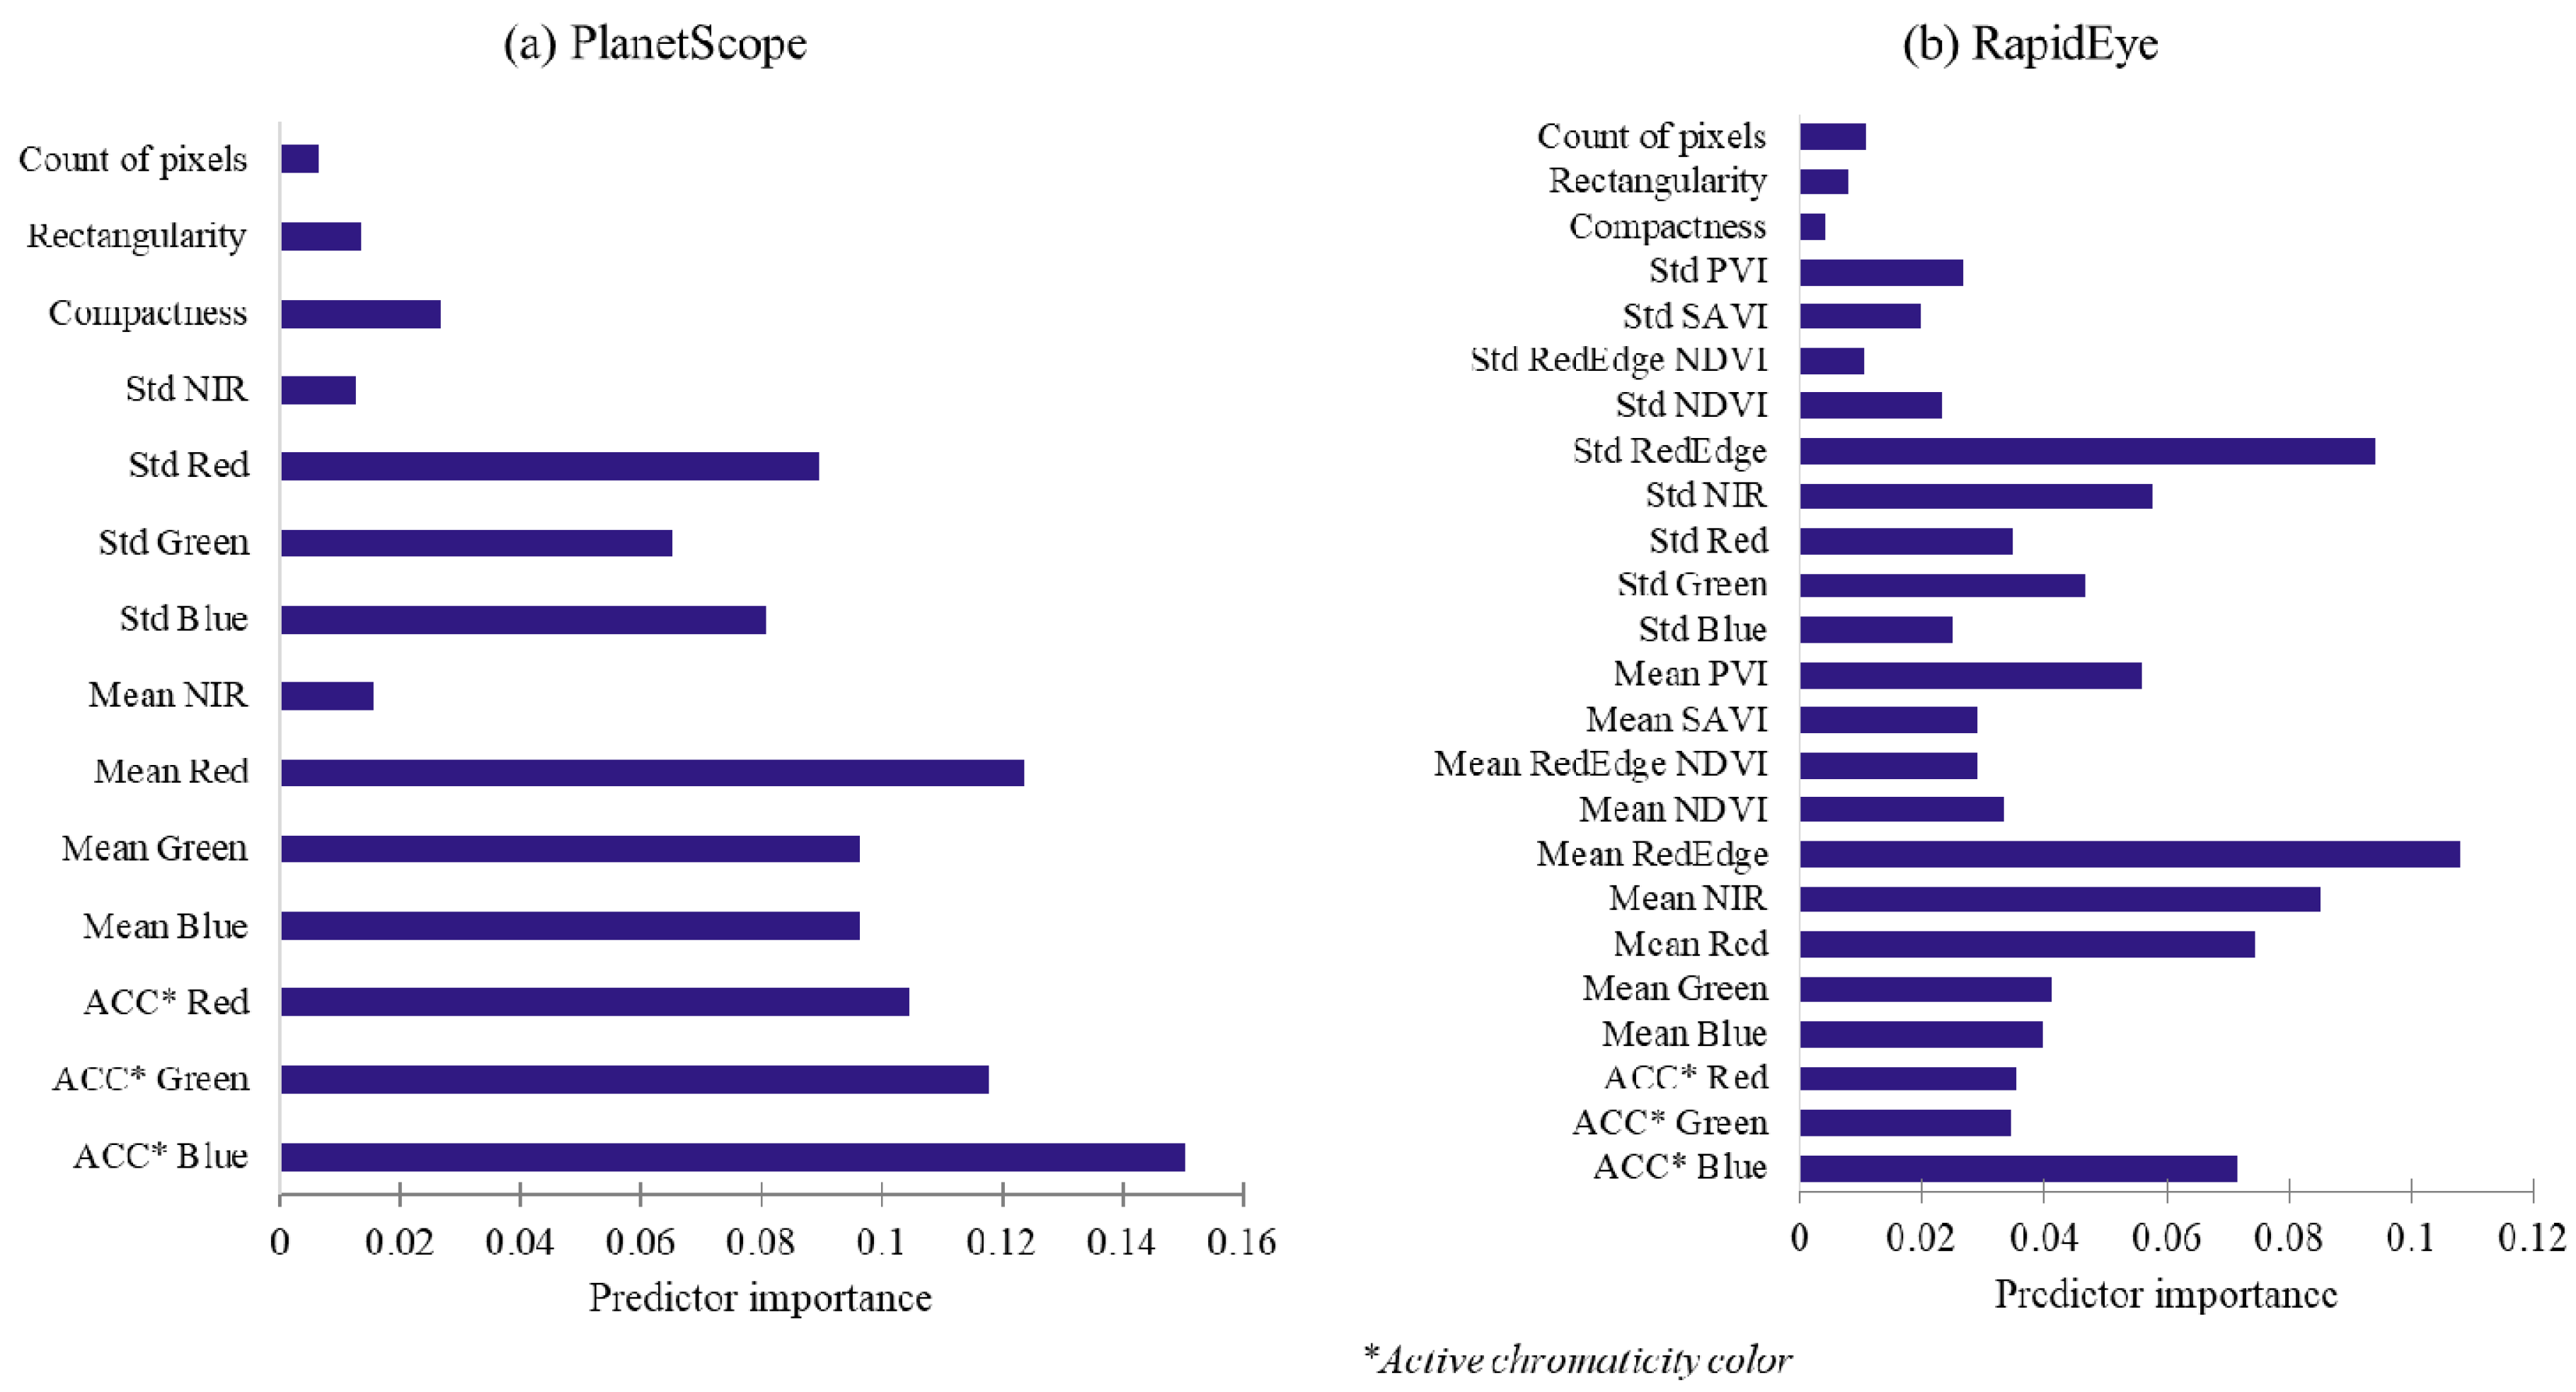
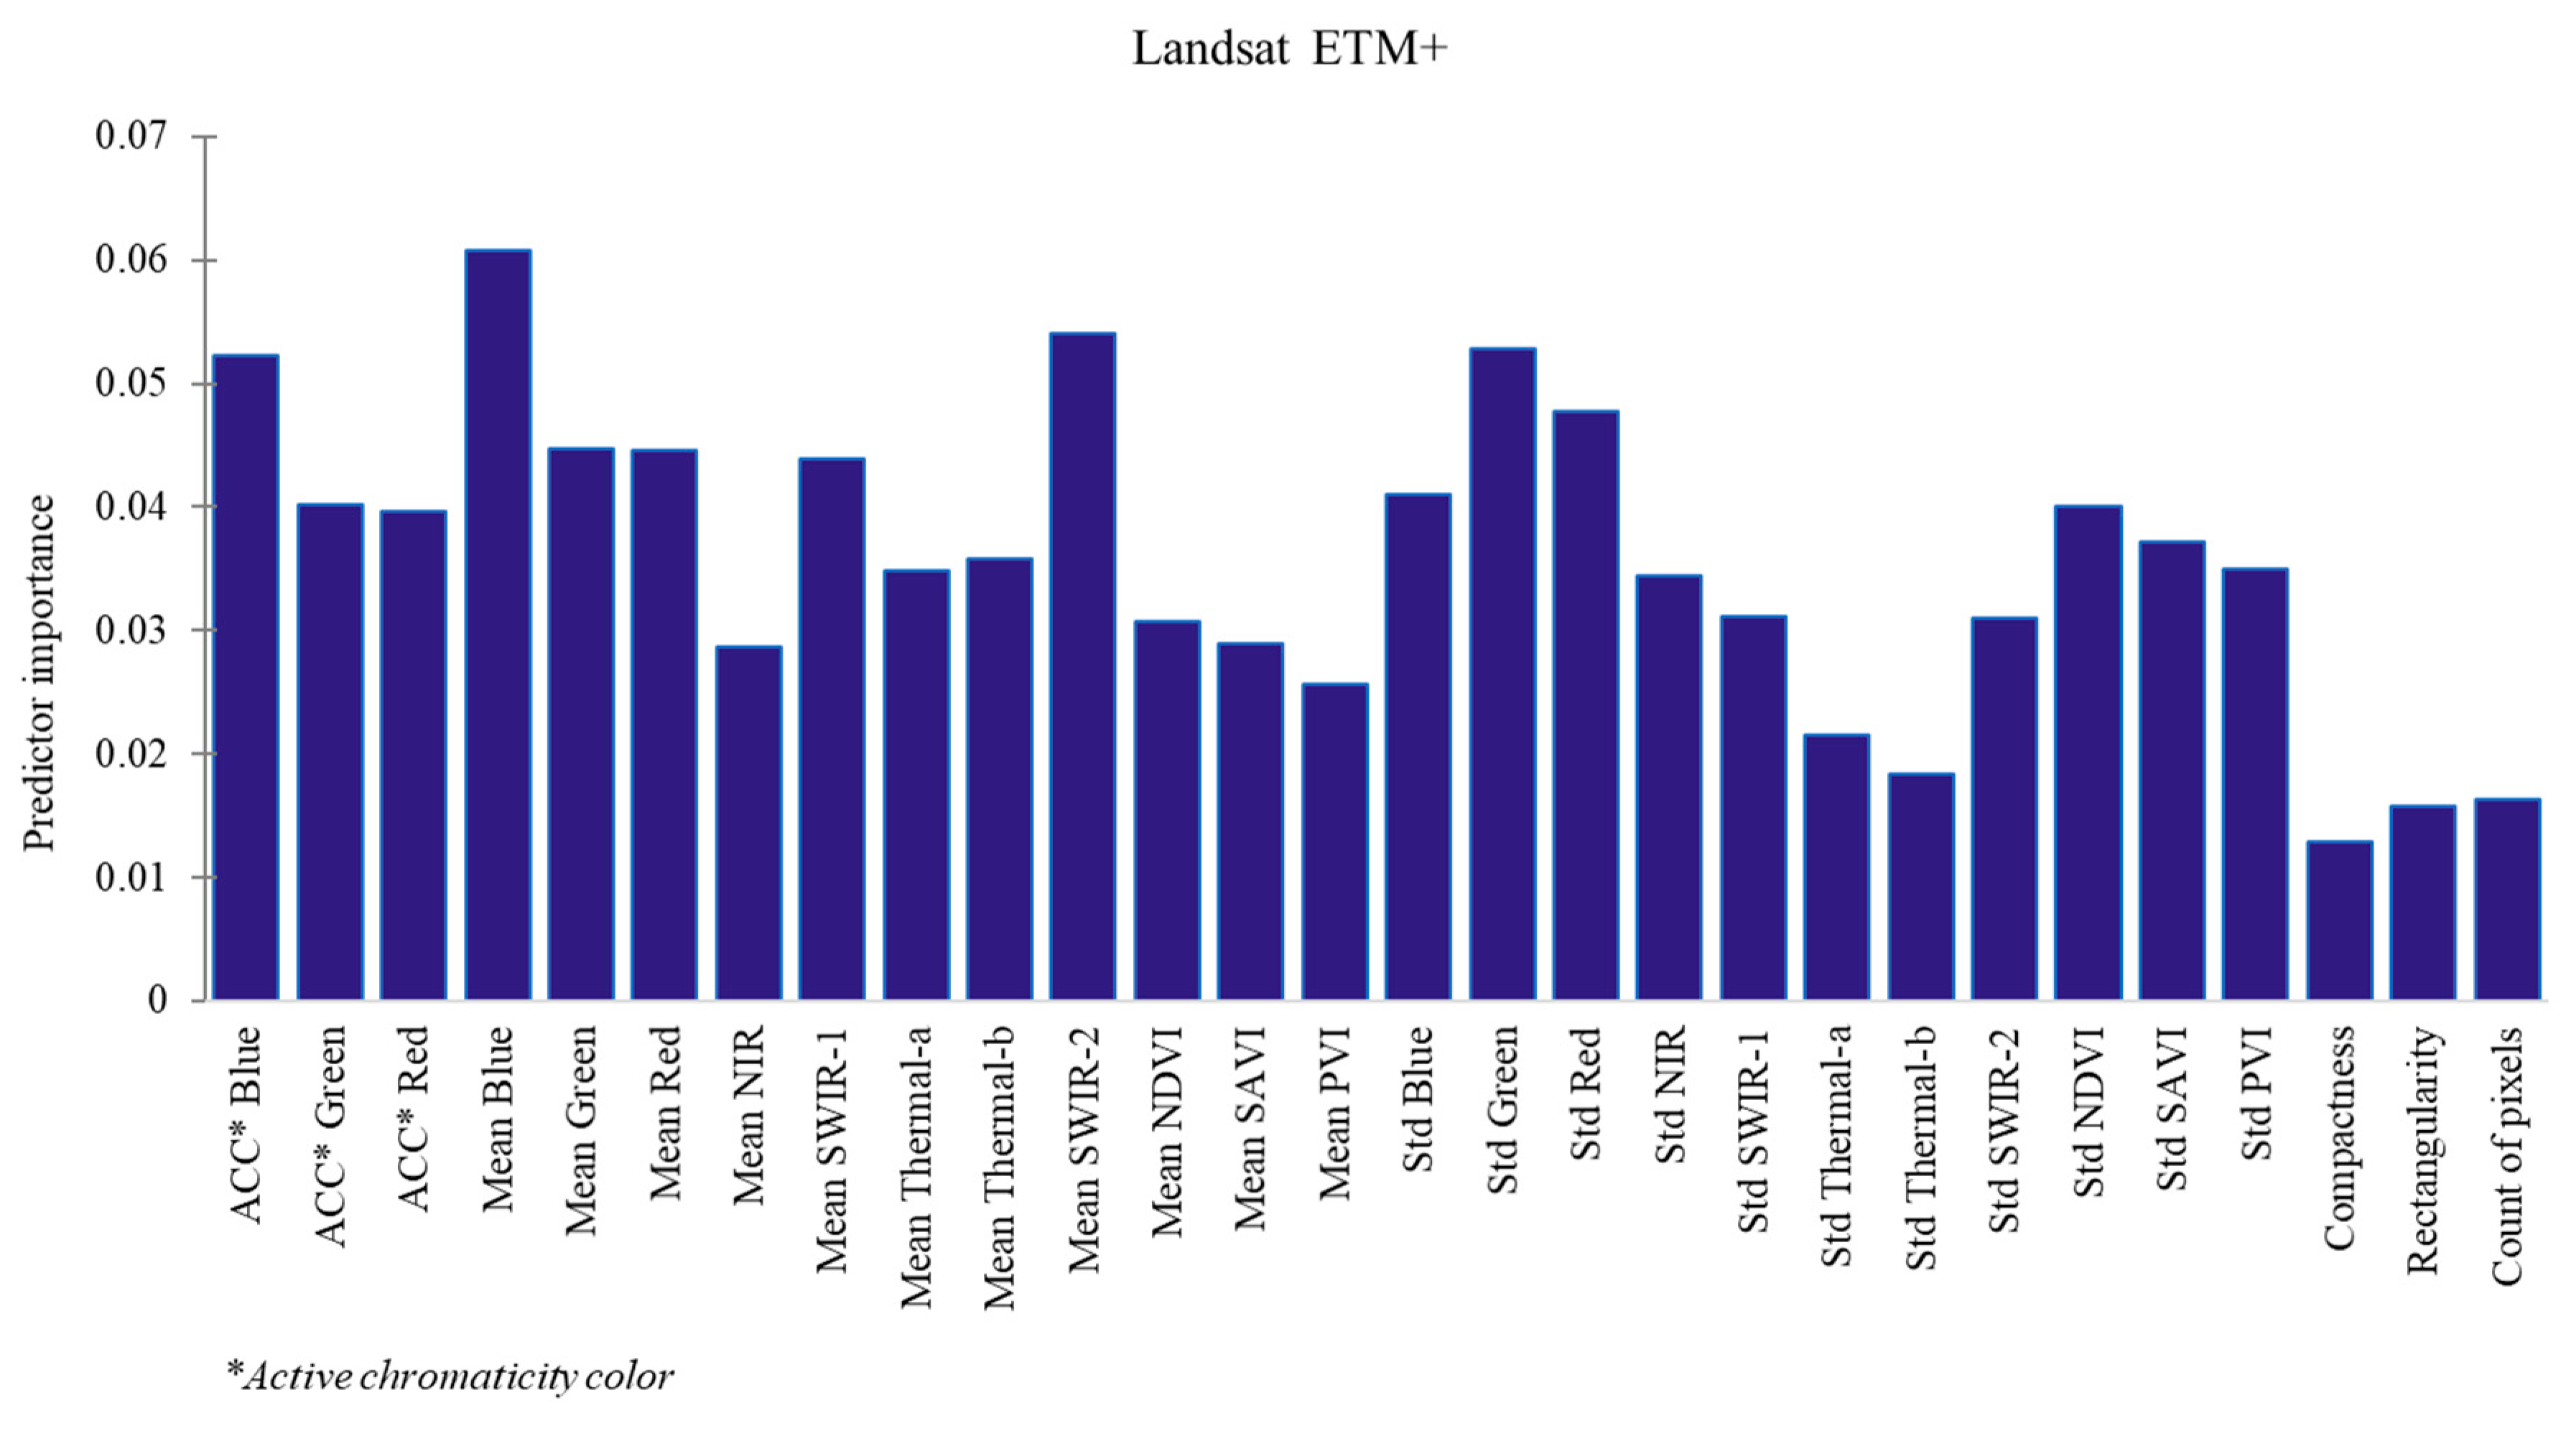
3.3. Analysis of Variable Importance

The variable importance was separately identified for all three different satellite data sources (Figure 5). Concerning PlanetScope data, the active chromaticity color of blue, green, and red were ranked as particularly important for classifying linear feature extraction. For RapidEye data, the variables derived from red edge and near-infrared channels stand out as the most important ones which had 2–3 times higher contributions than the other bands for predicting linear features. Furthermore, other spectral variables of above-mentioned satellite data were generally ranked as relatively important for classification and prediction.
Comparing variables importance in models based on RapidEye and PlanetScope, the mean and standard deviation value of near infrared was twice as high in the former compared to the latter. The largest difference was observed in the active chromaticity color of blue, green, and red, which was 3–4 times more important in models based on in PlanetScope compared to RapidEye.
For the Landsat imagery, the predictor variables derived from visible light and short-wave infrared-2 spectral bands of Landsat ETM+ were among the most important variables for linear feature extraction (Figure 6). In particular, the variables of the blue and short-wave infrared-2 (SWIR 2) band had high importances compared to all other predictors.
In general, the variables derived from NDVI, NDVIred-edge, PVI, and SAVI spectral indices featured low importances compared to multi-spectral bands in both of RapidEye and Landsat ETM+. In the classification of PlanetScope, the variables of active chromaticity color in segmentation were more important than other spectral bands variables. In contrary, the variables of active chromaticity color in segmentation, spectral bands and indices in Landsat ETM+ were equally involved in the classification model.

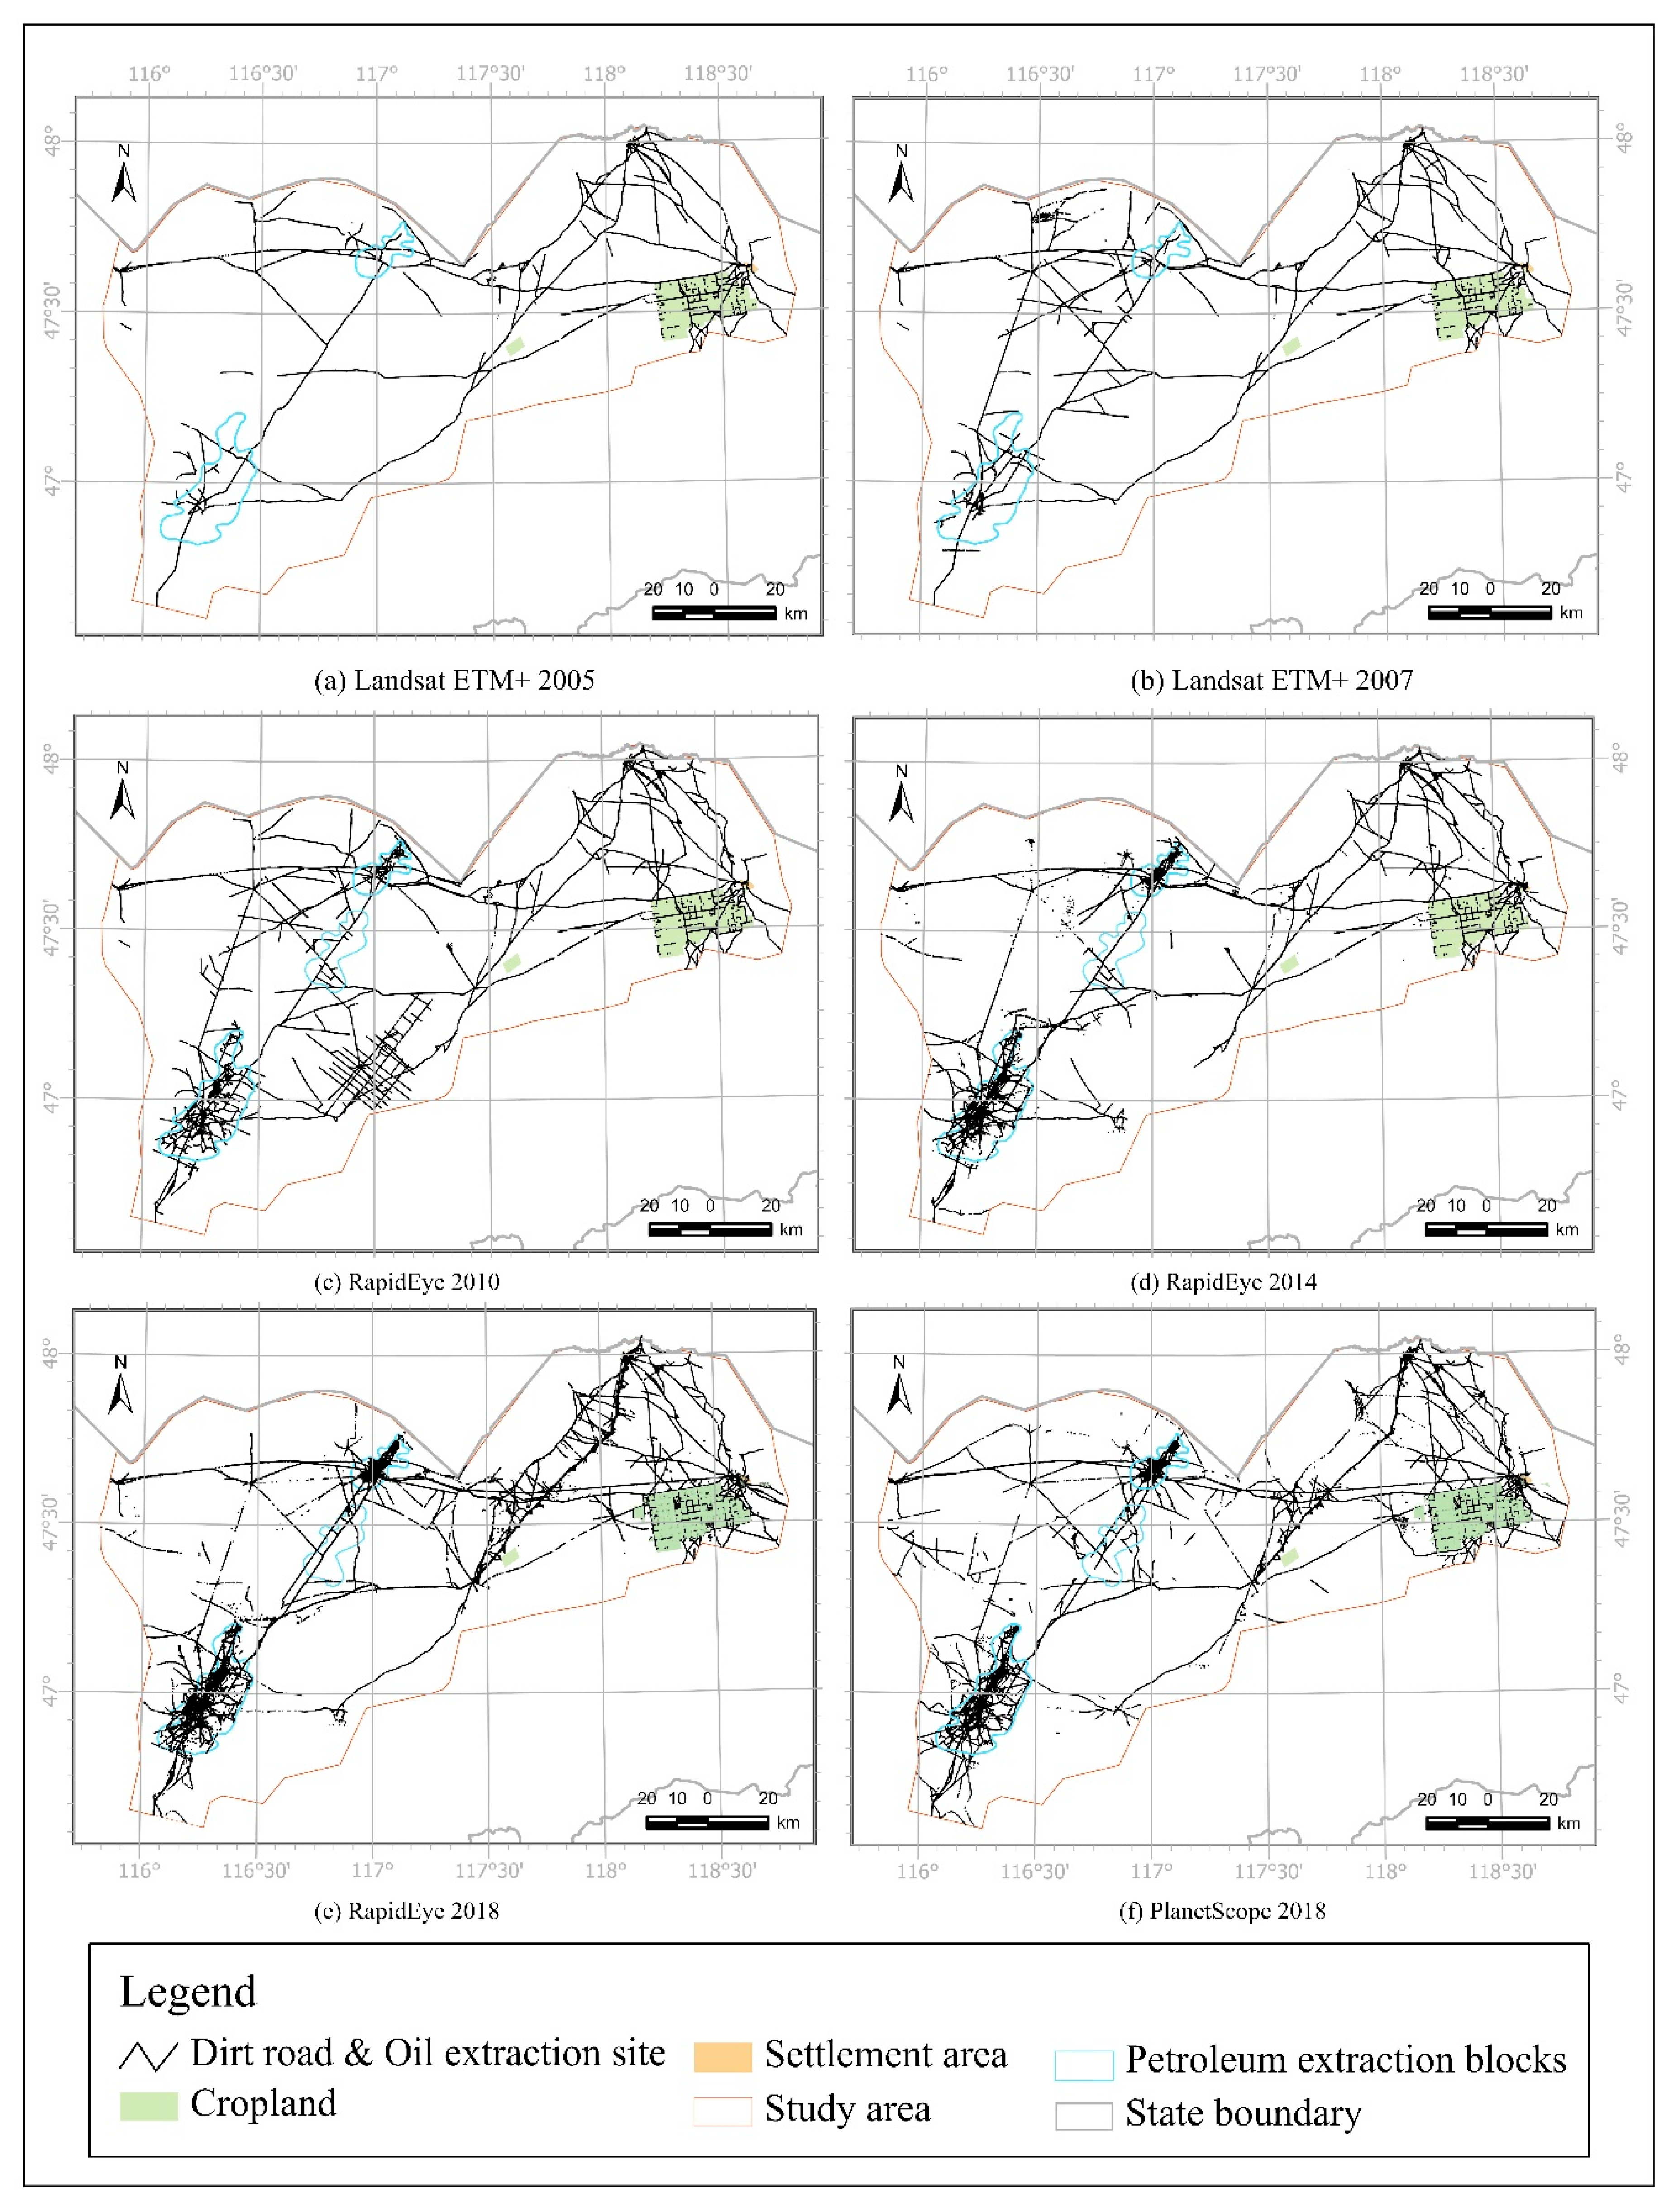
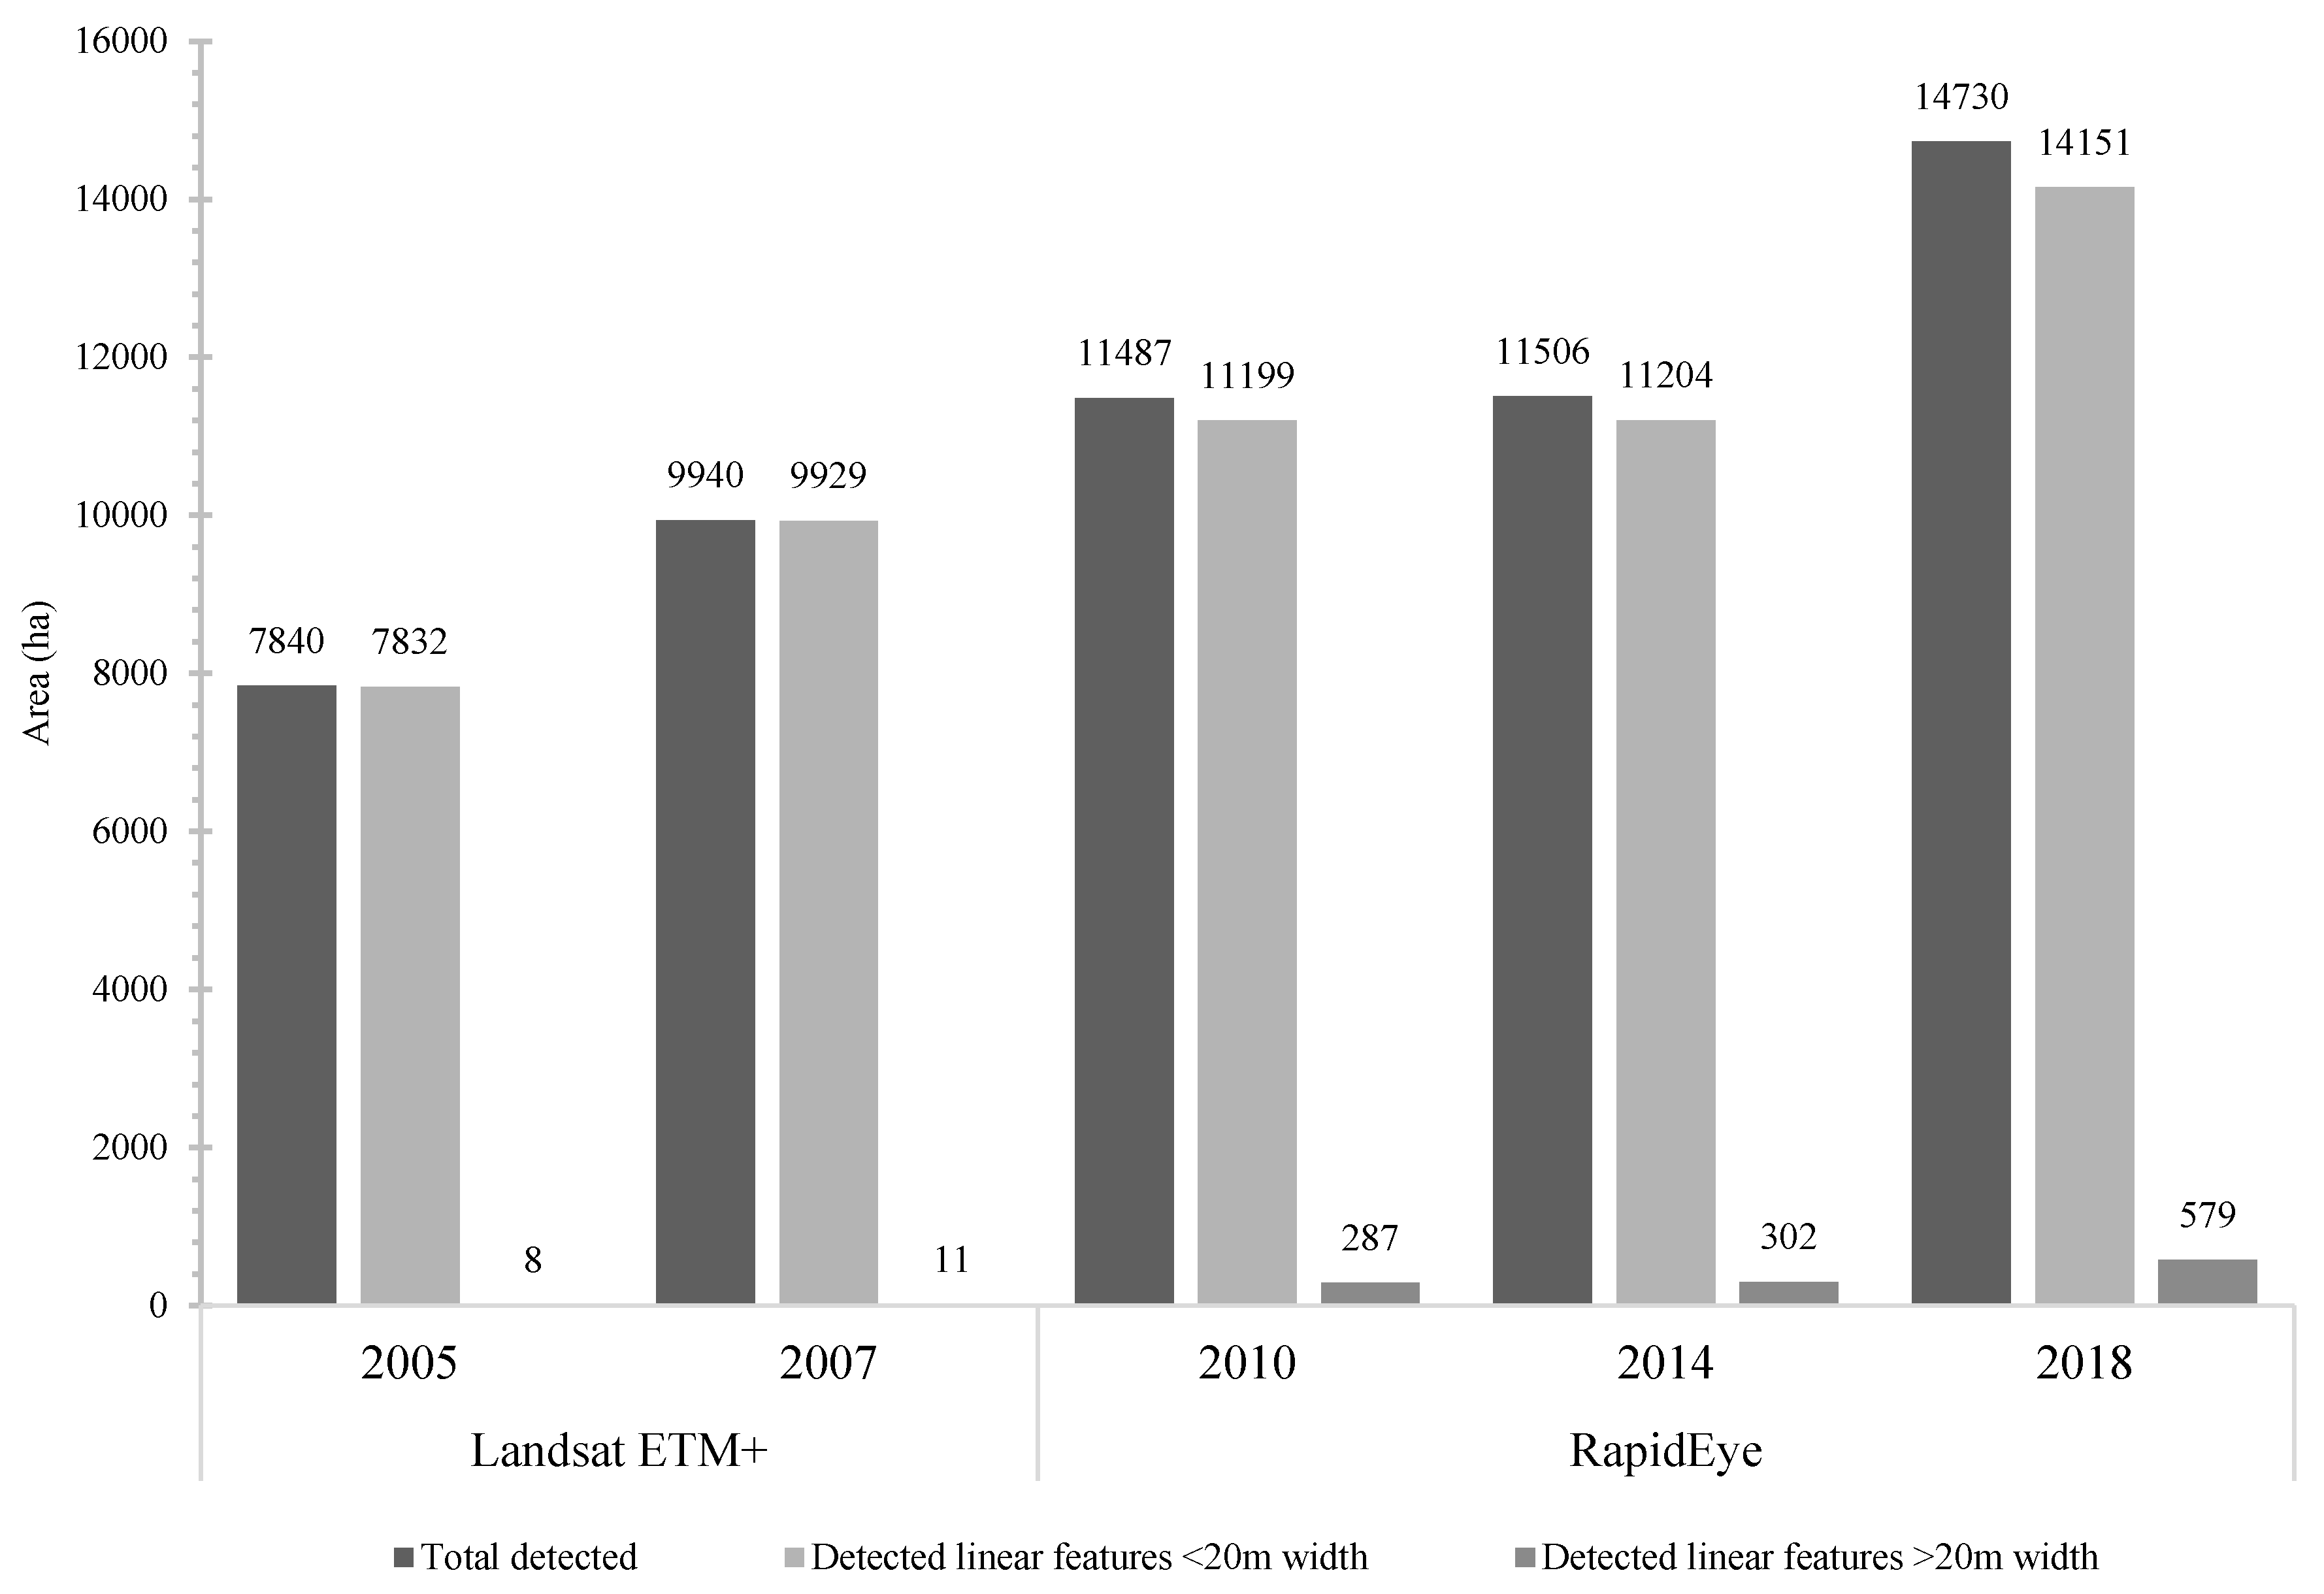
3.4. Land Use Changes

As result of this research, the first time-series of land use data of dirt road network, oil extraction infrastructure, cropland and settlement area for Eastern Mongolia was derived from the satellite images. According to the data, the total disturbed grassland of dirt road and oil extraction infrastructure increased sharply from 7840 ha in 2005 to 14,730 ha in 2018. Detected linear features of less than 20 m in width accounted to 8 ha and 11 ha in 2005 and 2007, respectively. For the years 2010, 2015, and 2018, the dirt roads and oil extraction infrastructure with >20 m in width occupied areas of 287 ha, 302 ha, and 579 ha. To further examine these changes across the 13-year time period, the total areas expanded by all-above-mentioned land use types were shown in Figure 7.
In the study area, the dominant land use categories are dirt roads, oil exploitation sites and infrastructure, cropland and settlement. Areas of cropland increased from 48,546 ha in 2005 to 50,134 ha in 2018. Settlement area only marginally changed from 4557.4 ha in 2005 to 4648.1 ha in 2018 (Table 4).

4. Discussion

4.1. Relevance of the Approach

The spatial distribution of land use change in the period 2005–2018 was extracted developing an object-based random forest classification method applied to long term multiscale and multi spectral remote sensing data. To detect changes in infrastructure in Eastern Mongolia since 2005, several images acquired by different satellite sensors were classified into “dirt road and oil extraction infrastructure site”, “settlement area”, “grassland”, and “cropland”. Since sensors differ in spatial and spectral resolutions, it is interesting to compare classification results among the different data sources. Highest overall accuracies between 87% and 93% were achieved using PlanetScope imagery, followed by RapidEye imagery with 85–91%. Classifications on Landsat ETM+ data yielded the lowest accuracies with 73–85%, respectively. Regardless of the spatial resolution of the satellite sensor, “cropland”, “natural grassland”, and “settlement area” classes were more accurately classified than the “dirt road and oil extraction infrastructure site” classes due to the relative homogeneity of the “cropland” “natural grassland”, and “settlement” classes compared to the narrow disconnected linear “dirt road and infrastructure” classes.
For the extraction of linear features, the method was well-suited to identify dirt roads and infrastructure from PlanetScope and RapidEye imagery, which obtained accurate results and opened up possibilities to apply the methodology to other areas. Consequently, the classification model achieved affordable results with high accuracy by the basis of different satellite data, which is consistent with the findings of other studies [22,23,24,52]. However, as could be seen in the performance of the different classifications, the accuracies of the dirt road and linear infrastructure were strongly related to the spatial resolution of the images through the influence of boundary pixels and influence of finer spatial resolution that increases the spectral-radiometric variation of land cover types [53]. In contrast to previous studies applying object-based image analysis to detect roads, geometrical features only marginally contributed to the overall model [54]. One explanation could be that the homogeneous undisturbed steppe ecosystems in Eastern Mongolia differed much more strongly in terms of spectral signatures from the infrastructure than it is the case in areas with more complex land-use as e.g., in cities. The segmentations were performed on images with different spatial resolution and same band composition. Previous studies suggested that, considering to set the high level on the parameters of spatial and spectral have given the opportunities to improve the segmentation results [35,55]. In the stage of experiments, the convenient adjustment was defined by the influence of spatial and spectral parameter on the segmentation in linear features. In this study, setting a high level of those parameters resulted in a decrease in homogeneity of objects. In other words, increasing the spatial and spectral parameter meant that a large number of small objects were obtained after segmentation. On the contrary, the lower level of those parameters made a homogeneity of objects increasing that failed to delimit linear features borders. Therefore, the selection of suitable parameters was paid much attention to the basis of those diverse in different spatial resolution.
The results of classification were validated using a ground truth dataset which were manually created by visual inspection of Google Earth Pro and ESRI base map images. Several studies showed that Google Earth imagery is a possible source of very high resolution imagery suitable to manually derive a reference dataset to assess the accuracy of remotely sensed image classifications [56,57]. In this study, the Google Earth and ESRI basemaps provided cost and time effective data sources especially from the point of view that this study covered an extremely large and remote area in Eastern Mongolia which is generally difficult to access. On the contrary, these sources have a scarcity of archived long time very-high-resolution imagery that cause difficulties in using the data in long-term image analysis. However, by selecting objects for reference data which have not been subject to change during the study period, both datasets were suitable to quantify the accuracy of the new product. The results obtained for Landsat ETM+ data were compared to original and spatially binned (15 m) multiscale imagery of PlanetSope and RapidEye to clarify the influence of different resolution on detecting linear features. Here, the comparison of different resolution image classification suggested that relatively wide dirt roads and linear infrastructures such as those featuring >20 m in width were easily classified from all types of images. Detection of 6–20 m wide narrow linear features from 3-meter resolution PlanetScope images and 5-meter resolution RapidEye revealed relatively high overall accuracies between 86% and 92%. In contrast, the detection of relatively narrow linear features such as roads featuring widths of 6–20 m was hardly possible from 15-meter spatial resolution data such as Landsat ETM+ and spatially binned images.
Differences in satellite imagery spectral significance for each random forest model are shown by calculation of variable importance. Generally, all variables derived from geometries of segments, multispectral channels and spectral indices were ranked as relatively important for classification and prediction. In general, the analysis of variable importance in all satellite imagery indicated that the variables of spectral channels and spectral indices are more important than geometrical variables. Comparing the variable importance, classification accuracy, and spatial resolution, the results suggested that the finer spatial resolution and lower spectral resolution of PlanetScope imagery yielded the highest overall accuracy (93.2%) and its most important variables were derived from active chromaticity color in segments and visible bands. Concerning the set of 5-meter spatial resolution, 5 spectral bands and 4 spectral indices composites in RapidEye data source, the variables of red, red edge and near-infrared channels, and active chromaticity color in blue were important to distinguish dirt road and infrastructure from all other surfaces with higher overall accuracy (87.3%). In the classification of RapidEye, red-edge and near-infrared channels had 2–3 times higher contributions than the other bands. According to the spectral reflectance, a typical bare soil and unvegetated surface such as dirt roads have a high reflectance in the near-infrared and shortwave infrared bands [58]. For the coarser spatial resolution and higher spectral resolution imagery of Landsat ETM+, generally, all variables derived from the geometry of segments, spectral bands, and spectral indices were equally involved. Considering individual variables, the results suggested that the visible and SWIR-2 bands proved to the most important variable for predicting and classifying linear features with 73.1% overall accuracy. Conceptually, the result of this analysis suggest that finer spatial resolution data is preferable to coarser spatial resolution data when a land use/land cover object is small and linear. Furthermore, the higher-spectral resolution data could not provide the possibilities to deal effectively with the detection of smaller and linear feature than their spatial resolution.

4.2. Land Use Analysis

Remote sensing technologies play an important role in continually delivering the quantitative information needed to analyze the nature, dynamic, and spatial distribution of land degradation processes. Diverse assessment approaches are used to monitor the scope and consequences of land degradation. According to several studies [59,60,61], the infrastructure development, especially, construction and extension of oil extraction infrastructure can foster land degradation processes. The main interest of this study is to estimate the land use change such as dirt road, oil extraction infrastructure, and site that can be determined by multiscale remote sensing imagery and RF classification. The land use change in the study area was determined by a combination of supervised classification methods and long-term multiscale earth observation data. In the research area, there are several man-made factors contributing to land degradation distinguished by the manners and types.
The land use change analysis of Menen steppe and Khalkh river area indicates significant shifts in dirt road and infrastructure over the last 13 years. The most pronounced change detected in this study was the expansion of dirt roads and infrastructure due to growth of oil exploitation, exploration and transportation. Over the observed 13 years, the total area occupied by dirt roads and oil exploitation infrastructure expanded by 75% or 14,730 ha. Regarding their change over space, the dirt roads and infrastructure expanded over the whole territory of the study area. Cropland slightly increased by 3% to approximately 50,134 ha. Concerning the land usage, the cropland area is relatively concentrated at a few locations; one of those was built in 1972 with approximately 40,000 ha. The slight growth was related to additional extension of main cropland in 2015–2018 and its further extension is purposed to establish 72,000 ha in 2020 [62]. Settlement area did not change during the last 13 years.
The analysis recorded some declination or some artificial changes, particularly, several temporal expansion of dirt roads were detected in the period 2007–2010, and their detection was decreased or disappeared from satellite images in 2014–2018. In this case, for the short period, dirt roads were visibly recovered by pioneering plants shortly after the roads were abandoned. However, it has to be questioned if the successional stages of the vegetation are structurally and functionally equivalent to the native vegetation cover before creation of the dirt roads [5,63].
Several studies (e.g., [4,64]) have indicated that dirt roads are a major anthropogenic driver for land degradation in Mongolia. Therein contrast much less studies analyzed anthropogenic drivers of grassland degradation in Mongolia [63]. However, no detailed study of dirt road impact on land degradation has been done yet. Intensive growth of dirt road in broad territory of Mongolia challenges the detection and registration of the short-term dirt roads into official data base. In addition, temporal dirt roads due to oil exploitation in the study area have never taken into account in official databases, because dirt roads are abandoned shortly after they have been created. These difficulties preclude a detailed analysis of dirt road impact on land degradation at regional scales. In this study, the permanent and temporal dirt roads due to exploitation were detected from an analysis of PlanetScope, RapidEye and Landsat ETM+ in 2005–2018.

5. Conclusions

Extensive land utilization for oil exploitation and dirt roads are major drivers of land degradation in the steppe ecosystem of eastern Mongolia. This research highlighted the potential usage of multi-resolution and multi-spectral remote sensing images and Random Forest classification to investigate the extraction of linear features and their change in extent over time. The performance of segmentation shows that adjusting high level of spatial and spectral detail provided the largest number of objects that were characterized by boundary, homogeneity, and heterogeneity, and thus, contained useful information for the linear features detection.
Understanding the driving factors such as the extent of land use change is particularly important for policies to develop sustainable land management practices, counteracting land degradation processes and fostering environmental conservation in the country. We tested and applied the method to data from 13 years to analyze spatio-temporal changes in land use for an area of more than 20,000 km2 in the Menen Steppe and Khalkh River area. The classified results of 13 years of satellite data indicate that the land usage for dirt road and oil extraction infrastructure in the Eastern Mongolian Steppe is increasing due to the active oil exploitation and exploration. Within the study area over the observed 13 years, the total area occupied by dirt roads and oil exploitation infrastructure expanded by 75% to occupy an additional area of approximately 14,730 ha. For the spatial distribution, the dirt roads and infrastructure were expanded over the whole territory of the study area. In future, the results of this study will serve as data source to quantify the impact of human and climate induced disturbances on steppe ecosystems in Eastern Mongolia. This knowledge is key to preserve the unique open steppe ecosystems under global change.

Author Contributions

B.D. prepared the raw and validation data of PlanetScope, RapidEye, and Landsat, and performed the formal analysis including classification and spatial analyses, and wrote the original draft manuscript. B.D. developed the methodology and ideas with contribution from L.W.L. and J.B. L.W.L. and J.B. contributed to the methodology and review, and supervised the study. Finally, all authors (B.D., L.W.L., and J.B.) participated in additional editing of the original draft. All authors have read and agreed to the published version of the manuscript.

Funding

This research was funded by the German Academic Exchange Service (DAAD), Research Grants—Doctoral Programmes in Germany (57381412), Grant reference number 91691130 for Batnyambuu Dashpurev and the More Step project funded by the German Ministry for Education and Research (BMBF), grant number 01LC1820B.

Acknowledgments

We are grateful to the Education and Research Program of Planet Labs Inc. for providing access to Planet’s imagery and archive.

Conflicts of Interest

The authors declare no conflict of interest.

Appendix A

Table A1. Summary of confusion matrices for the multi-resolution and multi-spectral satellite image classification in 2005–2018.
a. Landsat ETM+ 2005 and 2007 Reference Data
Classification resultDirt road and Oil extraction siteGrasslandCroplandSettlement areaUser Accuracy
Dirt road and Oil extraction site8992981.6%
Grassland191053778.3%
Cropland125120087.5%
Settlement area56010990.8%
Producer Accuracy71.2%84.2%96.1%87.2%
Overall accuracy = 84.6%, kappa statistic = 71.9%,
Quantity disagreement = 0.084 and Allocation disagreement = 0.186
b. RapidEye 2010, 2014, and 2018 Reference Data
Classification resultDirt road and Oil extraction siteGrasslandCroplandSettlement areaUser Accuracy
Dirt road and Oil extraction site95631480.5%
Grassland1311913479.8%
Cropland50109095.6%
Settlement area40010796.3%
Producer Accuracy81.1%95.2%87.2%85.6%
Overall accuracy = 87.3%, kappa statistic = 74.6%
Quantity disagreement = 0.0508 and Allocation disagreement = 0.0752
c. PlanetScope 2018 Reference Data
Classification resultDirt road and Oil extraction siteGrasslandCroplandSettlement areaUser Accuracy
Dirt road and Oil extraction site11172489.5%
Grassland51181690.7%
Cropland60122095.3%
Settlement area30011597.4%
Producer Accuracy88.8%94.4%97.6%92%
Overall accuracy = 93.2%, kappa statistic = 87.1%
Quantity disagreement = 0.016 and Allocation disagreement = 0.052
Table A2. Confusion matrices for the comparison of multi-spatial resolution images in 2018.
a. PlanetScope (Original)Reference Data
Classification resultDirt road and Oil extraction siteGrasslandUser Accuracy
Dirt road and Oil extraction site2261394.5%
Grassland2423790.8%
Producer Accuracy90.4%94.8%
Overall accuracy = 92.6%, kappa statistic = 85.2%
Quantity disagreement = 0.022 and Allocation disagreement = 0.052
b. PlanetScope (15 m)Reference Data
Classification resultDirt road and Oil extraction siteGrasslandUser Accuracy
Dirt road and Oil extraction site165696.4%
Grassland8524474.1%
Producer Accuracy66.1%97.6%
Overall accuracy = 81.8%, kappa statistic = 63.6%
Quantity disagreement = 0.158 and Allocation disagreement = 0.024
c. RapidEye (Original)Reference Data
Classification resultDirt road and Oil extraction siteGrasslandUser Accuracy
Dirt road and Oil extraction site1981294.2%
Grassland5223882.1%
Producer Accuracy79.2%95.2%
Overall accuracy = 87.2%, kappa statistic = 74.4%
Quantity disagreement = 0.08 and Allocation disagreement = 0.048
d. RapidEye (15 m)Reference Data
Classification resultDirt road and Oil extraction siteGrasslandUser Accuracy
Dirt road and Oil extraction site176398.3%
Grassland7424776.9%
Producer Accuracy70.4%98.8%
Overall accuracy = 84.6%, kappa statistic = 69.2%
Quantity disagreement = 0.142 and Allocation disagreement = 0.012
e. Landsat ETM+ (Original)Reference Data
Classification resultDirt road and Oil extraction siteGrasslandUser Accuracy
Dirt road and Oil extraction site1991991.2%
Grassland5123181.9%
Producer Accuracy79.2%92.4%
Overall accuracy = 86.1%, kappa statistic = 72%
Quantity disagreement = 0.116 and Allocation disagreement = 0.052

References

  1. Biancalani, R.; Nachtergaele, F.; Petri, M.; Bunning, S. Land Degradation Assessment in Drylands Methodology and Results; Food and Agriculture Organization: Rome, Italy, 2013. [Google Scholar]
  2. Dudley, N.; Alexander, S.; Johnson, I. Secretariat of the United Nations Convention to Combat Desertification Drivers of Change. In The Global Land Outlook; United Nations Convention to Combat Desertification: Bonn, Germany, 2017; pp. 40–51. ISBN 9789295110472. [Google Scholar]
  3. Duniway, M.C.; Herrick, J.E.; Pyke, D.A.; Toledo, P.D. Assessing transportation infrastructure impacts on rangelands: Test of a standard rangeland assessment protocol. Rangel. Ecol. Manag. 2010, 63, 524–536. [Google Scholar] [CrossRef]
  4. Batkhishig, O. Human Impact and Land Degradation in Mongolia. In Dryland East Asia: Land Dynamics amid Social and Climate Change; The Higher Education Press: Beijing, China, 2013; ISBN 978-3-11-028791-2. [Google Scholar]
  5. Cane, I.; Schleger, A.; Ali, S.; Kemp, D.; McIntyre, N.; McKenna, P.; Lechner, A.; Dalaibuyan, B.; Lahiri-Dutt, K.; Bulovic, N. Responsible Mining in Mongolia: Enhancing Positive Engagement; Sustainable Minerals Institute, The University of Queensland: St Lucia, Australia, 2015. [Google Scholar]
  6. Wingard, J. CMS Convention on Migratory Species: Guidelines for Addressing the Impact of Linear Infrastructure on Large Migratory Mammals in Central Asia; UNEP/CMS Secretariat, Wildlife Conservation Society: Quito, Ecuador, 2014. [Google Scholar]
  7. Ministry of Environment and Tourism of Mongolia. Mongolian Environmental Report; Ministry of Environment and Tourism of Mongolia: Ulaanbaatar, Mongolia, 2018.
  8. Nasanbat, E.; Sharav, S.; Sanjaa, T.; Lkhamjav, O.; Magsar, E.; Tuvdendorj, B. Frequency analysis of MODIS NDVI time series for determining hotspot of land degradation in Mongolia. In Proceedings of the International Archives of the Photogrammetry, Remote Sensing and Spatial Information Sciences—ISPRS TC III Mid-Term Symposium “Developments, Technologies and Applications in Remote Sensing”, Beijing, China, 7–10 May 2018; pp. 1299–1304. [Google Scholar]
  9. Li, S.G.; Tsujimura, M.; Sugimoto, A.; Davaa, G.; Sugita, M. Natural recovery of steppe vegetation on vehicle tracks in central Mongolia. J. Biosci. 2006, 31, 85–93. [Google Scholar] [CrossRef] [PubMed]
  10. Keshkamat, S.S.; Tsendbazar, N.E.; Zuidgeest, M.H.P.; Van Der Veen, A.; De Leeuw, J. The environmental impact of not having paved roads in arid regions: An example from Mongolia. Ambio 2012, 41, 202–205. [Google Scholar] [CrossRef] [PubMed] [Green Version]
  11. Gibbs, H.K.; Salmon, J.M. Mapping the world’s degraded lands. Appl. Geogr. 2015, 57, 12–21. [Google Scholar] [CrossRef]
  12. Baynard, C.W. Remote Sensing Applications: Beyond Land-Use and Land-Cover Change. Adv. Remote Sens. 2013, 2, 228–241. [Google Scholar] [CrossRef] [Green Version]
  13. United Nations Office for Outer Space Affairs. UNOOSA’s Annual Reports; UNOOSA: Vienna, Austria, 2018. [Google Scholar]
  14. Claverie, M.; Ju, J.; Masek, J.G.; Dungan, J.L.; Vermote, E.F.; Roger, J.C.; Skakun, S.V.; Justice, C. The Harmonized Landsat and Sentinel-2 surface reflectance data set. Remote Sens. Environ. 2018, 219, 145–161. [Google Scholar] [CrossRef]
  15. Dobrinic, D. Horizontal Accuracy Assessment of PlanetScope, RapidEye and WorldView-2 Satellite Imagery. In Proceedings of the 18th International Multidisciplinary Scientific GeoConference SGEM2018, Informatics, Geoinformatics and Remote Sensing, Albena, Bulgaria, 30 June–9 July 2018. [Google Scholar]
  16. Cooley, S.W.; Smith, L.C.; Stepan, L.; Mascaro, J. Tracking dynamic northern surface water changes with high-frequency planet CubeSat imagery. Remote Sens. 2017, 9, 1306. [Google Scholar] [CrossRef] [Green Version]
  17. Toure, S.I.; Stow, D.A.; Shih, H.C.; Weeks, J.; Lopez-Carr, D. Land cover and land use change analysis using multi-spatial resolution data and object-based image analysis. Remote Sens. Environ. 2018, 210, 259–268. [Google Scholar] [CrossRef]
  18. Blaschke, T. Object based image analysis for remote sensing. ISPRS J. Photogramm. Remote Sens. 2010, 65, 2–16. [Google Scholar] [CrossRef] [Green Version]
  19. Ma, L.; Li, M.; Ma, X.; Cheng, L.; Du, P.; Liu, Y. A review of supervised object-based land-cover image classification. ISPRS J. Photogramm. Remote Sens. 2017, 130, 277–293. [Google Scholar] [CrossRef]
  20. Lu, D.; Weng, Q. A survey of image classification methods and techniques for improving classification performance. Int. J. Remote Sens. 2007, 28, 823–870. [Google Scholar] [CrossRef]
  21. Wang, W.; Yang, N.; Zhang, Y.; Wang, F.; Cao, T.; Eklund, P. A review of road extraction from remote sensing images. J. Traffic Transp. Eng. (English Ed.) 2016, 3, 271–282. [Google Scholar] [CrossRef] [Green Version]
  22. Mjachina, K.; Hu, Z.; Chibilyev, A. Detection of damaged areas caused by the oil extraction in a steppe region using winter landsat imagery. J. Appl. Remote Sens. 2018, 12, 1. [Google Scholar] [CrossRef]
  23. Plank, S.; Mager, A.; Schoepfer, E. Monitoring of oil exploitation infrastructure by combining unsupervised pixel-based classification of polarimetric SAR and object-based image analysis. Remote Sens. 2014, 6, 11977–12004. [Google Scholar] [CrossRef] [Green Version]
  24. Zhang, Y.; Lantz, N.; Guindon, B.; Jiao, X. Spectral-analysis-based extraction of land disturbances arising from oil and gas development in diverse landscapes. J. Appl. Remote Sens. 2017, 11, 015026. [Google Scholar] [CrossRef]
  25. Pfeiffer, M.; Dulamsuren, C.; Jäschke, Y.; Wesche, K. Grasslands of China and Mongolia: Spatial Extent, Land Use and Conservation. In Grasslands of the World: Diversity, Management and Conservation; CRC Press: Boca Raton, FL, USA, 2018; pp. 168–196. ISBN 9781498796262. [Google Scholar]
  26. National Statistics Office of Mongolia Environment. Mongolian Statistical Yearbook; National Statistics Office of Mongolia Environment: Ulaanbaatar, Mongolia, 2017; pp. 224–227. ISBN 978-99978-758-0-8.
  27. Mineral Resources and Petroleum Authority of Mongolia Petroleum Exploitation and Production. Available online: https://www.mrpam.gov.mn/ (accessed on 26 June 2019).
  28. Mongolia Extractive Industries Transparency Initiative EITI-Extractive Industries Transparency Initiative. Available online: http://www.eitimongolia.mn/en (accessed on 26 June 2019).
  29. Planet Team Planet Application Program Interface: In Space for Life on Earth. Available online: https://api.planet.com/ (accessed on 10 December 2018).
  30. U.S. Geological Survey Landsat Image Courtesy of the U.S. Geological Survey. Available online: https://earthexplorer.usgs.gov/ (accessed on 1 October 2018).
  31. Scaramuzza, P.; Esad Micijevic, G.C. SLC Gap-Fill Methodology. Available online: https://landsat.usgs.gov/sites/default/files/documents/SLC_Gap_Fill_Methodology.pdf (accessed on 13 December 2019).
  32. Amro, I.; Mateos, J.; Vega, M.; Molina, R.; Katsaggelos, A.K. A survey of classical methods and new trends in pansharpening of multispectral images. EURASIP J. Adv. Signal Process. 2011, 2011, 79. [Google Scholar] [CrossRef] [Green Version]
  33. Fukunaga, K.; Hostetler, L.D. The Estimation of the Gradient of a Density Function, with Applications in Pattern Recognition. IEEE Trans. Inf. Theory 1975, 21, 32–40. [Google Scholar] [CrossRef] [Green Version]
  34. Cheng, Y. Mean Shift, Mode Seeking, and Clustering. IEEE Trans. Pattern Anal. Mach. Intell. 1995, 17, 790–799. [Google Scholar] [CrossRef] [Green Version]
  35. Mesner, N.; Oštir, K. Investigating the impact of spatial and spectral resolution of satellite images on segmentation quality. J. Appl. Remote Sens. 2014, 8, 083696. [Google Scholar] [CrossRef]
  36. El-naggar, A.M. Determination of optimum segmentation parameter values for extracting building from remote sensing images. Alex. Eng. J. 2018, 57, 3089–3097. [Google Scholar] [CrossRef]
  37. Breiman, L. Random Forests LEO. Mach. Learn. 2001, 45, 5–32. [Google Scholar] [CrossRef] [Green Version]
  38. Breiman, L.; Friedman, J.H.; Jerome, H.; Olshen, R.A.; Stone, C.J. Classification and Regression Trees; Taylor & Francis: Monterey, CA, USA, 1984; ISBN 9781138469525. [Google Scholar]
  39. Tucker, C.J. Red and photographic infrared linear combinations for monitoring vegetation. Remote Sens. Environ. 1979, 8, 127–150. [Google Scholar] [CrossRef] [Green Version]
  40. Gitelson, A.; Merzlyak, M.N. Spectral Reflectance Changes Associated with Autumn Senescence of Aesculus hippocastanum L. and Acer platanoides L. Leaves. Spectral Features and Relation to Chlorophyll Estimation. J. Plant Physiol. 1994, 143, 286–292. [Google Scholar] [CrossRef]
  41. Richardson, A.J.; Wiegand, C.L. Distinguishing vegetation from soil background information. [by gray mapping of Landsat MSS data]. Photogramm. Eng. Remote Sensing 1977, 43, 1541–1552. [Google Scholar]
  42. Huete, A.R. A soil-adjusted vegetation index (SAVI). Remote Sens. Environ. 1988, 25, 295–309. [Google Scholar] [CrossRef]
  43. Breiman, L.; Cutler, A. Random Forests. Available online: https://www.stat.berkeley.edu/~breiman/RandomForests/cc_home.htm#home (accessed on 15 October 2018).
  44. Rosenfield, G.H.; Fitzpatrick-Lins, K. A coefficient of agreement as a measure of thematic classification accuracy. Photogramm. Eng. Remote Sensing 1986, 52, 223–227. [Google Scholar]
  45. Cohen, J. A Coefficient of Agreement for Nominal Scales. Educ. Psychol. Meas. 1960, 20, 37–46. [Google Scholar] [CrossRef]
  46. Russell, G.C. A review of assessing the accuracy of classifications of remotely sensed data. Remote Sens. Environ. 1991, 37, 35–46. [Google Scholar]
  47. Pontius, R.G.; Millones, M. Death to Kappa: Birth of quantity disagreement and allocation disagreement for accuracy assessment. Int. J. Remote Sens. 2011, 32, 4407–4429. [Google Scholar] [CrossRef]
  48. Pickard, B.; Gray, J.; Meentemeyer, R. Comparing quantity, allocation and configuration accuracy of multiple land change models. Land 2017, 6, 52. [Google Scholar] [CrossRef] [Green Version]
  49. ESRI World Imagery [basemap]. Available online: http://www.arcgis.com/home/item.html?id=10df2279f9684e4a9f6a7f08febac2a9 (accessed on 1 December 2018).
  50. Google LLC. Google Earth Pro. Available online: https://www.google.com/earth/versions/#earth-pro (accessed on 1 December 2018).
  51. Mongolian National Land Information System of Land Administration and Management, Geodesy and Cartography. Available online: http://www.egazar.gov.mn (accessed on 1 March 2019).
  52. Salehi, B.; Chen, Z.; Jefferies, W.; Adlakha, P.; Bobby, P.; Power, D. Well site extraction from Landsat-5 TM imagery using an object- and pixel-based image analysis method. Int. J. Remote Sens. 2014, 35, 7941–7958. [Google Scholar] [CrossRef]
  53. Markham, B.L.; Townshend, J.R.G. Land cover classification accuracy as a function of sensor spatial resolution. In Proceedings of the the 15th International Symposium on Remote Sensing of Environment, Ann Arbor, MI, USA, 11–15 May 1981; pp. 1075–1090. [Google Scholar]
  54. Nobrega, R.A.A.; O’Hara, C.G.; Quintanilha, J.A. An object-based approach to detect road features for informal settlements near Sao Paulo, Brazil. In Object-Based Image Analysis; Lecture Notes in Geoinformation and Cartography; Springer: Berlin/Heidelberg, Germany, 2008; pp. 589–607. [Google Scholar]
  55. Schultz, B.; Immitzer, M.; Formaggio, A.; Sanches, I.; Luiz, A.; Atzberger, C. Self-Guided Segmentation and Classification of Multi-Temporal Landsat 8 Images for Crop Type Mapping in Southeastern Brazil. Remote Sens. 2015, 7, 14482–14508. [Google Scholar] [CrossRef] [Green Version]
  56. Wu, W.; De Pauw, E.; Helldén, U. Assessing woody biomass in African tropical savannahs by multiscale remote sensing. Int. J. Remote Sens. 2013, 34, 4525–4549. [Google Scholar] [CrossRef]
  57. Dimobe, K.; Ouédraogo, A.; Soma, S.; Goetze, D.; Porembski, S.; Thiombiano, A. Identification of driving factors of land degradation and deforestation in the Wildlife Reserve of Bontioli (Burkina Faso, West Africa). Glob. Ecol. Conserv. 2015, 4, 559–571. [Google Scholar] [CrossRef] [Green Version]
  58. Bowker, D.E.; Davis, R.E.; Myrick, D.L.; Stacy, K.; Jones, W.T. Spectral Reflectances of Natural Targets for Use in Remote Sensing Studies; NASA Langley Research Center: Hampton, VA, USA, 1985. [Google Scholar]
  59. Ngene, S.; Tota-Maharaj, K.; Eke, P.; Hills, C. Environmental and Economic Impacts of Crude Oil and Natural Gas Production in Developing Countries. Int. J. Econ. Energy Environ. 2016, 1, 64–73. [Google Scholar]
  60. Chijioke, B.; Onuoha, B.; Bassey, I.; Ufomba, H. The Impact of Oil Exploration and Environmental Degradation in the Niger Delta Region of Nigeria: A Study of Oil Producing Communities in Akwa Ibom State. Glob. J. Hum. Soc. Sci. Polit. Sci. 2018, 18, 55–70. [Google Scholar]
  61. Forman, R.T.T.; Alexander, L.E. Roads and their major ecological effects. Annu. Rev. Ecol. Syst. 1998, 29, 207–231. [Google Scholar] [CrossRef] [Green Version]
  62. Khalkh Gol Project. Available online: http://khalkhgol.mofa.gov.mn/ (accessed on 15 June 2019).
  63. John, R.; Chen, J.; Kim, Y.; Ou-yang, Z.T.; Xiao, J.; Park, H.; Shao, C.; Zhang, Y.; Amarjargal, A.; Batkhshig, O.; et al. Differentiating anthropogenic modification and precipitation-driven change on vegetation productivity on the Mongolian Plateau. Landsc. Ecol. 2016, 31, 547–566. [Google Scholar] [CrossRef]
  64. Nyamtseren, M. The land degradation and desertification process in Mongolia. In Mongolia Second Assessment Report on Climate Change; The Ministry of Environment and Green Development of Mongolia: Ulaanbaatar, Mongolia, 2014; pp. 132–139. [Google Scholar]
Figure 1. Study area map. The study area is a part of the Eastern Mongolian Steppe, which is one of the largest flat-steppes of Mongolia. The study area is registered in the World Heritage List of the UNESCO.
Remotesensing 12 00144 g001
Figure 2. Workflow of supervised image classification.
Remotesensing 12 00144 g002
Figure 3. Classification results for expansion of dirt road and oil extraction infrastructure in 2005–2018: (ab) Landsat ETM+ (15 m), (ce) RapidEye (5 m), and (f) PlanetScope (3 m).
Remotesensing 12 00144 g003
Figure 4. Comparison maps of the classification result: (a) PlanetScope imagery 3 m, (b) RapidEye imagery 5 m, (c) Landsat ETM+ imagery 15 m, (d) PlanetScope spatially binned imagery 15 m, (e) RapidEye spatially binned imagery 15 m. The location of the comparison area is shown in the lower right map.
Remotesensing 12 00144 g004
Figure 5. Variable importance for linear feature classification. (a) PlanetScope and (b) RapidEye.
Remotesensing 12 00144 g005
Figure 6. Variable importance for linear feature prediction in Landsat ETM+.
Remotesensing 12 00144 g006
Figure 7. Bar graphs showing the dirt road and infrastructure expansion by width which are narrower/wider than 20 m. Each bar represents one of the classified 2–4 year interval time series imagery.
Remotesensing 12 00144 g007
Table 1. Satellite data used in this study. MS—multispectral, Pan—panchromatic.
Satellite DataDataNumber of BandsGround Sample Distance (GSD)Product LevelNumber of Scenes
PlanetScope29 October 2018
12 October 2018
8–26 September 2018
4 September 2018
23 August 2018
19 August 2018
18 August 2018
31 July 2018
4MS: 3 m1B200
RapidEye13–16 September 2018
22 August 2014
17 September 2014
10 October 2010
24 September 2010
02 September 2010
21 August 2010
19 August 2010
27 June 2010
5MS: 5 m1B124
Landsat ETM+16 October 2018
12 July 2008
14 July 2007
21 July 2007
15 August 2007
09 October 2007
8MS: 30 m
Pan: 15 m
110
9 August 2005
16 August 2005
25 August 2005
15 September 2005
Table 2. Description of the predictor variables used in random forest (RF) classification. Note that each variable has been calculated for each segment and image.
VariableDescription
Data of single spectral bands
Mean value 1
Standard deviation 1
The average digital number (DN) of each band
Standard deviation of each bands
Spectral indices
NDVI 2Mean value and standard deviation of the normalized difference vegetation index 3: (NIR − Red)/(NIR + Red)
NDVIRed-edge 2Mean value and standard deviation of the normalized difference vegetation index 3: (NIR – RE)/(NIR + RE)
PVI 2Mean value and standard deviation of the perpendicular vegetation index 3: (NIR-a*Red-b)/(sqrt(1+a2))
SAVI 2Mean value and standard deviation of the soil-adjusted vegetation index.3: ((NIR − Red) / (NIR + Red + L)) × (1 + L)
Segment
Average chromaticity colorThe RGB color values of per-segment
CompactnessThe degree to which a segment is compact or circular
RectangularityThe degree to which a segment is rectangular
CountThe number of pixels comprising the segment
1 Variables were calculated for each of the four multispectral bands of PlanetScope, the five multispectral bands of RapidEye and the 8 multispectral bands of Landsat. 2 The calculation of indices was performed on the multispectral bands of Landsat and RapidEye only. 3 The calculations are cited from References [39,40,41,42].
Table 3. Comparison of classification performance by classes.
Original ImageryUpscaling Imagery
PlanetScope 3 mRapidEye 5 mLandsat ETM+ 15 mPlanetScope
15 m
RapidEye
15 m
Dirt road and Oil extraction site (ha)25322602280623932473
Grassland (ha)24,38124,31024,10724,51924,440
Table 4. Total area change (hectare) observed by dominant land use categories in the study area in the period 2005–2018.
Dominant Land Use Types20052007201020142018Change 2005–2010 (%)Change 2010–2018 (%)
Dirt road and oil extraction infrastructure (ha)7840994011,48711,50614,73047%28%
Settlement area (ha)455745574557464246610%2%
Cropland (ha)48,54648,54648,54648,54650,1340%3%

