Article

Towards a Satellite System for Archaeology? Simulation of an Optical Satellite Mission with Ideal Spatial and Temporal Resolution, Illustrated by a Case Study in Scotland

1
Department of Electronic and Electrical Engineering, University of Strathclyde, Royal College Building, 204 George Street, Glasgow G1 1XW, UK
2
Department of Mechanical and Aerospace Engineering, University of Strathclyde, 75 Montrose Street, Glasgow G1 1XJ, UK
3
Historic Environment Scotland, John Sinclair House, 16 Bernard Terrace, Edinburgh EH8 9NX, UK
*
Author to whom correspondence should be addressed.
Remote Sens. 2020, 12(24), 4100; https://doi.org/10.3390/rs12244100
Submission received: 28 August 2020 / Revised: 5 November 2020 / Accepted: 11 December 2020 / Published: 15 December 2020

Abstract

:
Applications of remote sensing data for archaeology rely heavily on repurposed data, which carry inherent limitations in their suitability to help address archaeological questions. Through a case study framed around archaeological imperatives in a Scottish context, this work investigates the potential for existing satellite systems to provide remote sensing data that meet defined specifications for archaeological prospection, considering both spatial and temporal resolution, concluding that the availability of commercial data is currently insufficient. Tasking a commercial constellation of 12 spacecraft to collect images of a 150 km2 region in Scotland through the month of July 2020 provided 26 images with less than 50% cloud cover. Following an analysis of existing systems, this paper presents a high-level mission architecture for a bespoke satellite system designed from an archaeological specification. This study focuses on orbit design and the number of spacecraft needed to meet the spatial and temporal resolution requirements for archaeological site detection and monitoring in a case study of Scotland, using existing imaging technology. By exploring what an ideal scenario might look like from a satellite mission planning perspective, this paper presents a simulation analysis that foregrounds archaeological imperatives and specifies a satellite constellation design on that basis. High-level design suggests that a system of eight 100 kg spacecraft in a 581 km altitude orbit could provide coverage at a desired temporal and spatial resolution of two-weekly revisit and <1 m ground sampling distance, respectively. The potential for such a system to be more widely applied in regions of similar latitude and climate is discussed.

Graphical Abstract

1. Introduction

Significant challenges exist in the application of remote sensing data for archaeological prospection and monitoring at a landscape scale. There is a heavy reliance on re-purposed datasets such as aerial photographs, satellite imagery and airborne laser scanning collected for reasons such as cartography, military intelligence and infrastructure planning. This repurposing of data for archaeological purposes is unsurprising as it is expensive to acquire. However, it also brings limitations because the data acquisition was not specified with archaeological imperatives in mind. This paper is a contribution to the discussion of how heritage applications of satellite data might be developed, seeking to reframe the common question of an archaeologist repurposing remote sensing data who might ask ‘how can data collected for other purposes be best used to address archaeological questions?’. Rather, the approach taken here is to ask ‘what might a satellite system for archaeology look like?’, specifically for a constellation of optical satellites. This exercise has been attempted to explore what an ideal scenario might be—a simulation analysis that foregrounds archaeological survey questions and specifies a satellite system design on that basis. The analysis is framed within imperatives drawn from a specification for imagery in Scotland, which nevertheless illustrates factors that require consideration in specifying such a system anywhere.
Specifying ‘a satellite for archaeology’ is of course a complex multi-faceted process, but the focus here is primarily on mission architecture, considering the number of spacecraft and appropriate orbit selection to deliver the desired spatial resolution and revisit times. While recognising that platforms, sensors, and workflows, to name but a few, are all fundamental aspects of a specification, these are out of the scope of this paper. By exploring mission architecture as one aspect of the design of satellite systems, this paper aims to provide an understanding of the impacts of these factors that will be informative to all users of satellite data.
This contribution is framed by the widespread leveraging of satellite remote sensing for archaeology (e.g., [1,2,3,4,5,6,7,8,9,10])—and that the trajectory for development is witnessing increasing spatial, spectral and temporal resolution, the potential to task data collection, and the proliferation of available data. While this is not yet a panacea for a range of reasons, including costs and, for example, the difficulties in calibrating and integrating different datasets from a range of Earth observation sensors [11], the rate of development is startling. Nevertheless, while recognising this trajectory, the lack of archaeological imperatives in the specification of data acquisition means that there are inherent compromises in primary survey data (see [12] for a comprehensive discussion of these factors for passive optical imaging).
A central issue here is the capacity of remote sensing data to provide systematic and reliable data for archaeological management and research questions. This depends on many factors, not least of which is the ability to specify data acquisitions. Thus, while the capacity to image large areas with sub-metre ground sampling distance (GSD) optical sensors, to revisit regularly, and to specify conditions for acquisitions are all important, this remains largely beyond the reach of archaeology. Rather, archaeologists rely on using what is available in the market (inherently random, usually too expensive), what is possible to collect oneself (limited in coverage with inherent user bias), or what is freely available (medium to high spatial resolution or not specified for archaeology). Working with these available datasets, archaeologists have demonstrated that relevant information can be extracted from a range of remotely sensed data, including satellite data, at a variety of spatial and temporal resolutions for prospection, condition monitoring and land-use change [6,7]. This, correspondingly begs the questions: ’what could be achieved with an ideal, bespoke remote sensing system?’ and ’what would this ideal system comprise?’.
The analysis presented below attempts to explore the parameters for a constellation of optical satellites against this background, using Scotland as a case study area to define the mission requirements. The design primarily focuses on the number of spacecraft and orbits required to provide the necessary temporal and spatial resolution. This design is presented not so much in the expectation that a satellite system for archaeology will be launched, but, by outlining the high-level features of such an ideal system, to contribute to the further development of this data source for the discipline.

2. Scope: Specifying a Satellite for Archaeology

In considering the question of what a satellite for archaeology might look like, a scope has been defined for a specific form of archaeological prospection. This is used as a device to help consider the relationships between archaeological imperatives and satellite system design, recognising that, even with a theoretical question, an element of feasibility is required and that a ‘do everything’ approach would over-complicate the issues. As such, sensors, platforms, and data processing and interpretation workflows remain out of scope for the paper, without wishing to underplay their importance. Instead, by focusing on the orbital mechanics of the system, this work presents a mission architecture that could meet the spatial and temporal resolution requirements for archaeological prospection with existing imaging technology.
At a high level, the scope is defined with the need to cover the whole of Scotland (c. 80,000 km2), with regular revisit periods and GSD of <1 m in multi-spectral data. Such data could be expected to inform a range of activities, including archaeological prospection, condition monitoring, and landscape-scale change detection. The required GSD is specified at <1 m to enable clear identification of archaeological features at a scale of 1 m and smaller, where a higher GSD would result in insufficient spatial resolving power to do so (Figure 1). A core objective is to contribute to the creation of systematic national data [13,14], and because of this aspiration to deal with very large areas, solutions like UAVs or localised survey methods do not provide the necessary data coverage. Within this general framework, a specific aspect of scope focusses on those otherwise buried archaeological remains that are expressed through crop proxies. The emergence of cropmarking is dependent on climatic conditions, soil properties and land-use patterns which introduce considerable variation in the timing and potential for formation [15]. These factors necessitate regular revisit periods, as crop development across even relatively small areas is not uniform through the summer and is thus time critical. Crop proxies are used for archaeological prospection across the European continent and Scotland is selected as a study region with the understanding that the presented method of space system architecture design could be applied to other regions. It should be noted, however, that the latitude, prevailing weather and timing of the crop season in the region of interest will impact the solution obtained.
In Scotland, the distributions of soils that are conducive to cropmark formation and appropriate land use (mainly arable crops, but in extreme droughts also pasture) are largely in the east and south of the country (Figure 2), so this represents a specific area of interest. Archaeological prospection in these areas is currently dependent on a light aircraft-based observer-directed survey, informed by broad-brush soil moisture deficit data as a proxy for areas of likely crop stress. On this basis, prospection is undertaken relying on visual identification of cropmarking and selective imaging, in an approach that is recognised as introducing significant bias in what is observed and recorded [16,17,18,19]. This ‘cropmark survey’ then is a central focus for the specification of our satellite for archaeology, alongside monitoring of designated archaeological sites for which multi-temporal high-resolution imaging is required. This specification is discussed in further detail below.
Using the priorities defined above, the following engineering specification was generated for a satellite system for archaeology:
  • Coverage must extend to all of Scotland;
  • For eastern and southern Scotland (Figure 2) the maximum revisit time should be three weeks, with a two-week revisit interval desirable, to ensure cropmark formation, which is time variant, can be captured;
  • A GSD of <1 m is required, with 0.5 m desirable, in recognition of the scale of anticipated features;
  • Imagery should be multi-spectral (including at least Red, Green, Blue and Near-Infra-Red bands);
  • The system must operate for a minimum of five years, to allow for observations during both wet and dry years;
  • Usability in regions of similar climate/land environment is desirable.
Based on the engineering specification, some high-level system requirements are identified that will constrain the space system design. Firstly, the requirement to provide a GSD of <1 m requires a low-Earth orbiting (LEO) spacecraft, as spacecraft in low altitude orbits will produce lower GSD data. LEO spacecraft are generally defined as having mean orbit altitudes of 300–1000 km and will orbit the Earth with a period of approximately 90 min. Geosynchronous and geostationary spacecraft have an orbit period that is the same as the Earth’s speed of rotation about its axis, allowing for continuous observations over a given longitude. However, these spacecraft operate at approximately 36,000 km altitude, and hence would be unable to provide the GSD required. Furthermore, an imager with a low GSD will generally have a small field of view, meaning that it may be necessary to use a constellation of spacecraft to achieve the desired revisit times. A greater number of spacecraft would tend to imply a higher cost system, and so the space system design discussed below will attempt to reduce costs by employing the minimum number of spacecraft. However, space system cost depends on a range of factors and is challenging to estimate due to the limited public availability of past mission costs. As such, any cost estimates will be subject to significant uncertainties.
On the basis of the defined requirements, existing space systems are firstly assessed against the specification (Section 3), which is followed by discussion of a bespoke space system design (Section 4).

3. Existing Space Systems

Of the multitude of Earth observing (EO) spacecraft currently in operation (as of 26 June 2020), only a small number can provide the appropriate GSD, multi-spectral imagery necessary for the archaeological purposes outlined in Section 1 and Section 2. These systems are summarised in Table 1, where GSD given are the maximum attainable (normally at nadir). In all cases pansharpened multi-spectral images are available at the stated panchromatic spatial resolution. While the listing of eleven systems (Table 1), with often daily revisit intervals, suggests that suitable data should be readily available, this is not the case. Firstly, the majority of these systems are commercial; as such, not all data are publicly available, and most of the data are certainly not freely available. Moreover, the revisit rates listed indicate the frequency with which a region of the Earth can be observed, but the actual data collection frequency is much lower. This is because the stated revisit time includes the ability of the spacecraft to slew and point their instrument off-nadir. As such, the revisit time represents the time in which any one region of the Earth could be imaged; it does not represent the time in which imagery of the entire Earth can be collected. As the spacecraft can only point at one location at a time, the limiting factor for the complete imaging of a region is the instrument swath width (i.e., the width of the spacecraft imager field of view on the Earth’s surface) and, as noted in Section 2, a lower GSD generally corresponds to a smaller field of view.
For visual imagery, the images must be taken during daytime and at times of limited cloud cover, further compounding these difficulties. For Scotland, the average cloud cover in May, June and July is 70%, though it may be lower on the east coast of the country [20]. Assuming an equal chance of cloud being present at any time, this indicates that only 30% of daytime satellite passes over the region of interest are likely to be useable. These factors highlight the reality behind the headline figures of revisit rates, and the potential difficulties of securing imagery of given locations at specified periods.
Conspicuously absent from Table 1 are the Sentinel-2 spacecraft, part of the EU Copernicus programme, and NASA’s Landsat spacecraft, as, in spite of their frequent revisits over Europe (five days for Sentinel-2 A and B combined and eight days for Landsat 7 and 8 combined) and previous use in archaeological prospection and condition monitoring [6,7], they cannot provide the GSD necessary for the purposes outlined in Section 2.
In order to assess the suitability of existing satellite systems for archaeological purposes as defined in the scope (Section 2), an approximately 150 km2 region in Scotland is examined as a sample site (Figure 3). For each of the eleven systems listed in Table 1, the availability of recent data is assessed for the periods from 1 May 2016 to 31 July 2016 and from 1 May 2018 to 31 July 2018. These periods were selected for the favourable cropmark formation conditions that prevailed during dry and hot summers that encouraged crop stress. For all the apparent likelihood of data availability on the basis of the large number of operational systems, for the sample area there are a total of eight images with <30% cloud cover for these two time periods, many of which provide <100% coverage of the area of interest. The low number of images available is striking, with a concomitant low number of time series of multiple overlapping images. The trends of image acquisition seen here reflect the priorities of most satellite data providers/consumers, with high demand, and hence high acquisition, generally focusing on urban areas. Failing a significant change in the global use of satellite data, such trends are likely to continue across all very high-resolution satellite data providers. Leaving aside the cost of procuring such commercial data (indicative costs for these products range from $5 to $50/km2 [25]), this volume of imagery is clearly insufficient as a primary source for the routine archaeological survey of the region specified above.
Through the European Space Agency Third Party Mission programme, access was granted to data obtained by the SkySat constellation of spacecraft (operated by Planet) to evaluate its use in detection and monitoring of archaeological sites. Through this, a request was made to Planet for one image to be collected of the study area (Figure 3) each week in July 2020 using the SkySat spacecraft. In order to satisfy this request Planet collected multiple images on almost every day in July. During the month of July, 150 images were collected, but only 26 of these have <50% cloud cover; this corresponds to just 17% of images. Furthermore, if the images are to be used for the detection of time varying cropmarking, multiple images collected on the same day are of limited value. While this data volume could be sufficient for the detection of crop proxies in summer, it has required dedicated daily collections from a total of 12 different spacecraft.
Figure 3. Stranraer area of interest [26]. Centred on 54° 52′27″ N, 4° 58′ 76″ W; see Figure 2 for location. © Planet Labs Inc. 2020.
Remotesensing 12 04100 g003

4. Bespoke Space System Design

The discussion in Section 3 identifies that the ideal requirements for routine archaeological detection and monitoring in Scotland, as defined by the requirements outlined in Section 2, cannot be achieved by using satellite data acquired for general purposes, which is not to negate the potential utility of such data in other contexts (e.g., [1,2,3,4,5,6,7,8,9,10]). Tasking a constellation of 12 spacecraft did allow for suitable imagery to be collected of a small region of Scotland, but the competing needs of other customers imply that extending this to provide routine, systematic coverage of the entirety of Scotland would be challenging. This reinforces many of the limitations to the effectiveness of archaeological applications of satellite data discussed in general terms in 
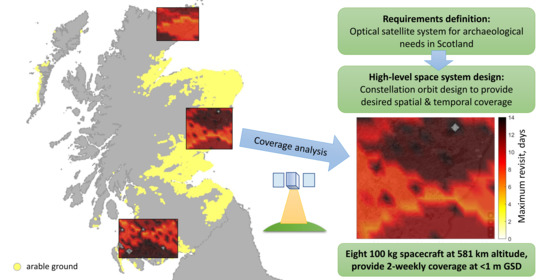
Section 1. From that position, a high-level design for a bespoke space system is developed and presented. It should be noted that this design is based on requirements derived for specific archaeological priorities in Scotland. As such, the space system specified may not be ideal for archaeological purposes elsewhere; however, the design methodology presented, and the general insights obtained, could be applied to any region.

4.1. Payload Selection

The key component of any spacecraft system is the payload, which must be selected or designed to meet the mission requirements. The function of the rest of the spacecraft, referred to as the spacecraft bus, is to ensure the successful operation of the payload. The potential variability in the payload, as a key variable in a system, is illustrated in a selection of existing multi-spectral imaging satellite systems with the required GSD (Table 2).
The spacecraft system properties can be further expressed in the panchromatic GSD of each imager plotted against its swath width and the total mass of the host spacecraft (Figure 4). The mass of the spacecraft is indicative of the mission budget, as the launch cost, which often dominates the mission budget, will rise with increasing mass. In this respect, the SkySat 3-13 design is an attractive option as it offers high-resolution imagery for an extremely low spacecraft mass when compared to other systems. However, the corollary of this is that it has the smallest swath width of all the imagers considered, which will correspond to a longer revisit time as the ground covered on each orbit is concomitantly less.
Figure 4. Panchromatic spatial resolution versus swath width for existing high-resolution satellite systems. Bubble size indicates spacecraft mass.
Remotesensing 12 04100 g004

4.2. Orbit Design

The orbit selected for the spacecraft will greatly influence the coverage and revisit capabilities of the system. Using the SkySat parameters defined in Section 4.1 as a baseline, an orbit is selected with the intent of maximising coverage of Scotland, and an estimation is made of the number of spacecraft required within this orbit to provide the desired revisit times. Circular orbits are assumed to be used due to ease of orbit insertion and operational maintenance.
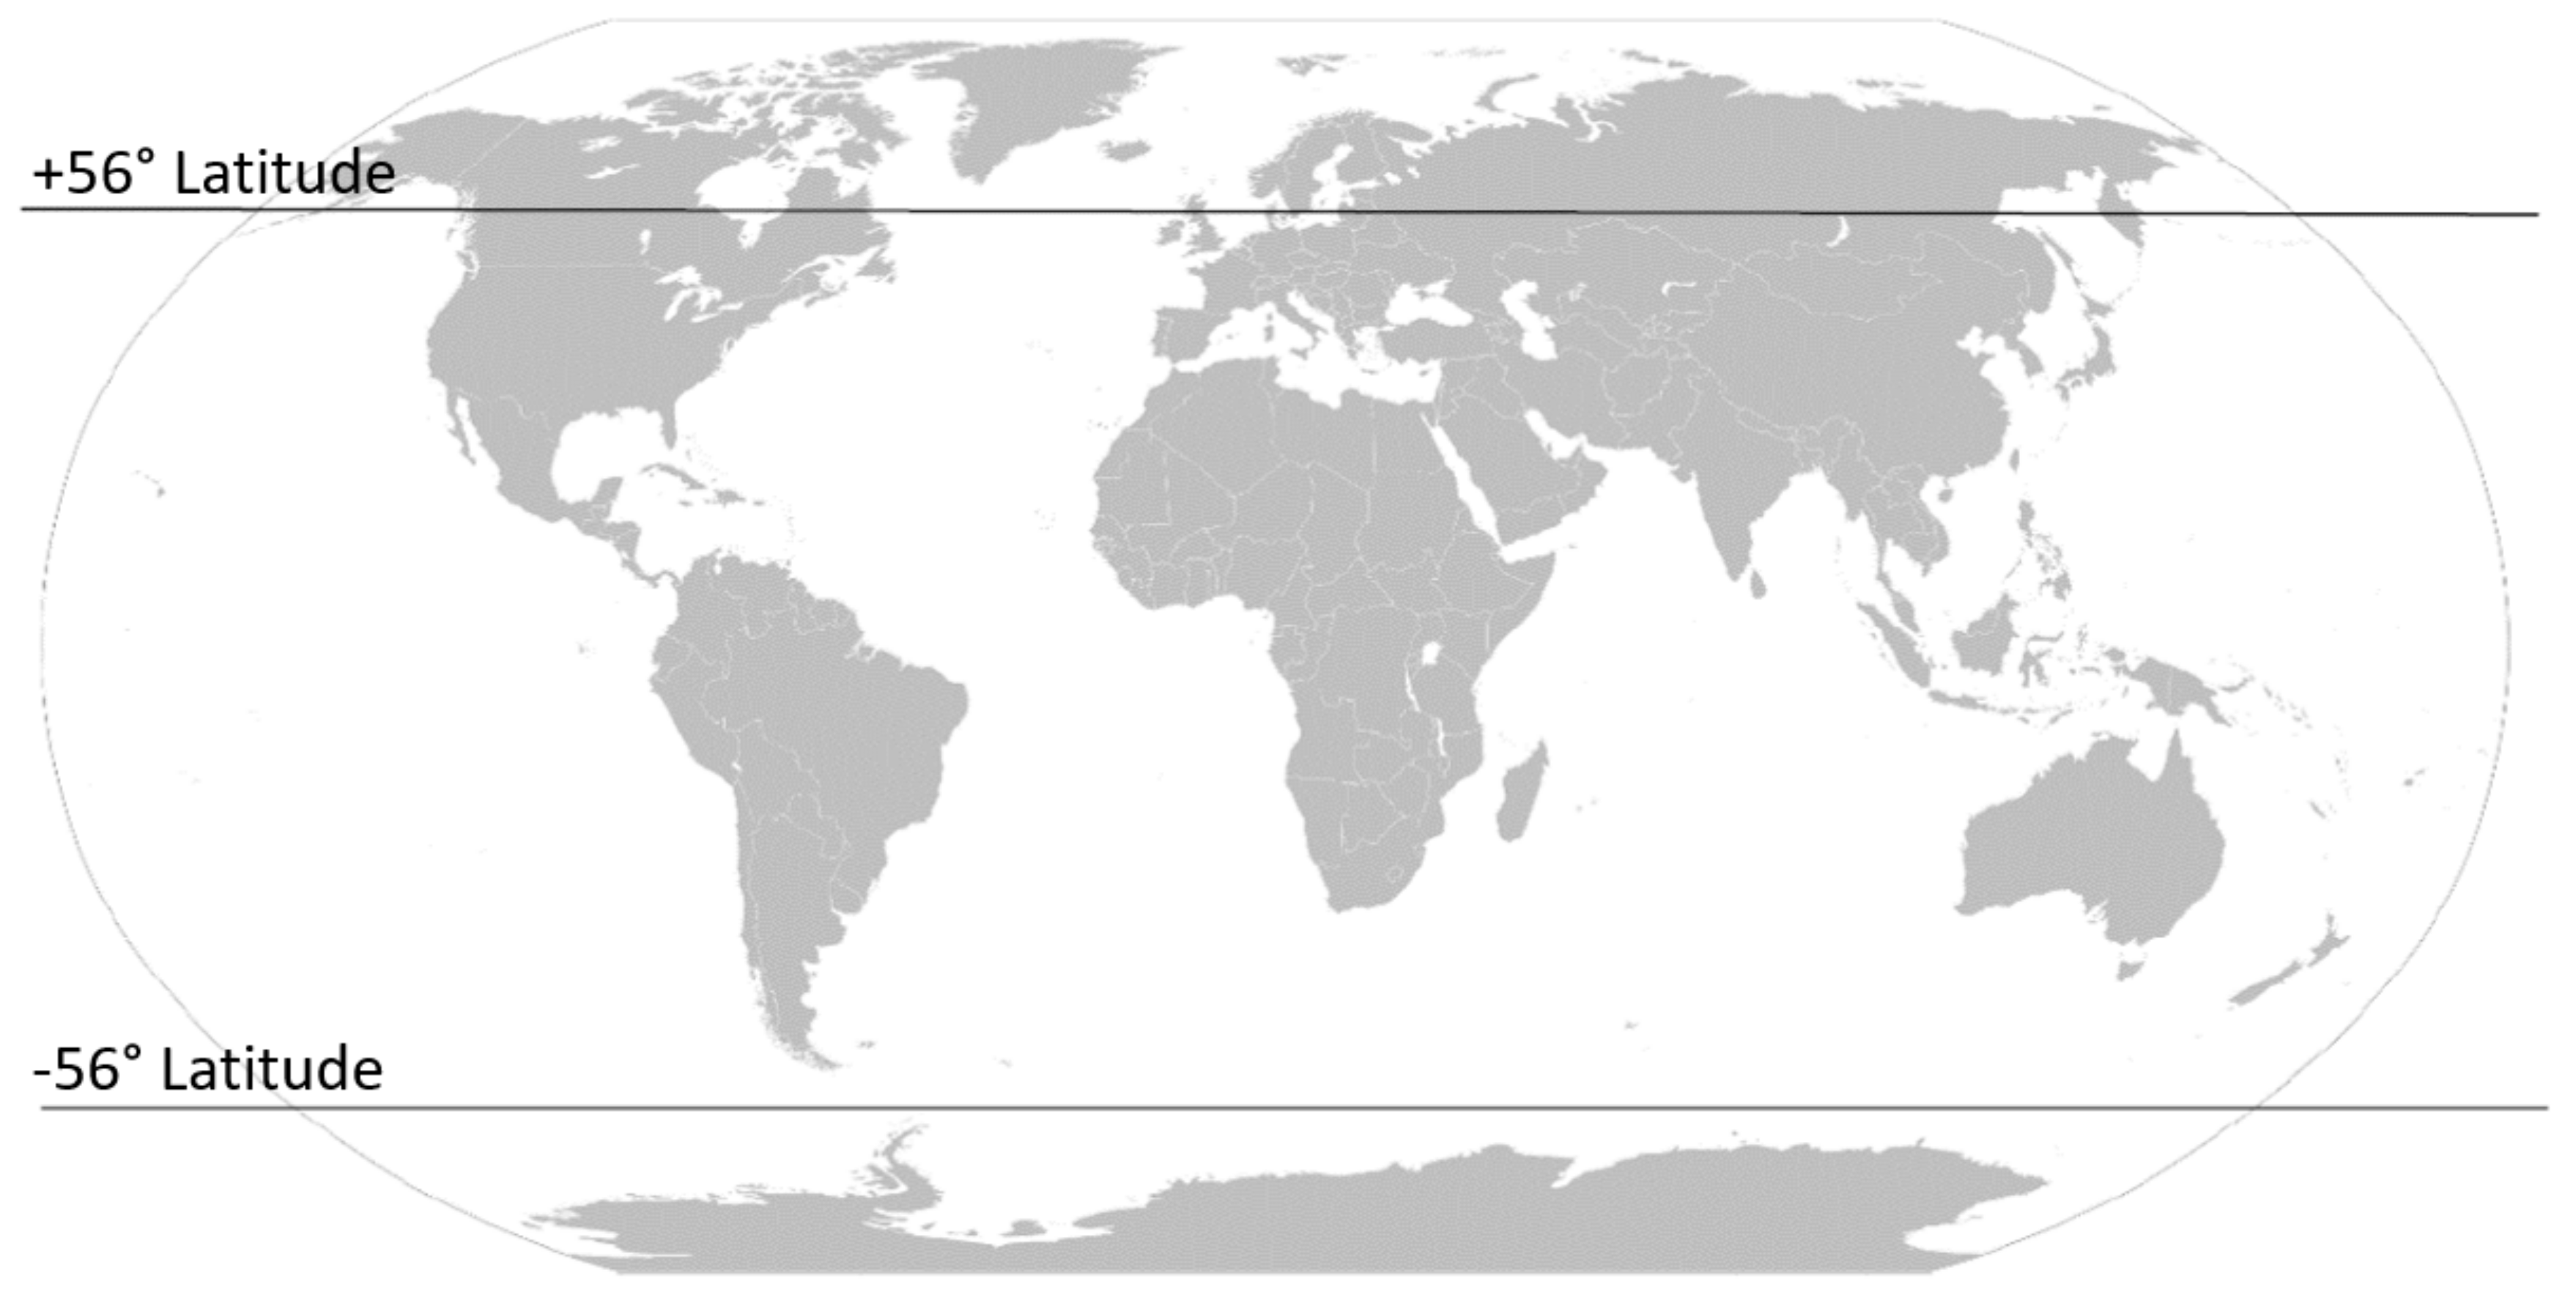
Altitude is one of the most significant parameters for the orbit design as it will influence the spatial resolution and swath width of the payload instrument; a lower altitude will result in a higher resolution image, but a narrower swath width. Inclination, which describes the angle between the orbit plane and the Earth’s equator, is another critical parameter in orbit design. The inclination is critical for two primary reasons. Firstly, the most northerly and southerly latitude a spacecraft will pass over is defined by the orbit inclination such that the geodetic latitude, δ, range of the spacecraft coverage can be defined as, where 0 δ   t a n 1 t a n i 1 f 2 f , where i is the orbit inclination in degrees and f is the Earth flattening factor to allow for conversion from geocentric to geodetic latitude [30]. It should be noted that depending on the swath width of the imager and the pointing capabilities of the spacecraft, it may be possible to view latitudes beyond this range. Secondly, spacecraft will have the shortest revisit period over regions at the most northerly and southerly viewable latitudes. The revisit time will generally increase as the latitude of the location of interest approaches the equator. The SkySat spacecraft operate in sun-synchronous orbits. A sun-synchronous orbit is a near-polar orbit where the average rate of nodal precession (i.e., the rate at which the spacecraft orbit rotates around the Earth’s axis of rotation) is the same as the Earth’s average rate of orbit around the sun. This synchronicity means that the relative time of day along the satellite’s ground track remains approximately the same for each orbit pass. This is especially useful for Earth observing satellites as it ensures consistent lighting conditions each time a region is observed. Furthermore, as a near-polar orbit it allows for the entirety of the Earth to be observed. However, sun-synchronous orbits generally have an inclination of 96 deg < i < 99 deg, depending on the orbit altitude, and hence provide maximum coverage in the region of 81 deg < δ < 84 deg.
In order to estimate the revisit time for a satellite in a sun-synchronous orbit over the entirety of Scotland, the time to provide full coverage of the lowest latitude of interest is calculated, assuming no overlaps between passes. The southernmost point of Scotland is the Mull of Galloway, with a latitude of approximately 54.63 deg. The circumference of the circle defined by a given line of latitude, cδ, can be estimated as [31]
c δ = 2   π R 1 sin δ 1 f 2 1 cos δ
where R is the Earth equatorial radius, taken as 6378 km, f is the Earth flattening factor and δ is the geodetic latitude of interest. The circumference of the Earth at 54.63 deg latitude is hence estimated as 23135 km, assuming a flattening factor f of 3.3528 × 10 3 as given by the World Geodetic System 1984 [32].
The width of a latitude band covered by an inclined spacecraft in a single pass, W , with a swath width, s , will depend on the direction of motion of the spacecraft relative to the line of latitude at nadir. At the equator, the relative angle between the spacecraft direction of motion and that of the line of latitude, β , will be β = i , where i is the orbit inclination, while at a latitude δ = i , there will be β = 0 . This angle β can be calculated [33] as
β = tan 1 sin 2 i   sin 2 δ cos i ω   cos 2 δ
where ω is the rotational rate of the Earth, taken as 7.2921 × 10 5 rad/s. The width of the latitude band covered in a single pass is then
W = s sin β .
It should be noted that as the latitude of interest, δ , approaches the orbit inclination, i , the width covered will tend to infinite; as such the above approximation is not valid at latitudes close to i . For a swath width of 6.6 km, and a spacecraft inclined at 97 deg, this gives a width covered, W , at 54.63 deg latitude of 6.8 km, meaning 3417 passes would be required for full coverage at 54.63 deg latitude, assuming no overlap between passes.
The orbit period, T , of a spacecraft in a circular orbit is
T = 2 π ( R E + h ) 3 μ
where h is the orbit altitude, R E is the mean Earth radius, taken as 6371 km, and μ is the standard gravitational parameter of the Earth, taken as 3.986 × 10 5 m3/s2. A spacecraft at an altitude of 500 km would have an orbit period of 94.47 min and therefore would require approximately 224 days to achieve 3417 passes; this gives a revisit time of approximately 224 days at 54.63 deg latitude. Assuming spacecraft could be distributed to provide no overlap in coverage, 16 spacecraft would hence be required to meet the desired revisit criteria of two weeks.
In order to minimise the revisit time of a spacecraft over a region, an inclination can be selected that is greater than, but close to, the most northerly latitude of interest. For Scotland, this is approximately 60 deg. For an orbit inclined at 60 deg, the width covered by a spacecraft with a swath of 6.6 km in a single pass at 54.63 deg increases to 13.1 km, as calculated using Equations (2) and (3), meaning 1761 passes are required to cover the full Earth’s circumference at 54.63 deg latitude. This would take 116 days for a single spacecraft, using the orbit period calculated with Equation (4), and so nine spacecraft could meet the two-week requirement—a significant improvement in comparison to the sun-synchronous case.
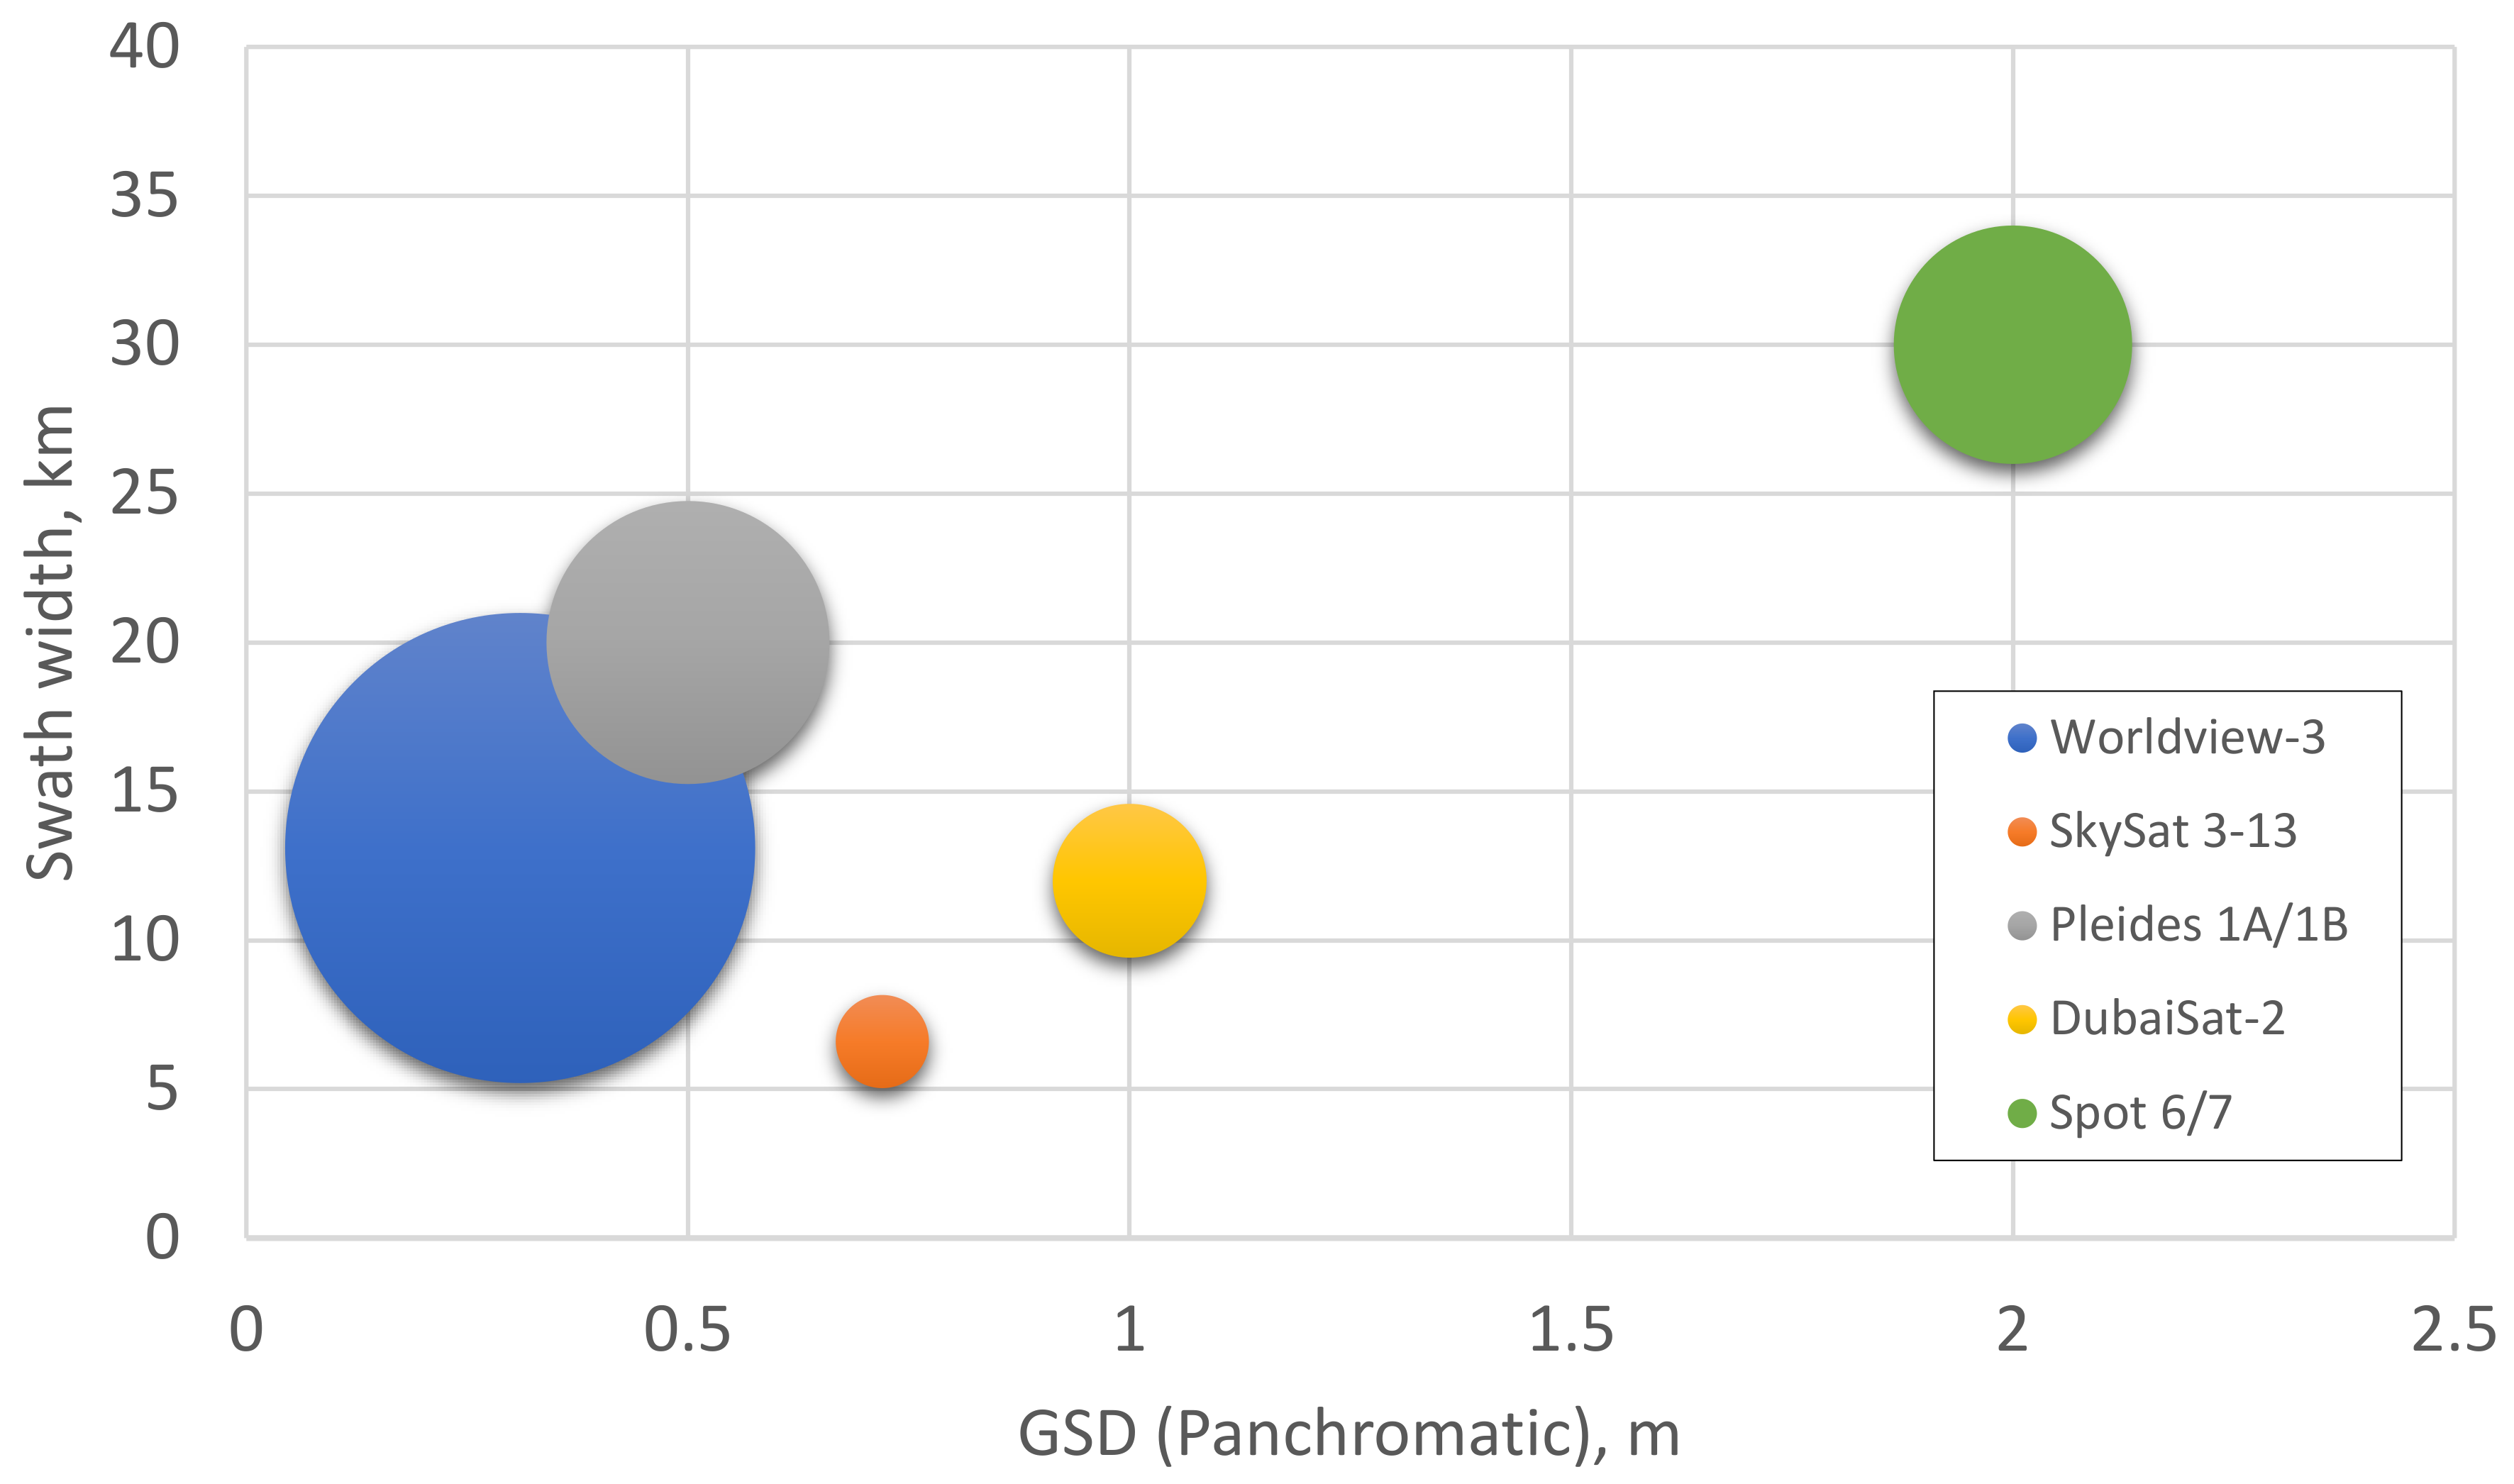
Increasing the spacecraft altitude will increase the swath width but decrease the GSD; this provides an opportunity to fine-tune the performance of the space system to, potentially, further reduce the number of spacecraft required. The relationship between GSD, swath width, s , and spacecraft altitude, h , can be expressed as
p G S D = L h = w s
where w is the sensor width, p is the photosite pitch and L is the instrument focal length [34]. Assuming the sensor parameters p , L , and w remain constant, both the GSD and swath width vary linearly with altitude according to Equation (5). Estimating the GSD and swath width at a given altitude using Equation (5) gives the results shown in Table 3. The number of spacecraft that would be required to provide a two-week revisit of Scotland at each altitude for a 60 deg inclined orbit as calculated using Equations (2)–(4) are also given. Note that the number of spacecraft required is rounded up to the nearest whole and the values should be considered a minimum as eclipse periods, cloud cover, and tasking restrictions may impact the spacecraft performance. The general trend is that a higher altitude gives a reduction in the number of spacecraft required, with diminished returns at greater altitudes. If the upper limit on GSD is taken as 1 m, then the minimum number of spacecraft needed will be seven, at an altitude of <700 km.
Orbit altitude will also directly impact the spacecraft on-orbit lifetime. A spacecraft in low-Earth orbit, that is with an altitude <1000 km, will experience drag due to the Earth’s atmosphere. Over time this will cause the spacecraft altitude to reduce, ultimately resulting in the spacecraft naturally deorbiting. A spacecraft orbit should be sufficiently high to ensure a suitable operational life for the spacecraft prior to deorbit, while also ideally complying with the UN Space Debris Mitigation Guideline to “limit the long-term presence of spacecraft and launch vehicle orbital stages in the low-Earth orbit (LEO) region after the end of their mission” [35]. Generally, this guideline is considered to be met if the spacecraft will naturally deorbit within 25 years of the end of the mission.
Assuming a power law fit to the 1976 standard atmosphere [36], the time for a spacecraft to naturally decay to a certain altitude, h 1 , as a function of time can be defined as [37]
t =   m C D   A   Λ   μ   R   h 0 R 1 + γ h 1 R 1 + γ 1 + γ   1000 γ
where h 0 is the initial spacecraft altitude,   C D is the coefficient of drag, taken as 2.2, and γ and Λ are coefficients of the power law taken as 7.201 and 10 7 , respectively. For a spacecraft with a mass, m , of 100 kg and a cross-sectional area, A , of 1 m2 (similar to those of SkySat), and with de-orbit assumed to occur at an altitude of 100 km, the time to deorbit from a range of possible orbit altitudes are shown in Table 3. A spacecraft in an orbit of 500 km or lower will deorbit naturally in less than five years, meaning that significant on-board propulsion would be required to maintain the spacecraft altitude and meet the requirement for a minimum operational life of five years. A 600 km orbit seems suitable as it requires the minimum number of spacecraft while still meeting the 25 year natural deorbit requirement and providing <1 m GSD.

4.3. Detailed Constellation Design and Simulation

Based on the coverage estimates made in Section 4.2, a 600 km altitude, 60 deg inclined orbit is selected as a baseline for the constellation. In order to ensure a 14 day revisit over Scotland, a repeating ground-track (RGT) orbit is designed [38]. It is calculated that for a spacecraft in a 60 deg inclined orbit, an altitude of 581.077 km will give a repeat period of 207 orbits in 14 days. At this altitude, the width covered by a single spacecraft pass at 54.63 deg latitude, the lowest latitude of interest, is 15.3 km as calculated using Equations (2) and (3), meaning eight spacecraft would be required for full coverage in 14 days. To ensure an even distribution of coverage, the spacecraft should be organised in a ‘train formation’ such that one edge of the swath of the first spacecraft passing 54.63 deg latitude is aligned exactly with the opposite edge of the swath of the subsequent spacecraft [39]. The time for Earth to rotate such that the surface at 54.63 deg latitude will move through a distance equal to the width seen by the spacecraft at the latitude of interest, W , can be estimated as
t s e p = 2 π W ω c δ
where ω is the rotational rate of Earth, and c δ is the circumference of the circle of the latitude of interest. The spacecraft should then be separated through true anomaly (i.e., within the orbit plane) such that a following spacecraft will reach the true anomaly of the previous spacecraft in the time t s e p . This separation can be calculated, in radians, as
θ s e p = 2 π t s e p T
where T is the orbit period, as calculated using Equation (4). For spacecraft in a RGT orbit at 581.077 km, this gives a required true anomaly separation between spacecraft of approximately 3.556 deg.
An orbit propagator is used to estimate the coverage that could be expected from a constellation of eight spacecraft in a 581.077 km altitude, 60 deg inclined orbit, with a separation between spacecraft of 3.556 deg through true anomaly. Using Equation (5), the spacecraft are calculated to have a swath width of 7.7 km at 581.077 km altitude and the simulation is carried out for a 30 day period. The propagator uses the Gauss/Lagrange planetary equations [40] to calculate the change in the Keplerian orbit elements of the spacecraft over time. J2, which is the perturbation due to an oblate central body, is the only perturbation included [41]. Drag and other forces acting on the satellite are disregarded as they are considered small when compared to the J2 effect. The satellite ground track and associated coverage is calculated assuming a spherical Earth. The constants and orbit parameters used in this analysis are given in Table 4 and 
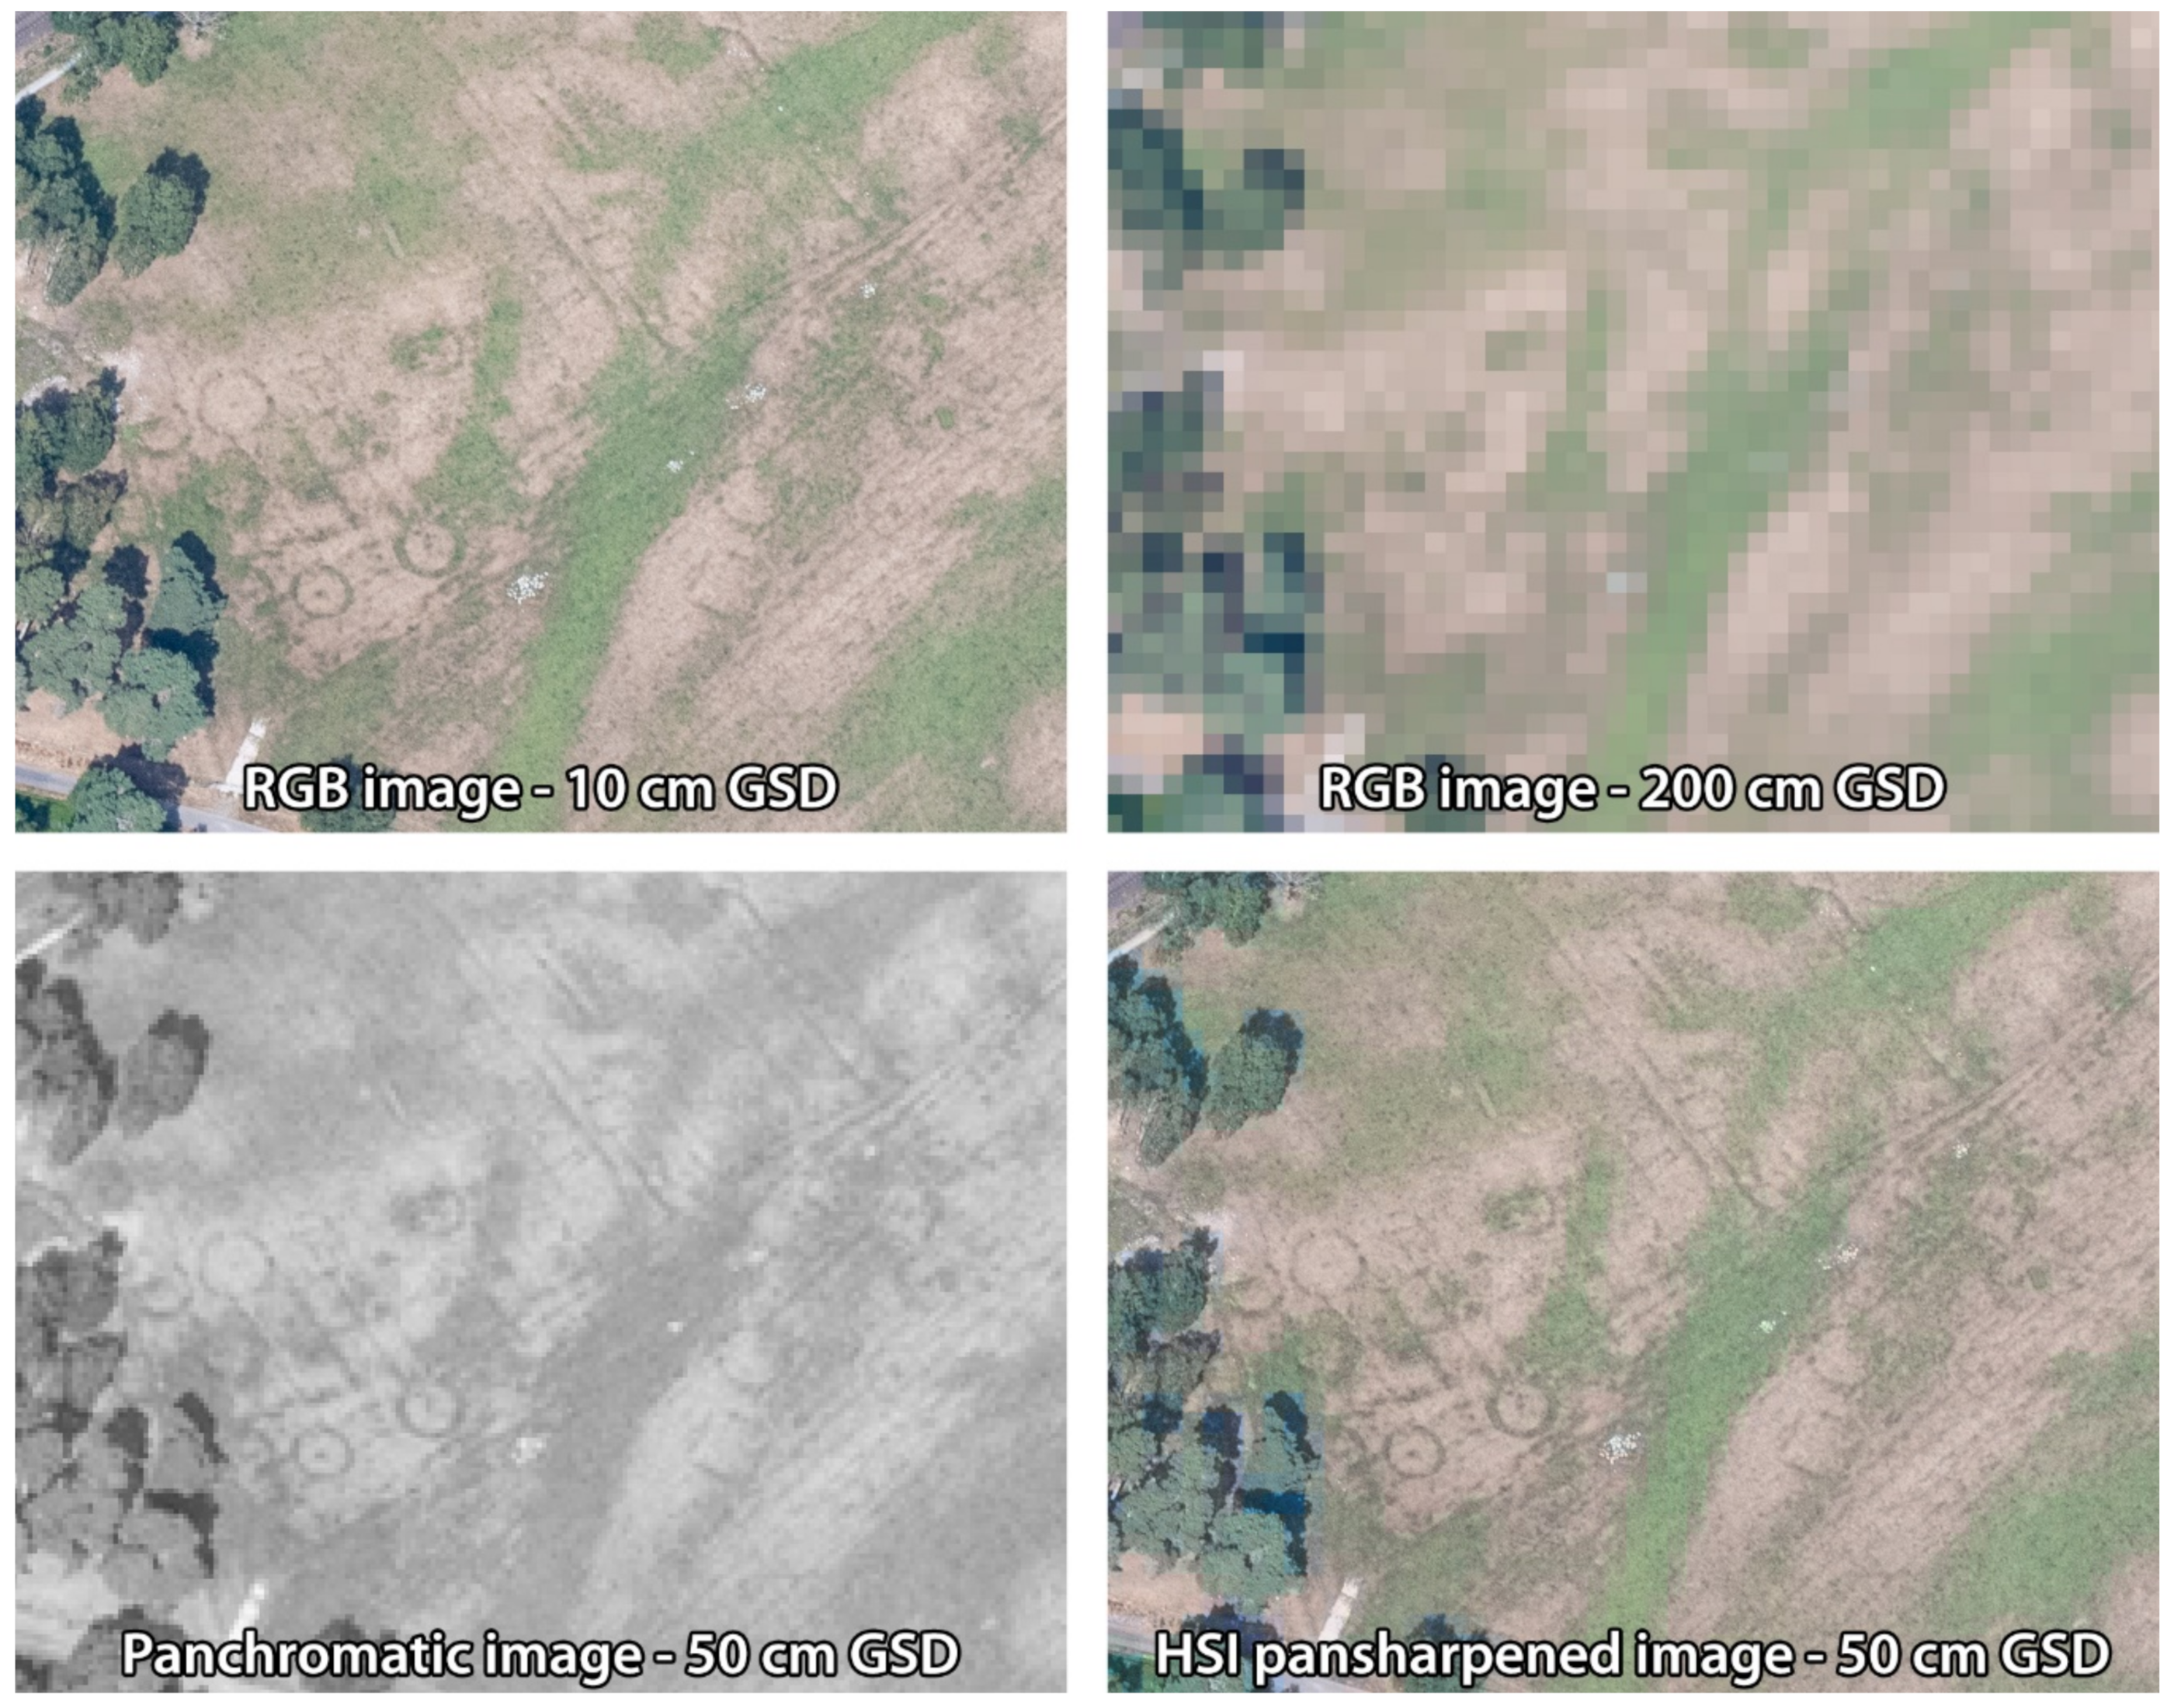
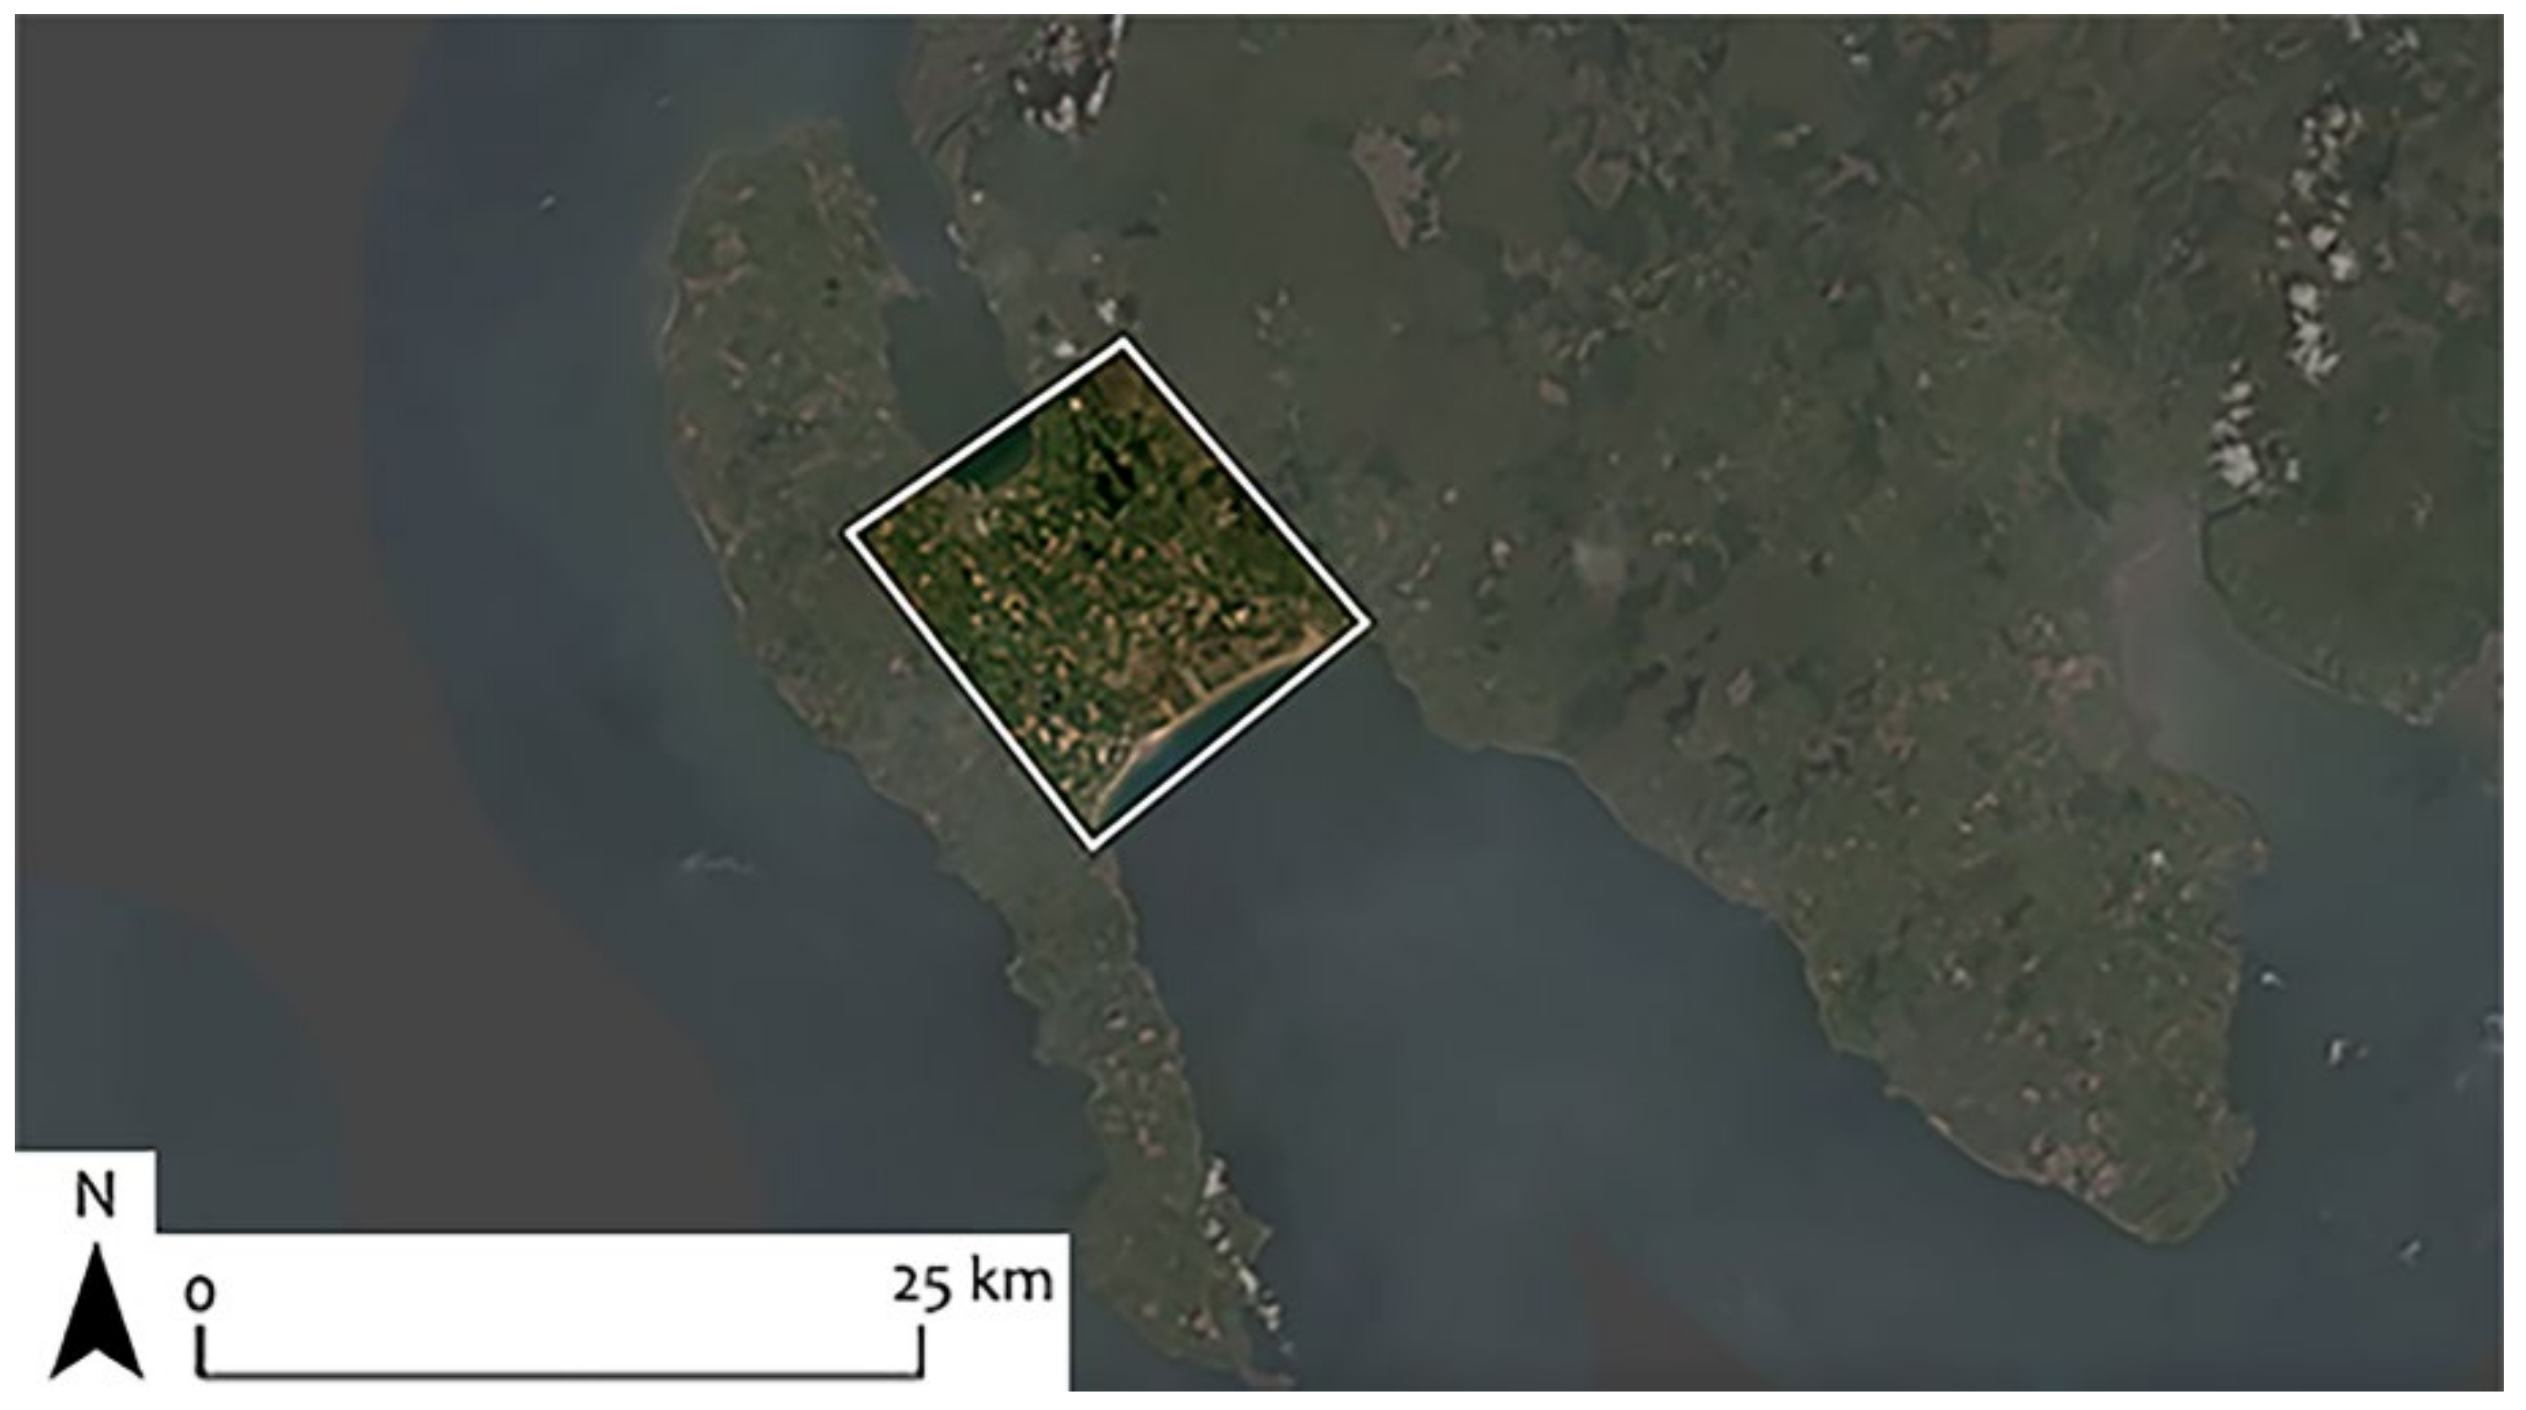
Table 5, respectively. The epoch date of 1 June 2020 is arbitrarily chosen for this example study. Sample sections of the north, east and south of Scotland are considered to reduce computational complexity, selected on the basis of the areas of interest (Figure 2 and Table 6).
The orbit simulation results are summarised in Table 7 and visualised in Figure 5, Figure 6 and 
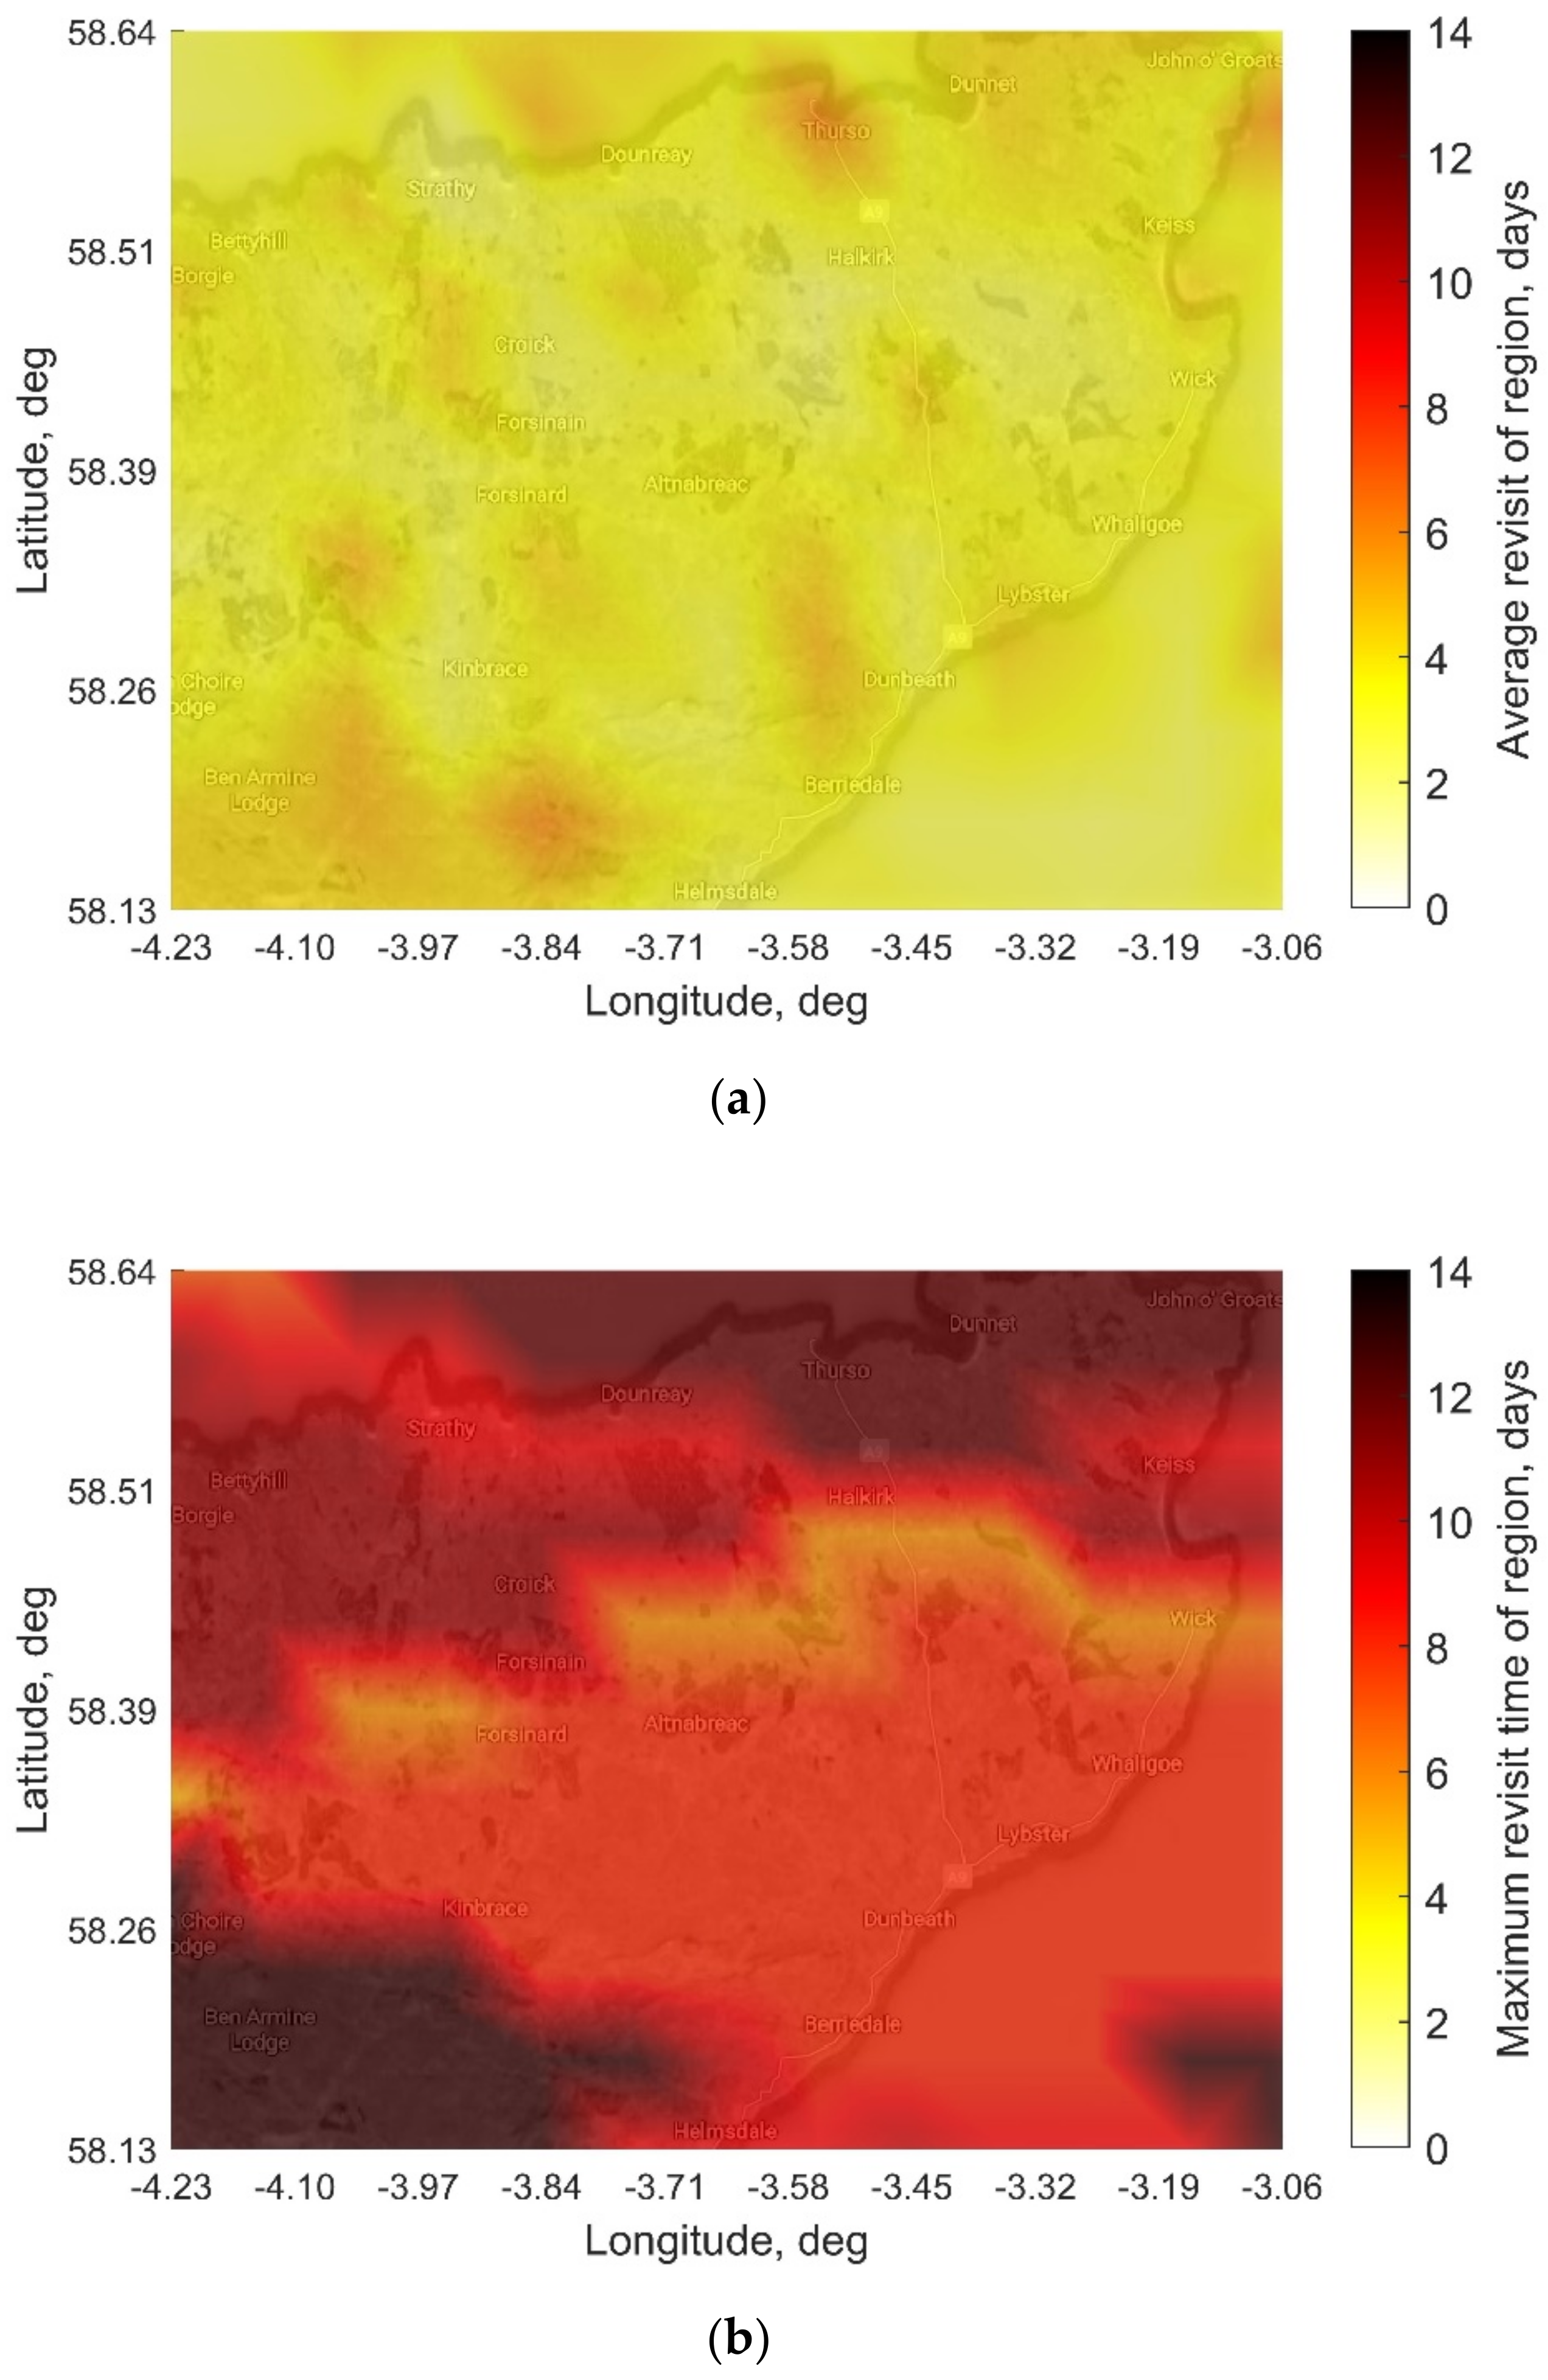
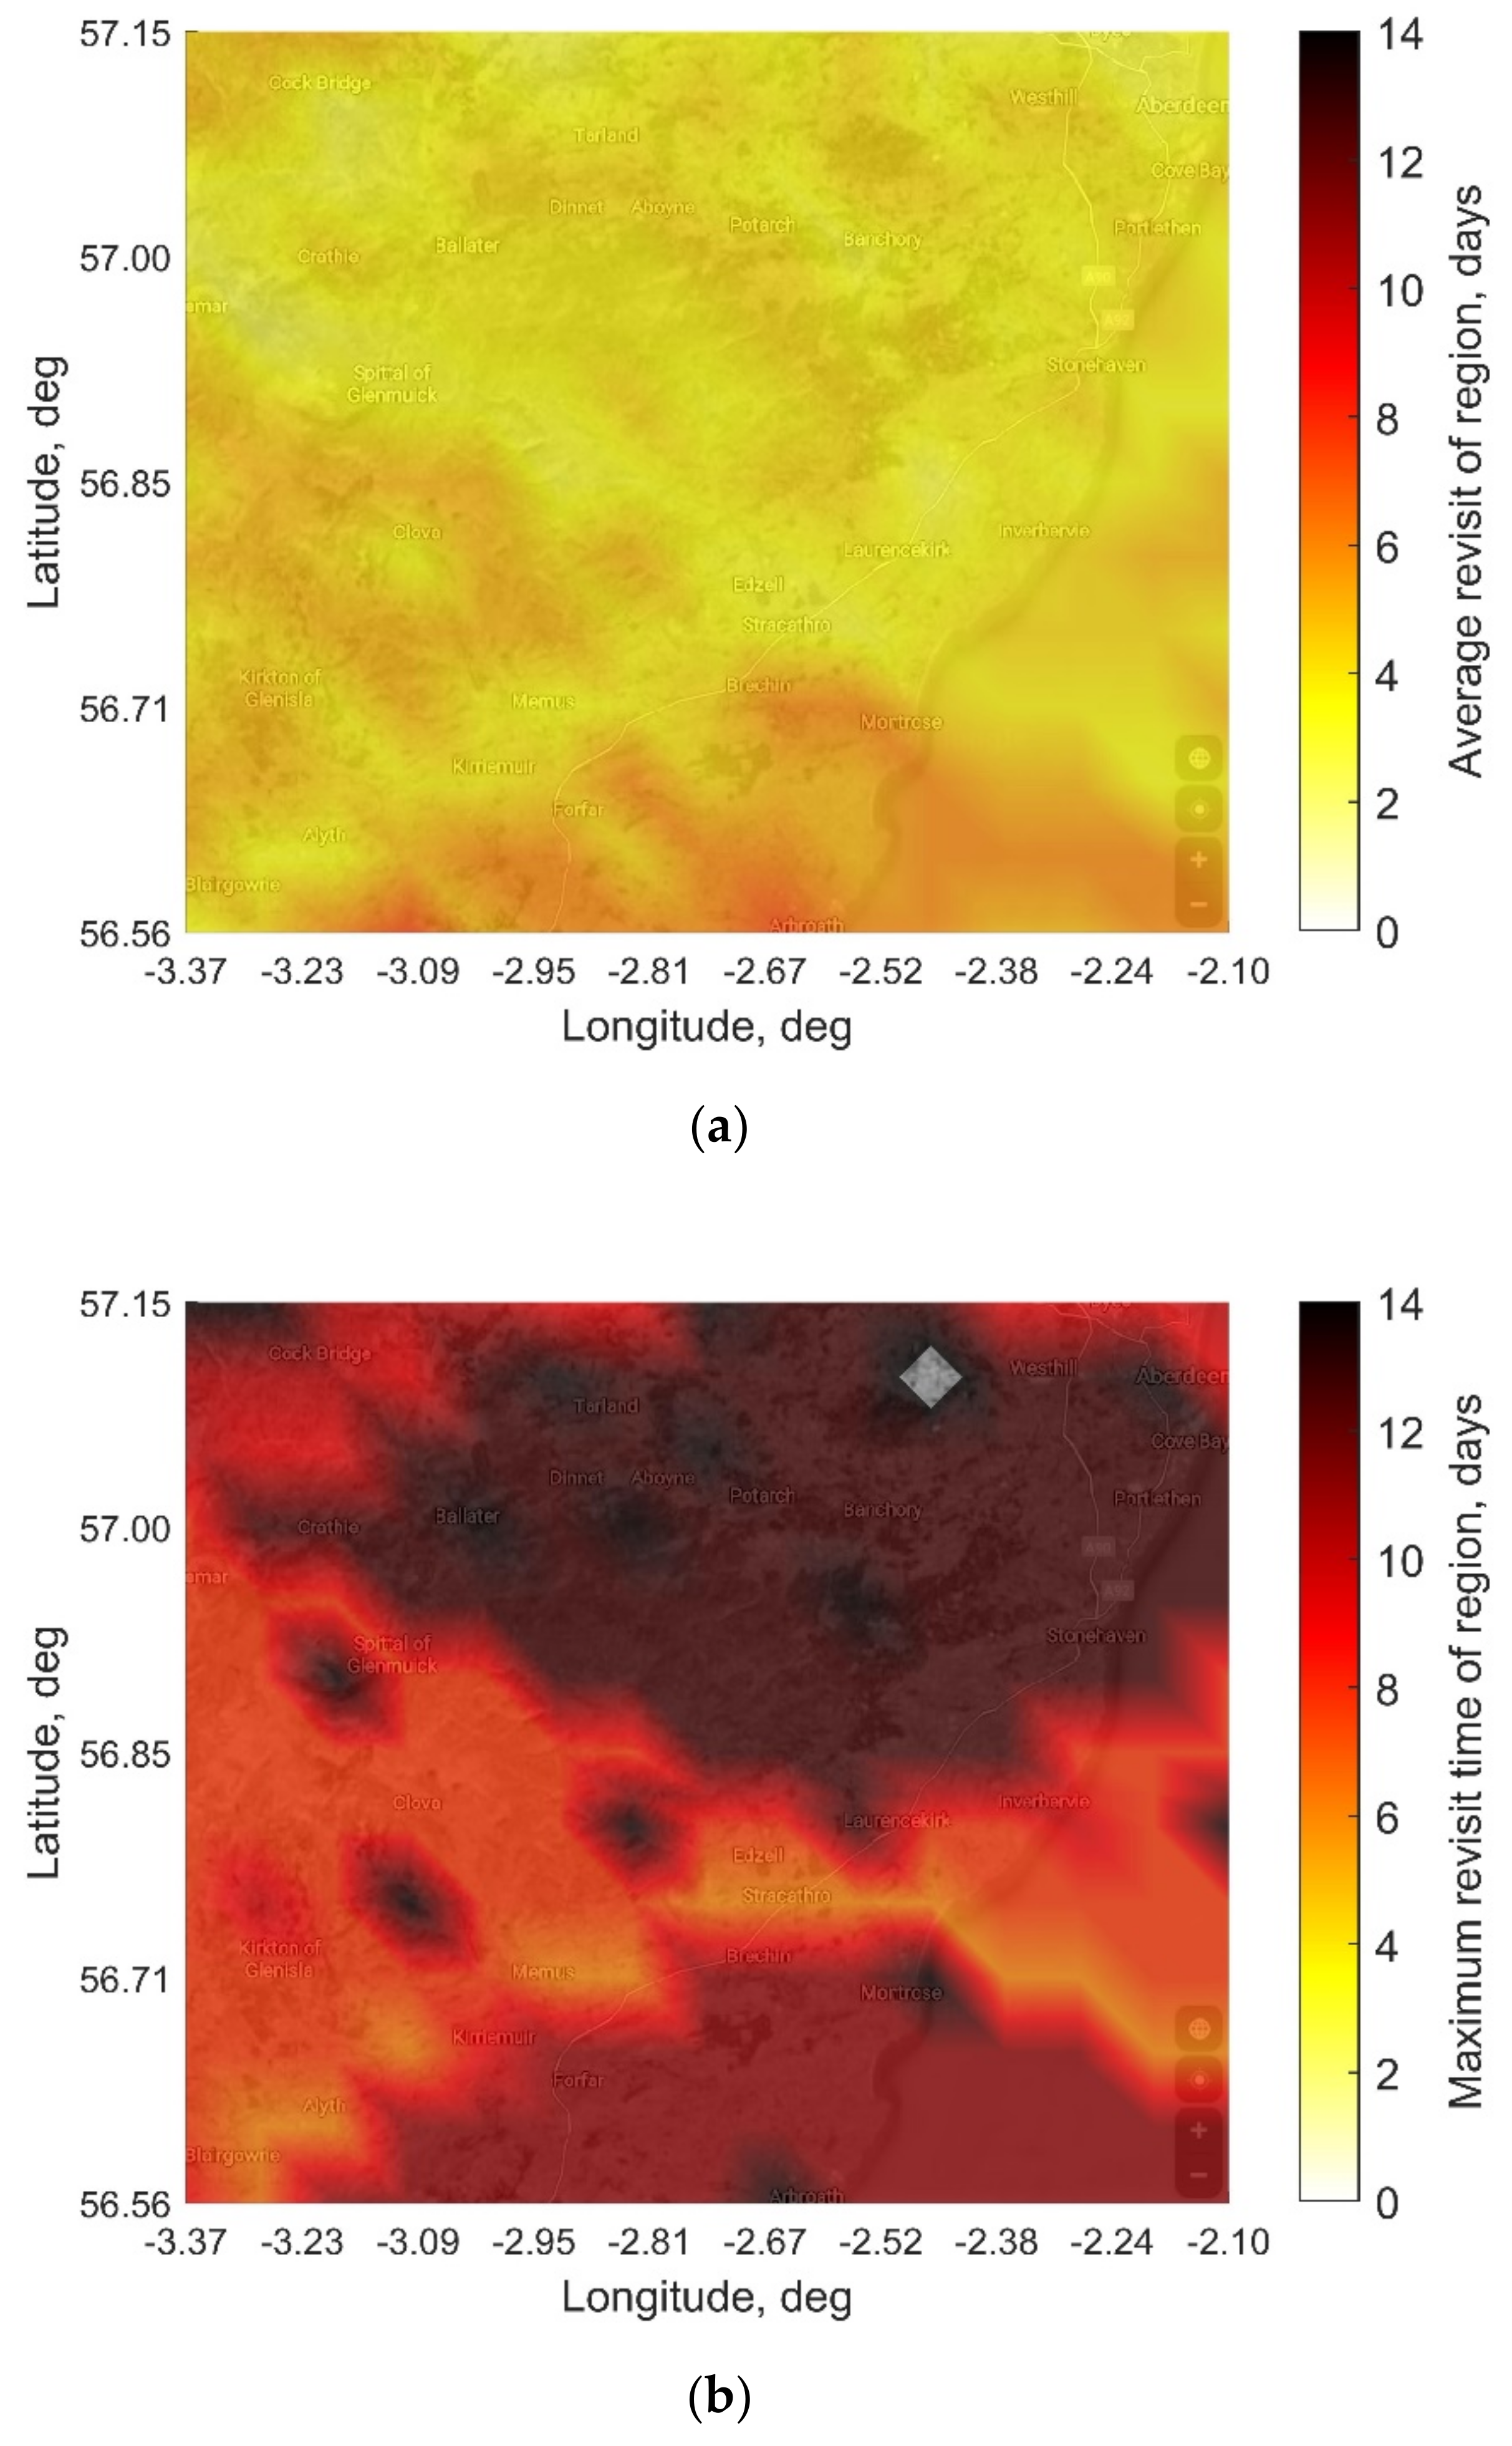
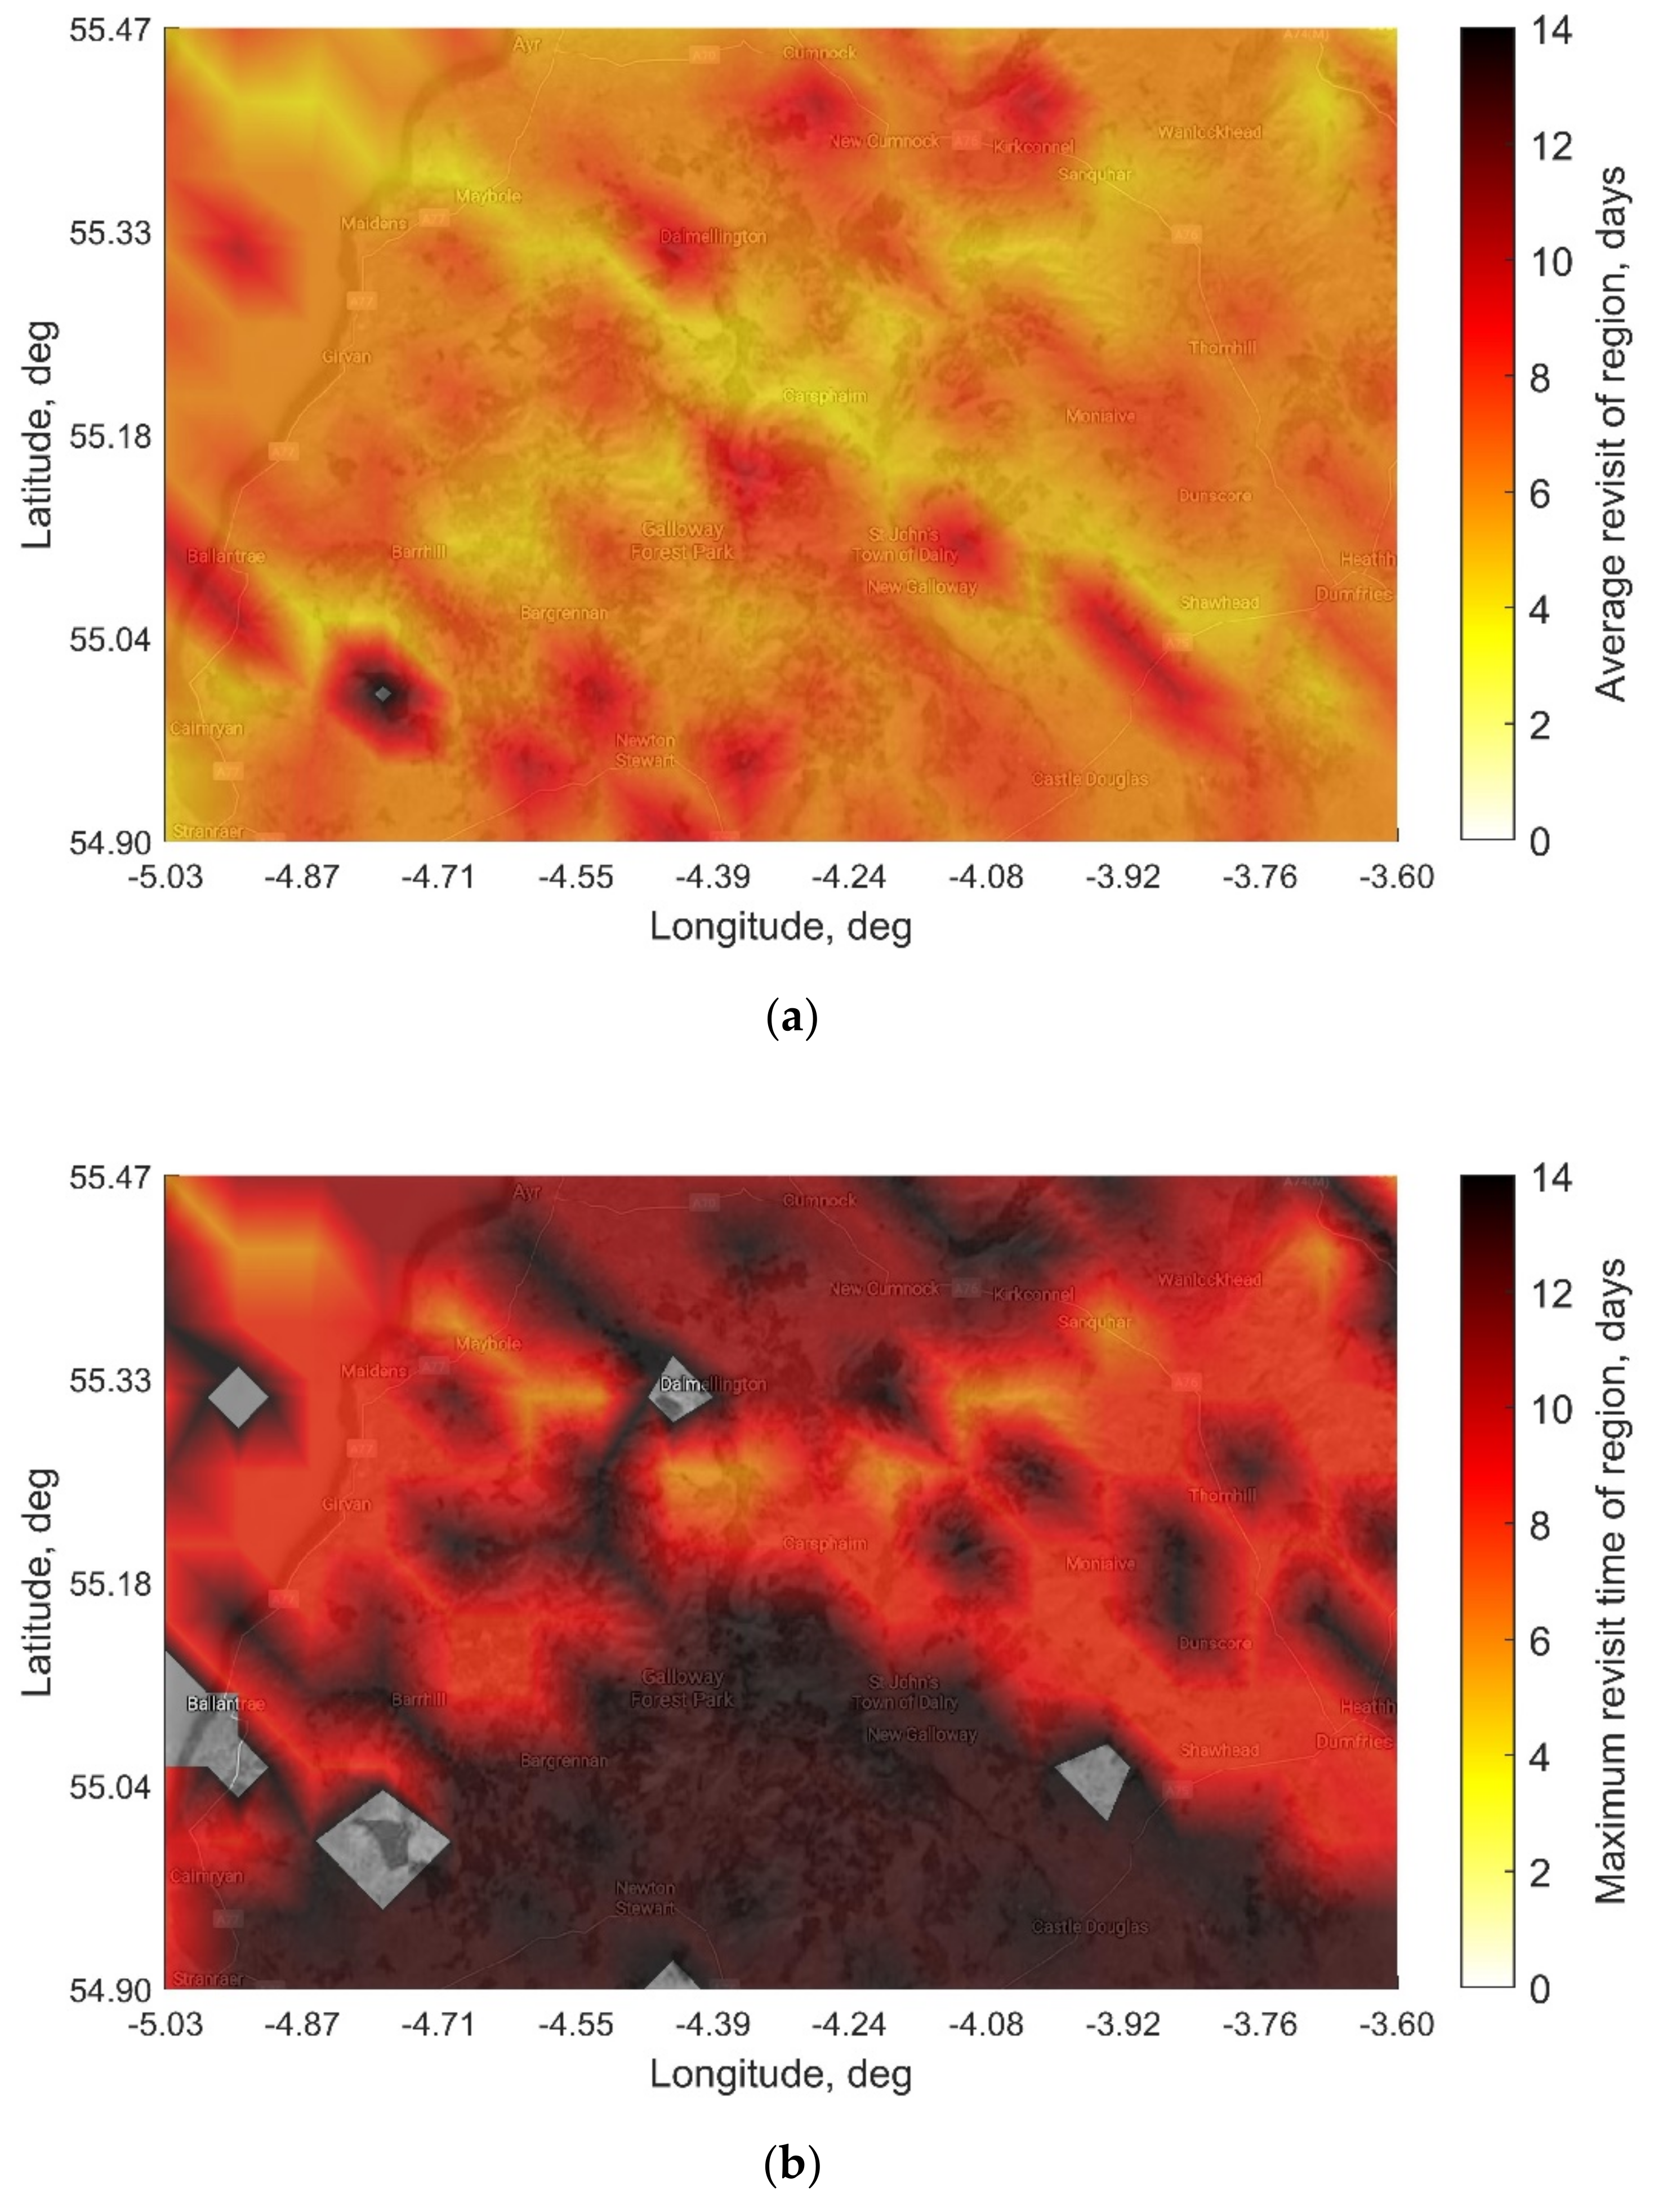
Figure 7. For each region selected, the average time between viewings (the average revisit time across all discrete points in the region) is less than seven days and each discrete point in the regions would be seen an average of 11–22 times, depending on latitude. 100% of the northern region, 99% of the eastern region, and 97% of the southern region are observed with a maximum revisit time of less than 14 days, though it should be noted that cloud cover and lighting conditions would mean that only a portion of the passes would be useable. There are a small number of points with maximum revisit times in excess of 14 days shown as grey regions in Figure 5, Figure 6 and Figure 7. These points of high maximum revisit are likely a result of inaccuracies in the calculation of the RGT orbit altitude and satellite distribution and could be addressed through precision orbit design. It should also be noted that maintaining the precise RGT orbit altitude and spacecraft distribution would necessitate active orbit maintenance using on-board propulsion.
Figure 5. Maps of the north region of interest as described in Table 6 and indicated on Figure 2. The maps are oriented with north to the top and cover an area of approximately 57 km (N-S) × 68 km (E-W). The colours overlaid on the maps indicate the (a) average and (b) maximum revisit times of each location in the region after 30 days. Coverage is calculated at approximately 5 km intervals and interpolated to provide the coverage estimates for the full region of interest (Map data: Google, TerraMetrics, www.google.com/maps [retrieved 16 March 2020]).
Remotesensing 12 04100 g005
Figure 6. Maps of the east region of interest as described in Table 6 and indicated on Figure 2. The maps are oriented with north to the top and cover an area of approximately 65 km (N-S) × 77 km (E-W). The colours overlaid on the maps indicate the (a) average and (b) maximum revisit times of each location in the region after 30 days. Coverage is calculated at approximately 5 km intervals and interpolated to provide the coverage estimates for the full region of interest. (Map data: Google, TerraMetrics, www.google.com/maps [retrieved 16 March 2020]).
Remotesensing 12 04100 g006
Figure 7. Maps of the south region of interest as described in Table 6 and indicated on Figure 2. The maps are oriented with north to the top and cover an area of approximately 63 km (N-S) × 90 km (E-W). The colours overlaid on the maps indicate the (a) average and (b) maximum revisit times of each location in the region after 30 days. Coverage is calculated at approximately 5 km intervals and interpolated to provide the coverage estimates for the full region of interest. (Map data: Google, TerraMetrics, www.google.com/maps [retrieved 16 March 2020]).
Remotesensing 12 04100 g007

5. Discussion

From an examination of appropriate currently operational multi-spectral imaging spacecraft, it is clear that the ideal requirements of the archaeological community, illustrated here with a case study of Scotland, would be challenging to meet using existing systems. What is readily available as a by-product of existing acquisitions may not be suitable, and even with expensive bespoke tasking there is no guarantee of acquiring the data required. Although the global revisit time of many of these systems appears sufficient (1–4 days), this only expresses the ability to view all areas of the globe, and does not correspond to the ability to image all areas. Tasking patterns, slewing and imaging constraints mean that the useable imagery available of any area is collected at a much lower frequency than might be expected. For archaeological applications, the useable imagery collected is even lower because commercial imperatives mean that a high proportion of historical imagery is centred on urban areas. Considering eleven satellite systems (as described in Table 1) only eight appropriate archive images were identified of a 150 km2 region of archaeological interest in Scotland over a six-month period during the summers of 2016 and 2018. This highlights the significant compromises inherent in archaeological applications of commercial satellite systems for site detection and monitoring, and the potential benefits of a bespoke system. When a constellation of 12 spacecraft were tasked with imaging this region in July 2020, 150 images were collected, though due to cloud cover only 17% of these images (a total of 26) were usable. This underlines the requirement for a system tasked consistently to improve the chances of securing the necessary imagery for archaeological observations. It also highlights the major impact of cloud cover, which is not further considered here, but is clearly a significant consideration in sensor choice and an imperative to developing uses of radar systems, for example. It is of note that the method of coverage analysis and orbit design presented in this paper is independent of sensor type, and the swath widths for very-high-resolution synthetic aperture radar (SAR) spacecraft are similar to those of the multi-spectral optical systems presented. For example, the recently launched ICEYE constellation can collect SAR imagery at <1 m GSD with a corresponding swath of 5 km [42] and Capella SAR offers <1 m GSD with a swath of approximately 10 km [43]. The spacecraft in both constellations have a mass of approximately 100 kg each, similar to the optical systems considered here. As such, a spaceborne SAR system designed to meet the outlined requirements would likely have similar parameters to the presented optical constellation. TerraSAR-X [44] and COSMO-SkyMed [45] are larger spacecraft, but both offer similar <1 m GSD SAR data and have been successfully used in archaeological prospection and cultural heritage monitoring, confirming the viability of this approach [7,45].
In designing a bespoke satellite for archaeology in Scotland, an inclined 60 deg orbit offers an increased revisit rate over a more common sun-synchronous orbit. The main drawback to this orbit is that even though there is a higher revisit rate, there may be issues with coverage due to the chance of passing over during eclipse, when an optical payload is ineffective. Using a 60 deg inclined orbit, it is estimated that full coverage of Scotland every two weeks could be achieved using eight spacecraft in repeating ground-track orbits, positioned to avoid any overlap in coverage. Such a system is estimated to provide an average revisit time across Scotland of 3–7 days, depending on the latitude. In the simulations performed, 97% of the areas of interest have a maximum revisit time of less than 14 days and it is expected that this could be extended to the full region with more precise orbit modelling.
The ground tracks of the satellite constellation would pass over various land masses across the globe. This presents a collaboration opportunity where research, development and costs could be shared with other countries in exchange for access to the system. The orbit characteristics recommended are designed to cover Scotland but could be adapted for better coverage across various countries. Land masses at a similar latitude to Scotland (56°) could be subject to a comparable coverage pattern and rate of revisit (Figure 8), provided that the satellites are capable of handling larger quantities of data. For example, Lithuania is at the same latitude as Glasgow (55°), allowing for similar results without changes to the existing orbit path. Due to the circular orbit selected, areas in the southern hemisphere of approximately −56° latitude (Figure 8) are subject to a similar coverage pattern and rate of revisit. However, this area is almost exclusively ocean. The use of an elliptical orbit could allow for longer dwell times in the northern hemisphere, reducing this impact, though this would require significant fuel for orbit maintenance.
Figure 8. Robinson projection map of the world with lines of ±56° latitude indicated. Regions of the Earth close to these latitudes would experience coverage similar to Scotland from the proposed satellite constellation.
Remotesensing 12 04100 g008

6. Conclusions and Future Perspectives

This paper has presented an analysis of the requirements for a satellite system for archaeology based on a specification drawn up from ideal requirements in a Scottish context. The analysis highlights the extent to which existing satellite data, even against the recent proliferation of suitable systems, is not as readily available as might be expected. Thus, while tasking existing systems shows promise, a bespoke system should offer increased performance. The ‘satellite for archaeology’ simulation analysis presented here should contribute to assessment of the suitability of applications of satellite remote sensing for archaeology, drawing out the nature and reasons for the compromises that are routinely made in fundamental areas of source data collection. This study illustrates the extent to which archaeologists are most often ‘passive’ receivers of source data collected according to imperatives set by others. While this will remain largely inevitable, aspects of the analysis should be useful in promoting heritage concerns and specifications in future satellite system designs, and, at the very least, promoting a better understanding of the systems that produce their data amongst users of satellite derived data.
High-level design for a bespoke satellite for archaeology system suggests that eight 100 kg spacecraft at approximately 581 km altitude could meet the defined needs. While the bespoke nature of traditional space missions makes cost estimates challenging, based on the cost of the similar sized Carbonite-2 spacecraft, each spacecraft could be expected to cost in the region of $6.3 million USD [46]. Rocket Lab USA provide dedicated launches for up to 150 kg to low-Earth orbit for an indicative cost of $4.5 million USD [47]. Assuming one launch per spacecraft, this would give an estimated build and launch cost in the region of c. $80–90 million USD. By heritage standards, this is a lot of money, but could be off-set by cost-sharing amongst countries at similar latitudes, with commercial tasking to subsidise costs and other social ventures offering further potential funding. Very-high-resolution multi-spectral satellite imagery with frequent revisit across Europe is expected to be valuable for many applications beyond cultural heritage. As such, a collaborative mission addressing a variety of compatible user needs could be envisioned, while additional imagery collection beyond the primary mission schedule could allow for repurposing and use by wider communities for many years into the future. It is beyond the scope of this paper to further explore these considerations, but they are raised here because of the potential they offer for archaeological considerations to be more directly taken account of in the design of future systems. This is especially pertinent as the trajectory of satellite development will continue to offer improved spatial resolution imagery from smaller spacecraft and reduced launch costs, allowing similar performance to be achieved at a lower cost. Furthermore, development of satellite relay systems [48,49], inter-satellite links [48,50], responsively manoeuvrable spacecraft [51,52] and federated satellite systems [53] may allow for new methods of operation that could be suitable for archaeological applications, in particular due to the seasonal restrictions on observations. For example, the challenge of high cloud cover could, in future, be addressed through on-board autonomous agility. Forward-facing cloud-detection cameras for spacecraft are currently being developed, which would enable spacecraft to autonomously slew and plan data collection to mitigate the effects of cloud cover [54].
The focus of this study is explicitly on mission architecture, recognising that there are many other factors that require consideration, not least of which are sensor design (e.g., to deal with cloud cover issues), which would further influence system specifications, and processing and analysis workflows. Nevertheless, even with this focus, many attributes of satellite mission planning that are directly relevant to end users of derived data have been highlighted. These should promote the more informed use of that data, through a better understanding of the attributes and characteristics of source data. Published works promoting the application of satellite data for archaeology (e.g., [1,2,3,4,5,6,7,8,9,10,55]) focus extensively on the characteristics of data and imagery, but this paper represents, to the best of our knowledge, the first instance of a discussion of the influence on archaeological applications of mission architecture as a fundamental aspect of satellite system design with profound down-the-line implications. In the future development of reliable and systematic data sources to inform archaeological enquiry, we hope it will not be the last.

Author Contributions

Conceptualisation, C.N.M. and D.C.; methodology, C.N.M. and C.S.; software, C.N.M.; validation, C.N.M.; formal analysis, C.N.M. and C.S.; investigation, C.N.M. and C.S.; resources, M.M.; data curation, C.S.; writing—original draft preparation, C.S., C.N.M., and D.C.; writing—review and editing, C.N.M. and D.C.; visualisation, C.N.M. and C.S.; supervision, M.M.; project administration, D.C.; funding acquisition, M.M. All authors have read and agreed to the published version of the manuscript.

Funding

This research received no external funding.

Acknowledgments

This paper is based in large part on a thesis submitted in partial fulfilment of the requirements of 4th year BEng (Hons) Aero-Mechanical Engineering, University of Strathclyde, 2020 [56]. The authors would like to thank Athos Agapiou, Rog Palmer, Chris Sevara, Žiga Kokalj and Geert Verhoeven for comments on various iterations of this paper, and the anonymous reviewers who provided valuable input. SkySat data provided by the European Space Agency.

Conflicts of Interest

The authors declare no conflict of interest.

References

  1. Lasaponara, R.; Masini, N. Satellite Remote Sensing. A New Tool for Archaeology; Springer: New York, NY, USA, 2012. [Google Scholar]
  2. Comer, D.; Harrower, M. Mapping Archaeological Landscapes from Space; Springer: New York, NY, USA, 2013. [Google Scholar]
  3. Fowler, M.J. Satellite imagery and archaeology. In Landscapes through the Lens. Aerial Photographs and Historic Environment, 1st ed.; Cowley, D., Standring, A., Abicht, M., Eds.; Oxbow: Oxford, UK, 2010; pp. 99–110. [Google Scholar]
  4. Hammer, E.; Ur, J. Near eastern landscapes and declassified U2 aerial imagery. Adv. Archaeol. Pract. 2019, 7, 107–126. [Google Scholar] [CrossRef] [Green Version]
  5. Lasaponara, R.; Masini, N. Detection of archaeological crop marks by using satellite QuickBird multispectral imagery. J. Archaeol. Sci. 2007, 34, 214–221. [Google Scholar] [CrossRef]
  6. Lasaponara, R.; Masini, N. Satellite remote sensing in archaeology: Past, present and future perspectives. J. Archaeol. Sci. 2011, 38, 1995–2002. [Google Scholar] [CrossRef]
  7. Luo, L.; Wang, X.; Guo, H.; Lasaponara, R.; Xin, Z.; Masini, N.; Wang, G.; Shi, P.; Khatteli, H.; Chen, F.; et al. Airborne and spaceborne remote sensing for archaeological and cultural heritage applications: A review of the century (1907–2017). Remote Sens. Environ. 2019, 232. [Google Scholar] [CrossRef]
  8. Philip, G.; Donoghue, D.; Beck, A.; Galiatsatos, N. CORONA satellite photography: An archaeological application from the Middle East. Antiquity 2002, 76, 109–118. [Google Scholar] [CrossRef] [Green Version]
  9. Scardozzi, G. An introduction to satellite remote sensing in archaeology: State of the art, methods, and applications. In Looking to the Future, Caring for the Past: Preventive Archaeology in Theory and Practice, 1st ed.; Boschi, F., Ed.; Bologna University: Bologna, Italy, 2016; pp. 217–239. [Google Scholar]
  10. Verhoeven, G.J.J. Satellite hyperspectral and multispectral imaging. In The Encyclopedia of Archaeological Sciences, 1st ed.; López Varela, S.L., Ed.; John Wiley & Sons: Hoboken, NJ, USA, 2018. [Google Scholar] [CrossRef]
  11. Agapiou, A.; Alexakis, D.D.; Hadjimitsis, D.G. Potential of virtual earth observation constellations in archaeological research. Sensors 2019, 19, 4066. [Google Scholar] [CrossRef] [Green Version]
  12. Verhoeven, G.J. Are we there yet? A review and assessment of archaeological passive airborne optical imaging approaches in the light of landscape archaeology. Geosciences 2017, 7, 86. [Google Scholar] [CrossRef] [Green Version]
  13. Banaszek, Ł.; Cowley, D.; Middleton, M. Towards national archaeological mapping. Assessing source data and methodology—A case study from Scotland. Geosciences 2018, 8, 272. [Google Scholar] [CrossRef] [Green Version]
  14. Cowley, D.; Banaszek, Ł.; Geddes, G.; Gannon, A.; Middleton, M.; Millican, K. Making LiGHT work of large area survey? Developing approaches to rapid archaeological mapping and the creation of systematic national-scaled heritage data. J. Comput. Appl. Archaeol. 2020, 3, 109–121. [Google Scholar] [CrossRef] [Green Version]
  15. Evans, R.; Jones, R.J.A. Crop marks and soils at two archaeological sites in Britain. J. Archaeol. Sci. 1977, 4, 63–76. [Google Scholar] [CrossRef]
  16. Cowley, D. A case study in the analysis of patterns of aerial reconnaissance in a lowland area of southwest Scotland. Archaeol. Prospect. 2003, 9, 255–265. [Google Scholar] [CrossRef]
  17. Brophy, K.; Cowley, D. (Eds.) From the Air: Understanding Aerial Archaeology; Tempus: Stroud, UK, 2005. [Google Scholar]
  18. Verhoeven, G.J.; Sevara, C. Trying to break new ground in aerial archaeology. Remote Sens. 2016, 8, 918. [Google Scholar] [CrossRef] [Green Version]
  19. Cowley, D. Aerial photography and reconnaissance for archaeology in the 21st century: Achievements and challenges. Archeol. Aerea 2017, XI, 9–15. [Google Scholar]
  20. Met Office, Department for Business, Energy and Industrial Strategy. Access to UK Climate Datasets. Available online: https://www.metoffice.gov.uk/research/climate/maps-and-data/data/index (accessed on 21 December 2019).
  21. Satellite Imaging Corporation. Satellite Sensors. Available online: https://www.satimagingcorp.com/satellite-sensors/ (accessed on 30 June 2020).
  22. European Space Agency. EO-CAT Web Client. Available online: https://eocat.esa.int/ (accessed on 30 June 2020).
  23. Earth Observing System. KOMPSAT 3/3A. Available online: https://eos.com/kompsat-3-3a/ (accessed on 30 June 2020).
  24. Deimos Imaging. Our Virtual Constellation Satellites. Available online: https://www.deimos-imaging.com/our-satellites (accessed on 30 June 2020).
  25. European Space Agency. Newcomers Earth Observation Guide. Available online: https://business.esa.int/newcomers-earth-observation-guide (accessed on 30 June 2020).
  26. Planet Team. Planet Application Program Interface: In Space for Life on Earth. Available online: https://api.planet.com (accessed on 30 June 2020).
  27. Planet Labs Inc. Planet Imagery Product Specifications; Planet Labs Inc.: San Francisco, CA, USA, 2020. [Google Scholar]
  28. European Space Agency. Earth Online—Third Party Missions: SkySat. Available online: https://earth.esa.int/web/guest/missions/3rd-party-missions/current-missions/skysat (accessed on 30 June 2020).
  29. European Space Agency. EO Portal Directory: Satellite Missions Database. Available online: https://directory.eoportal.org/web/eoportal/satellite-missions (accessed on 28 July 2020).
  30. Osborne, P. The Mercator Projections; Zenodo: Edinburgh, UK, 2013; pp. 88–90. [Google Scholar] [CrossRef]
  31. Vallado, D.A.; McClain, W.D. Coordinate and time systems. In Fundamentals of Astrodynamics and Applications, 3rd ed.; Microcosm Press: Hawthorn, CA, USA; Springer: New York, NY, USA, 2007; pp. 142–149. ISBN 978-0-387-71831-6. [Google Scholar]
  32. Decker, B.L. World Geodetic System 1984; Technical Report; Defense Mapping Agency Aerospace Center: St Louis, MO, USA, 1986. [Google Scholar]
  33. Washburn, A.R. Earth Coverage by Satellites in Circular Orbit; Technical Report; Department of Operations Research Naval Postgraduate School: Monterey, CA, USA, 2004. [Google Scholar]
  34. Verhoeven, G. Resolving some spatial resolution issues: Part 1: Between line pairs and sampling distance. AARGNEWS 2018, 57, 25–34. [Google Scholar] [CrossRef]
  35. United Nations. Space Debris Mitigation Guidelines of the Committee on the Peaceful Uses of Outer Space; United Nations Office for Outer Space Affairs, United Nations: Vienna, Austria, 2010. [Google Scholar]
  36. NASA. U.S. Standard Atmosphere; Technical Report No. NASA-TM-X-74335 [NOAA-ST 76-1562]; National Aeronautics and Space Administration (NASA): Washington, DC, USA, 1976.
  37. Macdonald, M.; McInnes, C.; Lücking, C.; Visagie, L.; Lappas, V.J.; Erb, S. Needs assessment of gossamer structures in communications platform end-of-life disposal. In Proceedings of the AIAA Guidance, Navigation, and Control (GNC) Conference, Boston, MA, USA, 19–22 August 2013. [Google Scholar] [CrossRef] [Green Version]
  38. Fu, X.; Wu, M.; Tang, Y. Design and maintenance of low-earth repeat-ground-track successive-coverage orbits. J. Guid. Control Dyn. 2012, 35, 686–691. [Google Scholar] [CrossRef]
  39. Lowe, C.; Macdonald, M.; Greenland, S.; McKee, D. ‘Charybdis’—The next generation in ocean colour and biogeochemical remote sensing. In Proceedings of the 26th Annual AIAA/USU Conference on Small Satellites, Logan, UT, USA, 13–16 August 2012. [Google Scholar]
  40. Vallado, D.A.; McClain, W.D. Initial orbit determination. In Fundamentals of Astrodynamics and Applications, 3rd ed.; Microcosm Press: Hawthorn, CA, USA; Springer: New York, NY, USA, 2007; pp. 615–633, 642–667. ISBN 978-0-387-71831-6. [Google Scholar]
  41. Mishne, D. Formation control of satellites subject to drag variations and J2 perturbations. J. Guid. Control Dyn. 2004, 27, 685–692. [Google Scholar] [CrossRef]
  42. ICEYE Data. Spotlight Imaging Mode. Available online: https://www.iceye.com/sar-data/spotlight (accessed on 2 October 2020).
  43. Stringham, C.; Farquharson, G.; Castelletti, D.; Quist, E.; Riggi, L.; Eddy, D.; Soenen, S. The Capella X-band SAR constellation for rapid imaging. In Proceedings of the IEEE International Geoscience and Remote Sensing Symposium, Yokohama, Japan, 28 July–2 August 2019; pp. 9248–9251. [Google Scholar] [CrossRef]
  44. Pitz, W.; Miller, D. The TerraSAR-X satellite. IEEE Trans. Geosci. Remote Sens. 2010, 48, 615–622. [Google Scholar] [CrossRef]
  45. Tapete, D.; Cigna, F. COSMO-SkyMed SAR for detection and monitoring of archaeological and cultural heritage sites. Remote Sens. 2019, 11, 1326. [Google Scholar] [CrossRef] [Green Version]
  46. Pultarova, T. UK military looking at smallsats to increase space resilience. Space News, 23 May 2018. Available online: https://spacenews.com/uk-military-looking-at-smallsats-to-increase-space-resilience/ (accessed on 2 October 2020).
  47. Wekerle, T.; Pessoa Filho, J.B.; Costa, L.E.V.L.D.; Trabasso, L.G. Status and trends of smallsats and their launch vehicles—An Up-to-date Review. J. Aerosp. Technol. Manag. 2017, 9, 269–286. [Google Scholar] [CrossRef]
  48. Lowe, C.J.; Macdonald, M. Resource-considerate Data Routing through Satellite Networks. J. Aerosp. Inf. Syst. 2017, 14, 472–482. [Google Scholar] [CrossRef] [Green Version]
  49. Troendle, D.C.; Rochow, C.; Martin Pimentel, P.; Heine, F.F.; Meyer, R.; Lutzer, M.; Benzi, E.; Sivac, P.; Krassenburg, M.; Shurmer, I. Optical LEO-GEO data relay: The in-orbit experience. In Proceedings of the AIAA SPACE 2015 Conference and Exposition, Pasadena, CA, USA, 31 August–2 September 2015. [Google Scholar] [CrossRef]
  50. Heine, F.; Kämpfner, H.; Czichy, R.; Meyer, R.; Lutzer, M.; Meyer, R. Laser communication applied for EDRS, the european data relay system. Ceas Space J. 2011, 2, 85–90. [Google Scholar] [CrossRef]
  51. McGrath, C.N.; Macdonald, M. General perturbation method for satellite constellation reconfiguration using low-thrust maneuvers. J. Guid. Control. Dyn. 2019, 42, 1676–1692. [Google Scholar] [CrossRef] [Green Version]
  52. Legge, R.S., Jr. Optimization and Valuation of Reconfigurable Satellite Constellations under Uncertainty. Ph.D. Thesis, Massachusetts Institute of Technology, Cambridge, MA, USA, 2014. [Google Scholar]
  53. Golkar, A.; i Cruz, I.L. The federated satellite systems paradigm: Concept and business case evaluation. Acta Astronaut. 2015, 111, 230–248. [Google Scholar] [CrossRef]
  54. Greenland, S.; Ireland, M.; Kobayashi, C.; Mendham, P.; Post, M.; White, D. Development of a minaturised forwards looking imager using deep learning for responsive operations. Presented at the 4S Symposium, Sorrento, Italy, 28 May–1 June 2018. [Google Scholar]
  55. Parcak, S. Satellite Remote Sensing for Archaeology; Routledge: London, UK; New York, NY, USA, 2009. [Google Scholar]
  56. Scott, C. Archaeology, but from Space! Ph.D. Thesis, Aero-Mechanical Engineering, University of Strathclyde, Glasgow, UK, 2020. [Google Scholar]
Figure 1. Many archaeological sites in Scotland, and indeed elsewhere in Europe, are composed of relatively small discrete features, as this example of an early medieval cemetery at Croftgowan in Highland illustrates. The discrete features that make up the site are characterised by ditches often <1 m across and small burial pits. The scale of expected features requires a GSD of <1 m to enable clear identification of archaeological features. Graphic: Geert Verhoeven; Source image DP281499 © Historic Environment Scotland.
Remotesensing 12 04100 g001
Figure 2. (A) The location of the study area in north-west Europe. (B) Map of Scotland, with yellow tone indicating the generalised extent of arable ground, which is a specific focus of interest for repeat imaging. The locations of Figures 3, 5, 6 and 7 are shown, referring to issues discussed below.
Remotesensing 12 04100 g002
Table 1. Selection of existing very-high-resolution multi-spectral satellite imaging systems [21,22,23,24].
SystemOperatorMulti-Spectral GSDPanchromatic GSDApproximate Revisit Time
Worldview-2MAXAR/DigitalGlobe1.84 m0.46 m1–4 days
Worldview-3MAXAR/DigitalGlobe1.24 m0.31 m1–4 days
GeoEye-1MAXAR/DigitalGlobe1.84 m0.46 m3 days
SkySatPlanet1 m0.5 m<1 day
Pleiades-1A + 1BAIRBUS Defence and Space2 m0.5 m1 day
DMC3-TripleSat-1DMCii3.2 m0.8 m1 day
DMC3-TripleSat-3DMCii3.2 m0.8 m1 day
SuperView-1Beijing Space View Technology2 m0.5 m2 days
KOMPSAT-3Korea Aerospace Research Institute2.2 m0.5 m1.4 days
Gaofen-2China National Space Administration3.2 m0.8 m5 days
Deimos-2Urthecast3 m0.75 m2 days
Table 2. Specifications for existing high-resolution satellite systems [21,27,28,29].
SpacecraftMulti-Spectral GSD, m Panchromatic GSD, mSwath Width, kmSpacecraft Mass, kgAltitude, km
Worldview-31.240.3113.12800617
SkySat 3-1310.726.6110500
Pleides 1A/1B20.5201015694
DubaiSat-24112300600
Spot 6/78230720694
Table 3. Estimated GSD, swath width, revisit times, and deorbit time as a function of altitude for a spacecraft baselined against the SkySat spacecraft.
Altitude, kmGSD, mSwath Width, kmWidth Covered at 54.63 deg Latitude, kmTime to Full Coverage for One s/c, daysNo. of s/c for 2-Week RevisitTime to Deorbit to 100 km, years
2000.292.65.2270.9200.003
3000.434.07.9184.8140.072
4000.585.310.5141.7110.762
5000.726.613.1115.994.748
6000.867.915.798.7721.18
7001.019.218.386.4774.97
8001.1510.621.077.26224.1
9001.3011.923.670.15588.8
10001.4413.226.264.451397.1
Table 4. Simulation constants.
ParameterValueUnit
Gravitational parameter 3.986 × 10 14 m3/s2
Mean Earth radius6371km
Coefficient of J2 for Earth0.0010827-
Angular velocity of Earth 7.29212 × 10 5 rad/s
Table 5. Orbital parameters.
ParameterValueUnit
Time and date at epoch00:00 1 June 2020-
Number of spacecraft8-
Mean orbit altitude581.077km
Orbit inclination60deg
Right ascension of the ascending node (RAAN)0deg
True anomaly of lead spacecraft0deg
True anomaly spacing between spacecraft3.556deg
Table 6. Selected regions for coverage simulation.
RegionMaximum Latitude, degMinimum Latitude, degMaximum Longitude, degMinimum Longitude, degArea, km2
North58.6458.13−3.06−4.233832
East57.1556.56−2.10−3.375025
South55.4754.90−3.60−5.035675
Table 7. Maximum and average coverage of selected regions of Scotland for a constellation of eight spacecraft in a 60 deg inclined RGT orbit.
RegionNo. of S/CAverage Revisit, DaysMaximum Revisit, DaysAverage Number of Passes% Area with <14 Day Revisit
North83.513.022100%
East84.215.01899%
South86.327.11197%
Publisher’s Note: MDPI stays neutral with regard to jurisdictional claims in published maps and institutional affiliations.

