Integration of Crowdsourced Images, USGS Networks, Remote Sensing, and a Model to Assess Flood Depth during Hurricane Florence


Geoinformatics and Earth Observation Laboratory, Earth and Environmental Systems Institute (EESI), and the Institute for Computational and Data Sciences, Department of Geography, The Pennsylvania State University, University Park, PA 16802, USA
*
Author to whom correspondence should be addressed.
Remote Sens. 2020, 12(5), 834; https://doi.org/10.3390/rs12050834
Submission received: 12 January 2020
/
Revised: 25 February 2020
/
Accepted: 3 March 2020
/
Published: 5 March 2020
(This article belongs to the Special Issue Integrating Remote Sensing and Social Sensing)
Abstract
:Crowdsourced environmental data have the potential to augment traditional data sources during disasters. Traditional sensor networks, satellite remote sensing imagery, and models are all faced with limitations in observational inputs, forecasts, and resolution. This study integrates flood depth derived from crowdsourced images with U.S. Geological Survey (USGS) ground-based observation networks, a remote sensing product, and a model during Hurricane Florence. The data sources are compared using cross-sections to assess flood depth in areas impacted by Hurricane Florence. Automated methods can be used for each source to classify flooded regions and fuse the dataset over common grids to identify areas of flooding. Crowdsourced data can play a major role when there are overlaps of sources that can be used for validation as well providing improved coverage and resolution.
1. Introduction
Hurricanes can leave behind a devastating wake of destruction with heavy precipitation and flooding. Extreme flooding events are expected to become more frequent and severe so there is a greater need for decision-makers to be able to closely monitor conditions. The scientific community deals with observational limitations to adequately predict, observe, and produce useful flood reports during hurricanes. Significant gaps in spatial and temporal information can occur during disasters [1]. Traditional sensor networks may be offline or provide data at an insufficient spatio-temporal resolution. Satellite remote sensing imagery of the Earth’s surface is limited by revisit time and cloud cover that is typically present when hurricanes make landfall. Models require observational inputs at a high enough resolution to make forecasts. The chance of having data when and where it is needed to provide a flood maps is a product of how the data are produced. However, the collection of social data is characterized by different conditions, so crowdsourcing may be used to augment traditional sources.
Crowdsourcing is a convenient method to conduct environmental monitoring as a single researcher cannot collect the quantities or types of data that can be rapidly obtained by utilizing the crowd [2]. The use of crowdsourced data for large-scale tasks fits the open-source community conceptualization of outsourcing a job to the crowd [3]. Institutions can crowdsource data during environmental hazards, and many government agencies are interested in how they can direct the collection of data [4,5]. The allure of crowdsourcing is well stated by the idea that there is a “potential of up to six billion persons to monitor the state of the environment, validate global models with local knowledge, contribute to crisis situations awareness, and provide information that only humans can capture is vast and has yet to be fully exploited” [6].
Institutions can set up technological interfaces to crowdsource data through users’ devices and application platforms. Common hazard-related crowdsourcing projects collect data on impacts from environmental issues such as air quality [2,7] and water quality [8,9]. Some projects are specifically built for crisis events such as Did You Feel It? (DYFI) by the U.S. Geological Survey (USGS), which is used to report the intensity of shaking from earthquakes [10]. With the contribution of 150,000 individuals, DYFI played an important role immediately after the August 2011 earthquake in evaluating how much of the Washington D.C. area—a region with a limited distribution of seismic sensors—was impacted [4].
Crowdsourcing, described as a minimal level of participant involvement in a project, often involves participant collection of data through a sensor or technological input [11,12]. There are many institution-led projects that are not specified as crisis-related, but can sometimes provide data in a crisis context. For example, the U.S. National Oceanic and Atmospheric Administration (NOAA) established a project called meteorological Phenomena Identification Near the Ground (mPING) which records meteorological observations and allows users to view observations. NOAA uses data from mPING to augment their dual-polarization radar and refine models for winter weather as ground-based meteorological observations are needed to ensure that the radar accurately determined the type of precipitation [13]. eBird provides guides on collecting data for different types of crisis events, and event data have demonstrated the impact on bird species from events such as hurricanes [14] and oil spills [15]. These specific interest datasets could be used to complement primary sources.
The value of comparing multiple sources is recognized by organizations that work in environmental monitoring with partnerships to share data. The Houston/Galveston Citizen Air Monitoring Project (HGCAMP) is a collaborative project between the U.S. Environmental Protection Agency (EPA), the Texas Commission on Environmental Quality, local governments, and citizens [7]. Another collaboration is a community and government project to monitor the impact of Marcellus Shale drilling [16]. Ushahidi joined up to create an Oil Spill Crisis Response Map for the 2010 Deepwater Horizon spill that displayed both crowdsourced and government data [17]. When coordinated for use, crowdsourced data can even provide timelier observations than traditional sensor networks [18].
Crowdsourced and traditional observations can be merged and compared in order to assess the quality of relevant information at spatio-temporal intersects of datasets [19,20]. Comparison with government data has shown that data from the crowd can complement traditional monitoring [18,21,22,23,24]. Automated methods can be developed to extract content from each source, such as remote sensing imagery, text, and images being classified to identify flooded regions [25,26,27]. Research on social media can pinpoint areas of interest through keywords and the use of logistic classifiers that group social media into areas of the emergency management continuum as well as specific topic categories related to a hurricane [28]. However, this textual data in social media rarely provides measurements that could be used to quantitatively compare different physical phenomena, although descriptions of impacts could sometimes be used as a proxy. Images, on the other hand, can be used to derive flood information [29,30,31]. The appropriate use of information from social sources requires context [32] and intentional crowdsourcing provides a directed approach in contrast to broad data mining.
The goal of this article is to compare and integrate four data sources to provide an assessment of flood depth. The primary source under evaluation is crowdsourced data on flood depth that was derived from images contributed by individuals. This research builds on previous flood analysis studies using crowdsourced data [33,34,35]. The crowdsourced data is compared to ground-based government observations, a hydrodynamic model, and a radar remote sensing product which will be further introduced in the following section. A methodology is developed to compare the sources in areas of overlapping dimensions that show impacted areas. Each source has its own spatio-temporal limitations. Given the temporal limitations of the other sources, crowdsourced data have the potential to fill information gaps in real-time. Crowdsourced data provided unforeseen benefits and timely information on flooding, particularly in areas of dense human activity.
2. Data
This section provides a background on the data used in this case study of Hurricane Florence. Hurricane Florence made landfall in the Carolinas on 14 September 2018 and caused severe flooding over the subsequent days. Numerous flood-related datasets and products were produced in light of the magnitude and impact of the event. However, for this study, it was necessary to select a single source of data to represent each category: crowdsourced, sensor network, remote sensing, and model.
The initial data evaluated for use in this article were downloaded through web-based servers and platforms. The data were then converted from file formats such as shapefile, geodatabase, CSV, and GeoTIFF. The datasets used various spatial coordinates systems, timestamp formats, and had erroneous entries unique to each collection.
The selection of which sources to use was made based on the data or product having geographical coverage of the Carolinas, being related to flood depth, and the public availability of the raw data. All of the raw data used in this academic research study were harnessed from publicly available sources that are either always open or were made available for humanitarian efforts. The authors did not make any data-sharing agreements or have a special circumstance to have access to the data. In this section, each dataset is described in relation to its original collection then in light of steps made in processing to prepare the data for standardized comparison.
2.1. Crowdsourced Environmental Monitoring
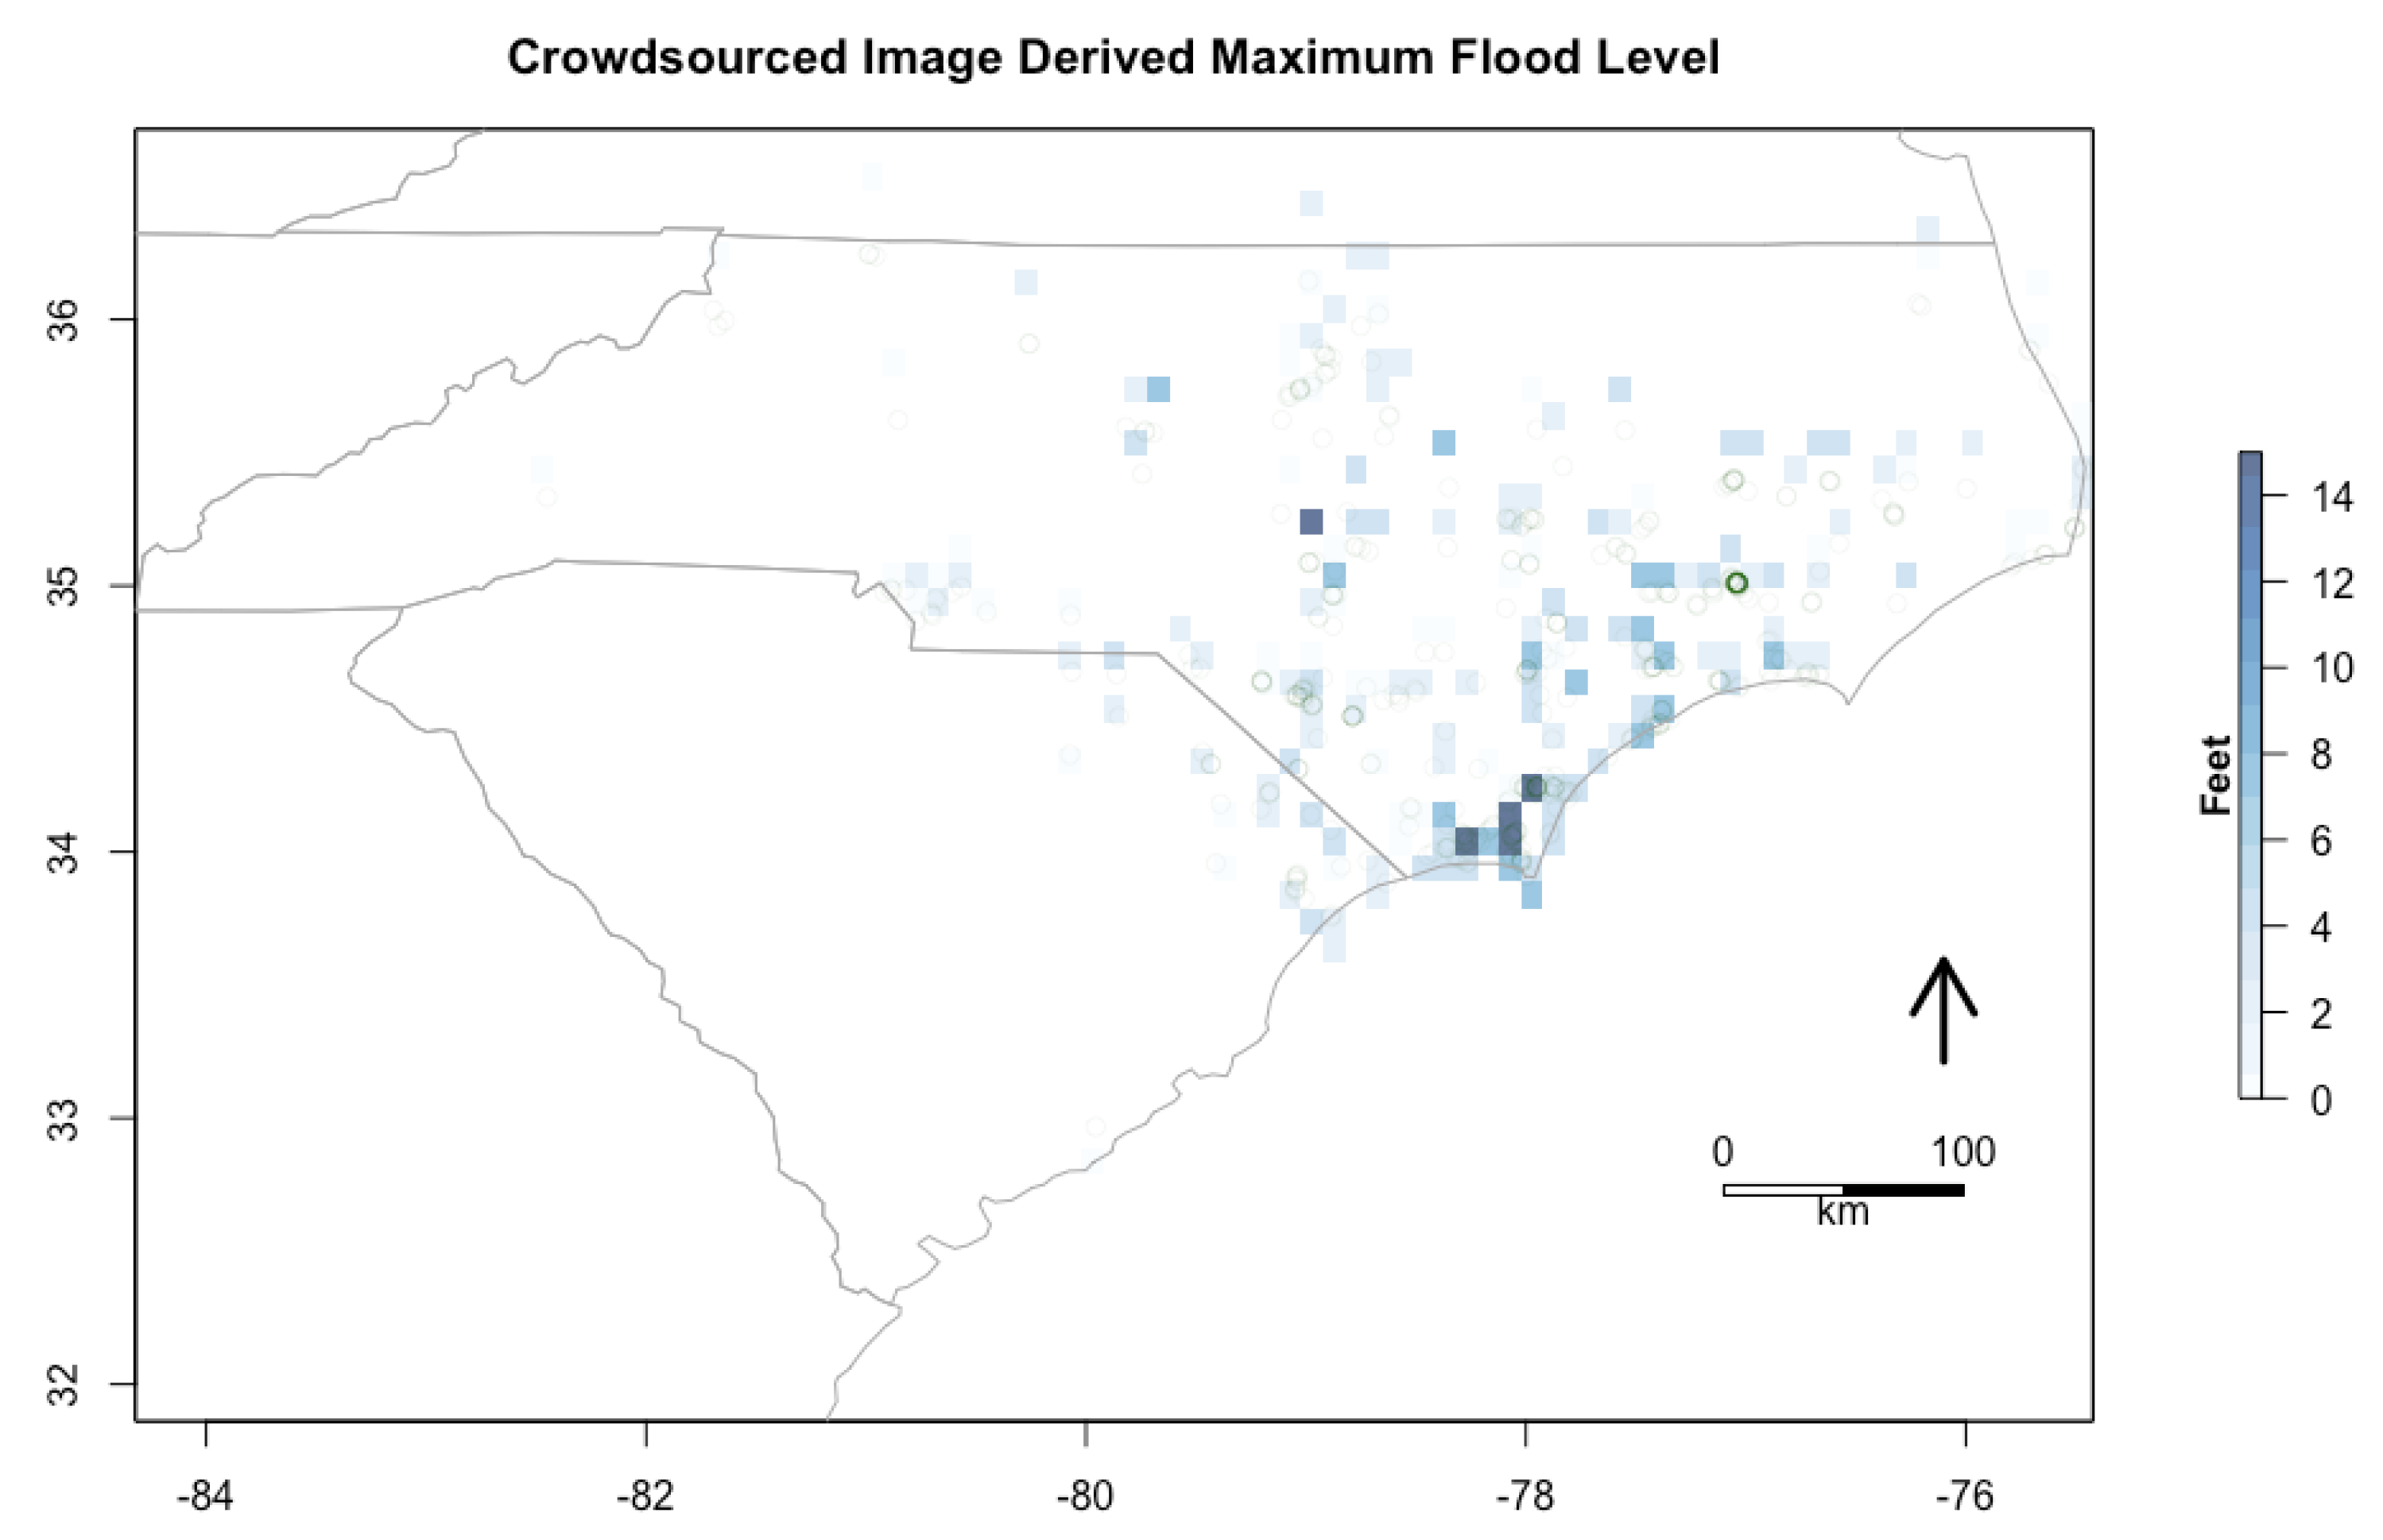
The GISCorps and National Alliance for Public Safety GIS (NAPSG) Foundation derived flood depth from crowdsourced images [36,37]. This product demonstrates the capability of volunteers to use contributed social data content to produce environmental data that is relevant to information needs. The data product is point-based geolocated measurements of flood depth. Figure 1 shows the flood depth derived from crowdsourced images in a standard spatial grid using the maximum flood level. This representation shows that the data, as expected from social sources, is not spatially sampled across the study area. The data are mostly collected in populated areas.
2.2. Traditional Environmental Monitoring
Government outputs generally report on broad environmental phenomena in consistent spatial and temporal patterns unless there are sensor outages or interference in coverage that leads to gaps. Information related to human impacts or activities may not be particularly evident from these environmental data sources.
2.2.1. USGS Streamgages
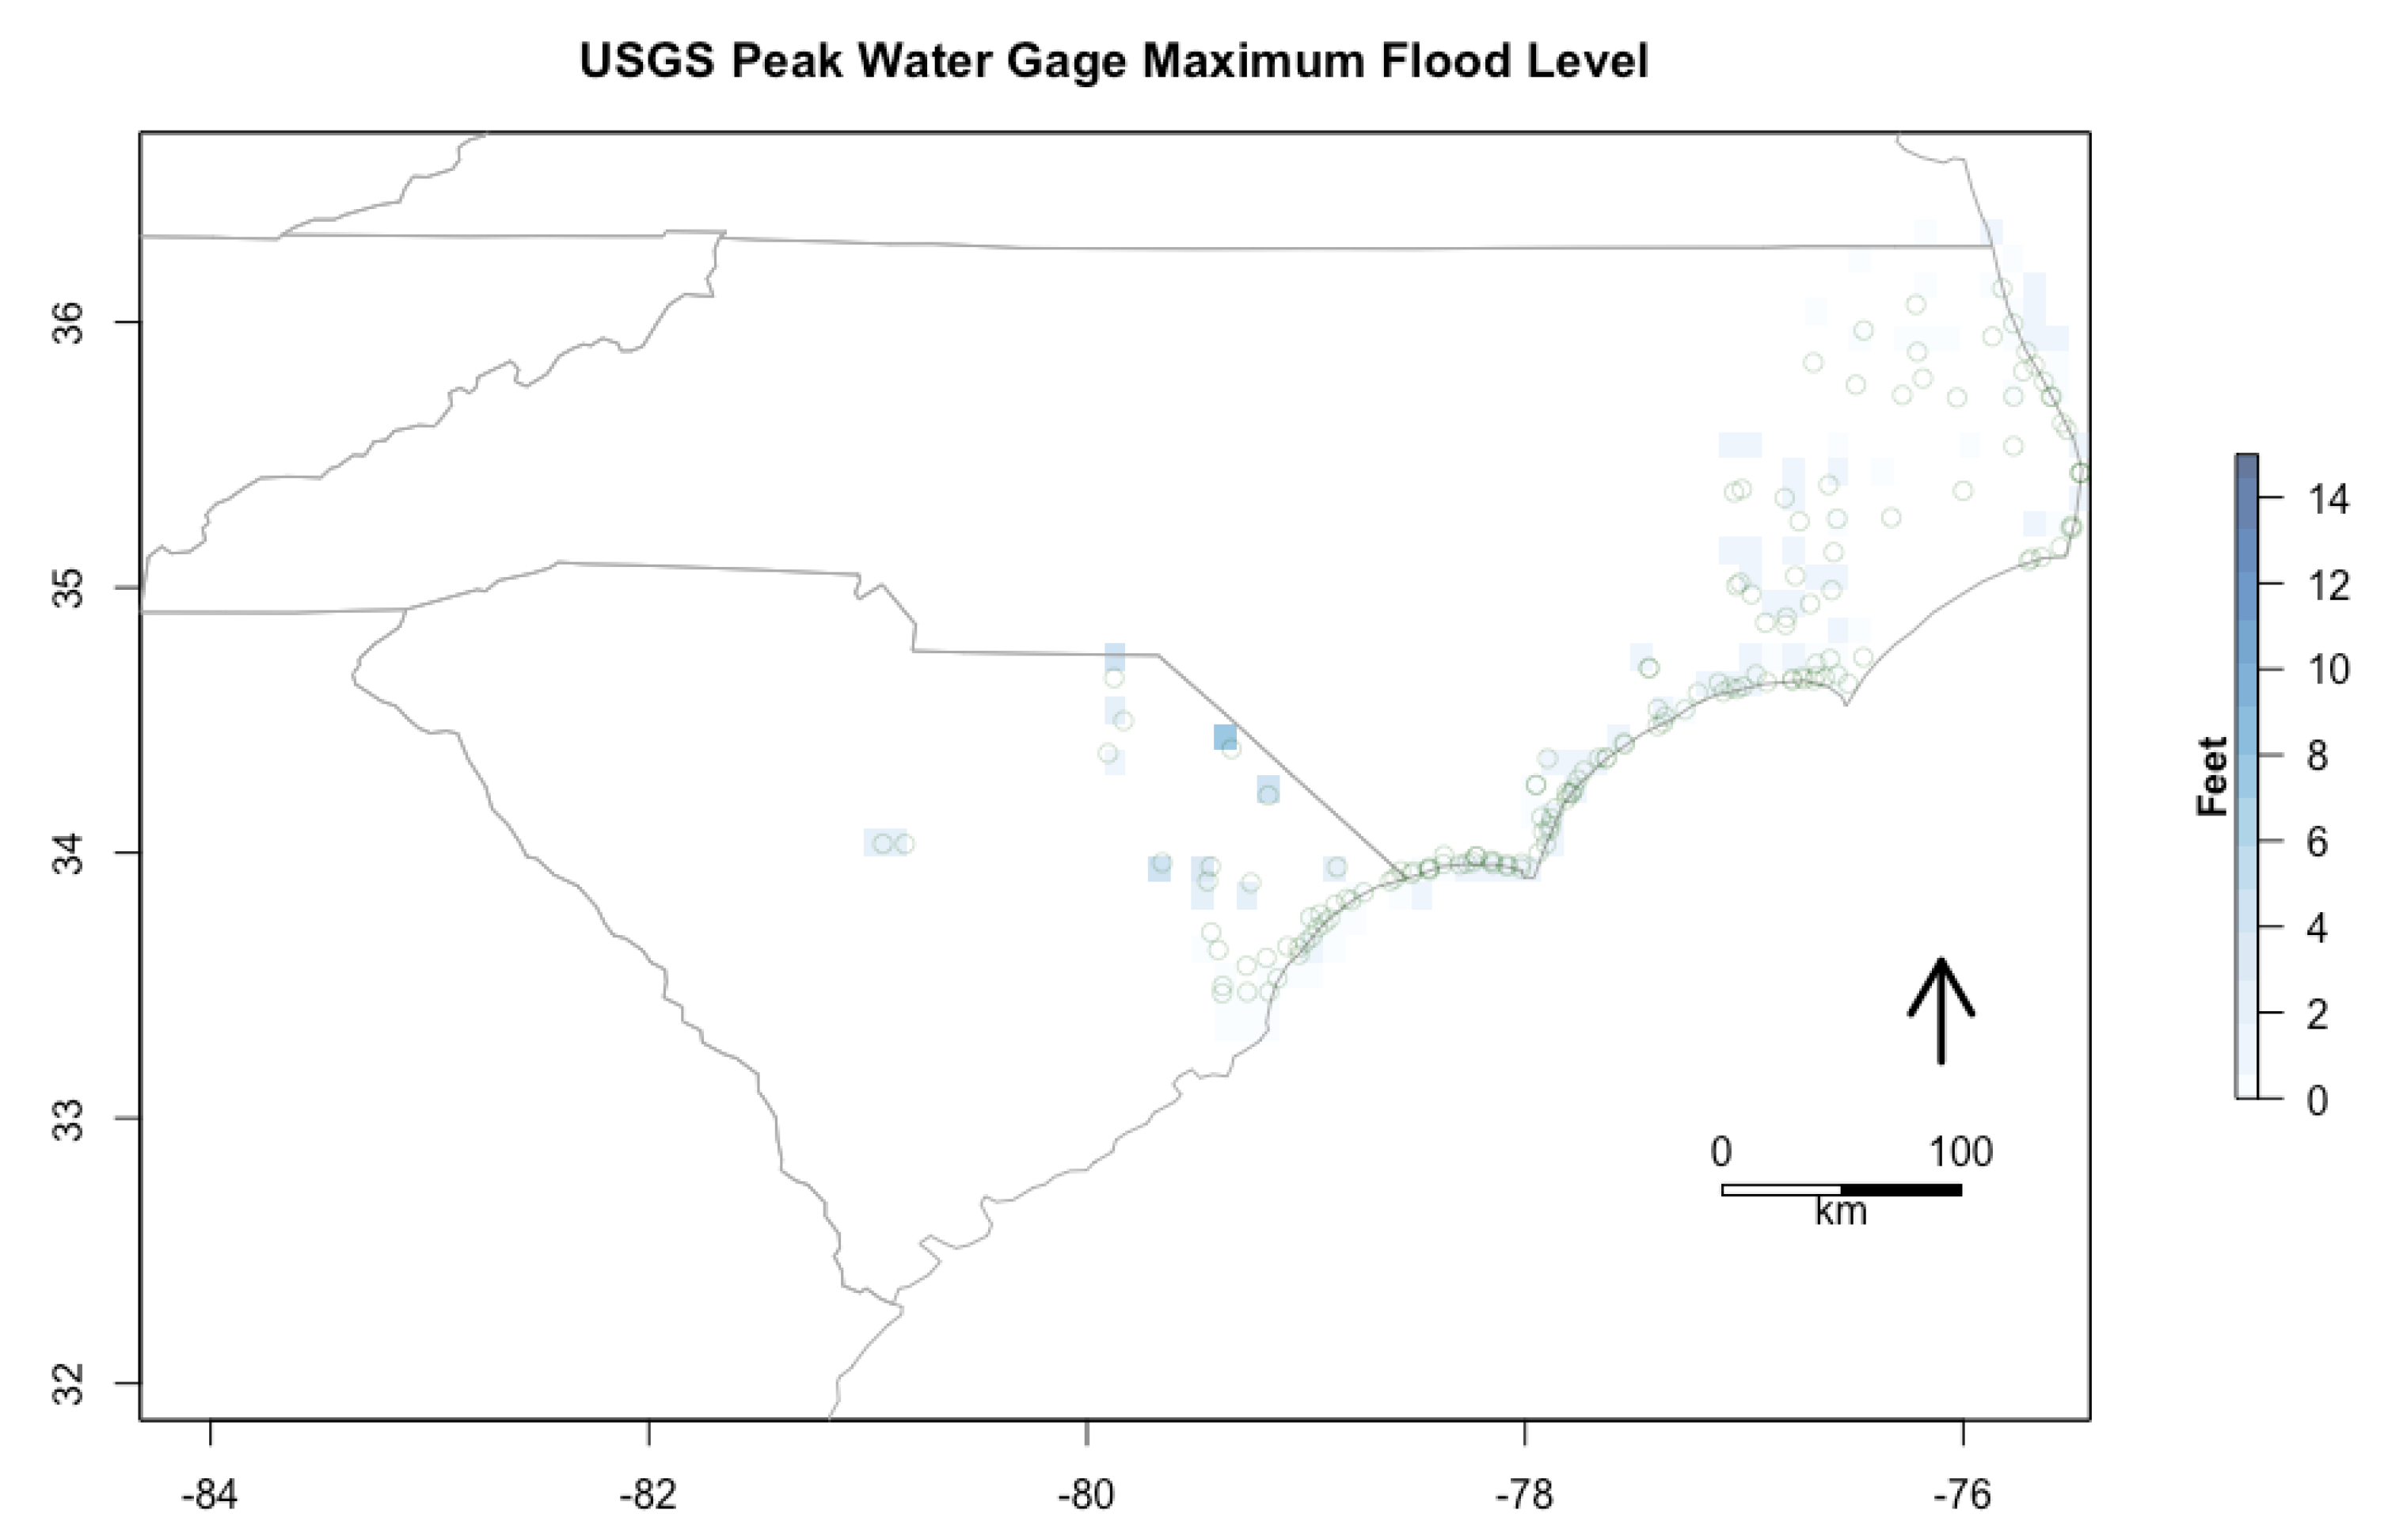
The USGS operates sensors at specific sites and provides streamflow data on over 10,000 stream gages in the U.S., many of which are collected in real-time [38]. The USGS Short-Term Network (STN) is active for events such as Hurricane Florence and hosts data in the USGS Flood Event Viewer (FEV) [39]. During Florence, parts of North Carolina set new state rainfall records with an accumulated maximum four-day total rainfall of nearly 36 inches [38]. Figure 2 and Figure 3 show the maximum recorded peak stream gage flood level and maximum recorded high-water marks (HWM) for each grid. These two datasets from USGS are joined and aggregated to the maximum.
High-water marks (HWM) data are measured from the “HWM to the ground surface using a tape measure or engineer’s ruler [40]”. These observation-based HWM can be marked physically and not recorded through sensors, but returned to by personnel after the event to record the depth of flooding. Therefore, it takes time after the event for these HWM observations to be recorded.
2.2.2. RIFT Model
Hydrodynamic modeling can use weather forecasts and other environmental inputs to simulate flood predictions. These predictions include quantitative estimates of expected flood depth. The Rapid Inundation Flood Tool (RIFT) model was created by the Pacific Northwest National Laboratory (PNNL), and the model results were downloaded from the data server GeoPlatform through FEMA Disasters Public Files [41]. The RIFT data provides modeled extents over the Carolinas and shows the intensity of predicted flooding from Hurricane Florence.
The model results were available for daily download during Hurricane Florence. The data is modeled at a 90-meter spatial resolution and uses rainfall, topography, land use/land cover, soil type, river gage, levee/dam, and infrastructure inputs [42]. The maximum values from 15 September 2018 are used for comparison of extreme flooding. Figure 4 shows a rasterized version of the model for the Carolinas. The maximum depth of flooding is used in the aggregation which visually highlights areas with the most extreme flooding and creates a format to use for comparison.
2.2.3. Remote Sensing
Remote sensing of the ground from purely optical sensors has serious limitations during hurricanes due to cloud cover. Most satellite remote sensing systems are unable to consistently collect imagery of the Earth’s surface due to the cloud cover that is typically present when hurricanes make landfall. Electro-optical satellites are limited in providing meaningful flood-related extent maps during events due to the atmospheric conditions of the storm. Optical imagery can prove useful during other types of disasters that do not have associated heavy cloud cover and to assess damage in the days after hurricane events. The chance of having remote sensing observations when and where it is needed to provide a flood map is a product of environmental variables and revisit time.
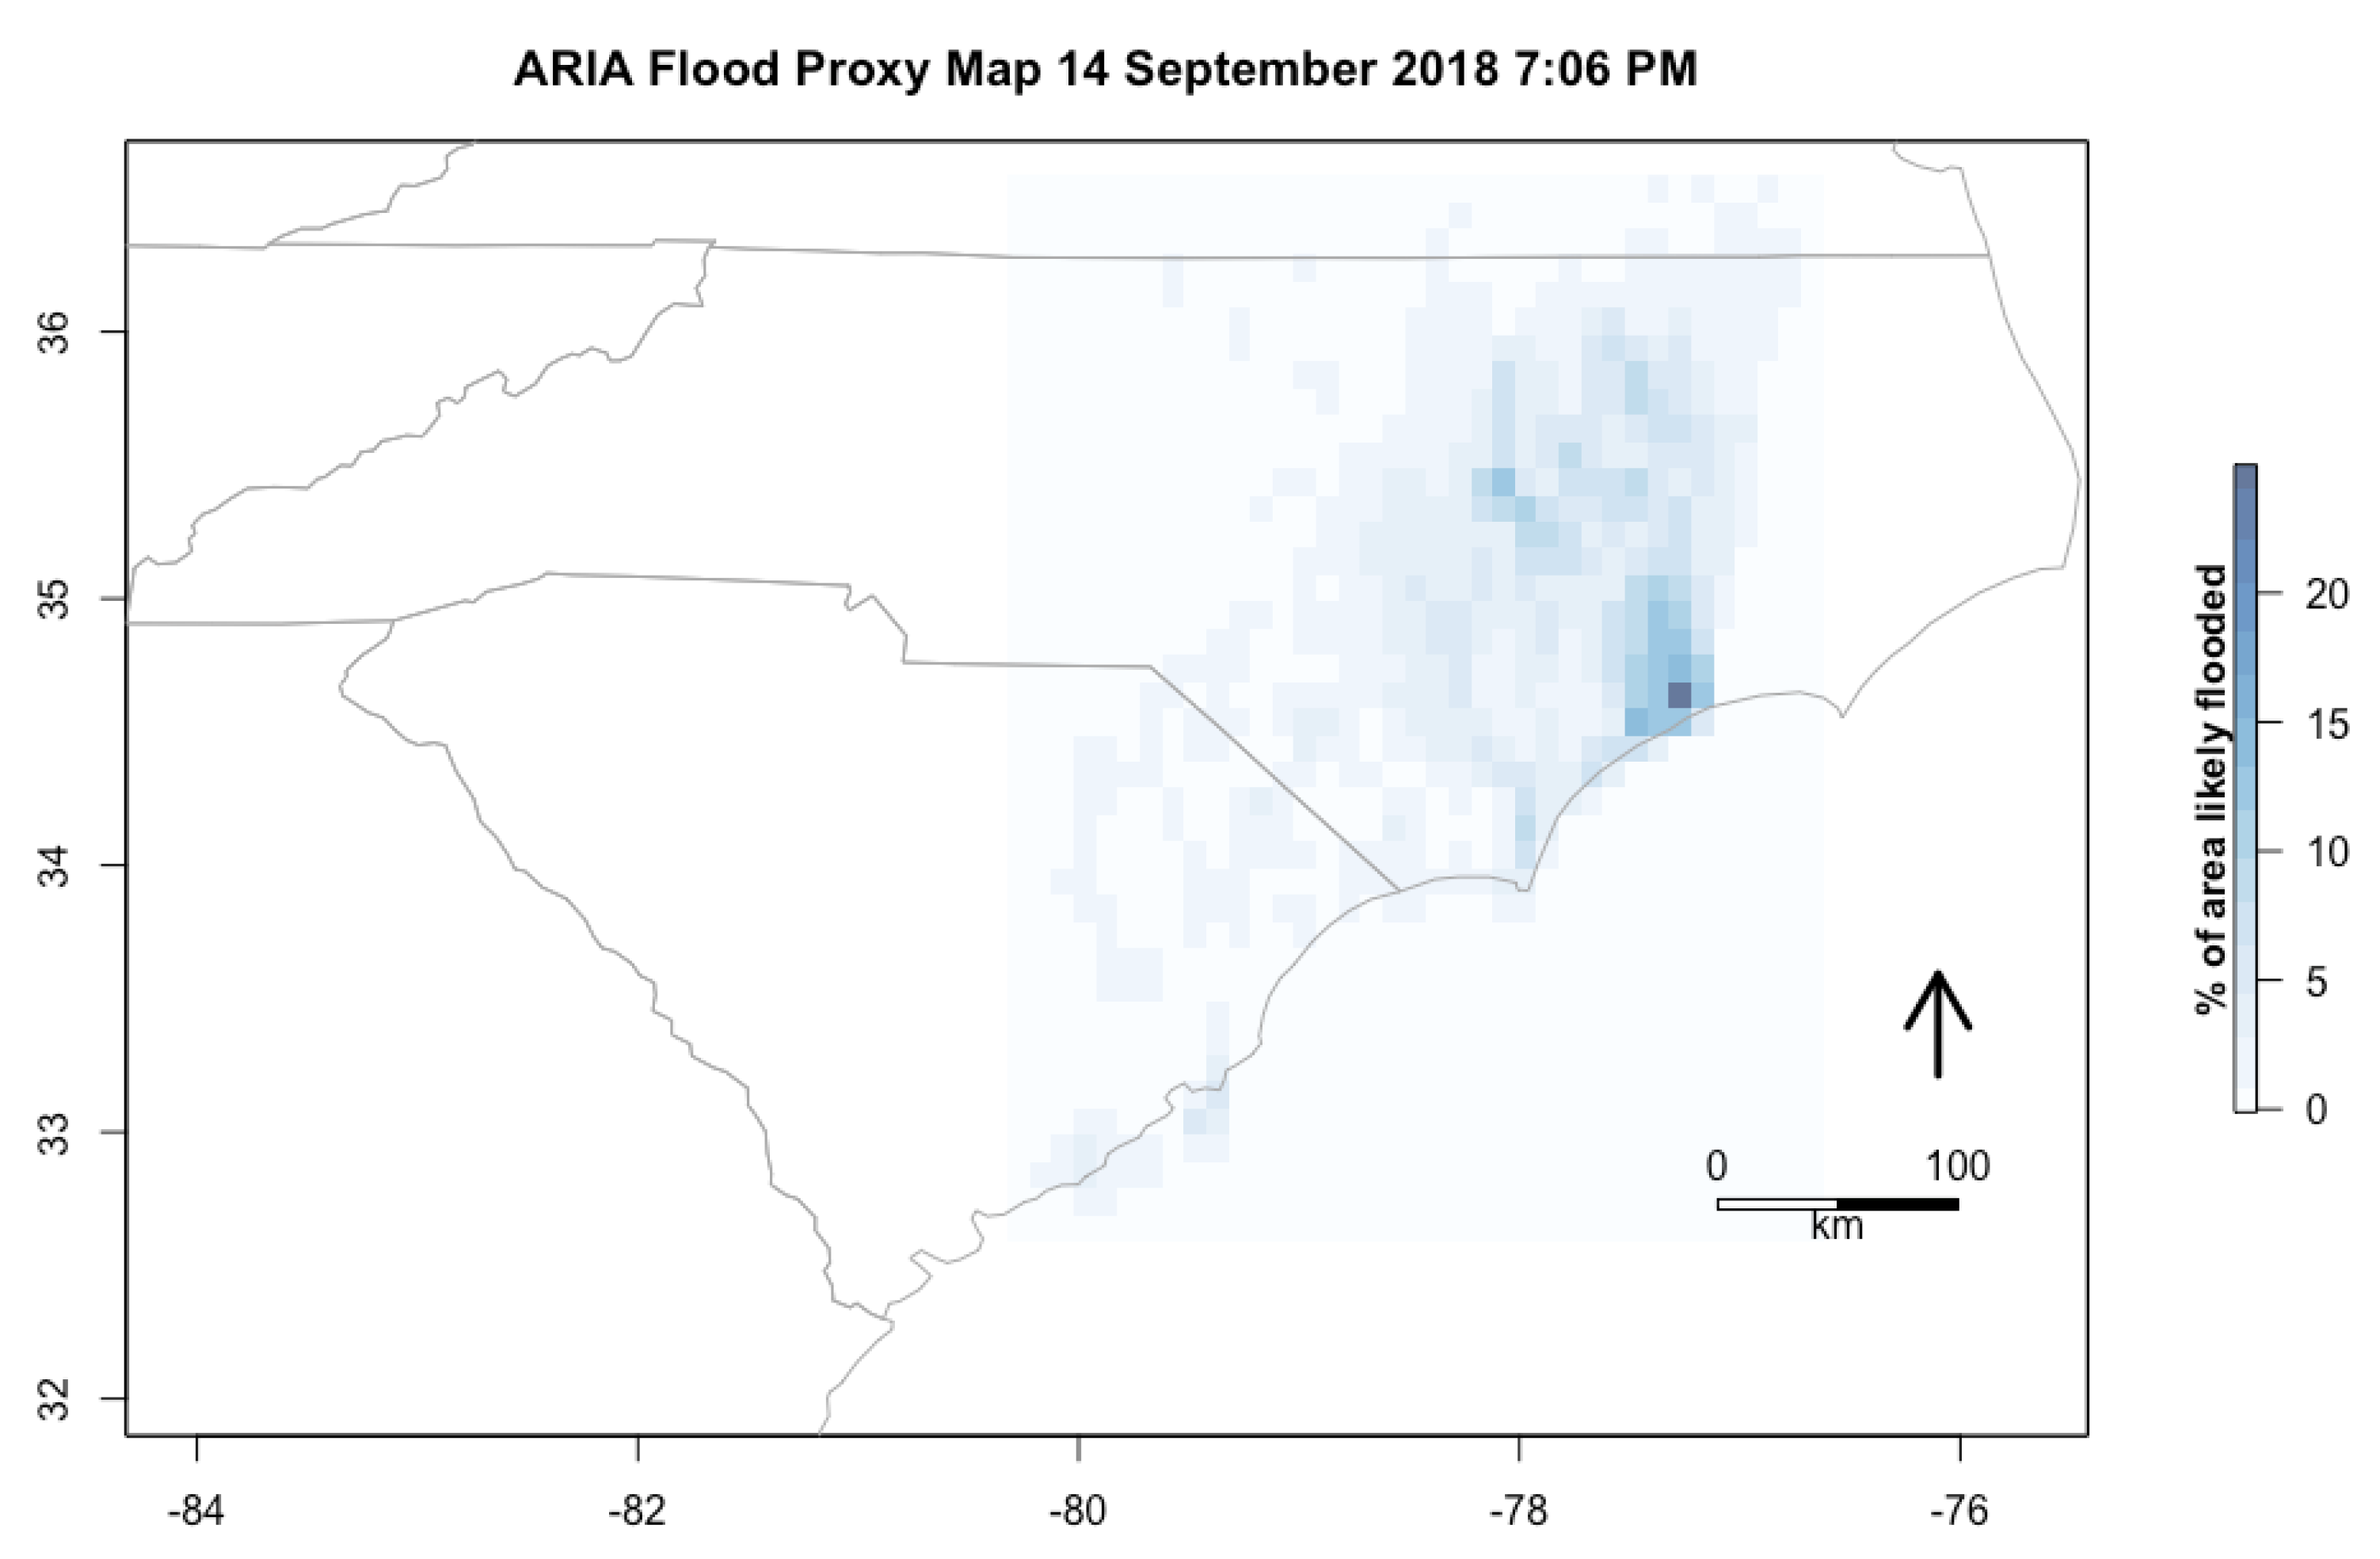
NASA’s Jet Propulsion Laboratory is funded by the NASA Disasters Program to produce a radar-based flood result using Sentinel-1 Synthetic Aperture Radar (SAR), which is operated by the European Space Agency (ESA) [43]. SAR is an active sensor that operates despite cloud cover and regardless of the time of day [44]. The Advanced Rapid Imaging and Analysis (ARIA) product is a flood extent map derived from change detection of SAR pre- and post-collection for an event. The spatial resolution of this product is 30 m × 30 m, and flood maps were created during the initial impact of Hurricane Florence.
ARIA Flood Proxy Maps were produced with radar from 14 September 2018 7:15 A.M. when the storm made landfall that is 155 miles × 233 miles (250 km × 375 km), 14 September 2018 7:06 P.M. that evening that is 155 miles × 210 miles (250 km × 340 km), 15 September 2018 18:57 P.M. local time, 36 h after the hurricane’s landfall that is 53 miles × 152 miles (85 km × 245 km) [45]. Figure 5 is resampled to show the percentage of the area within each grid cell that was identified as flooded in the ARIA data. A caveat was given that the product is supposed to be used to guide the identification of flooding, but that it might not perform well in urban areas or where there is interference from vegetation [43]. It appears that there are some errors along the coastal regions, especially in the highest areas designated as flooded that are actually naturally water with vegetation. This particularly seems to be an issue for one extreme grid cell on the North Carolina coast as the algorithm mistook an area as flooded that appears to actually be a small inland body of water.
2.2.4. Summary
Table 1 summarizes the data sources. Every source has unique characteristics due to how the data are collected.
3. Methods
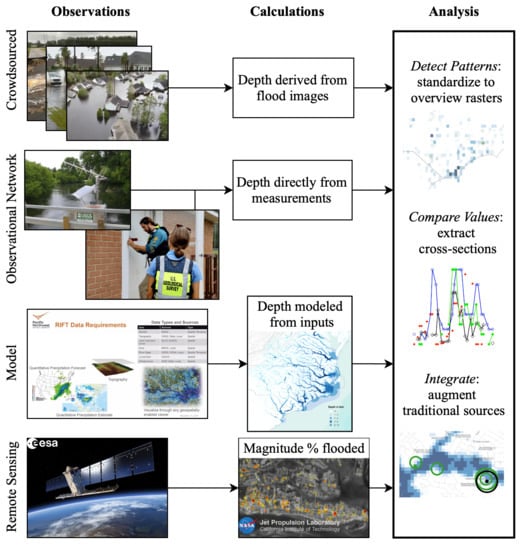
The research methodology of this paper is summarized here for the integration of crowdsourced and traditional datasets. Integration with traditional data during disasters can demonstrate the reliability of crowdsourced data [21]. Validated crowdsourced data can improve upon the spatial and temporal resolution of traditional datasets [46]. Processing is required to integrate heterogeneous datasets and these specifications are included in this section to enable replication. Developing automated methodologies to integrate geospatial data from multiple sources is time-intensive and computationally demanding. Section 3 is divided into three overarching methodological categories as shown in Figure 6: (1) collection of observations, (2) calculations of flood depth, and (3) analysis.
3.1. Collection of Observations
Many types of data were available from various sources during Hurricane Florence. For this case study, a source of data was selected from four major categories that can be used during floods: crowdsourced flooding measurements, USGS ground-based observation networks, a model, and a remote sensing product. Crowdsourced images of flooding were contributed during Hurricane Florence to an online application. The entire dataset can be downloaded, but not all the images are geolocated. These point-based observations are characterized as opportunistic as there is not a set pattern of collection. USGS data are easily downloadable in a standard format with geolocational information [39,40]. Streamgages are intentionally placed and high water marks are carefully recorded at specific points. The output of the hydrodynamic model was downloaded from a disaster platform [41] and the model captures broad areas of flooding. Finally, a remote sensing product of flooding classification is downloaded which provides coverage of the coast on a few days [45]. These data sources were described at greater length in Section 2.
3.2. Calculation of Flood Depth
Many studies in this field focus on flood extent [44,47], which is important, however, flood depth is a critical attribute. Flood depth information is an essential indicator of how much risk and damage is involved. Flood depth calculations can be automated for each type of data, but the methods required vary by the form of data used. In the case of the crowdsourced images, flood depth was calculated for the observed flooding in relation to features in the images. The USGS data provides direct flood depth observations. The hydrodynamic model considers inputs such as the topography to calculate the predicted flood level. For the radar remote sensing product, the percentage of the area classified as flooded was used to give a measure of the magnitude of flooding present. This step was used to provide a measure of comparison across sources.
3.3. Analysis
The data are analyzed to detect patterns, compare values, and integrate the sources. Crowdsourced collections need to have methods developed to aggregate to specific units of interest as “aggregated data from multiple sources is becoming increasingly important as features of research work and as inputs to policy and management actions” [48]. However, the process is complex as integration is often held back by data that may be insufficiently structured, documented, or validated for analysis or modeling purposes [6]. Data structure, semantic ambiguity, and the variety of tools with different levels of raw data access make data fusion of crowdsourced datasets difficult [49]. Assessment can be performed, and the data can be compared to a baseline; however, validation by comparing it with a known reference value can be difficult to assess when working with complex and heterogeneous unstructured data [50]. Case studies are needed that have spatio-temporal overlaps of datasets for cross-comparison of crowdsourced and traditional collection.
To compare these sources, standardized raster grids were created to detect patterns of flooding. This step provided a common overview to identify areas indicated as flooded. The key is to convert and store the data in the same measurement unit, geographic coordinate reference system, and spatial data format. The visualizations in Section 2 can be used to evaluate the completeness of the datasets as graduated symbols are used to indicate where there is data. This provides an overview of the flooding as well as the spatial limits of each dataset. Beyond the insights gained of the datasets, this step is also necessary as it standardizes the data over a common grid in order to compare it in the following step.
Next, the data sources are compared using cross-sections to assess flood depth in areas impacted by Hurricane Florence. In preparation, the contributed and traditional datasets were spatially standardized to common raster grid cells in the same coordinate system with the same units. The values of the datasets are then compared by extracting cross-sections. Cross-section analysis is commonly used in atmospheric sciences [20]. The method is effective for comparing across distributions that might have similar trends in nearby areas even if the data were not collected precisely in the same locations.
Calculations of flood depth are used for all the sources except ARIA. The remote sensing portion of flood associated content is included in Figure 7 and Figure 8 for comparison purposes, but derivation is entirely different as this input demonstrates the magnitude of flooding in the area through a percentage of the area classified as flooded. ARIA was calculated as the percentage of each grid area that was identified by SAR as flooded. While this last source is not a flood depth measurement, the magnitude of observed flooding appears to be related in areas of severe flooding and it is included for comparison.
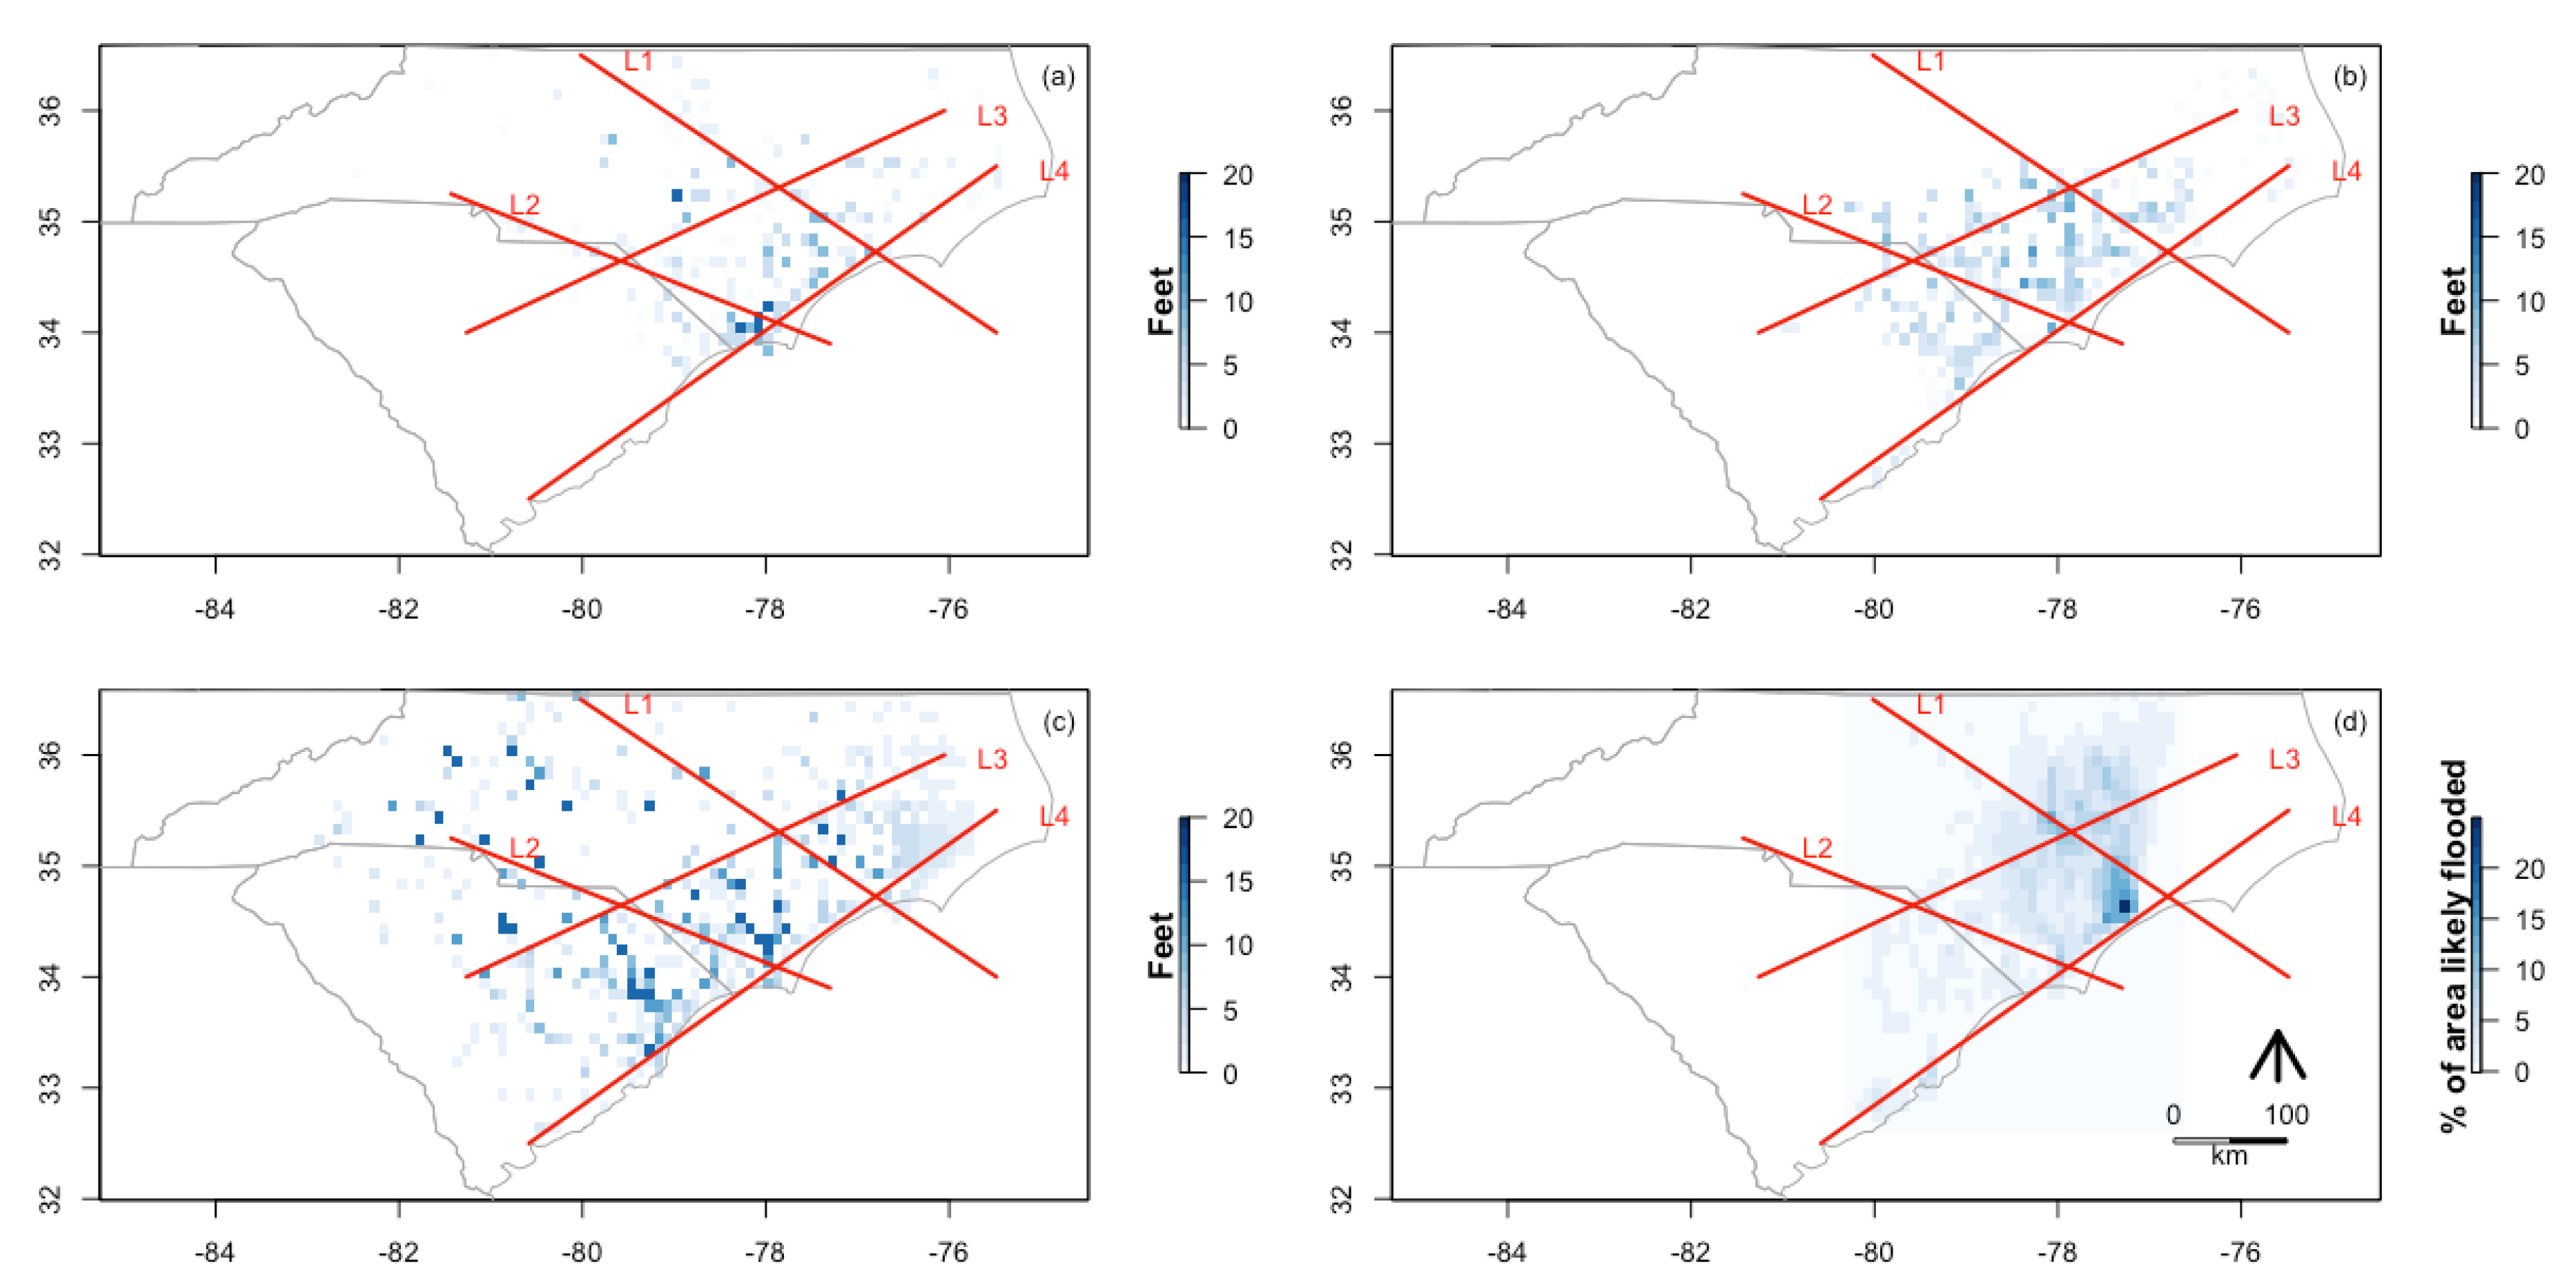
Cross-sections are created for the flooding data sources by extracting the raster values along each line from west to east as seen in Figure 7. Location-specific data are extracted from each cell and shown in Figure 8 in Section 4 for each line in Figure 7 from L1 to L4 as indicated on the map. The maximum value recorded for each grid cell is visually shown for each data source in Section 4. The maximum value, as opposed to a measure of central tendency, is chosen to create a comparison due to interest in maximum flooding and as a product of the data themselves. First, maximum flooding is the most meaningful measure as it is the most relevant to assessing impact from flooding. Second, the USGS HWM data are inherently related to the maximum. Third, the crowdsourced data are not spatially sampled so there is an uneven distribution of observations and likely a greater representation of higher levels of flooding. The context of the problem, phenomena, and the characteristics of the data determine the appropriate measure of aggregation.
Finally, crowdsourced data are integrated with traditional data sources collected during Hurricane Florence. The first step of pattern detection is used to indicate areas of flooding, the second step compares these regions, and the third step integrates the sources in focused areas along with geographical context. A few examples are provided in Section 4 to demonstrate how crowdsourced data can add value by augmenting information from traditional data sources. Particularly, by providing flood information specifically related to human interests.
4. Results
This section evaluates the integration of crowdsourced data with traditional data sources during Hurricane Florence. These datasets include a ground-based government observation system, a model, and a SAR satellite remote sensing product. Collection and calculation of flood depth prepared the datasets for analysis. Section 4 provides results from the analysis of crowdsourced flood observations through standardization, comparison, and integration.
Standardization is necessary to be able to compare sources. The data are prepared through rasterization of point data and high-resolution raster data into aggregate standardizations at various scales. The visualizations maintain the ability to detect areas of flooding across scales, however, the use of small grid cells provides fewer opportunities to compare across all the datasets. In the end, a 10 km grid was determined for this specific study to provide a comparison of the various datasets at intersections of the sources while maintaining geographical relationships. Flood patterns are detected in all of the data sources. The raster overviews indicate both coastal and riverine flooding. The detected flood areas are prioritized for cross-sectional analysis.
Cross-sections provide a comparison of trends across all of the datasets. Figure 8 visualizes the data extracted on flood depth across the extracted lines as previously discussed. The crowdsourced image derived flood depth, USGS HWM and Gage Peak, and RIFT Flood Model correspond in a number of cases where the data are available. The derived ARIA % of the area likely flooded has a noticeable relationship with a higher percent likely to be flooded where flooding is observed. For L2, all the datasets show a similar trend in an urban area of a high peak around 10 feet near the coast (east) and inland (west), another lower peak of approximately 5 feet. L3 and L4 run along the coast from west to east to show peaks at the rivers with crowdsourced images accurately showing the flood depth and location of the peaks.
These results are displayed graphically in Figure 8 and highlight agreement between the sources. A strict quantitative assessment requires further processing of the data, such as inter- and extrapolate values, which however would introduce error. The data are shown with as little processing as possible in order to avoid introducing artifacts that might mask the true contribution of each individual source. The figure shows that there is an inherent agreement among the data, in the sense that they seem to replicate the trend of the flooding as a function of location. However, there are also variations, which are due to the different nature of the data, and how they are collected.
The crowdsourced data were collected primarily in populated areas, so a few areas indicated as flooded in the other datasets are outside of the spatial extent of this collection. Discrepancies in the exact flood depth values may be a result of the observations being collected in slightly different locations within the raster grid of 10 km. Unfortunately, there is not much data collected precisely in the same place so direct comparisons are limited. Nevertheless, different values do not necessarily indicate error and varied data is the only way that crowdsourced data might augment traditional sources. In fact, the other sources might be less relevant if the maximum depth records are along rivers with no relation to human impact. The final analysis step gives context for locations detected as flooded that have overlapping data which provides insight into the causes of these variations.
Finally, we compare the flood observations in a geographical context from different sources at specific locations of interest. Figure 9 shows the crowdsourced image-derived flood depth in comparison to the RIFT flood model along the coast near Wilmington, NC. Crowdsourced images were taken along stream and river areas which also are indicated as flooded by other sources. Many contributed images were collected in towns and along roads that were flooded. A closer view is needed to compare data sources within towns that were flooded.
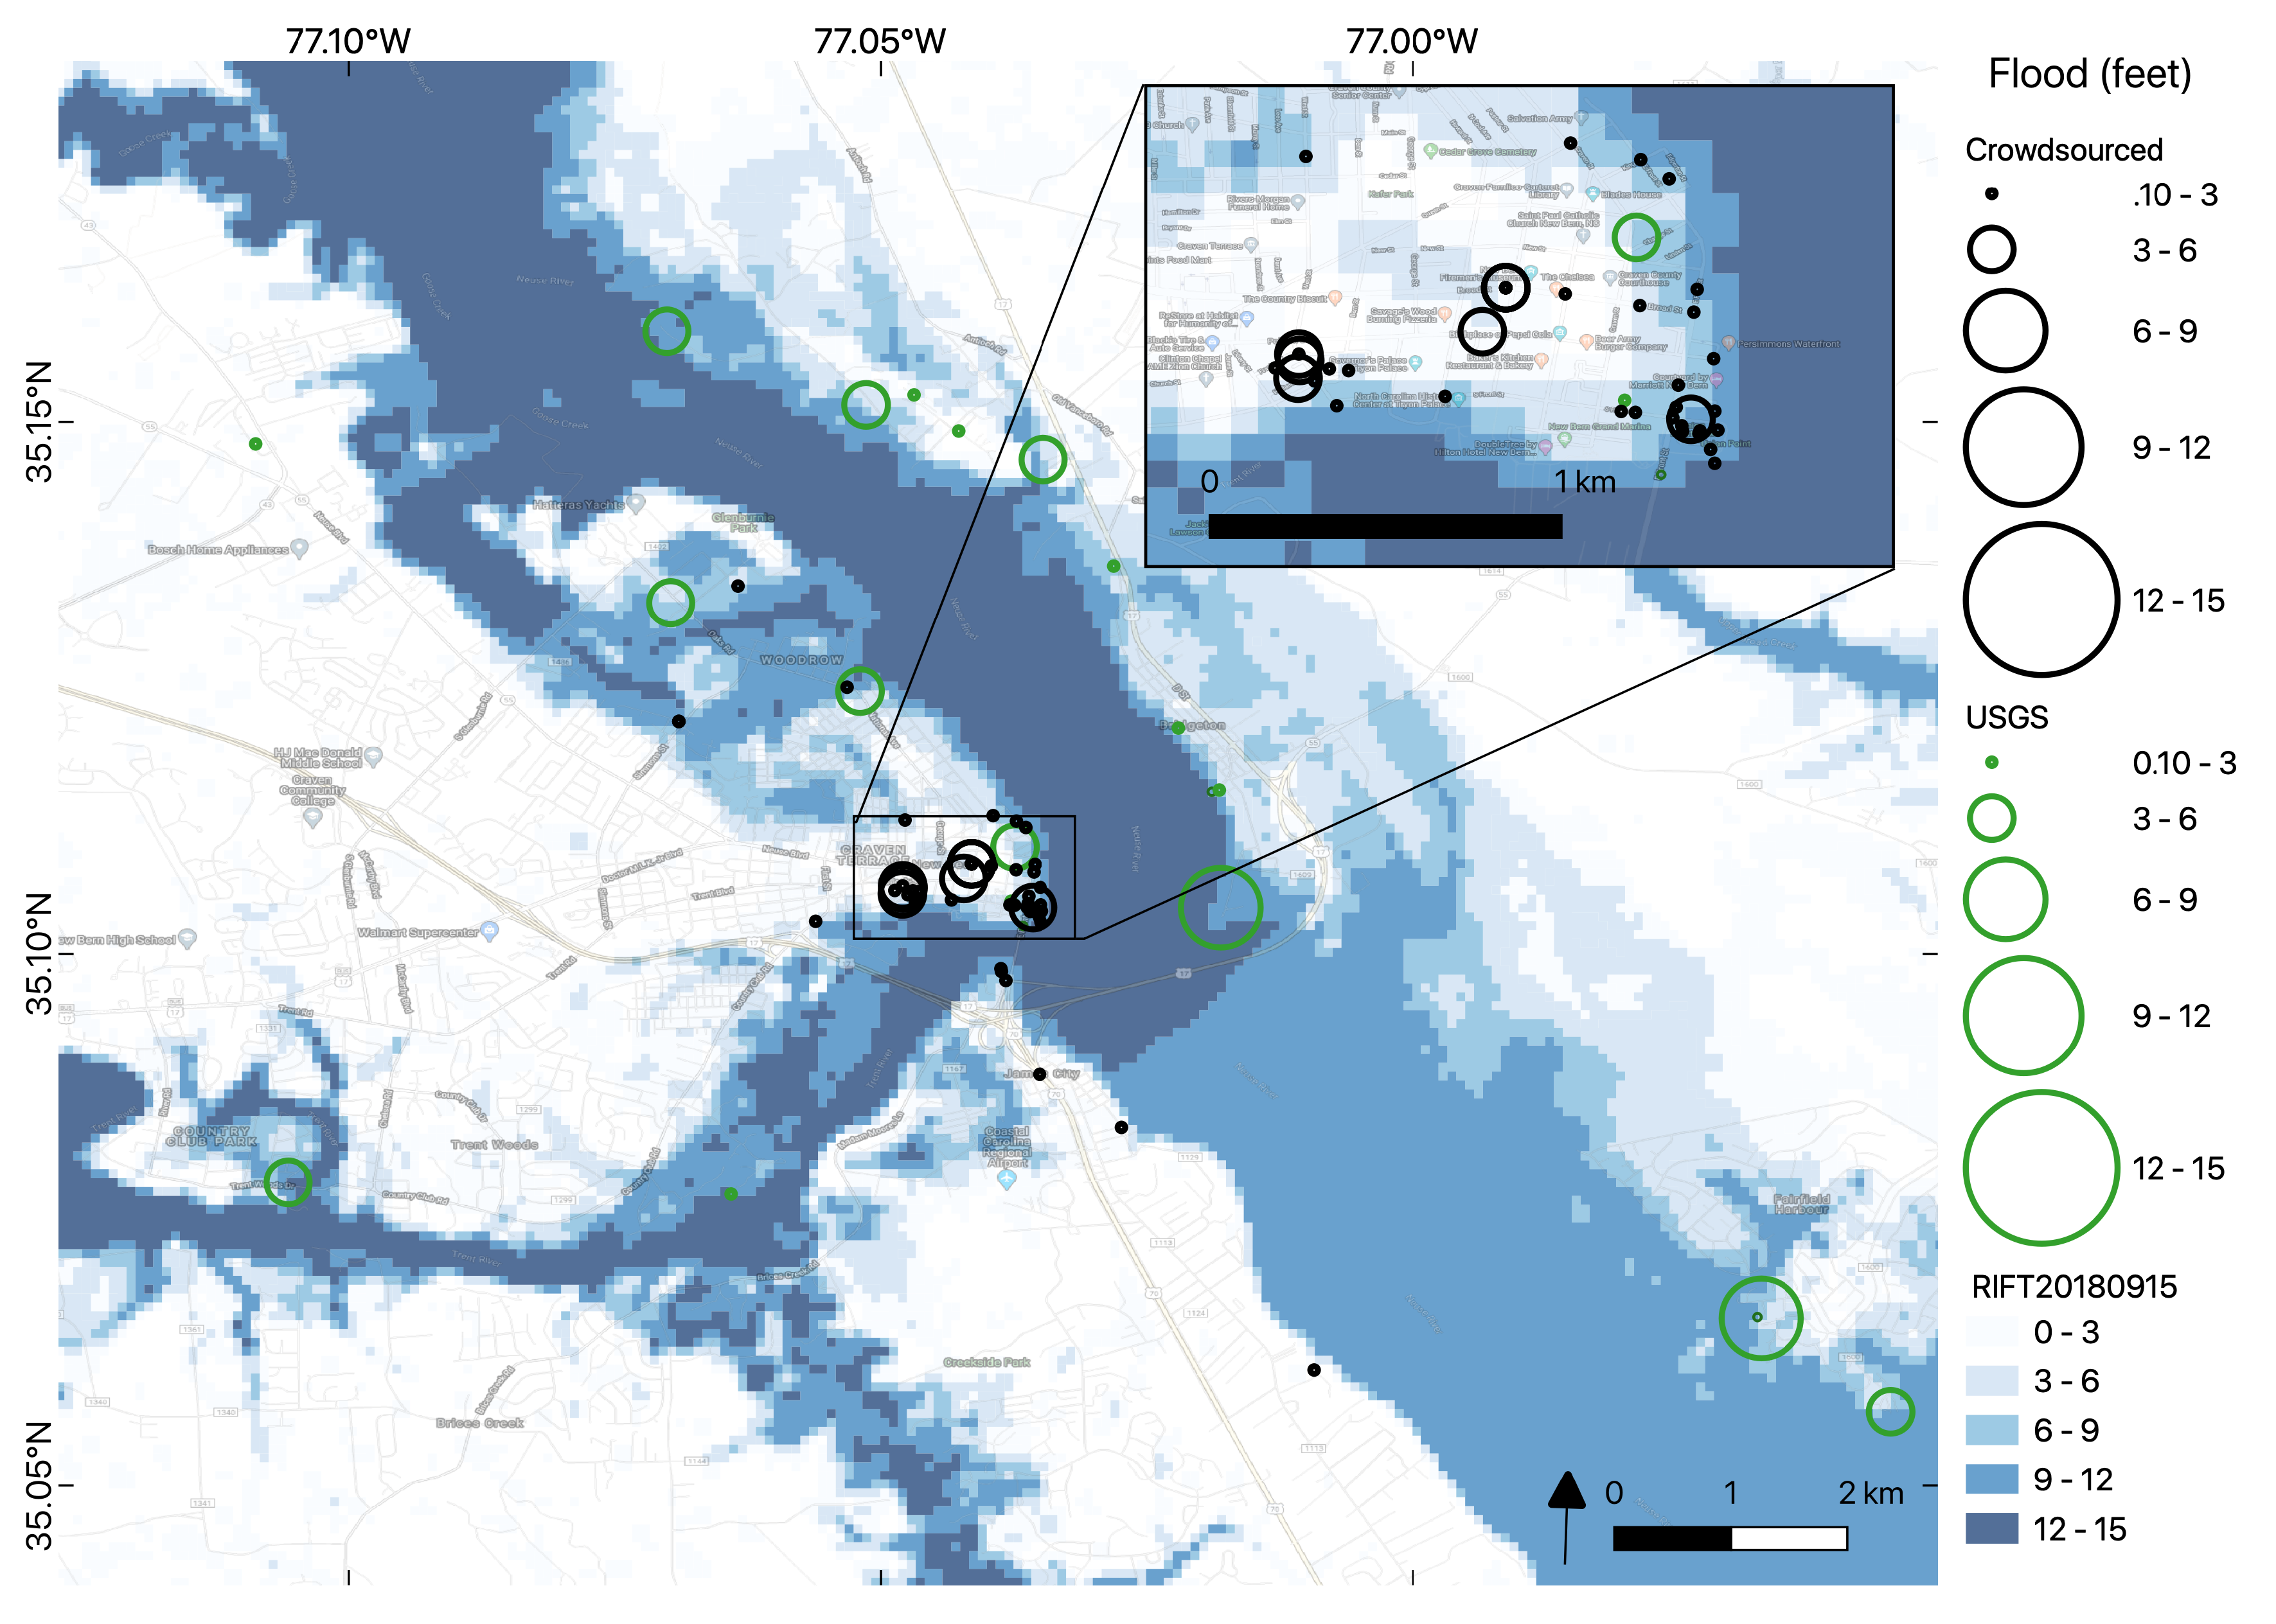
High-resolution visual comparisons of spatial data sources can be useful to show how datasets align with features and phenomena on the ground. Figure 10 shows an integration of flood depth data during Hurricane Florence in New Bern, NC. The town of New Bern is centered on the map with a number of flooding observations from the USGS networks and the crowdsourced data indicated in the town. The RIFT model prediction indicates severe flooding along the river which was confirmed by USGS measurements. In addition, the crowdsourced data shows flooding within the town of New Bern which is not indicated by the river confined stream gages or the model. Reporting from the time confirms widespread flooding in the town of New Bern as is indicated by the crowdsourced data.
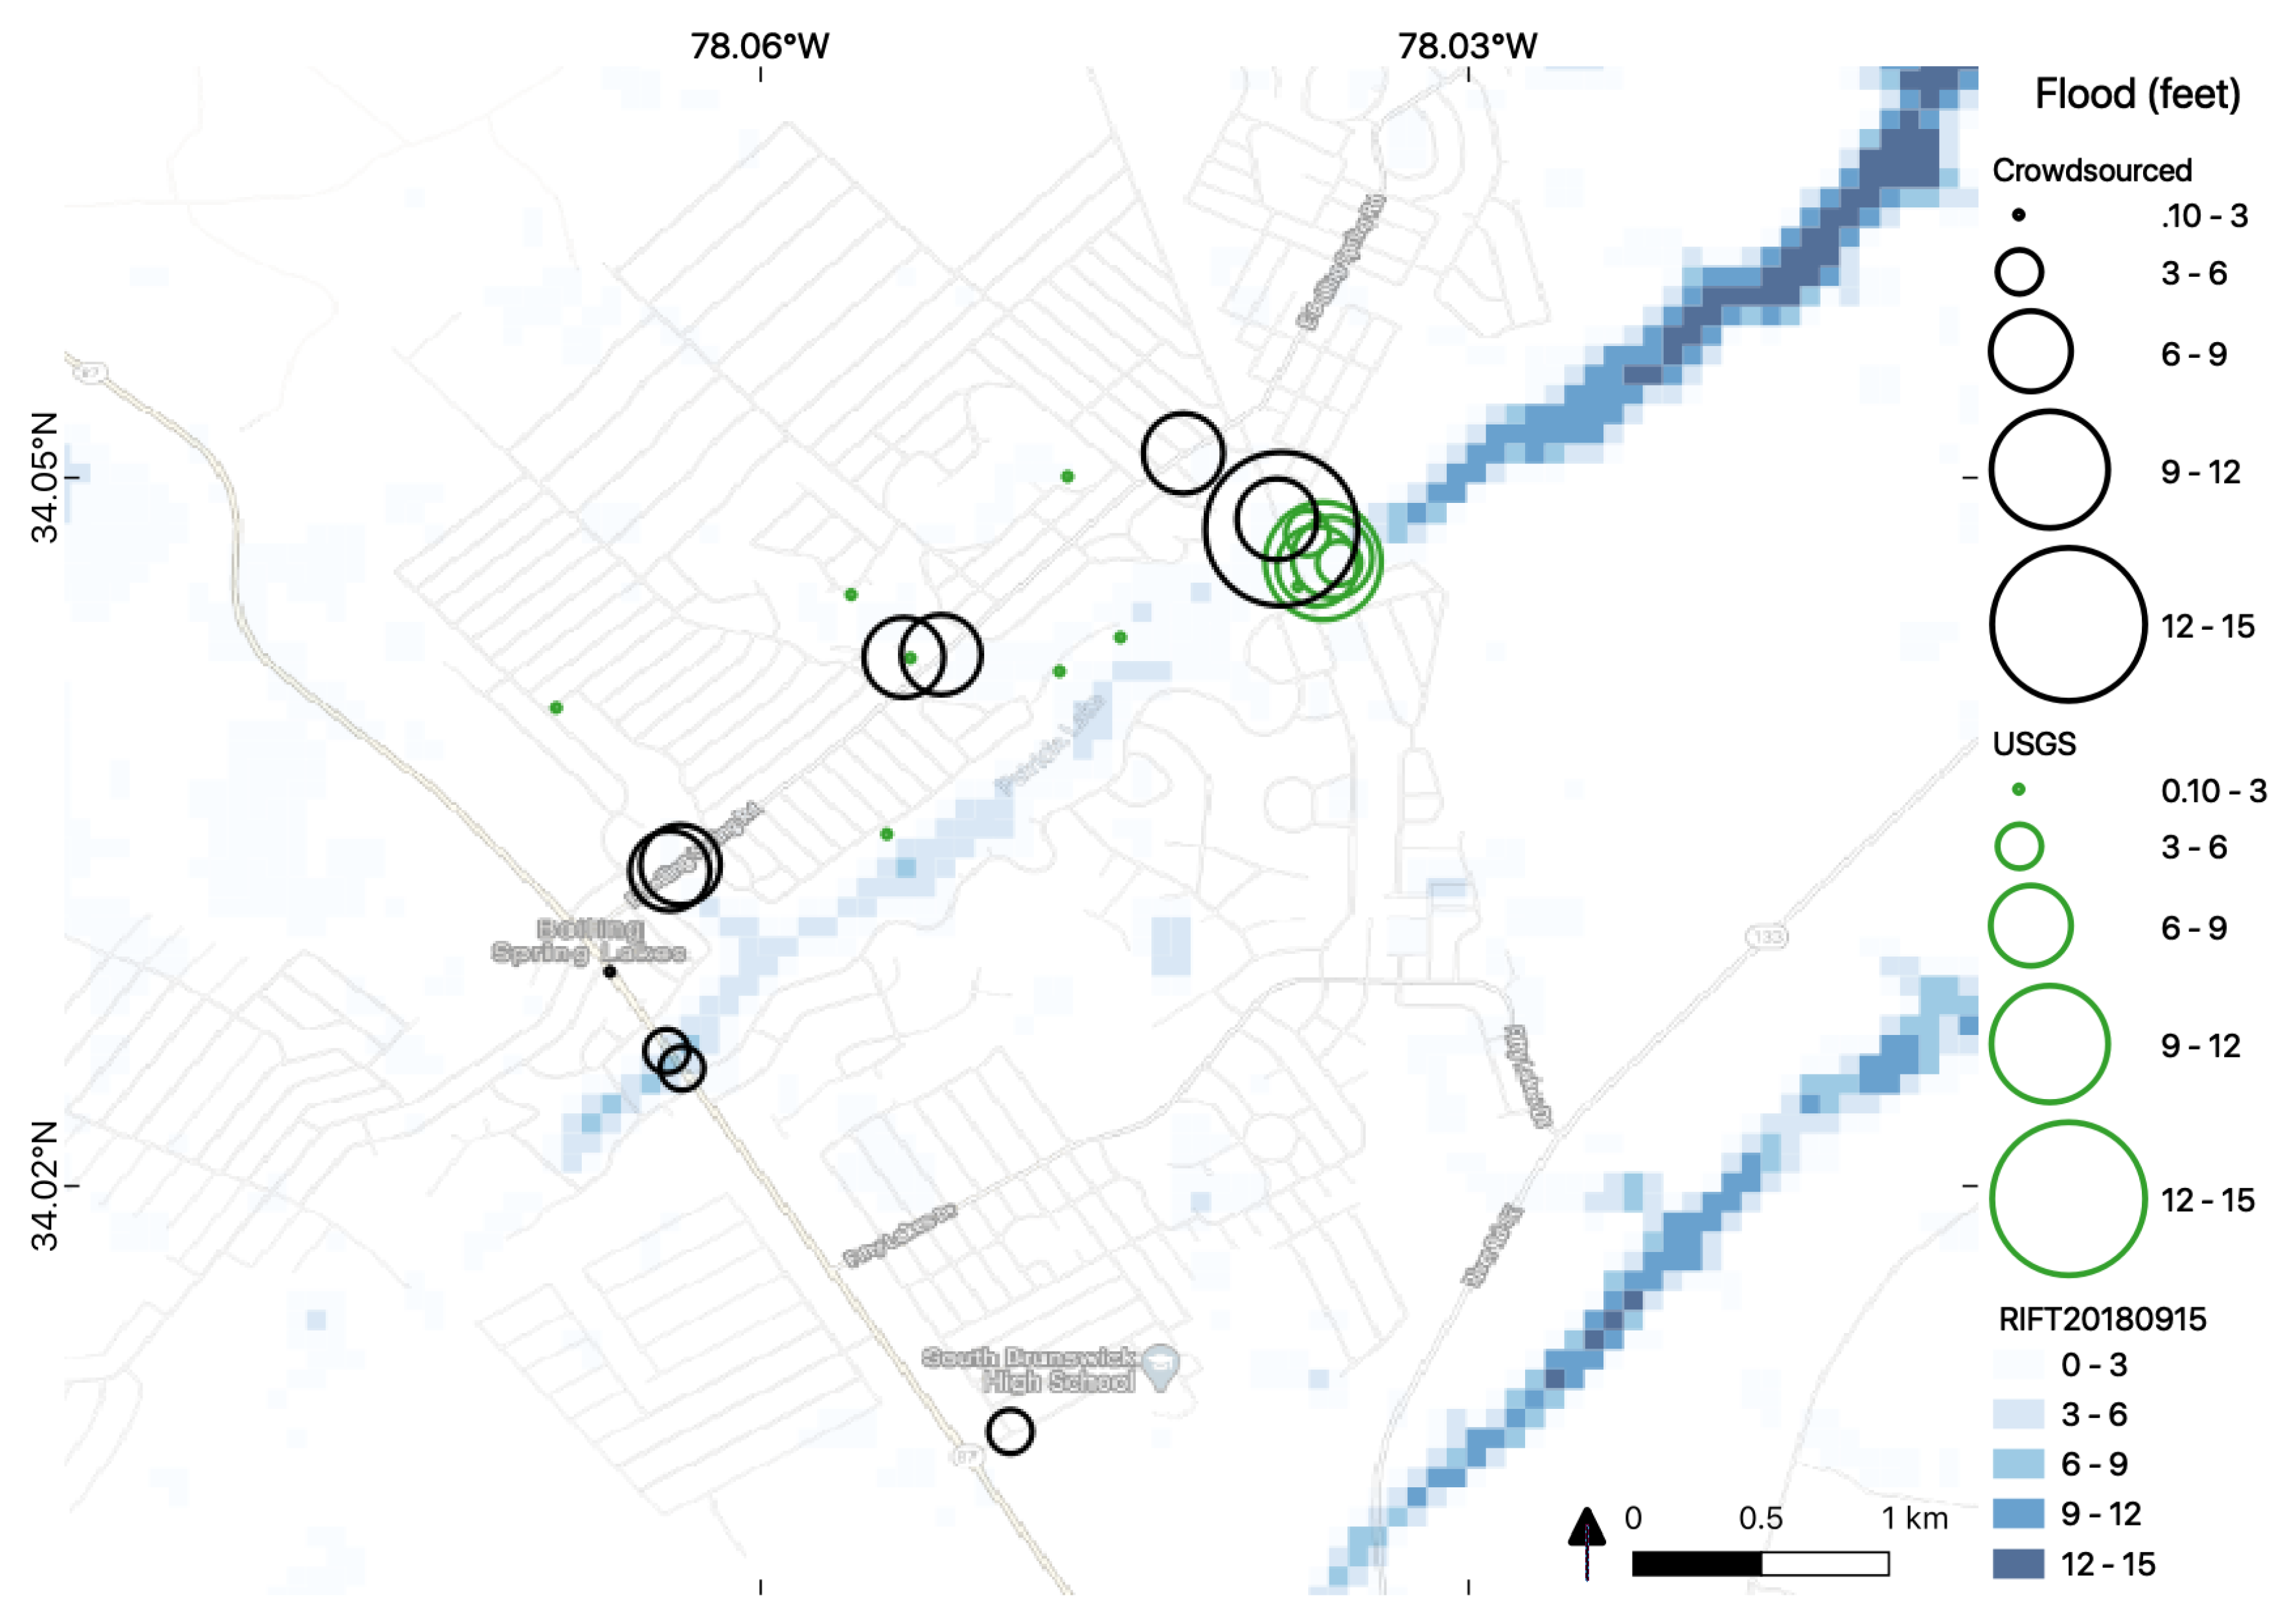
Figure 11 shows how the crowdsourced images are collected along major roads in the town of Boiling Spring Lakes, SC. In this case, the USGS and RIFT model confirm that there was flooding along the river. However, the crowdsourced data also shows that roads were flooded in the nearby town and this contributed source of data adds informational content about the human impact to the flood analysis.
The information value from social data is not defined by volume as there is a need for data on specific topics at specific times and places. Crowdsourced data can be integrated to show unique content, especially around populated areas. Social data has unique characteristics as it is typically unsampled, untasked, and mostly located in areas of human activity. These characteristics can lead to the production of useful data content that uniquely depict areas of human interest.
This full evaluation process corroborates crowdsourced data located in or nearby areas detected or predicted to be flooded by other sources. In some cases, the crowdsourced data provide evidence that the flooding was more extensive than indicated in the other sources. This augmentation is crucial for understanding flood risk, especially in urban areas, as crowdsourced data occur in areas of human activity. Crowdsourced contributions are intrinsically tied to human conditions in a disaster response context which inherently adds to the analysis. If evaluated alongside other inputs with broad spatial coverage, crowdsourced data can augment information from traditional data sources.
5. Discussion
During a disaster, crowdsourced real-time data could be informative when the data itself is immediately accessible and if steps are in place to harness the data. Crowdsourcing can provide timely information on flooding [51] particularly in areas of dense human activity [52]. This is evident in the results of this study as crowdsourced images can be immediately available in urban areas. Given the temporal limitations of the other sources, crowdsourced data have the potential to fill information gaps in near real-time by streamlining information processing [33].
Data fusion of heterogeneous big spatial datasets can be challenging as it involves a number of processes at scale [53]. In order to actually use the data in real-time, as many steps as possible of the processing chain should be automated [26]. Versatile workflows can streamline processing to ingest data from likely formats with the built-in capacity to navigate likely data errors. Each type of dataset has unique characteristics that require individualized approaches. It could be essential for organizations to collaborate with data producers prior to a crisis to ensure access and feasibility of use.
Crowdsourced collection, sensor networks, satellite remote sensing imagery, and models are all faced with limitations in observational inputs, forecasts, and resolution. Analysis of crowdsourced data is informed by an awareness of the characteristics of the data collection in light of the patterns of the phenomenon of interest. Data should be interpreted with an awareness of how it was collected. The crowdsourced data are untasked and unevenly available. Crowdsourced data has limited spatial sampling so a basic visualization could lead to a misrepresentation of areas of no data as being an area without flooding.
USGS water gages are primarily located along rivers, as we see in Figure 10, and may not provide coverage of urban flooding unless these locations are represented by high water marks (HWM) which are manually collected after an event. Therefore, while the results show agreement, this comparison is done after the fact, and most of the USGS HWM data are not available during flooding events.
Model results are heavily dependent on inputs to make accurate predictions. Crowdsourced data could be used as a direct input to models to improve their coverage and resolution. The crowdsourced inputs could be useful to tune models at specific times and points of interest. The data can be integrated over time to show flood depth trends at a high resolution over the course of the event based on what data are available. Other data sources can be integrated that might not be direct environmental observations, but could be valuable to provide near real-time data of impacts on human activities and interests.
Remote sensing collection is limited in temporal resolution by revisit time and environmental factors that obscure observations. Under the current system, the revisit time for radar is less frequent than for electo-optical imagery [29]. However, the collection of electro-optical imagery was severely limited by cloud coverage so a radar-based product was used in this study. High latency satellite products, due to collection and a lengthy processing time, may be impractical for direct use during hurricanes.
Cross-section visualizations in Figure 8 show spatial trends over multiple datasets for the phenomenon of interest. The cross-section method is effective at comparing across distributions and the results show that the datasets all agree on a binary distinction between flooded versus not flooded. In cases when data are unavailable at the exact location of the cross-section, data collected in the immediate vicinity are used to estimate the coastal and riverine flooding. The data from these alternate locations can be used without any modifications, or applying a function. In this study, a buffer area was effectively created by gridding the data, and the maximum value was used to summarize all the data collected within the same grid. The maximum value was used to show the most extreme flooding, which is generally most important during crisis. In addition, the flood depth phenomenon studied is transient and varies significantly over a short distance. In the future, other forms of social data and categories of environmental hazards could be evaluated using this methodology.
The crowdsourced data provided unforeseen benefits in the high-resolution analysis of flooding in towns, as seen in Figure 11. The crowd improved coverage in urban areas in a timely manner. Crowdsourced data can play a major role when there are active contributors during events.
6. Conclusions
This paper presented a comparison of contributed data with traditional sensor networks, a model, and a remote sensing product to study flooding in the Carolinas caused by Hurricane Florence. While models are broad, they depend on accurate observations to predict where it is likely to flood. Unfortunately, traditional sensor networks can be disrupted during disasters or not provide real-time data [54]. Flood detection using satellite imagery is particularly difficult in urban and vegetated areas [44]. Therefore, crowdsourced data can provide valuable observations on depth [34], particularly in urban areas, to augment traditional methods of flood detection and characterization [35].
Crowdsourced data serves as an essential source of valuable and useful data for environmental monitoring, and can be used to fill gaps in traditional data during disasters if technical systems are in place to rapidly integrate them [33]. However, social sources of crisis data are not likely to replace traditional environmental monitoring over long time scales or broad regions as the motivation may be short-term and localized. Still, these social datasets could be used to augment existing data or be incorporated into real-time models, especially as a method to improve resolution in populated areas. These novel data streams can tie modeling outputs directly to human activities, particularly in difficult to observe urban areas. In addition, crowdsourced data can provide invaluable observations for model input, especially if data are available on both the presence and absence of phenomena.
Social environmental monitoring data can provide useful information, particularly in areas of human activity, as long as limitations in spatial sampling are taken into account. However, by their very nature, crowdsourced data are opportunistic and their collections are biased towards heavily populated areas. This is an intrinsic limitation in observing broad trends which makes the use of crowdsourced data less applicable in rural areas, or in areas where the socio-economic condition of the population makes the area less likely to contribute data. It might not be possible to ensure that opportunistic data show a complete trend of a phenomenon despite the presence of valid observations. This finding supports the argument that crowdsourced data be used to augment traditional sources.
Further research is needed into the potential for decreased reports in areas of severe impact as it is speculated that those most impacted would be focused more on survival than on reporting. In these cases, contributions would not be available so an automated system set up to crowdsourced reports would fail to augment traditional sources when people are unable to report. The concern is that certain regions and vulnerable populations might not be represented by the severity of conditions indicated by crowdsourced data. However, this concern might not apply to some social sources during crises, such as community search and rescue platforms, in these cases, the submissions are from severely impacted people who need help. In addition, it is possible that an understanding of this baseline relationship could be used as an indicator of severe conditions.
Crowdsourcing projects are uniquely situated to educate the public about environmental harms, and these networks can improve community resilience. When the population is more active during disasters, they produce actionable data. The crowd becomes an essential asset to help communities recover faster from environmental harms.
Author Contributions
Conceptualization, C.H. and G.C.; methodology, C.H.; validation, C.H.; formal analysis, C.H.; investigation, C.H.; data curation, C.H.; writing—original draft preparation, C.H.; writing—review and editing, C.H. and G.C.; visualization, C.H.; supervision, G.C. All authors have read and agreed to the published version of the manuscript.
Funding
This research received no external funding.
Acknowledgments
The authors recognize the humanitarian efforts of the many individuals and organizations who provided data during Hurricane Florence. The authors of this paper are not the originators of the raw data and strive to properly reference these public sources of data in the text while producing original analysis.
Conflicts of Interest
The authors declare no conflict of interest.
Abbreviations
The following abbreviations are used in this manuscript:
| FEMA | U.S. Federal Emergency Management Agency |
| GIS | Geographic Information System |
| NASA | U.S. National Aeronautics and Space Administration |
| NOAA | U.S. National Oceanic and Atmospheric Administration |
| SAR | Synthetic Aperature Radar |
| USGS | U.S. Geological Survey |
| VGI | Volunteered Geographic Information |
References
- Hultquist, C.; Sava, E.; Cervone, G.; Waters, N. Damage Assessment of the Urban Environment during Disasters using Volunteered Geographic Information. In Big Data for Regional Science; Shintler, L., Chen, Z., Eds.; CRC Press: Boca Raton, FL, USA, 2017; Chapter 18. [Google Scholar]
- Bonney, R.; Shirk, J.L.; Phillips, T.B.; Wiggins, A.; Ballard, H.L.; Miller-Rushing, A.J.; Parrish, J.K. Citizen science: Next steps for citizen science. Science 2014, 343, 1436–1437. [Google Scholar] [CrossRef]
- Poblet, M. Crowdsourcing roles, methods and tools for data-intensive disaster management. Inf. Syst. Front. 2018, 20, 1363–1379. [Google Scholar] [CrossRef]
- Crowley, J. Connecting Grassroots and Government for Disaster Response; Technical Report; Woodrow Wilson International Center for Scholars Commons Lab: Washington, DC, USA, 2013. [Google Scholar]
- Shirk, J.L.; Bonney, R. Citizen Science Framework Review: Informing a Framework for Citizen Science within the US Fish and Wildlife Service; Technical Report November; US Fish and Wildlife Service: Washington, DC, USA, 2015.
- Schade, S.; Díaz, L.; Ostermann, F.; Spinsanti, L.; Luraschi, G.; Cox, S.; Nuñez, M.; Longueville, B.D. Citizen-based sensing of crisis events: Sensor web enablement for volunteered geographic information. Int. J. Appl. Geomath. 2013, 5, 3–18. [Google Scholar] [CrossRef] [Green Version]
- Ottinger, G. Buckets of Resistance: Standards and the Effectiveness of Citizen Science. Sci. Technol. Hum. Values 2010, 35, 244–270. [Google Scholar] [CrossRef]
- Buytaert, W.; Zulkafli, Z.; Grainger, S.; Acosta, L.; Alemie, T.C.; Bastiaensen, J.; De Bievre, B.; Bhusal, J.; Clark, J.; Dewulf, A.; et al. Citizen science in hydrology and water resources: Opportunities for knowledge generation, ecosystem service management, and sustainable development. Front. Earth Sci. 2014, 2, 1–21. [Google Scholar] [CrossRef] [Green Version]
- Tidball, K.; Krasny, M. A role for citizen science in disaster and conflict recovery and resilience. In Citizen Science: Public Participation in Environmental Research; Cornell University Press: Tthaca, NY, USA, 2012; pp. 1–9. [Google Scholar]
- Boatwright, J.; Phillips, E. Exploiting the Demographics of Did You Feel It?: Responses to Estimate the Felt Area of Moderate Earthquakes in California. Seismol. Res. Lett. 2017, 88, 335–341. [Google Scholar] [CrossRef]
- Haklay, M. Citizen Science and Volunteered Geographic Information—Overview and typology of participation. In Crowdsourcing Geographic Knowledge: Volunteered Geographic Information (VGI) in Theory and Practice; Springer: Berlin/Heidelberg, Germany, 2013; pp. 105–122. [Google Scholar] [CrossRef]
- Seymour, V.; Regalado, C. Extreme citizen science (excites): One end of the citizen science spectrum. In Proceedings of the British Hydrological Society South East Section Meeting, Cardiff, UK, 24–25 June 2014. [Google Scholar]
- Elmore, K.L.; Flamig, Z.L.; Lakshmanan, V.; Kaney, B.T.; Farmer, V.; Reeves, H.D.; Rothfusz, L.P. MPING: Crowd-Sourcing Weather Reports for Research. Bull. Am. Meteorol. Soc. 2014, 95, 1335–1342. [Google Scholar] [CrossRef]
- Fritz, A. Thousands of Birds Got Trapped in Hurricane Hermine’s Eye; WP Company LLC: Washington, DC, USA, 2016. [Google Scholar]
- Suyundikov, A.; Symanzik, J. A graphical assessment and spatial clustering of the Deepwater Horizon oil spill impact on Laughing Gulls. Environ. Ecol. Stat. 2017, 24, 297–316. [Google Scholar] [CrossRef]
- Kinchy, A.; Parks, S.; Jalbert, K. Fractured knowledge: Mapping the gaps in public and private water monitoring efforts in areas affected by shale gas development. Environ. Plan. C Gov. Policy 2016, 34, 879–899. [Google Scholar] [CrossRef]
- McCormick, S. After the Cap: Risk Assessment, Citizen Science and Disaster Recovery. Ecol. Soc. 2012, 17, 31. [Google Scholar] [CrossRef] [Green Version]
- Zook, M.; Graham, M.; Shelton, T.; Gorman, S. Volunteered Geographic Information and Crowdsourcing Disaster Relief: A Case Study of the Haitian Earthquake. World Med. Health Policy 2010, 2, 7–33. [Google Scholar] [CrossRef] [Green Version]
- Gengler, S.; Bogaert, P.; Gengler, S.; Bogaert, P. Integrating Crowdsourced Data with a Land Cover Product: A Bayesian Data Fusion Approach. Remote Sens. 2016, 8, 545. [Google Scholar] [CrossRef] [Green Version]
- Hultquist, C.; Cervone, G. Comparison of simulated radioactive atmospheric releases to citizen science observations for the Fukushima nuclear accident. Atmos. Environ. 2019, 198, 478–488. [Google Scholar] [CrossRef]
- Longueville, B.D.; Commission, E.; Smits, P.C.; Commission, E.; Peedell, S.; Commission, E.; Groeve, T.D.; Commission, E. Citizens as Sensors for Natural Hazards: A VGI integration Workflow. Geomatica 2010, 64, 41–59. [Google Scholar]
- De Albuquerque, J.P.; Herfort, B.; Brenning, A.; Zipf, A. A geographic approach for combining social media and authoritative data towards identifying useful information for disaster management. Int. J. Geogr. Inf. Sci. 2015, 29, 1–23. [Google Scholar] [CrossRef] [Green Version]
- Storey, R.G.; Wright-stow, A.; Kin, E.; Davies-colley, R.J.; Stott, R. Volunteer stream monitoring: Do the data quality and monitoring experience support increased community involvement in freshwater decision making? Ecol. Soc. 2016, 21, 32. [Google Scholar] [CrossRef] [Green Version]
- Hadj-Hammou, J.; Loiselle, S.; Ophof, D.; Thornhill, I. Getting the full picture: Assessing the complementarity of citizen science and agency monitoring data. PLoS ONE 2017, 12, e0188507. [Google Scholar] [CrossRef] [Green Version]
- Shelton, T.; Poorthuis, A.; Graham, M.; Zook, M. Mapping the data shadows of Hurricane Sandy: Uncovering the sociospatial dimensions of ‘big data’. Geoforum 2014, 52, 167–179. [Google Scholar] [CrossRef]
- Dumitru, C.O.; Cui, S.; Faur, D.; Datcu, M. Data Analytics for Rapid Mapping: Case Study of a Flooding Event in Germany and the Tsunami in Japan Using Very High Resolution SAR Images. IEEE J. Sel. Top. Appl. Earth Obs. Remote Sens. 2015, 8, 114–129. [Google Scholar] [CrossRef]
- Preis, T.; Moat, H.S.; Bishop, S.R.; Treleaven, P.; Stanley, H.E. Quantifying the digital traces of Hurricane Sandy on Flickr. Sci. Rep. 2013, 3, 3141. [Google Scholar] [CrossRef] [Green Version]
- Hultquist, C.; Simpson, M.; Huang, Q.; Cervone, G. Using Nightlight Remote Sensing Imagery and Twitter Data to Study Power Outages. ACM SIGSPATIAL Proc. 2015, 1–6. [Google Scholar] [CrossRef]
- Schnebele, E.; Cervone, G. Improving remote sensing flood assessment using volunteered geographical data. Nat. Hazards Earth Syst. Sci. 2013, 13, 669–677. [Google Scholar] [CrossRef] [Green Version]
- Schnebele, E.; Cervone, G.; Waters, N. Road assessment after flood events using non-authoritative data. Nat. Hazards Earth Syst. Sci. 2014, 14, 1007–1015. [Google Scholar] [CrossRef] [Green Version]
- Sava, E.; Clemente-Harding, L.; Cervone, G. Supervised classification of civil air patrol (CAP). Nat. Hazards 2017, 86, 535–556. [Google Scholar] [CrossRef]
- Tomaszewski, B.; MacEachren, A.M. Geovisual analytics to support crisis management: Information foraging for geo-historical context. Inf. Vis. 2012, 11, 339–359. [Google Scholar] [CrossRef]
- Fohringer, J.; Dransch, D.; Kreibich, H.; Schröter, K. Social media as an information source for rapid flood inundation. Nat. Hazards Earth Syst. Sci. (NHESS) 2015, 15, 2725–2738. [Google Scholar] [CrossRef] [Green Version]
- Le Coz, J.; Patalano, A.; Collins, D.; Federico, N.; Marcelo, C.; Smart, G.M.; Bind, J.; Chiaverini, A.; Le, R.; Dramais, G.; et al. Crowdsourced data for flood hydrology: Feedback from recent citizen science projects in Argentina, France and New Zealand. J. Hydrol. 2016, 541, 766–777. [Google Scholar] [CrossRef] [Green Version]
- Tzavella, K.; Fekete, A.; Fiedrich, F. Opportunities provided by geographic information systems and volunteered geographic information for a timely emergency response during flood events in Cologne, Germany. Nat. Hazards 2018, 91, 29–57. [Google Scholar] [CrossRef]
- Doherty, P.; Arkison, E.; Zelman-Fahm, D.; San Souci, J.; Leon, M.; Torpey, H. Volunteers Contribute to Hurricane Florence Crowdsourcing and Flood Estimation Efforts. 2 November 2018. Available online: https://www.giscorps.org/napsg_243/ (accessed on 12 January 2020).
- ArcNews: Weathering Hurricane Florence. 22 January 2019. Available online: https://www.napsgfoundation.org/arcnews-weathering-hurricane-florence/ (accessed on 12 January 2020).
- Feaster, T.D.; Weaver, J.C.; Gotvald, A.J.; Kolb, K.R. Preliminary Peak Stage and Streamflow Data at Selected U.S. Geological Survey Streamgaging Stations in North and South Carolina for Flooding Following Hurricane Florence, September 2018; Technical Report September; USGS: Reston, VA, USA, 2018.
- USGS. USGS Flood Event Viewer: Providing Hurricane and Flood Response Data. 2 November 2018. Available online: https://www.usgs.gov/mission-areas/water-resources/science/usgs-flood-event-viewer-providing-hurricane-and-flood-response (accessed on 12 January 2020).
- FilteredInstruments.csv. United States Geological Survey. 7 October 2018. Available online: https://stn.wim.usgs.gov/FEV/#FlorenceSep2018 (accessed on 12 January 2020).
- Pacific Northwest National Lab. RIFT Model Flood Extent. 2 October 2018. Available online: https://disasters.geoplatform.gov/publicdata/NationalDisasters/HurricaneFlorence/Data/PNNL_RIFT_FloodExtent/ (accessed on 12 January 2020).
- Pacific Northwest National Lab. PNNL RIFT Flood Depth Grids. 10 October 2019. Available online: https://communities.geoplatform.gov/disasters/pnnl-rift-flood-products-midwest-flooding/ (accessed on 12 January 2020).
- NASA-JPL/Caltech ARIA Team. NASA Disaster’s Website: Hurricane Florence 2018. 3 October 2018. Available online: https://disasters.nasa.gov/hurricane-florence-2018/hurricane-florence-resources-aria-flood-extent-maps (accessed on 12 January 2020).
- Clement, M.; Kilsby, C.; Moore, P. Multi-temporal synthetic aperture radar flood mapping using change detection. Flood Risk Manag. 2017. [Google Scholar] [CrossRef]
- NASA-JPL/Caltech ARIA Team. JPL ARIA Data Share Site: Hurricane Florence 2018. 3 October 2018. Available online: https://aria-share.jpl.nasa.gov/201809-Hurricane_Florence/FPM/ (accessed on 12 January 2020).
- Walker, D.; Forsythe, N.; Parkin, G.; Gowing, J. Filling the observational void: Scientific value and quantitative validation of hydrometeorological data from a community-based monitoring programme. J. Hydrol. 2016, 538, 713–725. [Google Scholar] [CrossRef] [Green Version]
- Ramirez, J.A.; Lichter, M.; Coulthard, T.J.; Skinner, C. Hyper-resolution mapping of regional storm surge and tide flooding: Comparison of static and dynamic models. Nat. Hazards 2016, 82, 571–590. [Google Scholar] [CrossRef]
- Brenton, P.; von Gaval, S.; Vogel, E.; Lecoq, M.E. Technology infrastructure for citizen science. In Citizen Science: Innovation in Open Science, Society and Policy; UCL Press: London, UK, 2018; pp. 63–80. [Google Scholar]
- Haklay, M.M.; Antoniou, V.; Basiouka, S.; Soden, R.; Mooney, P. Crowdsourced Geographic Information Use in Government; Technical Report; World Bank’s Global Facility for Disaster Reduction and Recovery (GFDRR): London, UK, 2014. [Google Scholar]
- Cai, L.; Zhu, Y. The Challenges of Data Quality and Data Quality Assessment in the Big Data Era. Data Sci. J. 2015, 14, 1–10. [Google Scholar] [CrossRef]
- Liu, S. GeoDC - 2019 03 - Sophia Liu - USGS Support to FEMA Crowdsourcing Unit. 19 March 2019. Available online: https://www.youtube.com/watch?v=XcUpOn0NmGI (accessed on 12 January 2020).
- Hultquist, C.; Cervone, G. Citizen monitoring during hazards: Validation of Fukushima radiation measurements. GeoJournal 2017. [Google Scholar] [CrossRef]
- Riesch, H.; Potter, C. Citizen science as seen by scientists: Methodological, epistemological and ethical dimensions. Public Underst. Sci. 2014, 23, 107–120. [Google Scholar] [CrossRef]
- Hemmi, A.; Graham, I. Hacker science versus closed science: Building environmental monitoring infrastructure. Inf. Commun. Soc. 2014, 17, 830. [Google Scholar] [CrossRef]
Figure 1.
Raster visualization and location symbols of flood depths derived from crowdsourced images.
Figure 1.
Raster visualization and location symbols of flood depths derived from crowdsourced images.

Figure 2.
Raster visualization and location symbols of USGS streamgages.

Figure 3.
Raster visualization and location symbols of USGS high-water marks (HWM).

Figure 4.
Raster visualization of flood model.

Figure 5.
Raster visualization of ARIA derived flooding.
Figure 6.
This flowchart provides an overview of the conceptual framing and methodological approach of the research.
Figure 6.
This flowchart provides an overview of the conceptual framing and methodological approach of the research.
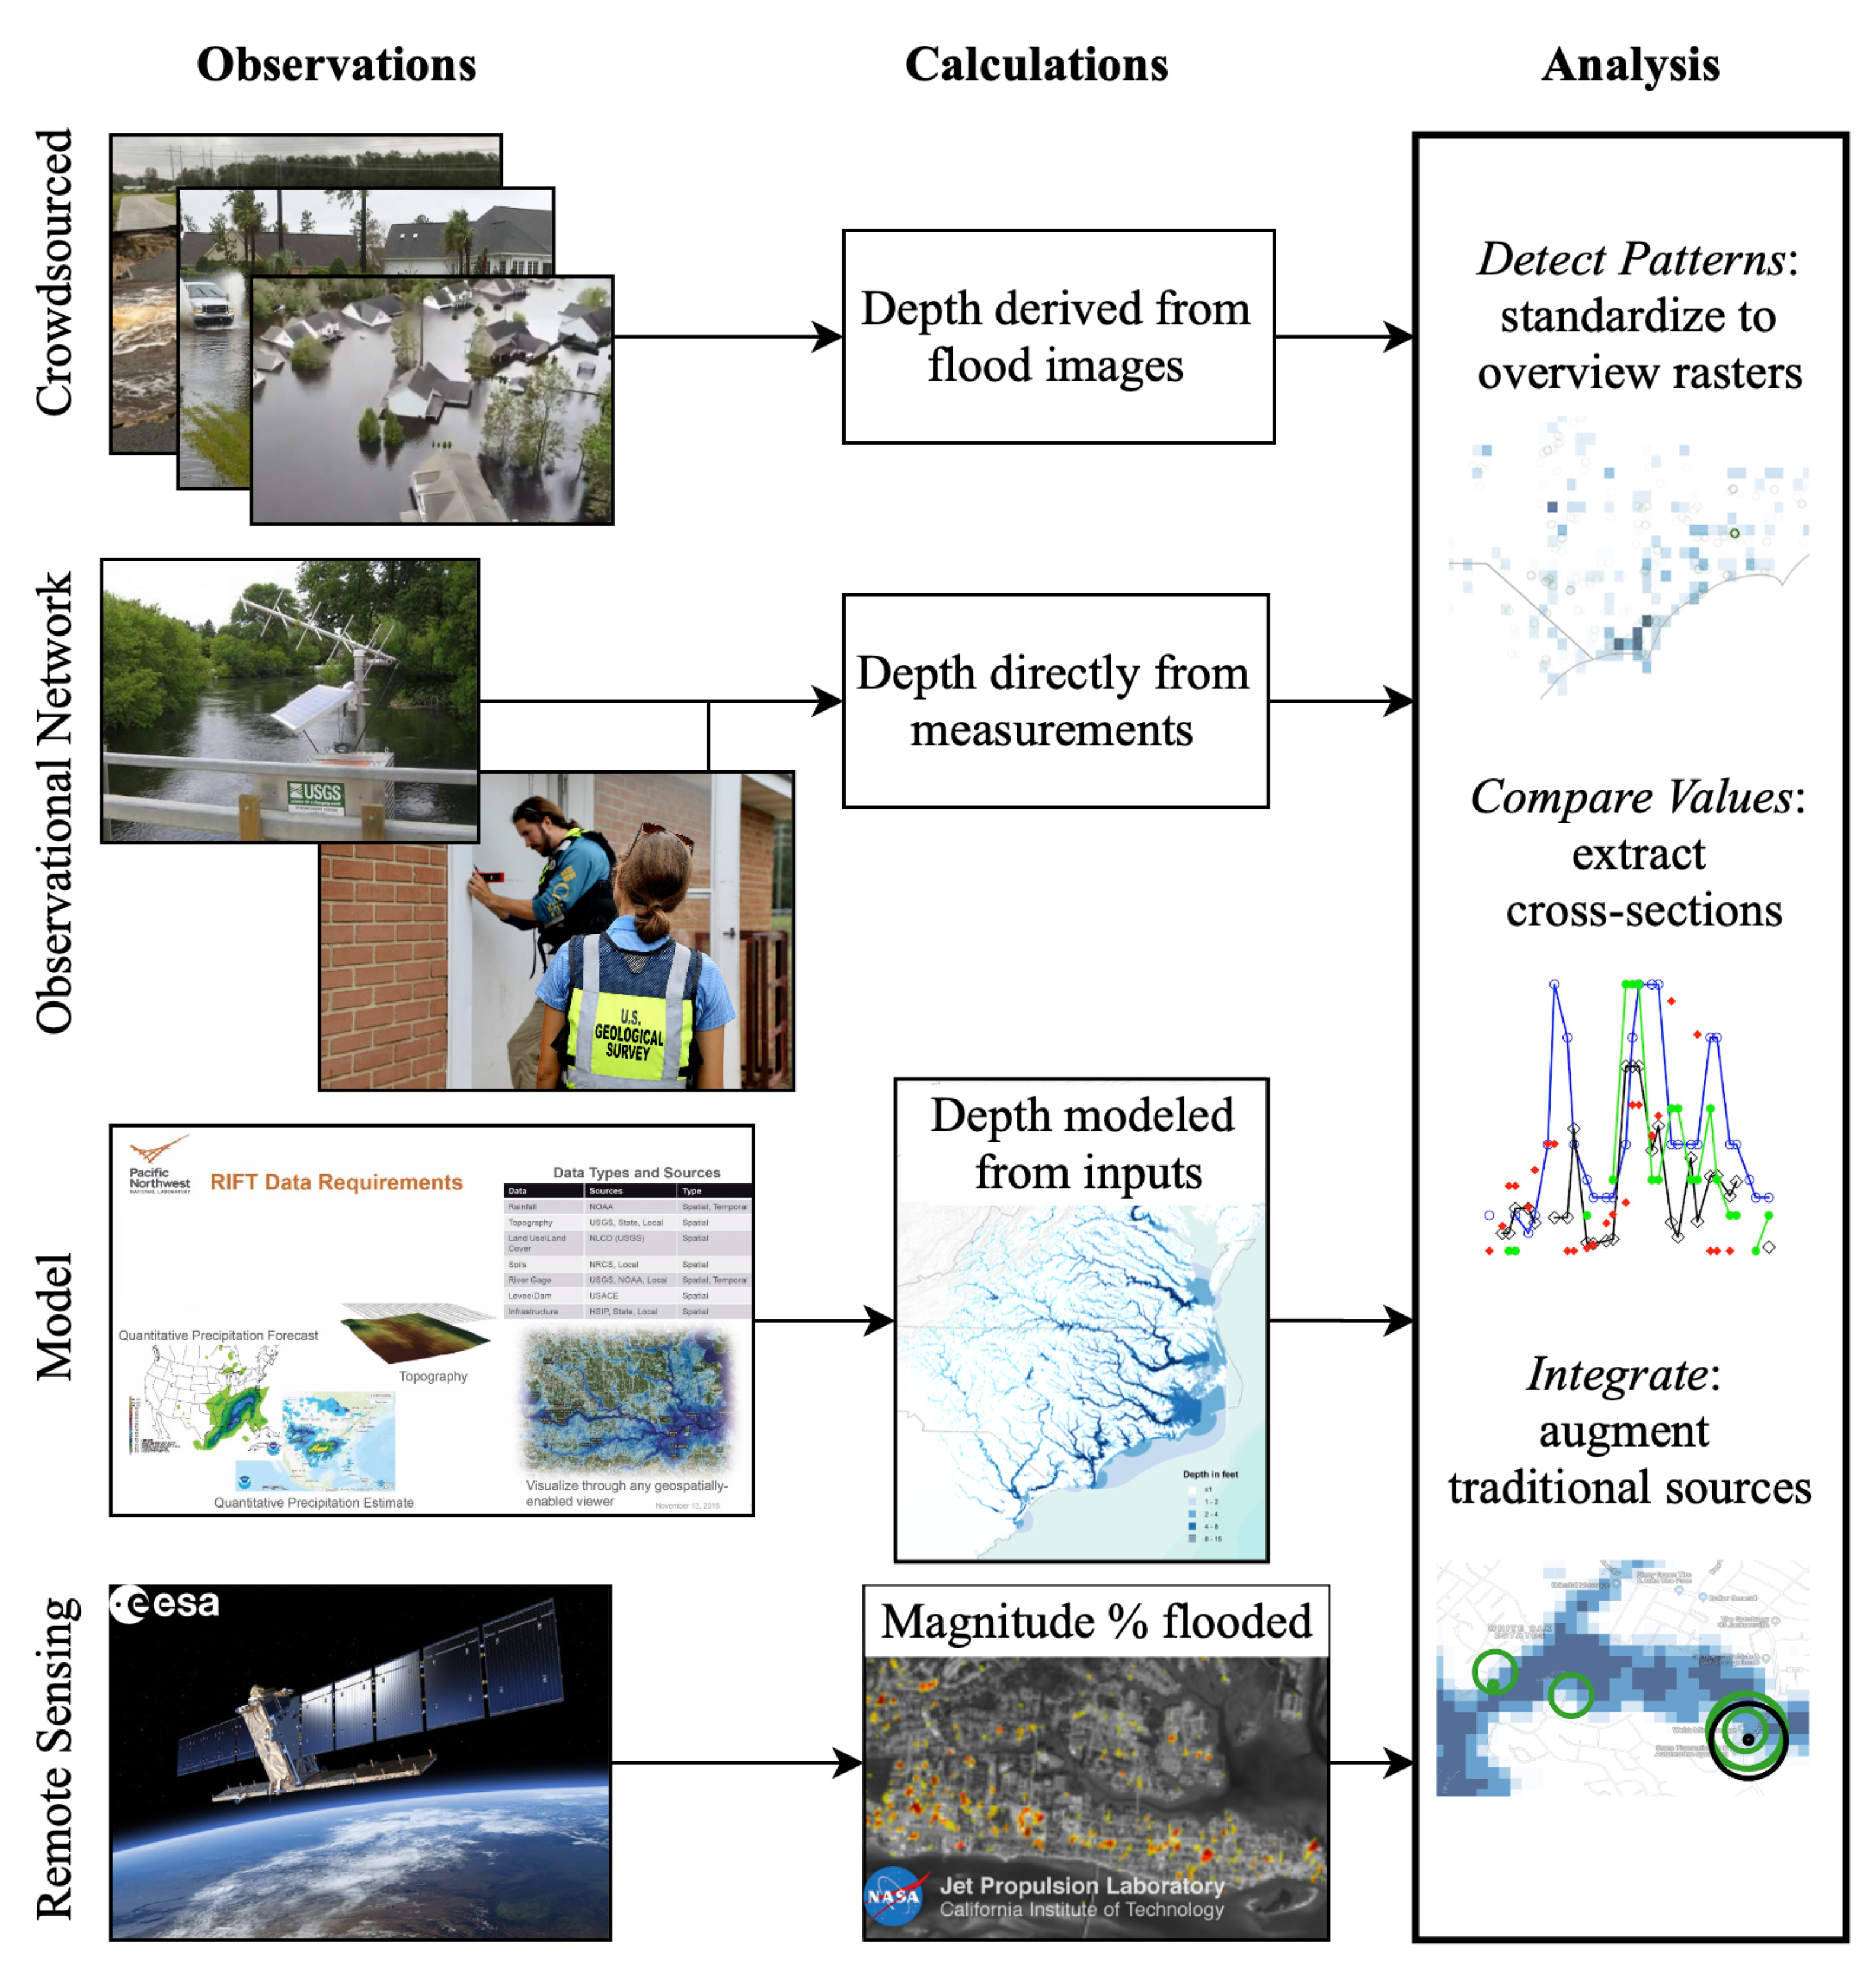
Figure 7.
Cross-section line locations overlaid on flood sources (a) crowdsourced image derived flood depth, (b) USGS HWM and Gage Peak, (c) RIFT flood model, and (d) ARIA % of area likely flooded.
Figure 7.
Cross-section line locations overlaid on flood sources (a) crowdsourced image derived flood depth, (b) USGS HWM and Gage Peak, (c) RIFT flood model, and (d) ARIA % of area likely flooded.

Figure 8.
Comparison of cross-section lines: (a) Line 1, (b) Line 2, (c) Line 3, and (d) Line 4.

Figure 9.
Visualization of the flood depth as derived from crowdsourced images overlaid on the predicted level of flooding from the RIFT model.
Figure 9.
Visualization of the flood depth as derived from crowdsourced images overlaid on the predicted level of flooding from the RIFT model.

Figure 10.
Comparison of flood depth from Crowdsourced, USGS, and RIFT model in New Bern, NC.

Figure 11.
Comparison of flood depth in Boiling Spring Lakes, SC.


Table 1.
Summary of the specified data sources for the study area in relation to Hurricane Florence.
Table 1.
Summary of the specified data sources for the study area in relation to Hurricane Florence.
| Crowdsourced | Observation Network | Model | Remote Sensing | |
|---|---|---|---|---|
| File Format | Shapefile | CSV | Geodatabase | GeoTIFF |
| Quantity | 538 | 677 | N/A | N/A |
| Spatial Resolution | N/A | N/A | 90 m | 30 m |
| Temporal Resolution | Throughout the event, but not consistent | Regular intervals | Daily prediction | At 4th, 84th, and 104th hour of event |
| Latency | Near real-time photos, time required to process depth | Some gages immediately, HWM within weeks | Prior to the time predicted | Within a day, but hours after observation |
© 2020 by the authors. Licensee MDPI, Basel, Switzerland. This article is an open access article distributed under the terms and conditions of the Creative Commons Attribution (CC BY) license (http://creativecommons.org/licenses/by/4.0/).
Share and Cite
MDPI and ACS Style
Hultquist, C.; Cervone, G. Integration of Crowdsourced Images, USGS Networks, Remote Sensing, and a Model to Assess Flood Depth during Hurricane Florence. Remote Sens. 2020, 12, 834. https://doi.org/10.3390/rs12050834
AMA Style
Hultquist C, Cervone G. Integration of Crowdsourced Images, USGS Networks, Remote Sensing, and a Model to Assess Flood Depth during Hurricane Florence. Remote Sensing. 2020; 12(5):834. https://doi.org/10.3390/rs12050834
Chicago/Turabian StyleHultquist, Carolynne, and Guido Cervone. 2020. "Integration of Crowdsourced Images, USGS Networks, Remote Sensing, and a Model to Assess Flood Depth during Hurricane Florence" Remote Sensing 12, no. 5: 834. https://doi.org/10.3390/rs12050834
Note that from the first issue of 2016, this journal uses article numbers instead of page numbers. See further details here.