Article

Building Extraction from Terrestrial Laser Scanning Data with Density of Projected Points on Polar Grid and Adaptive Threshold

1
School of Civil Engineering, Chongqing Jiaotong University, Chongqing 400074, China
2
School of Computer Science, Hubei University of Technology, Wuhan 430068, China
*
Author to whom correspondence should be addressed.
Remote Sens. 2021, 13(21), 4392; https://doi.org/10.3390/rs13214392
Submission received: 10 September 2021 / Revised: 28 October 2021 / Accepted: 29 October 2021 / Published: 31 October 2021
(This article belongs to the Special Issue Laser Scanning and Point Cloud Processing in Urban Environments)

Abstract

:
The extraction of building information with terrestrial laser scanning (TLS) has a number of important applications. As the density of projected points (DoPP) of facades is commonly greater than for other types of objects, building points can be extracted based on projection features. However, such methods usually suffer from density variation and parameter setting, as illustrated in previous studies. In this paper, we present a building extraction method for single-scan TLS data, mainly focusing on those problems. To adapt to the large density variation in TLS data, a filter using DoPP is applied on a polar grid, instead of a commonly used rectangular grid, to detect facade points. In DoPP filtering, the threshold to distinguish facades from other objects is generated adaptively for each cell by calculating the point number when placing the lowest building in it. Then, the DoPP filtering result is further refined by an object-oriented decision tree mainly based on grid features, such as compactness and horizontal hollow ratio. Finally, roof points are extracted by region growing on the non-facade points, using the highest point in each facade cell as a seed point. The experiments are conducted on two datasets with more than 1.7 billion points and with point density varying from millimeter to decimeter levels. The completeness and correctness of the first dataset containing more than 50 million points are 91.8% and 99.8%, with a running time of approximately 970 s. The second dataset is Semantic3D, of which the point number, completeness and correctness are about 1.65 billion, 90.2% and 94.5%, with a running time of about 14,464 s. The test shows that the proposed method achieves a better performance than previous grid-based methods and a similar level of accuracy to the point-based classification method and with much higher efficiency.

Graphical Abstract

1. Introduction

Building extraction is important for many applications, such as 3D reconstruction, disaster management, urban analysis and change detection [1,2,3,4]. Laser scanning can be used to acquire accurate and dense 3D points from a target surface and has unique advantages when it comes to building measurement, extraction and reconstruction. As the scanning scenes commonly contain a number of varied objects with different densities and sizes, as well as complicated and incomplete structures, extracting building points from laser scanning data is an important step in the utilization of building information.
Airborne laser scanning (ALS) is a widely used scanning system and has received considerable attention in building detection [5,6,7,8,9], but facade information is often missed in ALS data. As important supplements to ALS data, mobile laser scanning (MLS) and terrestrial laser scanning (TLS) can provide detailed scanning data from side views. Although many building extraction methods are suitable for both types of data because of similar scan geometry and range, those two techniques have different characteristics: MLS can cover a much larger area as the scanner is mounted on a vehicle, while the TLS scanner setup is more flexible [10], e.g., it can be set up in a place where a vehicle cannot reach. In this paper, we focus on building point extraction in TLS data.
As most buildings are mainly composed of planes, a natural line of thought is to apply plane segmentation methods for building extraction, such as region growing algorithms and point clustering algorithms. Pu and Vosselman [11] adopted a surface growing method to segment TLS data into planar patches and identified building patches based on semantic features, e.g., orientation and density. Yang and Dong [12] labeled each point in the MLS data collected as linear, planar or spherical in type and defined specific merging rules for each type in a region growing method. Then, the resulted segments were refined based on the normalized cuts [13] and merged for object extraction. In [14], wall segments were extracted by region growing and projected to form 2D wall rectangles. The buildings in the scene were then localized with a hypothesis and selection method. At each building position, they distinguished building points from surroundings via a min-cut-based segmentation, with both local geometric features and shape priors considered.
Building extraction methods using point-based segmentation commonly have heavy computing costs, as the computations have to be executed point by point, e.g., feature extraction and neighbor search. To improve the efficiency and reduce the memory requirement, many researchers apply the segmentation method on voxel level. Lim and Suter [15] over-segmented TLS data into voxels and utilized a conditional random field method to classify the voxels. Aijazi et al. [16] divided original points into voxels having different sizes and merged the voxels with similar properties to represent different objects. The building objects can then be identified based on the analysis of the object descriptors, e.g., normal vector and geometrical shape. Yang et al. [17] proposed an urban object extraction method based on multi-scale supervoxels. Supervoxel segmentation was applied to form larger segments and those segments were further merged into meaningful objects according to predefined rules. Common types of urban objects can be recognized based on the segmentation results.
The building extraction based on segmentation commonly follows a process that converts the points or voxels to segments or objects and then assigns a specific category (e.g., building, car and vegetation) to each segment or object. These methods can achieve good extraction results when the predefined merging or segmenting rules are suitable. However, the rules working well for a given scene may be inapplicable to other scenes. Additionally, segmentation itself is still a difficult and open problem especially when it comes to handling complex scenes [17].
Instead of utilizing point segmentation methods in 3D space, some researchers directly design building extraction strategies based on the spatial characteristics of a building in a horizontal 2D grid. As the projection of facade points on a horizontal plane has a more concentrated contribution than other objects, many grid-based methods are proposed. Li et al. [18] projected point clouds onto a horizontal grid and the quantity of projected points for each grid is regarded as the density of projected points (DoPP). A grid with a higher DoPP than the predefined threshold was identified as a facade object. In the work of [19], a Hough voting space is constructed based on the points with high DoPP and then a K-means algorithm was used to find lines corresponding to different facades. Similarly, the DoPP was also used for building extraction in the research of [20,21,22]. This method is convenient and efficient, but some high non-building objects cannot be removed only using DoPP, such as streetlamps [23], and setting a suitable threshold always needs much parameter tuning. To solve the problem of threshold setting, Cheng et al. [24] gave an intuitive meaning to the threshold by calculating the DoPP when placing the lowest building of a scene at the position of the farthest building. This parameter setting method was also used in the work of [25] for building outline extraction. The main disadvantage of this method is that it requires detailed prior insight into the data to get the necessary information for threshold estimation, e.g., the perpendicular horizontal distance between the scanner and the surface of the farthest building facade.
In addition to DoPP, weighted average elevation was used by [26] to generate geo-referenced feature images from point clouds, and buildings can be extracted via a size-and-shape-constrained boundary extraction method using these images. The height information was also used by [27] in a 2D grid for building extraction. Wang et al. [28] designed a grid feature called horizontal hollow ratio (HHR), which is the ratio of the projected area to the convex hull area of an object. This feature was calculated based on the cell groups projected from 3D voxel segments, and cell groups with lower HHR than the predefined threshold were identified as buildings. This method works well for buildings with multiples walls but can hardly detect buildings with single walls. Compared with segmentation-based methods, grid-based methods change the minimum primitive from point or voxel to cell or pixel, and for this reason they have higher efficiency. As the prior assumptions are mainly based on the characteristics of the vertical distribution of a facade, the grid-based method usually has better generality. Its accuracy, however, is commonly lower, as a cell may contain points from different objects at the same time.
Another line of thought utilizes the profile of the street object for building detection. Yang et al. [29] utilized the distribution characteristics of object profiles to identify multistorey buildings and residential buildings. In their decision rules, the point distribution along the z-axis is more obvious than that in the horizontal plane for a multistorey building, while the opposite is the case for a residential building. Gao and Yang [30] detected empty spaces between buildings through a histogram, with the x-axis corresponding to a sequence of positions and the y-axis corresponding to the point number. Then, independent buildings can be detected based on those empty spaces in a street view. The histogram of point numbers was also created by [14] to separate adjacent buildings in clusters of more than one building. These methods commonly make detailed and specific assumptions about the point distribution, and thus the scope of application is limited.
As buildings are a common type of object in urban scenes, they can also be extracted by a point cloud classification method. Weinmann et al. [31] divided the point cloud classification into four steps, which are: neighborhood selection, feature extraction, feature selection and classification. The neighborhood selection aims to find an optimal neighborhood to describe local geometric features based on, e.g., dimensionality [32] and eigen-entropy [33]. Sometimes, a multi-scale neighborhood is used to avoid comparison between different scales [34,35]. Then, different types of features are extracted to describe the characteristic of the selected neighborhood, e.g., geometric features [31,36,37], RGB colors [38], echo features [39,40] and full-waveform features [41]. For the extracted features, a feature selection method is applied to find compact and robust feature combinations to reduce computational cost and improve classification accuracy [42]. Based on the feature vector, the label of each point is commonly assigned according to a supervised classification method, e.g., Support Vector Machines [43,44] and Random Forest [45]. In some research, the label of each point is decided based on both the feature vector and the neighboring point labels [46,47]. This framework can achieve high accuracy on full category identification when features are designed properly; however, feature extraction and manual sample selection are usually time-consuming. In recent years, deep learning (DL) has been widely studied in various applications and many DL models have also been proposed for point cloud classification, such as PointNet [48] and PointCNN [49]. Utilizing deep learning for point cloud is, however, still an open problem [48], and the hardware requirement methods based on deep learning is usually high. When a building is the main or only target of interest, these classification-based methods may be inconvenient.
In this paper, considering both efficiency and effectiveness, we utilize the density of projected points (DoPP) to extract buildings from TLS data, and focus mainly on three problems:
(1)
Point density variation usually has more of an effect on TLS data than MLS data. The targets in an MLS scene are mainly located on the side of street; thus, the distances from different buildings to the scanner or the trajectory are similar, and the point density is relatively homogeneous. However, the case in a TLS scene can be very different, as the ranges of different objects may vary significantly, e.g., the point spacing may vary from 2 cm to 50 cm in a scene with the angular resolution of 0.02° and the largest scanning distance of 150 m. For each cell, the DoPP depends both on height difference and point density. As point density decreases with the increasing distance [37], it may occur in TLS data that a low but close object has a denser distribution of horizontally projected points than a high object from a long distance. This means that a fixed DoPP threshold may not work for data with large density variation, which holds particularly for TLS data.
(2)
It is hard to construct an intuitive and simple relation between the threshold and the geometric characteristics of a building, making it difficult to set a reasonable DoPP threshold [26]. Some methods partially solve this problem by calculating the point number on the surface of the farthest buildings with the lowest height [24,25]. However, this method requires a thorough knowledge of the scene in order to obtain necessary parameters for threshold calculation, e.g., the perpendicular horizontal distance from the scanner to the farthest building surface and the lowest building height. Moreover, the threshold result is still a fixed value.
(3)
The roof points can hardly be recognized by a DoPP method because the roof is visible from ground view only obliquely and has a more scattered horizontal point distribution.
To address those problems, we propose a method for building point extraction from single-scan TLS data based on a polar grid. The main contributions of this paper are:
(I)
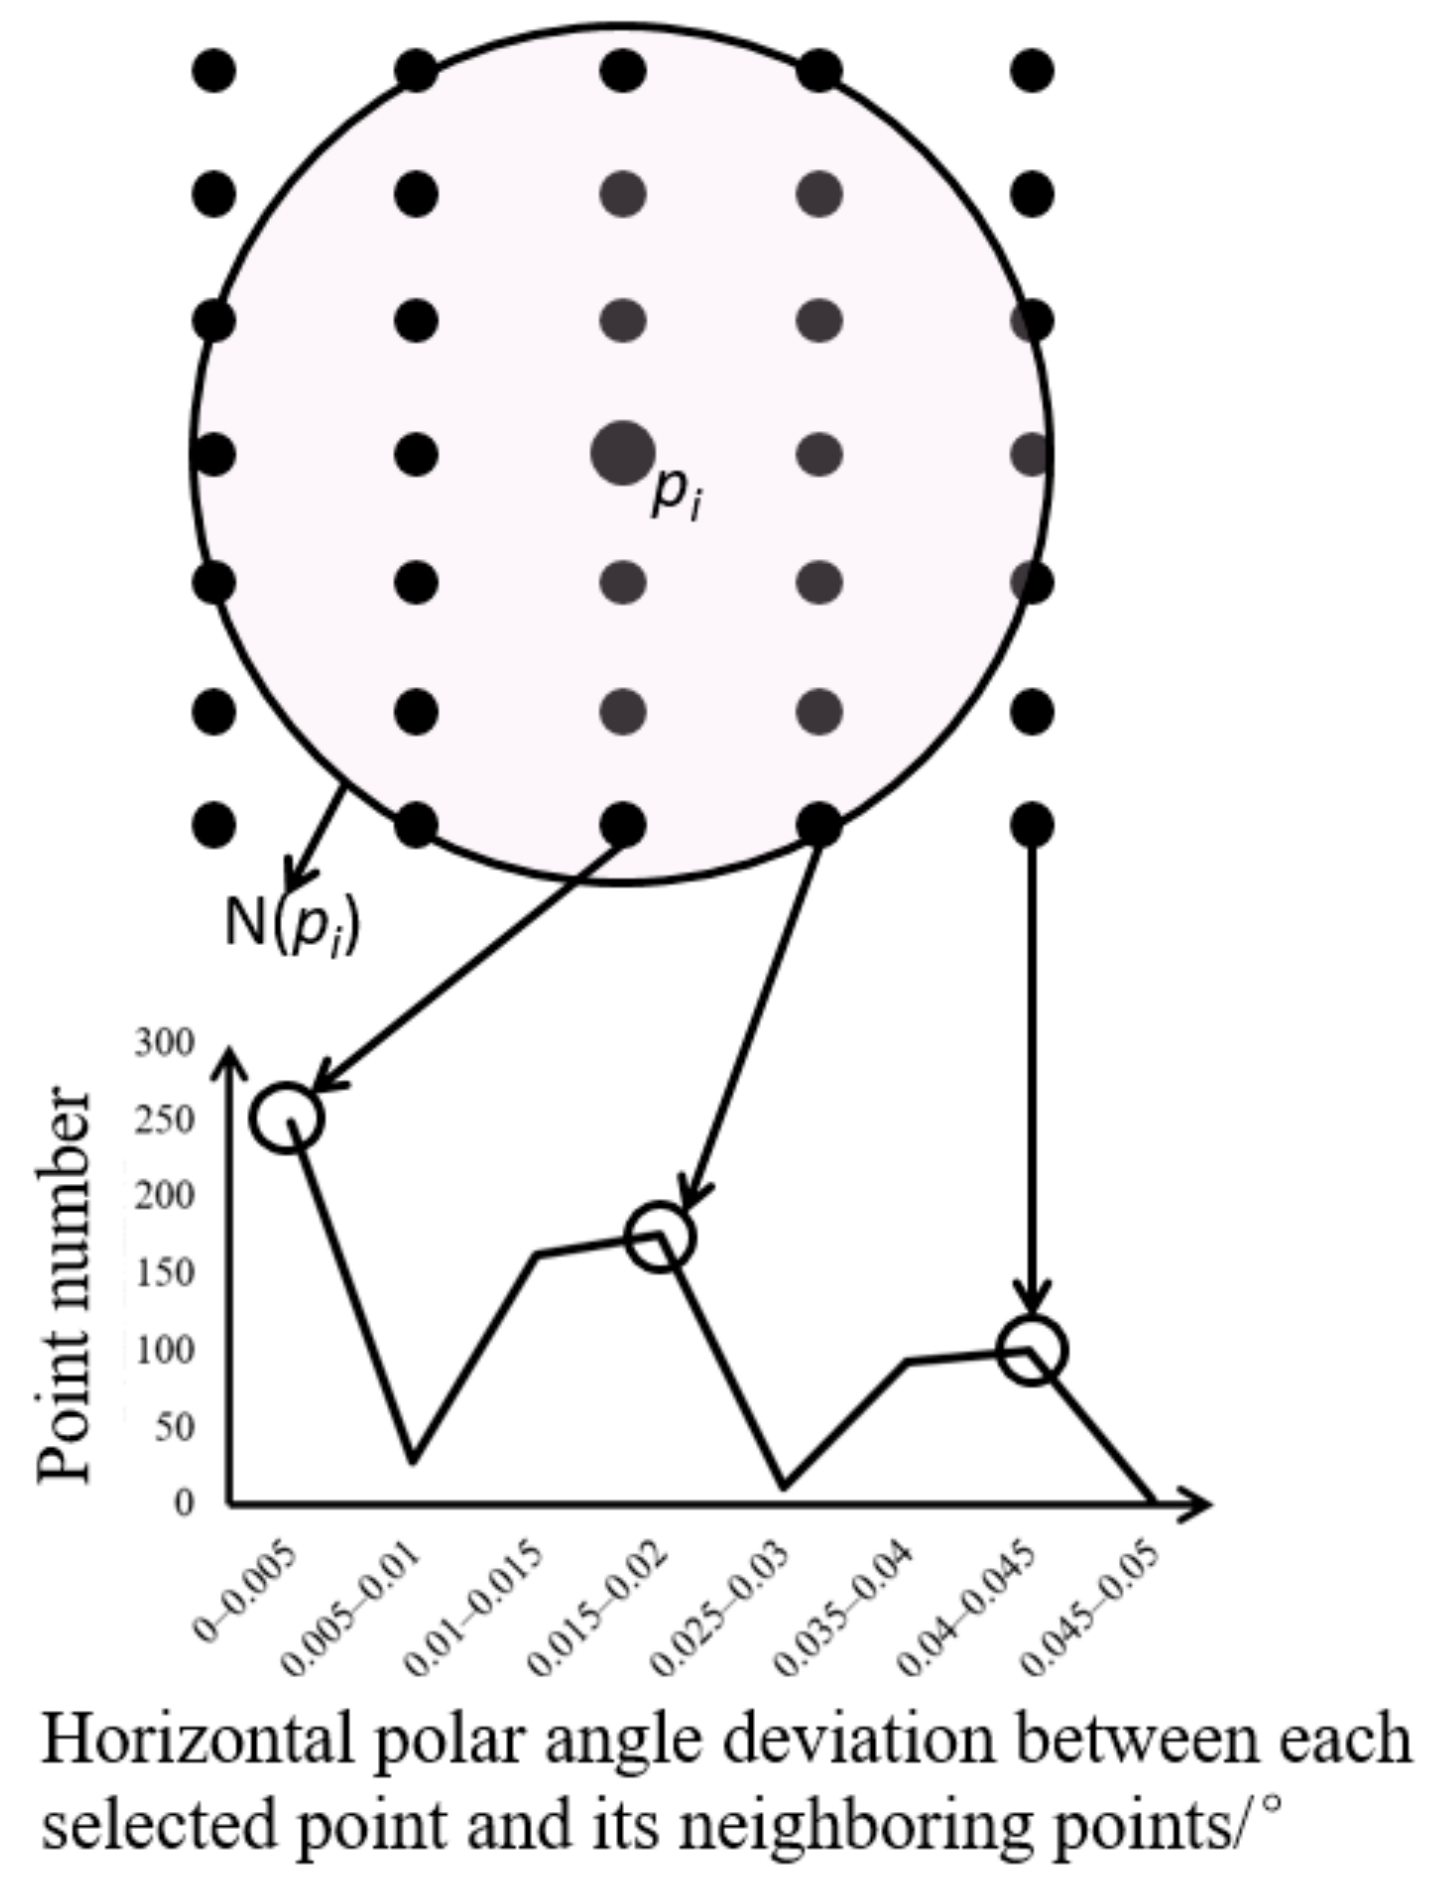
We utilize a polar grid, instead of the commonly used rectangular grid, to adapt to the density variation in TLS data. The polar grid has a more balanced point distribution, as a similar number of laser beams pass through each cell;
(II)
We generate an adaptive DoPP threshold for each cell. After DoPP filtering, we construct an object-oriented decision tree by combining different grid features to further refine the filtering results;
(III)
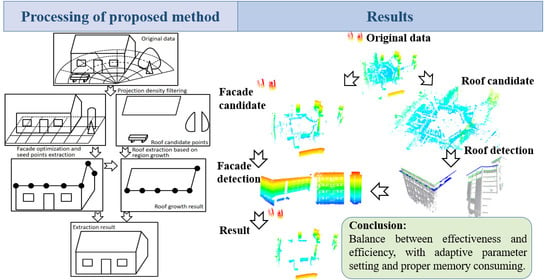
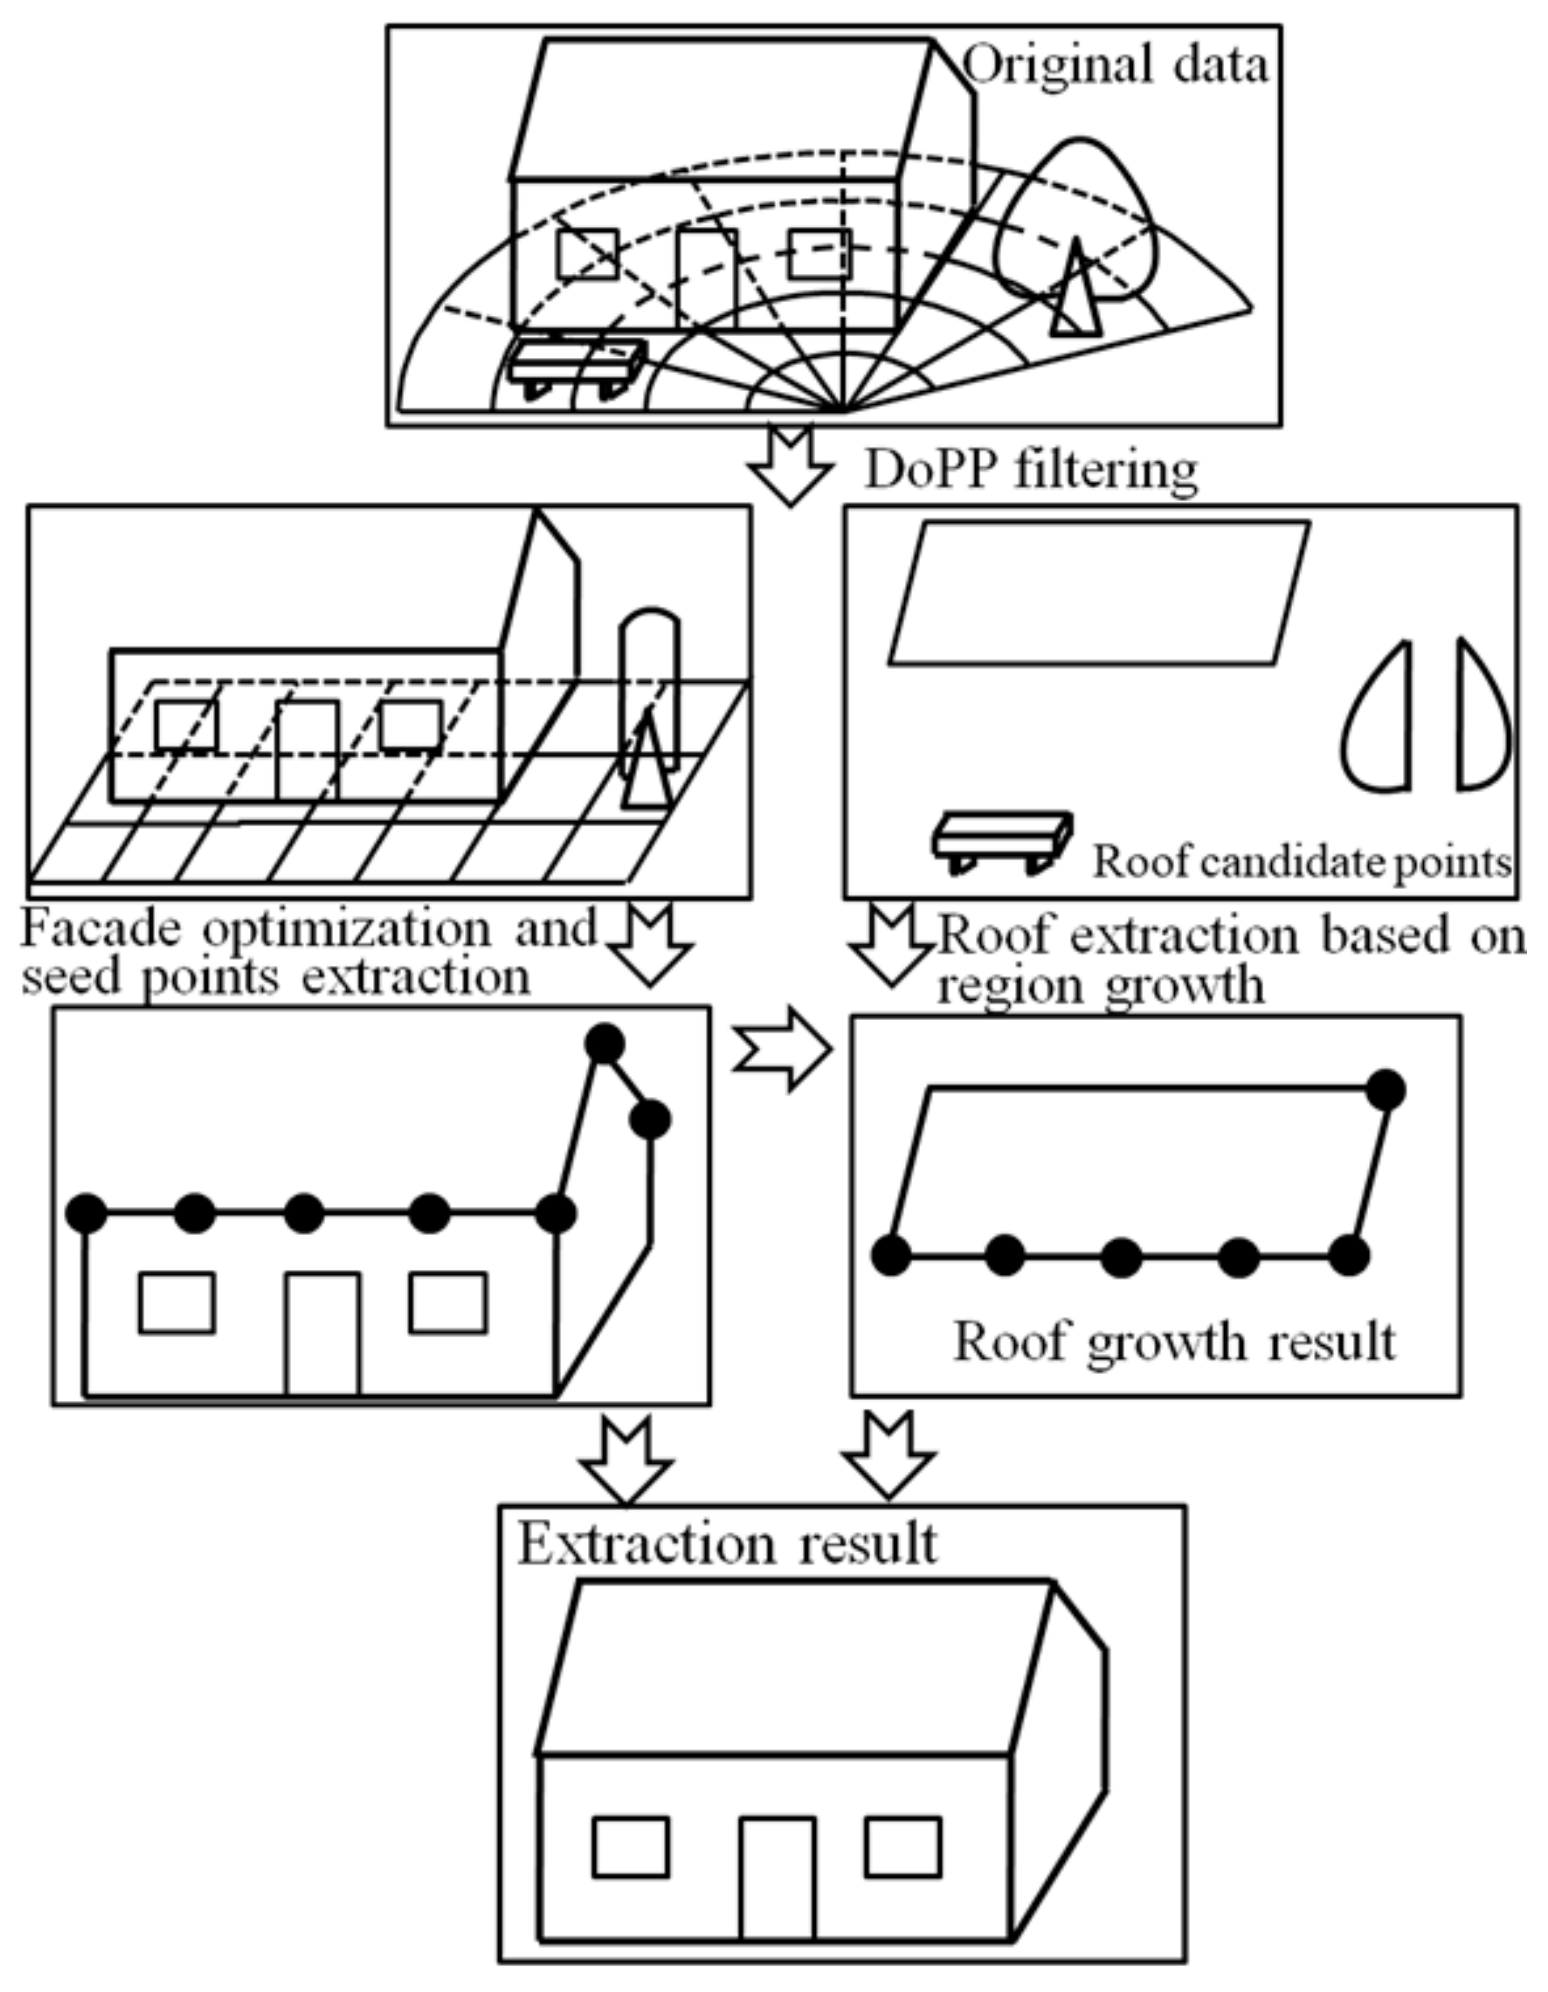
Our method can extract roof points with region growing based on the seed points extracted from the facade points.

2. Methodology

The method proposed in this paper mainly consists of three steps. First, DoPP filtering is applied on the polar gird to filter non-building cells, using an adaptively generated threshold. The preserved points are then filtered further with a series of grid features to distinguish the facade cells from cells consisting of high non-building objects, e.g., pole-like objects and thick tree canopies. Finally, the filtered points in the first step are regarded as roof candidate points and the highest point in each facade cell is used as a seed point. Based on these seed points, region growing is applied to the candidate roof points to extract roof points. The facade points and roof points are combined to form the final extraction result. The process of the proposed method is shown in Figure 1. We follow the assumption common to many previous studies [11,14,19,25] that the scanner is roughly leveled so that the building projection shows more obvious concentration characteristics than other objects on the x-o-y plane. Additionally, the input of our method is defaulted to the original coordinates of single-scan TLS data. In this case, the scan position is the origin of the scanner coordinate system.

2.1. Generation of Polar Grid

The ground points are first removed by Cloth Simulation Filter (CSF) [50] and the remaining points are projected onto the x-o-y plane, with (x, y) coordinates used as projected coordinates. To divide the points into the polar grid, the (x, y) coordinates are firstly converted to polar coordinates:
ρ = x 2 + y 2 θ = a r c cos x / ρ , y 0 2 π a r c cos x / ρ , y < 0
where ρ is the polar radius and θ is the polar angle. Then, points can be divided into polar grids on the x-o-y plane. The bounding box of the polar grid can be determined by the maximum and minimum polar coordinates (ρmin, θmin) and (ρmax, θmax), and the cell size depends on two grid parameters, angular size θG and radial size ρG, as shown in Figure 2. The radial size ρG determines the range of the data in one cell along the direction of the laser beam. The angular size θG is set as an integer multiple of the horizontal angular resolution:
θ G = N θ h
where θh is the horizontal angular resolution of the TLS data, which is the angle between two adjacent laser beams and N is a positive integer, which means the angular size θG is N times that of the horizontal angular resolution. With θG and ρG, the width and height of the polar grid can be calculated as:
W θ = θ m a x θ m i n / θ G + 1 W ρ = ρ m a x ρ m i n / ρ G + 1
where Wθ and Wρ are the angular and radius width, respectively. After the angular and radial width are determined, the cell index of each point can be calculated:
I θ = θ θ m i n / θ G + 1 I ρ = ρ ρ m i n / ρ G + 1
where θ and ρ are the polar coordinates of one point.
The commonly used rectangular grid makes a uniform partition of the x-o-y space. Intuitively, the point number of a cell corresponding to a tall building is obviously larger than other types of objects. However, the point number of each cell declines rapidly in a rectangular grid when the distance to the origin gets larger. Simply setting a threshold of the point number in each cell may lead to failure when it comes to separating buildings and non-building objects. Compared with the rectangular grid, the cell size of the polar grid becomes larger when scanning distance increases; this can compensate for the decreasing trend of point numbers in each cell. Thus, the method can eliminate the effect of density variation brought by the scanning characteristics in TLS data, as shown in Figure 3.
Angular resolution is important to deal with density variation, e.g., relative density is generated for the aim of ground filtering in TLS data, based on theoretical density simulated by angular resolution and scanning range [51]. In contrast, our method adapts to density variation by adjusting the grid size based on angular resolution. According to Equation (2), the angular size is actually based on the horizontal angular resolution, which is a fixed value in scanner settings. When the scanning settings are unknown, it can also be estimated by analyzing the neighborhood of several randomly picked points in the data. In this paper, we randomly select m points and search for the k nearest neighboring (KNN) points for each point. The neighborhood of the i-th point can be represented by:
N p i = p i j ,   j = 1 , 2 k , i = 1 , 2 , m
where pi is the i-th picked point and pij is the j-th point in the neighborhood of pi. The horizontal polar angles of pi and pij can be calculated using Equation (1), labeled as θi and θij respectively. Then we calculate the absolute value of the horizontal polar angle deviation between pi and each point in its neighborhood N(pi):
θ i j = a b s θ i j θ i , i = 1 , 2 , m ,   j = 1 , 2 k
As the horizontal angular resolution is the angle of each rotation of the scanner around the z-axis during scanning, the angle deviation Δθij can represent the horizontal angular resolution only when pij is on the adjacent vertical scanning line of pi. To find the neighboring points located on the adjacent vertical scanning line of pi, we use the interval Δ to show the histogram of Δθij values and calculate the mean value of Δθij in the interval with the second largest point number as the current horizontal angular resolution θΔ. Figure 4 shows an example when Δ is 0.005°. To weaken the effect of Δ on the estimation result, a series of histograms are constructed under Δ ϵ (0.005°, 0.015°) with a step of 0.001°. The median value of θΔ from different histograms is used as the final horizontal angular resolution. In this paper, m and k are set as 100 and 10 respectively. Similarly, vertical angular resolution can also be estimated based on the statistics for the angle between the line from the origin to each point and the x-o-y plane.

2.2. DoPP Filtering Based on Adaptive Threshold

After polar grid construction, the number of points in each cell is calculated, which is called the density of projected points (DoPP). The DoPP of one cell is affected by both the object height and the point density. Intuitively, the DoPP of a facade is obviously larger than other objects, such as cars, vegetation and pedestrians. Due to this characteristic, the cells with a higher DoPP than a predefined threshold are commonly regarded as facade cells. The threshold to filter non-facade cells is critical in this step, but always empirically set as a fixed value in many previous studies. As the point density decreases with the increasing distance to the scanner, a fixed threshold may lead to incorrect results when facades are under different ranges, e.g., a threshold that can distinguish a facade cell from a canopy cell in a short range may filter all the long-range facade cells. To solve this problem, an adaptive threshold nP is generated for each cell based on the polar grid:
n P = r o c c l u s i o n N a tan H s t o r e y n s t o r e y / d C / θ v
where N is the coefficient in Equation (2), Hstorey is the mean storey height in the scene which is set as 3.5 m in this paper, nstorey is the storey number of the lowest building in the scene, dc is the horizontal distance between the origin and the center of gravity of all the points in the current cell, θv is the vertical angular resolution and rocclusion is the occlusion ratio considering the holes on the facade that mainly represent windows or foreground occlusion. Based on Equation (7), the nP of one cell will be intuitive, representing the DoPP of the current cell when placing the lowest facade in it. Thus, a cell farther from the origin will obtain a smaller threshold, weakening the influence of density variation on the point number of each cell. In Equation (7), rocclusion and nstorey require predefined values. The rocclusion value indicates what percentage of a visible facade is acceptable and is set as 0.5 empirically. We set nstorey as 1 by default, regarding the minimum facade height as 3.5 m across all scenes, to reduce the amount of specific prior information about the scene. Although the nstorey can be larger than 1 in some scenes, setting the nstorey as 1 by default is usually compatible with those cases.

2.3. Facade Extraction Based on Grid Features

After the DoPP filtering, most non-facade cells can be removed, except some cells consisting of tall non-facade objects, e.g., pole-like objects, thick tree crowns and walls. We present an object-oriented decision tree to further filter non-facade cells based on the combination of some grid-level features. The filtering results are reprojected into a rectangular grid on the x-o-y plane to generate a binary image, with the grid size the same as the ρG of the polar grid. An empty cell that has no point located in it is labeled as 0, while others are labeled as 1. Then, connected cells are grouped into the same object in the binary image using 8-connectivity rules and then analyzed through the proposed object-oriented decision tree, as shown in Figure 5.
(1)
Height difference. This is the difference between the maximum and minimum z-coordinate of each object. Facades should have larger height difference than theoretical minimum height, which is 3.5 m, as analyzed in the contents following Equation (7). This feature is consistent with basic knowledge of the real world and easy to calculate, so we use it to remove the objects with a higher DoPP than np but a height less than 3.5 m, such as walls, pedestrians, hardscapes, some pole-like objects and the side of a large car.
(2)
Horizontal Hollow Ratio. It has been indicated in previous studies that this feature can be utilized for building extraction in ALS [52] and MLS [28] data. As the laser beam cannot penetrate the facade surface and the roof cells have been filtered utilizing DoPP filtering, the hollow regions also exist behind the facade from the bottom view of the TLS data. In the study of [28], the horizontal hollow ratio is calculated as the ratio of projection area to convex hull area:
H P = S P / S C
where HP is the horizontal hollow ratio, SP and SC are the area of the projection and convex hull respectively. The number of cells covered by the projection of an object is used as the projected area, since only the ratio is required. As shown in Figure 6, the convex hull area is much larger than the projection area when the facade contains at least two walls. In the proposed decision tree, the cell groups with the horizontal hollow ratio less than the threshold TH are identified as facade projections; this is calculated as:
T H = min 0.4 , T O T S U
where TOTSU is a threshold calculated by the OTSU method [53] to achieve the optimal separation of a horizontal hollow ratio for all cell groups. In case TOTSU is too large when only single-wall facades exist, an empirical threshold of 0.4 is involved simultaneously in Equation (9) to ensure a reasonable range of TH. This empirical threshold means the projection area of building points should be less than 40% of the convex hull area.
Theoretically, only multi-wall facades and curved facades can be detected in this step, and the horizontal hollow ratio of a single-wall facade is similar to non-building objects, as shown in Figure 7. Another limitation of this feature is that the facade with a long wall and a short wall or with small curvature may be missed, as the blank area can be relatively small in these cases. In contrast to the mobile measurement of MLS in [28], the terrestrial laser scanner is set in a fixed position during scanning such that many buildings have only one visible facade from the scanner’s point of view. This characteristic limits the effectiveness of the horizontal hollow ratio in TLS data, but it is still an efficient and useful tool for multi-wall facade extraction. For facades that cannot be identified in this step, we calculate the ratio of planar points for each object to make a further analysis, as described in (4) and (5). However, before that, the circle-like objects are removed by compactness in (3).
(3)
Compactness. After horizontal hollow ratio filtering, some facades are still mixed with non-building objects, such as trees and pole-like objects. Many of those objects are commonly isolated and the corresponding projections appear as circular shapes, while facades have a long and thin shape. The geometry difference can be measured by compactness [54], which is calculated as:
C = 4 π S P / P P 2
where SP and PP are the area and perimeter of the projection, respectively, and a larger C value means a more compact shape. The compactness of a circle is 1 while that of a long and thin object is close to 0, as the perimeter is relatively large compared with area. Then, the compactness threshold is generated to remove the non-building objects:
T C = max 0.65 , C O T S U
where COTSU is calculated using the OTSU method. The larger value of COTSU and 0.65, which is an empirical value, is used as the threshold of compactness TC, to avoid a very small threshold when there are only facade cells. The object with larger compactness than TC will be removed as a non-facade object. Isolated small objects can be filtered out efficiently through compactness filtering.
(4)
Model-based planar ratio. The objects preserved by compactness in the last step will show a long and thin shape, just like the usual shape of a building. But the objects formed by several connected compact targets are also preserved, e.g., the projection of a series of connected thick tree crowns may be recognized as a facade object only based on compactness. Considering the limitation of compactness, we add information about the remaining objects. A plane model is estimated for each cell group based on the RANSAC method [55]. A cell group is labeled as representing a building when the ratio of the points on the plane model is larger than 80%, which is the same setting as used in [38]. By checking the global geometric characteristics of the whole points in one cell group, the model-based planar ratio can distinguish the single-wall facade from other objects satisfactorily. A possible problem of this feature, however, is that the planar ratio may be smaller than 80% when the facade is not planar or consists of a long wall and a short wall. As a result, this kind of facade may still be recognized as a non-facade object even after filtering with the horizontal hollow ratio and the model-based planar ratio.
(5)
Point-based planar ratio. To extract the remaining facades after the aforementioned processing, we make a point-level insight for the cell groups left in the previous steps, following the knowledge that most parts of a common building surface are planar and have a smooth shape. The local geometry of the neighborhood of one point can be described using dimensionality features [31], which are calculated based on the eigenvalues of the local covariance matrix:
M = p 1 p p k p T p 1 p p k p
where pi = (xi, yi, zi), i = 1,2,...,k represents the k neighboring points of one point p. As M is a symmetric positive definite matrix, three eigenvalues of M can be calculated utilizing eigenvalue decomposition and ordered as λ1 ≥ λ2 ≥ λ3. Then, the dimensionality features of p can be calculated as:
a l = λ 1 λ 2 λ 1 , a p = λ 2 λ 3 λ 1 , a s = λ 3 λ 1
where al, ap and as represent the linear, planar, and scatter behaviors of the neighborhood of p. Points will be labeled as of planar type when ap is the largest among the three dimensionality features. The cell groups with a ratio of planar points larger than 80% are recognized as facade while others are filtered out. Many studies commonly extract dimensionality features coupled with a neighborhood selection method [12,31,32,37] to obtain an optimal scale and highlight the main geometric behavior in the neighborhood. The main concern of this study, however, is the geometric type of each point and the ratio of planar points in each object rather than the theoretically optimal dimensionality feature values; thus, a fixed neighborhood size is used with k set as 10.
The dimensionality feature calculation requires point-level calculation, including KNN search and a matrix operation, which are more time-consuming than grid-based processing. However, as most cell groups have been processed in previous steps, the number of points involved in this step is significantly reduced. Meanwhile, the fixed neighborhood can also improve the operation efficiency.

2.4. Roof Points Extraction

Oblique roofs are commonly visible from terrestrial viewpoints and can provide important building structure information. Roof points cannot be preserved in DoPP filtering, however, because roof projection is more scattered than facade projection. As a roof is always spatially connected with a facade, we select the highest point in each facade cell as a seed point after facade extraction in the last section. Then, region growth is applied based on the seed points to search for roof points in the removed points of DoPP filtering, which we refer to as roof candidate points.
For each seed point, we remove it from the seed point set and find its k nearest neighboring points within the radius of cell size ρG in the roof candidate points. The parameter k is set as 10, which is the same with the k value used when calculating point-based planar ratios. If a neighboring point has not been labeled and its ap value is the largest among the dimensionality features in Equation (13), it is labeled as a roof point, otherwise it is labeled as a non-roof point. The aim of this constraint is to avoid non-roof objects being connected with the facade (e.g., vegetation and wires) and therefore being recognized as part of the roof. After one point has been labeled as a roof point, it is put into the seed point set and the same growing process is performed with it. The growing process will stop once the seed point set is empty. The points labeled as roof points are combined with the facade points to form the final building extraction result.

3. Experimental Results and Discussion

3.1. Datasets

Two datasets are used to validate the proposed method. The first is captured on a square by a Riegl-VZ400 scanner with the horizontal and vertical angular resolution of 0.02°, as shown in Figure 8, and the point density range of non-ground points is roughly (4 mm, 1.2 dm). This dataset contains about 53 million points and the main objects include buildings, vegetation, cars, streetlamps and pedestrians. The distances of the closest and farthest buildings to the scanner are about 60 m and 360 m, respectively. The second dataset is the Semantic3D dataset, which is a benchmark dataset for point cloud classification [56]. The testing data in Semantic3D contains more than 1.65 billion points and covers a wide range of outdoor scenes, including churches, streets, railroad tracks, squares, villages, soccer fields and castles. The point number of a single scan varies from about 20 million to more than 400 million, and each scanning position is freely chosen with no prior assumption of point density and class distributions. For example, a building may be the dominant object in a street scene but only occupies a small part of a village scene. We compare the proposed method with several grid-based methods on the first dataset in terms of the performance in the scene with large variations of scanning distance and point density. Although the distance variance of the buildings is smaller than it is in the first dataset, the Semantic3D dataset covers much more complex outdoor scenes; thus, we test the performance of the proposed method in complicated scenes from the second dataset. The proposed method is implemented with C++, with no parallel programming strategy adopted. The main parameter and threshold settings in the tests are summarized in Table 1, together with setting basis.

3.2. Comparison with Other Methods on the First Dataset

Firstly, we compare the polar grid-based DoPP filtering in our method with the original DoPP filtering [18], which is based on a rectangular grid. Completeness and correctness are used to quantitatively evaluate the performance of the two methods
C o m p l e t e n e s s = T P T P + F N C o r r e c t n e s s = T P T P + F P
where TP is the number of correctly extracted building points, FN is the number of undetected building points and FP is the number of non-building points recognized as building.
As the filtering threshold in our method is generated adaptively using Equation (7), the parameters that need manual settings are all related with polar grid construction: N is used to calculate the angular size θG in Equation (2) and the radius size ρG. In the test, N is set as 5∗n with n = 1, 2,...,10, corresponding to the range (0.1°, 1°) of θG, and the range of ρG is set as (0.1 m, 2 m), with an interval of 0.1 m, resulting in 200 groups of parameters.
The key parameters for the original DoPP filtering are cell size and the threshold T of the point number used to label a cell as belonging to a building. The size of the rectangular grid is set to (0.1 m, 2 m), with the interval of 0.1 m, and the range of the threshold T is set to (100, 1500), with an interval of 100. Based on the above parameter settings, 300 groups of filtering results can be obtained. In addition, an empirical parameter setting is generated for the original DoPP filtering based on previous studies. The grid size is set as 0.15 m according to the work of [57]. The T value is set as 80 based on the work of [24], this figure having been obtained by calculating the point number when placing the lowest facade in the position of the farthest building.
The DoPP filtering performances are shown in Table 2. The completeness values of the two methods are similar, while the correctness of our method is about 20% better. In addition, the empirical threshold set by adding information about the scene does not obviously improve the performance of the original DoPP, when compared with the mean performance of the 300 groups of results. By examining the filtering results in our method, it can be seen that most missing building points belong to indoor points and have little effect on building outline extraction, as shown in Figure 9. This indicates that most of the building facade points representing the main geometric features can be preserved by our method.
As many parameter settings may achieve rather poor results, and lower the mean result in Table 2, we select specific filtering results among different runs for a detailed comparison based on the F1 measure, which is calculated by:
F 1 = 2 C o m p l e t e n e s s C o r r e c t n e s s C o m p l e t e n e s s + C o r r e c t n e s s
where the F1 measure is a balance of the completeness and correctness values in Equation (14). The selected results are shown in Figure 10. The manually picked building points are shown in Figure 10a as ground truth. The result in Figure 10b corresponds to the median F1 value among the 200 results of the proposed method, with the θG and ρG set as 0.2° and 1 m, respectively. In Figure 10c, the result with the best F1 value is selected among the 300 results of the original DoPP filtering, with the cell size and T value set as 0.2 m and 300. Figure 10d shows the result of the original DoPP filtering using the empirical parameters, with the cell size and T value set as 0.15 m and 81. The black frames in Figure 10c,d mark two groups of missing buildings by the original DoPP filtering, of which the average distances to the origin are more than 330 m (box 1) and 200 m (box 2), respectively. In contrast, those distant buildings are preserved by our method, as shown in Figure 10b. However, as the point number on the distant building surface is relatively small, the elimination of those points is hardly reflected on the completeness value in Table 2.
The comparison in Figure 10 shows the disadvantage of the original DoPP—that the point number in a cell decreases rapidly with the increasing distance to origin. In Figure 10c, the distance of the farthest building which can be detected is about 180 m. When the distance is larger than 180 m, the DoPP of a facade cell becomes smaller than most close-range non-facade objects (e.g., crown and car), and thus a threshold that can preserve long-range building points will keep most points in the scene. In other words, the low density of distant facade points reduces the significance of their projection features. Although the results based on empirical parameters in Figure 10d are superior with respect to identifying distant building points, most close-range objects are preserved simultaneously, which is almost equivalent to no filtering having been made. Compared with original DoPP filtering, the proposed method achieves higher correctness, and the main reason lies in the reduction of the influence of decreasing point density on the DoPP. As the cell size of the polar grid increases with the scanning distance, which is consistent with the trend of beam divergence from the scanner center, a similar number of laser beams will pass through each cell on the x-o-y plane without considering foreground occlusion. Thus, the DoPP in the polar grid is mainly related to the object height. The point number on the vertical direction also decreases when the scanning distance increases. With our method, the adaptive threshold is calculated by placing the lowest building in each cell, and this works better than the fixed threshold.
Following the comparison of DoPP filtering results, the object-based evaluation is made to evaluate the final extraction results. In our test, each cell group is simply recognized as one building object after facade optimization, as all the buildings in the first dataset are independent. Similar evaluation indexes to Equation (15) are used, and the difference is that the TP, FN and FP are the number of correctly detected buildings, undetected buildings and non-building objects in the result, respectively. We use the same rule as in [28] to decide whether an extracted building object is correctly detected. If the ratio of the overlapping area is larger than 70% when the extracted and reference building data are put together, the detected building object is recognized as of TP type, otherwise it will be marked as FN type. We compare the proposed method with three grid-based methods, including the original DoPP method [18] and the methods in [26,28].
θG and ρG in the proposed method are set at 0.2° and 1 m, following the setting in Figure 10b. The parameters of the original DoPP method also follow the result in Figure 10c, which are 0.2 m and 300. As a detailed post-processing method for the original DoPP filtering results is not proposed by [18], the proposed decision tree is used to obtain the final extraction result. The method in [26] needs three parameters: the thresholds of perimeter, compactness and area, which are set as 120 pixels, 0.5 and 20 m2, respectively. The grid size of the method in [28] is set as 1 m and the threshold used in this method is calculated by the OTSU method.
The building-based results of the four methods are shown in Table 3 and Figure 11. The result of the method in [26] is illustrated in Figure 11a. The completeness and correctness are 67% and 40%, respectively. The errors mainly come from the connected tree crowns (the elliptical frame) and the crowns near the buildings (the elliptical frame). Buildings and nearby crowns are easily recognized as the same object in this method while the other three methods can deal with this problem based on the low point density at the boundary between the crown and the building. The projection of connected crowns may also show a long and thin shape and thus resemble a building from the perspective of compactness. That means the method in [26] is more suitable for the scene containing only single trees.
The horizontal hollow analysis in method [28] achieves a better result than [26], and the completeness and correctness are 73% and 85%, respectively. As shown in Figure 11b, four building objects are missed by this method, of which one is divided into two objects marked by the circlular frame and the other three contain only one facade marked by the rectangular frame. This shows the disadvantage of the horizontal hollow ratio when it comes to detecting single-wall facades. Sometimes single-wall facades can be preserved, as the indoor points behind the facade increases the blank area of the convex hull projection, but it is still unreliable to extract single-wall facades based on the horizontal hollow ratio.
The completeness of the original DoPP method is the lowest among the four methods. The missed buildings are mainly more than 180 m away and have been removed by DoPP fitering, as shown in Figure 11c. As a comparison, both the completeness and correctness of our method are the highest, which are 93% and 88%. As the post-processing for the two methods are both based on the proposed decision tree, the reason for the difference in the completeness and correctness relies on the result of DoPP filtering. Both the FP and FN errors of our method are due to the farthest building, which is divided into two objects, as shown in the black frame of Figure 11d. Most points of this building are correctly extracted but wrongly clustered, and those points are actually of TP type from the perspective of point-based evaluation. Notice that the object-based evaluation is made mainly to compare and analyze the performances of different grid-based methods. The correctness and completeness are sensitive in terms of building instances. As resolving discrete building points into different instances is a difficult problem, especially in complex urban scenes, the result means that a single building object cannot always be correctly identified by our cell grouping method.
As shown in Figure 12, some details of our results are compared with the original DoPP method. Figure 12a–c shows that our method can preserve the protruding parts of the facade, which are easy to filter out because of their relatively small projection density. It should be noted that in theory the seed points should be on the top of the facade, but some are actually located in the middle part of the facade, as the scanner is not strictly vertical. These seed points can help with the extraction of the protrusion points. Besides the protrusion points, the region growing in the step of roof extraction can recover some facade points removed in the DoPP filtering, as shown in Figure 12d.
Besides the detailed comparison of two DoPP filtering results, we also provide into the results obtained in different steps of the decision tree in our method, as shown in Figure 13. Among non-facade points, most single stems (green points) preserved after DoPP filtering are removed by height difference and compactness, and all connected tree crowns (blue points) are filtered by planar ratio in the last two steps. For facade points, nine, three and three facades are recognized by horizontal hollow ratio, model-based ratio and point-based ratio, respectively. The side view and top view of the three facades recognized by point-based ratio at the last step are shown in Figure 14. Although the object in Figure 14a is a curved facade, its horizontal hollow ratio is 0.44 and not identified as facade in the second step, due to the existence of indoor points. The model-based and point-based planar ratio of this object are 27.5% and 98.5%, thus it is preserved in the last step. The object in Figure 14b contains a long wall and a short wall, together with a large number of indoor points (see the circle in Figure 14e). Its horizontal hollow ratio, model-based and point-based planar ratios are 0.52, 63.3% and 90.9%, respectively. Consequently, one plane model cannot include more than 80% of all points. The object in Figure 14c contains one long and two short walls, as shown in Figure 14f. As the hollow region is not large enough, the horizontal hollow ratio is 0.41 and it cannot be preserved in the second step. In the third step, as the left wall is not on the same plane with the others, the model-based planar ratio is only 69.5%. This object is identified as a facade in the last step, with the point-based ratio of 96.9%.
In the building-based evaluation, one building which is correctly preserved but divided into several objects may increase the FP and FN errors simultaneously. Thus, the evaluation result may be similar to the case in which several non-building objects are preserved. Recognizing nonadjacent facade objects as the same building commonly requires predefined a shape hypothesis [14]. As the main focus of our study is extracting the building points under different distances, the result of the proposed method shown in Figure 10d is also evaluated on the point level and compared with a point cloud classification method presented in [31], as shown in Table 4. This method is also one of the three baseline methods in the Semantic3D dataset [56]. We use the 3D, 2D and projection features to describe the geometric property of each point and the random forest as the classifier. The execution time for the classification method includes sample selection, feature extraction, sample training and point labeling. The completeness, correctness and F1 measure of the classification method are calculated based on the building category.
It is shown in Table 4 that the completeness of the proposed method is 1.2% lower than the classification method, while the precision is 4.5% higher. The results of the two methods are similar in terms of the more balanced F1 measure, but our method is more efficient. Although the classification method can achieve full-class recognition, the sample selection for each class is manually operated and time-consuming. Thus, when the main target of interest in the scene is a building, our method will be more practical than the classification method.

3.3. Parameters Test

Two parameters, θG and ρG, are needed in our method. In the evaluation of the final extraction result, θG and ρG are fixed to 1 m and 0.2°, which correspond to the median F1 values among the 200 groups of parameters. We analyze the influence of different parameter settings on extraction results, within the ranges of θG and ρG used in the previous section. The range of θG is (0.1 m, 2 m), with an interval of 0.1 m, and the range of θG is (0.1°,2°), with an interval of 0.1°. The F1 measure, completeness and correctness values of different parameter combinations are shown in Figure 15.
Both the F1 measure and completeness values increase while θG decreases and ρG increases until they reach the plateau of the mesh in the middle of the ρG range and the edge of the θG range. The N value in Equation (2) is 5 for the minimum θG, which means that θG is five times the angular resolution. As there is little space to reduce the N value, 0.1° is set as the minimum angular resolution in this test. The completeness is less than 90% when ρG is less than 0.5 m. The main reason is that when ρG is set to a relatively small value, cells belonging to the same facade may not be grouped as the same object and many isolated facade cells will be removed by the object-based decision tree. The correctness remains more than 98% for most parameter settings but decreases sharply at the edge of the range of ρG. The reason is that when ρG is set to a relatively large value, the facade and adjacent trees may be connected and recognized as the same object. The result in Figure 15 indicates that a smaller θG is usually better than a larger one, while the case is more complicated for the ρG and we regard (0.5 m, 1.5 m) as a suitable range for ρG in the first dataset.

3.4. Test on the Second Dataset

We use the Semantic3D dataset to test the performance of the proposed method in different types of outdoor scenes. The N in Equation (2) is set as 10 to calculate θG and the radial size ρG is set as 0.5 m. The evaluation measure used in Semantic3D is Intersection over Union (IoU), which is calculated here as:
I o U = T P T P + F N + F P
where TP, FN and FP are the number of correctly extracted building points, missing building points and falsely detected building points, respectively. The IoU of our result is 85.7%, with completeness and correctness of 90.2% and 94.5%, and the running time is 14,464 s. As we focus on both the effectiveness and efficiency and most methods do not report their running time, the comparison is made between our method and the 3D covariance baseline method, which utilizes the same classification framework as [31]. The IoU and running time of the 3D covariance baseline method for Semantic3D are 87.6% and 38,421 s. The result is similar to the comparison in Table 4—that our method achieves a similar extraction result within a much shorter time. Additionally, the time for sample point labeling in the classification method is not included.
As many urban scans are similar and three rural scans have few buildings (no more than three) in Semantic3D, we select four scans for the overview of the extraction results, as shown in Figure 16. The distance variation of the buildings in Semantic3D is about 1.5 m to 130 m, which is smaller than the first dataset, but some scans have larger density variation, e.g., the density variations of the marketsquarefeldkirch7 scan are about 2 mm to 2.9 dm. It can be seen that most points of the building can be correctly distinguished from the surroundings, including many small pieces of the facade at a distance.
Some extraction details are illustrated in Figure 17; Figure 18. Figure 17 shows that many building components with a small DoPP can be extracted satisfactorily, such as the roof (Figure 17a,b), porch (Figure 17c) and corridor (Figure 17d). As the point cloud captured from ground view is commonly regarded as a data source for facade structure, previous grid-based studies of building extraction mainly focus on facade extraction, and roof extraction has been rarely discussed. In the work of [26], the feature value of each cell is generated based on the height, and the roof points can be preserved together with facade points. However, this method has a problem in filtering connected high tree crowns, as shown in Figure 11a. Many objects which do not belong to the roof are detected in roof extraction, e.g., the porch in Figure 17c and the corridor in Figure 17d. Similarly, indoor objects connected with a facade may also be detected, such as a ceiling. We follow the class label setting in [56], that all indoor points are classified as buildings, so the detection of such objects can increase accuracy in building extraction and preserve more geometric details.
Figure 18 shows some extraction results for separating buildings from non-building objects. In Figure 18a, the pedestrians near the buildings can be filtered effectively by height difference. One bucket in Figure 18b is under the eave and removed together with the eave points above it at the DoPP filtering stage. However, the filtered eave points can be preserved in roof extraction, while the bucket points are finally removed. The case is similar in Figure 18c—that DoPP filtering removes the left corner of the eave together with vegetation below, though the eave points are preserved in the roof extraction. In Figure 18d, the vegetation points nearby the building are separated well. Figure 18e,f show the elimination of plane-like objects. The van in Figure 18e and the wall in Figure 18f are very similar to facades from the point of view of projection shape, but they can be easily distinguished from facades by height differences.
Figure 19 shows two main types of falsely extracted points (FP errors). The first type is brought by the non-building points located in a facade cell (Figure 19a,b). In Figure 19a, the building is surrounded by dense and close vegetation. Although most vegetation points have been filtered, some points close to the facade are located in the same cell as facade edge points and recognized as building. Reducing the cell size can separate these two groups of points but may divide one facade into several cell groups. Then, those small cell groups may be filtered because of too large compactness. In Figure 19b, the landscape vegetation is directly fixed to the guardrail on the terrace. Thus, it is impossible to separate those vegetation points from building points on a grid level in this case.
The second error is caused by the vertical overlap of different objects. In Figure 19c, the tree crown points right above the facade are mistaken as building points. The case in Figure 19d is very similar to that in Figure 18b, but the vehicle under the eave is falsely recognized as building, despite the minimum horizontal distance between vehicle and facade being 1.2 m. The main reason is that, in Figure 19d, the cells containing both vehicle and eave points have a higher DoPP than the threshold and are connected with nearby facade cells.
The point number of the FP errors is usually small compared with the number of building points and has little effect on building information preservation. One potential way to remove those points is to segment the building points into small clusters for further analysis. Building reconstruction or parsing commonly includes the step of recognizing basic geometric primitives by a segmentation or decomposition method [11,58,59]. Thus, it is possible to exclude those falsely extracted points in further applications.
The missed building points (FN errors) can be classified into four classes, as shown in Figure 20. The first error is due to ground filtering, as shown in Figure 20a. Points at the bottom of buildings are commonly filtered as ground points by the CSF method. The second type is due to isolated indoor points. The third error is a result of the building only having roof points (Figure 20b). This situation commonly appears for a long, low building, the facade of which is easily occluded by foreground objects. The fourth error occurs when the incident angle is very large, as shown in Figure 20c. In this case, the point spacing increases significantly and a large area of wall may be filtered out.
Since the first type of error often occurs at close-range to buildings with a relatively large point density, it covers the highest proportion of missing detections. However, considering that the points near ground are usually regarded as unreliable for building model reconstruction because of complex environment and foreground occlusion [11], this error has little influence on building structure preservation. Indoor points scanned from outside are usually discrete and can hardly represent the shape of an object. Thus, the first two types of errors have little effect on the application of building scanning data. Although the last two error types correspond to very few points, they usually cover relatively large area and may cause the missing detection of continuous facade areas or a single building.

4. Discussion

The proposed method aims to extract building points from single-scan TLS data with most processing executed at the grid level. After the test on two datasets containing more than 1.7 billion points and a comparison with other grid-based and classification methods, the advantages of our method can be summarized as follows.
Our method is easy to use, mainly for two reasons. First, our method does not rely on parameter tuning to set a suitable DoPP threshold. The rectangular grid is often used with a fixed threshold to extract a vertical facade in previous studies [18,19,20,25]. Our conclusion about DoPP filtering on a rectangular grid is similar to [14]—that it is difficult to set a suitable threshold at the beginning, as the threshold has no intuitive meaning. Thus, much parameter tuning is necessary. Cheng et al. [24] calculate the threshold as the point number when placing the lowest building in the position of the farthest building, but the generated threshold is still a fixed value. The test in Figure 10 shows that it may be impossible to set a suitable fixed threshold to preserve buildings more than 180 m away and remove close-range tree crowns simultaneously. Compared with previous studies, our method handles this problem using the adaptive threshold based on a polar grid. We place the lowest building in each cell and calculate the corresponding point number as the adaptive threshold. Theoretically, the height of the lowest facade in a scene requires prior knowledge of the scene, but our method sets the minimum facade height at 3.5 m by default, setting nstorey in Equation (7) as 1. Although the minimum height can be larger than 3.5 m and fixing nstorey to 1 may preserve more non-facade points in DoPP filtering in this case, our test has shown that the final results are for the most part satisfying and setting nstorey as 1 by default can accommodate cases where nstorey is larger than 1. Thus, the DoPP threshold in our method can be generated automatically. Second, the memory requirement of our method is not high. Most processings in our method are carried out at grid level. Besides the original points, only grid features are stored in the memory, such as the point number in each cell. In general grid construction, a small cell size may result in very large number of cells and increase memory consumption significantly. However, cell size cannot be set too small in grid-based building extraction, because it should be at least larger than the thickness of a facade projection and a small size may divide façade projection into several cells. It is also supported by our parameter test result—that F1 and completeness decrease rapidly when cell size is smaller than 0.5 m. If the point cloud is obtained by panoramic scanning with the largest horizontal range of 400 m, the number of cells is 2,880,000, with θG and ρG set as 0.1° and 0.5 m. This is usually a very small memory cost for current computers. However, in a point-based method, multiple features are generated for each point and these features commonly require much more memory space than storing original points. Although original data can be sampled to reduce memory cost, point-based methods usually still require much more memory than grid-based methods. For example, the method using 21-dimensional features in [31] will have a similar memory cost only when the point number is about 5% of the number of cells in our method.
Our method is balanced in terms of effectiveness and efficiency. The comparison with the first dataset suggests that our method has a better performance on TLS data with large density variation than other methods using grid features, such as DoPP [18,19,21,25], compactness [12] and horizontal hollow ratio [28]. Furthermore, those methods have dealt poorly with roof extraction, while our method can extract roof points well, as shown in the test on Semantic3D. As analyzed by [25], the time complexity of the DoPP method is O(N), and their method has almost the same efficiency. The efficiency is not discussed in [28], but the time complexity is much higher than DoPP, as much voxel grouping processing is required before 2D projection. Our method is essentially a combination of DoPP filtering and post-processing. The time complexity of different stages in our method is shown in Table 5. The first three stages have linear time complexity, so the complexity of the whole method largely depends on the last two stages. Commonly, only a small proportion of the original points are actually processed in the stage of point-based planar ratio calculation, e.g., only 10% of the original points are processed in the first dataset (the blue and black points in Figure 13). As a result of the large incident angle and foreground occlusion, the number of roof points is relatively small compared with other objects, e.g., the proportion of the extracted roof points in dataset 1 is only 0.2%. In general, our method is slower than [18,26], but faster than [28]. On the other hand, when compared with the point-based classification method [31], which is also a baseline method in the Semantic3D dataset, our method can achieve similar accuracy levels on a building class with much higher efficiency. Similar performance to the baseline method means that the result of our method is worse than most submitted results of the DL methods on Semantic3D homepage. Our focus is to find an efficient and simple way to extract the main building structures with acceptable accuracy; thus, a balance of effectiveness and efficiency is the aim. Considering the complexity of parameter tuning and the high demands on computing resources and professional knowledge in deploying a DL model in practical applications, DL is not suitable for the application scenario in our research. However, notice that point-based classification and DL can achieve multiple class recognition, including both big and small targets, while our method is designed for building extraction.
The test indicates that there are several error types found in our method, as shown in Figure 16; Figure 17. The major limitation of our method is that the area with a large incident angle is easily missed because of sparse point distribution. This may cause the loss of a large facade area, despite the missed point number being relatively small. Another limitation comes from the buildings with only the roof visible. As the wall outline can be recovered by projecting the upper contour lines to the ground [11], many buildings with only roof points may provide enough information for reconstruction. Misdetection of these buildings causes information loss in terms of building reconstruction.
In summary, in a case where a building is the main target of interest, our method will be a more practical choice with little prior knowledge and manual intervention required compared with a segmentation or classification method. If a more detailed building instance is needed, our result can also provide quick and accurate information for post-processing, such as the localization information in [14].

5. Conclusions

In this paper, we propose a grid-based building extraction method for single-scan TLS data. The main focuses of our method are the problems due to density variation and threshold tuning in previous grid-based methods using DoPP. The polar grid is utilized to adapt to the decreasing density with the increase of distance and generate an adaptive threshold. Facade points are extracted with DoPP filtering on the polar grid. Then, cell groups from the filtering result are used as the primitives for facade refinement. In the test on two datasets with more than 1.7 billion points, the proposed method outperforms previous grid-based methods, especially on the extraction of distant buildings (more than 180 m in our test). Compared with the point-based classification method, our method achieves similar accuracy with much higher efficiency. The result of the first dataset is 95.6% (our method) versus 94.2% (point-based classification) and that of the second is 85.7% versus 87.6%. Our running time, however, is less than half of the point-based classification. Additionally, our method can extract roof points which are ignored by most previous grid-based methods. Thus, when a building is the main target in the use of TLS data, our method is a suitable and practical choice in terms of the balance between efficiency and effectiveness. Our method has difficulty in detecting buildings with large incident angles or without facade points. Thus, future work will focus on the extraction of facades with sparse point distribution and buildings with only the roof visible.

Author Contributions

Conceptualization, M.C.; methodology, M.C.; software, L.Z.; validation, M.C., X.L. and X.Z.; writing—original draft preparation, M.C.; writing—review and editing, M.W.; visualization, X.L. and L.Z.; funding acquisition, M.C. and M.W. All authors have read and agreed to the published version of the manuscript.

Funding

This work was supported in part by the National Natural Science Foundation of China under grant no. 41801394 and no. 41901296, in part by Chongqing Natural Science Foundation under grant no. cstc2019jcyj-msxmX0370 and in part by the Science and Technology Research Program of Chongqing Municipal Education Commission under grant no. KJQN201900729.

Institutional Review Board Statement

Not applicable.

Informed Consent Statement

Not applicable.

Data Availability Statement

Not applicable.

Conflicts of Interest

The authors declare no conflict of interest.

References

  1. Chen, D.; Wang, R.; Peethambaran, J. Topologically aware building rooftop reconstruction from airborne laser scanning point clouds. IEEE J. Trans. Geosci. Remote Sens. 2017, 55, 7032–7052. [Google Scholar] [CrossRef]
  2. He, M.; Zhu, Q.; Du, Z.; Hu, H.; Ding, Y.; Chen, M. A 3D shape descriptor based on contour clusters for damaged roof detection using airborne LiDAR point clouds. Remote Sens. 2016, 8, 189. [Google Scholar] [CrossRef] [Green Version]
  3. Yu, B.; Liu, H.; Wu, J.; Hu, Y.; Zhang, L. Automated derivation of urban building density information using airborne lidar data and object-based method. Landsc. Urban Plan. 2010, 98, 210–219. [Google Scholar] [CrossRef]
  4. Qin, R.; Gruen, A. 3D change detection at street level using mobile laser scanning point clouds and terrestrial images. ISPRS J. Photogramm. Remote Sens. 2014, 90, 23–35. [Google Scholar] [CrossRef]
  5. Du, S.; Zhang, Y.; Zou, Z.; Xu, S.; He, X.; Chen, S. Automatic building extraction from LiDAR data fusion of point and grid-based features. ISPRS J. Photogramm. Remote Sens. 2017, 130, 294–307. [Google Scholar] [CrossRef]
  6. Huang, J.; Zhang, X.; Xin, Q.; Sun, Y.; Zhang, P. Automatic building extraction from high-resolution aerial images and LiDAR data using gated residual refinement network. ISPRS J. Photogramm. Remote Sens. 2019, 151, 91–105. [Google Scholar] [CrossRef]
  7. Tomljenovic, I.; Höfle, B.; Tiede, D.; Blaschke, T. Building extraction from airborne laser scanning data: An analysis of the state of the art. Remote Sens. 2015, 7, 3826–3862. [Google Scholar] [CrossRef] [Green Version]
  8. Lai, X.; Yang, J.; Li, Y.; Wang, M. A Building Extraction Approach Based on the Fusion of LiDAR Point Cloud and Elevation Map Texture Features. Remote Sens. 2019, 11, 1636. [Google Scholar] [CrossRef] [Green Version]
  9. Zarea, A.; Mohammadzadeh, A. A novel building and tree detection method from LiDAR data and aerial images. IEEE J. Sel. Top. Appl. Earth Obs. Remote Sens. 2015, 9, 1864–1875. [Google Scholar] [CrossRef]
  10. Che, E.; Jung, J.; Olsen, M.J. Object recognition, segmentation, and classification of mobile laser scanning point clouds: A state of the art review. Sensors 2019, 19, 810. [Google Scholar] [CrossRef] [Green Version]
  11. Pu, S.; Vosselman, G. Knowledge based reconstruction of building models from terrestrial laser scanning data. ISPRS J. Photogramm. Remote Sens. 2009, 64, 575–584. [Google Scholar] [CrossRef]
  12. Yang, B.; Dong, Z. A shape-based segmentation method for mobile laser scanning point clouds. ISPRS J. Photogramm. Remote Sens. 2013, 81, 19–30. [Google Scholar] [CrossRef]
  13. Shi, J.; Malik, J. Normalized cuts and image segmentation. IEEE Trans. Pattern Anal. 2000, 22, 888–905. [Google Scholar]
  14. Xia, S.; Wang, R. Extraction of residential building instances in suburban areas from mobile LiDAR data. ISPRS J. Photogramm. Remote Sens. 2018, 144, 453–468. [Google Scholar] [CrossRef]
  15. Lim, E.H.; Suter, D. 3D terrestrial LIDAR classifications with super-voxels and multi-scale Conditional Random Fields. Comput.-Aided Des. 2009, 41, 701–710. [Google Scholar] [CrossRef]
  16. Aijazi, A.K.; Checchin, P.; Trassoudaine, L. Segmentation based classification of 3D urban point clouds: A super-voxel based approach with evaluation. Remote Sens. 2013, 5, 1624–1650. [Google Scholar] [CrossRef] [Green Version]
  17. Yang, B.; Dong, Z.; Zhao, G.; Dai, W. Hierarchical extraction of urban objects from mobile laser scanning data. ISPRS J. Photogramm. Remote Sens. 2015, 99, 45–57. [Google Scholar] [CrossRef]
  18. Li, B.J.; Li, Q.Q.; Shi, W.Z.; Wu, F.F. Feature extraction and modeling of urban building from vehicle-borne laser scanning data. Int. Arch. Photogramm. Remote Sens. Spat. Inf. Sci. 2004, 35, 934–939. [Google Scholar]
  19. Hammoudi, K.; Dornaika, F.; Paparoditis, N. Extracting building footprints from 3D point clouds using terrestrial laser scanning at street level. ISPRS/CMRT09 2009, 38, 65–70. [Google Scholar]
  20. Fan, H.; Yao, W.; Tang, L. Identifying man-made objects along urban road corridors from mobile LiDAR data. IEEE Geosci. Remote Sens. Lett. 2013, 11, 950–954. [Google Scholar] [CrossRef]
  21. Hernández, J.; Marcotegui, B. Point cloud segmentation towards urban ground modeling. In Proceedings of the 2009 Joint Urban Remote Sensing Event, Shanghai, China, 20–22 May 2009; IEEE: Piscataway, NJ, USA, 2009; pp. 1–5. [Google Scholar]
  22. Cheng, L.; Tong, L.; Wu, Y.; Chen, Y.; Li, M. Shiftable leading point method for high accuracy registration of airborne and terrestrial LiDAR data. Remote Sens. 2015, 7, 1915–1936. [Google Scholar] [CrossRef]
  23. Zheng, H.; Wang, R.; Xu, S. Recognizing street lighting poles from mobile LiDAR data. IEEE Trans. Geosci. Remote Sens. 2016, 55, 407–420. [Google Scholar] [CrossRef]
  24. Cheng, L.; Tong, L.; Li, M.; Liu, Y. Semi-automatic registration of airborne and terrestrial laser scanning data using building corner matching with boundaries as reliability check. Remote Sens. 2013, 5, 6260–6283. [Google Scholar] [CrossRef] [Green Version]
  25. Cheng, X.; Cheng, X.; Li, Q.; Ma, L. Automatic registration of terrestrial and airborne point clouds using building outline features. IEEE J. Sel. Top. Appl. Earth Obs. Remote Sens. 2018, 11, 628–638. [Google Scholar] [CrossRef]
  26. Yang, B.; Wei, Z.; Li, Q.; Li, J. Automated extraction of street-scene objects from mobile lidar point clouds. Int. J. Remote Sens. 2012, 33, 5839–5861. [Google Scholar] [CrossRef]
  27. Gao, S.; Hu, Q. Automatic extraction method of independent features based on elevation projection of point clouds and morphological characters of ground object. In Proceedings of the 2014 Third International Workshop on Earth Observation and Remote Sensing Applications (EORSA), Changsha, China, 20 October 2014; IEEE: Piscataway, NJ, USA, 2014; pp. 86–90. [Google Scholar]
  28. Wang, Y.; Cheng, L.; Chen, Y.; Wu, Y.; Li, M. Building point detection from vehicle-borne LiDAR data based on voxel group and horizontal hollow analysis. Remote Sens. 2016, 8, 419. [Google Scholar] [CrossRef] [Green Version]
  29. Yang, B.; Wei, Z.; Li, Q.; Li, J. Semiautomated building facade footprint extraction from mobile LiDAR point clouds. IEEE Geosci. Remote Sens. Lett. 2012, 10, 766–770. [Google Scholar] [CrossRef]
  30. Gao, J.; Yang, R. Online building segmentation from ground-based LiDAR data in urban scenes. In Proceedings of the 2013 International Conference on 3D Vision-3DV 2013, Seattle, WA, USA, 29 June–1 July 2013; IEEE: Piscataway, NJ, USA, 2013; pp. 49–55. [Google Scholar]
  31. Weinmann, M.; Jutzi, B.; Hinz, S.; Mallet, C. Semantic point cloud interpretation based on optimal neighborhoods, relevant features and efficient classifiers. ISPRS J. Photogramm. Remote Sens. 2015, 105, 286–304. [Google Scholar] [CrossRef]
  32. Demantké, J.; Mallet, C.; David, N.; Vallet, B. Dimensionality based scale selection in 3D lidar point clouds. Int. Arch. Photogr. Remote Sens. Spat. Inf. Sci. Laser Scanning 2011, 38, 97–102. [Google Scholar] [CrossRef] [Green Version]
  33. Weinmann, M.; Jutzi, B.; Mallet, C. Semantic 3D scene interpretation: A framework combining optimal neighborhood size selection with relevant features. ISPRS Ann. Photogramm. Remote Sens. Spat. Inf. Sci. 2014, 2, 181. [Google Scholar] [CrossRef] [Green Version]
  34. Brodu, N.; Lague, D. 3D terrestrial lidar data classification of complex natural scenes using a multi-scale dimensionality criterion: Applications in geomorphology. ISPRS J. Photogramm. Remote Sens. 2012, 68, 121–134. [Google Scholar] [CrossRef] [Green Version]
  35. Niemeyer, J.; Rottensteiner, F.; Soergel, U. Contextual classification of lidar data and building object detection in urban areas. ISPRS J. Photogramm. Remote Sens. 2014, 87, 152–165. [Google Scholar] [CrossRef]
  36. Atik, M.E.; Duran, Z.; Seker, D.Z. Machine Learning-Based Supervised Classification of Point Clouds Using Multiscale Geometric Features. Int. J. Geo-Inf. 2021, 10, 187. [Google Scholar] [CrossRef]
  37. Chen, M.; Pan, J.; Xu, J. Classification of Terrestrial Laser Scanning Data with Density-Adaptive Geometric Features. IEEE Geosci. Remote Sens. Lett. 2018, 15, 1795–1799. [Google Scholar] [CrossRef]
  38. Li, Z.; Zhang, L.; Tong, X.; Du, B.; Wang, Y.; Zhang, L.; Zhang, Z.; Liu, H.; Mei, J.; Xing, X.; et al. A three-step approach for TLS point cloud classification. IEEE J. Trans. Geosci. Remote Sens. 2016, 54, 5412–5424. [Google Scholar] [CrossRef]
  39. Pirotti, F.; Guarnieri, A.; Vettore, A. Ground filtering and vegetation mapping using multi-return terrestrial laser scanning. ISPRS J. Photogramm. Remote Sens. 2013, 76, 56–63. [Google Scholar] [CrossRef]
  40. Ghamisi, P.; Hoefle, B. LiDAR data classification using extinction profiles and a composite kernel support vector machine. IEEE Geosci. Remote Sens. Lett. 2017, 14, 659–663. [Google Scholar] [CrossRef]
  41. Schmidt, A.; Niemeyer, J.; Rottensteiner, F.; Soergel, U. Contextual classification of full waveform lidar data in the Wadden Sea. IEEE Geosci. Remote Sens. Lett. 2014, 11, 1614–1618. [Google Scholar] [CrossRef]
  42. Liu, H.; Motoda, H.; Setiono, R.; Zhao, Z. Feature selection: An ever evolving frontier in data mining. In Proceedings of the Feature Selection Data Mining, Hyderabad, India, 21 June 2010; pp. 4–13. [Google Scholar]
  43. Cortes, C.; Vapnik, V. Support-vector networks. Mach. Learn. 1995, 20, 273–297. [Google Scholar] [CrossRef]
  44. Chang, C.C.; Lin, C.J. LIBSVM: A library for support vector machines. ACM Trans. Intell. Syst. Technol. (TIST) 2011, 2, 1–27. [Google Scholar] [CrossRef]
  45. Breiman, L. Random forests. Mach. Learn. 2001, 45, 5–32. [Google Scholar] [CrossRef] [Green Version]
  46. Zhang, Z.; Zhang, L.; Tong, X.; Mathiopoulos, P.T.; Guo, B.; Huang, X.; Wang, Z.; Wang, Y. A multilevel point-cluster-based discriminative feature for ALS point cloud classification. IEEE J. Trans. Geosci. Remote Sens. 2016, 54, 3309–3321. [Google Scholar] [CrossRef]
  47. Landrieu, L.; Raguet, H.; Vallet, B.; Mallet, C.; Weinmann, M. A structured regularization framework for spatially smoothing semantic labelings of 3D point clouds. ISPRS J. Photogramm. Remote Sens. 2017, 132, 102–118. [Google Scholar] [CrossRef] [Green Version]
  48. Qi, C.R.; Su, H.; Mo, K.; Guibas, L.J. Pointnet: Deep learning on point sets for 3d classification and segmentation. In Proceedings of the IEEE Conference on Computer Vision and Pattern Recognition, Honolulu, HI, USA, 21–26 July 2017; IEEE: Piscataway, NJ, USA, 2017; pp. 652–660. [Google Scholar]
  49. Li, Y.; Bu, R.; Sun, M.; Wu, W.; Di, X.; Chen, B. Pointcnn: Convolution on x-transformed points. Adv. Neural Inf. Process. Syst. (NIPS) 2018, 31, 820–830. [Google Scholar]
  50. Zhang, W.; Qi, J.; Wan, P.; Wang, H.; Xie, D.; Wang, X.; Yan, G. An easy-to-use airborne LiDAR data filtering method based on cloth simulation. Remote Sens. 2016, 8, 501. [Google Scholar] [CrossRef]
  51. Che, E.; Olsen, M. Fast ground filtering for TLS data via Scanline Density Analysis. ISPRS J. Photogramm. Remote Sens. 2017, 129, 226–240. [Google Scholar] [CrossRef]
  52. Aljumaily, H.; Laefer, D.; Cuadra, D. Big-data approach for three-dimensional building extraction from aerial laser scanning. J. Comput. Civ. Eng. 2015, 30, 04015049. [Google Scholar] [CrossRef]
  53. Otsu, N. A threshold selection method from gray-level histograms. Automatica. IEEE J. Trans. Syst. Man Cybern. 1975, 11, 23–27. [Google Scholar]
  54. Touya, G. A road network selection process based on data enrichment and structure detection. Trans. GIS 2010, 14, 595–614. [Google Scholar] [CrossRef] [Green Version]
  55. Fischler, M.; Bolles, R. Random Sample Consensus: A Paradigm for Model Fitting with Applications to Image Analysis and Automated Cartography. Commun. ACM 1981, 24, 381–395. [Google Scholar] [CrossRef]
  56. Hackel, T.; Savinov, N.; Ladicky, L.; Wegner, J.; Schindler, K.; Pollefeys, M. Semantic3D.net: A new Large-scale Point Cloud Classification Benchmark. arXiv 2017, arXiv:1704.03847. [Google Scholar]
  57. Piegl, L.; Tiller, W. Algorithm for finding all k nearest neighbors. Comput.-Aided Des. 2002, 34, 167–172. [Google Scholar] [CrossRef]
  58. Lin, H.; Gao, J.; Zhou, Y.; Lu, G.; Ye, M.; Zhang, C.; Liu, L.; Yang, R. Semantic decomposition and reconstruction of residential scenes from LiDAR data. ACM Trans. Graph. 2013, 32, 1–10. [Google Scholar] [CrossRef]
  59. Li, Z.; Zhang, L.; Mathiopoulos, P.; Liu, F.; Zhang, L.; Li, S. A hierarchical methodology for urban facade parsing from TLS point clouds. ISPRS J. Photogramm. Remote Sens. 2017, 123, 75–93. [Google Scholar] [CrossRef]
Figure 1. Process of the proposed method. Notice that all polygons here represent point clouds instead of models.
Remotesensing 13 04392 g001
Figure 2. Parameters of polar grid.
Remotesensing 13 04392 g002
Figure 3. Comparison between a rectangular grid and a polar grid. The number in (a) is the number of laser beams passing through each cell. In (b), different cells in the polar grid correspond to similar number of laser beams. The comparison shows that the polar grid achieves a more even data distribution.
Remotesensing 13 04392 g003
Figure 4. Example of the histogram of Δθij values with Δ set as 0.005°. There are three large inflection points in this example. In addition to the range of (0°, 0.005°), the interval with the largest number of points is the one most likely to correspond to the adjacent vertical scanning line of pi. Thus, the mean value of Δθij in (0.015°, 0.02°) is calculated as the horizontal angular resolution for this histogram.
Remotesensing 13 04392 g004
Figure 5. Facade optimization with the object-oriented decision tree.
Remotesensing 13 04392 g005
Figure 6. Horizontal hollow ratio of multi-wall building. (ac) show the projected points, projection area and convex hull, respectively. The empty area after the facade forms a smaller horizontal hollow ratio than other objects.
Remotesensing 13 04392 g006
Figure 7. Limitation of the horizontal hollow ratio in single-wall facade detection. The left three figures show that the projected points of a single-wall facade in (a), the corresponding projection in (b) and the convex hull in (c) have similar areas. Thus, the horizontal hollow ratio of the single-wall facade in (a) is similar to that of the stem and canopy projections in (d).
Remotesensing 13 04392 g007
Figure 8. The first data set rendered by height.
Remotesensing 13 04392 g008
Figure 9. Example of the DoPP filtering results of our method from an indoor perspective with θG and ρG set as 0.2° and 1 m. Points are colored by the filtering result: preserved (gray) or filtered (blue). Most filtered points are indoor points, which are in front of the building points from the indoor view.
Remotesensing 13 04392 g009
Figure 10. Comparison of the filtering results of our method and the original DoPP filtering. (a) shows the manually extracted building points; (b) the result of our method corresponding to the median F1 value among the 200 runs; (c) the result of the original DoPP filtering, with the highest F1 value among the 300 runs; and (d) the result of the original DoPP filtering with the empirical parameters based on the methods of [24,57]. Our method performs better when it comes to distinguishing long-range buildings points (boxes 1 and 2) from close-range crown points.
Remotesensing 13 04392 g010aRemotesensing 13 04392 g010b
Figure 11. Extraction results for four grid-based methods. (a) shows the compactness-based method, (b) the horizontal hollow analysis, (c) the original DoPP, and (d) the proposed method.
Remotesensing 13 04392 g011
Figure 12. Comparison of result details. Left in (ac): our results; right in (ac): results of the original DoPP. The facade in (d) is removed by the original DoPP and only our result is shown. Gray points are facade points, green points are seed points for roof extraction and blue points are results of the roof extraction.
Remotesensing 13 04392 g012aRemotesensing 13 04392 g012b
Figure 13. Results of different steps in the decision tree, including two classes: (1) points filtered by height difference (red), compactness (green) and planar ratio (blue); (2) points preserved by horizontal hollow ratio (gray), model-based planar ratio (maroon) and point-based planar ratio (black).
Remotesensing 13 04392 g013
Figure 14. Facades recognized at the last step of the decision tree. (ac) show the side view and (df) show the top view. The points marked by the ellipses in (d,e) are indoor points.
Remotesensing 13 04392 g014
Figure 15. F1 measure (a), completeness (b) and correctness (c) of the proposed method under different parameter settings.
Remotesensing 13 04392 g015
Figure 16. Extraction results of four selected scans in Semantic3D. (a) shows the original data for marketsquarefeldkirch7, sg27_10, sg27_8 and stgallencathedral1 colored by intensity. (b) shows corresponding extraction results (gray: facade points; blue: roof points; green: seed points on the top of each facade cell).
Remotesensing 13 04392 g016
Figure 17. Extraction details of building components with a small DoPP in Semantic3D. (a,b) show extraction results of roofs; (c,d) show extraction results of porch and corridor. For each sub-figure, on the left is shown the original points rendered by intensity, on the right the extraction result with facade points colored gray and roof points colored blue.
Remotesensing 13 04392 g017
Figure 18. Extraction details of separating building points from non-building points in Semantic3D. Separated targets are (a) pedestrian, (b) bucket, (c,d) vegetation, (e) van and (f) wall. For each sub-figure, the left side shows the original points rendered by intensity, while the right shows the extraction result with facade points colored gray and roof points colored blue.
Remotesensing 13 04392 g018aRemotesensing 13 04392 g018b
Figure 19. Different types of FP errors with falsely extracted points marked in the rectangle. (a,b) show the case that non-building points are located in a facade cell; (c,d) show the case of vertical overlap of building and non-building points. For each sub-figure, the left side shows the original points rendered by intensity and the right side shows the result of DoPP filtering (gray) and roof detection (blue).
Remotesensing 13 04392 g019
Figure 20. Different types of FN errors (missing detection). For each sub-figure, the left side shows the original points rendered by intensity. The right side in (a) shows the ground filtering result of a selected area (left). Real ground points are colored orange and building points recognized as ground points are colored gray. (b) shows a building with few facade points. In (c), the right side shows the extraction results (gray) of the original point cloud on the left.
Remotesensing 13 04392 g020
Table 1. Main threshold and parameter settings.
NotationDescriptionValueBasis
NNumber of laser beams in one cell to calculate angular size1: First dataset and parameter test: 5∗n with n = 1, 2, ...10
2: Second dataset: 10
1: For test purpose
2: Empirically based on parameter test result
ρGRadial size1: First dataset and parameter test: (0.1 m, 2 m) with interval of 0.1 m
2: Second dataset: 0.5 m
1: For test purpose
2: Empirically based on parameter test result
npDoPP thresholdAutomaticEquation (7)
-Height difference threshold3.5 mBasic knowledge of real world
THThreshold of HHRMin{0.4, OTSU result}0.4: to avoid a very large threshold in case only single-facade buldings exist
TCThreshold of CompactneeMax{0.65, OTSU result}0.65: to avoid a very small threshold in case only facade cells exist
-Threshold of planar ratio80%Previous work in [38]
Table 2. Comparison of the proposed and original DoPP filtering. For the two methods, 200 and 300 groups of parameters are generated respectively. The corresponding results are in the form of mean ± standard deviation of all runs. The empirical parameter of the original DoPP filtering is set according to [24,57].
MethodThresholdCompletenessCorrectness
Proposed methodAdaptive threshold89.95% ± 8.71%80.74% ± 10.73%
Original DoPPFixed threshold88.42% ± 4.47%58.74% ± 6.22%
Empirical threshold91.65%64.82%
Table 3. Building-based evaluation and comparison between different grid-based methods.
MethodTPFPFNCompletenessCorrectness
Method in [26]1015567%40%
Method in [28]112473%85%
Original DoPP96660%60%
Proposed method142193%88%
Table 4. Comparison with classification method [31] in terms of point-based evaluation.
MethodCompletenessCorrectnessF1Time/s
The proposed method91.8%99.8%95.6%970
Classification method93.1%95.3%94.2%>3600
Table 5. Time complexity of different stages in the proposed method.
StageComplexityMeaning of the Symbols
DoPP filteringO(N1)N1 is the number of non-ground points.
Facade extraction (not including planar ratio calculation)O(N2)N2 is the number of points after DoPP filtering; N2 < N1.
Facade extraction (model-based planar ratio calculation)O(N3)Theoretically, N3 is the rough point number of long and thin non-facade objects and facades which are not multi-wall type; N3 < N2.
Facade extraction (point-based planar ratio calculation)O(kN4log2 N4 + N4)Theoretically, N3 is the rough point number of long and thin objects, which cannot be fitted with one plane; k is the nearest neighbor; N4 < N3.
Roof extractionO(kN5log2 N5 + N5)Theoretically, N5 is the rough point number of roof points; N5 < N1–N2.
Publisher’s Note: MDPI stays neutral with regard to jurisdictional claims in published maps and institutional affiliations.

