
A High-Dimensional Indexing Model for Multi-Source Remote Sensing Big Data

1
School of Information Science and Technology, University of Science and Technology of China, Hefei 230026, China
2
Institute of Electronics, Chinese Academy of Sciences, Suzhou 215123, China
3
Aerospace Information Research Institute, Chinese Academy of Sciences, Beijing 100094, China
*
Author to whom correspondence should be addressed.
Remote Sens. 2021, 13(7), 1314; https://doi.org/10.3390/rs13071314
Submission received: 15 February 2021
/
Revised: 24 March 2021
/
Accepted: 24 March 2021
/
Published: 30 March 2021
(This article belongs to the Collection Google Earth Engine Applications)
Abstract
:With continuous improvement of earth observation technology, source, and volume of remote sensing data are gradually enriched. It is critical to realize unified organization and to form data sharing service capabilities for massive remote sensing data effectively. We design a hierarchical multi-dimensional hybrid indexing model (HMDH), to address the problems in underlying organization and management, and improve query efficiency. Firstly, we establish remote sensing data grid as the smallest unit carrying and processing spatio-temporal information. We implement the construction of the HMDH in two steps, data classification based on fuzzy clustering algorithm, and classification optimization based on recursive neighborhood search algorithm. Then, we construct a hierarchical “cube” structure, filled with continuous space filling curves, to complete the coding of the HMDH. The HMDH reduces the amount of data to 6–17% and improves the accuracy to more than eight times than traditional grid model. Moreover, it can reduce the query time to 25% in some query scenarios than algorithms selected as the baseline in this paper. The HMDH model proposed can be used to solve the efficiency problems of fast and joint retrieval of remote sensing data. It extends the pattens of data sharing service and has a high application value.
1. Introduction
1.1. Research Background
With the continuous development of earth observation technology, data from different imaging methods coexist. Remote sensing data are more and more diversified and their types are becoming more and more abundant. At the same time, the spatial resolution, time resolution, spectral resolution, and radiation resolution of remote sensing data are getting higher and higher. The acquisition speed of remote sensing data is accelerating, leading to shortened update cycle and significant increase in data volume [1,2]. Remote sensing data presents obvious "big data" characteristics, such as large capacity, high efficiency, multiple types, difficult to identify, high value, etc. Further, it has been widely used in many fields such as national defense, agriculture, water conservancy, land planning, smart cities, disaster warning, geological survey, and emergency monitoring and so on [3,4,5]. These massive amounts of remote sensing data have different sources and different structures. However they have time, spatial and data characteristics, and can comprehensively reflect the surface of the earth in multiple granularities, multiple temporal phases, multiple directions, and multiple levels [1]. On the one hand, it can form a complementary relationship with other spatial big data such as GIS data. On the other hand, the generalized remote sensing big data include all non-contact imaging data, the integrated information mining of which can reveal more earth knowledge and changing laws [1,2,3]. Therefore, we should organize and manage remote sensing big data in a unified manner, eliminate their structural differences, and realize the fusion of multi-source remote sensing data. In doing so, it will help fully tap its application value and provide comprehensive and diversified information support for data analysis, command, and decision-making and other fields. For example, in the application of remote sensing detection of forest fires, it is necessary to interpret the fire point data from the medium and high-resolution satellite data with shortwave infrared and visible light near infrared bands. However, due to the characteristics of a single satellite, the increase in spatial resolution is often at the cost of time resolution. Therefore, it is necessary to integrate the hyperspectral and multispectral data generated by multiple satellites, so as to realize near real-time and accurate monitoring of forest fire occurrence and fire situation.
Remote sensing big data has the characteristics of large data volume, wide distribution, multi-scale, and multi-time equal [6]. Efficient access of remote sensing data is the basis for realizing remote sensing big data management and analysis, in order to meet real-time, comprehensive, and system requirements. However, suffering from their discrepancies in data format, metadata structure and processing methods, remote sensing data obtained by different types of sensors are usually difficult to organize in a unified manner, easy to lead to isolated data island. Huge challenges are brought to the efficient access of remote sensing data. Solving the consistency problem of multi-source remote sensing data organization specifications, realizing efficient organization and management of multi-source remote sensing big data, and providing multi-dimensional and efficient data retrieval capabilities, are the foci of remote sensing big data research field.
1.2. Paper Organization
This paper takes the main problems faced by remote sensing big data in the application process as an entry. It introduces the research background and related research progress of remote sensing big data organization and management, followed by the main research content of this paper—a hierarchical multi-dimensional hybrid indexing model (HMDH). The basic concepts involved in the construction of the HMDH model are introduced. We construct the HMDH on several types of remote sensing datasets and set up retrieval experiments, to prove the usability and universality of the HMDH. Finally, we conclude this study and look forward to the future work.
2. Materials and Methods
2.1. The Outline of Hierarchical Multi-Dimensional Hybrid Indexing Model
2.1.1. Related Work
As the amount of remote sensing data continues to grow, the magnitude order of remote sensing data has increased from GB to TB and PB, and will increase continually in the future. The application of remote sensing big data is also developing in the direction of networking and integration [1,7,8]. Many countries have launched national-level spatial data infrastructure plans, providing services for accessing and downloading remote sensing data and various thematic data, to provide support for the application of remote sensing data in meteorology and hydrology, agricultural water conservancy, land planning, earthquake resistance and disaster reduction, etc. [1]. For example, there is a spatial information portal established by the US government abroad, and there are the geospatial data cloud released by the Computer Network Information Center of the Chinese Academy of Sciences, and the national science and technology resource sharing service platform provided by the National Earth System Science Data Center in China [9,10,11]. All of these platforms provide remote sensing data sharing capabilities. However, with the expansion of remote sensing data applications, the drawbacks of these platforms have become increasingly prominent. First of all, the remote sensing data retrieval methods provided by the above platforms are relatively simple. Although some platforms provide the ability to query remote sensing data within a certain space in the form of frame selection, which provides convenience for users to screen remote sensing data to a certain extent, there are still deficiencies in meeting the user’s needs for data retrieval. Secondly, there is no unified organization and management capability for multi-source remote sensing data. After obtaining the data, users need to conduct a customized preprocessing process for the differences of various types of remote sensing data, in order to carry out subsequent business-related work content.
In the era of remote sensing big data, it is necessary to achieve further technological breakthroughs in the efficient storage and management of massive multi-source remote sensing data. Only by solving the consistency problem of the organization specifications of multi-source remote sensing data, realizing the unified organization and management of massive remote sensing data, and providing efficient data access mechanisms and sharing capabilities, can it meet the needs of data-intensive and computationally intensive remote sensing applications.
In terms of remote sensing data organization and management, a lot of related work has been done at home and abroad. Among them, the main achievements abroad include Google Earth Engine, Google Maps, Bing Maps, World Wind, and ERDAS APOLLO. In China, there is a comprehensive geographic information service website built by The State Bureau of Surveying and Mapping, Map World [12]. It uses distributed storage technology to store global geographic information data and realizes geographic information resource sharing. However, there are many shortcomings in these services. On one hand, the data objects are mainly processed image data in JPEG/PNG format, whose own multi-dimensional attributes are lost, such as spatial dimension, time dimension, and event dimension, and it is difficult to meet the needs of other applications besides data visualization. On the other hand, in the process of standardized organization of remote sensing data, more attention was paid to the vertical multi-resolution pyramid structure, whereas the horizontal organization of multi-source remote sensing data within the same geographic area was ignored [12,13]. In addition, there are solutions for remote sensing data integration, such as data cube [14,15] and Analysis Ready Data (ARD) [16]. The Australian Geoscience Data Cube (AGDC) is a “Big Data” infrastructure that aims to realize the full potential of Earth observation data holdings for Australia, including geometric and radiometric corrections to Earth observation data to produce standardized surface reflectance measurements that support time-series analysis, and collection management systems which track the provenance of each Data Cube product and formalize re-processing decisions [14]. The Swiss Data Cube (SDC) is a new paradigm revolutionizing the way users can interact with EO data, lowering the barrier caused by Big Data challenges and providing access to large spatiotemporal data in an analysis ready format [15]. Most of these studies use metadata to organize and manage remote sensing data. They construct a logical multi-dimensional data model through the data link of remote sensing data and metadata information to solve the problem of multi-dimensional unified organization and rapid calculation of remote sensing source data. The United States Geological Survey (USGS) released the first version of Landsat Analysis Ready Data, to provided Landsat data for the conterminous United States (CONUS), Alaska, and Hawaii in formats that can be directly compared for change and time series analysis [16]. ARD solves the problems of high application cost and complicated pre-processing process of satellite data for users, and opens up the path between remote sensing data acquisition and application. However, there is still a lot of work for users to quickly extracting the data of interest from these massive amounts of data.
Therefore, we need to address the shortcomings of the above remote sensing data integration and sharing platforms, combine the needs of remote sensing big data in application, effectively organize the storage of remote sensing big data, design a reasonable storage management architecture, and provide multi-dimensional and efficient data retrieval capabilities. Therefore, in view of the shortcomings in the above two types of remote sensing data sharing platforms, we need to design a reasonable storage management architecture based on the application requirements to effectively organize and store remote sensing big data, and to provide multi-dimensional and efficient data retrieval capabilities.
The researches on the storage and retrieval of remote sensing big data are mainly divided into two categories. One is to expand the traditional relational database, that is to increase spatial operation support to realize the storage and management of remote sensing data; the other is to build a non-relational (NoSQL) database based on a distributed file system, and process data relying on the parallel computing framework [17]. However, due to the characteristics of remote sensing data such as multi-source, heterogeneous, and heterogeneity, relational databases cannot meet requirements in terms of structured data extension and non-structured data management. Meanwhile, relational databases need to re-create the index when data are updated, and always take a long time, leading to poor performance in fast storage and efficient retrieval of massive remote sensing data [17]. Modern storage technology is developing in the direction of distributed and large-scale clustering, providing some solutions for the organization and storage of remote sensing big data. Therefore, to address problems of traditional relational databases in remote sensing data storage, distributed NoSQL databases such as HBase are usually used to construct structured storage to realize management of large-scale remote sensing data, including high-resolution remote sensing images and vector data, and to provide capabilities to retrieval and access remote sensing data efficiently [13]. Wang et al. [18] proposed and implemented a massive spatial data distributed cloud storage management and access service solution based on NoSQL database technology and vector raster data integration. In [19], based on the distributed column database HBase, an index suitable for distributed storage of massive image data was proposed to improve the query efficiency of massive data. In [20], focusing on the storage and management of massive, high-throughput, spatially structured remote sensing image data and its basic land information products, a remote sensing resource storage management method using big data architecture was proposed, and a prototype system was implemented based on the MongoDB database.
Due to the huge volume of remote sensing data, in addition to designing a reasonable storage structure, it is also necessary to design an efficient spatiotemporal data remote sensing data index to improve data retrieval efficiency. Researches on spatio-temporal index are usually to improve and expand traditional spatial indexes in dimensions, such as time dimension, and the earliest research can be traced back to the 1970s. In [21], the quadtree index was proposed, which divided nodes into four regions in a two-dimensional space to solve the problem of combined query of data. In [22], a multi-dimensional binary tree (KD tree) in which each node is a k-dimensional point was introduced, and it could be used to store k-dimensional data; In [23], K-D-B tree divided the space into two subspaces, thereby improving the search efficiency of the balanced KD tree; and in [24], R tree was proposed, which stored the smallest bounding rectangle of spatial data in leaf nodes, and the middle node was formed by gathering the bounding rectangles of lower nodes. In [25], based on analysis of the limitations of traditional R-tree for multi-scale expression of spatial data, SDMR tree, a deformed R-tree index structure for multi-scale expression of spatial data was proposed. Afterwards, researchers merged multiple index structures to form a hybrid index based on multiple tree structures. In [26], a multi-level hybrid index based on grid and R tree was put forward; In [27], KD tree and R tree were combined to be used in research on multi-dimensional cloud data index structure. The spatio-temporal index should provide multi-scale retrieval capabilities for remote sensing data in dimensions such as time and attributes. However, with the dimensionality of the remote sensing data gradually increases, the depth of the spatio-temporal index based on a tree structure alone will increase, and the query efficiency will be significantly reduced, resulting in the curse of dimensionality [28]. Therefore, it is necessary to map the data in the high-dimensional space to the one-dimensional space to realize the dimensionality reduction of the remote sensing data. Index technology based on space filling curve is one of the effective methods which can solve the multi-dimensional indexing problem of remote sensing data [19]. Ref. [29] proposed the Hilbert R tree, which uses Hilbert curve to perform one-dimensional sorting on k-dimensional space data to improve node storage utilization. Ref. [30] realized the tile map service spatial index based on the Z curve. Ref. [31] combined the Z curve with the Hilbert curve, and proposed a massive terrain data management scheme based on tile quadtree and space filling curve. Ref. [32] compared several typical space filling curves and analyze d their characteristics, and considered that Hilbert curve has better spatial proximity than other space filling curves to ensure that there is the greatest degree of proximity in space between consecutively encoded entities. Ref. [33] proposed a fast coding method of Hilbert curve based on the partitioning, which could reduce the complexity of Hilbert curve coding. Ref. [34] presents a distributed spatio-temporal database with indexing techniques, GeoMesa. It uses space filling curves to map multi-dimensional data to the single lexicographic list managed by the underlying distributed database. Ref. [35] provides GeoWave, a software library that connects the scalability of various distributed computing frameworks and key-value stores with modern geospatial software to store, retrieve, and analyze massive geospatial datasets. Ref. [36] proposes a spatio-temporal data indexing method based on Hilbert code, solving the problem of fast access to spatio-temporal data in the virtual battlefield environment.
2.1.2. HierarchicalMulti-Dimensional Hybrid Indexing Model
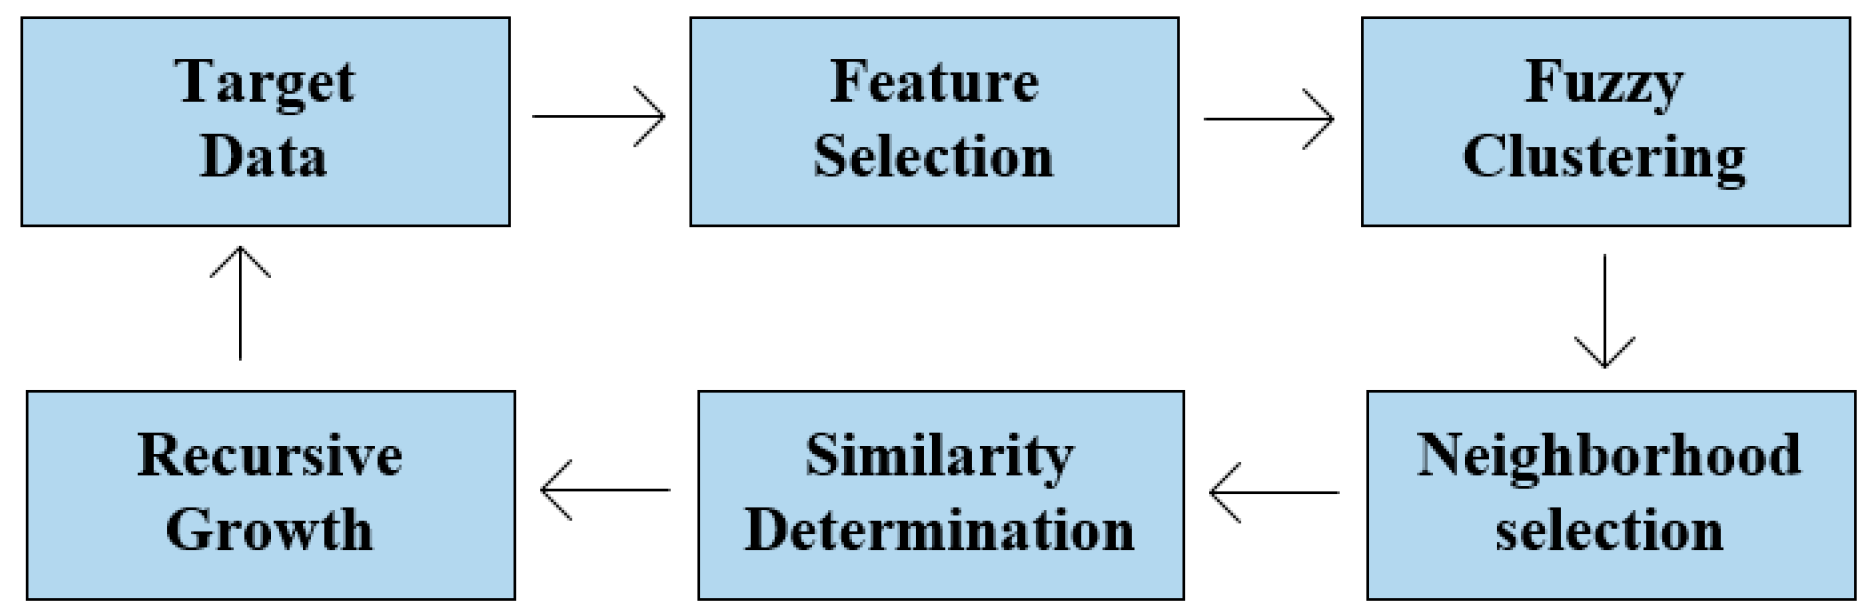
In order to solve the problem of remote sensing big data in underlying data organization and query, we design a hierarchical multi-dimensional hybrid indexing model, as shown in Figure 1. Firstly, incorporating the concept of grids in geospatial data, we use the global seamless multi-level grid recursive subdivision method [4,37] to establish a remote sensing data grid model based on spatial pyramids. We divide the remote sensing data into remote sensing data grids, and extract the time, spatial, data, and other characteristics. Then, we construct a multi-dimensional hybrid indexing model based on data clustering. We use fuzzy clustering algorithm to achieve partition based on data features to divide remote sensing data grid into different datasets, and then, we use recursive neighborhood search algorithm to complete the completion of the dataset based on spatio-temporal characteristics, providing the complete description of the classification under the spatio-temporal grid and forming a structured model of multi-dimensional hybrid index. Next, we map the multi-dimensional hybrid index to remote sensing data storage structure in the dimensions of time, space, and event to construct a "cube" structure. Finally, continuous space curves are designed to fill the grids at different levels to realize the coding of the HMDH index.
In the HMDH model, the main technologies and concepts involved are as follows:
- Quadtree [23]. The data structure of the quadtree is to store the data with two-dimensional keys in a tree, and divide the space plan into different levels of tree structure. For evenly distributed spatial data objects, the quadtree structure usually has relatively high spatial data insertion and query efficiency.
- Fuzzy C-Means (FCM) [38]. Clustering is to divide a group of physical or abstract objects into several groups according to the degree of similarity between them. FCM is a typical fuzzy clustering algorithm, whose basic idea is to use the degree of membership to restrict the degree to which each data sample belongs to a certain class to complete data classification [39,40,41,42].
- Regional growth [45,46]. Region growth is a region-based image segmentation technology, which is a process of combining pixels or sub-regions into larger regions according to predefined growth criteria. The basic method of region growth is to start from a set of “seed points“, which neighbor pixels with properties similar to the pre-defined seeds are added to each seed to form these growth regions [46,47].
2.2. Construction of Hierarchical Multi-Dimensional Hybrid Indexing Model
Remote sensing data are quite different in terms of organizational structure, spatial resolution, time resolution, etc. Taking remote sensing image data as an example, due to varying degrees of influence by sensors, errors, and other factors, even the resolutions of data describing the same geographic area are quite different. These data are usually isolated from each other and cannot be managed and used uniformly. Therefore, it is necessary to establish a grid model to realize the unified organization and management of remote sensing data.
On the basis of the remote sensing data grid, in order to accurately and quickly retrieve and access target data, it is necessary to find the optimal feature combination of the remote sensing data ontology to achieve data pre-classification. This paper combines the data features of a single grid in the remote sensing data grid and the space and time attributes of the data, and uses fuzzy clustering based on spatio-temporal feature fusion to realize the pre-classification process of remote sensing data, and divide the target data grid into the correct dataset.
In this section, we respectively introduce the construction process of remote sensing data grid and the realization process of fuzzy clustering with spatio-temporal features, and explain in detail how to realize remote sensing data clustering based on the feature fusion of remote sensing data.
2.2.1. Remote Sensing Data Grid
In order to realize the unified organization of remote sensing data, we have proposed a remote sensing data grid, which organizes remote sensing data from multiple aspects such as spatial resolutions, time resolutions and data structures. The specific organization is as follows. The structure of the remote sensing data grid is shown in Figure 2.
- Integration across Spatial Resolutions. Refer to the traditional pyramid technology, the remote sensing data grid is the data grid model based on the spatial pyramid, which breaks up data according to uniform rules, associates spatio-temporal information is with data grids of different scales, and optimize data structure using data spatio-temporal attributes.
- Integration across Time Resolutions. We extract remote sensing data in the time dimension by establishing time slices of different thicknesses in the time dimension. The time attribute of the data is decomposed according to the smallest time granularity, and then it is aggregated step by step from low to high resolution in the time dimension to form time series of different scales.
- Integration across Data Structures. From the two aspects, remote sensing data description and remote sensing data content, we carry out data integration between unstructured and structured remote sensing data. In terms of remote sensing data description, we analyze the characteristics of remote sensing data to define a unified meta-information model, which can provide a comprehensive and unified standardized description of remote sensing data. A metadata model can include content such as data identification, data source, geographic location, shooting time, storage path, spatial coordinate reference system, and so on. We use relational databases to store meta-information extracted from remote sensing data. In terms of remote sensing data content integration, we realize unified storage of remote sensing data based on NoSQL database, storing remote sensing data of different structures by expanding different columns. Based on the grid model, the correlation between data is established in spatial and time dimensions, which is defined in the key of remote sensing data retrieval, and the remote sensing data with different structures can be extracted at one time based on a unified data key.
The smallest unit of the remote sensing data grid has attributes such as resolution and spatial range, and is expressed in encoding with its resolution level, row order, and column order. Figure 2 shows the structure of one of the quadtrees. As the level value increases, the spatial resolution corresponding to each level gradually increases. In the construction of the pyramidal grid model, the spatial resolution expressed by each grid on different layer is
where and represents the maximum and minimum value of the longitude range of the current coordinate system, respectively, represents the level of current grid, represents the resolution, and represents the size of current grid.
The calculation formulas of grid data coordinates (column number, row number) are
where and represent the row number and column number of the grid, respectively. and represent the longitude and latitude positions of the grid center. and represent the minimum longitude and maximum latitude of the current coordinate system, and represents the size of the longitude range and latitude range represented by each grid [48,49,50].
The construction process of remote sensing data grid based on spatial pyramid is as follows:
- Associate spatio-temporal information on the basis of the pyramidal grid hierarchy, and establish the correspondence between remote sensing data and grid models according to the spatial resolution and geographic scope of the remote sensing data.
- Copy the remote sensing data to the relevant position in the grid based on the correspondence to obtain a grid generated from the remote sensing data.
- Use resampling algorithm (such as bilinear interpolation algorithm) to down sampling remote sensing data step by step to obtain grid data at lower resolution levels, thereby obtaining a complete remote sensing data pyramid.
- Sample multi-source remote sensing data on a unified remote sensing data pyramid hierarchy to form a hierarchical structure, realize multi-scale management of data, and obtain a global remote sensing data pyramid.
2.2.2. Clustering Optimization Based on Fusion of Spatio-Temporal Feature
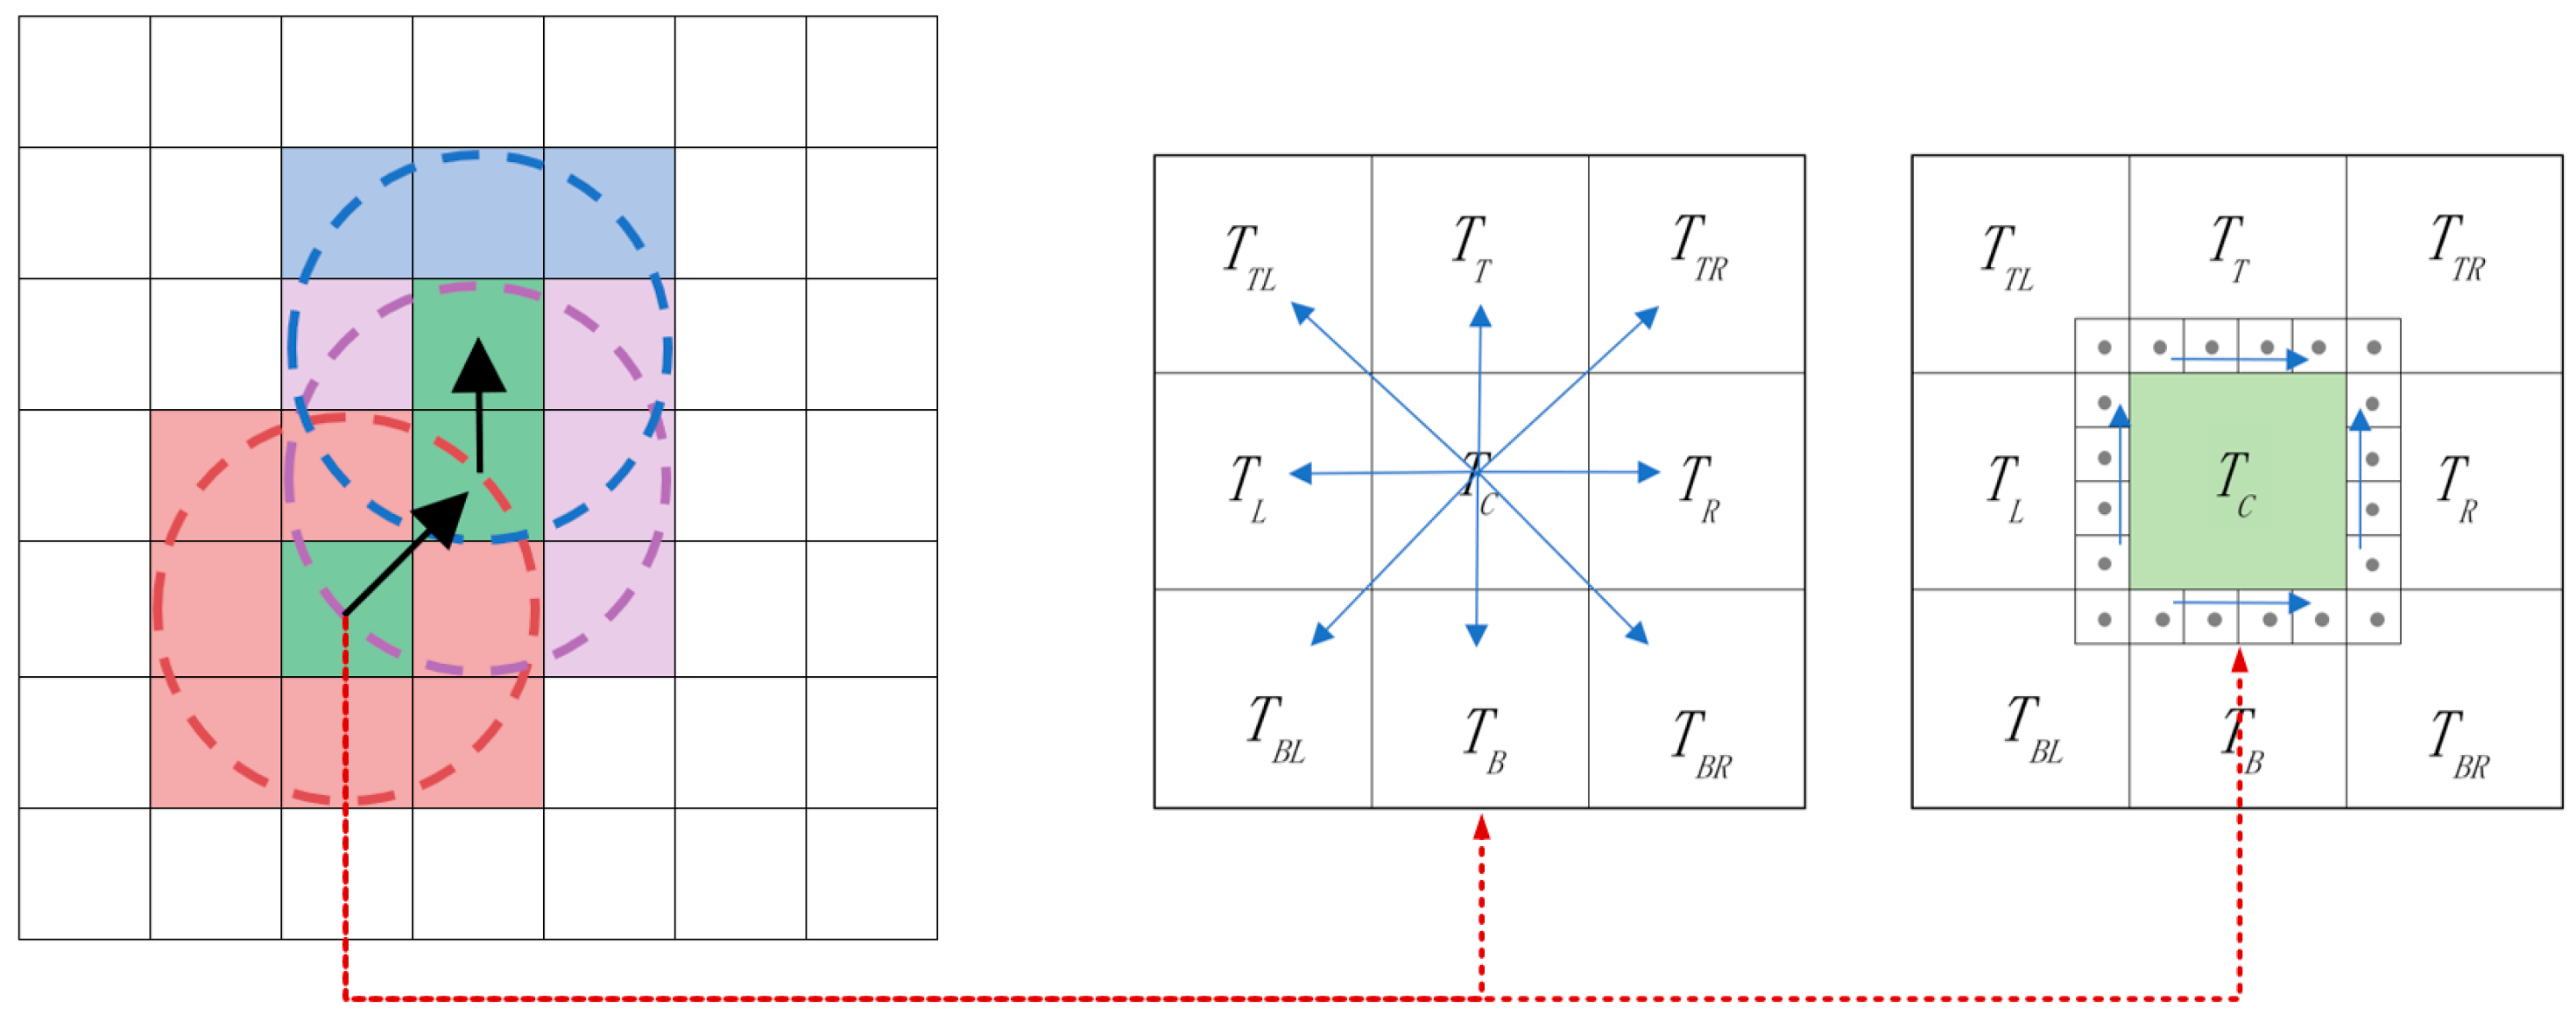
On the basis of the remote sensing data grid, in order to accurately and quickly retrieve and access the target data, it is necessary to perform feature clustering and association on the multi-source data at first, and find the optimal feature combination of the data ontology to achieve data pre-classification. Considering that in the pyramid grid, a single grid is the smallest carrier of spatio-temporal information and usually contains multi-dimensional information, especially in the grid layer of small scale, due to the size limitation, local locations have semantic information belonging to multiple categories and will lead the clustering results to be discontinuous, that is, cliff phenomenon. Therefore, the accuracy of clustering results obtained only by the features of the data ontology is low. To remedy the impact on the classification results, we use the neighborhood search strategy to determine the similarity of the edges of the target data, according to the connectivity of the spatial location of the remote sensing data, and divide the grid containing multiple semantics to the correct dataset, as shown in Figure 3.
We use the optimized FCM algorithm to divide the remote sensing dataset. Firstly, we select the combination of statistical feature of the remote sensing data as the basis of classification, and choose one or several combined features of the remote sensing data as a set of vectors to calculate, and determine the association relationship between the data grids containing the same objects from the grid dataset, extract object information and group remote sensing datasets based on the similarity of features between grid data, to obtain remote sensing datasets containing different feature elements.
Firstly, we fuse the multi-source features of the remote sensing data by expanding the data dimension of the FCM algorithm, and use weighting factors to adjust the degree of contribution of different features of the remote sensing data. The modified objective function is as follows:
where is the weighting factor of the kth feature. Whereas determining the weight factor, firstly we set an initial value which satisfies the constraint condition for each feature, then we use the weight to divide the cluster, and feedback the evaluation index of the clustering result to adjust the weight of the feature. Empirical judgment or machine learning method can be used to get the weight factor of each feature in the best classification result after many iterations.
We use four indicators: recall rate, precision rate, accuracy rate, and Kappa coefficient to evaluate the clustering results of remote sensing data, and respectively gives statistics of fuzzy clustering based on single feature and multi-feature fusion, as shown in Figure 4a,b. Figure 4c shows the selection process of each feature weight factor in the multi-source feature fusion, taking the adjustment of the weight coefficient of the mean and histogram of gradient (HOG) [51,52,53,54,55] as an example, and gives cluster evaluation results with different weights.
In Figure 4, the clustering based on multi-source image features has a higher recall rate than single image feature clustering, the completeness of the remote sensing dataset obtained has been partially improved, whereas the precision, accuracy, and Kappa coefficient have been reduced; in the process of feature weight adjustment, by setting reasonable feature weight coefficients, the recall rate of clustering results can be improved on the premise that the precision rate, accuracy rate, and Kappa coefficient and other indicators maintain a high level, therefore, the completeness of remote sensing dataset extraction can be enhanced.
In Figure 5, the thumbnails of the remote sensing dataset after clustering at each stage are given, and the gray and red rectangular boxes are used to identify the data grid in the dataset and the new data grid compared with the result of the previous stage of the clustering process to more intuitively represent the clustering results using single feature, multi-feature fusion, and optimized feature weight.
Figure 5 shows that the use of a single image feature can identify most lake grids, but the recognition effect is poor in the edge region; compared with a single feature, clustering based on gray level mean and HOG feature fusion improve the integrity of some edge regions of the lake dataset; the adjustment of the feature weight factor contributes to the accuracy of remote sensing data grid division and the completeness of remote sensing datasets.
In the process of clustering analysis based on image features, the amount of image feature data is reduced in feature extraction, resulting in the loss of some continuity details in the spatial position relationship, so that the remote sensing data grid originally belonging to the same object are divided into different sets. In order to optimize the clustering analysis process to obtain a more accurate remote sensing dataset, temporal, and spatial features are introduced in the remote sensing data classification process to establish the association relationship between remote sensing big data, and achieve data similarity division in the spatio-temporal dimension.
The optimization of fuzzy clustering combined with spatio-temporal features, is to select grids obtained by clustering based on image features which contain some kind of objects as seeds and use a recursive 8-neighborhood search algorithm to judge the similarity between the seed data grid and its neighboring data grid and complete the division of the edge grid, to achieve optimization of clustering results [56,57]. In this paper, the region segmentation algorithm is applied to the grid pyramid, and the difference in pixel value is upgrade to the difference in grid feature value in the regional similarity criterion. We select the grid data with the highest similarity to the cluster center as the seed grid, and use the similarity of the eigenvalues between the seed and its neighboring grids as the judgment basis, and connect the grids that meet the regional growth criteria to achieve grid-level regional growth. As shown in Figure 6, is selected as the seed node, the black arrow indicates the recursive route, and the circular area indicates the search range; that is, a total of 24 similarity determinations are completed in 3 areas.
- Judgment Criterion of Neighborhood Similarity
Regarding data grid with multiple features as a set of data samples in a multi-dimensional feature space, referring to the definition of Euclidean distance, the distance between any two grids in the image feature space of the grid data is defined as:
where is the distance between two grids, , and , respectively, represents the value of two characteristics of an arbitrary grid and the seed grid, and , indicates the weight coefficient when comparing each feature of the grid.
- Grid Area Search Based on 8-Neighborhoods
The process of clustering optimization combined with spatio-temporal features is shown in Figure 7.
The specific process of clustering optimization combined with spatio-temporal features is as follows:
- Judge the similarity between the grid in 8-neighborhoods and the seed grid to determine whether they belong to the same dataset.
- If it belongs to the same dataset, then the 8-neighborhood grid similarity judgment of this neighborhood grid will be performed; otherwise, the search will not continue to the surroundings.
- When judging the similarity of image features in the neighborhood search, it is necessary to judge the cells in the grid from large to small to determine whether they belong to the same dataset.
Figure 8 shows the clustering results based on image features and optimized results using spatio-temporal features, and some differences in the results are identified by rectangular boxes.
As we can know from Figure 8, compared with the clustering method based on image features, the accuracy of the clustering results optimized by using spatio-temporal features at the edge of feature elements is significantly improved, which can ensure the integrity and spatio-temporal continuity of the remote sensing dataset.
2.3. Coding Mechanism of Hierarchical Multi-dimensional Hybrid Indexing Model
Remote sensing data has time, space, and event attributes, which can provide support for the sequence analysis and spatio-temporal change description of remote sensing datasets. Therefore, in order to achieve rapid remote sensing data acquirement, it is necessary to encode the multi-dimensional hybrid index model and establish the mapping relationship between the model and the storage structure, so as to realize the access method of remote sensing data based on the HMDH model.
We use spatio-temporal features to expand data in different dimensions and abstract remote sensing data from the three dimensions of time, space, and event, to form a cube structure, which can clearly show the details of the data in different dimensions. In the cube structure, the event dimension is the fusion representation of various features of the data ontology, and the feature weight can be adjusted by the weight factor.
However, in this cube structure, different dimensions are isolated from each other, and single condition query does not provide complete data retrieval capabilities. Meanwhile, retrieval based on features of different dimensions will increase the complexity due to the combination of conditions, resulting in reduced retrieval efficiency. Therefore, this structure cannot provide efficient retrieval support. Therefore, spatial curve and compression coding are introduced to establish hierarchical remote sensing data index, which reduces the complexity of the data access process.
In this section, we introduce the construction of “cube” structure and coding method continuous mixed index, to explain how to establish the mapping relationship between HMDH model and storage structure.
2.3.1. “Cube” Structure
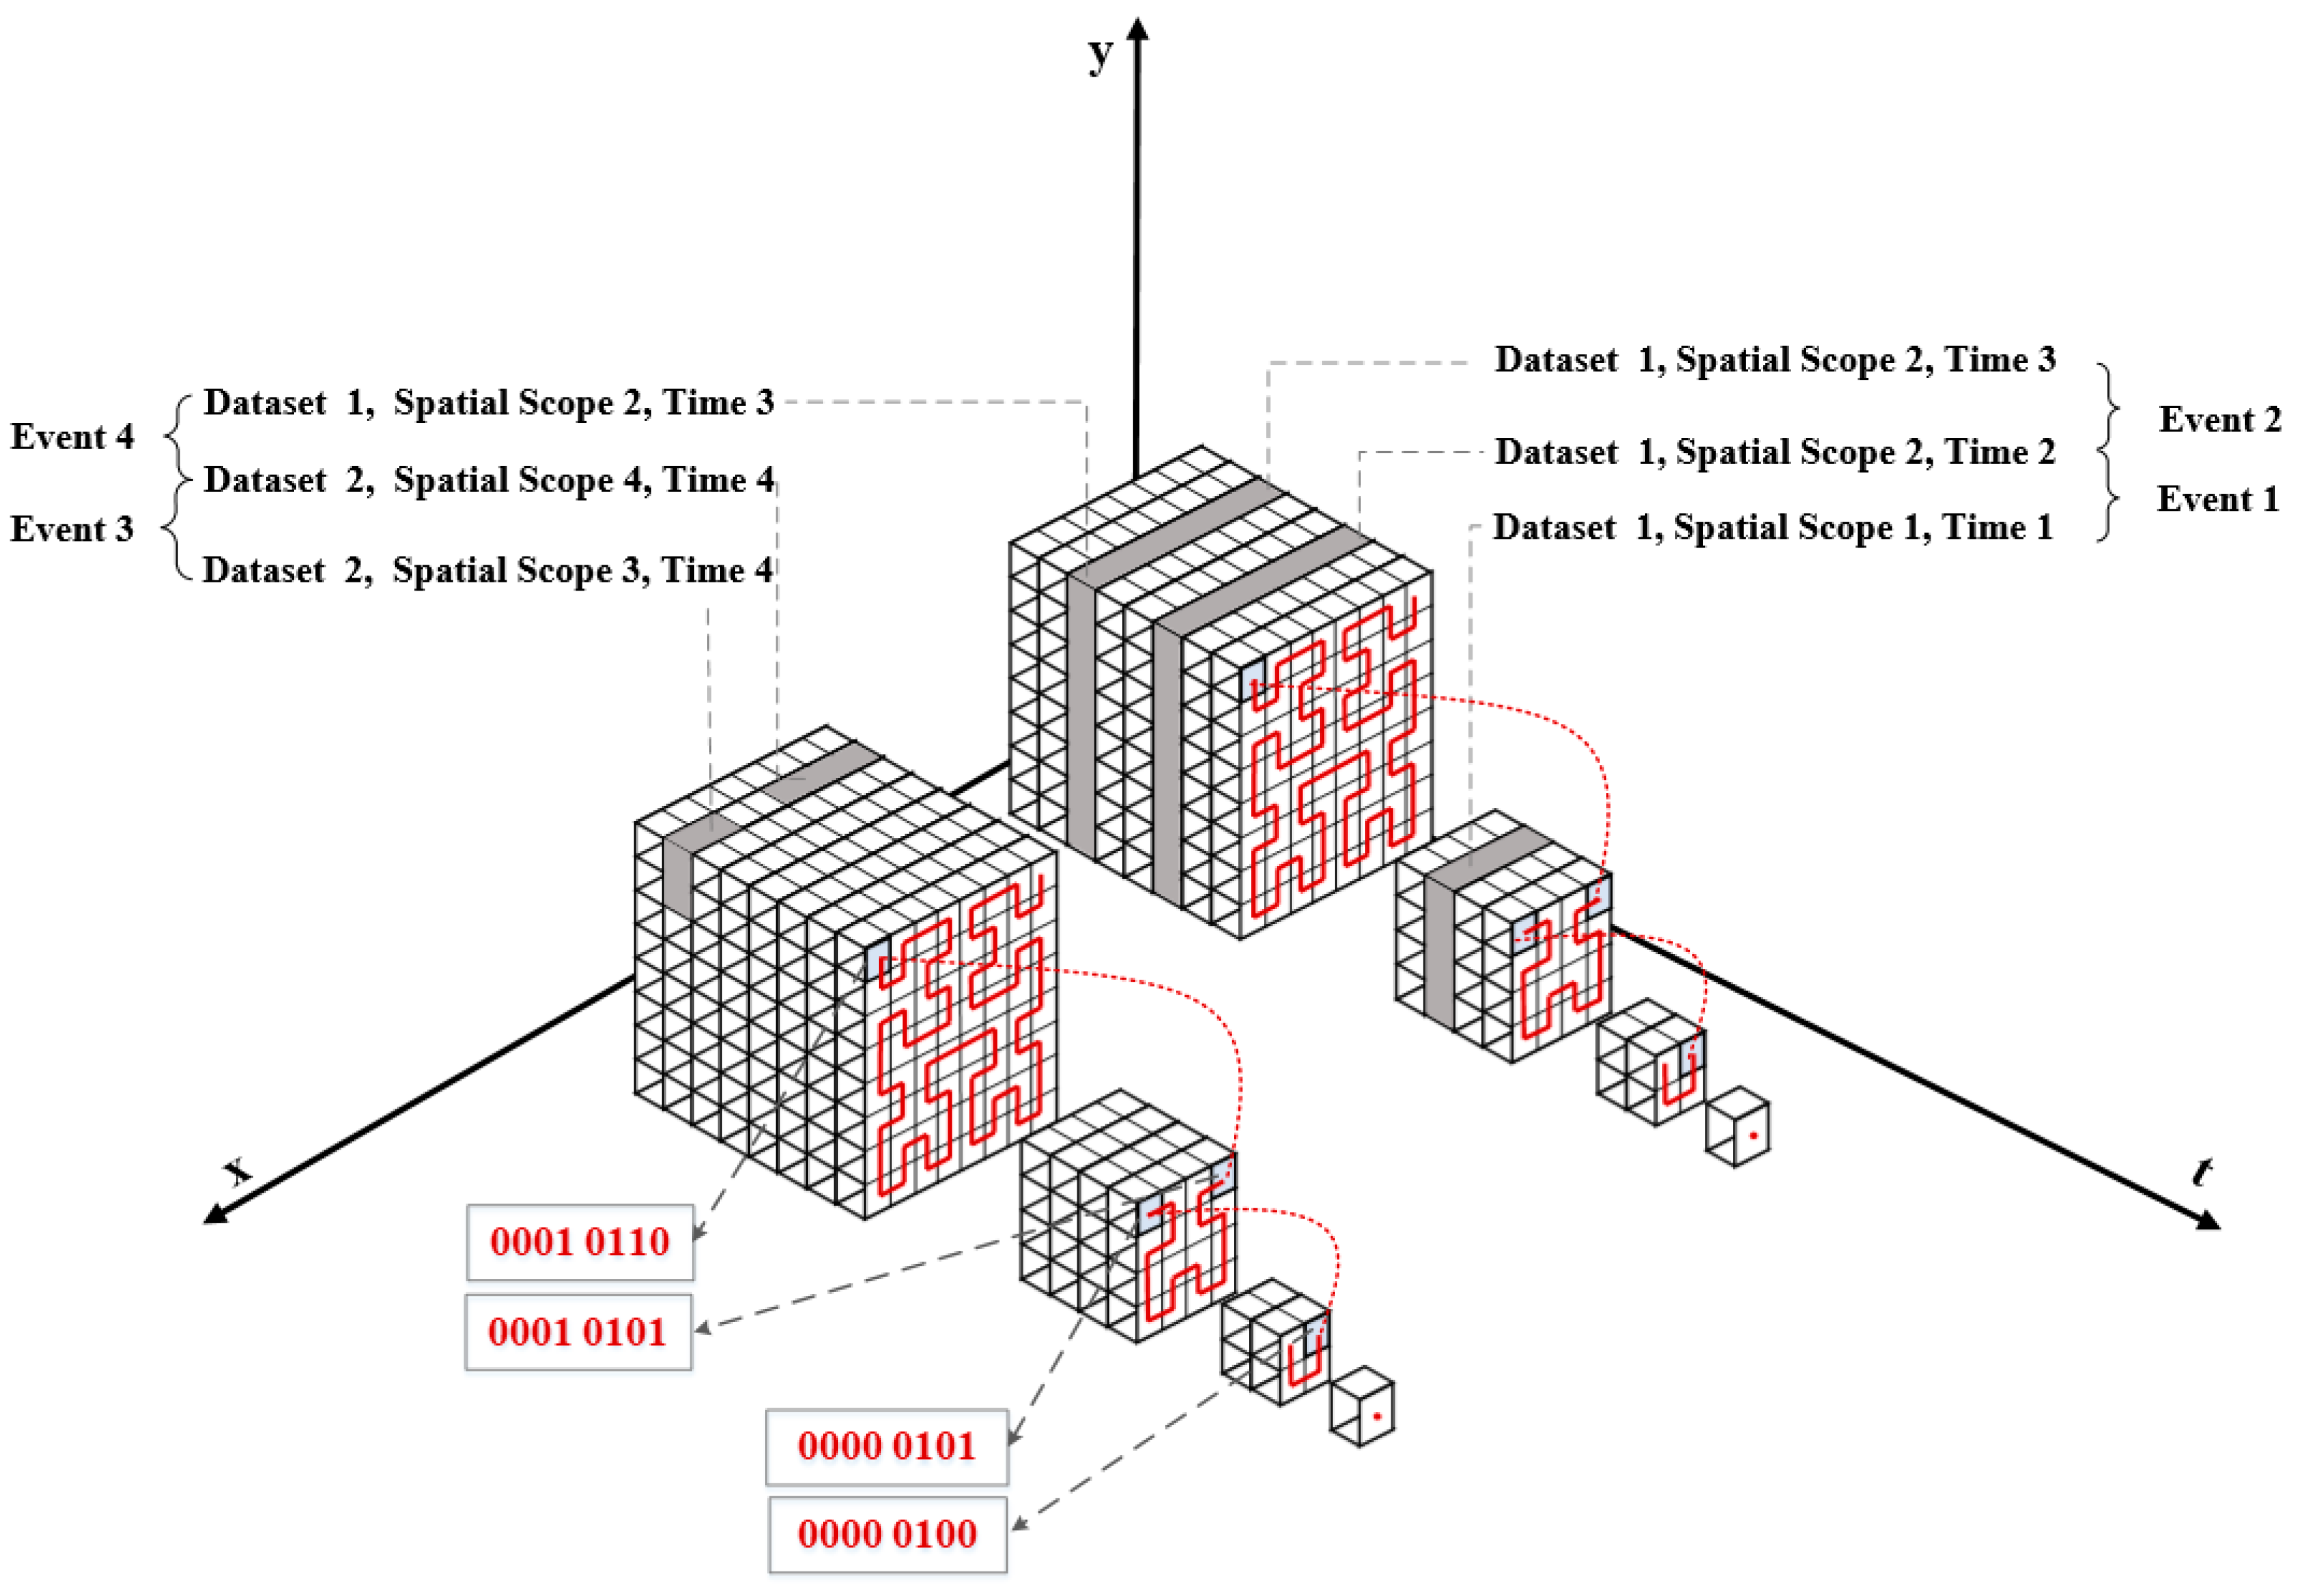
Compared with other types of data, remote sensing data has time and spatial attributes when it is acquired. Where the spatial attribute describes the geographic location and range of the remote sensing data, and the time attributes represent the order in time dimension and life cycle of the remote sensing data and defines the valid time range of the dataset, and event attribute describes the combined range of different time and spatial dimensions. These attributes support the sequence analysis and the description of description of temporal and spatial changes of remote sensing datasets. Therefore, we use these spatio-temporal features as benchmarks to expand the data in different dimensions and establish a unified expression model for remote sensing data. As shown in Figure 9, the “cube” model is an abstract cube model in time dimension, spatial dimension, and event dimension.
In the remote sensing data “cube” model given in Figure 9, the multi-source remote sensing data are divided into different datasets. In the spatial dimension, on the basis of the grid organization model of the pyramid structure, we construct a spatial dataset with uniform geographic scope, spatial resolution, and grid size. In the time dimension, we define the valid time range of the dataset in the form of a timestamp to construct the time dataset. Furthermore, in view of the differences in the data sources and included objects, we extract the event features of remote sensing data based on spatio-temporal correlations to establish a remote sensing data organization model for multi-source remote sensing data, and divide the event influence domain into several units in time and space dimensions, to support users to extract and analyze multi-source remote sensing data based on events.
2.3.2. Hybrid Index Coding
Remote sensing data usually have multi-dimensional features, and single condition query does not provide complete data retrieval capabilities. Meanwhile, the complexity of the combination of conditions brought by retrieval based on features of different dimensions will lead to reduced retrieval efficiency. In this section, we introduce spatial curves and compression coding to build indexes, use spatial curves to connect data of different scales and different sets, and realize a hybrid index based on grid coding, which can be used to converts the feature combination retrieval of different dimensions into the form of batch retrieval to reduce the complexity of the data access process.
Hilbert curve is used to fill the “cube” model at different scales, so that it can traverse all grids in the spatial dimension, and make the curve start and end with the upper left and upper right grids respectively. The space filling curves at different scales are connected end to end in the order of increasing levels to ensure that all grids on the spatio-temporal pyramid model can be uniquely mapped to a point on the space filling curve, thereby realizing dimensionality reduction of the “cube” model [58].
Then, it is necessary to encode the grid nodes in the “cube” model to establish the mapping relationship between the filling result of the Hilbert curve and the key used for the remote sensing data storage to make the data near the spatial location is stored in the adjacent storage space, to guarantee that high efficiency of data storage and retrieval. The encoding process is as follows:
- Divide the grid of the node’s level into four regions evenly according to the spatial position, and number the four regions according to the direction of the space filling curve;
- Calculate the grid offset of each region relative to the starting point;
- Continue to subdivide the area to which the node belongs according to the above process until the number of grids contained in the subarea is 1;
- Accumulate the relative offsets of the sub-areas to which the node belongs during the iteration process to obtain the code of the grid node in this level;
- According to the series relationship of the space filling curve at different resolution levels, the number of grid nodes is corrected; that is, the offset is added on the basis of the foregoing encoding result, and the offset is smaller than all grids of the current level Total, get the complete coding result of the grid node in the entire grid pyramid.
Figure 10 shows a schematic diagram of filling the “cube” model with a space filling curve, and some coding results on layers 1–3. From the coding results in the figure, we can see that this paper proposes that the continuous index space has continuity in spatial dimensions of different scales.
For the continuous index space of the multi-source remote sensing data organization model, the corresponding data table and index table structure are given in Figure 11 and Figure 12, respectively.
In the data table, the Rowkey [59,60,61] is constructed according to the encoding result of Hilbert curve filling to ensure the continuity of the data index in the spatial dimension; in the index table, the data time attribute and event attribute are used as prefixes to construct the Rowkey, to ensure that the index is stored in the same order as the time and event attribute values of the remote sensing data so as to achieve the continuity of the index of the remote sensing data in the time dimension and the event dimension.
Rowkey in the data table mainly includes the grid block identification (BlockID), grid offset (Index), data type (Type), and data production time (Time), as described below:
- BlockID is the grid block ID obtained by dividing the grid according to space. In order to ensure the hashability of the data in distributed storage, the BlockID is stored in reverse order;
- Index is the storage location of the grid in the grid block. The grid data of a certain spatial location can be obtained by prefix matching;
- Type is the basic category to which the data belongs, 0-basic image, 1-vector map, 2-temporal image, and 4-basic elevation;
- Time is the coarse-grained time attribute value extracted from the data, is the production time of the data, accurate to the year.
The data table contains two column clusters, MetaData and TileData. Where MetaData is used to store grid data element information, such as grid task ID, grid data classification, grid transparency, grid data channel number, etc. Moreover, TileData is used to store grid data in different formats, such as png256, jpeg256, png512, and jpeg512, etc. The version of the grid in the data table is its production time in milliseconds.
The Rowkey in the index table mainly includes the retrieval type, retrieval value, and the key of the grid in the data table, described as follows:
- “TIME_yyyyMMdd1_key1” means that the value of the key corresponding to the grid whose time attribute value is “yyyyMMdd1” is key1;
- “TAG_name1_value1_key1” means that the value of the event attribute name1 is the grid data of value1, and the value of the key stored in the data table is key1
- “TIME” and “TAG” are used to distinguish time and event attributes.
The index table contains a column cluster Key, which contains a column Key, which is used to store the key of the grid data in the data table; the version of the grid data in the index table is the data production time.
2.4. Experimental Materials
This paper mainly takes remote sensing data from the following sources as test data to verify the effectiveness and versatility of the HMDH index in multi-source remote sensing data.
2.4.1. Remote Sensing Satellite Image Data
The remote sensing satellite image data used in this test comes from Microsoft’s Bing map service. Data in three regions of the Paracel Islands, Hawaiian Islands, and Qinghai-Tibet Plateau lakes are selected as the test data set, in PNG format.
2.4.2. Digital Elevation Data
The digital elevation data is the global spatial resolution 30 m digital elevation data of the ASTER GDEM V2 version, coming from the Geospatial Data Cloud Platform of the Computer Network Information Center of the Chinese Academy of Sciences, in GeoTiff format.
3. Results and Discussion
3.1. Construction Results of the HMDH
3.1.1. Construction Results of the HMDH for Remote Sensing Image Data
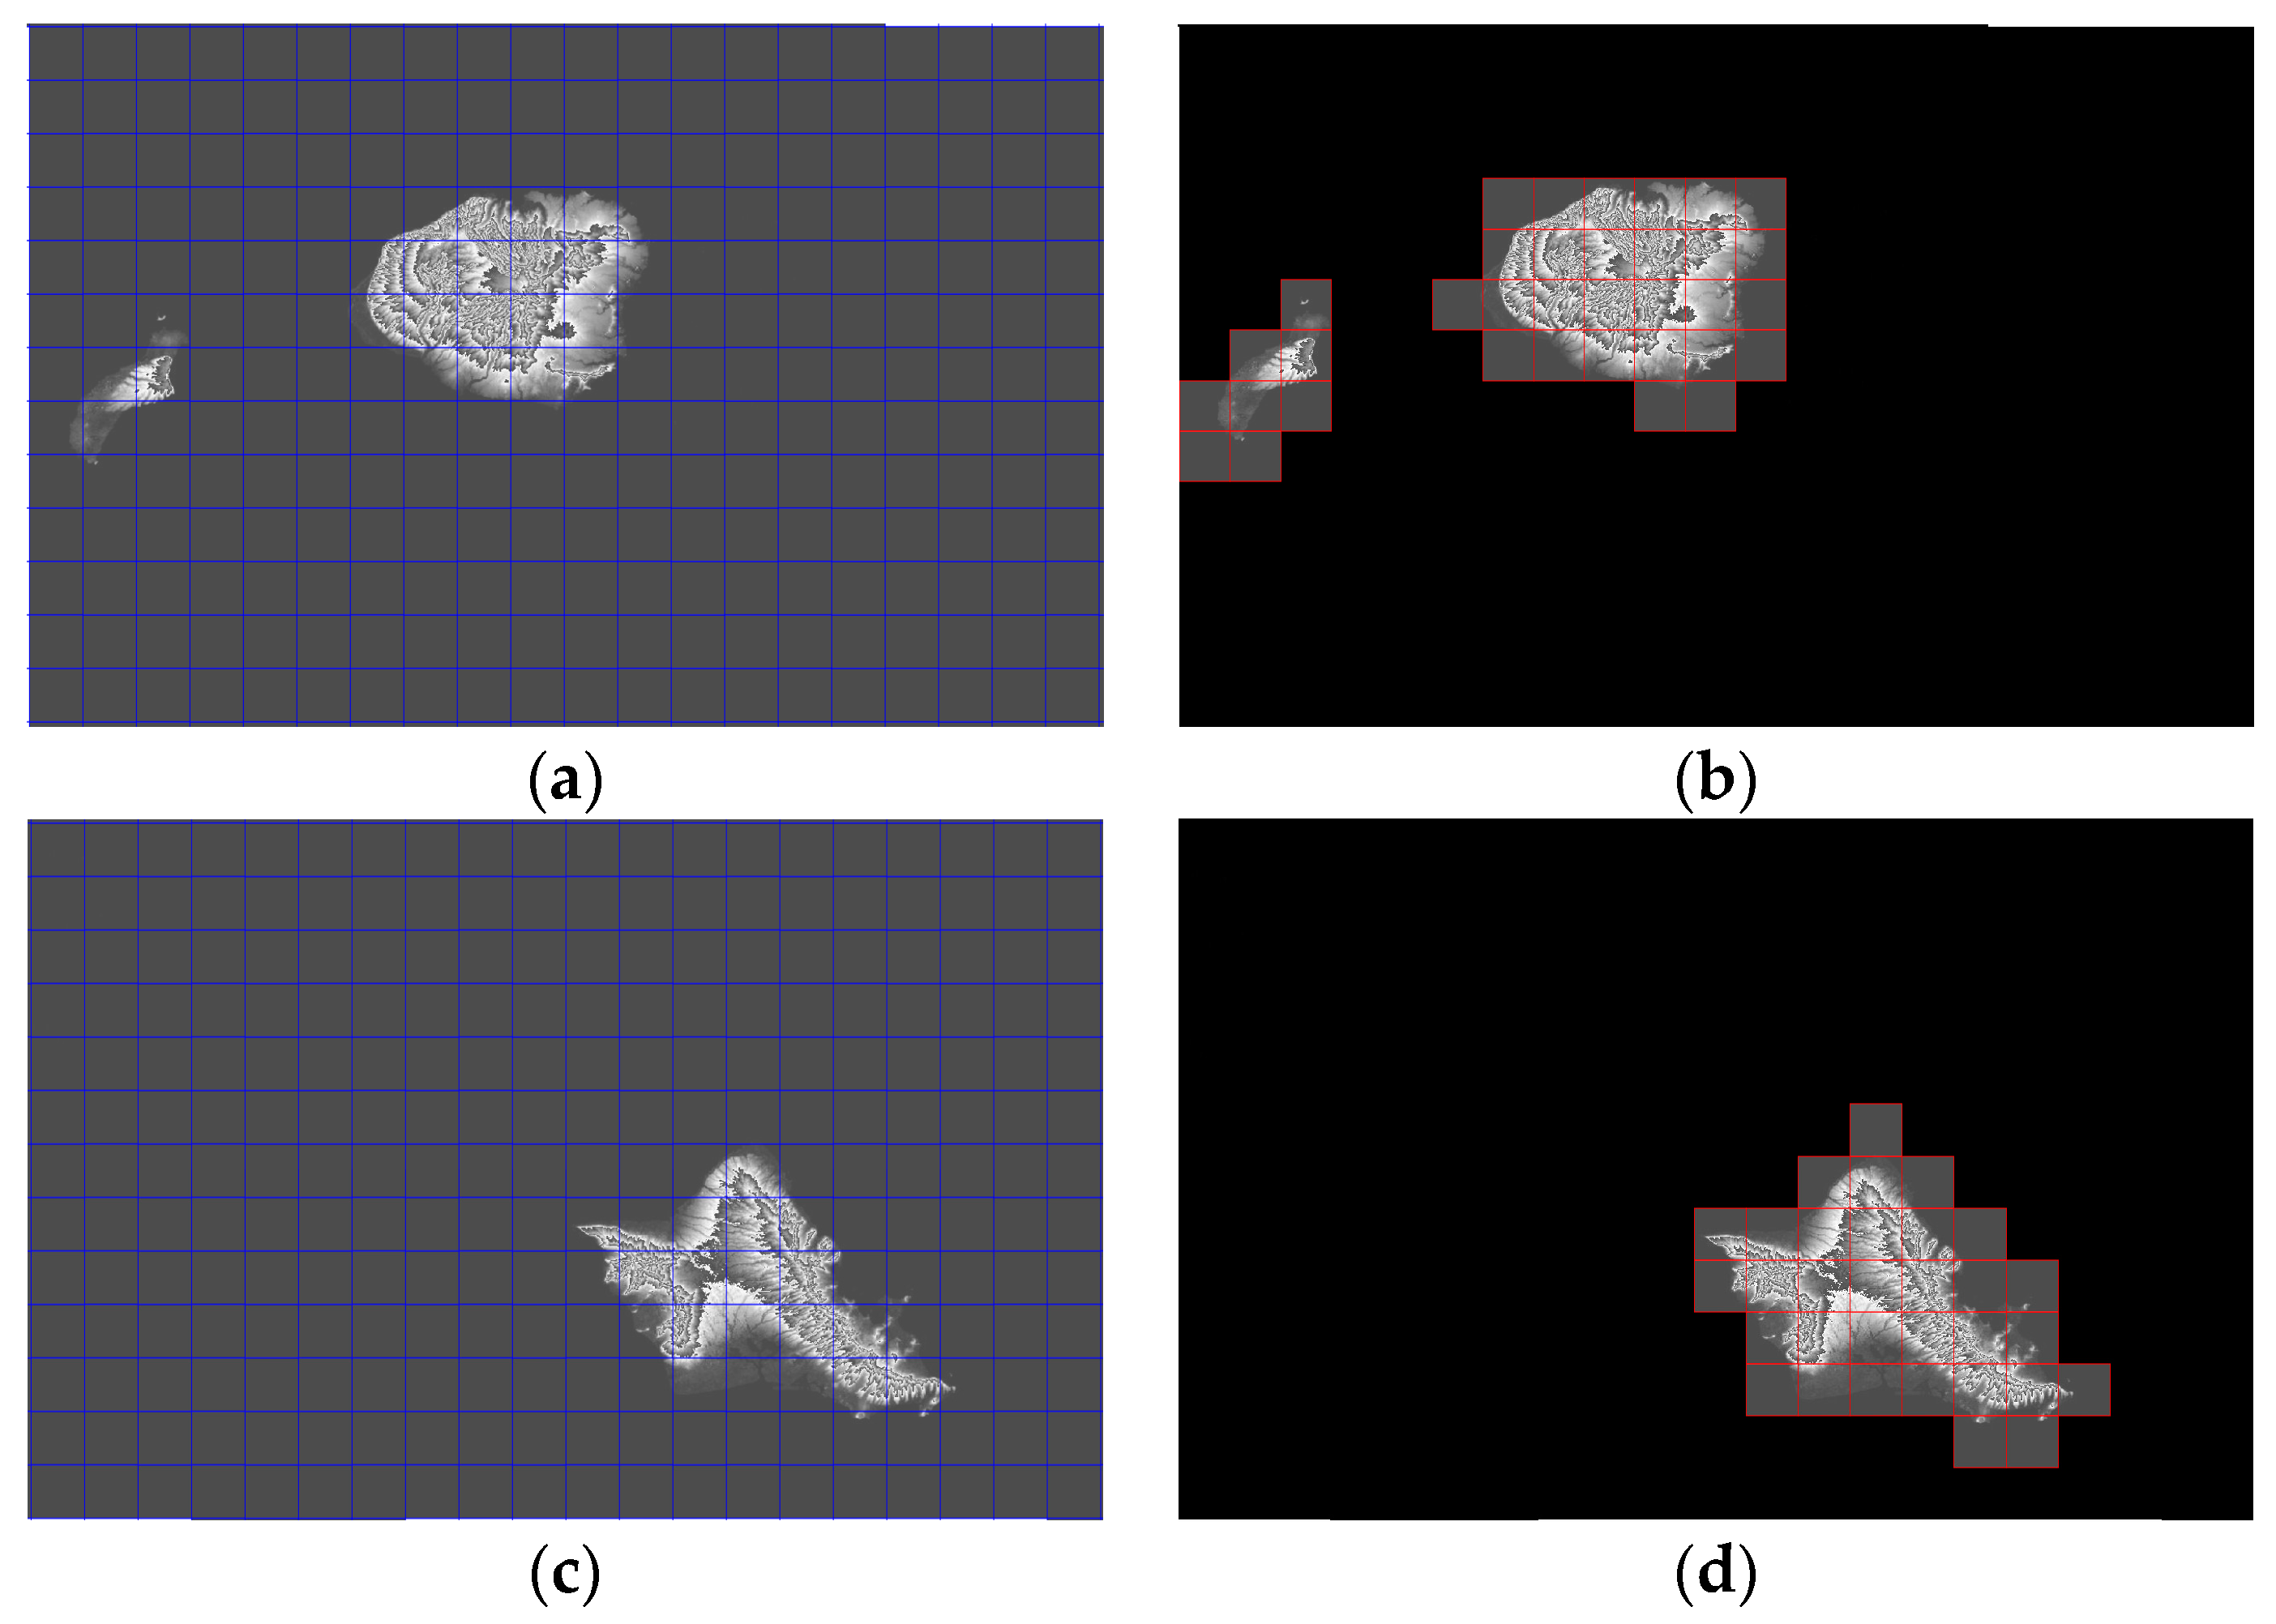
As for remote sensing image data, we select the Paracel Islands dataset, the Hawaiian Islands dataset, and the Qinghai–Tibet Plateau lake dataset. We extract color features, texture features, shape features, such as grayscale histogram, grayscale mean value, variance, standard deviation, color moment, direction gradient histogram, and image principal component feature value and other data features; read the time stamp information from metadata as the data time feature; read the coordinate system information, origin, affine coefficient, and other parameters of the data, calculate the geographic range of the data expression as the data spatial feature. Then we build the HMDH model on this basis. The results are given in Figure 13.
In Figure 13, the experimental visualized results of the three test datasets and their clustering results are given respectively, and grids of the divided remote sensing dataset are marked with a rectangular box.
In the test, the data in the remote sensing dataset is marked by methods such as vector marking and manual elimination. On the basis of the marking results, we calculate the integrity, accuracy, and redundancy of the traditional grid dataset and the clustered dataset to get the effectiveness evaluation result, as shown in Table 1.
Where the integrity indicates the completeness of the objects in the divided dataset, which is represented by the percentage of the number of grids containing objects in the HMDH to the number of all marked image grids in the traditional grid dataset; the accuracy indicates the correctness of the dataset division, which is expressed by the percentage of the number of grids that contains the objects to the total number of grids in the HMDH dataset; the redundancy indicates the degree of redundancy of the image grid in the dataset with respect to the feature target, and it is represented by the percentage of number of the grids that does not contain objects to the total number of grids in the clustered dataset.
It can be seen from Table 1 that the number of grids in the HMDH is reduced to 6%–17% of the traditional grid dataset. The accuracy is increased to more than eight times the original, and the redundancy is significantly reduced. In other words, benefit from the fuzzy clustering method proposed in this paper, the size of the dataset significantly reduced and the accuracy of data clustering is improved, under the premise of ensuring the integrity of the feature elements in the remote sensing dataset.
3.1.2. Construction Results of the HMDH for Digital Elevation Data
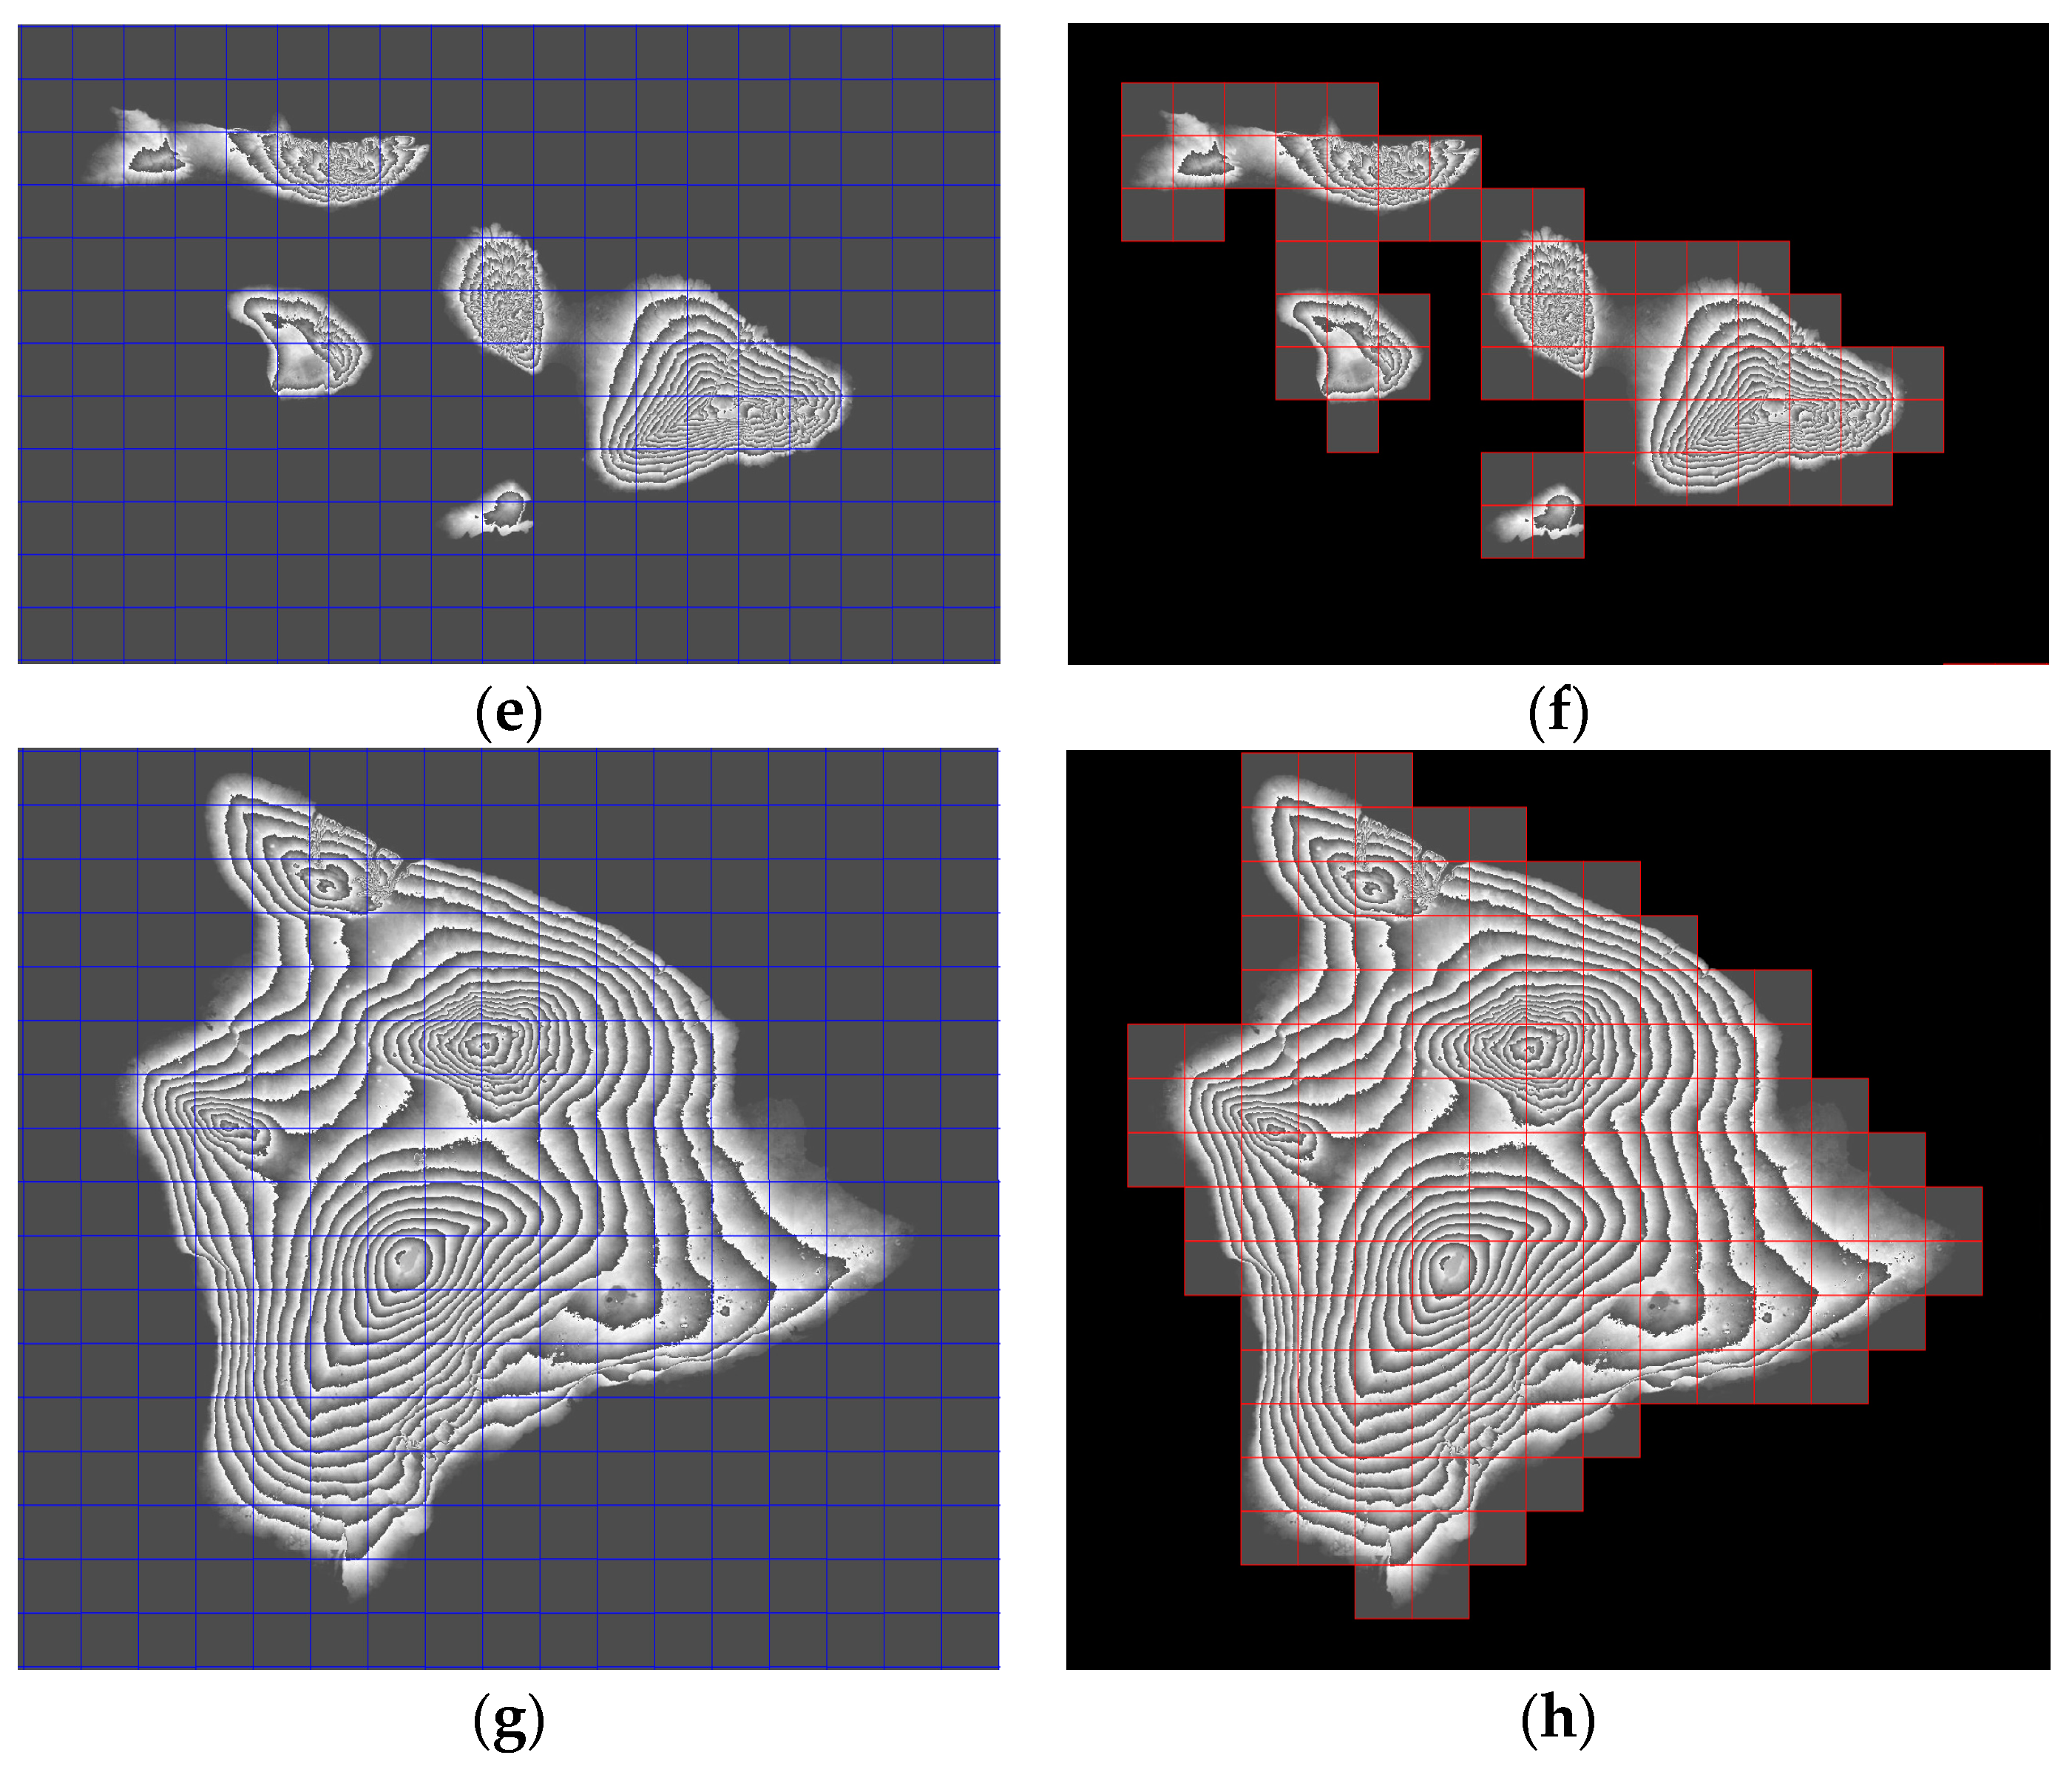
As for digital elevation data, we select the Hawaiian Islands data as the test dataset. We extract grayscale histogram, mean value, standard deviation and other data features; read the time stamp information from metadata as the data time feature; read the coordinate system information, origin, affine coefficient and other parameters of the data, calculate the geographic range of the data expression as the data spatial feature. Then we build the HMDH model on this basis. The results are given in Figure 14.
In Figure 14, the original grid data set in the four sub-regions and the construction results of the multi-dimensional hybrid indexing model are presented in the form of visualization, and they are compared. Among them, the blue rectangular boxes are used to identify the original remote sensing data grid division result, and the red rectangular boxes are used to identify the construction result of the multi-dimensional hybrid indexing model.
It can be seen from Figure 14 that when HMDH is applied to digital elevation model data, it can also achieve accurate division of targets. On the premise of ensuring the integrity of the feature elements in the remote sensing data set, the size of the data set is reduced and the effectiveness of model construction is improved significantly.
3.2. Query Performance of the HMDH
We use Apache JMeter as a performance testing tool to continuously access the interface of the HMDH model we proposed and the traditional remote sensing data model, by virtualizing a certain number of users, to conduct efficiency tests on the remote sensing data access process, so as to complete the comparison of the retrieval efficiency of the above two models in the spatial, time and target dimension. Average response time in experimental results is shown in Figure 15. The index structures used in the test is as follows.
- Perform data retrieval based on the HMDH proposed in this paper;
- Perform data retrieval based on the distributed database index (DDBI), established on time, spatial and other features of the remote sensing data in distributed database system [34];
- Perform remote sensing data retrieval based on Hilbert code index method for spatiotemporal data of virtual battlefield environment (STHI), proposed in [36].
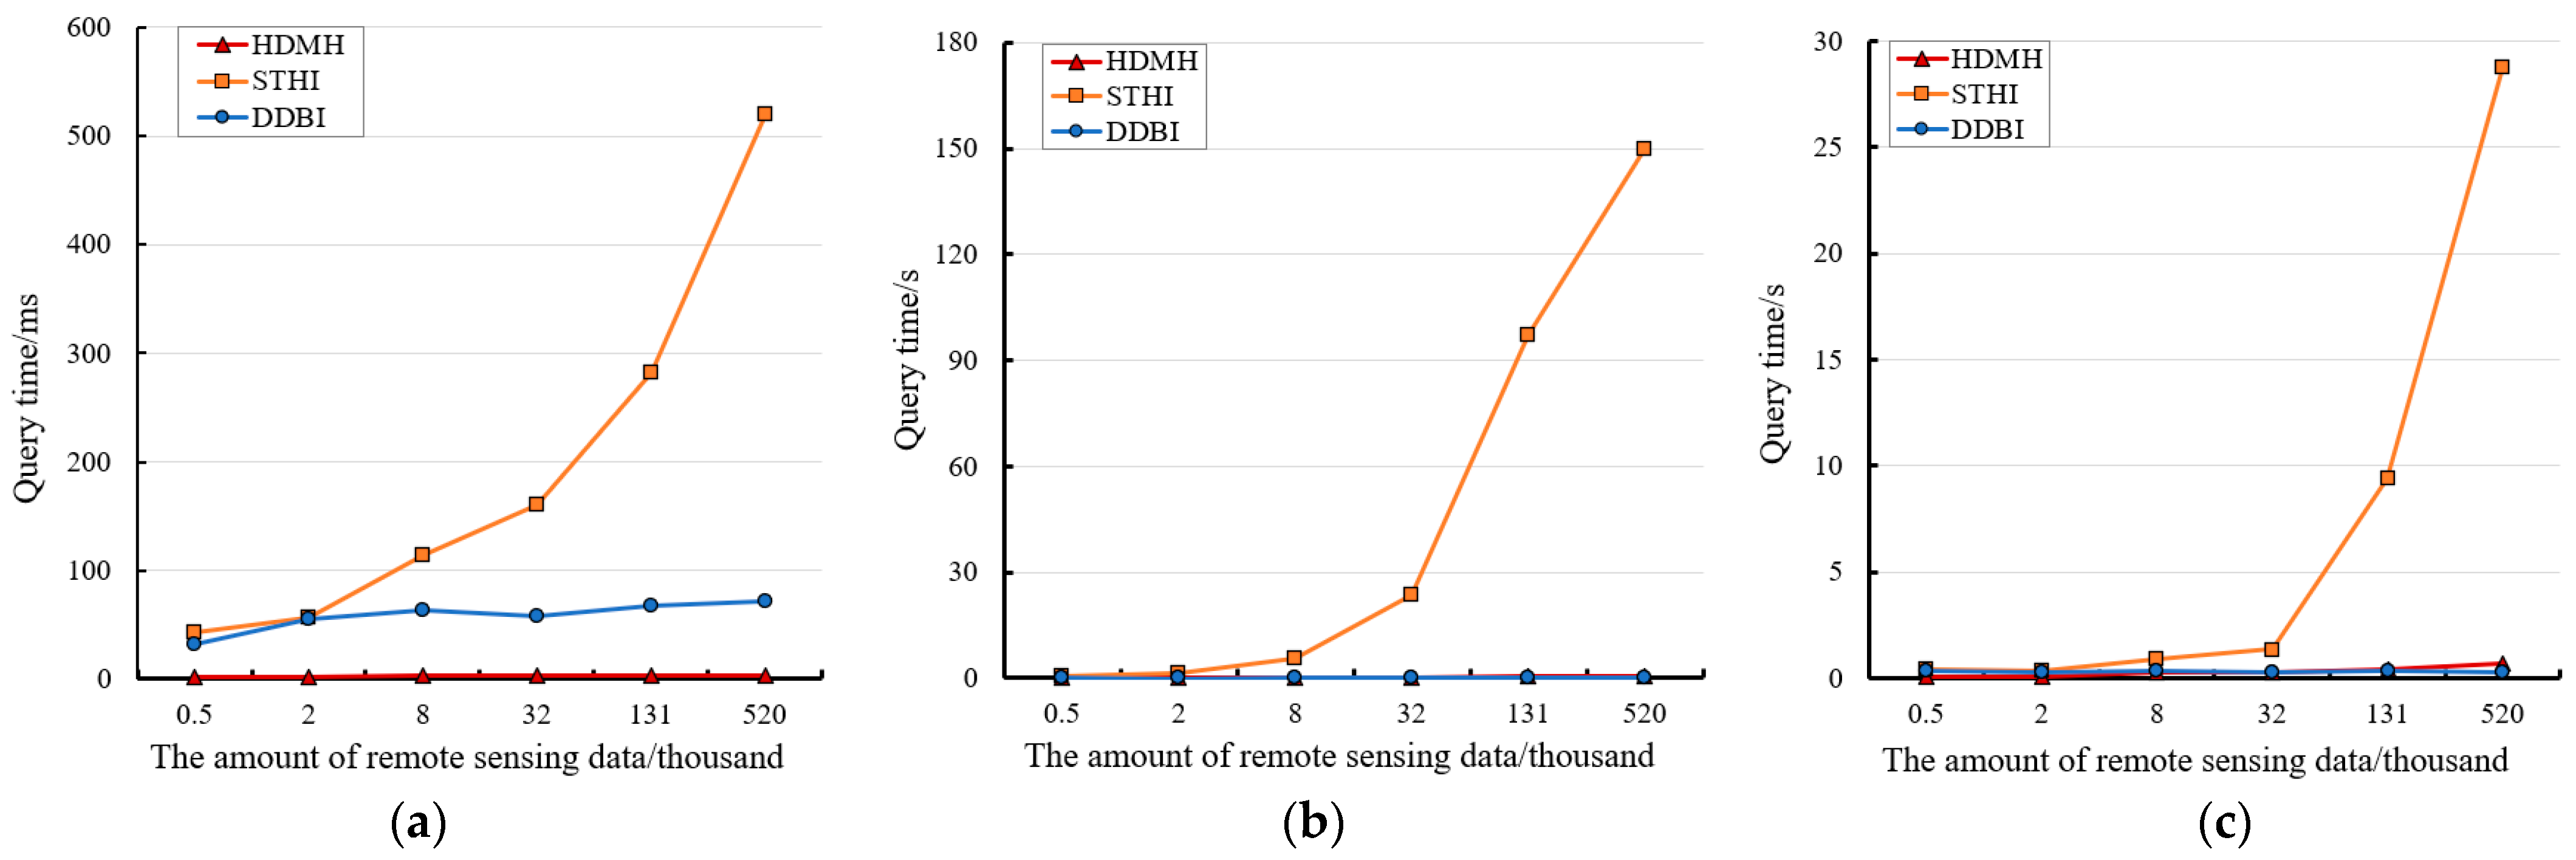
We select remote sensing image data in global area on 0–9th layer, a total of 690 thousand. Firstly, we perform spatial retrieval, time retrieval, and event retrieval on tables that store different amounts of data, respectively. We then perform examination on the combination of spatial and time dimension, to verify the efficiency of the HMDH in multi-dimensional combination query. The results of query on spatial, time and event dimension are given in Figure 15, and the results of query on spatial and time dimensions are given in Figure 16.
It can be seen from Figure 15 that, the HMDH and DDBI have better query performance than the STHI. Among them, the HMDH performs better on remote sensing data query, especially in space dimension. As the amount of data grows, the STHI index has a significant decline in query efficiency, while the other two indexes are relatively stable.
According to the results given in Figure 16, the HMDH is more sensitive to the size of the interval for time query. Although the scope of spatial query varies, the query efficiency slightly decreases as the scope of time query continues to expand, while the other two index remains relatively stable. As the scope of spatial queries increases, the gap between the three indexes gradually increases.
It can be seen from the above experimental results, the HMDH proposed has higher retrieval efficiency in the retrieval process of mass remote sensing data in spatial, time and event dimension, especially suitable for query in a short time interval. Compared with STHI and distributed index, the query time of HMDH index in this scenario is shortened by at least 75%. The HMDH has high application value and practical significance in some remote sensing data query scenarios. In future research, we will take into account the optimization of feature encoding in the time dimension and introduce a certain degree of disorder, to further improve the efficiency of remote sensing data query in the time dimension.
4. Conclusions
Focusing on the challenges encountered in the process of remote sensing data organization, management and access, we propose a hierarchical multi-dimensional hybrid indexing model—the HMDH model for multi-source remote sensing big data. The HMDH model establishes the optimized retrieval scheme from the two perspectives of data, structure and index, to realize the reorganization and rapid sharing of massive remote sensing data. According to the experimental results, compared with the traditional grid model, the HMDH reduces the amount of data to 6%–17%, and improves the accuracy to more than eight times, and compared with other algorithms selected as the baseline in this paper, the HMDH can reduce the query time to 25% in some query scenarios. That is, the HMDH model has higher retrieval efficiency in the retrieval process in multiple dimensions such as spatial dimension, time dimension, and event dimension. The HMDH can be used to solve the access problems of remote sensing data in various fields with high spatial resolution. It expands the data sharing mode, and shortens the data acquisition time.
In the later stage, it is necessary to consider the access of multiple remote sensing data sources to learn from deep learning methods to realize a transferable end-to-end processing flow, improve the accuracy and efficiency of pre-classification, and reduce the impact of empirical values. In addition, how to provide a dynamic index expansion method at the retrieval model level and improve the robustness of the indexing model, is also the focus of future research.
Author Contributions
L.Z. proposed the concept and designed the HDMH; X.S. made the first prototype of the HDMH; X.S. wrote the original draft; L.Z. and X.S. reviewed and edited the manuscript; X.T. provided the project. All the authors contributed equally to the revisions of the manuscript. All authors have read and agreed to the published version of the manuscript.
Funding
This research was funded by the Strategic Priority Research Program of the Chinese Academy of Sciences, grant number XDA 19080201”.
Data Availability Statement
The digital elevation data set is provided by Geospatial Data Cloud site, Computer Network Information Center, Chinese Academy of Sciences (http://www.gscloud.cn).
Conflicts of Interest
The authors declare no conflict of interest.
References
- Zhu, J.Z.; Shi, Q.; Chen, F.E. Research status and development trends of remote sensing big data. J. Image Graph. 2016, 21, 1425–1439. [Google Scholar]
- Li, D.R.; Zhang, L.P.; Xia, G.S. Automatic analysisi and mining of remote sensing big data. Acta Geod. Cartogr. Sin. 2014, 43, 1211–1216. [Google Scholar]
- Zhang, B. Remotely Sensed Big Data Era and Intelligent Information Extraction. Geomat. Inf. Sci. Wuhan Univ. 2018, 43, 1861–1871. [Google Scholar] [CrossRef]
- Li, D.R. On Space-Air-Ground Integrated Earth Observation Network. J. Geo Inf. Sci. 2012, 14, 419–425. [Google Scholar] [CrossRef]
- Zhang, Y. Research on the Theory and Key Technology of Global Spatial Information Muti-Grid with China’s Geographic Characteristics Considered; Huazhong University of Science & Technology: Wuhan, China, 2014. [Google Scholar]
- Wang, S.; Zhong, Y.; Wang, E. An integrated GIS platform architecture for remote sensing big data. Future Gener. Comput. Syst. 2019, 94, 160–172. [Google Scholar] [CrossRef]
- Chen, X.; Wu, J.; Yuan, G. Research on the construction of spatio-temporal information cloud platform for big data. Geomat. Spat. Inf. Technol. 2020, 43, 138–140. [Google Scholar]
- Hua, Y.; Zhou, C. Description frame of data model of multi-granularity spatio-temporal object for pan-spatial information system. J. Geo Inf. Sci. 2017, 19, 1142–1149. [Google Scholar]
- Huang, X. Research on Spatio-Temporal Raster Data Modeling Based on Gric Mode; Zhejiang University: Hangzhou, China, 2015. [Google Scholar]
- Yuan, F. A New Strategy of Storage & Retrieval for Massive Tile Data of Remote Sensing Images; University of Electronic Science and Technology of China: Chengdu, China, 2013. [Google Scholar]
- Zhao, Z.M.; Gao, L.R.; Chen, D.; Yue, A.Z.; Chen, J.B.; Liu, D.S.; Yang, J.; Meng, Y. Development of satelliteremote sensing and image processing platform. J. Image Graph. 2019, 24, 2098–2110. [Google Scholar]
- Lü, X.; Cheng, C.; Gong, J.; Guan, L. Review of data storage and management technologies for massive remote sensing data. Sci. China Tech. Sci. 2011, 41, 1561–1573. [Google Scholar] [CrossRef]
- Zheng, W.; Chengming, L.; Pengda, W.; Jianming, S.; Wei, S. Integerated storage and management of vector and raster data based on Oracle database. Acta Geod. Cartogr. Sin. 2017, 46, 639–648. [Google Scholar]
- Lewis, A.; Oliver, S.; Lymburner, L.; Evans, B.; Wyborn, L.; Mueller, N.; Raevksi, G.; Hooke, J.; Woodcock, R.; Sixsmith, J.; et al. The Australian Geoscience Data Cube—Foundations and lessons learned. Remote Sens. Environ. 2017, 202, 276–292. [Google Scholar] [CrossRef]
- Giuliani, G.; Peduzzi, P.; Chatenoux, B.; Richard, J.P.; Poussin, C.; Schaepman, M.; Small, D.; Steinmeier, C.; Psomas, A.; Ginzler, C. The Swiss Data Cube: Earth Observations for monitoring Switzerland’s environment in space and time. In 11th International Symposium on Digital Earth (ISDE 11); IOP Publishing Ltd.: Bristol, UK, 2020. [Google Scholar]
- Zhu, Z. Science of Landsat Analysis Ready Data. Remote Sens. 2019, 11, 2166. [Google Scholar] [CrossRef] [Green Version]
- Sun, W. Research of Some Key Technologies of Efficient Remote Sensing Big Data Services; Shandong University of Science and Technology: Qingdao, China, 2013. [Google Scholar]
- Wang, N.; Yue, L.H.; Yu, P.Q. Multi-source geospatial information association model based on the integration of vector and raster data. In Proceedings of the 29th National Database Conference, Hefei, China, 12–14 October 2012. [Google Scholar]
- Chen, C.C.; Lin, J.F.; Wu, X.Z. Massive geo-spatial data cloud storage and services based on nosql database technique. J. Geo Inf. Sci. 2013, 15, 166–174. [Google Scholar] [CrossRef]
- Hu, X.D.; Zhang, X.; Qu, J.S. Resource storage and management method of massive remote sensing data supported by the big data architecture. J. Geo Inf. Sci. 2016, 18, 681–689. [Google Scholar]
- Finkel, R.A.; Bentley, J.L. Quad trees a data structure for retrieval on composite keys. Acta Inform. 1974, 4, 1–9. [Google Scholar] [CrossRef]
- Bentley, J.L. Multidimensional binary search trees used for associative searching. Commun. ACM 1975, 18, 509–517. [Google Scholar] [CrossRef]
- Robinson, J.T. The K-D-B-tree: A search structure for large multidimensional dynamic indexes. In Proceedings of the ACM SIGMOD International Conference on Management of data, Ann Arbor, MI, USA, 29 April–1 May 1981; ACM: New York, NY, USA, 1981; pp. 10–18. [Google Scholar]
- Guttman, A. R-Trees: A Dynamic Index Structure for Spatial Searching; ACM: New York, NY, USA, 1984; pp. 47–57. [Google Scholar]
- Zhao, N. A hybrid structure of spatial multilevel index based on grids and R-tree. Comput. Technol. Dev. 2009, 19, 91–94. [Google Scholar]
- Deng, H.; Wu, F.; Zhai, R. R-tree index structure for multi-scale representation of spatial data. Chin. J. Comput. 2009, 32, 177–184. [Google Scholar] [CrossRef]
- He, J.; Wu, Y.; Yang, F. Multi-dimensional cloud index based on KD-tree and R-tree. J. Comput. Appl. 2014, 34, 3218–3221, 3278. [Google Scholar]
- Keogh, E.; Mueen, A. Curse of dimensionality. In Encyclopedia of Machine Learning; Springer: New York, NY, USA, 2011; pp. 257–258. [Google Scholar]
- Kamel, I.; Falout, S.; Hilbert, C. Hilbert R-tree: An improved R-tree using fractals. In Proceedings of the 20th International Conference on Very Large Data Bases, Santiago de Chile, Chile, 12–15 September 1994; pp. 500–509. [Google Scholar]
- Nie, Y.; Zhou, W.; Jian, S. Spatial index for tile map service based on Z curve. J. Image Graph. 2012, 17, 286–292. [Google Scholar]
- Yang, Y. Tile quadtree and filling curve realizing massive terrain dataset management. Comput. Eng. Appl. 2016, 52, 192–196. [Google Scholar]
- Moon, B.; Jagadish, H.V.; Faloutsos, C.; Saltz, J.H. Analysis of the clustering properties of Hilbert space-filling curve. IEEE Trans. Knowl. Data Eng. 2001, 13, 124–141. [Google Scholar] [CrossRef] [Green Version]
- Cao, Z.; Zhang, Y.; Li, C. A fast algorithm for the Hilbert curve ordering code based on partitioning. Comput. Eng. Sci. 2006, 28, 63–65. [Google Scholar]
- Hughes, J.N.; Annex, A.; Eichelberger, C.N.; Fox, A.; Hulbert, A.; Ronquest, M. GeoMesa: A distributed architecture for spatio-temporal fusion. In Geospatial Informatics, Fusion, and Motion Video Analytics V; International Society for Optics and Photonics: Baltimore, MD, USA, 2015. [Google Scholar]
- Whitby, M.A.; Fecher, R.; Bennight, C. GeoWave: Utilizing distributed key-value stores for multidimensional data. In Proceedings of the International Symposium on Spatial & Temporal Databases, Arlington, VA, USA, 21–23 August 2017; pp. 105–122. [Google Scholar]
- Wu, Y.H.; Cao, X.F. Hilbert code index method for spatiotemporal data of virtual battlefield environment. Geomat. Inf. Sci. Wuhan Univ. 2020, 45, 1403–1411. [Google Scholar]
- Zhu, J.; Liu, Z.; Qiao, D. Construction and optimization of spatial index model for massive geospatial data based on hbase. Geol. Sci. Technol. Inf. 2019, 38, 253–260. [Google Scholar]
- Lin, J.S. Fuzzy clustering using a compensated fuzzy hopfield network. Neural Process. Lett. 1999, 10, 35–48. [Google Scholar] [CrossRef]
- Zhang, M.; Yu, J. Fuzzy partitional clustering algorithms. J. Softw. 2004, 15, 858–869. [Google Scholar]
- Zhou, K. Theoretical and Applied Research on Fuzzy C-Mean Clustering and Its Cluster Validation; Hefei University of Technology: Hefei, China, 2014. [Google Scholar]
- Li, K.; Liu, Y.S. KFCSA: A novel clustering algorithm for high-dimension data. In Proceedings of the 2nd International Conference on Fuzzy Systems and Knowledge Discovery, Changsha, China, 27–29 August 2005; pp. 531–536. [Google Scholar]
- Piao, S.Z.; Yu, J. Cluster validity indexes for fcm clustering algorithm. Pattern Recognit. Artif. Intell. 2015, 28, 451–461. [Google Scholar]
- Zhang, C.; Wang, T.; Sun, D. Image edge detection based on the Euclidean distance graph. J. Image Graph. 2013, 18, 176–183. [Google Scholar]
- Buades, A.; Coll, B.; Morel, J.M. A non-local algorithm for image denoising. In Proceedings of the IEEE International Conference on Computer Vision and Pattern Recognition, San Diego, CA, USA, 20–25 June 2005; IEEE Computer Society: Washington, DC, USA, 2005; pp. 60–65. [Google Scholar]
- Li, Z. The Segmentation and Realization of High Spatial Resolution Remote Sensing Image Based on Region Growing Algorithm; Guangxi University: Nanning, China, 2008. [Google Scholar]
- Adams, R.; Bischof, L. Seeded region growing. IEEE Trans. Pattern Anal. Mach. 1994, 16, 641–647. [Google Scholar] [CrossRef] [Green Version]
- Methnert, A.; Jackway, P. An improved seeded region growing algorithm. Pattern Recognit. Lett. 1997, 18, 1065–1071. [Google Scholar] [CrossRef]
- Deng, X. Research on Service Architecture and Algorithms for Grid Spatial Data; Information Engineering University: Zhengzhou, China, 2003. [Google Scholar]
- Xu, D. Research on the Key Techniques of Multi-Source Remote Sensing Big Data Management under the Cloud Computing Environment; University of Chinese Academy of Sciences: Beijing, China, 2018. [Google Scholar]
- Song, A. Distributed Multi-Temporal Geoinformation Service Aggregation Based on a Compound Pyramid Model; Wuhan University: Wuhan, China, 2013. [Google Scholar]
- Yan, W. Research on Image Feature Extraction Method; Northwestern Polytechnical University: Xi’an, China, 2007. [Google Scholar]
- Wang, C. Study on Nondestructive Detection Method of Potato Grading Based on Multi-Source Information Fusion; Huazhong Agricultural University: Wuhan, China, 2014. [Google Scholar]
- Qing, Y.; Song, W. Remote sensing image feature extraction and selection and its application in image classification. Sci. Surv. Mapp. 2008, 01, 176–199. [Google Scholar]
- Chen, P. Research on Principal Component Analysis and Its Application in Feature Extraction; Shaanxi Normal University: Xi’an, China, 2014. [Google Scholar]
- Cao, M. Research on Intelligent Recognition and Extraction of Feature Elements Based on Remote Sensing Images; Changan University: Xi’an, China, 2015. [Google Scholar]
- Chen, Z.; Zhao, Z. A multi-scale remote sensing image segmentation algorithm based on region growing. Comput. Eng. Appl. 2005, 35, 7–9. [Google Scholar]
- Wu, M. Hilbert space-filling curve and spatial pattern detection-based spatial partitioning approach to point geospatial data. J. Image Graph. 2013, 18, 1336–1342. [Google Scholar]
- Huihui, Z.; Fan, Z.; Renhai, C.; Zhiyong, F. Efficient index and query algorithm based on geospatial big data. J. Comput. Res. Dev. 2020, 57, 333–345. [Google Scholar]
- Gong, J.Y.; Chen, J.; Xiang, L.G. GeoGlobe: Geo-spatial Information Sharing Platform as Open Virtual Earth. Acta Geod. Cartogr. Sin. 2010, 39, 551–553. [Google Scholar]
- Zhang, F. The Study on the Grid-Oriented Access, Integration and Interoperation of Massive Spatio-Temperal Data; Zhejiang University: Hangzhou, China, 2007. [Google Scholar]
- Chang, F.; Dean, J.; Ghemawat, S.; Hsieh, W.C.; Wallach, D.A.; Burrows, M.; Chandra, T.; Fikes, A.; Gruber, R.E. Bigtable: A distributed storage system for structured data. ACM Trans. Comput. Syst. 2008, 26, 1–26. [Google Scholar] [CrossRef]
Figure 1.
Hierarchical multi-dimensional hybrid indexing model.

Figure 2.
Remote sensing data grid.

Figure 3.
Clustering optimization based on spatial-temporal Features.

Figure 4.
Evaluation index values of fuzzy clustering results based on image features. (a) single feature; (b) multi-feature fusion; (c) multi-feature fusion using various weighting factors. h and m respectively represent the weight coefficients of the histogram of gradient (HOG) and the mean gray level.

Figure 5.
Results of fuzzy clustering results based on image features. (a) clustering results based on mean; (b) clustering results based on mean and HOG; (c) clustering results with adjusted weighting factors.
Figure 5.
Results of fuzzy clustering results based on image features. (a) clustering results based on mean; (b) clustering results based on mean and HOG; (c) clustering results with adjusted weighting factors.

Figure 6.
Eight-neighborhood recursive decision algorithm.

Figure 7.
Fuzzy clustering optimization based on spatio-temporal features.

Figure 8.
Comparison of fuzzy clustering results. (a) fuzzy clustering results based on image features; (b) fuzzy clustering results based on spatial-temporal features.
Figure 8.
Comparison of fuzzy clustering results. (a) fuzzy clustering results based on image features; (b) fuzzy clustering results based on spatial-temporal features.

Figure 9.
Remote sensing data cube model.

Figure 10.
Remote sensing data cube model filled with Hilbert curve.

Figure 11.
Space index on remote sensing data.

Figure 12.
Time and event index on remote sensing data.

Figure 13.
Construction result of the multi-dimensional hybrid indexing model (HMDH) for remote sensing image data. (a) Paracel Islands reef dataset; (b) Clustering results of Paracel Islands reef dataset; (c) Hawaii Islands dataset; (d) Clustering results of Hawaii Islands dataset, (e) Qinghai–Tibet Plateau lakes dataset; (f) Clustering results of Qinghai–Tibet Plateau lakes dataset.

Figure 14.
Fuzzy clustering results of digital elevation dataset. (a) Subregion 1 of Hawaii Islands dataset; (b) Clustering results of subregion 1 of Hawaii Islands dataset; (c) Subregion 2 of Hawaii Islands dataset; (d) Clustering results of subregion 2 of Hawaii Islands dataset; (e) Subregion 3 of Hawaii Islands dataset; (f) Clustering results of subregion 3 of Hawaii Islands dataset; (g) Subregion 4 of Hawaii Islands dataset; (h) Clustering results of subregion 4 of Hawaii Islands dataset.


Figure 15.
Data query performance of HMDH on different storage data volumes. (a) Query in the spatial dimension, (b) Query in the time dimension, (c) Query in the event dimension.
Figure 15.
Data query performance of HMDH on different storage data volumes. (a) Query in the spatial dimension, (b) Query in the time dimension, (c) Query in the event dimension.

Figure 16.
Data query performance of HMDH in spatial and time dimension with different window sizes. (a) Query a spatial scope of , (b) Query with spatial scope of , (c) Query with spatial scope of .
Figure 16.
Data query performance of HMDH in spatial and time dimension with different window sizes. (a) Query a spatial scope of , (b) Query with spatial scope of , (c) Query with spatial scope of .


Table 1.
Remote sensing dataset statistics.
| Dataset | Grid | The Amount of Data | Integrity | Accuracy | Redundancy |
|---|---|---|---|---|---|
| Paracel Islands dataset | Traditional grid | 15,000 | 1 | 0.023 | 0.977 |
| the HMDH | 1792 | 1 | 0.20 | 0.8 | |
| Hawaii Islands dataset | Traditional grid | 16,960 | 1 | 0.058 | 0.942 |
| the HMDH | 1072 | 1 | 0.951 | 0.049 | |
| Plateau Lake dataset | Traditional grid | 18,240 | 1 | 0.108 | 0.892 |
| the HMDH | 2601 | 1 | 0.935 | 0.065 |
Publisher’s Note: MDPI stays neutral with regard to jurisdictional claims in published maps and institutional affiliations. |
© 2021 by the authors. Licensee MDPI, Basel, Switzerland. This article is an open access article distributed under the terms and conditions of the Creative Commons Attribution (CC BY) license (http://creativecommons.org/licenses/by/4.0/).
Share and Cite
MDPI and ACS Style
Zhu, L.; Su, X.; Tai, X. A High-Dimensional Indexing Model for Multi-Source Remote Sensing Big Data. Remote Sens. 2021, 13, 1314. https://doi.org/10.3390/rs13071314
AMA Style
Zhu L, Su X, Tai X. A High-Dimensional Indexing Model for Multi-Source Remote Sensing Big Data. Remote Sensing. 2021; 13(7):1314. https://doi.org/10.3390/rs13071314
Chicago/Turabian StyleZhu, Lilu, Xiaolu Su, and Xianqing Tai. 2021. "A High-Dimensional Indexing Model for Multi-Source Remote Sensing Big Data" Remote Sensing 13, no. 7: 1314. https://doi.org/10.3390/rs13071314
Note that from the first issue of 2016, this journal uses article numbers instead of page numbers. See further details here.