Article

Vertical Structures Associated with Orographic Precipitation during Warm Season in the Sichuan Basin and Its Surrounding Areas at Different Altitudes from 8-Year GPM DPR Observations

1
School of Atmospheric Sciences, Chengdu University of Information Technology, Chengdu 610225, China
2
Fujian Meteorological Observatory, Fujian Meteorological Bureau, Fuzhou 350028, China
3
Collaborative Innovation Center on Forecast and Evaluation of Meteorological Disasters, Nanjing University of Information Science & Technology, Nanjing 210044, China
4
Institute of Plateau Meteorology, China Meteorological Administration (CMA)/Heavy Rain and Drought-Flood Disaster in Plateau and Basin Key Laboratory of Sichuan Province, Chengdu 610072, China
*
Author to whom correspondence should be addressed.
Remote Sens. 2022, 14(17), 4222; https://doi.org/10.3390/rs14174222
Submission received: 26 July 2022 / Revised: 23 August 2022 / Accepted: 24 August 2022 / Published: 27 August 2022

Abstract

:
Global precipitation measurement (GPM) is one of the effective means employed to observe orographic precipitation, and its inversed GPM DPR data can be used to study the microphysical structure of precipitation particles. This study considers statistics on convective precipitation (CP) and stratiform precipitation (SP) events over three types of terrain (plains, mountains, and high mountains) using the DPR onboard the GPM Core Observatory from May to September of 2014–2021 to analyze the vertical structure of heavy CP and SP. In mountain areas and high mountain areas, the updraft rendered by topography or seeder-feeder mechanism is not only conducive to the collision and merger of raindrops into large raindrops, but also increases the concentration of small drops, which is the main reason why the occurrence probability of not only large but also small raindrops increases and the horizontal distribution domain of mass weighted average raindrop diameter (Dm) widens. For heavy SP, the occurrence probability of medium-diameter precipitation particles below the freezing height (FzH) over high mountains is greater than those over plains. The precipitation particles above 10 km altitude of high mountains have characteristics, such as lower droplet number concentration and larger diameter, compared with those over plains. Furthermore, the study also analyzed the correlation between storm top altitude (STA) and Dm, water vapor and STA respectively. This study is helpful to further understand the effect of topography on heavy precipitation through cloud microphysical processes and the vertical structure of precipitation.

1. Introduction

Precipitation types can be mainly classified as stratiform precipitation (SP) and convective precipitation (CP) [1]. There are significant differences between SP and CP regarding the growth of precipitation particles by aggregation, riming, and coalescence, which is due to the different thermal dynamics and microphysics processes of the two types of precipitation [2,3]. The vertical structure of precipitation can reflect the characteristics of dynamics and microphysical of hydrometeor growth attenuation in the precipitation clouds. These microphysical and thermodynamic processes can affect the precipitation efficiency, and the intensity of surface precipitation, likewise, plays a role in determining precipitation type to some extent [4,5,6,7]. The topography has a very important influence on the vertical structure of precipitation and clouds [8,9,10], manifested in that topographical thermodynamic and dynamic processes affects atmospheric circulation, thereby the initiation and development of rainfall systems was significantly affected.
Sichuan province is located in the interior of southwest China, with the Qinling Mountains to the north, the Yun-Gui Plateau to the south, and the eastern edge of the Qinghai-Tibet Plateau. The terrain of Sichuan is high west and low east that the topography is diverse, and the weather processes are also complex and changeful. Heavy rainfall is one of the meteorological disasters with the highest frequency and the severest personal casualty and property loss in the Sichuan Basin and its surrounding areas. This region not only has high annual average precipitation, but is also prone to short-time heavy precipitation because of the complex terrain. In the past, research on mountain precipitation was difficult due to scarce surface observational data. At the same time, the detection of weather radar in mountainous areas is limited by terrain [11]. The Global Precipitation Measurement (GPM) mission was initiated by the National Aeronautics and Space Administration (NASA) and the Japan Aerospace and Exploration Agency (JAXA), which is the successor to Tropical Rainfall Measuring Mission (TRMM). The GPM observatory carries the first spaceborne dual-frequency phased array precipitation radar (DPR), developed by JAXA and National Institute of Communication Technology (NICT), and a conical-scanning multichannel microwave imager, developed and built by the Ball Aerospace and Technology Corporation under contract with NASA’s Goddard Space Flight Center (GSFC). The GPM sensor has higher sensitivity and wider measurement range compared with TRMM instruments, and can provide more accurate precipitation microstructure information [12,13,14]. The detection of precipitation radar (PR) from satellite is not restricted to the geographical environment. Thus, it is feasible for PR to monitor cloud clusters on the distant seas and oceans, the plateau, or mountains where ground-based PR is hard to deploy, which can effectively make up for the deficiency of ground-based PR. In addition, the large precipitation particles are usually located in the middle and lower layers of cloud cluster, in the upper layer of cloud cluster, radar beam form satellite attenuated more lightly than that from ground-based because of the work type of satellite PR detection is top-down, which is available for obtaining the structural information of the upper layer of cloud cluster [15].
The reliability of GPM DPR data has been evaluated and verified by many scholars. Liao et al. [16] conducted a physical evaluation of the rain profiling retrieval algorithms for DPR on board the GPM Core Observatory satellite and proved that the DPR dual-wavelength algorithm can generally provide accurate rainfall rate. Jin et al. [17] evaluated the applicability of the GPM data in Mount Taishan area, and the results showed that the GPM had the highest accuracy in the mountainous area that could estimate the precipitation system with more accurate accuracy and lower error. Zhang et al. [18] revealed that the GPM DPR inversion product was more capable of revealing structures of both strong and light precipitation through individual cases and statistical analysis. Lasser et al. [19] compared the precipitation observation data measured by GPM DPR with that measured by ground weather stations, and the result showed that the precipitation observation data measured by GPM DPR was basically consistent with the data measured by ground meteorological station. Sun et al. [20] compared the GPM DPR data with the measured results of one-dimensional (1-D) laser-optical particle size velocity (PARSIVEL) disdrometers over the Yangtze-Huai River Valley in central China, and found that the measured results were similar, the mean deviation was relatively small, and the skewness was close to zero. 16 laser-optical PARSIVEL disdrometers deployed in Sichuan were used to validate the GPM-DPR results by Li et al. [21] verified that the DPR data in this area are basically credible. However, it is also mentioned that due to the complex topography of Sichuan Province and the difference of measurement principles between DPR and disdrometers, it is difficult to have identical and ideal conditions to evaluate DPR data by PARSIVEL disdrometers. All of the above comparative evaluation works show that the GPM DPR data are very reliable.
Drop size distribution (DSD) and its spatial variability is not only essential in understanding the microphysical processes that occur at the different stages of a precipitating system, but also useful in microwave communication, soil erosion and landslide triggering studies [22,23,24]. Seela et al. [25] studied the DSD variability in summer season rainfall between two islands in the western Pacific region and the results indicated that both orography and aerosol loading are responsible for the spatial variability of DSD. Harikumar et al. [26] made a comparative study on the data of four tropical stations in the peninsular India and found that orographic rain has larger drops when compared with non-orographic rain when the rain rate is high. Zwiebel et al. [27] studied the impact of complex terrain located in France on the structure of rainfall and mentioned that the evolution of the DSD over the transition and plain areas is dominated by coalescence and evaporation.
In this study, DPR observations are used to analyze the radar reflectivity factors and the vertical structural characteristic of DSD of SP and CP over different terrain regions (plains, mountains, high mountains) in the Sichuan Basin and its surrounding areas, expecting to obtain the characteristics of precipitation structure, which will help in further understanding the influence of mountain topography on precipitation structure and internal microphysical processes, and it also plays a very important role in deepening scientific recognition of mountain heavy rainfall mechanism. The remainder of this study is arranged as follows: The dataset used and the methodology are given in Section 2. Section 3 provides the results, including the vertical structure characteristics, horizontal distribution characteristics, and the relationship between each physical quantities of stratiform and CP over different types of terrain. The discussion is provided in Section 4 and followed by a summary in Section 5.

2. Data and Methods

GPM Core Observatory takes about 93 min to fly around the earth. The global coverage is from 68°S to 68°N, and the flight heights is at the altitude of 407 km. The GPM radar is able to provide observations of the 3D structure of precipitation from the surface to 22 km altitude. The DPR instrument is made of a Ka-band precipitation radar (KaPR) operating at 35.5 GHz and a Ku-band precipitation radar (KuPR) at 13.6 GHz, and the KuPR and KaPR will provide coaligned 5-km-resolution footprints on Earth’s surface. 2A.GPM.DPR is the dataset of DPR Ku and Ka-band radar reflectivity profile and radar-based precipitation retrievals. The dataset carries three radar profiles, including the Ku-band normal scan (NS), the Ka-band matched scan (MS), and the Ka-band high-sensitivity scan (HS). The NS has a nominal vertical range resolution of 250 m with cross-track swath widths of 245 km, the MS has a nominal vertical range resolution of 250 m with cross-track swath widths of 120 km, and the HS has a nominal vertical range resolution of 500 m with cross-track swath widths of 120 km [12].The 2A.GPM.DPR database V06 (covering the period from May to September of 2014–2021) has been used in the study, which can provide detailed precipitation information, including reflectivity factor with attenuation correction (Ze), DSD, storm top altitude (STA), freezing height (FzH), rain rate (RR), precipitation type, and so on. In single frequency classification (CSF) modules, i.e., in Ku-only and Ka-only modules, precipitation type classification is made by a Vertical profiling method (V-method) and by an Horizontal pattern method (H-method) [28,29]. In the dual frequency module, in place of the V-method, the measured dual frequency ratio (DFRm) method is used for precipitation type classification and for BB detection in the inner swath [30,31], classifying rain into stratiform, transition, and convective. More details can be found online at https://gpm.nasa.gov/sites/default/files/2019-05/ATBD_DPR_201811_with_Appendix3b.pdf (accessed on 23 August 2022).
The research regions are the Sichuan Basin and its surrounding areas of China (99°E–109°E, 27°N–33°N). ETOPO1 is a 1 arc-minute global relief model that was developed by the National Geophysical Data Center (NGDC), an office of the National Oceanic and Atmospheric Administration (NOAA), which was used to divide the research regions in this study. Fan et al. [32] found the best statistical window of topographic relief in Sichuan to be 9.92 km2, while the statistical window of topographic relief is defined as 13.69 km2 in this paper because of the limit of resolution of ETOPO1. Topographic relief is the difference between maximum and minimum of altitude. Referring to related research results [33,34,35], dividing the research regions into three types of topography by ETOPO1 (Figure 1): 1. Plains with altitude from 0 to 1500 m, topographic relief < 100 m; 2. Mountains with altitude from 500 to 1500 m, topographic relief ≥ 200 m; 3. High mountains with altitude from 1500 to 4000 m, topographic relief ≥ 200 m. In Figure 1b, the white areas represent the place where topographic relief does not meet the requirements of three categories mentioned above, e.g., the white areas of 1500–4000 m above mean sea level represent high-altitude areas with flat terrain as well as with few rainy pixels, therefore not going to study such areas. For statistical analysis, the number of rainy pixel samples occurred in study regions during the period May to September of 2014–2021 was counted based on GPM DPR data (Table 1), and Figure 2 shows the spatial distribution of the number of stratiform and convective rainy pixels.
The contoured frequency by altitude diagram (CFAD) is an effective method to represent the vertical structure of precipitation that has been applied in many studies [36,37]. The entire frequency distribution normalized by dividing by the maximum absolute frequency of the samples within the region of analysis is NCFAD, which permits the comparison of CFADs between regions despite the different absolute frequencies [38]. In this paper, NCFAD is mainly used to statistically analyze the vertical structure characteristics of SP and CP that occurred over plains, mountains and high mountains regions of the Sichuan Basin and its surrounding area. RR ≥ 20 mm/h is defined as heavy precipitation [39], and 2A.GPM.DPR retrievals with RR < 0.5 mm/h are discarded from this study because of the limitations of dual-frequency retrieval. For the detailed discussion, the ground precipitation grades were divided into 5 levels, including 0.5 < RR ≤ 2 mm/h, 2 < RR ≤ 4 mm/h, 4 < RR ≤ 8 mm/h, 8 < RR ≤ 20 mm/h and RR ≥ 20 mm/h. Since shallow rain is archived as CP in DPR retrievals, excluded it from the CP, and only precipitation events in which the phase behavior of near-surface particles is liquid are considered. The STA, FzH, and bright band height in this study are absolute heights altitude relative to sea level, not relative to the surface. In addition, the horizontal distribution of STA and other physical quantity of DPR orbit dataset were gridded at 0.25° × 0.25°. For example, the average STA denotes the ratio of the sum of STA within the 0.25° × 0.25° to the total number of samples within that area.

3. Results

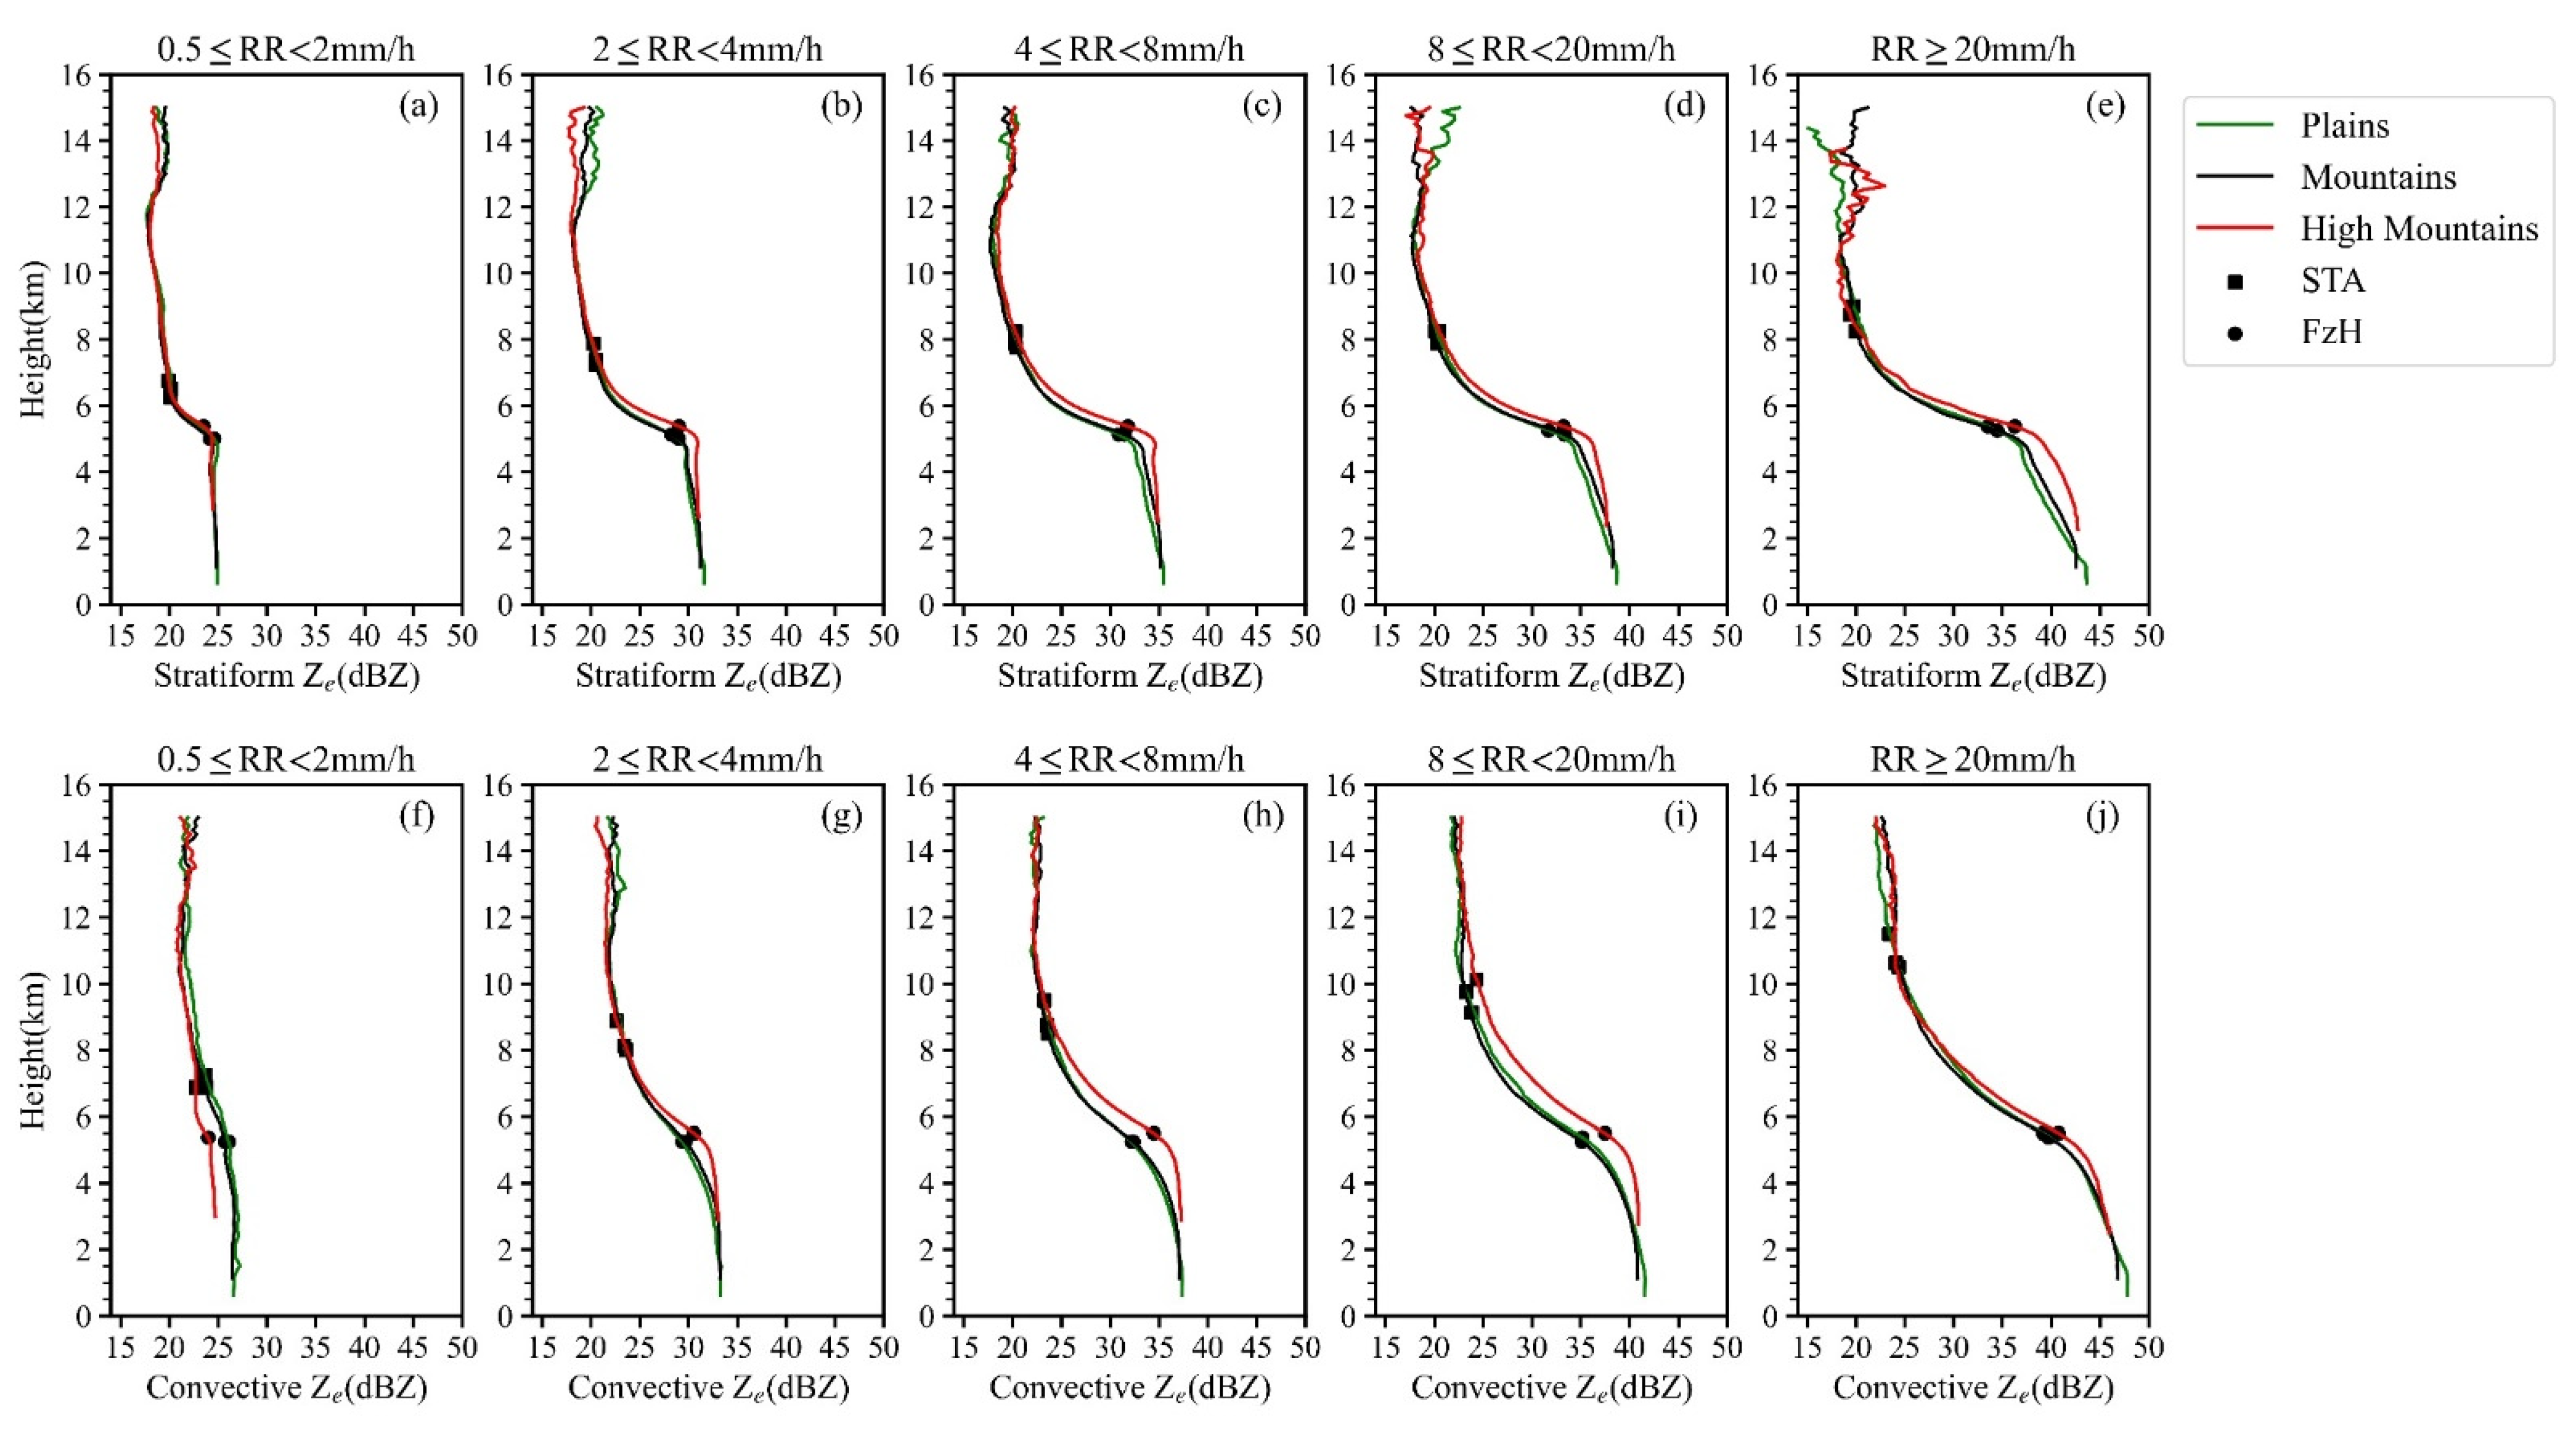
3.1. Vertical Distribution Characteristics of Radar Reflectivity Factor

Figure 3 shows the vertical structure of reflectivity factor. In addition to revealing the vertical structure of precipitation, the maximum frequency profile of the Ze is also a good indicator of its microphysical processes [40]. SP is usually characterized by bright band near FzH, and the bright band is a good indicator of phase change of hydrometeor [41]. The hydrometeors above bright band are mainly ice or snow. In bright band, there are mixed-phase hydrometeors including partially melted ice, snow and raindrops, while it occurs at the liquid phase below bright band. As shown in the maximum frequency profile of Ze from 6 to 10 km, Ze of two types of heavy precipitation increases with altitude reducing, indicating that precipitation particles are growing as they are falling. For stratiform heavy precipitation (Figure 3a–c), different to CP, the growth rate of Ze is very large near the freezing layer that the profile tends to be horizontal, showing particles undergoing a rapid transition from ice to liquid phase near the freezing layer. Figure 4 shows the correlation between the elevation and FzH for heavy rainfall. Only Figure 4e,g,h passed the 0.01 significance level, and the r-value is relatively large in Figure 4h, which suggests that the FzH of the two types of heavy precipitation is hardly affected by topography, except for heavy CP over high mountains.
Figure 5 exhibits the mean Ze profiles with various RR. Ze increases from STA to the surface with altitude decreasing, and the near-surface Ze increases with near-surface RR increasing. As shown in Figure 5a–e, the bright band characteristics of SP are remarkable at an altitude of about 6 km, and there is a clear turning point near FzH, which is the microphysical property of the SP particles during the falling process, while Ze profiles of CP do not have such characteristic. For heavy precipitation, Ze from FzH to the surface overall increases, indicating that the coalescence of falling particles is more efficient than breakup and evaporation.

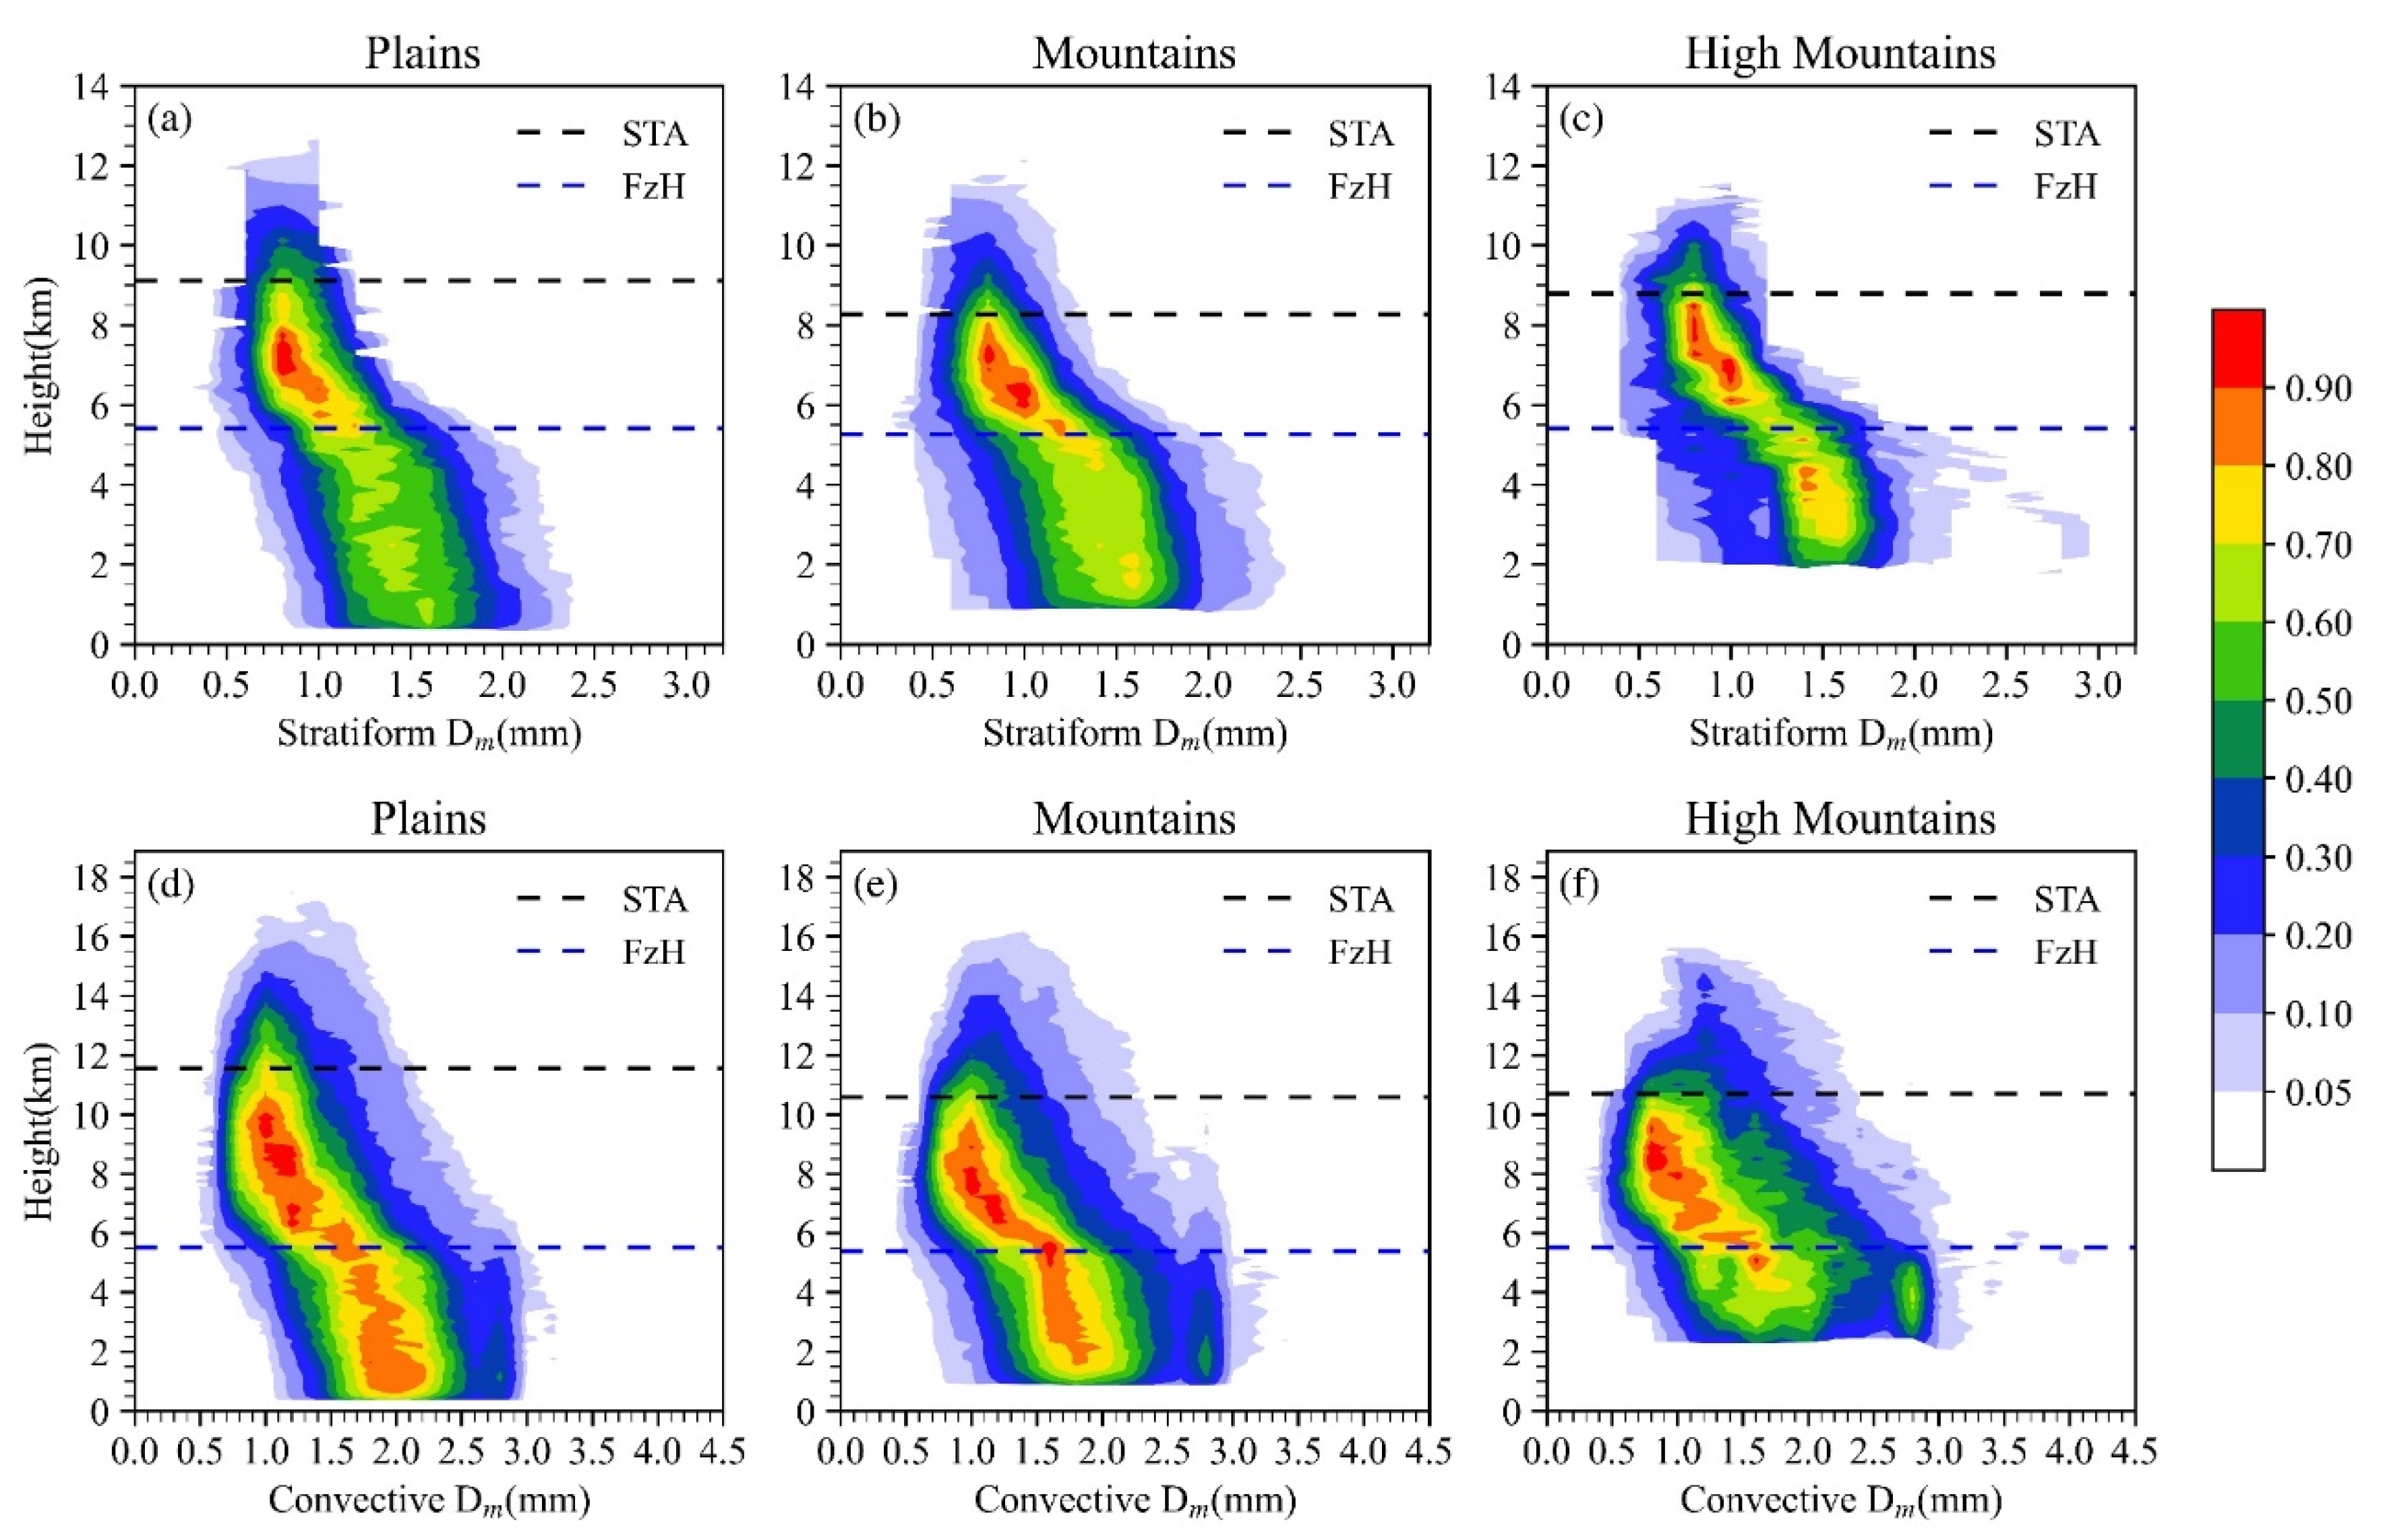
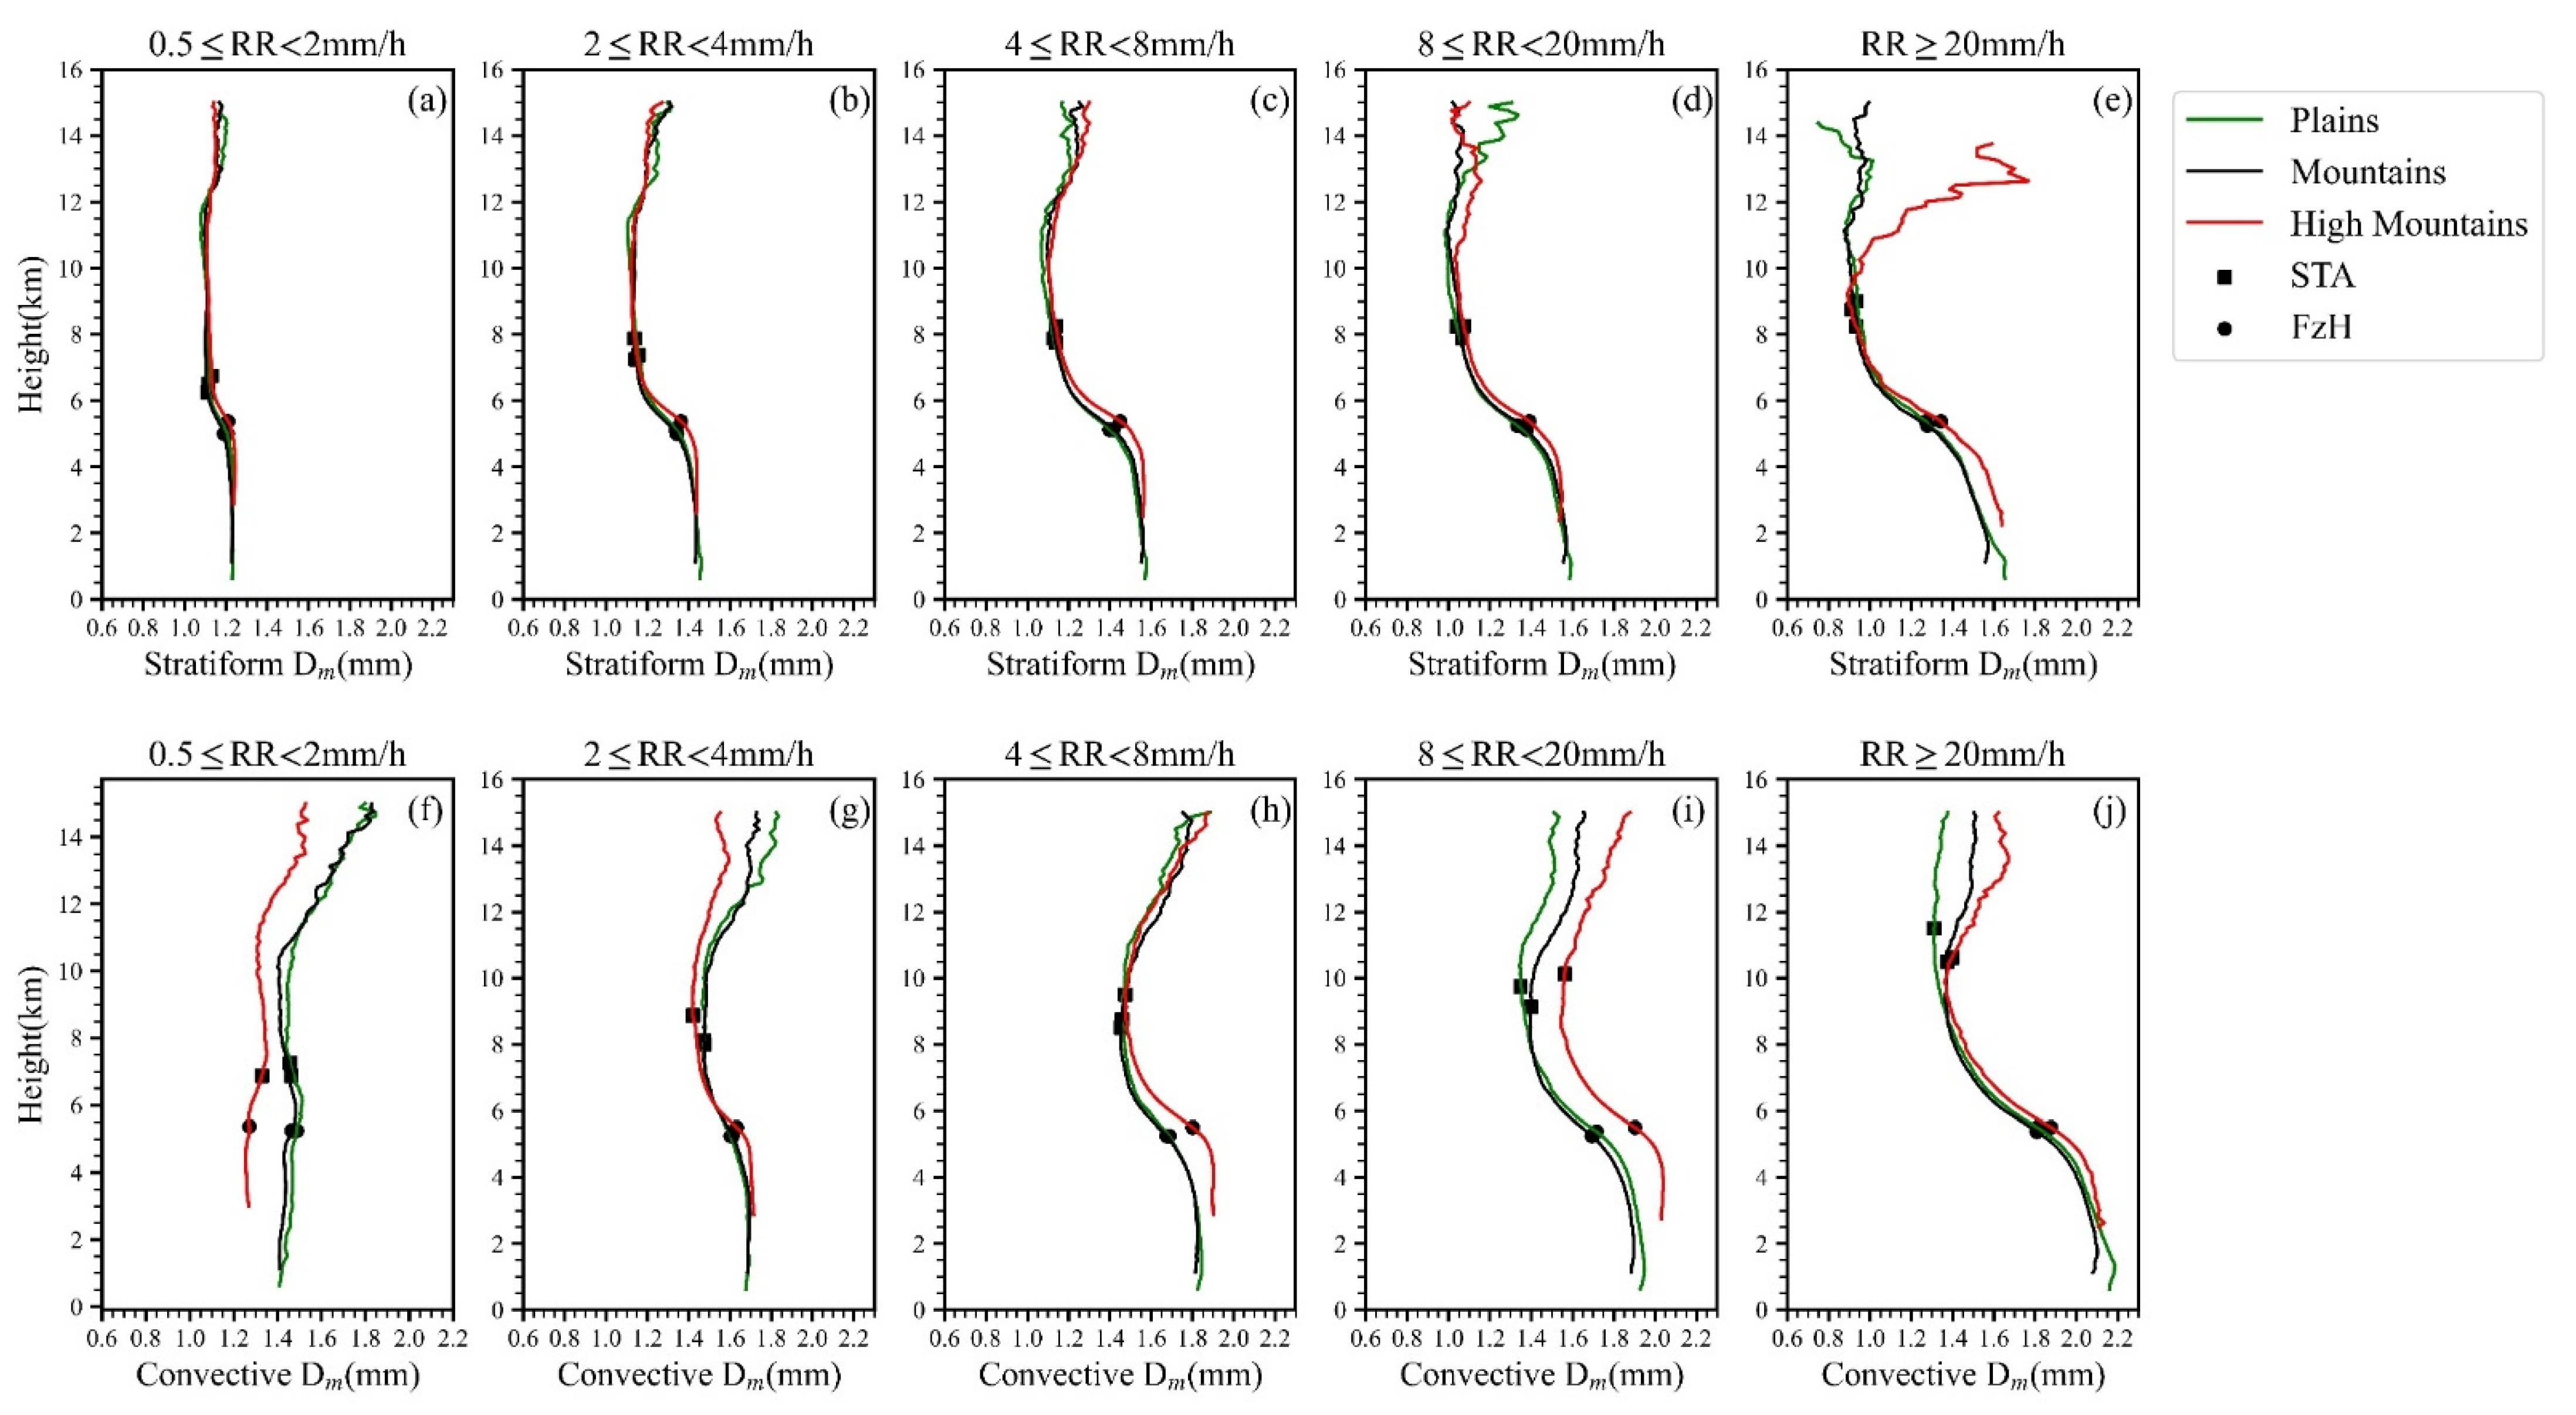
3.2. Vertical Distribution Characteristics of Mass-Weighted Mean Raindrop Diameter

DSD is a fundamental property of precipitation, which is very important for understanding the microphysical processes occurring in precipitation systems. DSD contains two parameters: mass-weighted mean raindrop diameter (Dm in mm) and normalized DSD intercepts (Nw in mm−1/m3), where Nw denotes the raindrop number concentration as rainwater content and raindrop size are constant. The relationship between dBNw and Nw is dBNw = 10 lg(Nw). For simplicity, hereinafter, dBNw is used rather than Nw. Figure 6 shows the NCFAD of Dm of two types of heavy precipitation over different types of terrain. Small precipitation particles (Dm ≤ 1.2 mm) are mainly concentrated between STA and FzH, and the precipitation particles in this layer mainly exist in the form of ice crystals. With the elevation of terrain, the horizontal distribution domain of Dm increases while the vertical distribution domain decreases. For the same terrain, the horizontal and vertical distribution domain of Dm of heavy SP is smaller than that of heavy CP. In addition, the maximum Dm of the horizontal distribution domain is also smaller than that of CP. For heavy CP, with the elevation increasing, the occurrence probability of large raindrops (Dm ≥ 2.6 mm) increasing, as shown in Figure 6d–f. It can be clearly seen from Figure 6a–c that in heavy SP, precipitation particles with Dm of 1.3–1.6 mm below FzH of mountains and high mountains have a higher probability of occurrence than that of plains. This is mainly caused by the difference of water vapor content near FzH, which will be discussed in Section 4.
From Dm profiles of different rain intensity levels (Figure 7), it can be seen that the value of CP near the surface is always greater than SP under the same terrain and rain intensity levels. The Dm profiles of light CP (0.5 ≤ RR < 2 mm/h) that are shown in Figure 7f are obviously different from that of other rainfall intensity. The Dm profile of light CP over high mountains decreases as altitude decreases from STA to FzH, while that of other rainfall intensity increases as altitude decreases. Different from light SP (Figure 7a), the Dm profile of plains of CP (Figure 7f) decreases as altitude decreases from FzH to surface because of the less water vapor in low-level atmosphere over plains, which tends to reduce the diameter of small raindrops by evaporation. Above an altitude of 10 km, the Dm of heavy precipitation over high mountains are larger than those over plains and mountain (Figure 7e,j), particularly in heavy SP, which is significantly different from that of other rainfall intensity.
There is a close relationship between Dm and Ze. In general, large Dm of precipitation particles correspond to large Ze. As shown in Figure 7e,j, the near-surface Dm of CP is significantly larger than that of heavy SP, and therefore the near-surface Ze is also larger than that of SP (Figure 5e,j).

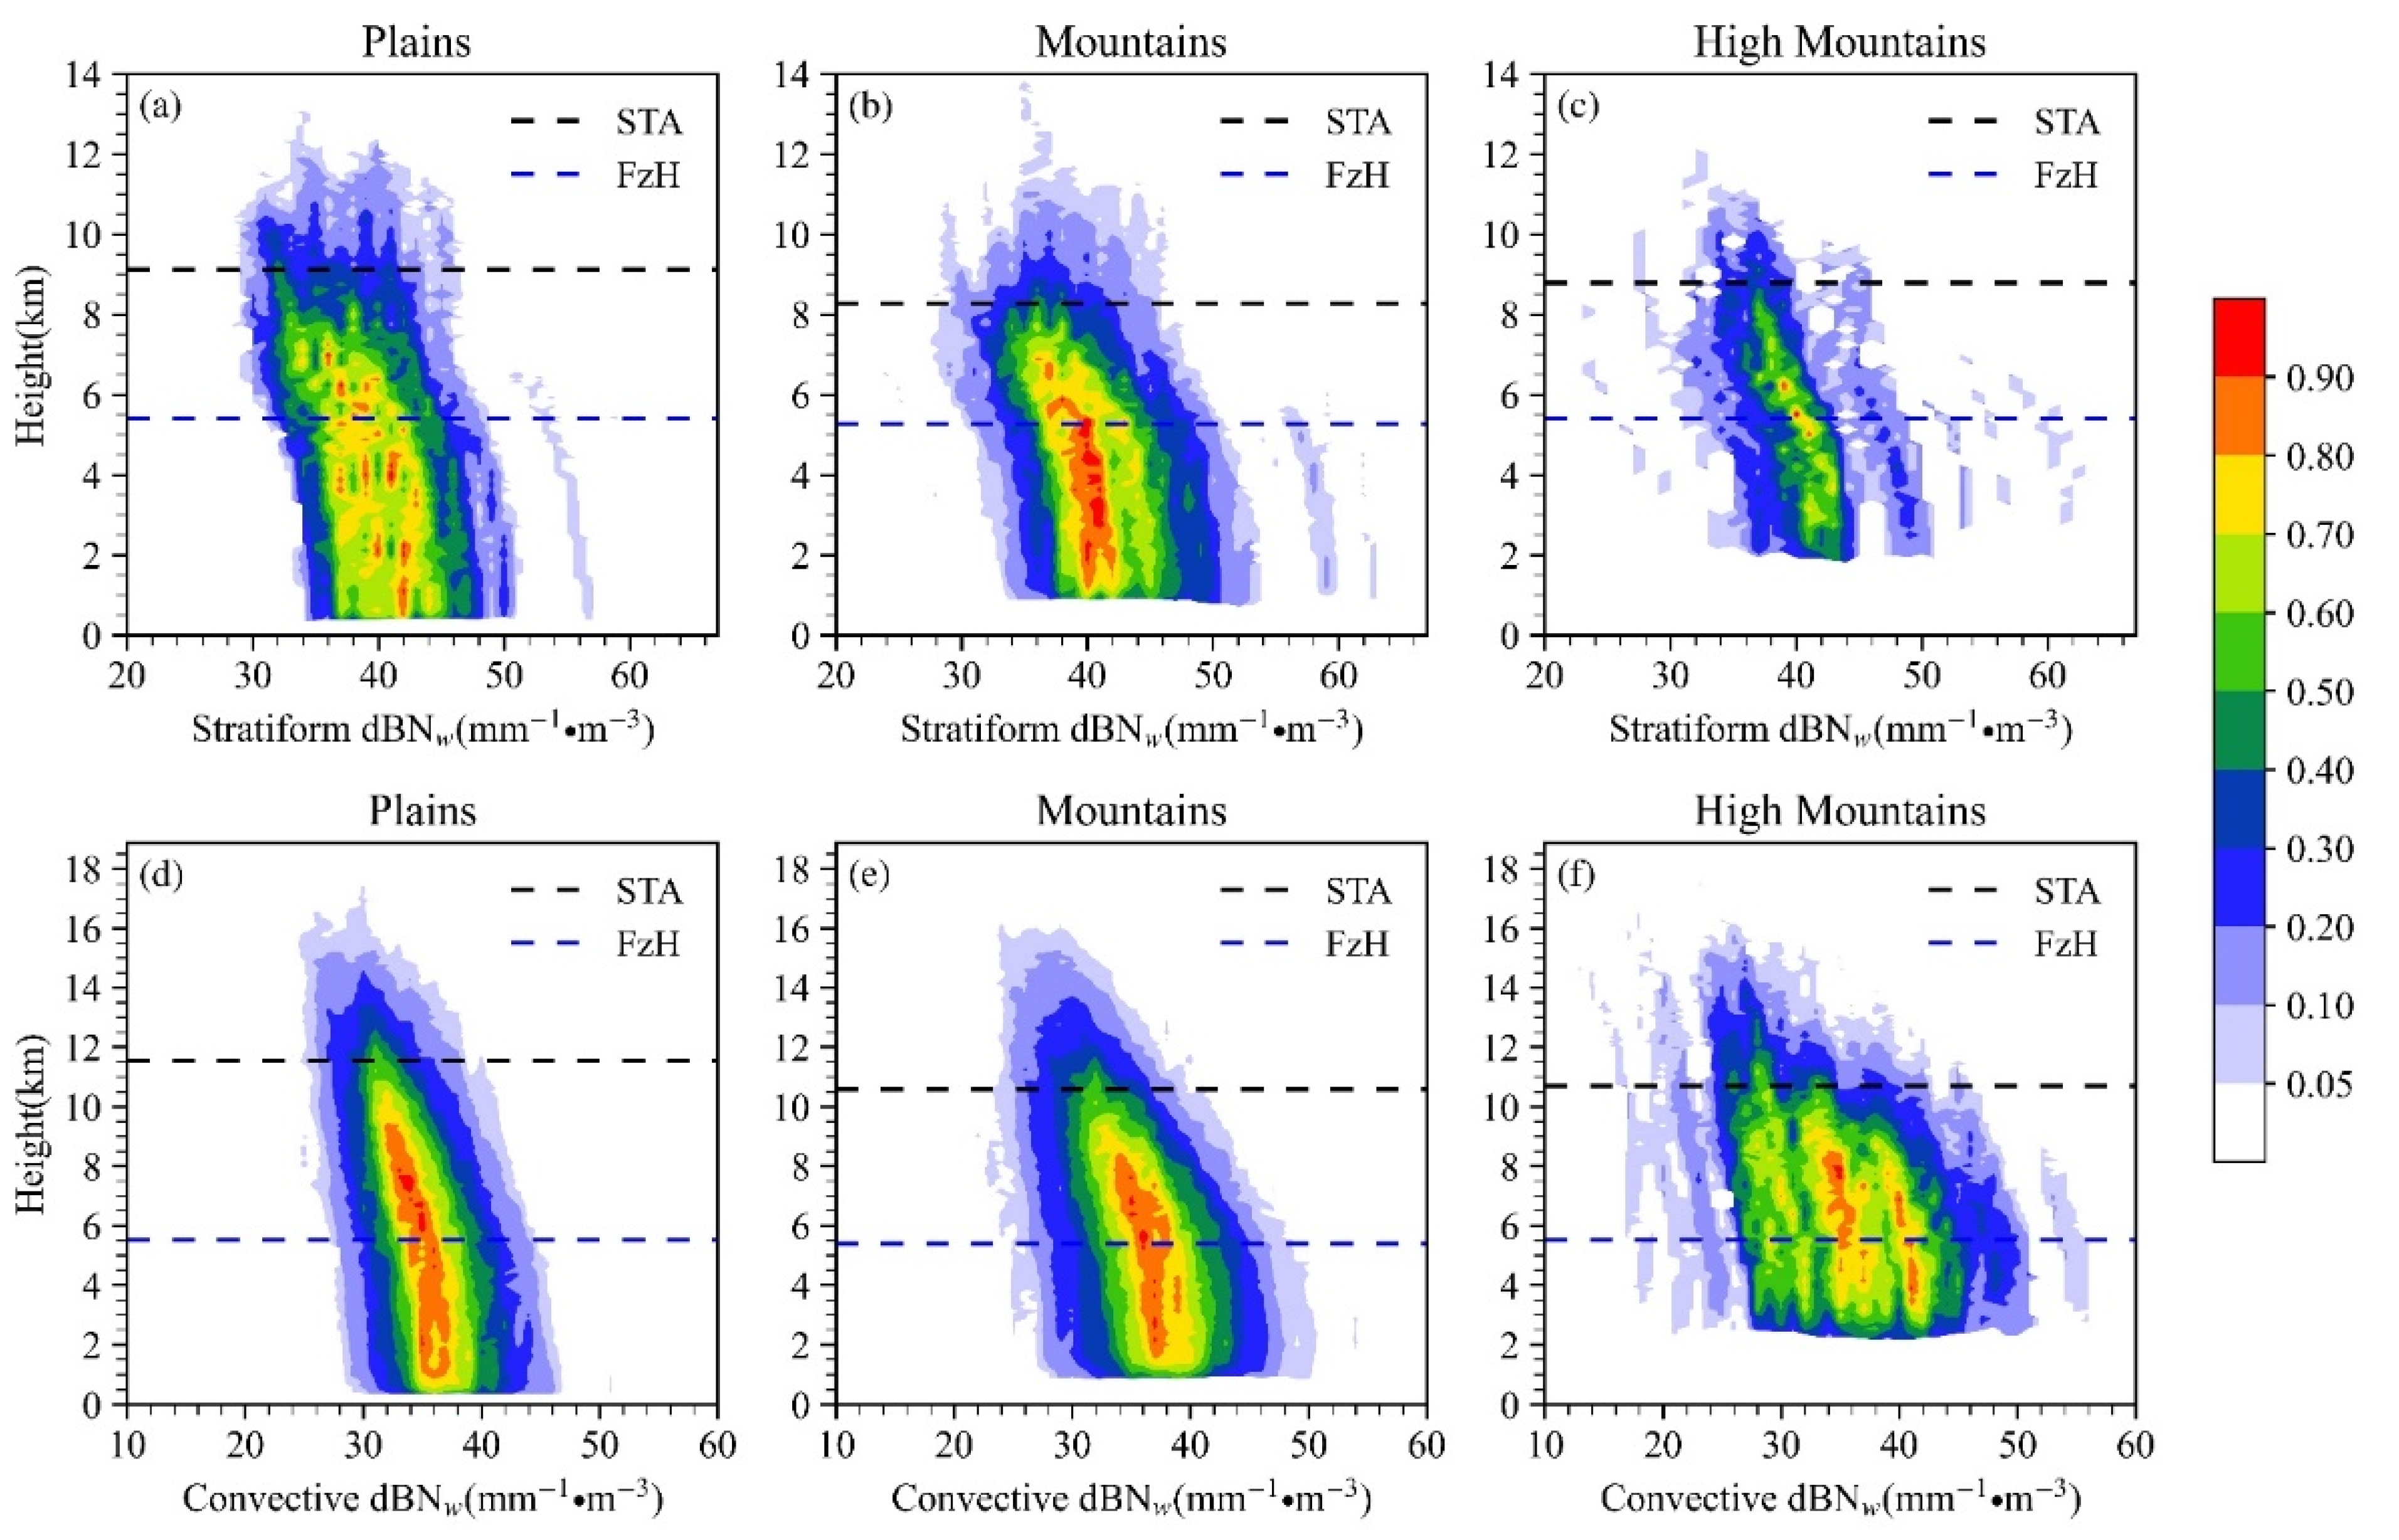
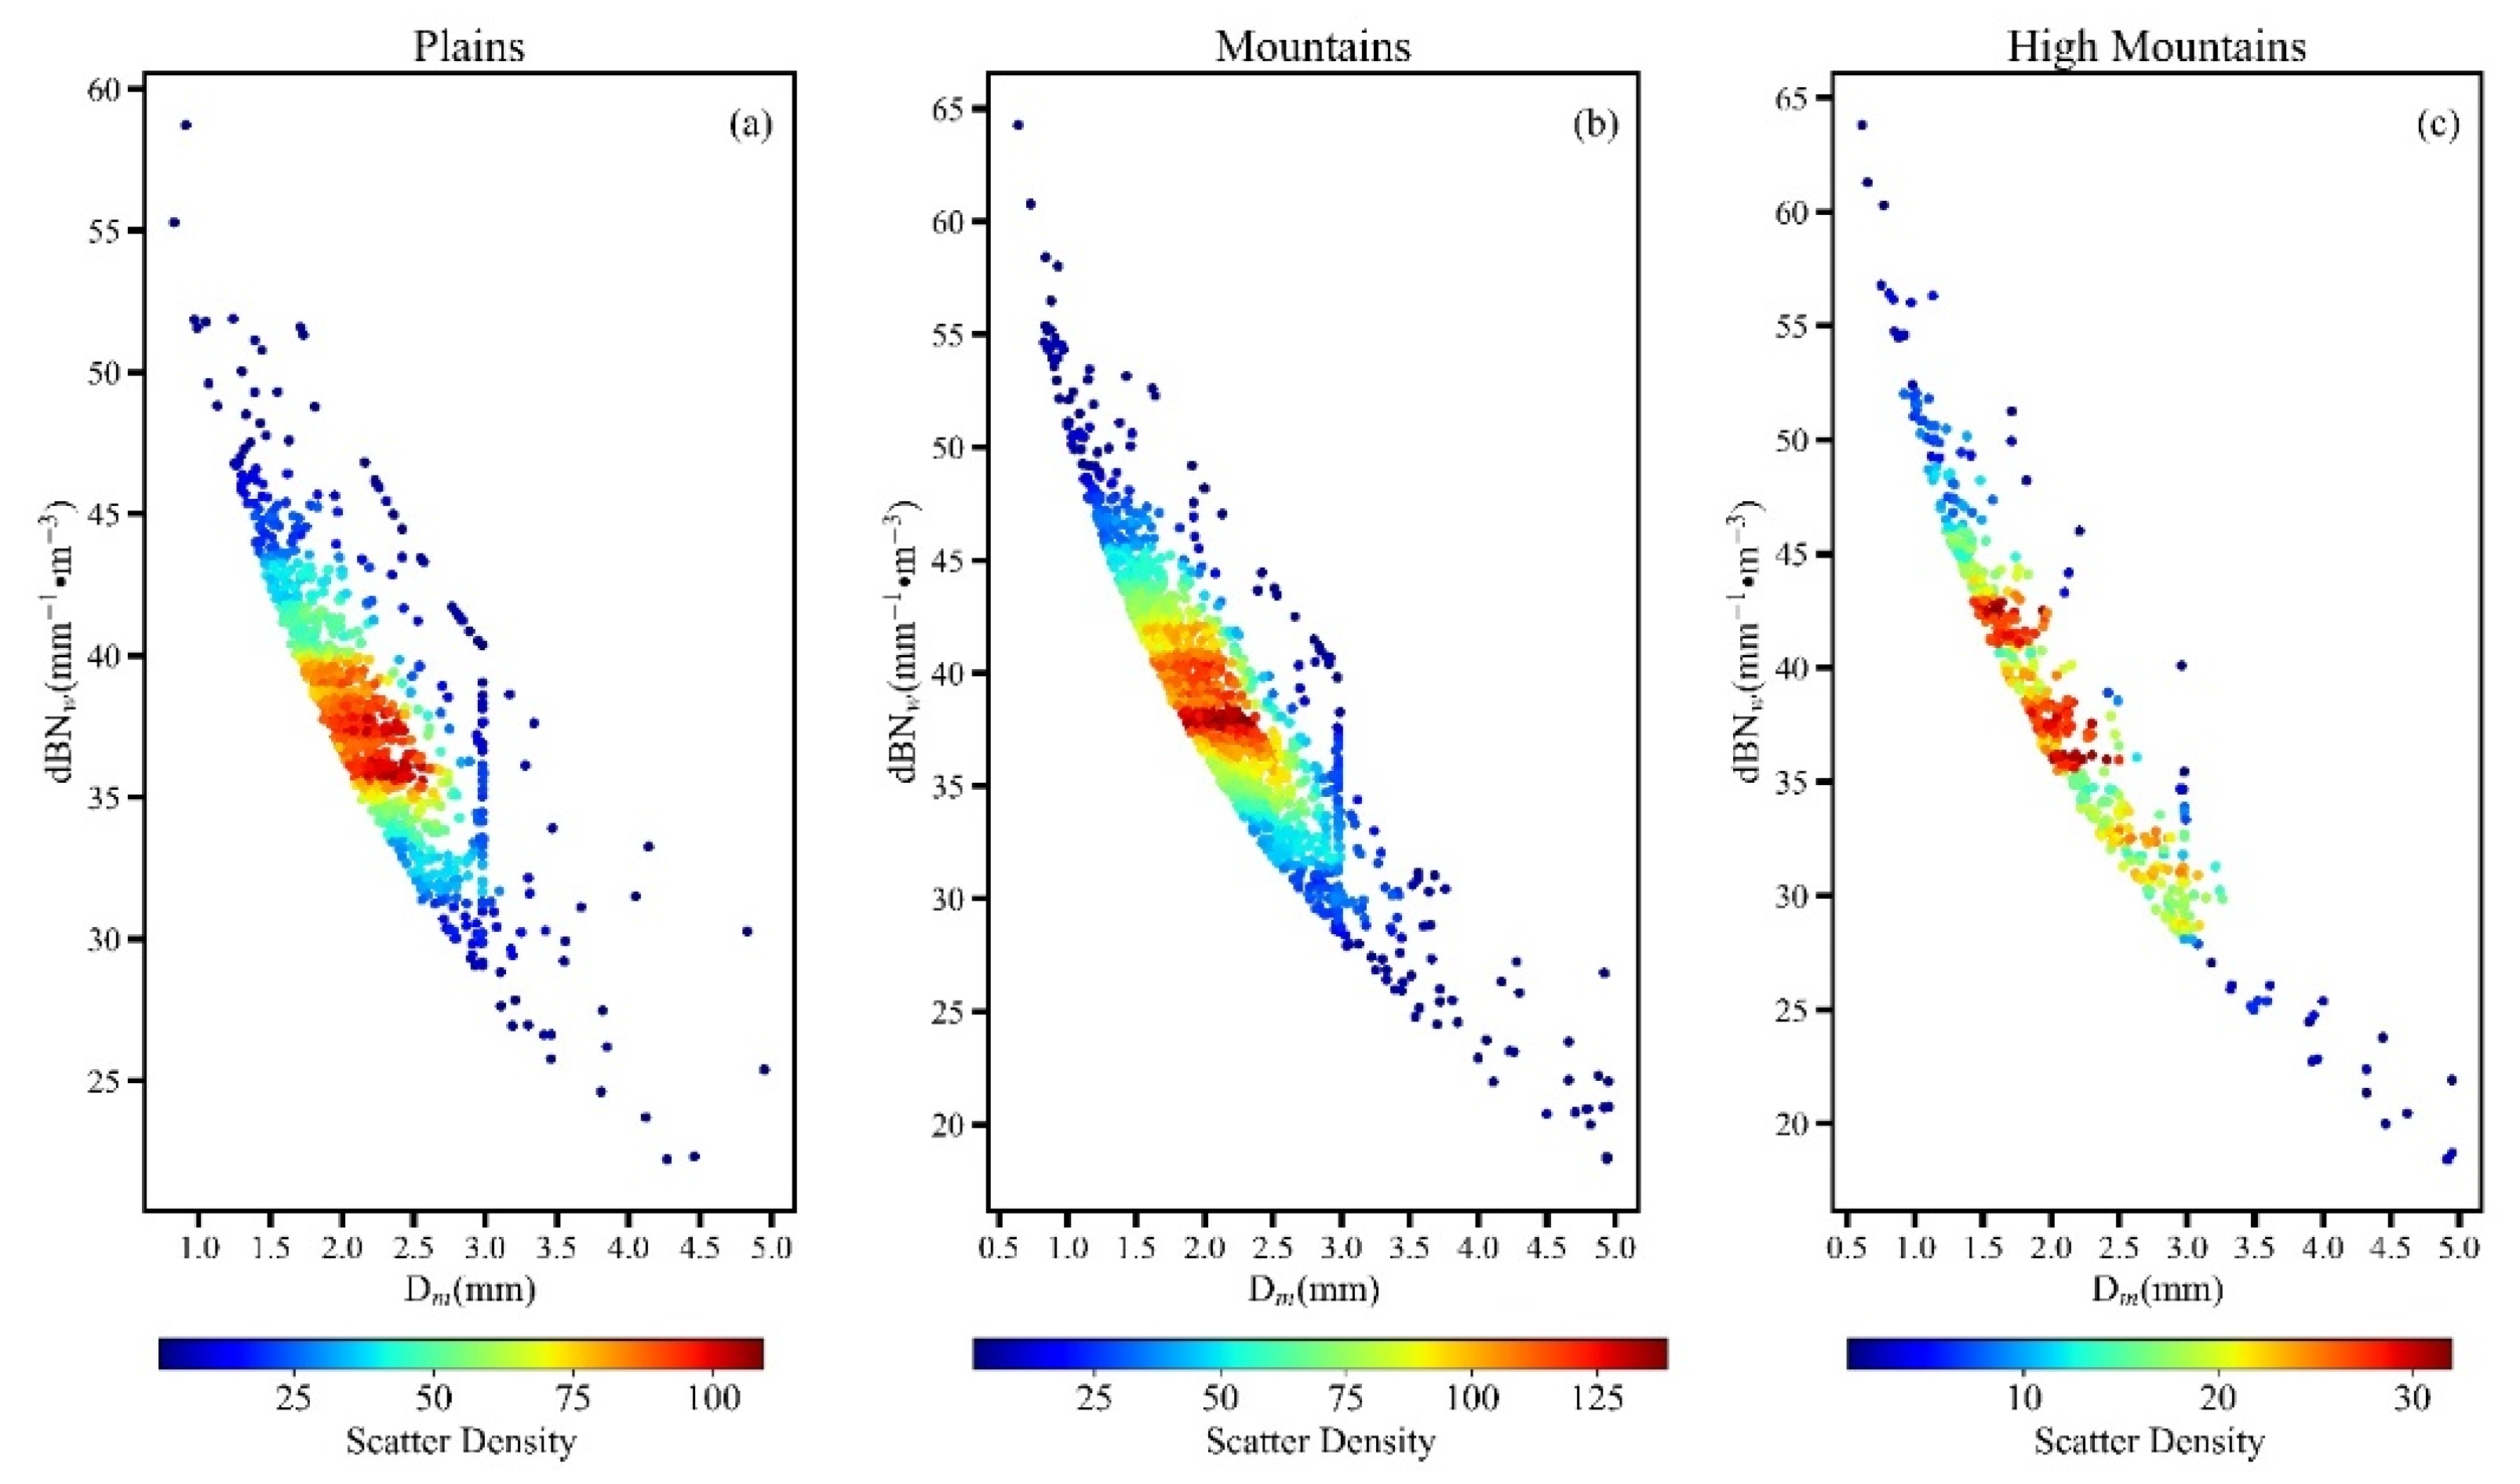
3.3. Vertical Distribution Characteristics of dBNw

For the same terrain, compared with dBNw NCFAD of two types of heavy precipitation (Figure 8), it shows that the horizontal distribution domain of dBNw of heavy SP over plains and mountains is wider than that of CP while the high frequency areas of dBNw are not as concentrated as those of heavy CP. In contrast, the horizontal distribution domain of dBNw of heavy SP over high mountains is smaller than that of CP while the high frequency areas are more concentrated. For different types of terrain, the vertical structure of dBNw of heavy CP is also different, as shown in Figure 8d–f: The higher elevation is, the wider horizontal distribution domain of dBNw is. Below FzH, the high frequency areas of dBNw over plains are the most concentrated with 34–38 mm−1/m3, while those over mountains and high mountains are more scattered, especially over high mountains. The opposite is true for heavy SP. The high frequency areas of dBNw over mountains and high mountains are more concentrated than those over plains (Figure 8a–c).
Figure 9 shows the mean dBNw profiles with different surface rainfall intensity. In each panel, dBNw overall increases as altitude decreases. For heavy precipitation (Figure 9e,j), the dBNw above 10 km over high mountains are obviously smaller than those over plains. Combined with the mean Dm profiles of heavy precipitation (Figure 7e,j), compared with plain areas, precipitation particles over high mountains have the characteristics of lower number concentration and larger scale above 10 km.

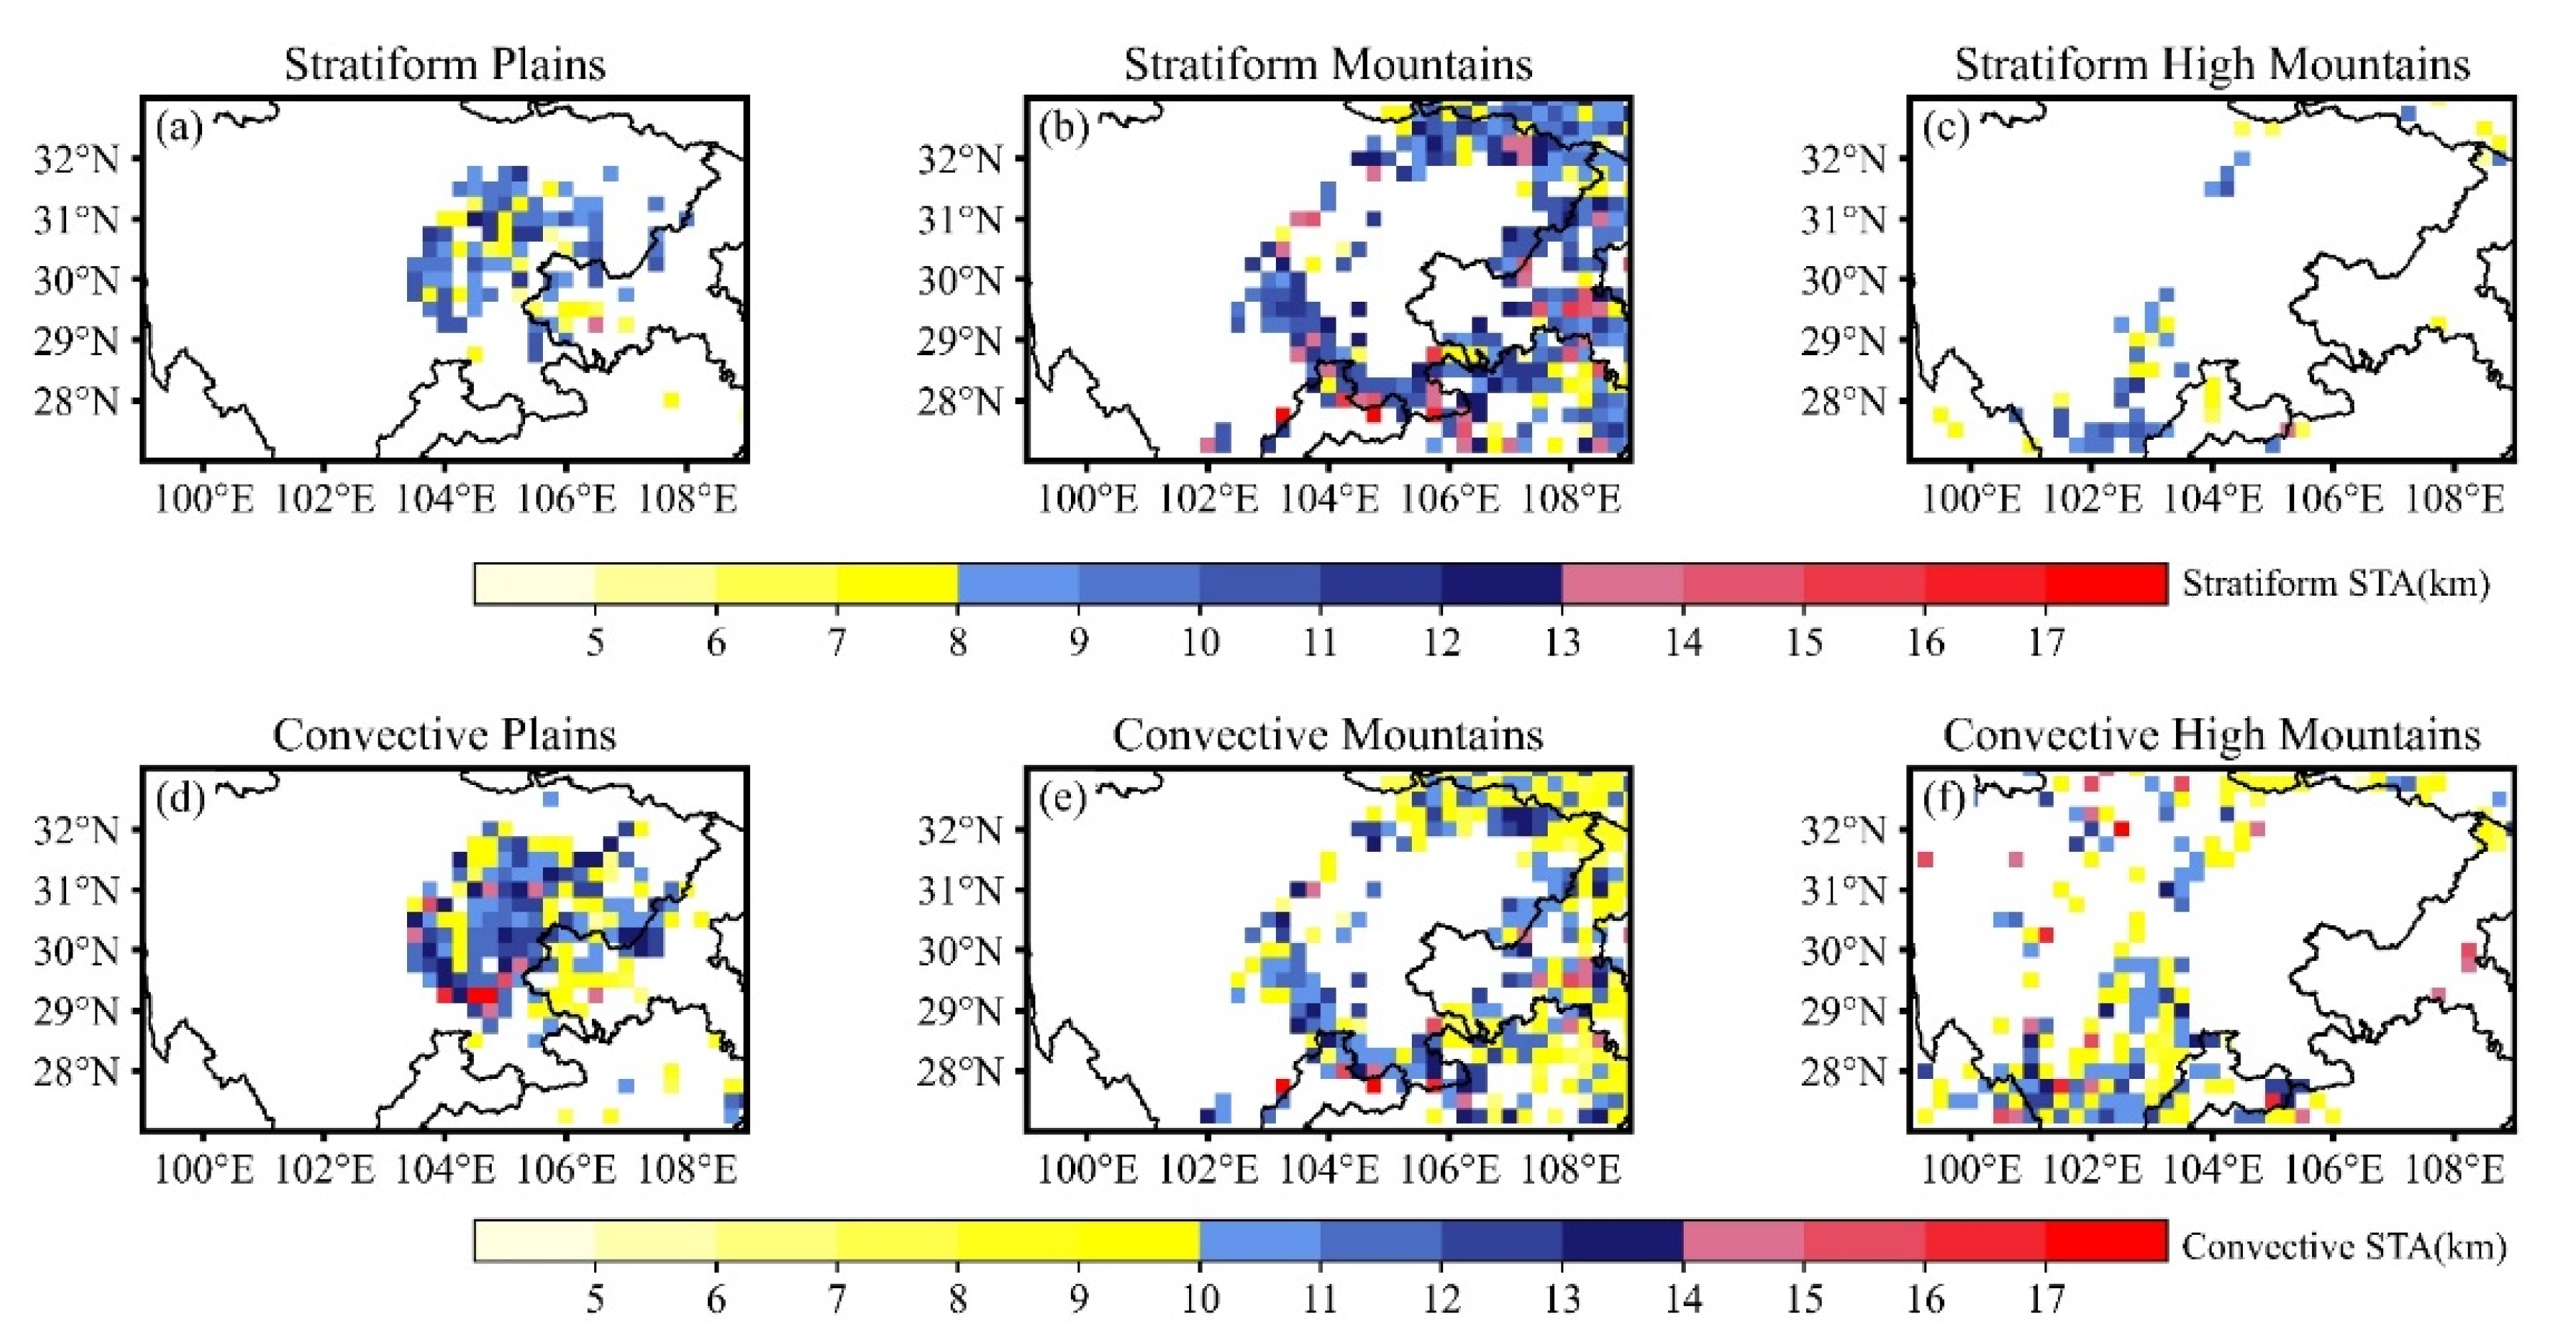
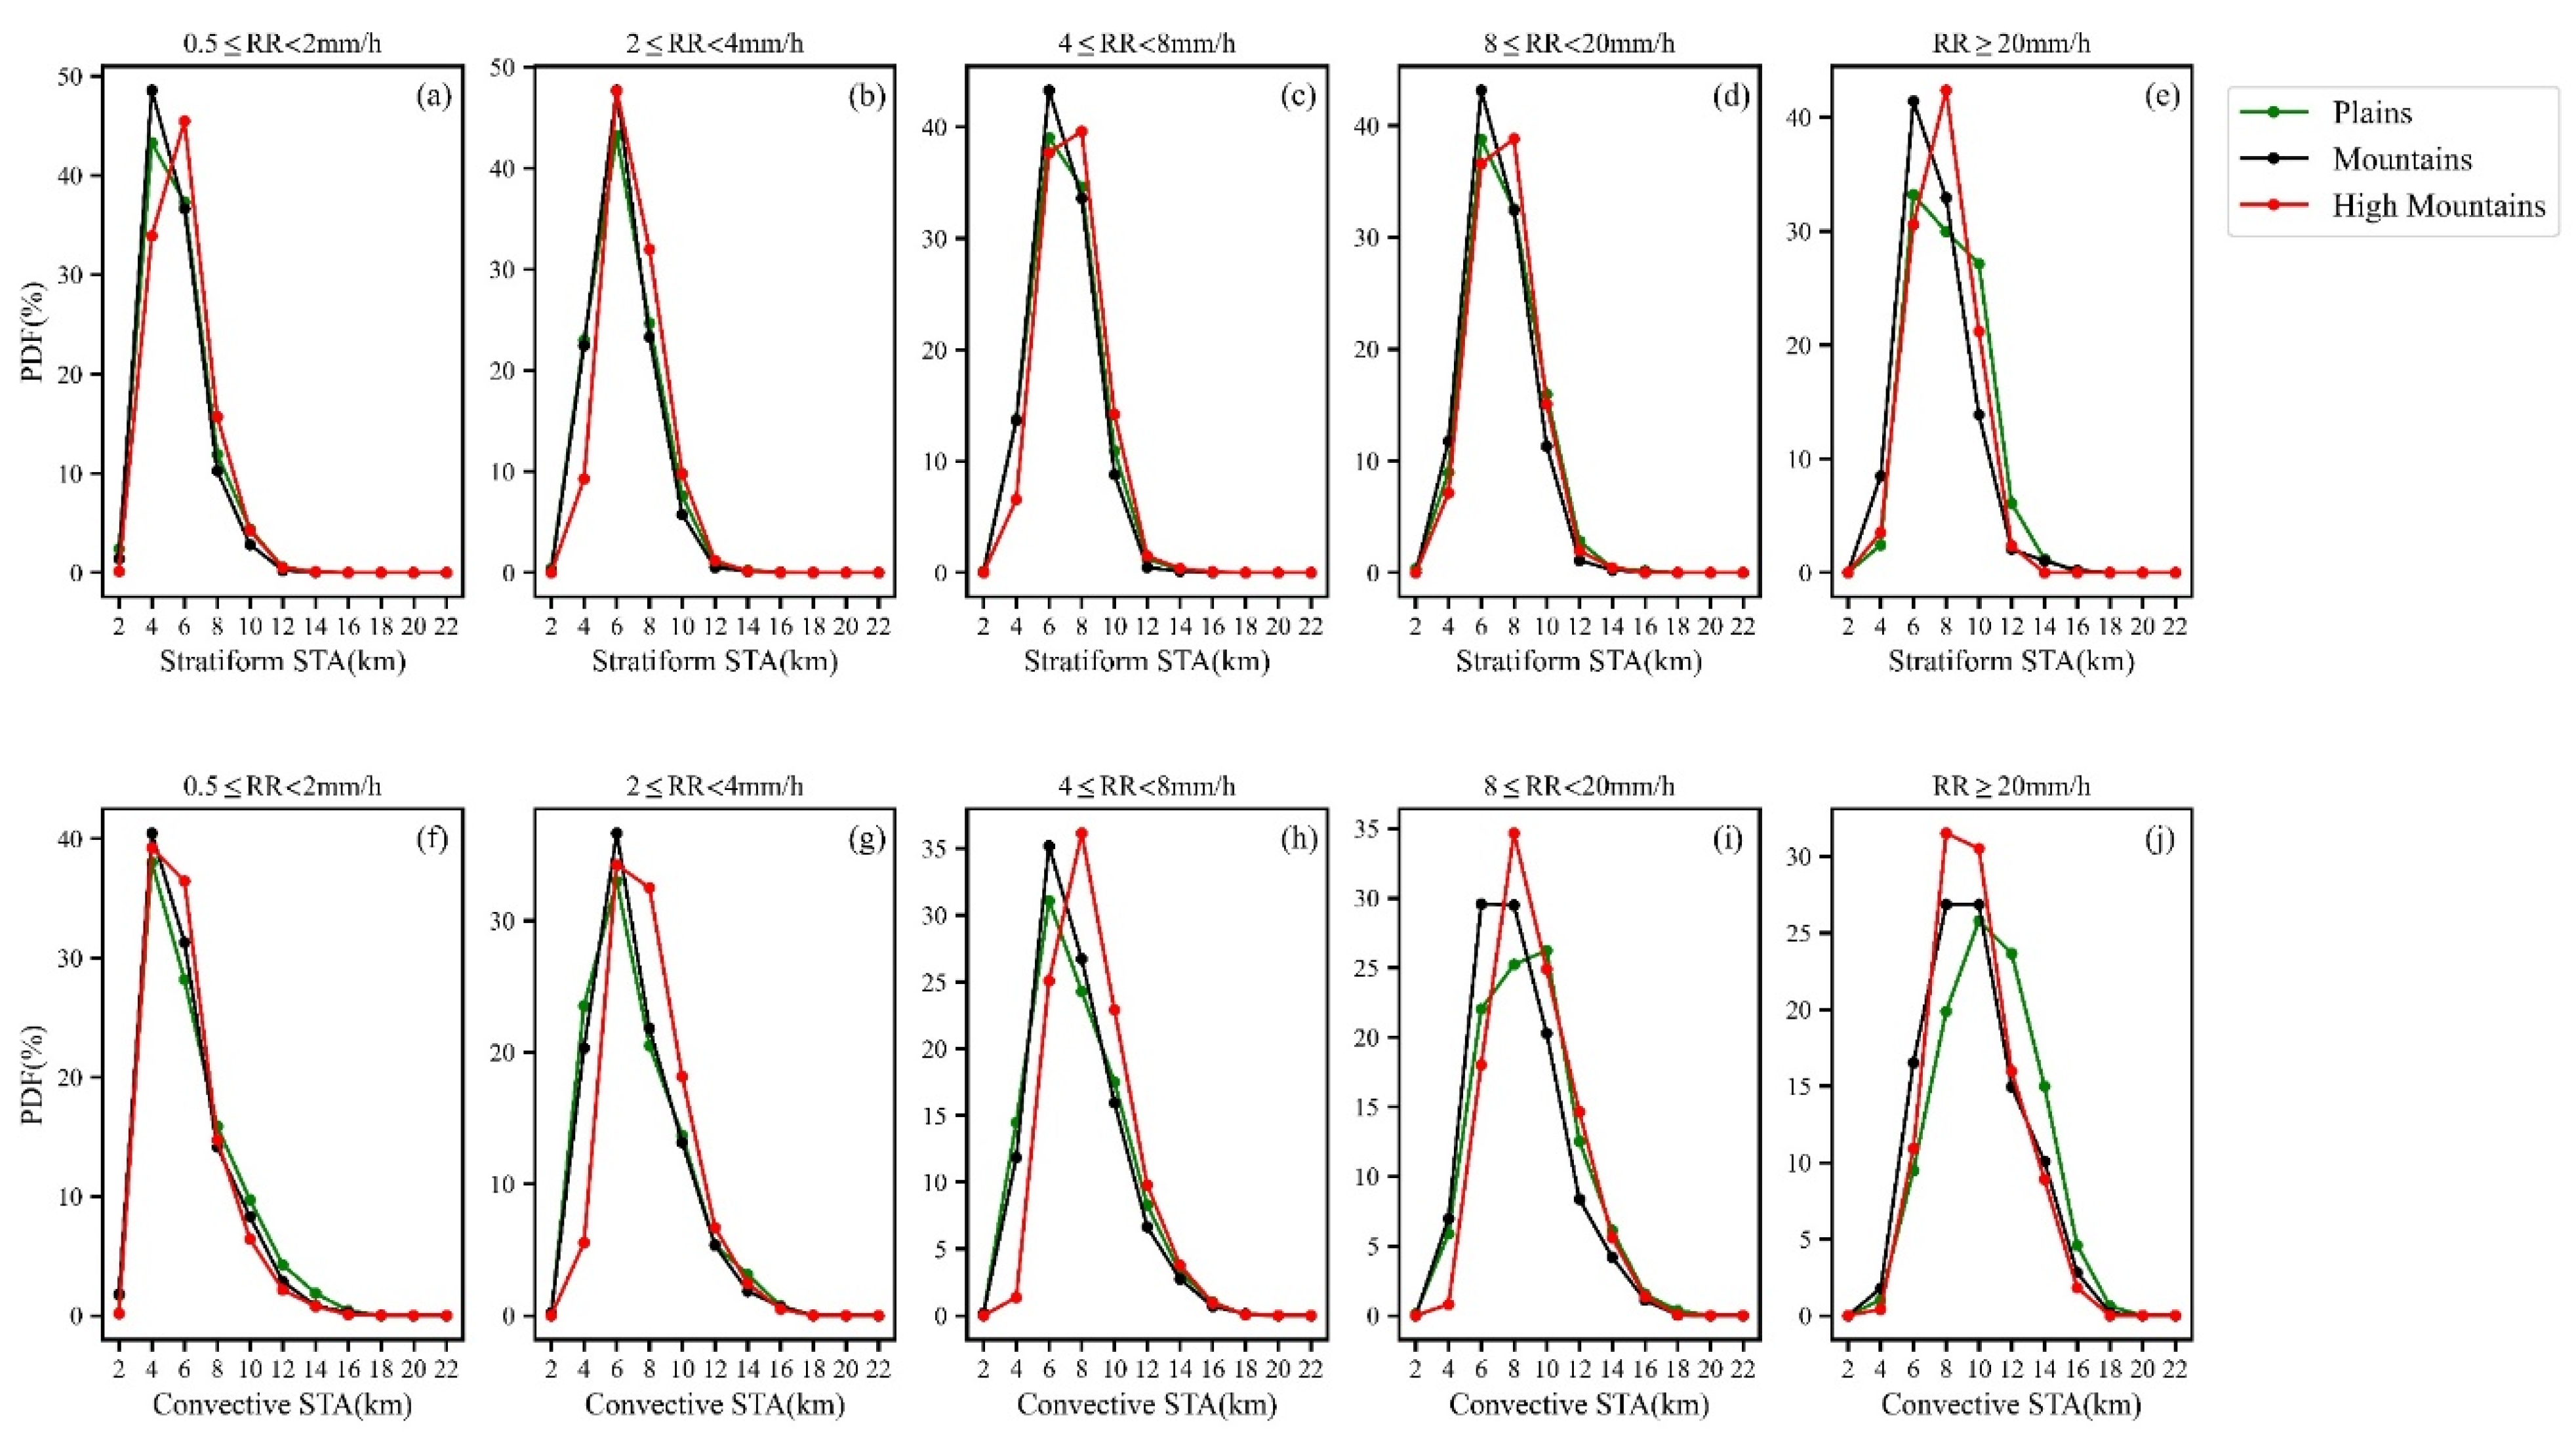
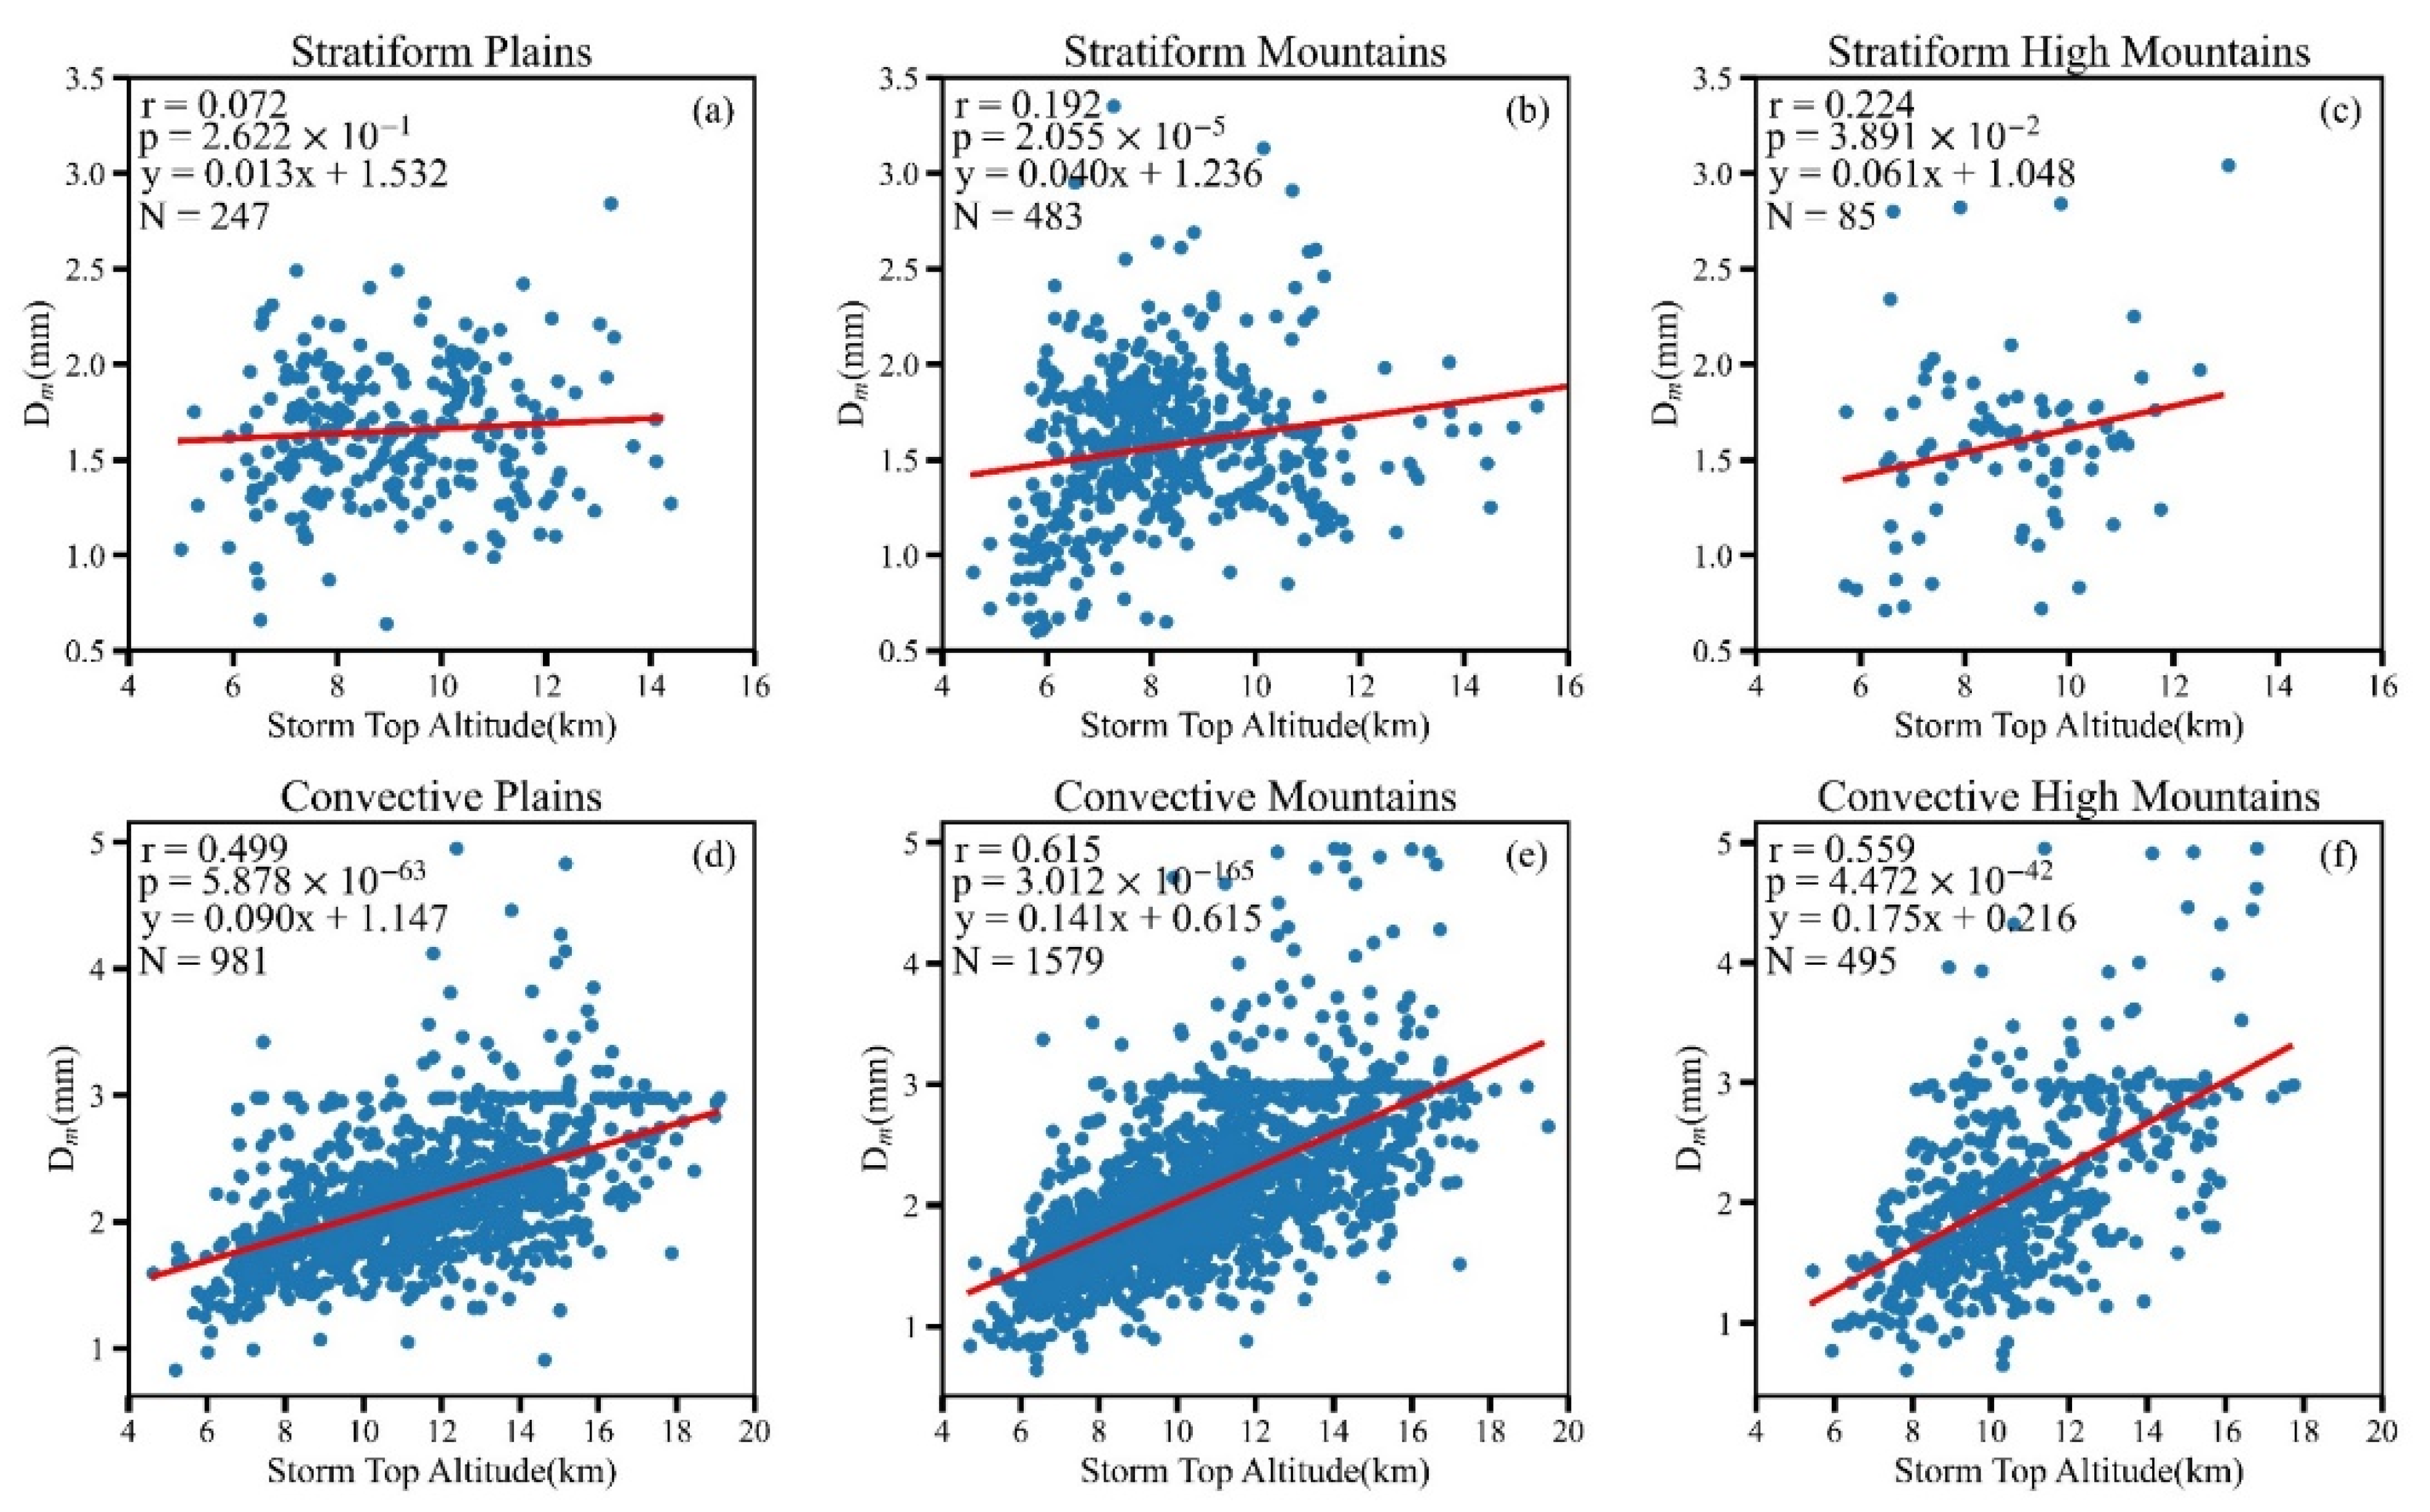
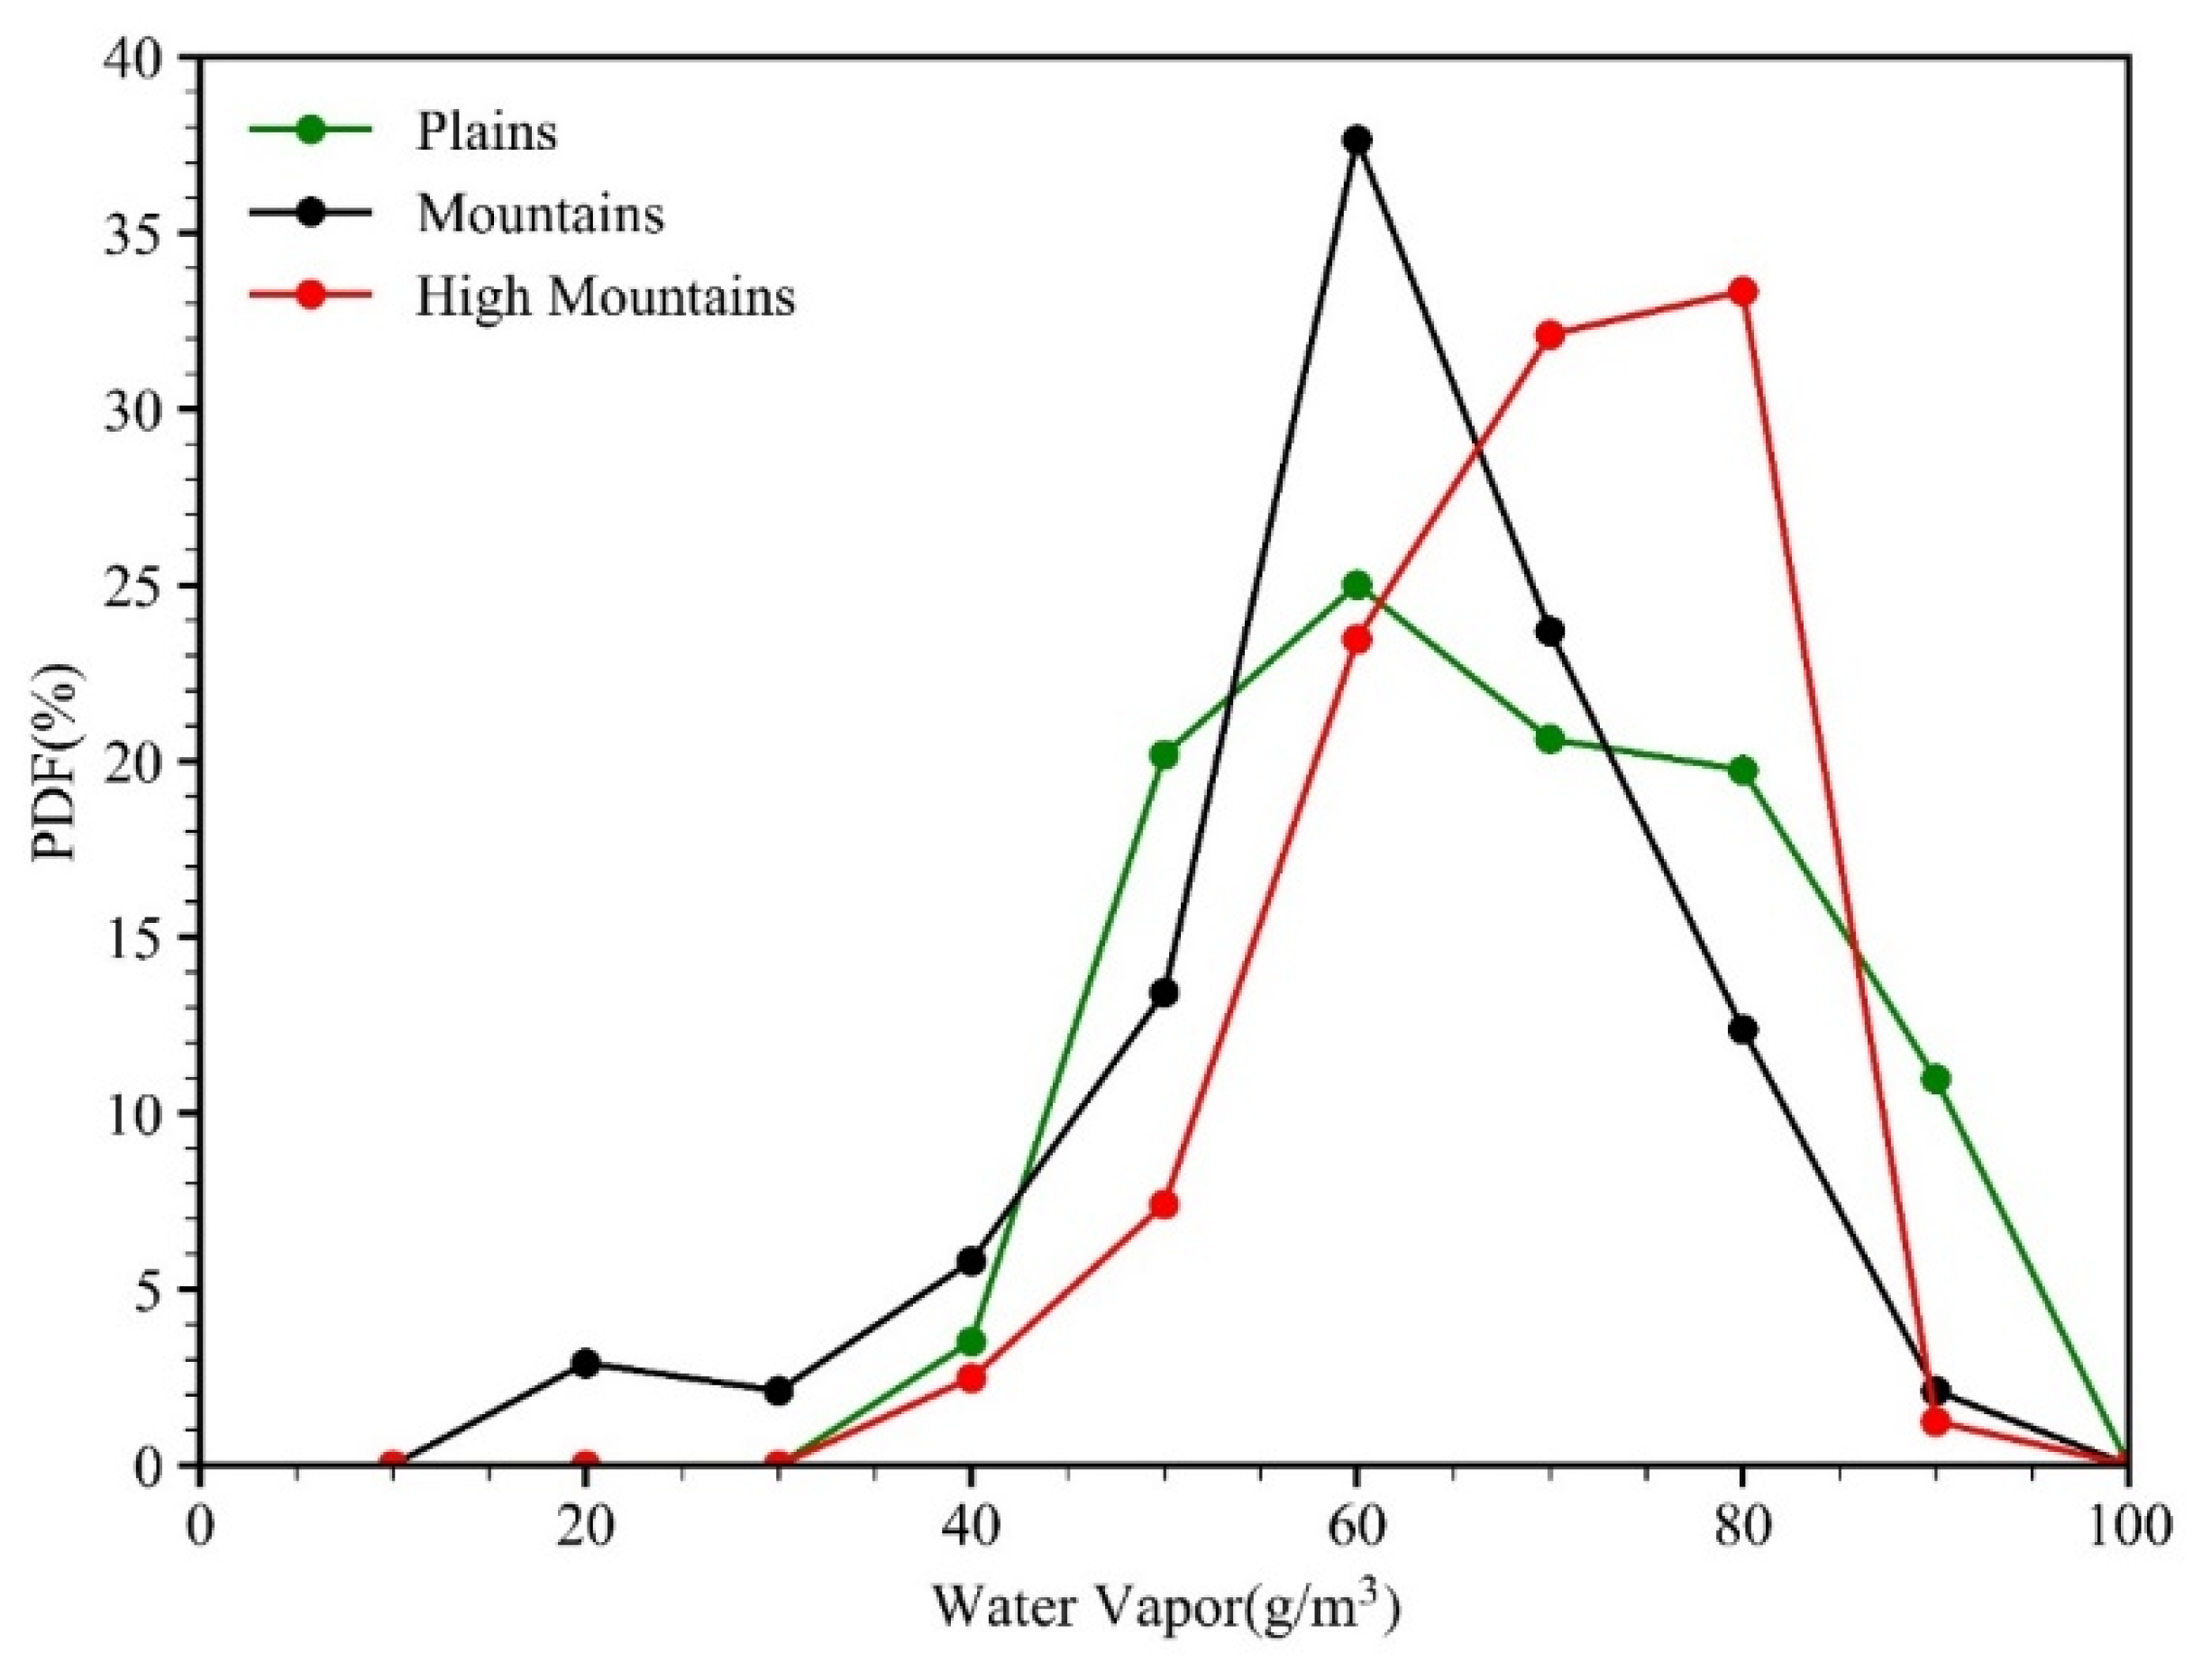
3.4. Distribution Characteristics of Storm Top Altitude and Water Vapor

In general, for the same type of precipitation, the higher STA is, the heavier precipitation is. STA is usually lower than the cloud top height, and when STA is low, the cloud top height varies widely. The higher STA is, the more similar the cloud top height is to STA [42].
Figure 10 shows the horizontal distribution of STA when heavy precipitation occurred. For the same types of terrain, STA of heavy CP is overall higher than that of heavy SP. For heavy CP, the high value areas of STA over plains (Figure 10d) are mainly located in the central and western of the Sichuan Basin where roughly correspond to the high frequency areas of heavy precipitation. The high value areas of STA over mountains are mainly located in the region where the plain and the mountain meet in the west of the Sichuan Basin (Figure 10e). In general, STA over plains is higher than those over mountains and high mountains, regardless of heavy CP or SP.
In order to have a more intuitive understanding of the distribution of STA, Figure 11 shows the probability distribution functions (PDFs) of STA over plains, mountains and high mountains with different rain intensity levels. It can be seen that when heavy precipitation occurs, STA is mostly above 6 km altitude (cloud system is deep). In the same terrains, STA of heavy CP is generally higher than heavy SP (Figure 11e,j), which also indicates that convective cloud develops more vigorously than stratus in the vertical direction. When the RR is less than 8 mm/h, there is no significant difference in STA of CP and SP over the same terrain. When the surface RR increased to 8–20 mm/h, STA of precipitation over mountains and high mountains was still roughly the same, but STA of precipitation over plains began to show significant differences. STA of CP over plains was significantly higher than that of SP, and its highest frequency was about 4 km higher than that of SP. When CP occurs, with the increase of RR, the height corresponding to the maximum occurrence frequency of STA also increases. For the two types of precipitation with RR < 20 mm/h, STA of precipitation over high mountains is generally higher than those over plains and mountain. When the RR ≥ 20 mm/h for heavy CP, STA over plains is obviously higher than those over mountains and high mountains. STA of heavy CP over plains is mainly concentrated at 10–14 km altitude, while that in mountains and high mountains are mainly concentrated at 9–11 km altitude.
It is usually considered that convective overshooting is with STA > 10 km, and deep SP is with STA > 8 km. Fu et al. [43] divided STA into three categories, including STA < 5 km, 5–10 km and > 10 km, which represent shallow convective, moderate convective and deep convective (also called convective overshooting) respectively. Likewise, divided STA into below 5 km, 5–8 km and above 8 km, representing shallow stratiform, moderate stratiform and deep stratiform respectively. Statistics on the categories of STA over the Sichuan Basin and its surrounding areas are shown in Table 2. It can be found that with the increase of RR, the proportion of shallow precipitation gradually decreases, while the deep precipitation increases with the increase of RR. For heavy precipitation, the proportion of deep convective over plains is 69.6%, higher than mountains (54.8%) and high mountains (57.2%). For heavy SP, there is little difference in the proportion of deep stratiform between plains and high mountains (64.4% and 65.9%, respectively), both higher than mountains (50.1%).
STA is related to the strength of the updraft and affected by properties of the underlying surface [44]. The updraft not only influences STA, but also plays a significant role in the size of the precipitation particles. Therefore, it is speculated that there may be a correlation between STA and the precipitation particles size, then the correlation between STA and the near-surface Dm was tested for significance (Figure 12). Except for the heavy SP over plains and high mountains that failed with 0.01 significance level, all others passed the significance test, indicating that there is a positive linear correlation between STA and near-surface Dm of heavy precipitation except for the heavy SP over plains and high mountains. For the same types of terrain, the correlation of heavy CP is higher than that of heavy SP, and the correlation of heavy CP over mountains is the most significant, which may be related to different mechanisms of heavy CP and SP. For heavy CP, as shown in Figure 12d–f, the slope of the regression equation of high mountains is the largest, followed by mountains and plains in sequence, which shows that when near-surface Dm grows to the same diameter, STA over high mountains is usually the lowest while that over plain is usually the highest.
Water vapor is one of the important physical quantities that affects precipitation. The momentum, water vapor and heat convergence in meteorological boundary layer all contribute to the rainstorm during the heavy rainfall processes. Figure 13 exhibits the horizontal distribution characteristics of total water vapor from the surface to FzH when heavy precipitation occurs. The maximum value of water vapor is mainly located over the plains, and the water vapor gradually decreases as the elevation increases, showing a stair-like decrease from west to east. The horizontal distribution characteristics of water vapor are roughly similar to STA.
Figure 14 shows the correlation between the sum of water vapor from the surface to FzH and STA. For the heavy CP and SP over plains and mountains except high mountains passed with 0.01 significance level, which suggests there is a positive linear correlation between the sum of water vapor from surface to FzH and STA. For the same terrain, the correlation of heavy SP is more relevant than that of heavy CP, and it is most significant over plains.

4. Discussion

In this section, we discuss and analyses the reasons for the difference of precipitation particles of heavy precipitation over different terrain, including plains, mountains, and high mountains. For heavy CP, the occurrence probability of larger precipitation particles (Dm ≥ 2.6 mm) increases with elevation (Figure 6d–f). We suggest that strong updraft is more likely to form due to mountainous topographic lifting, and the strong updrafts tend to hold up the falling raindrops, slowing them down, and can carry some small raindrops to high altitudes to collide and merge with the falling raindrops, which leads to higher collision efficiency. In addition, the strong updraft can also carry sufficient water vapor into the cloud, which is also conducive to the formation of large raindrops. Yan et al. [45] proposed that the strengthening of ascending movement will also cause the snow and graupel particles above FzH to grow rapidly, making it easier to generate large rain droplets. Strong turbulence facilitates raindrops colliding and merging into large raindrops, meanwhile, it is facilitating raindrops breakup into little raindrops. This phenomenon is well evidenced by the wider Dm horizontal distribution over mountains and high mountains than those over plains (Figure 6d–f). Another explanation is due to the seeder–feeder mechanism. In Figure 15, the relationship between near-surface Dm and near-surface dBNw is shown for the heavy CP over the three areas. For heavy CP, when dBNw is > 40 mm−1/m3, it generally corresponds to Dm < 2 mm, and this relationship is best in high mountains. In Figure 8f, it can be clearly observed that the occurrence probability of region with dBNw > 40 mm−1/m3 below FzH of high mountains is much higher than those of plains. Wilson and Barros [46] showed that the seeder-feeder mechanism leads to an accelerated growth of small and moderate size raindrops (Dm < 2 mm). This process could explain the enhancement of coalescence and the increase of the concentration of small drops [27]. Yan et al. [45] mentioned that for heavy rain, the cloud ice particles with large number concentrations (>600 L−1) seldom occur, and they are more inclined to gather at moderate concentrations (100–250 L−1) above 9 km over the Tibetan Plateau (roughly corresponds to the high mountains in this study) compared with the northern India and south of the Tibetan Plateau (NIST) and tropical ocean (TO). The cloud ice particles with smaller number concentrations usually correspond to the larger sizes of cloud ice particles. In this study, for heavy precipitation, precipitation particles over high mountains have the characteristics of lower number concentration and larger scale above 10 km. We speculate that there is some connection between the cloud ice particles and precipitation particles. However, this assumption needs further exploration and validation in future studies.
For heavy SP, the occurrence probability of precipitation particles Dm below FzH within 1.3–1.6 mm over high mountains are significantly higher than those over plains (Figure 6a,c). The total water vapor near FzH (altitude at 4.5–6.5 km) over high mountains is more sufficient than those over plains (Figure 16). In addition, the underlying surface of the high mountains is closer to FzH, and the updraft is more likely to transport water vapor to FzH, which makes snow and graupel particles above FzH grow rapidly and form larger raindrops more easily. Owing to sufficient water vapor, the occurrence probability of Dm in the range of 1.1–1.3 mm over high mountains is much lower than those over plains, and the Dm over high mountains tends to concentrate in the range of 1.3–1.6 mm (Figure 6a,c).

5. Conclusions

The Sichuan Basin and its surrounding areas are divided into three types of terrain based on ETOPO1, including plains, mountains, and high mountains. The Ze and the vertical structural of SP and CP particles over the three types of terrain were analyzed by measurements and retrievals from GPM DPR from May to September of 2014–2021. The major conclusions of this study can be summarized as follows.
  • The FzH of the two types of heavy precipitation is hardly affected by topography, except for heavy CP over mountains. The mean Ze profiles of SP are significantly bent near FzH, which is different from that of CP.
  • For the same types of terrain, the Dm horizontal distribution domain, vertical distribution domain, and the maximum Dm of the horizontal distribution domain of heavy CP are all larger than those of heavy SP. With the increase of elevation, the horizontal distribution domain of Dm of the two types of heavy precipitation increases, while the vertical distribution domain of Dm decreases. For heavy CP, as elevation increases, the occurrence probability of larger precipitation particles (Dm ≥ 2.6 mm) increases as well as Dm horizontal distribution domain, which is probably related to the strong updraft rendered by topography, while the seeder-feeder mechanism may also enhance particle growth mechanism. For heavy SP, the occurrence probability of medium raindrops (Dm in 1.3–1.6 mm) below FzH over high mountains is higher than those over plains. This is because water vapor over high mountains is more sufficient, the underlying surface is closer to FzH, and the updraft is more likely to transport water vapor to FzH, which makes snow and graupel particles above FzH grow rapidly, and thus it is easier to form larger raindrops. For heavy precipitation, the higher the elevation, the larger the Dm above 10 km altitude.
  • The mean dBNw profiles of the two types of precipitation overall increase with the decreases of altitude. For heavy CP, the dBNw high frequency area of plains is more concentrated than that of mountains and high mountains, while the situation of heavy SP is opposite. Above 10 km altitude, compared with plains, the precipitation particles of heavy precipitation over high mountains have the characteristics of lower number concentration and larger scale.
  • In the same terrain, overall, STA of heavy CP is higher than heavy SP. The distribution characteristics of STA of the two types of heavy precipitation are consistent, and STA of plain is generally higher than that of mountains and high mountains. There is a positive linear correlation between STA and the near-surface Dm for heavy precipitation (excluding heavy SP over plains and high mountains), and the correlation is most significant for heavy CP over mountainous. The slope of the linear regression equation of heavy CP over high mountainous terrain is the largest, followed by mountains and plains, indicating that when precipitation particles grow to the same size over different terrains, the STA of high mountainous is the smallest, while that of plains is the largest.
  • For heavy precipitation, the total distribution of water vapor from ground to FzH is the most sufficient over plains, followed by over the mountains, and the smallest over high mountains, which is caused by the difficulty of transporting water vapor to mountains and high mountains areas due to the effect of altitude and terrain barrier. For heavy precipitation (excluding heavy precipitation over high mountains), there is also a positive linear correlation between STA and the total water vapor in the altitude layer from surface to FzH, and the correlation of heavy SP over plains is the most significant.
The present study mainly focuses on heavy rain DSD, by comparing the DSD characteristics at low-altitude flat terrain and high-altitude complex terrain, leads to evidence and understanding about the effect of Sichuan’s unique orography on rain physics. It is very clear from the present study that for heavy precipitation, high-altitude complex terrain has a higher occurrence probability of larger raindrops than plains in Sichuan. This situation is critical because larger rain drops could cause more soil erosion, which leads to the triggering of landslides [26]. Therefore, in the present study on the orographic effect of rain DSD, it would also be useful and throw more light on landslide triggering mechanisms. Likewise, preliminary connections between some physical quantities would help improve the current understanding of the effects of Sichuan’s unique topography on microphysical precipitation processes. The current work is a preliminary study focusing on some facts about the characteristics and differences due to different terrains, as well as the internal relationships and mechanisms that remain to be studied further in the future.

Author Contributions

Conceptualization, C.S. and G.L.; methodology, C.S. and G.L.; software, C.S.; validation, C.S. and G.L.; formal analysis, C.S.; investigation, C.S.; resources, G.L.; data curation, C.S.; writing—original draft preparation, Y.D. and G.L.; writing—review and editing, G.L.; visualization, C.S.; supervision, G.L.; project administration, G.L.; funding acquisition, G.L. All authors have read and agreed to the published version of the manuscript.

Funding

This research was funded by the National Natural Science Foundation of China, grant No. 42175002, No. 91937301, No. 42075013.

Data Availability Statement

2A.DPR V06 dataset is publicly available. The dataset can be found here: https://storm.pps.eosdis.nasa.gov/storm/ (accessed on 5 February 2022).

Acknowledgments

The authors sincerely thank the reviewers for their constructive comments and editorial suggestions, which have greatly contributed to the quality of the paper.

Conflicts of Interest

The authors declare no conflict of interest.

References

  1. Robert, A., Jr. Houze Cloud Clusters and Large-Scale Vertical Motions in the Tropics. J. Meteorol. Soc. Jpn. Ser. II 1982, 60, 396–410. [Google Scholar] [CrossRef]
  2. Houze, R.A., Jr. Mesoscale Convective Systems. Rev. Geophys. 2004, 42, RG4003. [Google Scholar] [CrossRef]
  3. Cifelli, R.; Rutledge, S.A. Vertical Motion, Diabatic Heating, and Rainfall Characteristics in North Australia Convective Systems. Q. J. R. Meteorol. Soc. 1998, 124, 1133–1162. [Google Scholar] [CrossRef]
  4. Hobbs, P.V. Research on Clouds and Precipitation: Past, Present, and Future, Part I. Bull. Am. Meteorol. Soc. 1989, 70, 282–285. [Google Scholar] [CrossRef]
  5. Zipser, E.J.; Lutz, K.R. The Vertical Profile of Radar Reflectivity of Convective Cells: A Strong Indicator of Storm Intensity and Lightning Probability? Mon. Weather. Rev. 1994, 122, 1751–1759. [Google Scholar] [CrossRef]
  6. Pruppacher, H.R.; Klett, J.D. Microstructure of Atmospheric Clouds and Precipitation. In Microphysics of Clouds and Precipitation; Springer: Dordrecht, The Netherlands, 2010; pp. 10–73. ISBN 978-0-306-48100-0. [Google Scholar]
  7. Chang, W.-Y.; Lee, W.-C.; Liou, Y.-C. The Kinematic and Microphysical Characteristics and Associated Precipitation Efficiency of Subtropical Convection during SoWMEX/TiMREX. Mon. Weather. Rev. 2015, 143, 317–340. [Google Scholar] [CrossRef]
  8. Wu, G.; Liu, Y.; Zhang, Q.; Duan, A.; Wang, T.; Wan, R.; Liu, X.; Li, W.; Wang, Z.; Liang, X. The Influence of Mechanical and Thermal Forcing by the Tibetan Plateau on Asian Climate. J. Hydrometeorol. 2007, 8, 770–789. [Google Scholar] [CrossRef]
  9. Boos, W.R.; Kuang, Z. Dominant Control of the South Asian Monsoon by Orographic Insulation versus Plateau Heating. Nature 2010, 463, 218–222. [Google Scholar] [CrossRef]
  10. Zhang, A.; Fu, Y.; Chen, Y.; Liu, G.; Zhang, X. Impact of the Surface Wind Flow on Precipitation Characteristics over the Southern Himalayas: GPM Observations. Atmos. Res. 2018, 202, 10–22. [Google Scholar] [CrossRef]
  11. Wen, Y.; Kirstetter, P.; Hong, Y.; Gourley, J.J.; Cao, Q.; Zhang, J.; Flamig, Z.; Xue, X. Evaluation of a Method to Enhance Real-Time, Ground Radar–Based Rainfall Estimates Using Climatological Profiles of Reflectivity from Space. J. Hydrometeorol. 2016, 17, 761–775. [Google Scholar] [CrossRef]
  12. Hou, A.Y.; Kakar, R.K.; Neeck, S.; Azarbarzin, A.A.; Kummerow, C.D.; Kojima, M.; Oki, R.; Nakamura, K.; Iguchi, T. The Global Precipitation Measurement Mission. Bull. Am. Meteorol. Soc. 2014, 95, 701–722. [Google Scholar] [CrossRef]
  13. Mugnai, A.; Di Michele, S.; Smith, E.; Baordo, F.; Bauer, P.; Bizzarri, B.; Joe, P.; Kidd, C.; Marzano, F.; Tassa, A.; et al. Snowfall Measurements by Proposed European GPM Mission. In Advances in Global Change Research; Springer: Dordrecht, The Netherlands, 2007; Volume 28, pp. 655–674. ISBN 978-1-4020-5834-9. [Google Scholar]
  14. Kulie, M.; Bennartz, R. Utilizing Spaceborne Radars to Retrieve Dry Snowfall. J. Appl. Meteorol. Climatol. 2009, 48, 2564–2580. [Google Scholar] [CrossRef]
  15. Fu, Y. Satellite-borne active and passive instruments for remote sensing of heavy rain in China:A review. Torrential Rain Disasters 2019, 38, 554–563. (In Chinese) [Google Scholar] [CrossRef]
  16. Liao, L.; Meneghini, R. Physical Evaluation of GPM DPR Single- and Dual-Wavelength Algorithms. J. Atmos. Ocean. Technol. 2019, 36, 883–902. [Google Scholar] [CrossRef] [PubMed]
  17. Jin, X.; Shao, H.; Zhang, C.; Yan, Y. The Applicability Evaluation of Three Satellite Products in Tianshan Mountains. J. Nat. Resour. 2016, 31, 2074–2085. (In Chinese) [Google Scholar] [CrossRef]
  18. Zhang, A. Structural Features of Precipitating Clouds observed by Geostationary Satellite and Dual-frequency Radar. Ph.D. Thesis, University of Science and Technology of China, Anhui, China, 2019. [Google Scholar]
  19. Lasser, M.O.S.; Foelsche, U. Evaluation of GPM-DPR Precipitation Estimates with WegenerNet Gauge Data. Atmos. Meas. Tech. 2019, 12, 5055–5070. [Google Scholar] [CrossRef]
  20. Sun, Y.; Dong, X.; Cui, W.; Zhou, Z.; Fu, Z.; Zhou, L.; Deng, Y.; Cui, C. Vertical Structures of Typical Meiyu Precipitation Events Retrieved From GPM-DPR. J. Geophys. Res. Atmos. 2020, 125, e2019JD031466. [Google Scholar] [CrossRef]
  21. Li, J.; Zheng, J.; Liu, Y.; Cheng, Z.; He, J.; Ren, T.; Chen, S. A Study on Vertical Structure and Macro- to Micro-Characteristics and Differences of Precipitation in Sichuan Basin and the Surrounding Areas. Acta Meteorol. Sin. 2022, 80, 205–223. (In Chinese) [Google Scholar] [CrossRef]
  22. Radhakrishna, B.; Saikranthi, K.; Rao, T.N. Regional Differences in Raindrop Size Distribution within Indian Subcontinent and Adjoining Seas as Inferred from Global Precipitation Measurement Dual-Frequency Precipitation Radar. J. Meteorol. Soc. Jpn. Ser. II 2020, 98, 573–584. [Google Scholar] [CrossRef]
  23. Verma, A.K.; Jha, K.K. Rain Drop Size Distribution Model for Indian Climate. Indian J. Radio Space Phys. 1996, 25, 15–21. [Google Scholar]
  24. Sasi Kumar, V.; Sampath, S.; Vinayak, P.V.S.S.K.; Harikumar, R. Rainfall Intensity Characteristics at Coastal and High Altitude Stations in Kerala. J. Earth Syst. Sci. 2007, 116, 451–463. [Google Scholar] [CrossRef] [Green Version]
  25. Seela, B.K.; Janapati, J.; Lin, P.-L.; Reddy, K.K.; Shirooka, R.; Wang, P.K. A Comparison Study of Summer Season Raindrop Size Distribution Between Palau and Taiwan, Two Islands in Western Pacific. J. Geophys. Res. Atmos. 2017, 122, 11787–11805. [Google Scholar] [CrossRef]
  26. Harikumar, R. Orographic Effect on Tropical Rain Physics in the Asian Monsoon Region. Atmos. Sci. Lett. 2016, 17, 556–563. [Google Scholar] [CrossRef]
  27. Zwiebel, J.; Van Baelen, J.; Anquetin, S.; Pointin, Y.; Boudevillain, B. Impacts of Orography and Rain Intensity on Rainfall Structure. The Case of the HyMeX IOP7a Event. Q. J. R. Meteorol. Soc. 2016, 142, 310–319. [Google Scholar] [CrossRef]
  28. Awaka, J.; Iguchi, T.; Okamoto, K. Early Results on Rain Type Classification by the Tropical Rainfall Measuring Mission (TRMM) Precipitation Radar. In Proceedings of the 8th URSI Commission F Triennial Open Symposium on Wave Propagation and Remote Sensing, Aveiro, Portugal, 22–25 September 1998; pp. 143–146. [Google Scholar]
  29. Awaka, J.; Iguchi, T.; Okamoto, K.; Trmm, P.R. Standard Algorithm 2A23 and Its Performance on Bright Band Detection. J. Meteorol. Soc. Jpn. Ser. II 2009, 87A, 31–52. [Google Scholar] [CrossRef]
  30. Le, M.; Chandrasekar, V. Precipitation Type Classification Method for Dual-Frequency Precipitation Radar (DPR) Onboard the GPM. IEEE Trans. Geosci. Remote Sens. 2013, 51, 1784–1790. [Google Scholar] [CrossRef]
  31. Le, M.; Chandrasekar, V. Hydrometeor Profile Characterization Method for Dual-Frequency Precipitation Radar Onboard the GPM. IEEE Trans. Geosci. Remote Sens. 2013, 51, 3648–3658. [Google Scholar] [CrossRef]
  32. Fan, J.; Zhang, Z.; Li, L. Mountain Demarcation and Mountainous Area Divisions of Sichuan Province. Geogr. Res. 2015, 34, 65–73. (In Chinese) [Google Scholar] [CrossRef]
  33. Gao, X. The Subjective and Objective Classification of Geomorphologic Forms. J. Mt. Sci. 2004, 22, 261–266. (In Chinese) [Google Scholar] [CrossRef]
  34. Zhong, J.; Lu, T. Optimal Statistical Unit for Relief Amplitude in Southwestern China. Bull. Soil Water Conserv. 2018, 38, 175–181,186. (In Chinese) [Google Scholar] [CrossRef]
  35. Yang, B. The Research of Mountains Ontology and Digital Classification in the framework of “Digital Mountains”—A Case Study in Sichuan Province. Ph.D. Thesis, Chengdu University of Technology, Sichuan, China, 2009. [Google Scholar]
  36. Yuter, S.E.; Houze, R.A. Three-Dimensional Kinematic and Microphysical Evolution of Florida Cumulonimbus. Part I: Spatial Distribution of Updrafts, Downdrafts, and Precipitation. Mon. Weather. Rev. 1995, 123, 1921–1940. [Google Scholar] [CrossRef]
  37. Zhang, A.; Chen, Y.; Zhang, X.; Zhang, Q.; Fu, Y. Structure of Cyclonic Precipitation in the Northern Pacific Storm Track Measured by GPM DPR. J. Hydrometeorol. 2020, 21, 227–240. [Google Scholar] [CrossRef]
  38. Houze, R.A., Jr.; Wilton, D.C.; Smull, B.F. Monsoon Convection in the Himalayan Region as Seen by the TRMM Precipitation Radar. Q. J. R. Meteorol. Soc. 2007, 133, 1389–1411. [Google Scholar] [CrossRef]
  39. Chen, B.; Gao, W.; Zhou, X. Synoptic Characteristic Analysis of Short-time Hard Rain in Southwest Sichuan Basin. Plateau Mt. Meteorol. Res. 2016, 36, 14–20. (In Chinese) [Google Scholar]
  40. Cao, Q.; Hong, Y.; Gourley, J.J.; Qi, Y.; Zhang, J.; Wen, Y.; Kirstetter, P.-E. Statistical and Physical Analysis of the Vertical Structure of Precipitation in the Mountainous West Region of the United States Using 11+ Years of Spaceborne Observations from TRMM Precipitation Radar. J. Appl. Meteorol. Climatol. 2013, 52, 408–424. [Google Scholar] [CrossRef]
  41. Sánchez-Diezma, R.; Zawadzki, I.; Sempere-Torres, D. Identification of the Bright Band through the Analysis of Volumetric Radar Data. J. Geophys. Res. Atmos. 2000, 105, 2225–2236. [Google Scholar] [CrossRef]
  42. Fu, Y.; Feng, J.; Zhu, H.; Li, R.; Liu, D. Structures of a thermal convective precipitation system happened in controlling of the western subtropical pacific high. Acta Meteorol. Sin. 2005, 63, 750–761. (In Chinese) [Google Scholar] [CrossRef]
  43. Fu, Y.; Cao, A.; Li, T.; Feng, S.; Zheng, Y.; Liu, Y.; Zhang, A. Climatic Characteristics of the Storm Top Altitude for the Convective and Stratiform Precipitation in Summer Asia Based on Measurements of the TRMM Precipitation Radar. Acta Meteorol. Sin. 2012, 70, 436–451. (In Chinese) [Google Scholar] [CrossRef]
  44. Fu, Y.; Feng, J.; Zhu, H.; Li, R.; Liu, D. Precipitation Structures of a Thermal Convective System Happened in the Central Western Subtropical Pacific Anticyclone. J. Meteorol. Res. 2006, 20, 232–243. [Google Scholar]
  45. Yan, Y.-F.; Wang, X.-C.; Liu, Y.-M. Cloud Vertical Structures Associated with Precipitation Magnitudes over the Tibetan Plateau and Its Neighboring Regions. Atmos. Ocean. Sci. Lett. 2018, 11, 44–53. [Google Scholar] [CrossRef]
  46. Wilson, A.M.; Barros, A.P. An Investigation of Warm Rainfall Microphysics in the Southern Appalachians: Orographic Enhancement via Low-Level Seeder–Feeder Interactions. J. Atmos. Sci. 2014, 71, 1783–1805. [Google Scholar] [CrossRef]
Figure 1. Administrative regional division of the People’s Republic of China (a), and geographical division of Sichuan Basin and its surrounding areas; (b) The green, yellow and brown areas represent the plains, mountains and high mountains respectively.
Remotesensing 14 04222 g001
Figure 2. The spatial distribution of heavy stratiform (a) and convective (b) rainy pixels. The heavy precipitation occurs over plains (green dots), mountains (yellow dots) and high mountains (brown dots).
Remotesensing 14 04222 g002
Figure 3. Normalized contoured frequency by altitude diagrams (NCFAD) of reflectivity factor of two types of heavy precipitation over plains (a,d), mountains (b,e), and high mountains (c,f). The color areas and black solid lines indicate occurrence frequency and maximum frequency profile of reflectivity factor, respectively. The black and blue dash lines represent STA and FzH, respectively.
Remotesensing 14 04222 g003
Figure 4. Scatter plots of elevation and FzH of two types of heavy precipitation over (a,e) three areas, (b,f) plains, (c,g) mountains, and (d,h) high mountains. r represents Pearson correlation coefficient, p represents significance level, y and red solid lines are the regression equation and N represents sample size.
Remotesensing 14 04222 g004
Figure 5. The vertical profile of Ze with various near-surface RR. (ae) represent SP (top panels), (fj) represent CP (bottom panels). The green, black and red solid lines represent plains, mountains and high mountains, respectively. The square and round dots represent STA and FzH, respectively.
Remotesensing 14 04222 g005
Figure 6. NCFAD of Dm of two types of heavy precipitation over plains (a,d), mountains (b,e), and high mountains(c,f). The color areas indicate occurrence frequency of Dm. The black and blue dash lines represent STA and FzH, respectively.
Remotesensing 14 04222 g006
Figure 7. The vertical profile of the mean Dm with various near-surface RR. (ae) represent CP, (fj) represent SP. The green, black and red solid lines represent plains, mountains and high mountains, respectively. The square and round dots represent STA and FzH, respectively.
Remotesensing 14 04222 g007
Figure 8. Normalized contoured frequency by altitude diagrams (NCFAD) of dBNw of two types of heavy precipitation over plains (a,d), mountains (b,e), and high mountains (c,f). The color areas indicate occurrence frequency of dBNw, the black and blue dash lines represent STA and FzH, respectively.
Remotesensing 14 04222 g008
Figure 9. The vertical profile of dBNw with various near-surface RR. (ae) represent SP, (fj) represent CP. The green, black and red solid lines represent plains, mountains and high mountains, respectively. The square and round dots represent STA and FzH, respectively.
Remotesensing 14 04222 g009
Figure 10. The horizontal Distribution of storm top altitude of two types of heavy precipitation over plains (a,d), mountains (b,e), and high mountains (c,f).
Remotesensing 14 04222 g010
Figure 11. Probability distribution functions (PDFs) of storm top altitude with various near-surface RR of SP (ae) and CP (fj) over different topographic. The green, black and red solid lines represent plains, mountains and high mountains, respectively.
Remotesensing 14 04222 g011
Figure 12. Scatter plots of storm top altitude and Dm of two types of heavy precipitation over plains (a,d), mountains (b,e), and high mountains (c,f). r represents Pearson correlation coefficient, p represents significance level, y and red solid lines are the regression equation and N represents sample size.
Remotesensing 14 04222 g012
Figure 13. The horizontal Distribution of water vapor of two types of heavy precipitation over plains (a,d), mountains (b,e), and high mountains (c,f).
Remotesensing 14 04222 g013
Figure 14. Scatter plots of water vapor and storm top altitude of two types of heavy precipitation over plains (a,d), mountains (b,e), and high mountains (c,f). r represents Pearson correlation coefficient, p represents significance level, y and red solid lines are the regression equation and N represents sample size.
Remotesensing 14 04222 g014
Figure 15. Scatter distribution of near-surface Dm-dBNw of heavy CP over plains (a), mountains (b), and high mountains (c). The color indicates the scatter density.
Remotesensing 14 04222 g015
Figure 16. Probability distribution functions (PDFs) of total water vapor content at 4.5–6.5 km of heavy SP of different topographic. The green, black and red solid lines represent plains, mountains and high mountains, respectively.
Remotesensing 14 04222 g016
Table 1. Number of convective and stratiform rainy pixels of different types of terrain in Sichuan Basin and its surrounding detected by GPM DPR from May to September of 2014–2021.
RR (mm/h)PlainMountainHigh Mountain
0.5 ≤ RR < 22186 (32,530)4616 (72,504)6646 (65,973)
2 ≤ RR < 42031 (10,851)4146 (25,204)3885 (14,688)
4 ≤ RR < 81985 (5301)4263 (12,772)3481 (5545)
8 ≤ RR < 201685 (1674)3530 (3813)2126 (1121)
RR ≥ 20981 (247)1579 (483)495 (85)
Numbers in brackets denote SP, and numbers outside brackets denote CP.
Table 2. Statistics on the proportion of shallow convective (stratiform), moderate convective (stratiform) and deep convective (stratiform) over different types of terrain in the Sichuan Basin and its surrounding detected by GPM DPR from May to September of 2014–2021.
RR (mm/h)0.5 ≤ RR < 22 ≤ RR < 44 ≤ RR < 88 ≤ RR < 20RR ≥ 20
Shallow convective (stratiform) of plains15.2%
(15.0%)
5.8%
(5.4%)
3.7%
(2.7%)
1.2%
(1.5%)
0.1%
(0.0%)
Shallow convective (stratiform) of mountains17.4%
(15.3%)
5.1%
(4.0%)
2.4%
(1.9%)
0.8%
(1.5%)
0.2%
(0.6%)
Shallow convective (stratiform) of high mountains7.9%
(4.6%)
0.5%
(0.5%)
0.1%
(0.2%)
0.0%
(0.7%)
0.0%
(0.0%)
Moderate convective (stratiform) of plains68.6%
(68.0%)
71.3%
(61.2%)
66.3%
(50.2%)
52.0%
(46.6%)
30.3%
(35.6%)
Moderate convective (stratiform) of mountains70.3%
(71.3%)
73.9%
(66.3%)
71.5%
(55.1%)
65.2%
(53.4%)
45.0%
(49.3%)
Moderate convective (stratiform) of high mountains82.7%
(74.9%)
71.8%
(56.4%)
62.5%
(44.0%)
53.4%
(43.0%)
42.8%
(34.1%)
Deep convective (stratiform) of plains16.2%
(17.0%)
22.9%
(33.4%)
30.0%
(47.1%)
46.8%
(51.9%)
69.6%
(64.4%)
Deep convective (stratiform) of mountains12.3%
(13.4%)
21.0%
(29.7%)
26.1%
(43.0%)
34.0%
(45.1%)
54.8%
(50.1%)
Deep convective (stratiform) of high mountains9.4%
(20.5%)
27.7%
(43.1%)
37.4%
(55.8%)
46.5%
(56.3%)
57.2%
(65.9%)
Numbers in brackets denote SP, and numbers outside brackets denote CP.
Publisher’s Note: MDPI stays neutral with regard to jurisdictional claims in published maps and institutional affiliations.

