Article

First Implementation of a Normalized Hotspot Index on Himawari-8 and GOES-R Data for the Active Volcanoes Monitoring: Results and Future Developments

1
National Research Council, Institute of Methodologies for Environmental Analysis, C. da S. Loja, 85050 Tito Scalo, Italy
2
School of Engineering, University of Basilicata, Via dell’Ateneo Lucano, 10, 85100 Potenza, Italy
*
Author to whom correspondence should be addressed.
Remote Sens. 2022, 14(21), 5481; https://doi.org/10.3390/rs14215481
Submission received: 19 September 2022 / Revised: 20 October 2022 / Accepted: 27 October 2022 / Published: 31 October 2022
(This article belongs to the Special Issue Geographic Data Analysis and Modeling in Remote Sensing)

Abstract

:
The Advanced Himawari Imager (AHI) and Advanced Baseline Imager (ABI), respectively aboard Himawari-8 and GOES-R geostationary satellites, are two important instruments for the near-real time monitoring of active volcanoes in the Eastern Asia/Western Pacific region and the Pacific Ring of Fire. In this work, we use for the first time AHI and ABI data, at 10 min temporal resolution, to assess the behavior of a Normalized Hotspot Index (NHI) in presence of active lava flows/lakes, at Krakatau (Indonesia), Ambrym (Vanuatu) and Kilauea (HI, USA) volcanoes. Results show that the index, which is used operationally to map hot targets through the Multispectral Instrument (MSI) and the Operational Land Imager (OLI), is sensitive to high-temperature features even when short-wave infrared (SWIR) data at 2 km spatial resolution are analyzed. On the other hand, thresholds should be tailored to those data to better discriminate thermal anomalies from the background in daylight conditions. In this context, the multi-temporal analysis of NHI may enable an efficient identification of high-temperature targets without using fixed thresholds. This approach could be exported to SWIR data from the Flexible Combined Imager (FCI) instrument aboard the next Meteosat Third Generation (MTG) satellites.

1. Introduction

Several studies have shown the relevance of geostationary satellite observations in detecting, monitoring and characterizing volcanic thermal features, thanks to the high frequency of observation (10–30 min), and despite the low spatial resolution (2–4 km) (e.g., [1,2,3,4,5,6]).
GOES (Geostationary Operational Environmental Satellite) Imager data were used to investigate active volcanoes such as Kilauea (HI, USA), through time series analyses of the MIR (medium infrared; 3–5 µm) radiance (e.g., [7]). SEVIRI (Spinning Enhanced Visible and Infrared Imager), aboard MSG (Meteosat Second Generation) satellites, demonstrated a high potential in promptly detecting eruption onsets, and in monitoring short-lived events at the European/African volcanoes (e.g., [8,9,10,11,12,13]). MTSAT-1R/2 (Multifunctional Transport Satellites) data contributed to the monitoring of active volcanoes located in Southern Asia and Western Pacific region (e.g., [14,15,16]).
Monitoring capabilities of active volcanoes have been further improved with the launch of Himawari-8 and GOES-R satellites.
Himawari-8 carries the AHI (Advanced Himawari Imager) instrument, which shows better features, in terms of spatial, spectral, and temporal resolution, than prior images of the MTSAT series (e.g., [17]).
GOES-R satellites, thanks to the ABI (Advanced Baseline Imager) instrument, offer the opportunity of monitoring the volcanically active regions of the Pacific Ring of Fire (i.e., western regions of North and South America, East Asia, Indonesia, Micronesia, and New Zealand) with increased performance [18].
Among the studies using Himawari-8 AHI data, time series analyses of the maximum SWIR (short-wave infrared) radiance, and the pixel-integrated temperatures in the MIR and TIR (thermal infrared) bands, corrected for atmospheric and emissivity effects, were performed to investigate the different phases of the Mt. Raung (Indonesia) 2015 eruption [19]. A correction for pseudo-thermal anomalies was tested during a recent Nishinoshima (Japan) eruption [20], while an empirical method was used to estimate the lava-effusion rate [21]. Other authors investigated thermal anomalies at the Ambrym (Vanuatu) volcano, before and during the 15 December 2018 fissure eruption, by means of a normalized index analyzing MIR and TIR brightness temperatures. The study revealed the start of the lava effusion, and the drop of the lava lake level inside the craters [22].
An overview of the potential of GOES-R ABI observations in supporting the monitoring of active volcanoes, also regarding the identification and characterization of different phases of thermal activity, can be found in previous papers (e.g., [18,23,24]).
In this work, we analyze for the first time Himawari-8 AHI and GOES-R ABI data, at 10 min temporal resolution, by means of a Normalized Hotspot Index (NHI) defined in [25]. The NHI algorithm uses this index jointly with another one, analyzing SWIR (short-wave infrared) and NIR (near-infrared) radiance, to map high-temperature features in daylight conditions, through Sentinel-2 (S2) MSI (Multispectral Instruments) and Landsat-8 OLI (Operational Land Imager) data, at mid-high spatial resolution (i.e., tens of meters). The NHI tool [26], by implementing the algorithm, allows users to investigate active volcanoes at a global scale under the Google Earth Engine (GEE) platform [27].
The aim of this study is to assess the NHI behavior, in the presence of active lava flows/lakes, when satellite data at coarse spatial resolution are used.
Some recent eruptions of the Ambrym (Vanuatu), Krakatau (Indonesia), and Kilauea (HI, USA) volcanoes (Figure 1) are investigated for this purpose.
Results are shown and discussed in the next sections, through comparison with some independent ground and satellite-based observations.

2. Data

Himawari-8/9 are geostationary weather satellites operated by the Japan Meteorological Agency (JMA). Himawari-8 was launched on 7 October 2014 and positioned at 140.7 degrees East. Himawari-9 was launched two years later and placed in a stand-by orbit. The AHI is the primary instrument aboard the Himawari-8/9 platforms. This sensor provides full disk 10-bit data in 16 spectral bands, from visible (VIS) to thermal infrared (TIR), with a spatial resolution of 0.5–2 km (see Table 1), and a temporal resolution of 10 min (up to 2.5 min over Japan, and some selected targets) [17].
The GOES-R Series is a four-satellite program (GOES-R/S/T/U), from the National Aeronautics and Space Administration (NASA) and National Oceanic and Atmospheric Administration (NOAA) [28]. GOES-16 satellite was launched in November 2016 and positioned in a geostationary orbit over 75.2°W, while GOES-17 (operational since February 2019) was positioned at the longitude of 137.2°W [29,30].
The ABI is the main instrument of the GOES-R satellites; it delivers data in 16 spectral bands, including two visible channels, four near-infrared channels, and ten infrared channels at the nominal spatial resolution of 2 km (see Table 2). Among those bands, the MIR channel, thanks to a high saturation temperature (around 400 K), minimizes the saturation effects in comparison with the previous GOES imagers [31]. Moreover, the instrument has multiple scan modes; the default scan mode provides a full disk imagery every 10 min (e.g., [28]).
Due to the aforementioned features, both AHI and ABI enable the near-real time monitoring of rapidly evolving volcanic phenomena (e.g., [32,33]). Indeed, data from these sensors may be used to identify, monitor and quantify ash and SO2 clouds (e.g., [18,34]). In addition, they offer the opportunity to promptly detect changes in thermal volcanic activity by satellite, as further assessed in this work.

3. Methods

3.1. NHI Indices

The NHI indices are defined as:
N H I S W I R = L 2.2   L 1.6   L 2.2   + L 1.6    
N H I S W N I R = L 1.6   L 0.8   L 1.6   + L 0.8    
where, L0.8, L1.6, and L2.2 are the TOA (Top-Of-Atmosphere) radiances [W/m2 sr µm] measured at 0.8 µm (NIR), 1.6 µm (SWIR1) and 2.2 µm (SWIR2) wavelengths.
As shown in [25], while positive values of the index in Equation (1) indicate the occurrence of a moderate thermal activity, those of the index in Equation (2) suggest the presence of more intense thermal anomalies, frequently saturating the SWIR2 channel of MSI and OLI [25,26]. By searching for positive values of the indices, the NHI algorithm is capable of performing an accurate mapping of high-temperature targets [25,26].
This detection scheme, although designed for S2-MSI and L8-OLI data at 20 m and 30 m spatial resolution, was tested with success also on Terra-ASTER (Advanced Spaceborne Thermal Emission and Reflection Radiometer) images acquired before the failure of the SWIR subsystem [35]. Moreover, it was applied to TM (Thematic Mapper) and ETM+ (Enhanced Thematic Mapper Plus) data of the prior Landsat series [26].
In a recent study, we used the NHI algorithm to investigate gas-flaring sources, having temperatures between 1600–2200 K (e.g., [36]), in both offshore and onshore conditions [37]. The study showed that both normalized indices described above (which may be in principle computed also from SWIR and NIR reflectance) are sensitive to gas flaring sources even when SLSTR (Sea and Land Surface Temperature Radiometer) data, at 500 m spatial resolution, are analyzed [37].
In this work, we assess for the first time the NHISWIR index behavior on AHI and ABI data, at 2 km spatial resolution, in both daylight and night-time conditions. Indeed, although the index was proposed for daytime data, it may be used also in night-time, as demonstrated in previous studies [35,38].

3.2. NHI Implementation on Himawari-8 AHI and GOES-R ABI Data

To investigate thermal anomalies at Ambrym and Krakatau volcanoes, we used the Himawari-8 AHI data provided by the Center for Environmental Remote Sensing (CEReS) of the Chiba University (Japan). After extracting two Regions of Interest (ROIs) from the full disk data, we converted data, acquired in bands 5 (1.6 µm) and 6 (2.2 µm), from reflectance to radiance using the coefficients reported in each file header [39]. We computed only the index in Equation (1), due to the different spatial resolution of SWIR and NIR bands (see Table 1). Additionally, we filtered out pixels showing low SWIR radiance values on night-time scenes, because ascribable to the instrumental noise.
The NHI implementation on GOES-R ABI data was performed by analyzing the Level 2 Cloud and Moisture Imagery Products (CMIP), at 2 km spatial resolution in all the bands, available under the Google Earth Engine Platform (e.g., [40,41]). In particular, we computed the NHISWIR index starting from the formulation used to convert from reflectance to radiance, and the irradiance values (for the SWIR1 and SWIR2 bands) reported in [42].

4. Results

4.1. Ambrym (Indonesia) 14–15 December 2018 Eruption

Ambrym (16°15′00″S, 168°07′00″E) is an active volcano, located in the Vanuatu archipelago, characterized by a large caldera (12 km in diameter) and two active craters, i.e., Marum and Benbow, which were the site of active lava lakes.
This highly degassing volcano had some major eruptions in 1820, 1894, 1913 and 1929; more recent eruptive events occurred in 1988, 2015 and 2018 [43].
The 14–15 December 2018 eruption took place at the summit caldera [22,44]. During the eruption, a lava flow, accompanied by lava fountaining, originated from the SE flank of the Marum crater [45,46,47]. Thermal anomaly at the craters progressively disappeared within 12 hours of the start of the eruption, suggesting the drop in the lava lake level [22], confirmed by the outputs of the NHI tool [48].
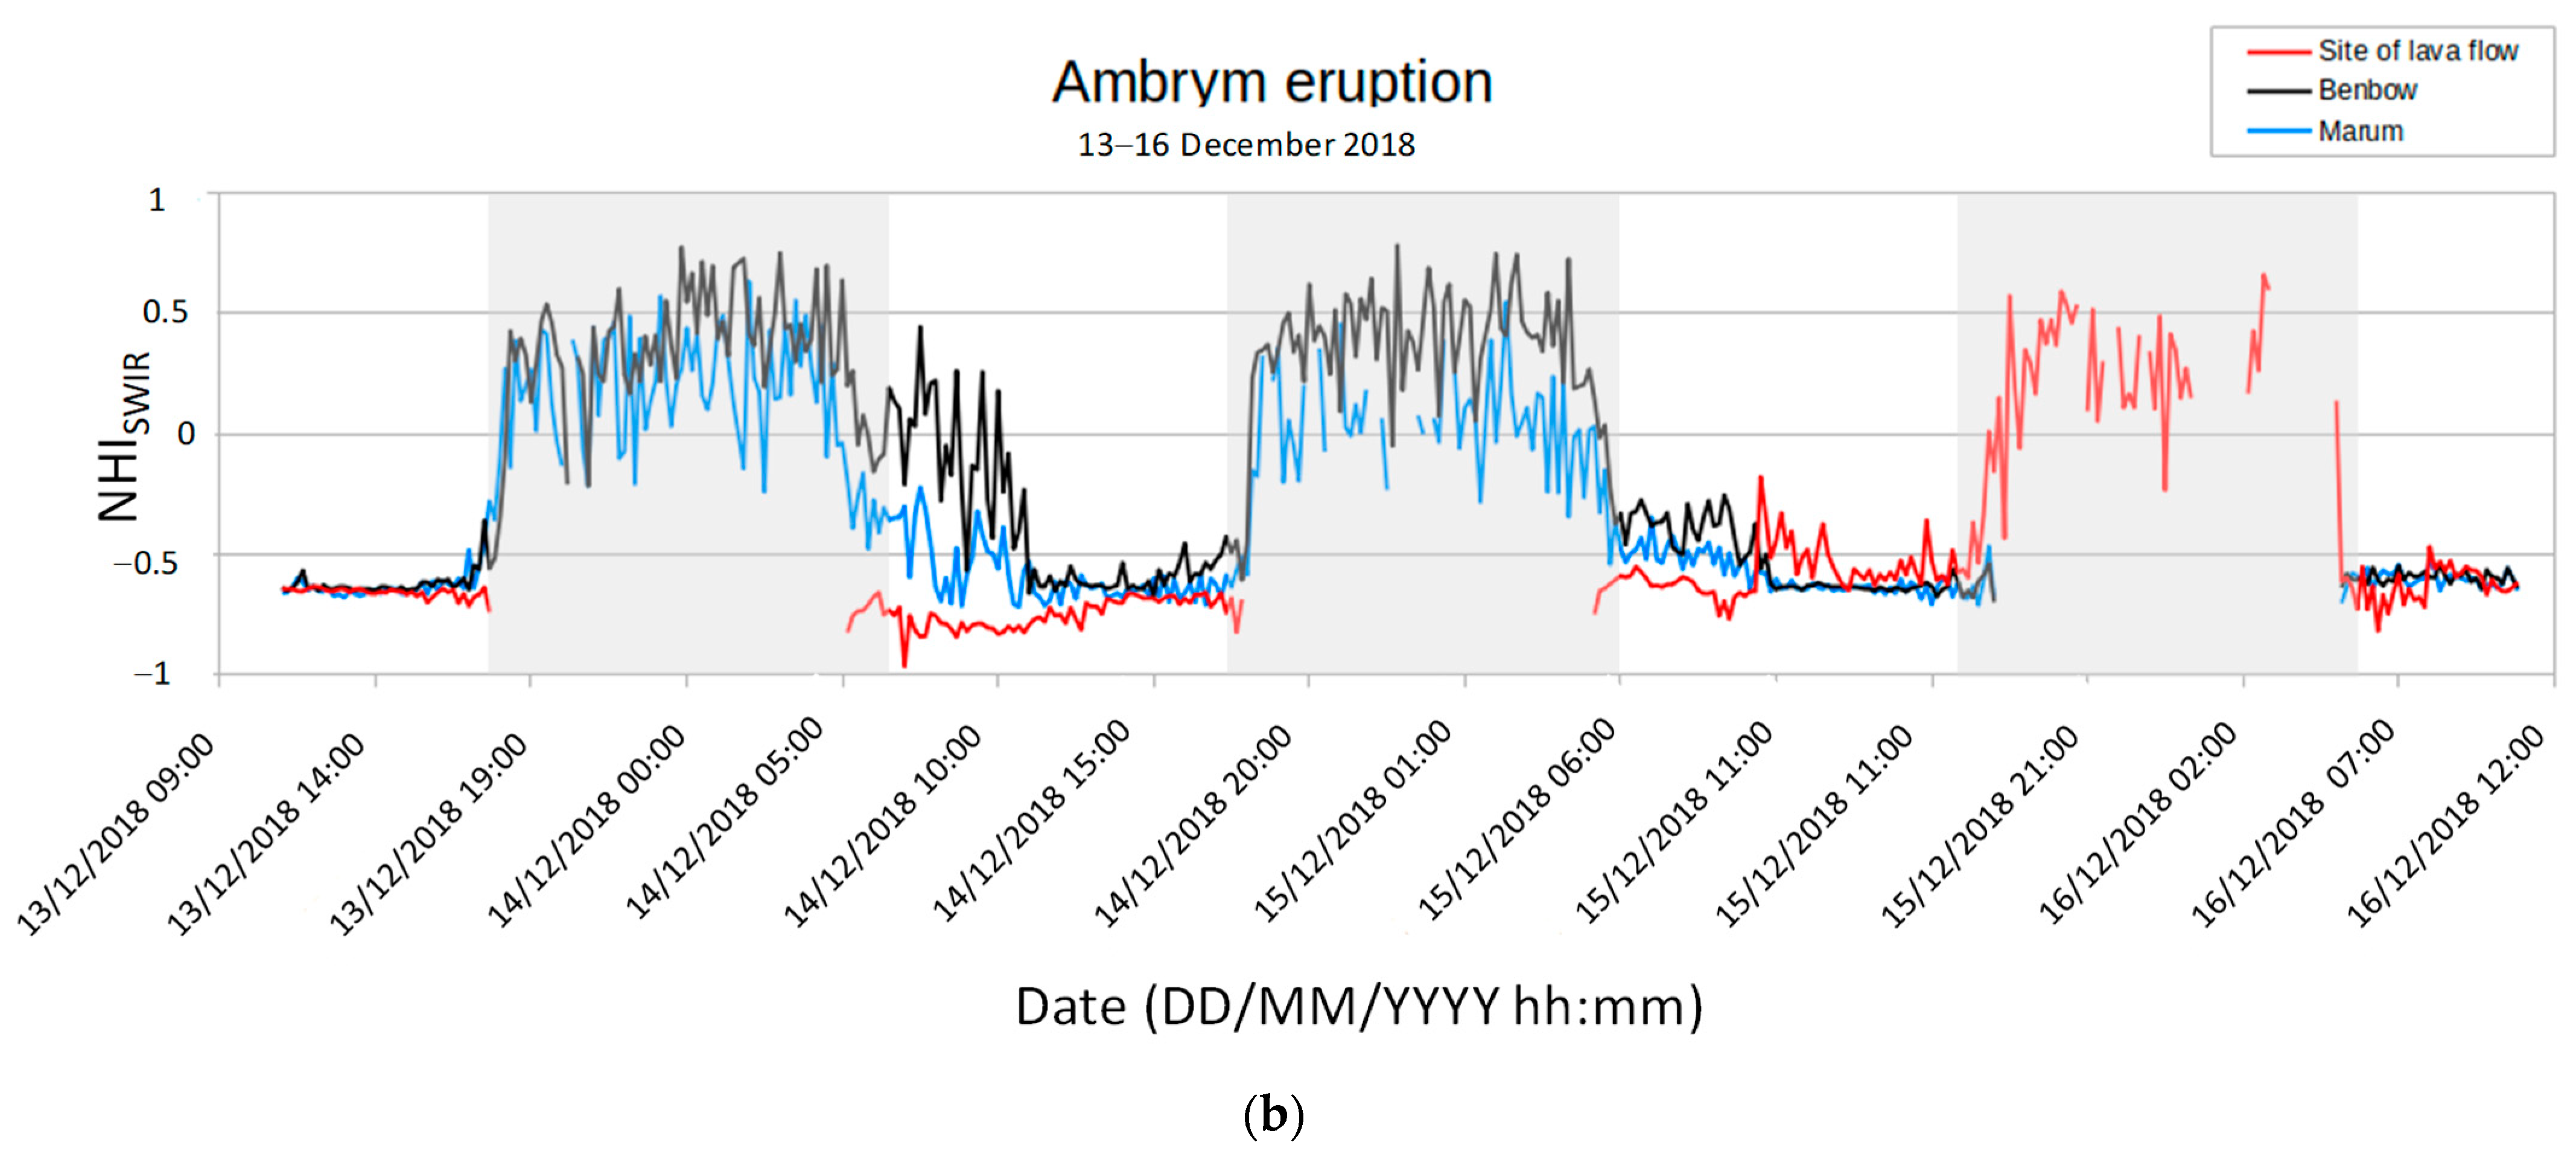
To investigate these features through Himawari-8 AHI data, we computed the mean value of the NHISWIR index, at 10 min time interval, over three different areas marked in Figure 2a, in both daytime and night-time conditions. Figure 2b displays the results of this analysis, showing that at the Benbow (area #1) and Marum (area #2) craters values of −0.5 < NHISWIR < 0.5 were mostly recorded (see blue and black curve). The index was however not always computed over the SE flank of the Marum crater, due to the low SWIR radiance values recorded in night-time before eruption, for the reasons mentioned in Section 3.2, and when clouds masked the emitted lava flows (see red curve).
In more detail, positive values of the index mostly characterized the night-time scenes, with a comparable magnitude at the craters. Those values of the index recorded before the eruption were associated with the active lava lakes (areas #1 and #2). Similar values of the index were also recorded, a few hours later the eruption start, over the SE flank of Marum crater (area #3), because of lava effusion. By contrast, the index was mostly negative in daytime, especially at the Marum crater (blue curve), regardless of cloud coverage. Negative values of the index (below −0.5) were retrieved also on SE flank of the Marum crater before the eruption start (see red curve). The latter, based on information inferred from Himawari-8 AHI data, took place on 14 December, in between 23:20–23:40 UTC (15 December at 10:20–10:40 LT) [22]. In this time interval, the NHISWIR index showed a sudden variation, analyzed in Figure 3.
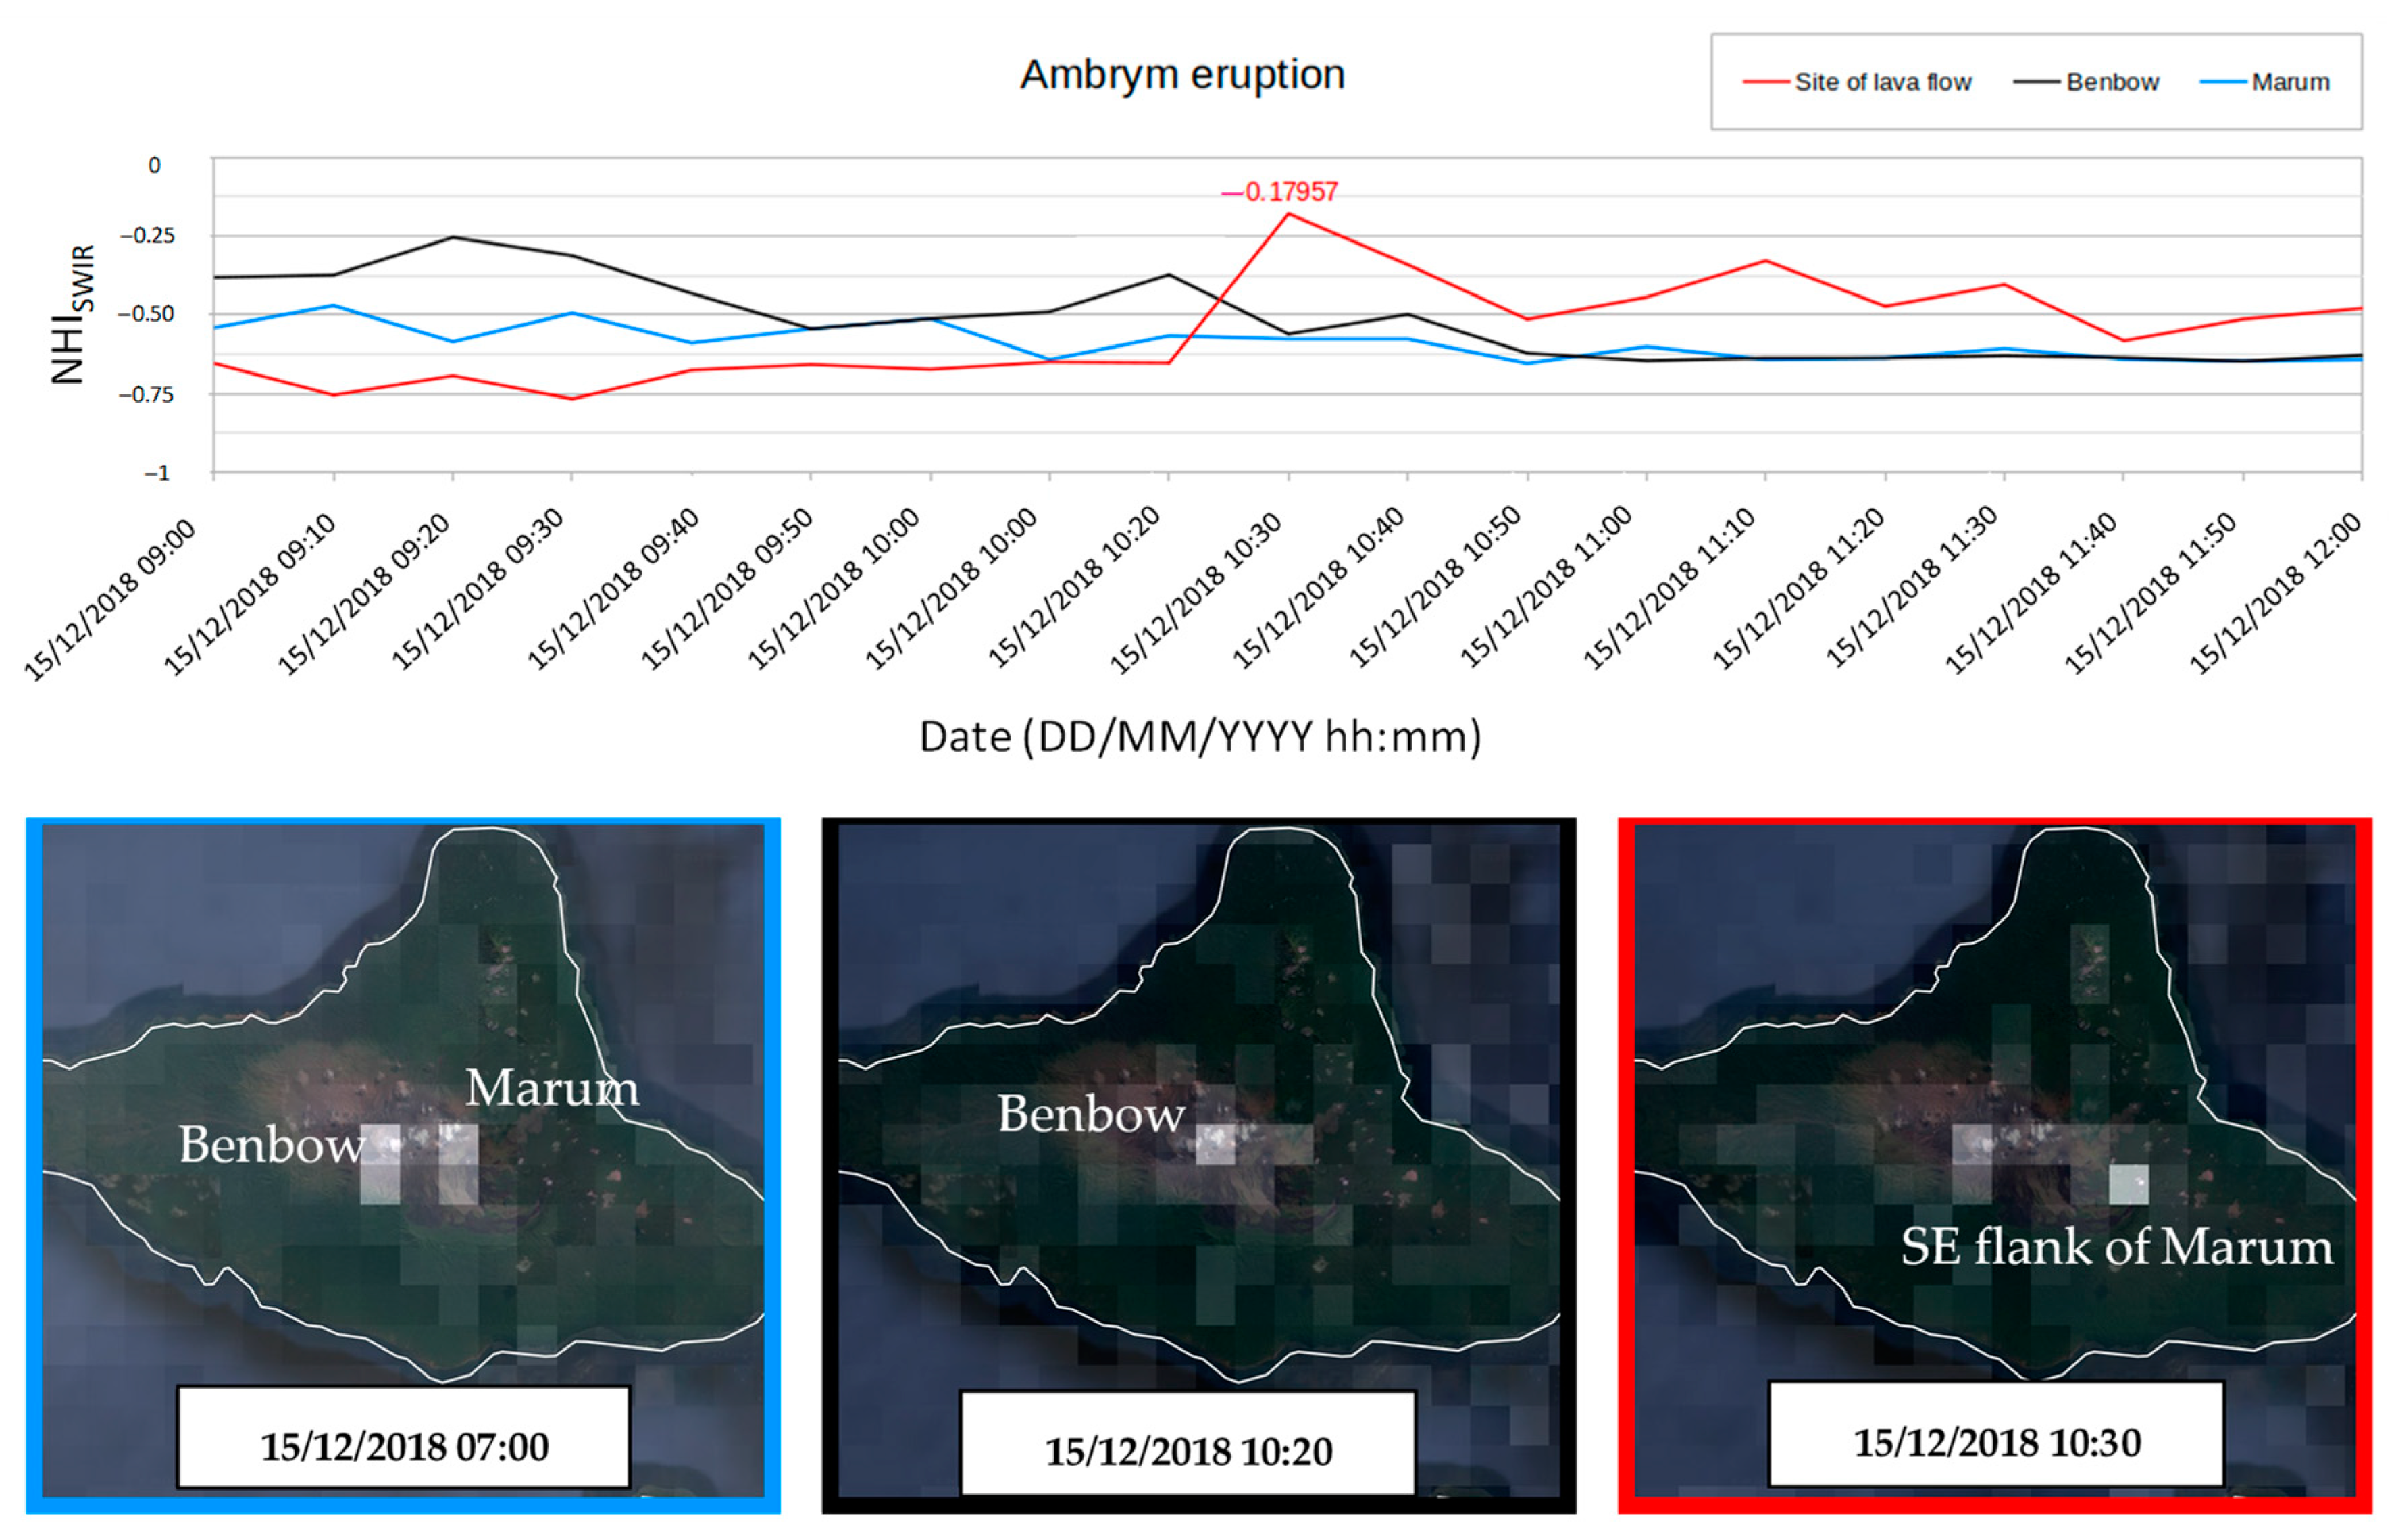
The figure shows that the NHISWIR index abruptly increased (up to values of about −0.18), over the SE flank of Marum crater, in between 10:20–10:30 LT (see red curve), marking the exact time of eruption onset (AHI data at 20 min time interval were analyzed in [22]). The bottom panels display the pixel associated with higher values of the used index on satellite scenes of 07:00 LT, 10:20 LT and 10:30 LT, overlapped on a static very-high resolution imagery of the Ambrym volcano available in GEE. It is worth noting that while at Marum crater a hot pixel was evident until 07:00 LT (blue panel) because of clouds, at Benbow crater the lava lakes were potentially detectable until 10:20 LT, when values of the index above −0.4 were recorded (black panel). Ten minutes later, when a thermal anomaly affected the SE flank of the Marum crater (red panel), the index decreased under values of −0.5, probably because of the drop in the lava lake level.
These results show that the NHISWIR index is sensitive to the high-temperature features also when daytime satellite data at coarse spatial resolution are used. This behavior of the index is further assessed in the following section, by investigating high-temperature features at Krakatau (which is not covered by GOES-R data such as Ambrym) and Kilauea volcanoes.

4.2. Krakatau (Indonesia) September 2018 Eruption

Krakatau (6°06′07.2″S, 105°25′22.8″E) is a volcanic complex, located in the Sunda Strait (Indonesia), in between Java and Sumatra (see Figure 1). The catastrophic Krakatau eruption of 1883 caused the caldera collapse, destroying most of the previous island. At least 36,000 peoples died because of the induced tsunami waves. The volcano emerged above sea level in 1927, showing frequent eruptions [49].
In more recent years, ash and lava flow emission occurred during the second half of February 2017; thermal activity resumed in late June 2018 [50]. Lava flows affected the S and SE flanks of the volcano, and were accompanied by a Strombolian activity, increasing throughout September 2018. In the following two months, lava effusion continued, and on 22 December 2018, a large explosion occurred [50]. Tsunami waves, generated by the flank collapse, destroyed most of the island, causing more than 400 fatalities. Eruption confirmed the dangerousness of the Krakatau volcano for the neighbors’ densely populated coastal regions of the Java and Sumatra islands (e.g., [51]).
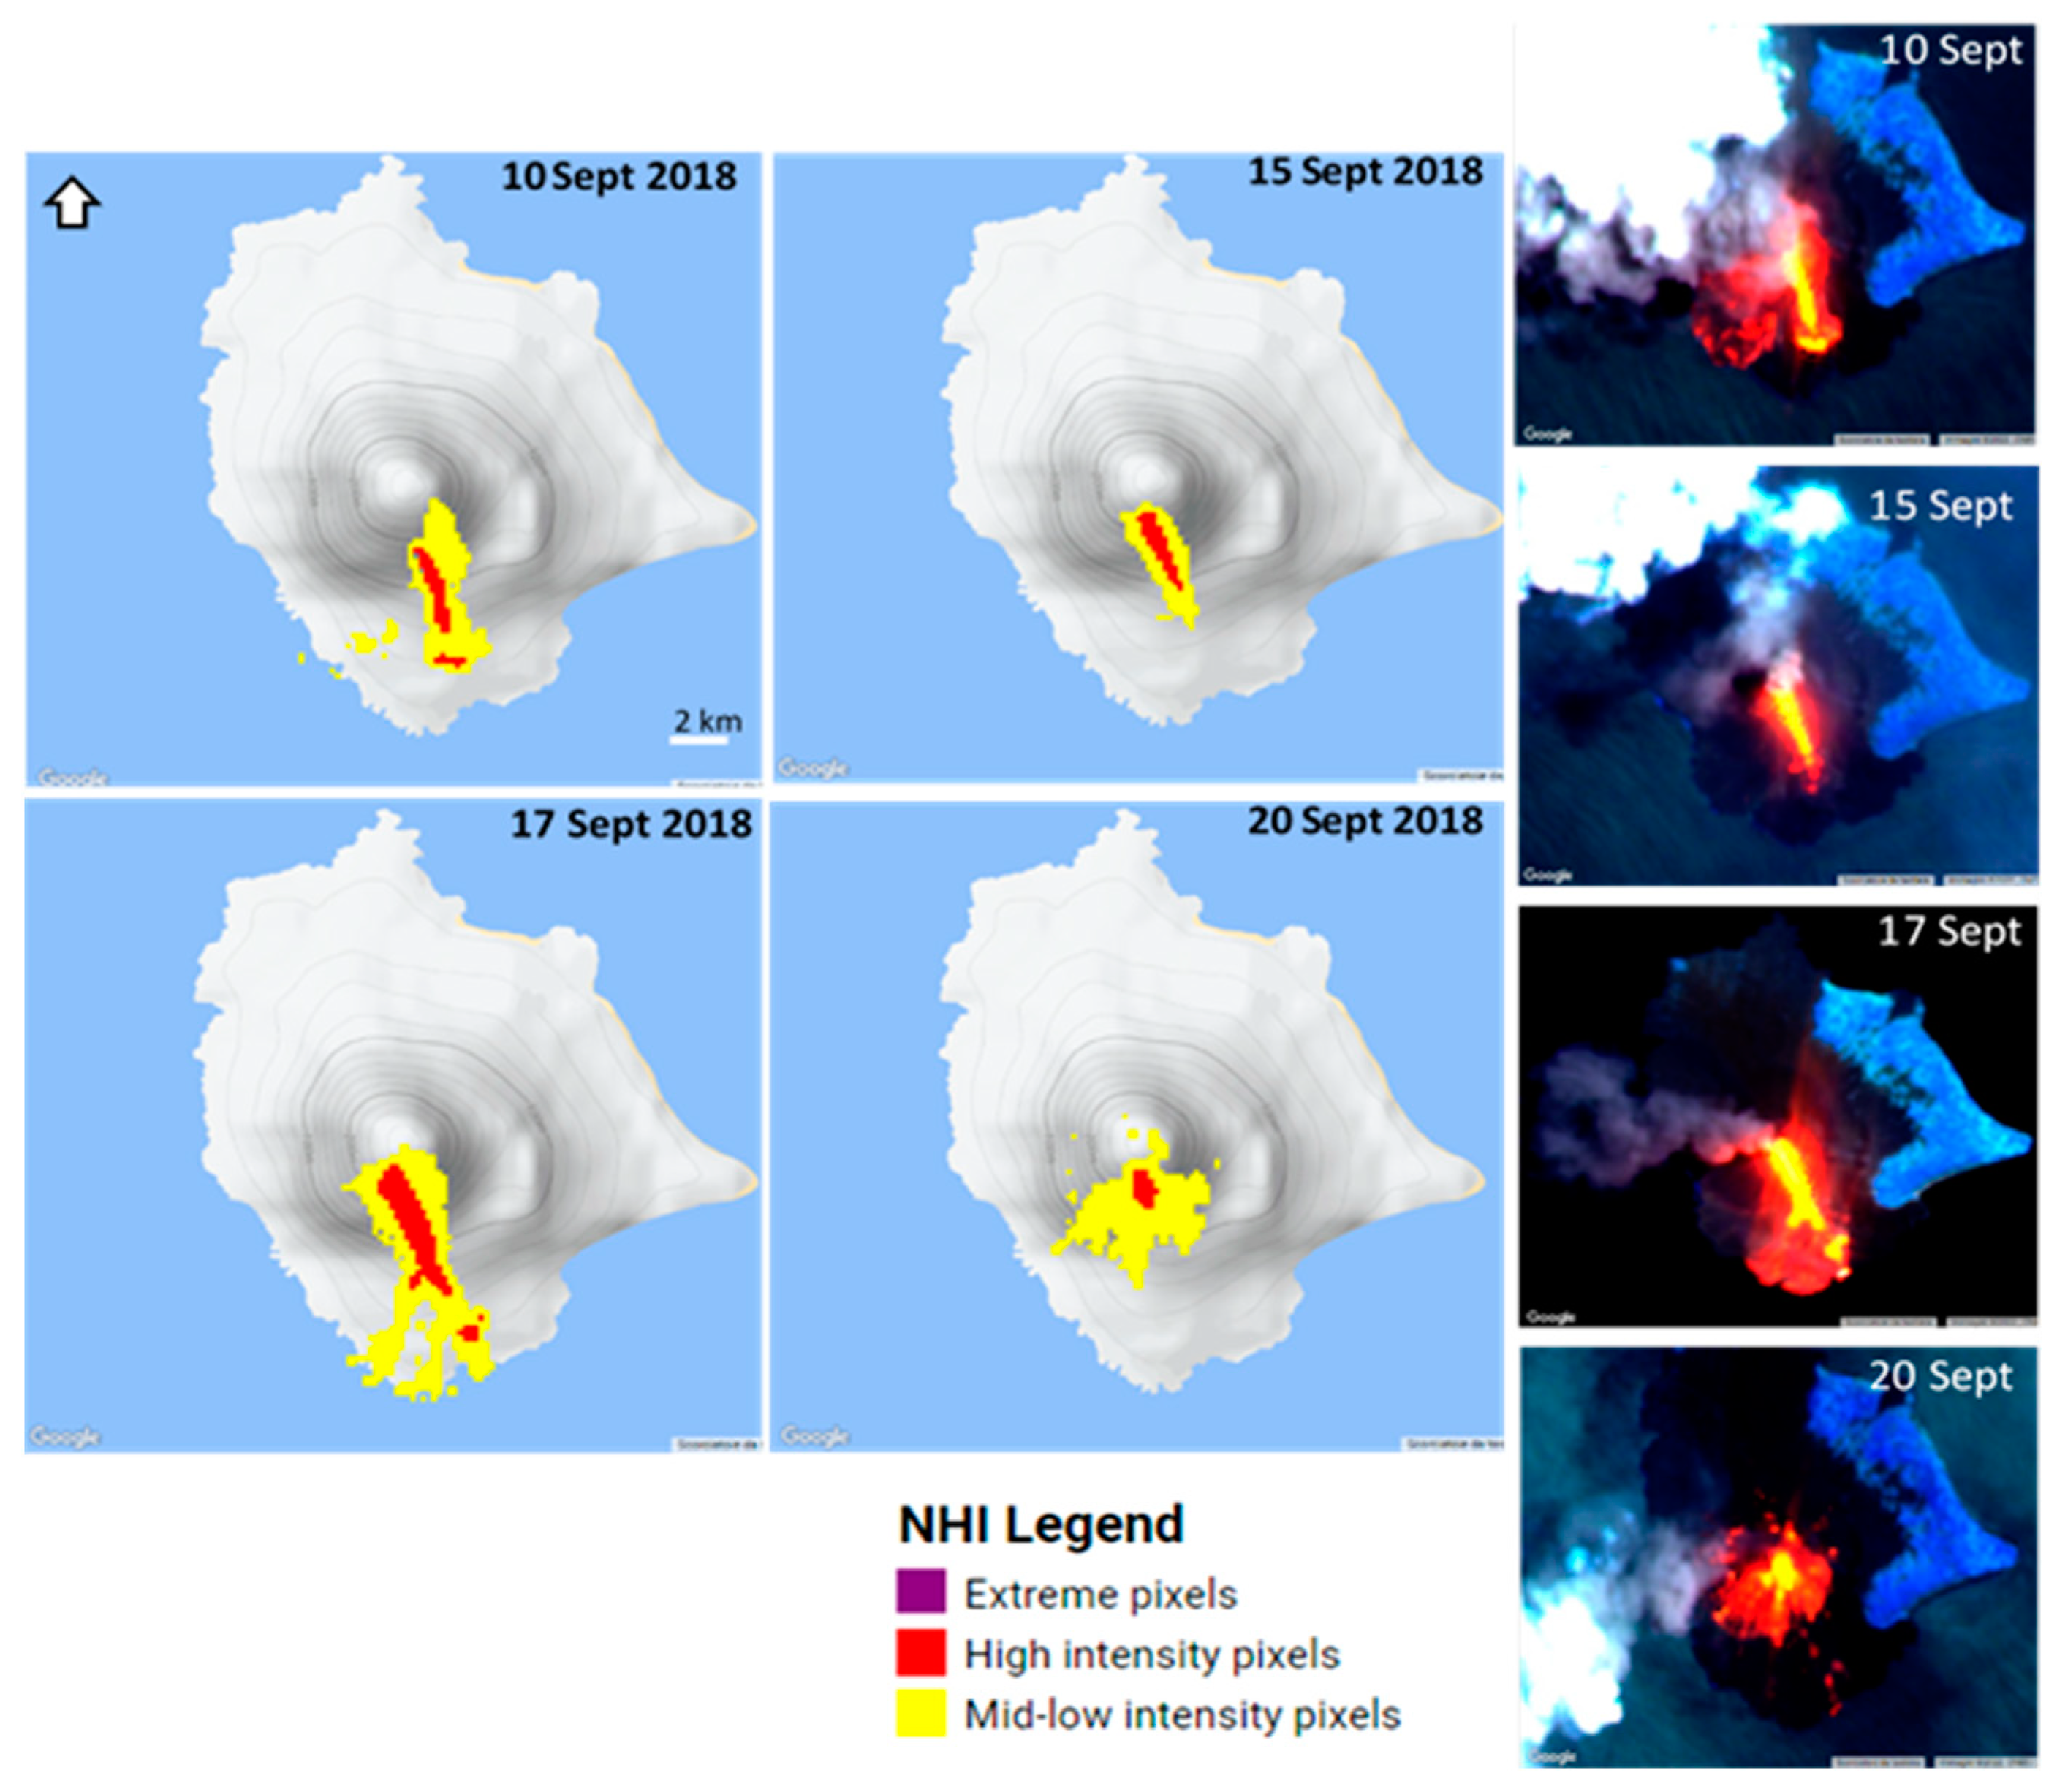
To assess the NHI behavior at the Krakatau volcano, we analyzed the Himawari-8 AHI data of 10–20 September 2018. Figure 4 provides an overview of the effusive activity identified and mapped by the NHI tool from S2-MSI observations. In more detail, the figure displays some lava flows maps (left-middle panels), and the RGB (Red = SWIR2; Green = SWIR1; Blue = NIR) images (right panels), showing also the presence of a volcanic plume.
The NHI maps provide information about the space-time evolution of the emitted lava flows (see red/yellow pixels overlapped on the relief map of the volcano), indicating that these features covered an area of about 260,000 m2 on 17 September 2018.
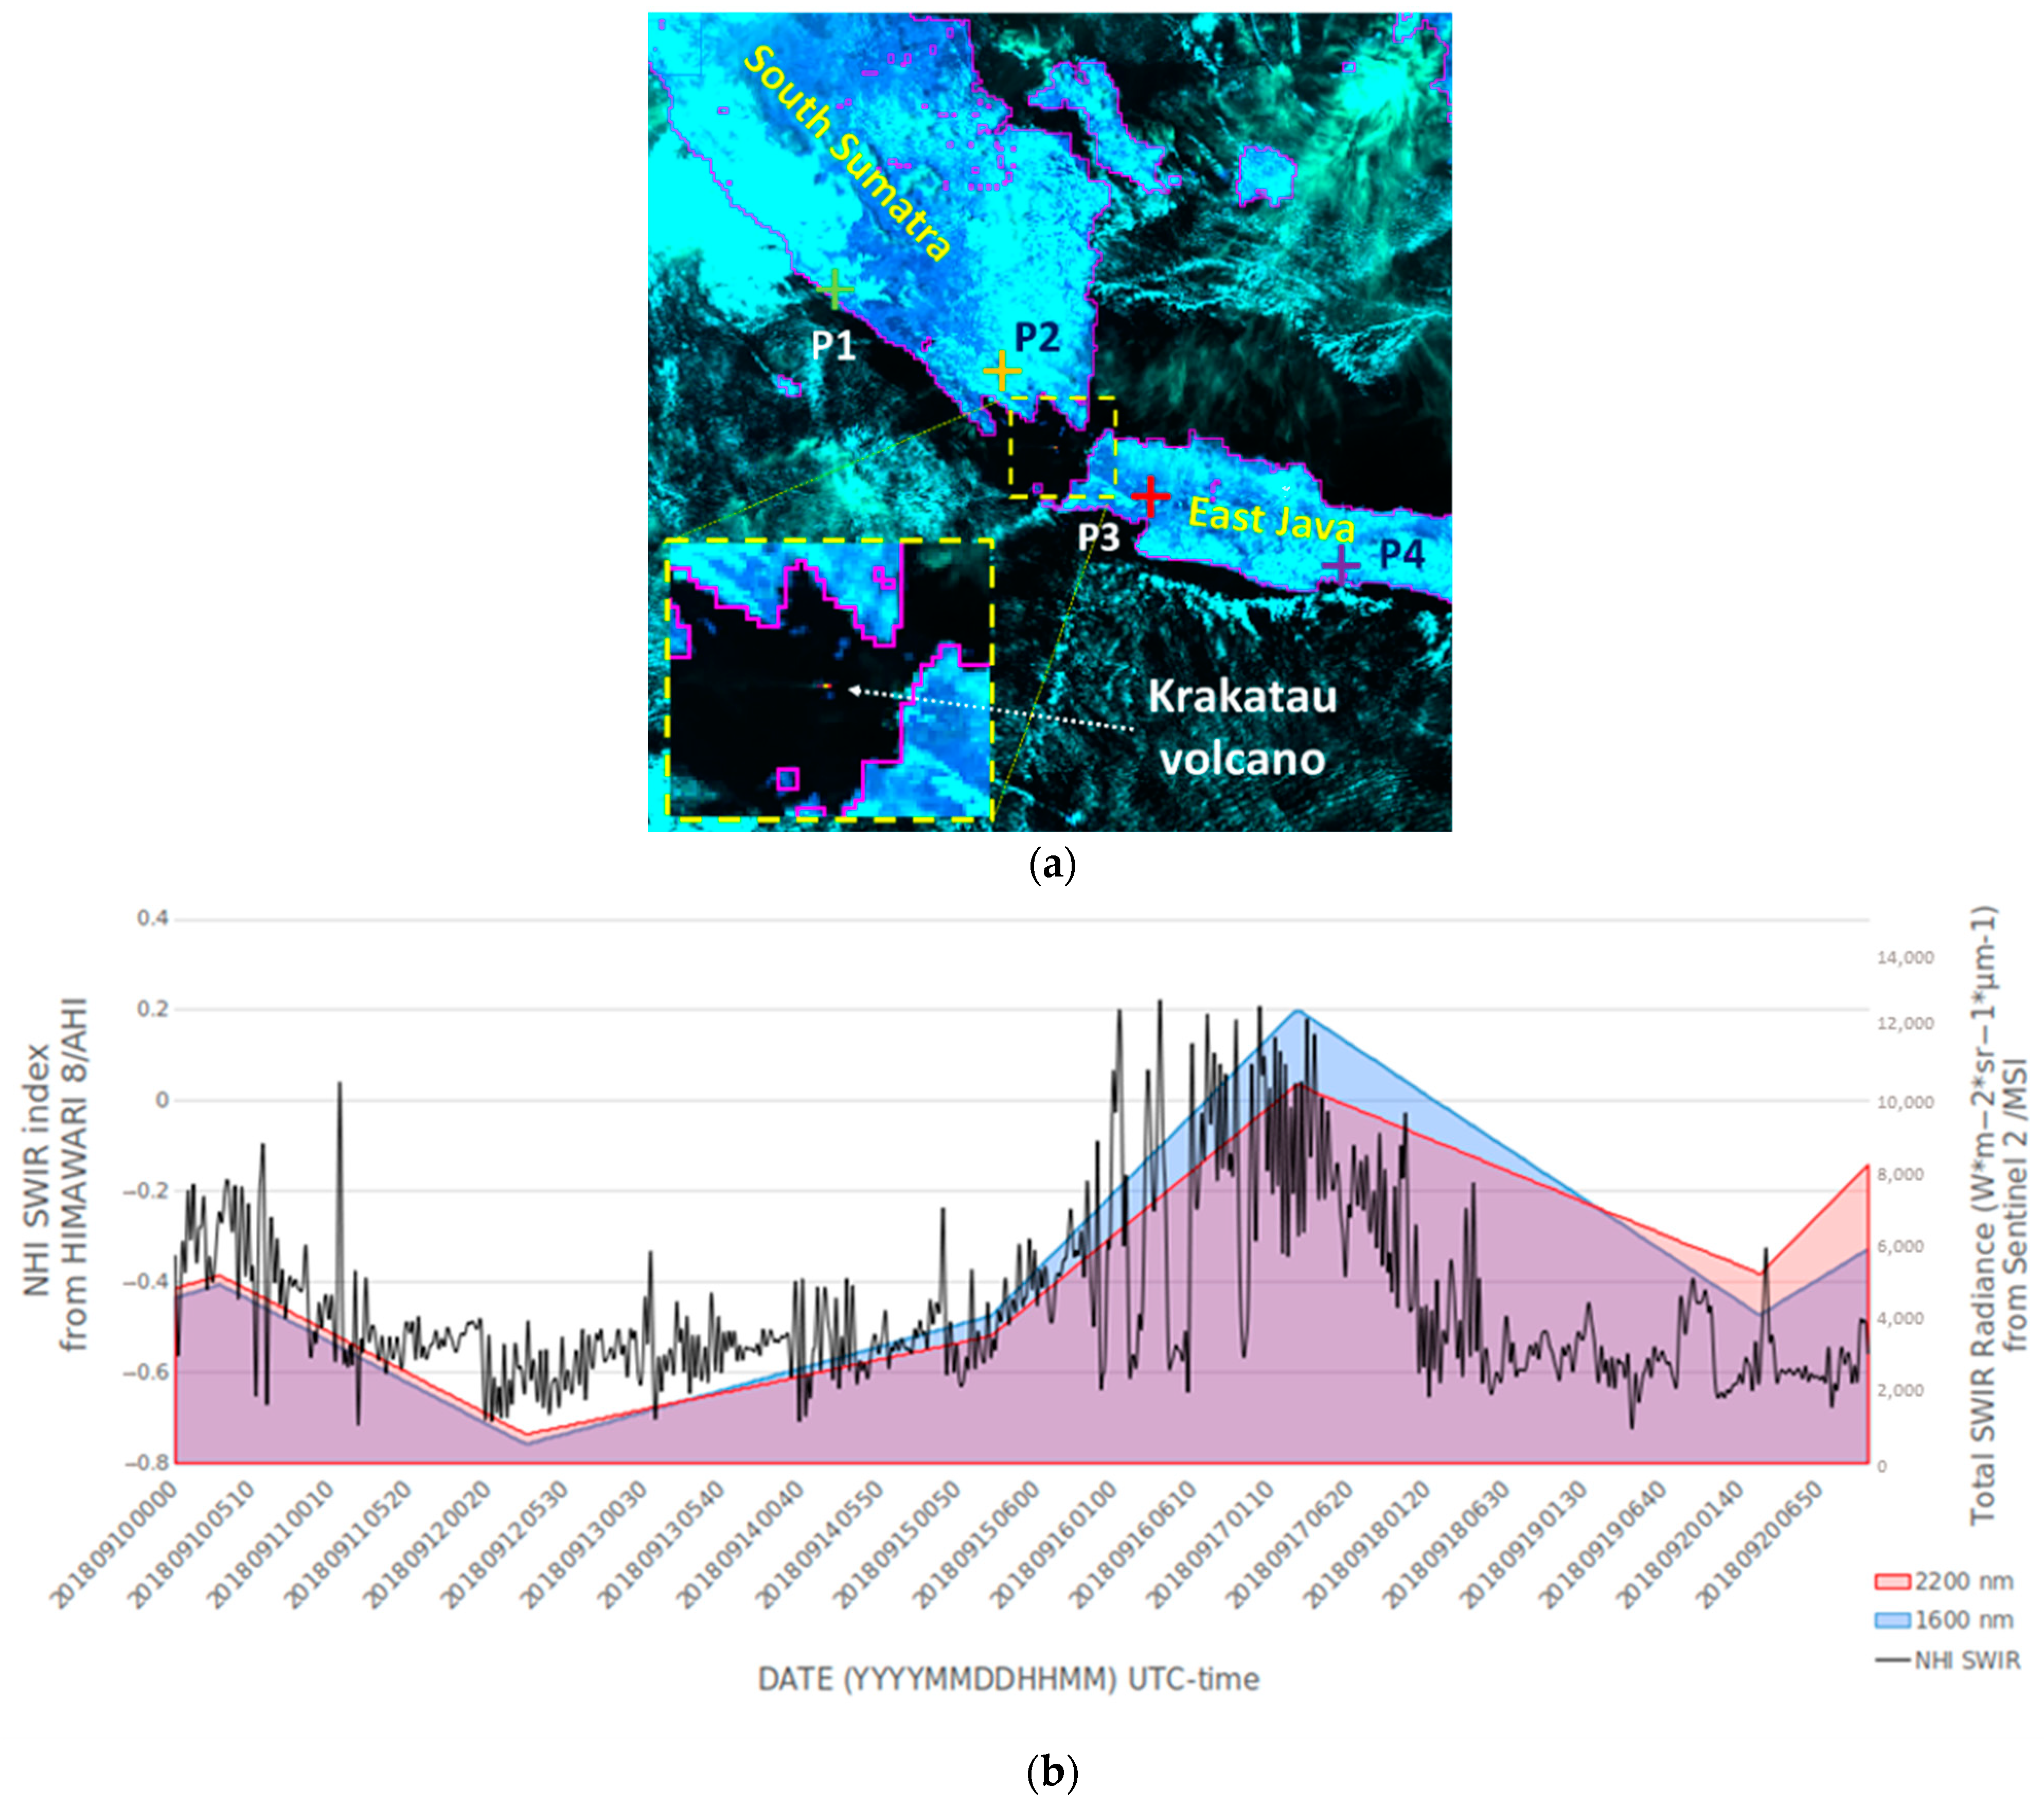
Figure 5 displays the time series of the NHISWIR index retrieved from daytime AHI observations, and the curves of the total SWIR radiances (at 1.6 and 2.2 µm) from MSI data. It is worth noting that the two curves had almost the same temporal trend; obviously, the 10 min temporal resolution of Himawari-8 AHI data allowed us to infer more continuous information about changes of thermal volcanic activity.
In particular, a first abrupt increment of the used index, up to positive values, was recorded on 11 September at 00:40 UTC (06:40 LT), marking the increase in the lava flow emissions (bursts of incandescent material were reported during the night of 9–10 September [50]). The index then drastically decreased, remaining negative until 16 September at 00:40 UTC. In the following hours, when the lava flow appeared particularly extended (see map of 17 September in Figure 4), the index increased once again up to positive values. Independent estimates of the radiant flux from MODIS data (at 1 km spatial resolution), retrieved from the MODVOLC [52] web site (http://modis.higp.hawaii.edu/; accessed on 9 September 2022), revealed the increase in this parameter from less than 100 MW, on 14 September 2018, up to 1858 MW two days later. This increment corroborates the increase in thermal activity, marked by positive values of the NHISWIR index. After 17 September at 04:30 UTC, the index once again decreased to negative values; in that period, and before the first increase in the lava effusion, values of −0.6 < NHISWIR < −0.2 were mostly recorded. Hence, the NHISWIR index reached positive values only during the waxing phase of eruption, while it remained negative during the waning phase, and when clouds/plumes presumably affected the target area.
To assess the behavior of the NHISWIR index also over some background areas, we analyzed four image pixels (P1–P4) located far from the Krakatau caldera (see Figure 5a). Figure 6 displays the results of this analysis, indicating that the NHISWIR index was always negative, and lower than −0.4 (see green, yellow, red and violet curves). On the other hand, values of the index higher than −0.4 were recorded both at Krakatau (see black curve) and at the Ambrym volcano, in the presence of a documented thermal activity. Hence, a negative threshold could enable a better identification of high-temperature features through daytime Himawari-8 AHI data. This aspect is analyzed in detail in the discussion section.

4.3. Kilauea (HI, USA) December 2020–May 2021 Eruption

Kīlauea (19°24′24.81″N, 155°17′0.18″W) is the youngest, and recently the most active, of the five shield volcanoes forming the island of Hawai’i [53].
After the intense eruption of May–August 2018, which was widely analyzed by means of satellite observations (e.g., [54]), a new eruptive activity started on 20 December 2020 at around 21:30 LT (UTC-10), with the opening of three fissures on the inner walls of Halema‘uma‘u crater [55]. The eruption produced a vigorous steam plume and generated a new lava lake at the base of the crater. In the following days, lava lake continued to be fed by the N and W fissure vents, and some islands of cooler solidified lava formed inside the crater [55]. The eruptive activity continued in the following months, ending on 23 May 2021; post-eruption analyses indicated that the lava lake eruption filled the base of Halema‘uma‘u to a depth of 223 m [56].
We previously investigated the December 2020–May 2021 Kilauea’s eruption through the NHI tool, and offline analysis of L8-OLI night-time data. After detecting hot pixels, and correcting daytime SWIR data for the solar irradiation, we estimated the radiant flux. Results were consistent with estimates of this parameter independently performed using MODIS and VIIRS (Visible Infrared Imaging Radiometer Suite) data [39].
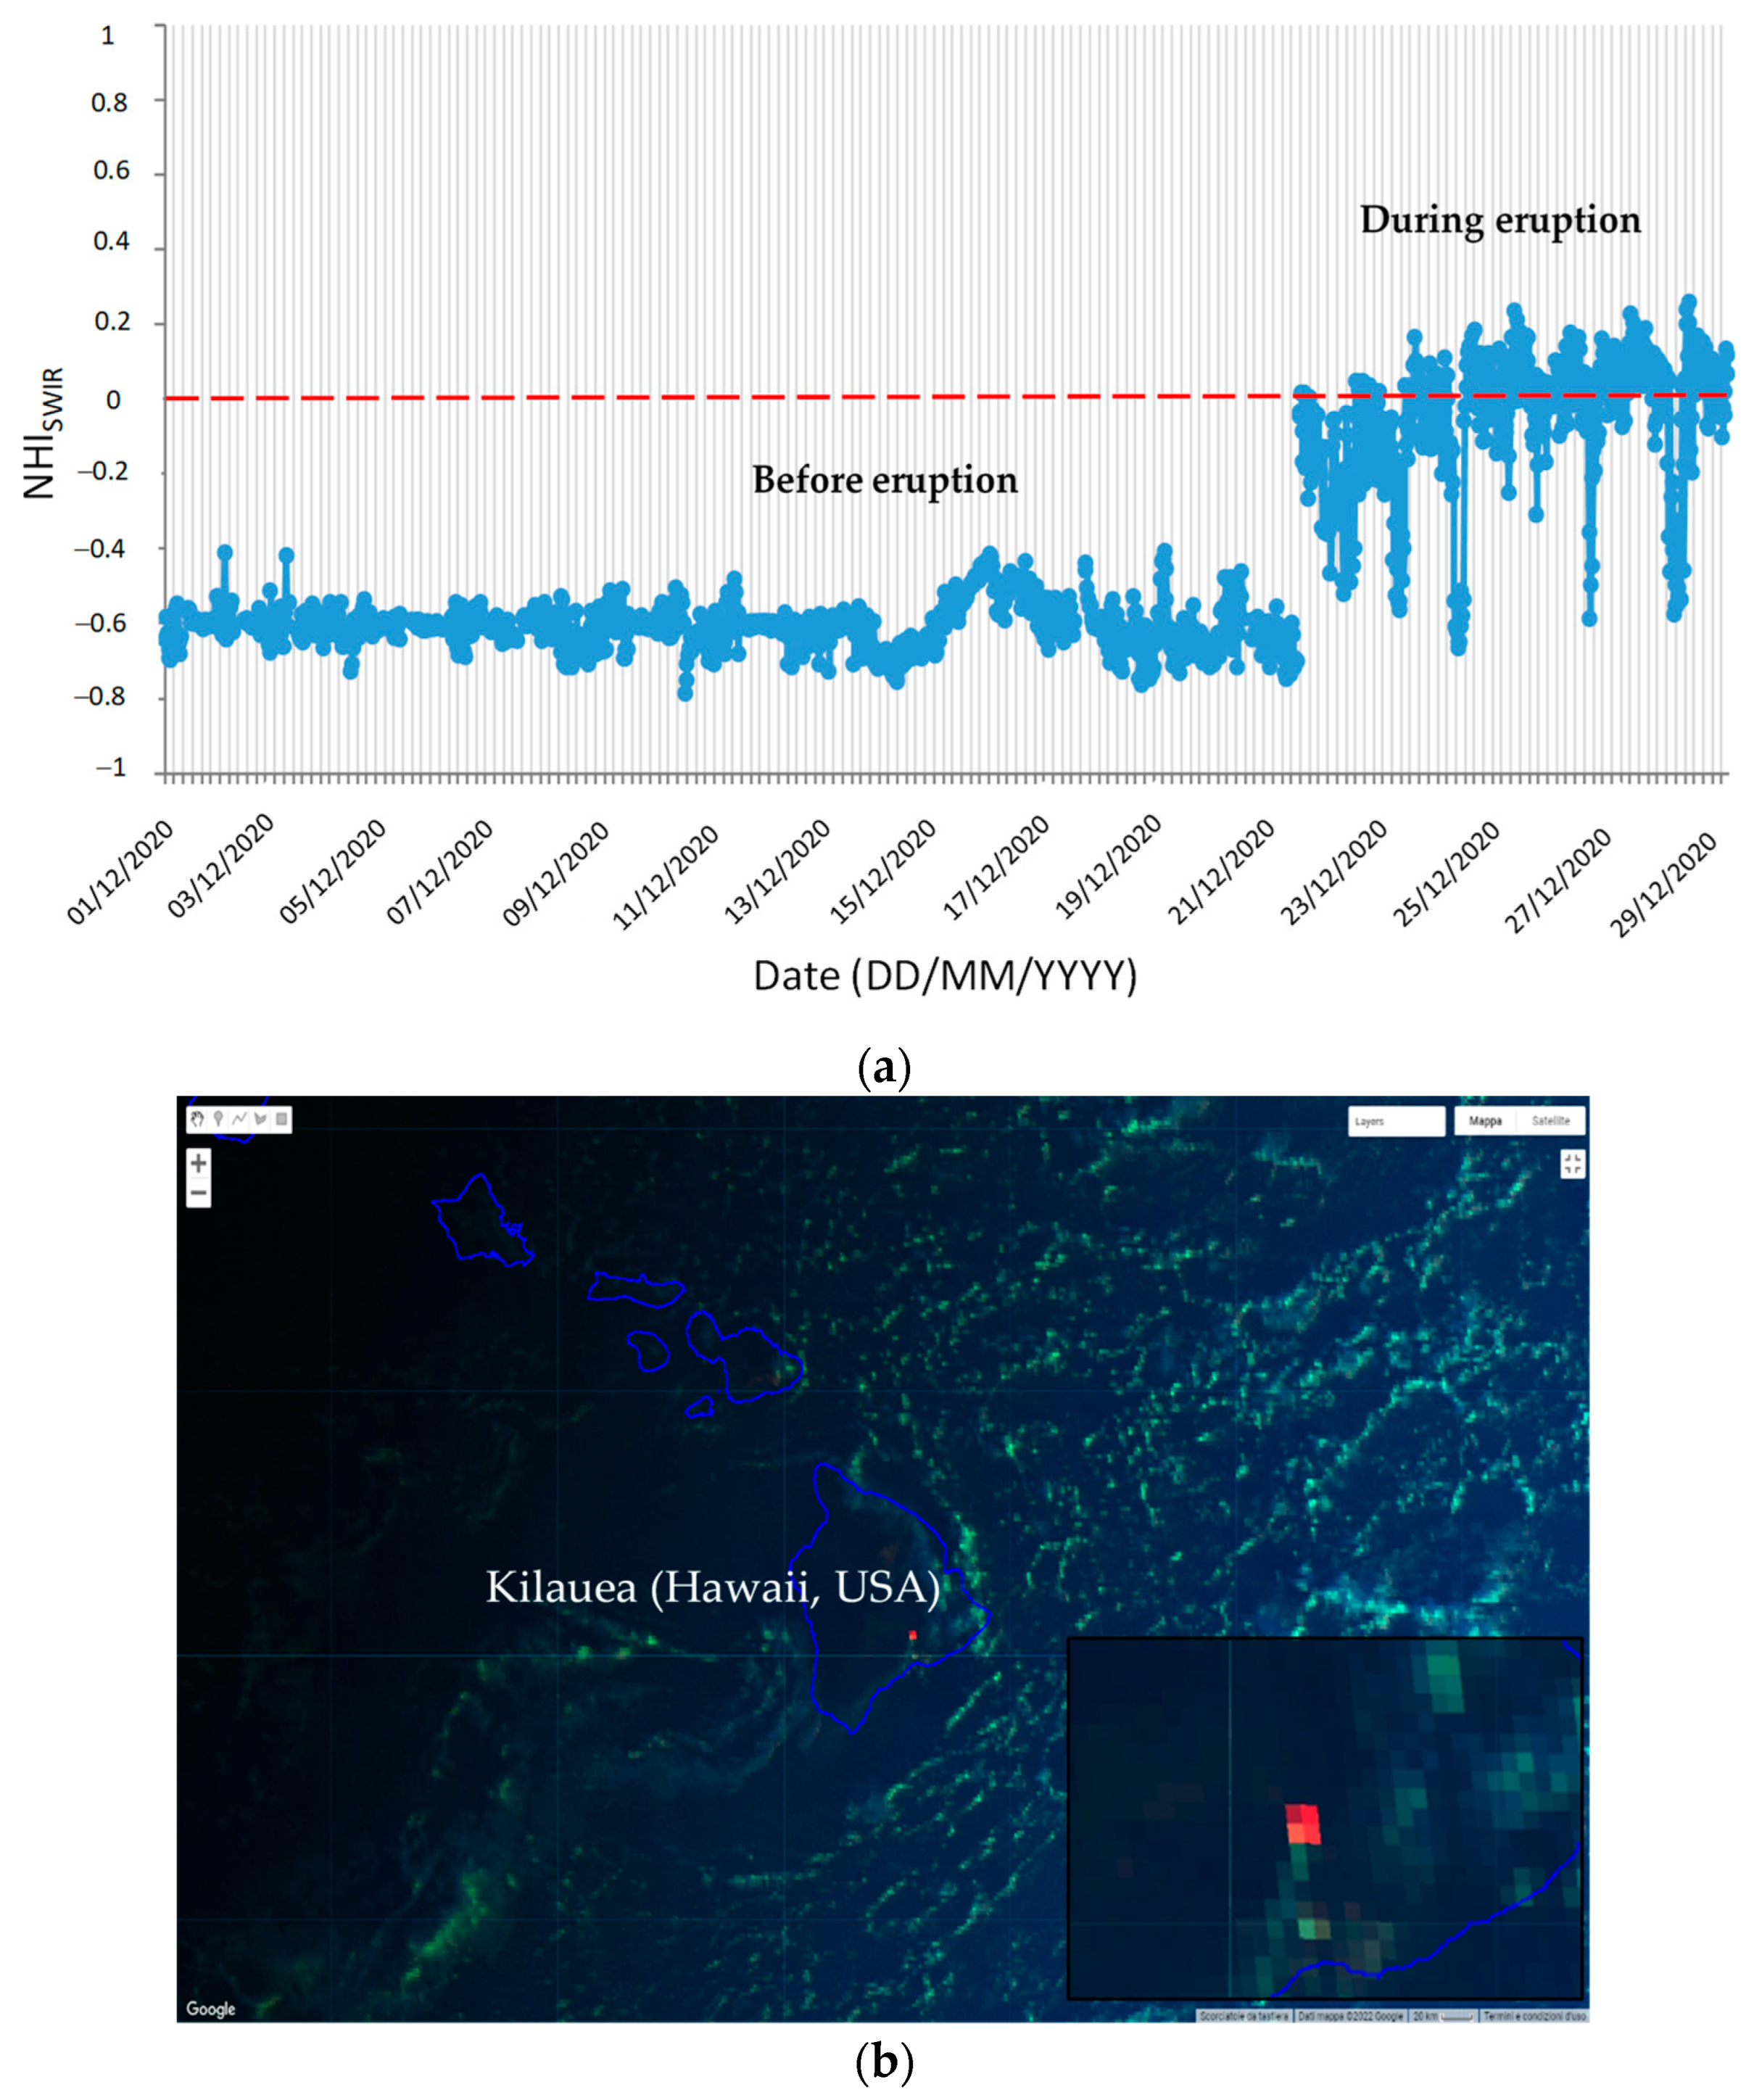
Figure 7a displays the temporal trend of the NHISWIR index retrieved, over one of the Kilauea’s crater pixels, from daytime GOES-R ABI data of 18–23 December 2020 processed under the GEE platform. The plot shows that the NHISWIR index was always negative before the eruption, showing values generally lower than −0.4. During the eruption, the index significantly increased in magnitude up to positive values, apart from when steam plumes and clouds partially/completely obscured the Halema‘uma‘u crater (e.g., [39]).
These outcomes demonstrate that the NHISWIR index may be used to infer information about hot targets (temperatures up to about 1100 K were retrieved at Kilauea during the analyzed eruption [39]) also through daytime GOES-R ABI data (see Figure 7b). However, as for Himawari-8 AHI observations, thresholds should be tailored to the coarse spatial resolution of those data to monitor volcanic thermal anomalies in a more continuous way from space (e.g., at the early stage and during the waning phase of eruptions).

5. Discussion

Daytime SWIR observations are significantly affected by the solar-reflected radiation (e.g., [57]). Because of this component, high-temperature targets should increase the NHISWIR index, up to positive values, only when these features are particularly extended within the AHI/ABI pixel area.
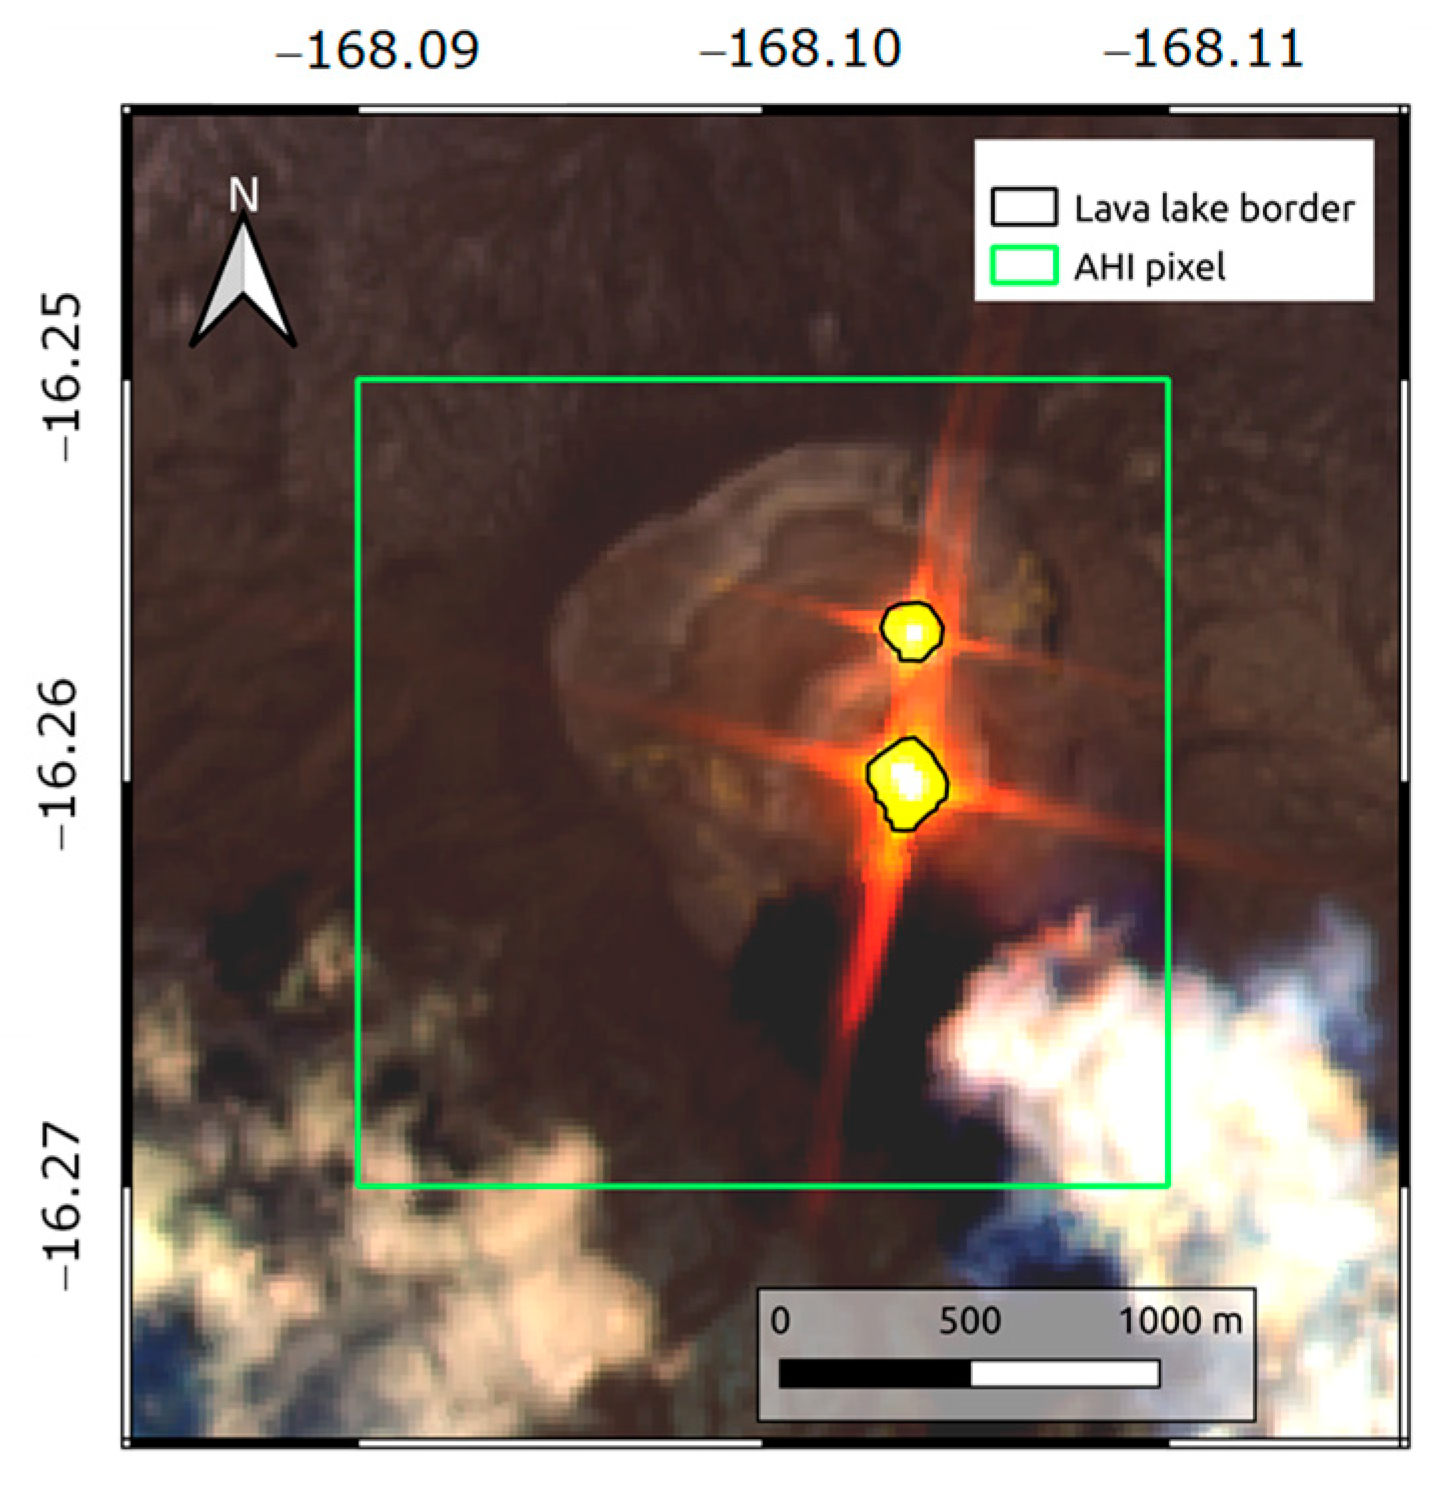
Figure 8 displays the two lava lakes at the Benbow crater, observed on S2-MSI scene of 25 November 2018 at 23:10 UTC (26 November 2018 at 10:10 LT) and the AHI pixel in green [52]. On that day, an increment of volcanic thermal emissions occurred, as indicated by NHI and MIROVA (Middle Infrared Observation of Volcanic Activity) [58], suggesting the increase in the lava lake level a few weeks before the 15 December 2018 eruption [52]. The hottest portion of the lava lakes, in yellow on the RGB image shown in background, having a temperature probably close to 1000 °C (e.g., [59]), affected about 1.1% of the AHI pixel area (≈ 4.7 km2 at the latitude of Ambrym volcano), increasing the NHISWIR index up to slightly negative values (−0.13). Therefore, despite the increment of thermal emissions, a negative threshold was required to identify the active lava lakes through Himawari-8 AHI data of the same day and hour.
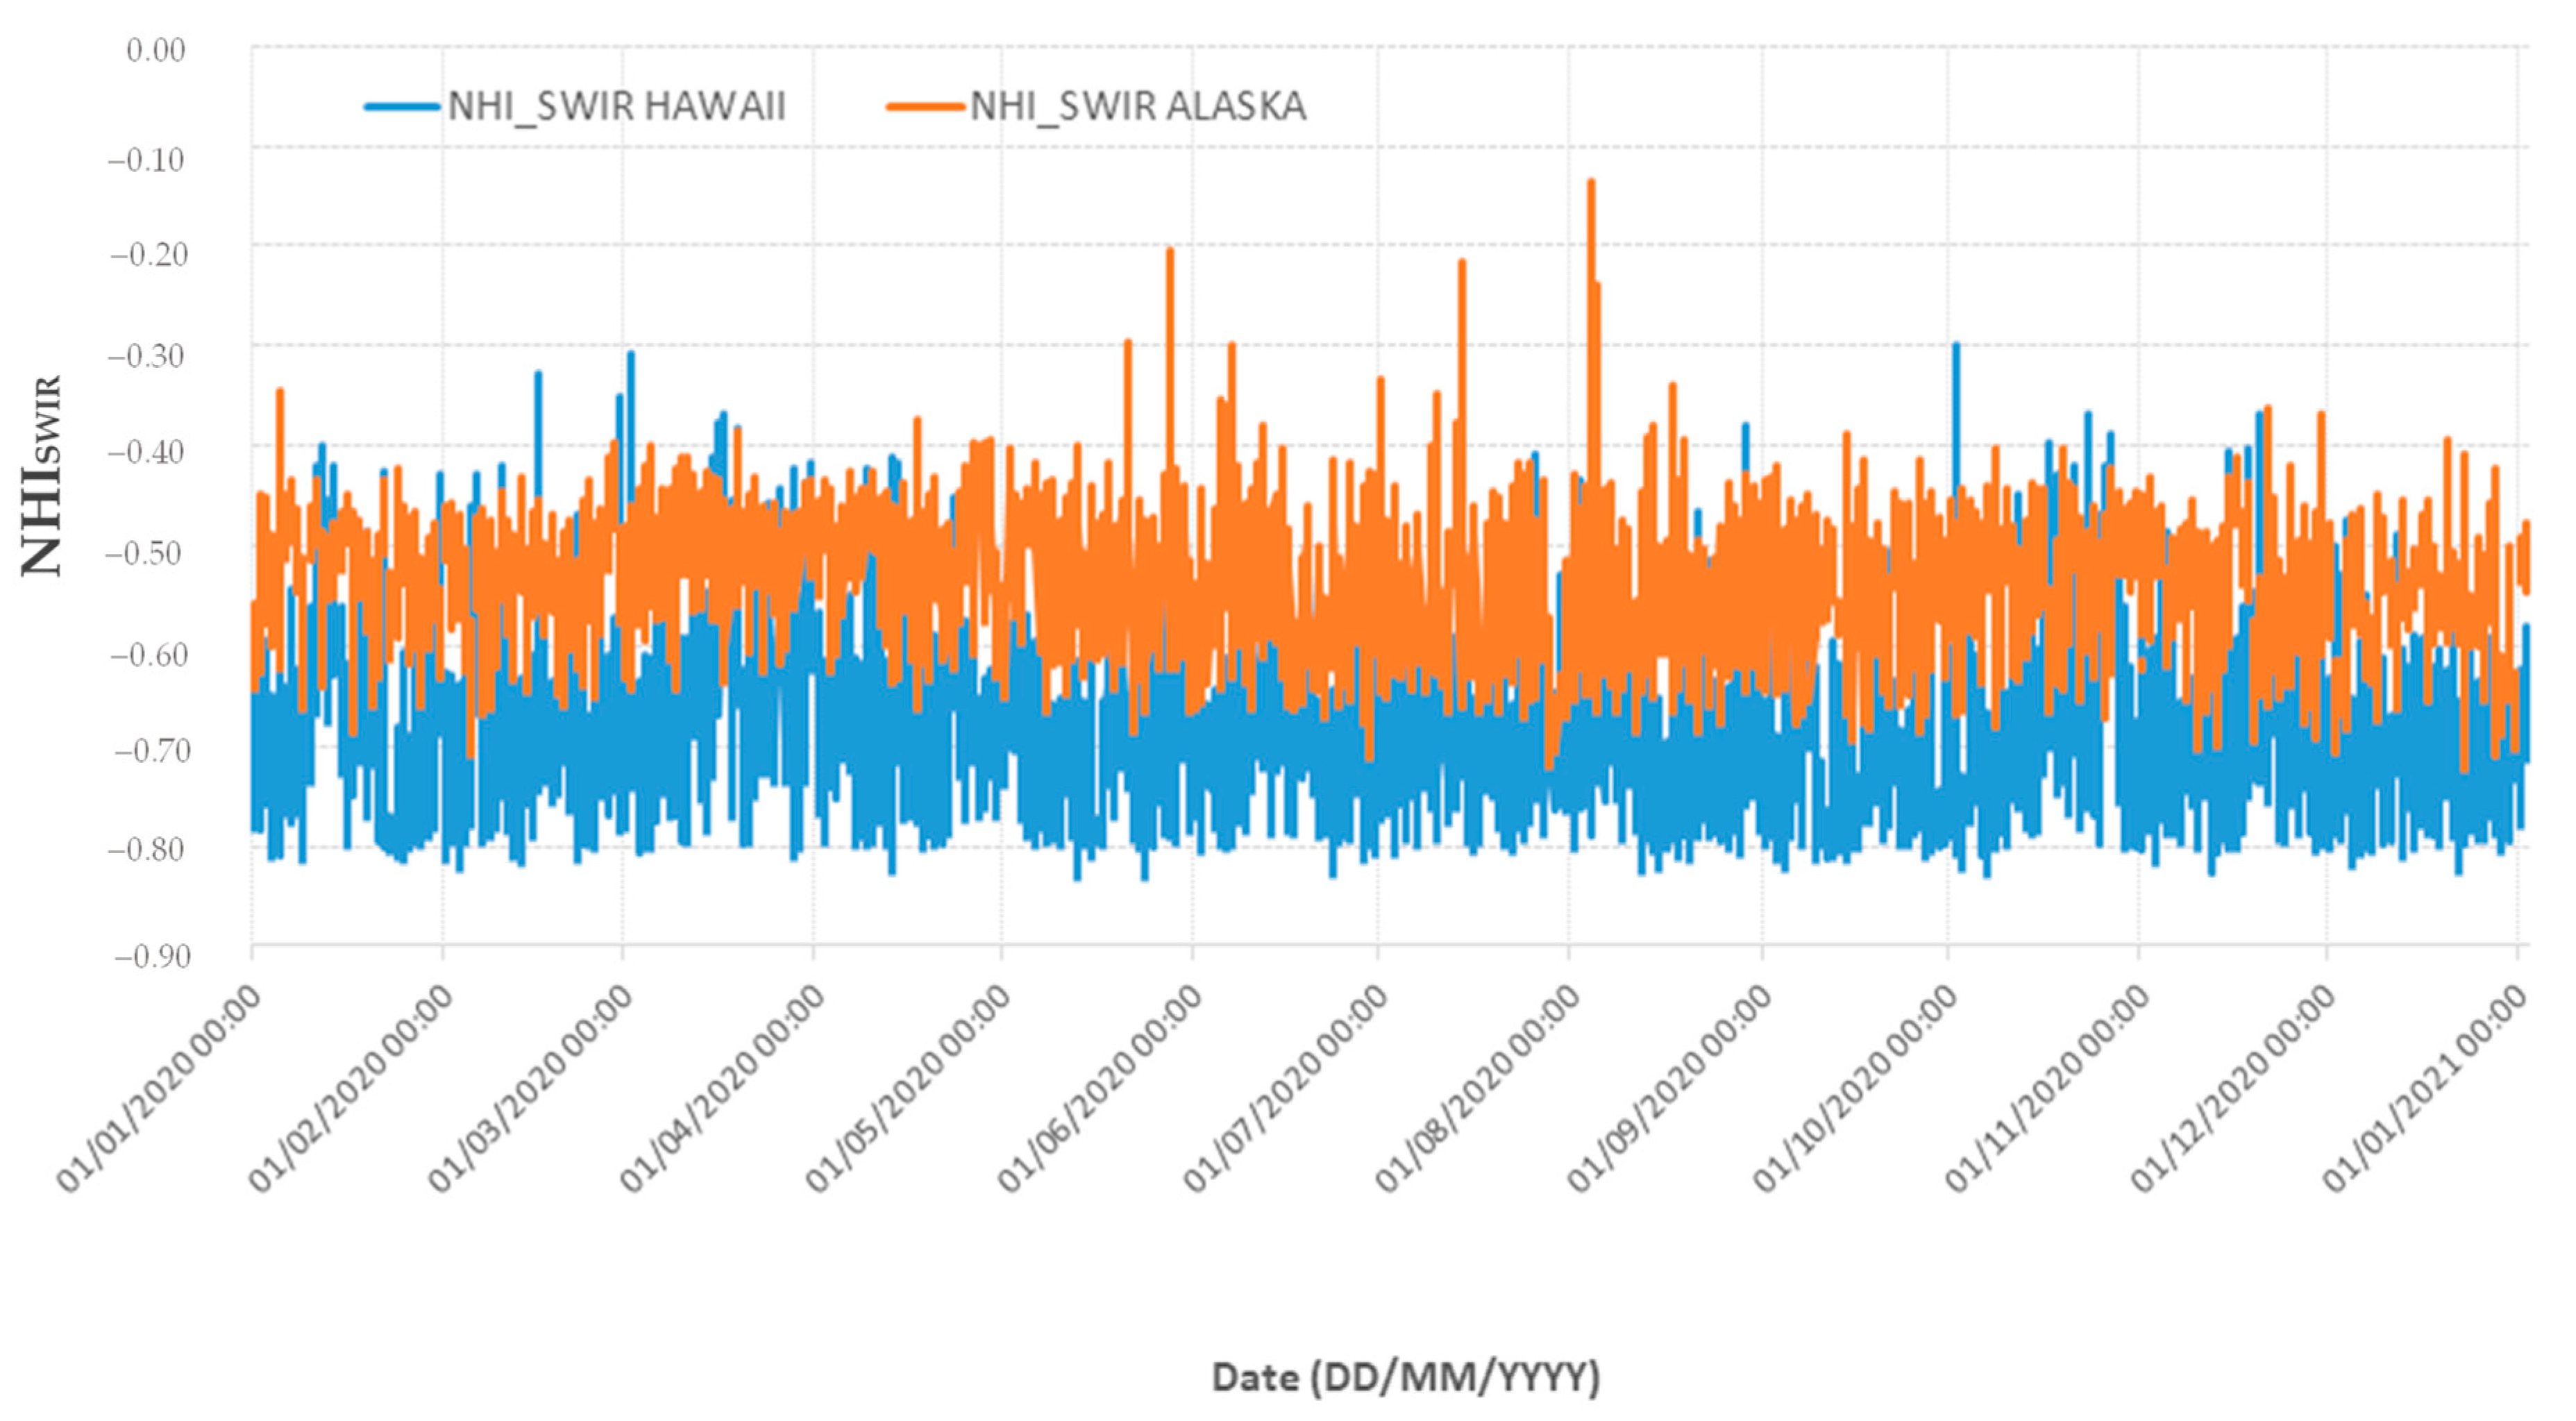
Small high-temperature features, well identified and mapped by the NHI algorithm on S2-MSI and L8-OLI scenes (e.g., [60]), may remain then undetected when AHI and ABI data are analyzed. In addition, although a negative threshold may enable a better identification of these features in daylight conditions, it appears more difficult to set properly, as shown in Figure 9. The latter displays the time series of the NHISWIR index computed, in daytime, over two background pixels of the Hawaii and Alaska (USA) regions, in reference to the period January 2020–2021. The figure shows that while values of −0.3 < NHISWIR < −0.8 characterized the selected pixel of Hawaii (see blue curve), higher values of the same index (up to about −0.1) were recorded in Alaska, in presence of a possible ice-covered surface (see orange curve). Therefore, a negative fixed threshold tailored to Kilauea (e.g., NHISWIR > −0.4), and potentially useful also at Ambrym and Krakatau volcanoes (see previous section), may be less effective in discriminating thermal anomalies from the background at the high-latitude regions.
To improve the identification of hot targets in the SWIR bands through AHI and ABI data, without using fixed thresholds, self-adaptive detection methods are required. Some authors recently used the NHISWIR and NHISWNIR indices as input to change detection methods and machine learning techniques (e.g., [51,61]). Moreover, investigations currently in progress indicate that accuracy in the lava flow mapping may be further increased by analyzing those indices in the space-time domain, according to the RST (Robust Satellite Techniques) detection scheme [62].
In this direction, a multi-temporal approach, focusing for instance on the short-term variations of NHI devoted to minimizing the processing times, may allow for a more effective identification of high-temperature features through SWIR data at low spatial resolution. This approach, also thanks to the different NHISWIR index behavior observed in the presence of clouds and hot targets, could integrate information provided by systems using MIR data, that although suited to detect also subtle thermal anomalies (e.g., [63]) which generally implements cloud-screening procedures in daylight conditions (e.g., [64,65]).

6. Conclusions

In this study, we investigated the NHISWIR index behaviour, in the presence of high-temperature targets, using satellite data at low spatial/high-temporal resolution.
Results achieved in three different volcanic areas (i.e., Ambrym, Krakatau and Kilauea) indicate that the NHISWIR index may potentially be used to identify active lava flows/lakes also through Himawari-8 AHI and GOES-R ABI observations. On the other hand, unlike S2-MSI and L8-OLI data, a negative fixed threshold is required to better identify thermal anomalies in daylight conditions. This threshold appears, however, more difficult to set univocally.
In this context, the quite stable behavior of the NHISWIR index in the time domain (in absence of hot targets) should favor its implementation within multi-temporal detection schemes. The latter, thanks to a self-adaptive threshold setting, performed without using additional input parameters (e.g., [63,65]), may allow us to better exploit the index to detect high-temperature features in daytime, through AHI and ABI data. Moreover, the standard NHI algorithm could be used in nighttime, when hot targets are easier to identify in the SWIR bands, developing a sort of hybrid approach capable of integrating MIR and TIR observations.
This approach could be then exported to SWIR data, at 1 km spatial resolution, from the FCI (Flexible Combined Imager), aboard the next MTG-I (Meteosat Third Generation) geostationary satellite, which is scheduled to be launched at the end of 2022 [66].

Author Contributions

F.M. and N.G. conceptualization; F.M. and A.F. writing paper; A.F., N.G., F.M. and G.M., Himawari-8 data analysis; N.G. and F.M., GOES-R data analysis; N.G., software; N.P. and F.M. review and editing. All authors have read and agreed to the published version of the manuscript.

Funding

This research received no external funding.

Data Availability Statement

Himawari-8 AHI data analysed in this study were provided by CEReS. Sentinel-2 MSI, Landsat-8 OLI and GOES-R ABI are available under the Google Earth Engine platform.

Acknowledgments

This work was partially performed under the CEReS Overseas Joint Research Program of the Chiba University (Japan). N.G. thanks MUR PON R&I 2014–2020 Program FSE-REACT EU.

Conflicts of Interest

The authors declare no conflict of interest.

References

  1. Prins, E.M.; Feltz, J.M.; Menzel, W.P.; Ward, D.E. An overview of GOES-8 diurnal fire and smoke results for SCAR-B and 1995 fire season in South America. J. Geophys. Res. Atmos. 1998, 103, 31821–31835. [Google Scholar] [CrossRef]
  2. Roberts, G.; Wooster, M.J.; Perry, G.L.; Drake, N.; Rebelo, L.M.; Dipotso, F. Retrieval of biomass combustion rates and totals from fire radiative power observations: Application to southern Africa using geostationary SEVIRI imagery. J. Geophys. Res. Atmos. 2005, 110, D24311. [Google Scholar] [CrossRef] [Green Version]
  3. Calle, A.; González-Alonso, F.; de Miguel, S.M. Validation of active forest fires detected by MSG-SEVIRI by means of MODIS hot spots and AWiFS images. Int. J. Remote Sens. 2008, 29, 3407–3415. [Google Scholar] [CrossRef]
  4. Amraoui, M.; DaCamara, C.C.; Pereira, J.M.C. Detection and monitoring of African vegetation fires using MSG-SEVIRI imagery. Remote Sens. Environ. 2010, 114, 1038–1052. [Google Scholar] [CrossRef]
  5. Filizzola, C.; Corrado, R.; Marchese, F.; Mazzeo, G.; Paciello, R.; Pergola, N.; Tramutoli, V. RST-FIRES, an exportable algorithm for early-fire detection and monitoring: Description, implementation, and field validation in the case of the MSG-SEVIRI sensor. Remote Sens. Environ. 2016, 186, 196–216. [Google Scholar] [CrossRef]
  6. Wooster, M.J.; Roberts, G.J.; Giglio, L.; Roy, D.P.; Freeborn, P.H.; Boschetti, L.; Justice, C.; Ichoku, C.; Schroeder, W.; Davies, D.; et al. Satellite remote sensing of active fires: History and current status, applications and future requirements. Remote Sens. Environ. 2021, 267, 112694. [Google Scholar] [CrossRef]
  7. Harris, A.J.L.; Pilger, E.; Flynn, L.P.; Garbeil, H.; Mouginis-Mark, P.J.; Kauahikaua, J.; Thornber, C. Automated, high temporal resolution, thermal analysis of Kilauea volcano, Hawai’i, using GOES satellite data. Int. J. Remote Sens. 2001, 22, 945–967. [Google Scholar] [CrossRef] [Green Version]
  8. Pergola, N.; Marchese, F.; Tramutoli, V.; Filizzola, C.; Ciampa, M. Advanced satellite technique for volcanic activity monitoring and early warning. Ann. Geophys. 2008, 51, 287–301. [Google Scholar] [CrossRef]
  9. Hirn, B.; Di Bartola, C.; Ferrucci, P. Combined use of SEVIRI and MODIS for detecting, measuring, and monitoring active lava flows at erupting volcanoes. IEEE Trans. Geosci. Remote Sens. 2009, 47, 2923–2930. [Google Scholar] [CrossRef]
  10. Marchese, F.; Filizzola, C.; Mazzeo, G.; Paciello, R.; Pergola, N.; Tramutoli, V. Robust satellite techniques for thermal volcanic activity monitoring, early warning and possible prediction of new eruptive events. In Proceedings of the 2009 IEEE International Geoscience and Remote Sensing Symposium, Cape Town, South Africa, 12–17 July 2009; Volume 2, pp. I-953–II-956. [Google Scholar]
  11. Ganci, G.; Harris, A.J.L.; Del Negro, C.; Guehenneux, Y.; Cappello, A.; Labazuy, P.; Calvari, S.; Gouhier, M. A year of lava fountaining at Etna: Volumes from SEVIRI. Geophys. Res. Lett. 2012, 39, L06305. [Google Scholar] [CrossRef]
  12. Gouhier, M.; Harris, A.; Calvari, S.; Labazuy, P.; Guéhenneux, F.; Donnadieu, F.; Valade, S. Lava discharge during Etna’s January 2011 fire fountain tracked using MSG-SEVIRI. Bull. Volcanol. 2012, 74, 787–793. [Google Scholar] [CrossRef]
  13. Marchese, F.; Filizzola, C.; Lacava, T.; Falconieri, A.; Faruolo, M.; Genzano, N.; Mazzeo, G.; Pietrapertosa, C.; Pergola, N.; Tramutoli, V.; et al. Etna paroxysms of February–April 2021 monitored and quantified through a multi-platform satellite observing system. Remote Sens. 2021, 13, 3074. [Google Scholar] [CrossRef]
  14. Marchese, F.; Malvasi, G.; Ciampa, M.; Filizzola, C.; Pergola, N.; Tramutoli, V. A robust multitemporal satellite technique for volcanic activity monitoring: Possible impacts on volcanic hazard mitigation. In Proceedings of the 2007 International Workshop on the Analysis of Multi-temporal Remote Sensing Images, Leuven, Belgium, 18–20 July 2007. [Google Scholar]
  15. Girina, O.A. On precursor of Kamchatkan volcanoes eruptions based on data from satellite monitoring. J. Volcanol. Seismol. 2012, 6, 142–149. [Google Scholar] [CrossRef] [Green Version]
  16. Marchese, F.; Falconieri, A.; Pergola, N.; Tramutoli, V. A retrospective analysis of the Shinmoedake (Japan) eruption of 26–27 January 2011 by means of Japanese geostationary satellite data. J. Volcanol. Geotherm. Res. 2014, 269, 1–13. [Google Scholar] [CrossRef]
  17. Bessho, K.; Date, K.; Hayashi, M.; Ikeda, A.; Imai, T.; Inoue, H.; Kumagai, Y.; Miyakawa, T.; Murata, H.; Ohno, T.; et al. An introduction to Himawari-8/9—Japan’s new-generation geostationary meteorological satellites. J. Meteorol. Soc. Japan. Ser. II 2016, 94, 151–183. [Google Scholar] [CrossRef] [Green Version]
  18. Pavolonis, M.J.; Sieglaff, J.M.; Cintineo, J.L. Remote sensing of volcanic ash with the GOES-R series. In The GOES-R Series; Elsevier: Amsterdam, The Netherlands, 2020; pp. 103–124. [Google Scholar]
  19. Kaneko, T.; Takasaki, K.; Maeno, F.; Wooster, M.J.; Yasuda, A. Himawari-8 infrared observations of the June–August 2015 Mt Raung eruption, Indonesia. Earth Planets Space 2018, 70, 89. [Google Scholar] [CrossRef] [Green Version]
  20. Kaneko, T.; Yasuda, A.; Yoshizaki, Y.; Takasaki, K.; Honda, Y. Pseudo-thermal anomalies in the shortwave infrared bands of the Himawari-8 AHI and their correction for volcano thermal observation. Earth Planets Space 2018, 70, 175. [Google Scholar] [CrossRef]
  21. Kaneko, T.; Yasuda, A.; Fujii, T. Simple empirical method for estimating lava-effusion rate using night-time Himawari-8 1.6-µm infrared images. Earth Planets Space 2021, 73, 37. [Google Scholar] [CrossRef]
  22. Shreve, T.; Grandin, R.; Boichu, M. Reservoir depressurization driven by passive gas emissions at Ambrym volcano. Earth Planet. Sci. Lett. 2022, 584, 117512. [Google Scholar] [CrossRef]
  23. Schmit, T.J.; Gunshor, M.M. ABI Imagery from the GOES-R Series. In The GOES-R Series; Elsevier: Amsterdam, The Netherlands, 2020; pp. 23–34. [Google Scholar]
  24. Thompson, J.O.; Contreras-Arratia, R.; Befus, K.S.; Ramsey, M.S. Thermal and seismic precursors to the explosive eruption at La Soufrière Volcano, St. Vincent in April 2021. Earth Planet. Sci. Lett. 2022, 592, 117621. [Google Scholar] [CrossRef]
  25. Marchese, F.; Genzano, N.; Neri, M.; Falconieri, A.; Mazzeo, G.; Pergola, N. A Multi-Channel Algorithm for Mapping Volcanic Thermal Anomalies by Means of Sentinel-2 MSI and Landsat-8 OLI Data. Remote Sens. 2019, 11, 2876. [Google Scholar] [CrossRef] [Green Version]
  26. Genzano, N.; Pergola, N.; Marchese, F. A Google Earth Engine tool to investigate, map and monitor volcanic thermal anomalies at global scale by means of mid-high spatial resolution satellite data. Remote Sens. 2020, 12, 3232. [Google Scholar] [CrossRef]
  27. Gorelick, N.; Hancher, M.; Dixon, M.; Ilyushchenko, S.; Thau, D.; Moore, R. Google Earth Engine: Planetary-scale geospatial analysis for everyone. Remote Sens. Environ. 2017, 202, 18–27. [Google Scholar] [CrossRef]
  28. Geostationary Operational Environmental Satellites—R Series. A collaborative NASA and NOAA Program. Mission Overview. Available online: https://www.goes-r.gov/ (accessed on 6 September 2022).
  29. Hall, J.V.; Zhang, R.; Schroeder, W.; Huang, C.; Giglio, L. Validation of GOES-16 ABI and MSG SEVIRI active fire products. Int. J. Appl. Earth Obs. Geoinf. 2019, 83, 101928. [Google Scholar] [CrossRef]
  30. Zhao, Y.; Ban, Y. GOES-R Time Series for Early Detection of Wildfires with Deep GRU-Network. Remote Sens. 2022, 14, 4347. [Google Scholar] [CrossRef]
  31. Li, F.; Zhang, X.; Kondragunta, S.; Schmidt, C.C.; Holmes, C.D. A preliminary evaluation of GOES-16 active fire product using Landsat-8 and VIIRS active fire data, and ground-based prescribed fire records. Remote Sens. Environ. 2020, 237, 111600. [Google Scholar] [CrossRef]
  32. Smart, D. The first hour of the paroxysmal phase of the 2022 Hunga Tonga–Hunga Ha’apai volcanic eruption as seen by a geostationary meteorological satellite. Weather 2022, 77, 81–82. [Google Scholar] [CrossRef]
  33. Ishii, K.; Hayashi, Y.; Shimbori, T. Using Himawari-8, estimation of SO2 cloud altitude at Aso volcano eruption, on 8 October 2016. Earth Planets Space 2018, 70, 19. [Google Scholar] [CrossRef] [Green Version]
  34. Marchese, F.; Falconieri, A.; Pergola, N.; Tramutoli, V. Monitoring the Agung (Indonesia) ash plume of November 2017 by means of infrared Himawari 8 data. Remote Sens. 2018, 10, 919. [Google Scholar] [CrossRef] [Green Version]
  35. Mazzeo, G.; Ramsey, M.S.; Marchese, F.; Genzano, N.; Pergola, N. Implementation of the NHI (normalized hot spot indices) algorithm on infrared ASTER data: Results and future perspectives. Sensors 2021, 21, 1538. [Google Scholar] [CrossRef]
  36. Fisher, D.; Wooster, M.J. Multi-decade global gas flaring change inventoried using the ATSR-1, ATSR-2, AATSR and SLSTR data records. Remote Sens. Environ. 2019, 232, 111298. [Google Scholar] [CrossRef]
  37. Faruolo, M.; Falconieri, A.; Genzano, N.; Lacava, T.; Marchese, F.; Pergola, N. A Daytime Multisensor Satellite System for Global Gas Flaring Monitoring. IEEE Trans. Geosci. Remote Sens. 2022, 60, 5001717. [Google Scholar] [CrossRef]
  38. Marchese, F.; Genzano, N.; Nolde, M.; Falconieri, A.; Pergola, N.; Plank, S. Mapping and characterizing the Kīlauea (Hawai’i) lava lake through Sentinel-2 MSI and Landsat-8 OLI observations of December 2020–February 2021. Environ. Model. Softw. 2022, 148, 105273. [Google Scholar] [CrossRef]
  39. Japan Meteorological Agency. Himawari-8/9: Himawari Standard Data—User’s Guide; Version 1.2; Japan Meteorological Agency: Tokyo, Japan, 2015; p. 22. Available online: https://www.data.jma.go.jp/mscweb/en/himawari89/space_segment/hsd_sample/HS_D_users_guide_en_v12.pdf (accessed on 6 September 2022).
  40. Schmit, T.J.; Griffith, P.; Gunshor, M.M.; Daniels, J.M.; Goodman, S.J.; Lebair, W.J. A closer look at the ABI on the GOES-R series. Bull. Am. Meteorol. Soc. 2017, 98, 681–698. [Google Scholar] [CrossRef]
  41. GOES-R Series Product Definition and Users’ Guide. Available online: https://www.goes-r.gov/products/docs/PUG-Appendix-X.pdf (accessed on 6 September 2022).
  42. GOES-16 MCMIPF Series ABI Level 2 Cloud and Moisture Imagery Full Disk. Available online: https://developers.google.com/earth-engine/datasets/catalog/NOAA_GOES_16_MCMIPF (accessed on 6 September 2022).
  43. GOES-R Advanced Baseline Imager (ABI) Algorithm Theoretical Basis Document for Cloud and Moisture Imagery Product (CMIP). Available online: https://www.star.nesdis.noaa.gov/goesr/documents/ATBDs/Baseline/ATBD_GOES-R_ABI_CMI_KPP_v3.0_July2012.pdf (accessed on 6 September 2022).
  44. Government of Vanatu, Vanuatu Volcano Alert Bulletin n°1—Ambrym Activity (25 January 2022). Available online: https://reliefweb.int/report/vanuatu/vanuatu-volcano-alert-bulletin-n-1-ambrym-activity-january-25th-2022 (accessed on 4 July 2022).
  45. Global Volcanism Program. Report on Ambrym (Vanuatu). Bulletin of the Global Volcanism Network; Bennis, K.L., Venzke, E., Eds.; Smithsonian Institution: Washington, DC, USA, 2020; Volume 45. [Google Scholar] [CrossRef]
  46. Moussallam, Y.; Médard, E.; Georgeais, G.; Rose-Koga, E.F.; Koga, K.T.; Pelletier, B.; Bani, P.; Shreve, T.L.; Grandin, R.; Boichu, M.; et al. How to turn off a lava lake? A petrological investigation of the 2018 intra-caldera and submarine eruptions of Ambrym volcano. Bull. Volcanol. 2021, 83, 36. [Google Scholar] [CrossRef]
  47. Shreve, T.; Grandin, R.; Boichu, M.; Garaebiti, E.; Moussallam, Y.; Ballu, V.; Delgado, F.; Leclerc, F.; Vallée, M.; Henriot, N.; et al. From prodigious volcanic degassing to caldera subsidence and quiescence at Ambrym (Vanuatu): The influence of regional tectonics. Sci. Rep. 2021, 9, 18868. [Google Scholar] [CrossRef] [Green Version]
  48. Marchese, F.; Coppola, D.; Falconieri, A.; Genzano, N.; Pergola, N. Investigating Phases of Thermal Unrest at Ambrym (Vanuatu) Volcano through the Normalized Hot Spot Indices Tool and the Integration with the MIROVA System. Remote Sens. 2022, 14, 3136. [Google Scholar] [CrossRef]
  49. Grilli, S.T.; Tappin, D.R.; Carey, S.; Watt, S.F.L.; Ward, S.N.; Grilli, A.R.; Engwell, S.L.; Zhang, C.; Kirby, J.T.; Schambach, L.; et al. Modelling of the tsunami from the 22 December 2018 lateral collapse of Anak Krakatau volcano in the Sunda Straits, Indonesia. Sci. Rep. 2019, 9, 11946. [Google Scholar] [CrossRef] [Green Version]
  50. Global Volcanism Program. Report on Krakatau (Indonesia). Bulletin of the Global Volcanism Network; Crafford, A.E., Venzke, E., Eds.; Smithsonian Institution: Washington, DC, USA, 2018; Volume 43. [Google Scholar] [CrossRef]
  51. Rösch, M.; and Plank, S. Detailed Mapping of Lava and Ash Deposits at Indonesian Volcanoes by Means of VHR PlanetScope Change Detection. Remote Sens. 2022, 14, 1168. [Google Scholar] [CrossRef]
  52. Wright, R.; Flynn, L.; Garbeil, H.; Harris, A.; Pilger, E. Automated volcanic eruption detection using MODIS. Remote Sens. Environ. 2002, 82, 135–155. [Google Scholar] [CrossRef] [Green Version]
  53. Fildes, R.A.; Turcotte, D.L.; Rundle, J.B. Natural Time Analysis and Nowcasting of Quasi-Periodic Collapse Events During the 2018 Kīlauea Volcano Eruptive Sequence. Earth Space Sci. 2022, 9, e2022EA002266. [Google Scholar] [CrossRef]
  54. Plank, S.; Massimetti, F.; Soldati, A.; Hess, K.U.; Nolde, M.; Martinis, S.; Dingwell, D.B. Estimates of lava discharge rate of 2018 Kīlauea Volcano, Hawai’i eruption using multi-sensor satellite and laboratory measurements. Int. J. Remote Sens. 2021, 42, 1492–1511. [Google Scholar] [CrossRef]
  55. Global Volcanism Program. Report on Kilauea (United States) Bulletin of the Global Volcanism Network; Bennis, K.L., Venzke, E., Eds.; Smithsonian Institution: Washington, DC, USA, 2021; Volume 46. [Google Scholar] [CrossRef]
  56. United Geological Survey. 2022; Recent Eruption. Available online: https://www.usgs.gov/volcanoes/kilauea/recent-eruption (accessed on 6 September 2022).
  57. Dennison, P.E.; Charoensiri, K.; Roberts, D.A.; Peterson, S.H.; Green, R.O. Wildfire temperature and land cover modeling using hyperspectral data. Remote Sens. Environ. 2006, 100, 212–222. [Google Scholar] [CrossRef]
  58. Coppola, D.; Laiolo, M.; Cigolini, C.; Donne, D.D.; Ripepe, M. Enhanced volcanic hot-spot detection using MODIS IR data: Results from the MIROVA system. Geol. Soc. Lond. Spec. Publ. 2016, 426, 181–205. [Google Scholar] [CrossRef]
  59. Radebaugh, J.; Lopes, R.M.; Howell, R.R.; Lorenz, R.D.; Turtle, E.P. Eruptive behavior of the Marum/Mbwelesu lava lake, Vanuatu and comparisons with lava lakes on Earth and Io. J. Volcanol. Geotherm. Res. 2016, 322, 105–118. [Google Scholar] [CrossRef]
  60. Marchese, F.; and Genzano, N. Global volcano monitoring through the NHI (Normalized Hot Spot Indices) system. J. Geol. Soc. 2022, jgs2022-014. [Google Scholar] [CrossRef]
  61. Zhang, Q.; Ge, L.; Zhang, R.; Metternicht, G.I.; Liu, C.; Du, Z. Towards a Deep-Learning-Based Framework of Sentinel-2 Imagery for Automated Active Fire Detection. Remote Sens. 2021, 13, 4790. [Google Scholar] [CrossRef]
  62. Tramutoli, V. Robust satellite techniques (RST) for natural and environmental hazards monitoring and mitigation: Theory and applications. In Proceedings of the 2007 International Workshop on the Analysis of Multi-Temporal Remote Sensing Images, Leuven, Belgium, 18–20 July 2007; pp. 1–6. [Google Scholar]
  63. Pergola, N.; Coviello, I.; Filizzola, C.; Lacava, T.; Marchese, F.; Paciello, R.; Tramutoli, V. A review of RSTVOLC, an original algorithm for automatic detection and near-real-time monitoring of volcanic hotspots from space. Geol. Soc. Lond. Spec. Publ. 2016, 426, 55–72. [Google Scholar] [CrossRef]
  64. Engel, C.B.; Jones, S.D.; Reinke, K.J. Fire Radiative Power (FRP) Values for Biogeographical Region and Individual Geostationary HHMMSS Threshold (BRIGHT) Hotspots Derived from the Advanced Himawari Imager (AHI). Remote Sens. 2022, 14, 2540. [Google Scholar] [CrossRef]
  65. Koeppen, W.C.; Pilger, E.; Wright, R. Time series analysis of infrared satellite data for detecting thermal anomalies: A hybrid approach. Bull. Volcanol. 2011, 73, 577–593. [Google Scholar] [CrossRef]
  66. Eumetsat. Flexible Combined Imager (FCI). Available online: https://www.eumetsat.int/mtg-flexible-combined-imager-fci (accessed on 21 July 2022).
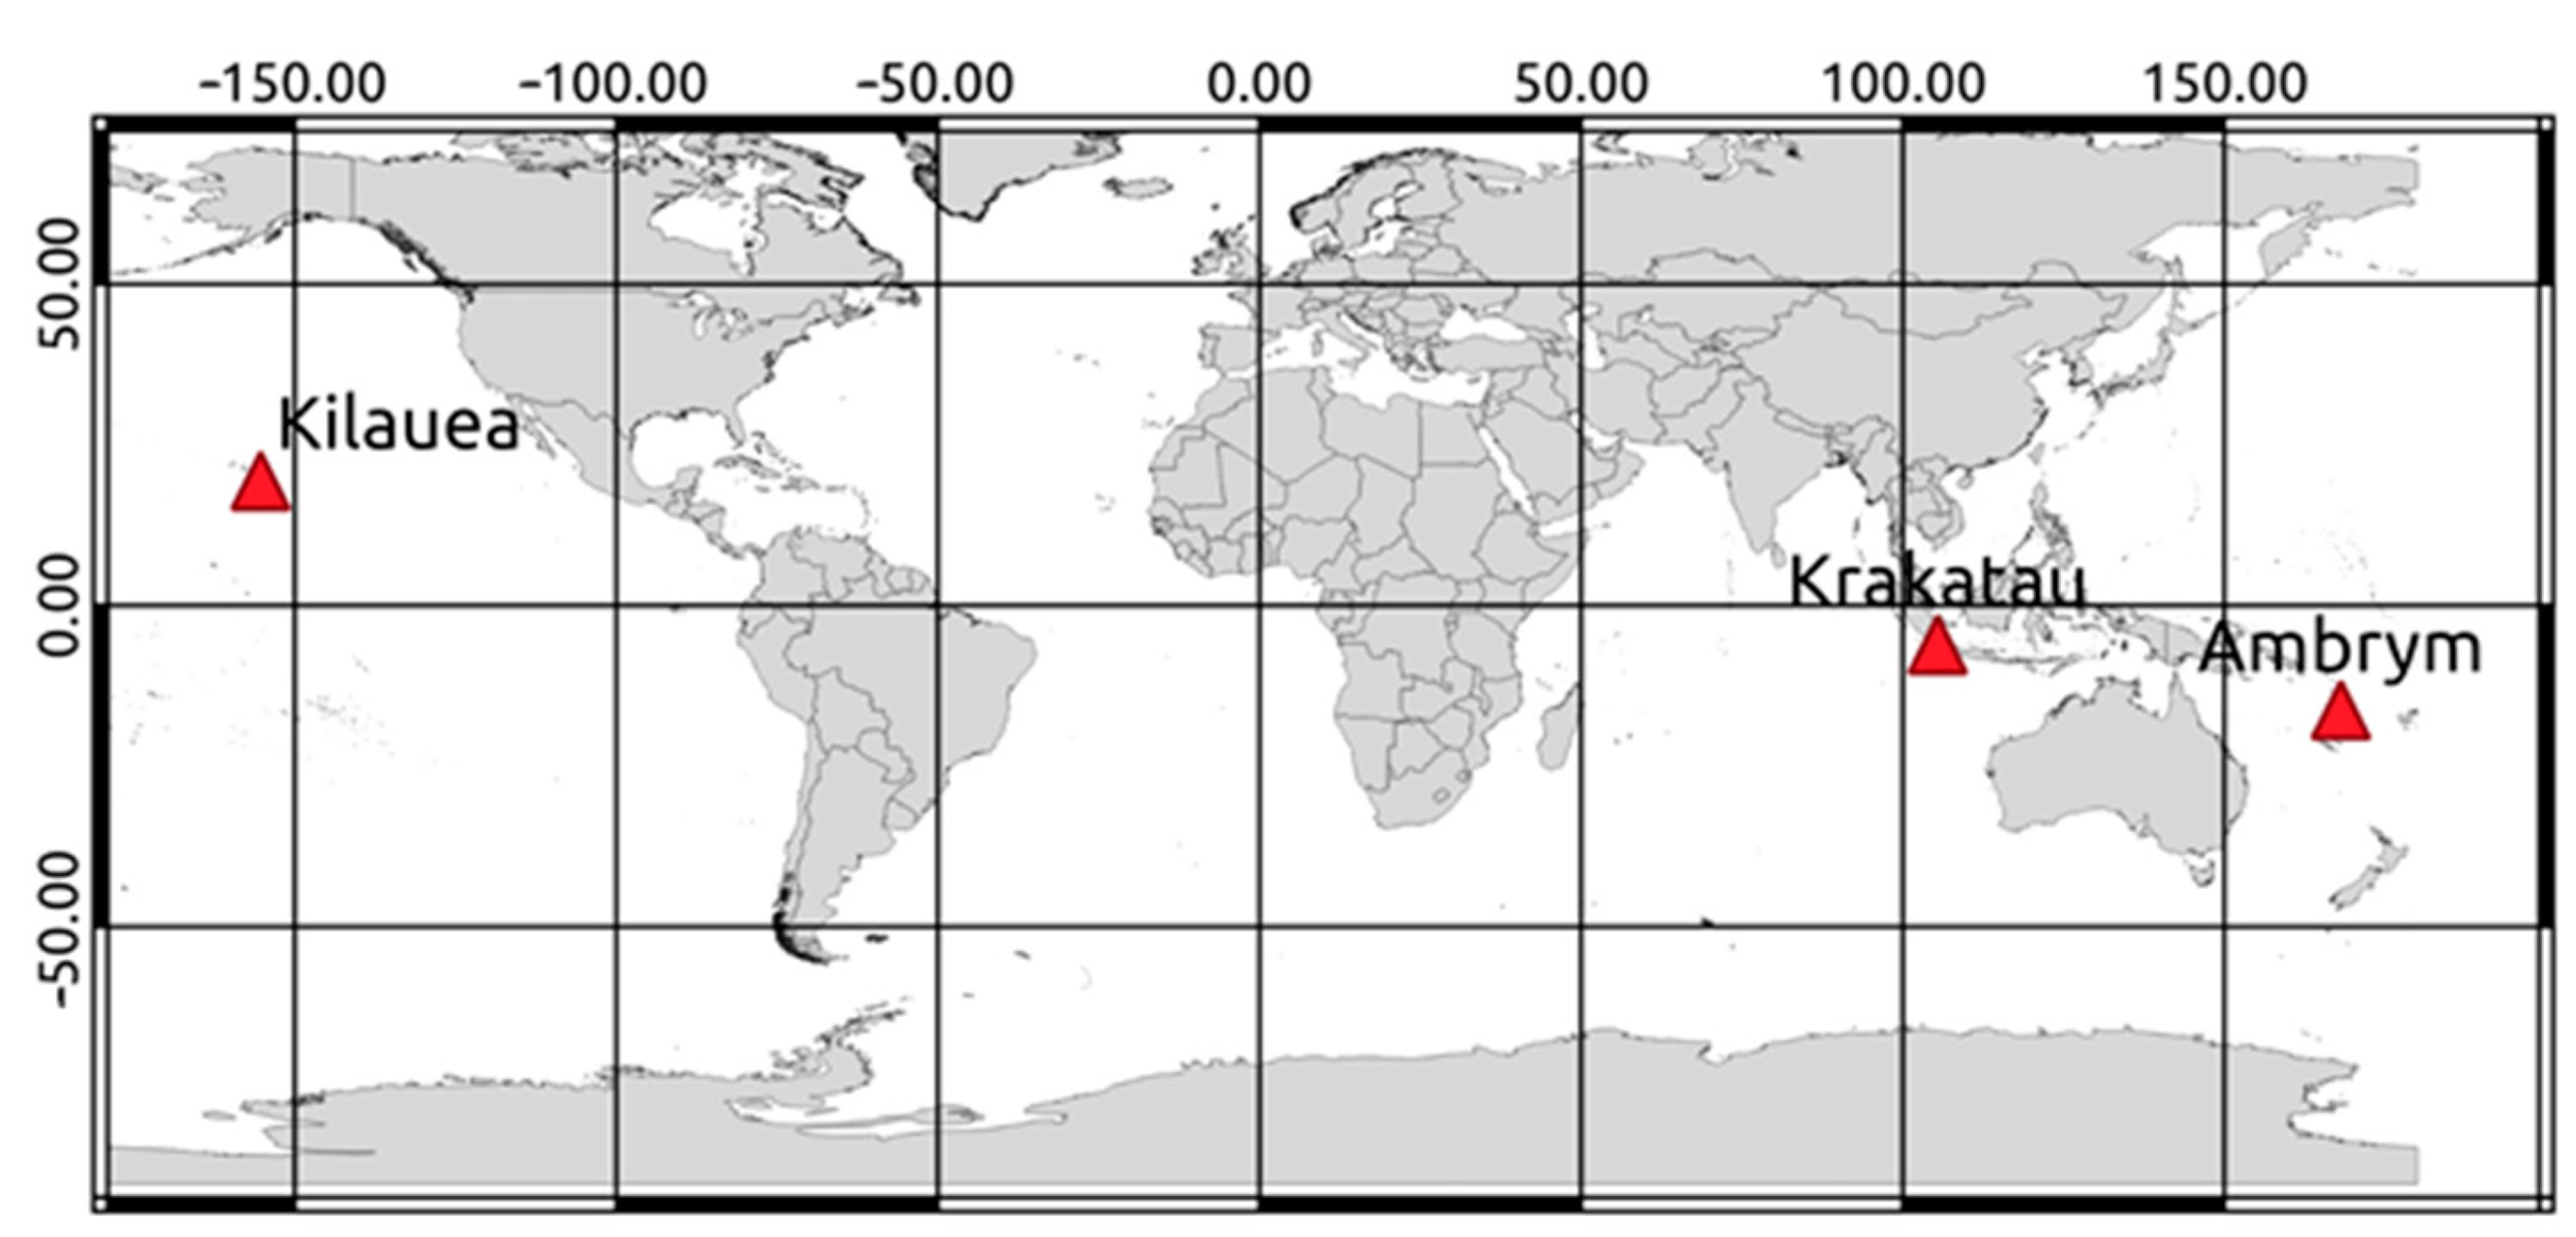
Figure 1. Geographic location of the Kilauea (HI, USA), Krakatau (Indonesia) and Ambrym (Vanuatu) volcanoes analyzed in this study.
Remotesensing 14 05481 g001
Figure 2. (a) Pixel boxes centred over Benbow (area #1), Marum (area #2) and SE flank of the Marum crater (area #3); (b) Time series of the NHISWIR index retrieved over the period 13 December 2018 at 09:00 LT–16 December 2018 at 11:00 LT, night-time intervals (17:00–06:00 LT) are marked in light grey. Note that the index was not calculated in the presence of low SWIR radiance values recorded at night-time for the reasons discussed in the text (see red curve; area #3).
Remotesensing 14 05481 g002aRemotesensing 14 05481 g002b
Figure 3. Time series of the NHISWIR index retrieved, at 10 min time interval, over the Benbow (black line) and Marum (blue line) crater, and the area affected by intra-caldera eruption (red curve), from Himawari-8 AHI data of 15 December 2018 at 09:00–12:00 LT. On the bottom, NHISWIR image overlapped on the map of Ambrym volcano; light grey pixels indicate higher values of the used index. The dotted black lines indicate the time interval associated with the start of the lava effusion.
Remotesensing 14 05481 g003
Figure 4. Lava flow maps of the Krakatau (Indonesia) volcano, from S2-MSI data of 10 September 2018 at 03:27 UTC, 15 September 2018 at 03:24 UTC, 17 September 2018 at 03:18 UTC and 20 September 2018 at 03:28 UTC, generated through the NHI tool. On the right, the RGB (Red = SWIR2; Green = SWIR1; Blue = NIR) images.
Remotesensing 14 05481 g004
Figure 5. (a) RGB (Red = B7; Green = B6; Blue = B5) image from Himawari-8 AHI data of 17 September 2018 at 10:00 LT showing the Krakatau volcano and two hot pixels (see red and yellow ones); (b) Time series of the NHISWIR index computed, from daytime Himawari-8 AHI data of 10–20 September 2018, over the pixel including the Krakatau crater area (top panel), and curves of the total SWIR1 and SWIR2 radiance from S2-MSI data retrieved using the NHI tool.
Remotesensing 14 05481 g005
Figure 6. Time series of the NHISWIR index computed, from Himawari-8 AHI data of Figure 5b, over the Krakatau (black curve) and four background pixels (from P1 to P4) located far from the volcano (see Figure 5a). Note that values of the index higher than −0.4 were recorded only at Krakatau, in the presence of a documented lava effusion.
Remotesensing 14 05481 g006
Figure 7. (a) Time series of the NHISWIR index retrieved, from daytime GOES-17 ABI data (06:00–17:00 LT), at 10 min time interval, of 18 December at 16:00 UTC–23 December at 23:50 UTC, over the Kilauea (Hawaii, USA) crater area; (b) GOES-17 RGB (Red = band 6; Green = band 2; Blue = band 1) image of 21 December at 17:00 UTC (21 December at 07:00 LT) showing, in red, the thermal anomaly at Kilauea (magnified on bottom right corner) leading to positive values of the NHISWIR index.
Remotesensing 14 05481 g007
Figure 8. RGB (Red = Band 12: Green = Band 11; Blue = Band 8A) S2-MSI imagery of 25 November 2018 at 23:09 UTC and AHI pixel, in green, including the Benbow crater. The hottest portion of the lava lakes (in yellow on the RGB with the lava lake borders marked in black) covered an area of about 55,650 m2 (≈ 1.1% of the AHI pixel area).
Remotesensing 14 05481 g008
Figure 9. Time series analysis of the NHISWIR index retrieved from one year of daytime GOES-R (GOES-17) observations (17:10 UTC–03:50 UTC) over the selected background pixels of Hawaii (21.54 N, 157.99 W) (blue curve) and Alaska (60.07 N, 149.95 W) (orange curve).
Remotesensing 14 05481 g009
Table 1. Main features of the AHI instrument aboard Himawari-8/9 satellites.
Spectral BandsCentral Wavelength (µm)Spatial Resolution at the SSP (km)
10.471
20.511
30.640.5
40.861
51.62
62.32
73.92
86.22
96.92
107.32
118.62
129.62
1310.42
1411.22
1512.42
1613.32
Table 2. Main features of the ABI instrument aboard GOES-R satellites.
Spectral BandsCentral Wavelength (µm)Spatial Resolution at the SSP (km)
10.471
20.640.5
30.861
41.372
51.61
62.22
73.92
86.22
96.92
107.32
118.42
129.62
1310.32
1411.22
1512.32
1613.32
Publisher’s Note: MDPI stays neutral with regard to jurisdictional claims in published maps and institutional affiliations.