
Application of TLS Method in Digitization of Bridge Infrastructures: A Path to BrIM Development


Centre for Infrastructure Engineering, Western Sydney University, Penrith, NSW 2751, Australia
*
Author to whom correspondence should be addressed.
Remote Sens. 2022, 14(5), 1148; https://doi.org/10.3390/rs14051148
Submission received: 3 February 2022
/
Revised: 23 February 2022
/
Accepted: 23 February 2022
/
Published: 25 February 2022
(This article belongs to the Special Issue Bridge Monitoring Using Remote Sensors)
Abstract
:Over the past years, bridge inspection practices and condition assessments were predicated upon long-established manual and paper-based data collection methods which were generally unsafe, time-consuming, imprecise, and labor-intensive, influenced by the experience of the trained inspectors involved. In recent years, the ability to turn an actual civil infrastructure asset into a detailed and precise digital model using state-of-the-art emerging technologies such as laser scanners has become in demand among structural engineers and managers, especially bridge asset managers. Although advanced remote technologies such as Terrestrial Laser Scanning (TLS) are recently established to overcome these challenges, the research on this subject is still lacking a comprehensive methodology for a reliable TLS-based bridge inspection and a well-detailed Bridge Information Model (BrIM) development. In this regard, the application of BrIM as a shared platform including a geometrical 3D CAD model connected to non-geometrical data can benefit asset managers, and significantly improve bridge management systems. Therefore, this research aims not only to provide a practical methodology for TLS-derived BrIM but also to serve a novel sliced-based approach for bridge geometric Computer-Aided Design (CAD) model extraction. This methodology was further verified and demonstrated via a case study on a cable-stayed bridge called Werrington Bridge, located in New South Wales (NSW), Australia. In this case, the process of extracting a precise 3D CAD model from TLS data using the sliced-based method and a workflow to connect non-geometrical information and develop a BrIM are elaborated. The findings of this research confirm the reliability of using TLS and the sliced-based method, as approaches with millimeter-level geometric accuracy, for bridge inspection subjected to precise 3D model extraction, as well as bridge asset management and BrIM development.
1. Introduction
Bridge infrastructures are one of the essential components of the road/transport network the world over, and require regular inspection and condition assessment to remain durable and healthy while maintaining an acceptable level of safety and serviceability during their lifetime. Over the years, bridges of all types have had to support increasingly greater loads, at greater frequencies, causing these expensive and vital infrastructures to wear out at an ever increasing rate [1,2]. The collapse of Taiwan’s Nanfang’ao bridge in 2019 [3] and Italy’s Morandi bridge collapse in 2018 [4] are two recent examples of disasters caused by a lack of proper bridge monitoring and management. Therefore, the importance of monitoring, documenting, and managing the state of bridge health cannot be overstated. A common, yet vital, part of bridge monitoring is the inspection of bridges by visual means [5,6,7]. These attributes of visual bridge inspection are reinforced by inspection regimes established by transportation authorities’ [8], where the initial detection of defects in concrete bridges is usually through visual inspection; this is a technique that also has the capability of detecting much damage in steel and timber bridges [9,10,11,12]. Despite its prevalence and versatility, visual inspection involves an element of subjectivity and is influenced by the experience of the inspectors involved. This procedure is labor-intensive, is not traceable, and may necessitate special equipment to enable access to places otherwise out of reach [13,14,15,16,17,18]. The prevalence of visual inspection is not surprising, given that humans are highly visual creatures [19]. The human quality establishes a need to link electronic written bridge inspection and maintenance records with a digital three-dimensional (3D) model of the subject bridge so that the records can have their storage organized. In this regard, the recorded information can be accessed via an ergonomic navigation medium, as opposed to paper records maintained in a file cabinet drawer. In doing so, bridge inspection records can be more meaningful, and be better understood by the bridge maintenance team, which in turn, can permit greater collaboration and teamwork between the members [20,21,22].
While a bridge may be modeled in 3D during its design period, the built structure may diverge from the details within a design model, and, once built, a bridge’s condition constantly changes over time. This makes it necessary for the geometry of a bridge to be recorded at a nominated frequency in order for the possible realization of a 3D model that better reflects the real bridge’s as-is condition [23,24]. Amassing the information required to produce a 3D model of a bridge can be a time-consuming task, especially if data collection is performed as a visual inspection clambering over components while using measuring staffs, tapes, plumb bobs, string lines, and calipers. However, advancements in technology present possible solutions to the problem of efficiently measuring the extensive geometry within bridges. Specifically, the relatively new technology of Terrestrial Laser Scanning (TLS) has developed a reputation for rapid collection of spatial information remotely [25,26,27]. TLS is a ground-based system, typically operated from a stationary vantage point, such as on a tripod, and makes use of lasers to record the shapes of objects’ surfaces within a field of view. Through the return of a TLS’s laser emission back to its source, as a result of being reflected off points of objects’ surfaces, a TLS, relative to its own position, is able to observe and record the position in 3D space (namely the x, y, and z coordinates) of each point of reflectance in a computer file known as a point cloud [28]. TLS is now used in many engineering applications, including bridge inspection, assessment, and management [29,30,31,32].
In the field of bridge inspection and assessment, Tang et al. [30] were among the first researchers who suggested the application of TLS in collecting bridge geometric features, such as vertical clearance measurements, which was a requirement of the National Bridge Inventory (NBI) guideline proposed by the U.S. Department of transportation. In this study, the advantages of using TLS in collecting accurate data were compared to traditional methods of manual data collection. Another research study conducted by Chen [33] described how TLS can be used to ascertain minimum clearance measurements, detect damage, confirm, and compare post-event geometry with pre-event geometry. Moreover, they provided an example where TLS has served as an alternative means of evaluating static load deflections of a bridge which could not have reasonably had strain gauges attached to its underside without shutting down a major thoroughfare. Stull and Earls [34] used collected TLS information to estimate the capacity of a damaged bridge structure by extracting the finite element model. Another effort by Miśkiewicz et al. [31] described a thorough interdisciplinary bridge assessment using a combination of TLS technology, Ground Penetration Radar (GPR), and Finite Element (FE) computation to evaluate the factors that contribute to the incidence of premature pavement cracks. In a similar strategy, Pérez, et al. [35] also used a combination of TLS and GPR for evaluating the integrity of a Roman bridge in Spain. Other bridge research studies by Artese and Zinno [32], Arbi and Ide [36], Gawronek, et al. [37], and Mill, et al. [38], cover the use of TLS in projects involving bridge assessment, monitoring, and updating of bridge information to reflect the presence of additions, required maintenance, and evaluating suitable locations for new equipment under a bridge. They all stated that by using TLS in bridge inspection, dependence on access equipment such as under bridge units and scaffoldings, which can impact the flow of traffic, is greatly reduced. In terms of quality and accuracy of TLS’s data, a recent research study conducted by Mohammadi et al. [39,40] evaluated the quality of two digital bridge point clouds captured via TLS and another technology of Unmanned Area Vehicle (UAV) photogrammetry. The result of this research indicated more accurate and denser data using TLS technology. It is worth noting that denser datasets generally have a greater number of data presenting the surface of the object that could positively affect the 3D model reconstructions and surface condition assessments. Similar statements were presented in research studies by Kwiatkowski, et al. [41], and Gawronek and Makuch [42].
In the field of bridge management, Chan et al. [21] explained the essential need for using a Bridge Management System (BMS) or Bridge Information System (BIS) to collate various types of bridge information such as visual inspection data, test findings, modeling results, repair, and rehabilitation activities. However, the limitation with BMS and BIS was the visualization of the collected data; therefore engineers could readily misinterpret the bridge health condition. Over the last decade, application of Bridge Information Model (BrIM) as the specific form of Building Information Modeling (BIM) in the context of bridge engineering, has provided faster solutions in the management processes. This shared platform containing a 3D Computer-Aided Design (CAD) model connected with non-geometric information, including, but not limited to, inspection reports, descriptions of maintenance actions, the material used, etc. As noted by Chan et al. [21], BrIM can allow better visualizations, and therefore understanding of data pertaining to a bridge, through the integration of bridge data with a 3D model of the same bridge. Moreover, the combination of 3D laser scanning with BrIM can result in a better means of both recording information for bridge inspection, and housing this information for future references. BrIM development using laser scanner data were initiated as a concept for asset management purposes in studies conducted by Tang et al. [30,43,44,45]. In recent years, the clear advantages of creating TLS-derived BrIMs has meaningfully improved the reliability of the generated management models. In this regard, a case study conducted by Kasireddy and Akinci [46] discussed the valuable benefits of using TLS technology in BrIM development compared to manual 3D CAD model creations using existing drawings, and inspection reports. In this research, the misalignment between the geometry of the bridges as they are, and their respective drawings, were attributed to the lack of preparing new/updated drawings. The updated drawings could depict alterations at each instance where a bridge’s geometry has been altered from that shown in the original drawings. However, by necessity, preparation of these updated drawings and 3D CAD models, as the core of the BrIM, would have been a time-consuming manual process even in computer days. Currently, various methods of data processing and reverse engineering employ TLS data points to create 3D CAD models. Studies dealing with automation in reconstruction of geometrical CAD models can be found in Hinks et al. [47], Bitelli et al. [48], Castellazzi et al. [49], Conde-Carnero et al. [50], and Mehranfar et al. [51]. In a common approach, researchers tend to make use of mesh for representations of the objects’ surface or classifying the scanned object into different components. Although these processes are known to be efficient for geometrical modeling and visualization of small size components, they may remain inefficient, time-consuming, and require a high level of computing demand for reconstruction of a bridge-sized 3D CAD model with intricate details.
Aims and Objectives
With the huge bridge inventory worldwide, condition assessment and management of these bridges have become especially important and challenging. Although various bridge management methods have been implemented by bridge owners, a newer method was developed over the last decade in the form of the BrIM, containing the 3D CAD model and additional non-geometric information. Given the time, and effort involved in data collection and 3D CAD model creation, as the requirement of BrIM, there is a need for an efficient means of recording the extensive geometry and condition of the bridges. The state-of-the-art technology of TLS has already developed a reputation as a tool capable of rapid and precise collection of spatial information. However, the adoption of this technology in the case of bridge engineering, and in terms of asset management, has not been as rapid. Therefore, this research study aims to make use of TLS technology and provide a comprehensive and practical methodology as a pathway for engineers to develop a TLS-derived BrIM. Following this study, the procedure for generating a quantitative point cloud using TLS is elaborated, and both a novel sliced-based approach for bridge geometric 3D CAD model reconstruction and workflow for non-geometric data connection are presented. Finally, the reliability and soundness of the proposed methodology is proved in the form of a real bridge case study by evaluating the quality of the captured point cloud and the extracted 3D CAD model, and then illustrating the outcome as a BrIM. The following are the main objectives of this study:
- Provide a practical methodology for generating a TLS-derived BrIM.
- Elaborate the process to generate a quantitative bridge point cloud using TLS.
- Provide a novel slicing-based method to extract a precise geometric 3D CAD model from the captured bridge point cloud.
- Prove the soundness of the proposed methods in form of a real bridge case study and validating the outcomes by comparing the quality of TLS data, CAD model versus the as-designed CAD drawings, and illustrating the outcome as a BrIM.
2. TLS-Derived BrIM Methodology
As outlined in the literature study presented, the successful application of BIM in the field of bridge engineering, commonly known as BrIM, has made this platform an alternative for paper-based and manual asset management processes. BrIM, as a data-driven digital twin, not only allows better visualization and an enhanced understanding of the bridge condition but also benefits bridge managers and assessors to make more reliable decisions either in bridge assessment or management. At its core, BrIM consists of the bridge 3D CAD model connected with non-geometrical information such as bridge location, its identification number, design revisions, inspection reports, number of bridge components and their condition, description of acts of maintenance, the material used, etc. The combination of TLS with BrIM can not only speed up the creation of bridge 3D CAD models, but also can result in a better means of both recording well-detailed information from bridge inspection, as well as a source of information for condition state and maintenance history. During the asset management phase, TLS data can also be used for detecting bridge deterioration throughout the structure’s service life, and this information can be used to update the BrIM. Therefore, in the long term, TLS-derived BrIM improves the productivity of bridge inspection and maintenance programs.
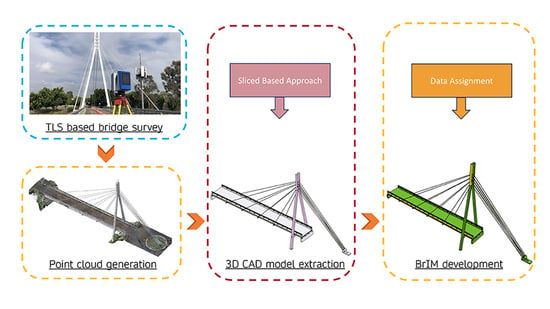
This section elaborates on all the necessary steps for a reliable bridge survey using TLS and the proposed method of extracting a well-detailed 3D CAD model from the registered point clouds as the BrIM core model. In particular, all the requirements of phases from bridge survey, post-processing, 3D CAD model creation to final data connection into the 3D solid model are described. The proposed workflow is presented in Figure 1. This workflow can be useful for bridge surveyors concerning a quantitative TLS survey as well as a well-detailed 3D CAD model extraction and BrIM development from the generated point cloud.
2.1. TLS-Based Bridge Survey and Post-Processing
The bridge survey phase contains pre-site inspections, risk assessment, and permission steps that require an expert engineer to evaluate the topological location of the object/structure, and assess the logistical requirements while evaluating the vulnerable risks involved for a surveyor, or arrangements for the necessary permissions. Selecting suitable scan positions and target locations is particularly relevant for bridges, where the shapes of such structures may cause self-shadowing, or components blocking the view of other components, is often encountered from any one viewpoint [52]. When determining suitable scan positions, the distance between the involved scanner(s) and the target surface(s) to be scanned needs to be considered, as well as the angle of the object surface(s) relative to the scanner(s). In this respect, all else being equal, both the closer an object surface is to an active laser scanner, and the closer that an object surface is to being viewed perpendicularly by an active laser scanner, the greater the number of points on that surface that would be observed by the scanner [28]. Capturing a greater number of points is an important consideration for effective recording of the object surface subjected to implementation of 3D model reconstruction [53].
The collection of on-site data is an important stage concerning the quality and quantity of data point clouds and their subsequent usefulness for bridge engineering applications [54]. This step is important, as scan positions, and their number, selected without a prepared strategy plan, could result in a captured data set of poorer quality and detail than is required [25,52]. Therefore, in order to minimize the amount of time spent on-site (and in data post-processing), and at the same time, maximize the quality of data collected in the time that is spent on-site, a scan plan should be devised. Considering the need for scanning, an evaluation can be made to identify the amounts of detail to be captured when scanning, and how this can be achieved for the given complexity of surface details and intricacy of features of a bridge planned to undergo scanning [55,56,57].
Scan quality and resolution settings of a laser scanner are two parameters that need to be considered before acquiring point cloud data. These two parameters need to be adjusted by the operator who must take into consideration the size of the smallest object which would need to be discernible in the amassed point cloud. Negligence in selecting appropriate values for these parameters can yield low-quality data, could negatively affect the scanning time, and hamper post-processing of the point cloud data [58,59]. The data quality setting within a TLS has a great impact on both the prevalence of noise and data acquisition rate, which affects the total scanning time, and can accentuate the time spent collecting redundant data. Captured point clouds generally contain noises that refer to the deviation of the recorded position of a point in a point cloud from the actual position of the same point; the position which would have been recorded if laser scanning was a perfect process [60]. Although normal noise is defined as usual redundant data with modest error, outlier noise can be defined as a wider notion that encompasses discordant data with significant error. The point cloud’s normal noise can be assessed using the Standard Deviation (STD) analysis and the well-known STD formula described in Equation (1). However, the outlier noises can be evaluated and controlled by calculating the maximum distance error.
where M is the total number of recorded data points, is the distance value of each data point to the corresponding reference, and defines as the mean value of the distances among the recorded dataset population that can be calculated using Equation (2).
The captured TLS data registration is not always perfect, and differences in the coordinate values of common/target points within mutually registered point clouds can negatively affect the quality of the point cloud. Other aspects of laser unit calibration, lack of surveying targets, and choosing unstable scan locations might lead to low-quality and noisy point clouds. Therefore, the registered point cloud also needs to become optimized in a procedure named data filtering. The quality of the registered/optimized point cloud can be evaluated by employing some quality analysis methods using well-known error metrics such as Standard Deviation (STD), STD Error, Root Mean Square Error (RMSE), and Mean Absolute Error (MAE) presented in Equations (3), (4) and (5), respectively [39].
2.2. Geometric 3D CAD Model Extraction
After point cloud registration and quality evaluation processes discussed, the next step consists of creating a suitable geometrical 3D CAD model of the captured structure with the aim of developing a BrIM. This step may be the most challenging task since the generated 3D CAD model will serve as the foundation for bridge inventory data connections to be a reference for future works and bridge management plans. In this respect, bridge structural shapes often contain complex architectural components that make it difficult to perform this task well.
In recent years, a variety of data processing and reverse engineering methodologies have made use of TLS-based point cloud and mesh generation for the representation of the object’s surface [25,52]. Although this process is well-known for its efficiency in geometrical model reconstruction and visualization of small-scale components, it may be inefficient, time-consuming, and require a high level of computer demand in developing a bridge-sized 3D mesh with detailed features. Moreover, the other concern/limitation of this method is related to its nature and use of surface-based representation for a structure. However, in many circumstances, a complex structure such as a bridge needs to be converted into a solid model using volumetric representations [27]. In a common approach, researchers attempted to overcome this limitation by classifying the scanned bridges into their individual main elements such as a pier, deck, girder, and so on and then applying mesh-based algorithms or creating extrusions using cross-sections of the mesh model to achieve a reliable approximation of the best fitting primitive for their volumetric presentation [25,47,48,49,50,51]. Although this approach has the advantage of producing useful 3D CAD models without requiring substantial computing demand, it might lead to errors and discrepancies if the components do not conform to their idealized shape.
To overcome the challenges involved, the slicing approach presented in this research study serves a different and practical workflow reducing the time and effort involved for a bridge size 3D CAD model extraction. The proposed method consists of dividing the bridge into different slices/segments extracted from the optimized point cloud after applying post-processing filtration such as noise reduction and removing non-bridge features such as surrounding thoroughfares, terrains, and vegetations. These slices contain similar information such as the initial bridge point cloud that the points of a slice are positioned between two planar cross-sectional surfaces that intersects the objected bridge in a certain direction with a specific relative distance (slice thickness). This approach is basically a point-based method combined with an automated slicing algorithm that avoids creating a surface mesh model for the whole bridge. The proposed approach offers several advantages over the mesh-based methods, such as the ability to work directly with the point cloud, data volume reduction as a result of slicing the point cloud, eliminating mistakes caused by poor smoothing, and sharp edge features.
Following this approach, the sliced bridge point cloud can then be imported into CAD software for 3D solid modeling employing general plane fitting and extrusion techniques while considering the constraints imposed by the sliced point clouds. The creation of 3D models is a straightforward operation, and auxiliary planes fitted to the point cloud can serve as a valuable guide for sketching the appropriate representations. The workflow of the described methodology is presented in Figure 1, in the 3D CAD model extraction part. Although the proposed approach sometimes may require specialized skill operators in the point cloud processing, this approach can lead to an accurate 3D geometric model in a timely manner that cannot be achieved by the conventional methods presented. The outcome of this approach as a 3D CAD model can then be used directly for various aspects of structural assessments such as Finite Element Model (FEM) development, and asset management purposes in BrIM creations. In the following section, the process of point cloud slice-based approach is described.
Point Cloud Slice-Based Approach
Throughout this approach, the slice direction and thickness play an important role in effective feature extraction and the resultant model. Therefore, regardless of the existing Coordinate System (CS) of the captured bridge data, a new/local CS needs to be established for the optimized point cloud after filtering and eliminating non-bridge features from the raw data. The new CS needs to have an x-direction parallel to the bridge direction, a y-direction running along the width, and a z-direction perpendicular to the xy plane. Moreover, considering as the whole point cloud dataset containing individual points, which and is defined based on the new coordinate system, the total number of vertical slices, , can be calculated using Equation (6). Considering as the number of vertical slices, is the specific vertical slice along the x-direction, presented in Equation (7).
where denotes slicing thickness along the x-direction. Slicing thickness can be calculated based on the minimum length of the bridge components, level of required detail, etc., which is not the main concern of this study. It is worth noting that the points of a very thick slice may not provide useful information since various features may become entangled, and vice versa, a very thin slice may not provide sufficient details for efficient feature extraction. Therefore, the proposed automatic algorithm of this research is developed based on a cloud-to-cloud comparison. In this step, the cloud-to-cloud comparison is performed between the sequential point cloud slices, and then slices with a substantially comparable RMSE value are eliminated, or merged/connected to form a larger sliced point cloud. In a similar strategy, horizontal slices also need to be generated considering a slice thickness along the z-direction, and then slices have to be compared and eliminated using cloud-to-cloud comparison and RMSE values. The remained slices of the point cloud will be imported as input into CAD software for 3D solid model extractions.
2.3. BrIM Development
As previously stated, connecting the BrIM with laser scanning information for a quick and intelligent survey not only can be an innovative approach for effective inspection, but also can be used as valuable source information for management consideration. In this step, the as-is 3D CAD model forms the core of the BrIM, and different non-geometrical information such as components’ condition state, their specific properties, ages, enacted maintenances, designed revisions can be collected by an expert engineer and assigned to each component of the 3D model to create a database as an information model for bridge management purposes in development of a BrIM-oriented BMS. This system provides considerable benefits not only in the transmission of digital information data to users such as asset managers, but also in the assimilation of semantic information that supports decision-making and strategic planning. The conceptual framework of the proposed method is provided in Figure 2. This framework shows the constituents required to form an effective bridge management system using the reliable input of TLS data.
As illustrated in the framework, non-geometrical data can be assigned to the as-is 3D model, specifically for each element, and used to create a BrIM database. Please note that these data are made up of static information that needs to be stored by an expert engineer based on existing reports, and records such as TLS-based inspections and non-destructive tests. In some circumstances, some data, such as the condition state of bridge components, need to be interpreted by an expert engineer using the element-level bridge inspection procedure, which necessitates a qualitative expression via a grading system based on local standards [8].
This database can then be used for a variety of purposes, including bridge condition assessment and deterioration predictions in a BMS to identify the issues of high critically by interpreting the information, and assigning related bridge works orders that need to be performed during the bridge’s lifetime. Similar to other management systems, this system is also defined as a cyclic process and needs consequent updating during bridge performance. Therefore, it is necessary to develop it, and associate updated data at a nominated frequency so that the BrIM reflects the as-is condition of its physical twin. Therein, the application of TLS, proposed in this methodology, can be used as a valuable technology for rapid and precise data collection of bridge information used for detailed structural inspection, monitoring, and management.
3. Bridge Case Study
To better understand the application of TLS in 3D CAD model development and investigate the valuable benefits of the proposed methodology and challenges involved, a real field study was carried out to collect the point cloud of a bridge called the Western Sydney University Bridge (commonly known as the Werrington Bridge), over the Great Western Highway, located in Werrington city, New South Wales, Australia, Figure 3. The Werrington bridge is a cable-stayed bridge with an A-frame pylon consisting of two legs, both composed of steel plates butt welded together along their long edges to form lengths of built-up Rectangular Hollow Sections (RHS), which in turn form the pylon’s height above ground. Drawings of the bridge, dated 1990 and 1991, from around the time when the bridge was constructed [61], indicate that the concrete deck is steel reinforced and forms a composite structure with the underlying steel frame via shear studs (shown in the drawings) and BONDEK steel sheeting. Along each side of the composite deck are concrete kerbs topped with steel railings. The composite deck is supported by three lines of four bearings (one line at each concrete abutment, and one line at the pylon’s beam) and a set of eight stay cables, which are in fact round bars, anchored to the upper end of the pylon. The pylon is stabilized against toppling into the bridge’s main span by another set of eight stay cables anchored into a concrete block within the southern end of the bridge.
The research study is defined as part of an asset management project for developing a well-detailed BrIM consist of an as-is 3D CAD model connected with some non-geometrical information to be used for health monitoring and asset management purposes.
Site Survey and Data Acquisition
The site survey was carried out after initial investigations considering important factors previously mentioned in Section 2.1 and safety risks involved. To avoid making multiple site visits, the site survey was also confirmed via available photographs, specifically satellite images of bridge and its surrounding using Google Street View photographs taken from the vicinity of the bridge. Finally, the scan plan of Figure 4, which shows 40 stations on and around the Werrington Bridge, was developed to enable the TLS to gather sufficient data without the need to either set foot on the highway below the bridge based on safety requirements, or introduce specialized access equipment. During this procedure, scan stations were placed at regular intervals, where possible, in order to have at least one primary connection with other scan stations with several views/points in common. Moreover, redundant connections, which relate to additional instances of networks, were considered in the suggested scan plan in order to assure scan station connections and facilitate registration procedures. As shown in Figure 4, 28 of the proposed scan stations were at the level of bridge’s deck to approach the roads, and adjacent grassed areas. However, with a view to scanning the underside of the bridge’s deck, 12 scan stations on the scan plan were spread out on the grassed areas below the level of the bridge’s deck.
Following this process, suitable locations of the target placements were identified. Placing the targets at locations at which they would be as conspicuous as possible was considered, while at the same time, attention was given to the need to attach the targets to objects which ideally would not move. However, small movements of the bridge during its operation was unavoidable. As the registration precision of multiple scans is affected by both the number of targets and their distribution in the overlapping region [62], on the scan day, a total of 29 targets were strategically placed on and around the Werrington Bridge to facilitate point cloud registration. Five targets were of the spherical type (a purpose-made sphere with a special coating), and 24 were of the planar type (a high-contrast black and white pattern on laminated A4 paper), with a minimum distribution of three common targets in each scan.
The Werrington bridge was scanned using the Z+F IMAGER 5016 terrestrial laser scanner, shown in Figure 5. This laser unit offers great versatility of features including fast rating data acquisition (about one million data points per second), range resolution of 0.1 mm and average range noise of 0.25 mm RMS for the laser system, various scanning resolutions (up to 0.8 mm at the subject distance of 10 m), long-range scanning (up to 360 m away from the scan unit), a wide field of view 360° × 320° along with an integrated High Dynamic Range (HDR) panorama camera (80 Megapixel) allows the capture of color information. This laser unit is also equipped with an integrated positioning system that optimizes post-processing operations and enables on-site registrations in real time [63].
Scans were carried out at 40 scan stations including multiple positions of the bridge deck, bridge sides and underneath the bridge in line with the scan plan presented in Figure 4, considering close range positions with an offset not more than 20 m to the nearest part of the bridge. Given the limited timeline regarding the arrangements for bridge traffic control, it was decided to employ a scan resolution of 6.3 mm at 10 m, and a normal scan quality setting to complete the task in a timely manner. During this process, the panorama photographs were also set to be captured by the laser scanner’s in-built camera.
4. Results
In this section, in order to further investigate the application of the proposed methodology, the whole process, from bridge point cloud generation to BrIM creation of the Werrington Bridge, is described.
4.1. Werrington Bridge Point Cloud Generation
The TLS data captured from each scan position on and around the Werrington Bridge has undergone relative registration to form one large point cloud encompassing much of the structure, as shown in Figure 6. The outcome of the Werrington Bridge point cloud developed from TLS data contains more than 525 million discrete points, as well as color information obtained via the TLS’s in-built camera, and required around 15 gigabytes of computer storage space.
The process of filtering and registration/merging of all 40 scan stations’ point clouds was conducted using Z+F Laser Control V9 software [64], considering non-destructive general filters such as intensity filter, mixed- and single-pixel filters and manual noise reduction to remove undesirable noises. The challenging part of the registration process was in locating/matching common points between scans taken at the level of the bridge deck, and the scans taken below the bridge deck. In this regard, automatic scan alignment/cloud-to-cloud technique, referring to use of Iterative Closest Point (ICP) algorithm [65], and artificial targets, referring to select some specific common points as the target, were used to improve the level of registration and reduce the standard deviation of the cloud-to-cloud calculations. Overall, the average standard deviation between scan stations’ point clouds was calculated as 4.9 mm after the registration.
4.2. Quality Evaluation of the Generated Point Cloud
According to the literature presented, the state-of-the-art emerging technology of laser scanning provides advantages in terms of rapid, precise, and voluminous data collection. However, several common concerns/errors, discussed in Section 2.1, may have a significant impact on the quality of the acquired data point and, in some cases, result in erroneous 3D models and incorrect interpretations compare to the as-is conditions. The methodology presented in Section 2 of this research study is a comprehensive pathway for engineers not only to consider all parameters involved in a bridge survey but also to achieve a qualitative point cloud. Therefore, as an illustration of the procedures provided, the quality of the Werrington bridge point cloud captured via TLS was evaluated and compared using the most common quality evaluation methods including surface deviation analysis, point distribution, and geometrical accuracy evaluations adopted from the VDI/VDE 2643 guideline [39,66,67]. In this regard, different components/objects of the bridge including eight cables, two pylons, and four cross-sections passing through the bridge span, shown in Figure 7, were selected to be analyzed using these methods.
4.2.1. Surface Deviation Analysis
In theory, the captured texture of a smooth-surfaced object is expected to be retrieved in only one layer of points without thickness; however, in reality the surface is normally formed based on points with deviations from the expected flat ideal shape. In surface metrology, the result of this analysis is generally used for quality assessment of the generated point cloud, subjected to the creation of a 3D solid model [39]. In this analysis, the spatial distributions of the objects’ points are measured with respect to their best fitting primitive: a flat plane, known as plane fitting technique, or a cylinder, known as cylinder fitting technique.
In this research study, different sides of the steel pylons, shown in Figure 7a, are considered to be analyzed using the plane fitting technique by defining the best fitting plane and calculating the spatial distribution of the points using error metrics. As shown in Table 1, plane fitting analysis indicated an average standard deviation (STD) of 3.883 mm and Root Mean Square Error (RMSE) of 2.687 mm for the optimized point cloud data. Moreover, the amount of Mean Absolute Error (MAE) was calculated as 2.731 mm. Overall, the findings revealed millimeter noise level for the acquired point cloud, indicating that the dataset retains reliable model when subjected to 3D surface representation.
In a similar strategy, the cylinder fitting technique was also used to assess the quality of the TLS survey in generating the small size components such as a bridge cable. In this regard, the bridge’s eight cables, as illustrated in Figure 7a, were considered to be analyzed by matching the best fitting cylinder, and then computing the spatial distribution of the point using different error metrics. Moreover, in order to analyze the TLS measurement error, the diameter of the best fitting cylinders was compared to the as-designed dimensions available. The results of this analysis are presented in Table 2.
The results of cylinder fitting, shown in Table 2, demonstrated an average STD of 2.988 mm and MAE of 2.492 mm, both in millimeter values, indicating that TLS data can perform well in millimeter-level 3D model reconstruction. However, concerns remained about the maximum absolute error values showing the level of outlier noise, which is remained greater while collecting objects at high altitudes and far away from the laser unit.
4.2.2. Relative Geometric Accuracy Evaluation
Employing the profiling method described by Mohammadi et al. [39], the relevant geometric accuracy of the generated point cloud was evaluated and compared for several parameters (lengths) shown in Figure 8 with the collected as-is measurements and available as-designed drawings. Using this method, the lengths/distances were calculated after converting four cross-sections of the bridge point cloud, shown in Figure 7b, into polygon meshes (triangular mesh models) and conducting distance measurement using GOM Inspect computer software [68]. The results of this evaluation over the proposed cross-sectional profiles of the bridge are presented in Table 3 and Table 4.
According to the results presented in Table 3, the average absolute error across the four separate cross-sectional profiles compared to the as-is measurement was determined to be less than 8 mm. This error was also calculated to be less than 5 mm, shown in Table 4, compared to as-designed drawings/dimensions. All of which demonstrates a millimeter-level geometrical relative accuracy for the TLS-based Werrington bridge point cloud.
4.3. Werrington Bridge 3D CAD Model Extraction
Using the sliced-based approach presented in Section 2.2, the bridge point cloud was divided into several horizontal and vertical point cloud slices before being imported into the CAD software. The schematic of this process is shown in Figure 9. After this step, Tekla structures software [69] was used as the CAD software. This software not only allows the importation of the point cloud files but also provides powerful functionality for 3D CAD modeling. Recent versions of this software incorporated usable point cloud functionalities, allowing users to adjust the position and scale of the point cloud, modify the point cloud’s density, and colorize the points based on the predefined classification categories. After importing the point cloud slices, the 3D model creation was a straightforward process, fitting the auxiliary lines to the point cloud in different 2D views and simply drawing the desired representations, and then extruding the drawings or specified elements while considering the constraints imposed by the sliced point clouds. Following this process, the generated 3D model was also upgraded to a higher Level of Detail (LoD) in constructive modeling, using predesigned details, components, and connections available in this software. Figure 10 depicts a view of the 3D CAD model generated using this technique as well as 3D model’s acceptable agreement with its physical counterpart in a photograph taken from the bridge site.
To further validate the reliability of the sliced-based approach, two parts of the Werrington bridge, depicted in Figure 7, were inspected and analyzed by calculating the deviation of the created 3D CAD model from the conventional mesh-based 3D CAD model and the TLS-based point cloud. The comparison results of this analysis are shown in Table 5. Additionally, a cross-sectional profile of the part A was extracted and analyzed from both the sliced-based model and the mesh-based model, as shown in Figure 11.
As presented in Table 5, the average STD and RMSE of the sliced-based CAD model versus the mesh-based CAD model are 4.62 mm and 5.75 mm, respectively. These values are calculated as 4.26 mm and 5.42 mm versus the point cloud data. All of which indicates an acceptable agreement between the models created based on the proposed algorithm and the conventional mesh-based method and point cloud. However, the creation of mesh-based models took significantly more time, which can vary according to the level of detail required, the computer and software configurations, as well as the operator involved.
In another effort, considering the group of bridge girders as the reference elements, the deviation of the generated 3D CAD model and the point cloud was evaluated and compared. This evaluation shows the distance less than 5.00 mm between the majority of the girder elements drawn and the point cloud, indicating that the two datasets are in an acceptable agreement. The result of this evaluation is shown in Figure 12. It is worth mentioning that the deviation analysis may also be used as a clash detection process to find areas where elements from the constructed 3D model could not perfectly overlap the acquired point cloud.
4.4. Werrington Bridge BrIM and Designed Plugin
In this step, the generated 3D CAD model of the Werrington bridge forms the core of the BrIM, and various non-geometrical data were assigned to each component of the bridge using Tekla structures’ Application Programming Interface (API) [69]. Tekla Open API is an interface that allows software developers to create plugins that can interact with the 3D model generated. Based on this, a plugin was designed to communicate with the 3D CAD model, assigning various non-geometrical information to each component of the bridge. This plugin allows users (expert engineers, inspectors, etc.) to create and assign element-level reports, records, and documentations to each component of the bridge.
As a benefit of TLS-derived BrIM, the acquired TLS data, which serves as the database’s precise geometrical record, can subsequently be used for bridge inspection and detection of damages/defects that occur over the course of the bridge’s lifespan at different time intervals. In this regard, clash detection analysis and progress tracking algorithms [70], which discover changes/conflicts between two models, are essential additions, allowing asset managers to conduct thorough inspections of bridge assets over time. This useful information may potentially a reliable source of data for effective/successful bridge monitoring, assessment, and management, which contributes to decision-making while providing a suitable starting point for development of a BMS.
In the case of Werrington bridge BrIM, the designed plugin was used to assign various reports and records to each individual bridge element. In this regard, component-level information such as the element’s details, material, maintenance history, and some interpretations of the element’s condition state were gathered and assigned to create a reliable BrIM. Moreover, TLS data were used for clash detection in order to identify discrepancies between the ideal 3D CAD model and the captured point cloud. Figure 13a depicts the effective detection of clashes and the importation of this information into the BrIM. This information can then be used for damage identification and interpretation of the element-based condition states. As a tangible example, Figure 13b demonstrated the schematic of Werrington bridge BrIM with interpreted condition state of each element.
As part of this, components in a critical condition (with defects detected as affecting the structural integrity and serviceability) are indicated in red, while elements in “as new” condition are highlighted in gray. As previously stated, this information is the outcome of an expert engineer’s interpretation based on the local grading system with four standardized condition states descriptions which condition state 1 denotes “new” or “good” element condition, whereas condition states 2, 3, and 4 indicate minor, moderate, and severe defects, respectively [8]. As demonstrated through the developed BrIM, the severity and locality of the defects, as well as other non-geometrical information, can be readily transferred to asset managers for management purposes and future maintenance planning. The successful implementation of this plugin at an early stage has opened the door to the development of a comprehensive BMS in future research studies.
5. Discussion and Future Directions
This study established a practical methodology for developing a TLS-derived BrIM that contains a 3D CAD model and the ability to connect non-geometrical information to each component of the bridge structure with the aim of bridge monitoring and asset management. Given the time and effort required to gather manual measurements and update information, the significant use of the TLS application, described in this research study, introduces an efficient and precise method for data collection and 3D CAD model generation.
To further evaluate the soundness of the proposed method provided in this research study, the process of bridge surveying, 3D CAD model creation, and BrIM development of a real bridge case study was thoroughly discussed. In relation to the bridge surveying phase, important factors in a proper bridge surveying plan and essential activities using TLS were reviewed. In the case of the Werrington bridge case study, the TLS application shows an acceptable data acquisition time, although this operation would take a couple of weeks using manual approaches.
In another effort, the quality of the generated bridge point cloud was evaluated and compared, employing several quality analysis methods. The result of surface deviation analysis indicated millimeter-level of noise which led to a reliable surface representation and 3D model reconstruction. Moreover, the results of the geometric accuracy evaluation indicated an average TLS measurement error of less than 5 mm. However, concerns remained regarding the outlier noise for components located at high altitudes, far away from the scan unit.
In the next following step, the generated point cloud was converted into a 3D CAD model using the slicing approach presented. The result of the deviation analysis proved the soundness of the proposed approach with a majority of deviations being less than 5 mm between the generated 3D CAD model, conventional mesh-based model, and the point cloud. However, the process of transforming TLS data into mesh model takes significantly more time than the proposed method. This time can also vary according to the level of detail required, available computer hardware, available processing/modeling software and their inter-compatibility, as well as the operator involved.
Finally, the constructed 3D CAD model of the bridge forms as the core of the BrIM and non-geometrical data assigned to each component of the model for future asset management planning.
Future research is also recommended for the development of bridge management systems (BMSs) including Artificial Intelligence (AI) [71,72], a decision support system [73], and the Internet of Things (IoT) [74], not only to collect real-time information but also to evaluate and prioritize the tasks. Therein, asset managers may benefit from real-time decisions, recommending strategic plans, and distributing tasks to other sub-team members. Over the last decade, new laser scanning technology has developed a reputation in precise and rapid data collection, making this emerging technology perfectly suited for creating and updating information models such as BrIMs, presented in this research study. However, research is lacking in automated and dynamic methodologies, as well as in AI interpretations for real-time health monitoring and updating the BrIMs.
6. Conclusions
With respect to bridge inspection and management, this study proposed a methodology not only to generate a well-detailed and precise source of information using Terrestrial Laser Scanning (TLS) for bridge inspection but also to develop a TLS-derived Bridge Information Model (BrIM) containing a 3D CAD model associated with element-based non-geometrical data. The proposed BrIM database can be used as a valuable source of information for a variety of purposes including bridge asset management and structural assessment. The proposed TLS-derived BrIM in this research study can not only be beneficial for asset managers and bridge engineers in potential time saving through overcoming the necessity to frequently revisit a bridge in person, but also can ease the document management through substitution of digital models over hard formats. Moreover, linking additional information such as bridge reports, or any other bridge inspection data, with digital replication of a bridg, will lead to a better understanding, and smoother communication of such data being exchanged between the relevant personnel.
An attempt to fulfill these objectives was made by performing a real bridge case study via laser scanning a cable-stayed bridge called the Werrington Bridge, located in Western New South Wales (NSW), Australia. Following this case study, the process to develop a 3D point cloud using TLS was elaborated, the quality of the acquired data was evaluated and compared, and the soundness of the proposed methodology in generating a TLS-derived BrIM was proved. In the case of Werrington Bridge, the comparative results between the TLS-based point cloud and the as-designed CAD models showed millimeter-level errors in geometric accuracy evaluations. Moreover, the deviation analysis showed acceptable agreement between the generated 3D CAD model and the captured point cloud. The constructed 3D model of the Werrington Bridge was used as the core of its BrIM and different non-geometric data were perfectly assigned for future references.
Nonetheless, concerns remain for future research studies regarding the automatic methods for real-time BrIM, updating algorithms using Artificial Intelligence (AI). Moreover, introducing a decision support system to further evaluate the collected information and support asset managers in their judgments is critical.
Author Contributions
Conceptualization, M.M., M.R., V.M., Y.Y. and B.S.; methodology, M.M., M.R. and V.M.; software, M.M., V.M. and Y.Y.; validation, M.M., M.R., V.M., Y.Y.; formal analysis, M.M., V.M., Y.Y.; investigation, M.M., M.R.; resources, M.R. and B.S.; data curation, M.M., V.M., Y.Y.; writing—original draft preparation, M.M.; writing—review and editing, M.M., M.R., V.M., Y.Y. and B.S.; visualization, M.M. and V.M.; supervision, M.M., M.R. and B.S.; project administration, M.M., M.R. and B.S.; funding acquisition, M.R. and B.S. All authors have read and agreed to the published version of the manuscript.
Funding
This research received no external funding.
Institutional Review Board Statement
Not applicable.
Informed Consent Statement
Not applicable.
Data Availability Statement
Upon a reasonable request from the corresponding author.
Acknowledgments
The authors would like to acknowledge the valuable advice of Adam Masters, the striving efforts of Joshua Taylor and the technical supports of Jason Carpenter from BuildingPoint Australia Co. and Transport for NSW (TfNSW), Australia, during this research study.
Conflicts of Interest
The authors declare no conflict of interest.
References
- Shojaeddin, J. Assessing Load Carrying Capacity of Existing Bridges Using SHM Techniques. Ph.D. Thesis, Queensland University of Technology, Queensland, Australia, 2019. [Google Scholar]
- Wan, C.; Zhou, Z.; Li, S.; Ding, Y.; Xu, Z.; Yang, Z.; Xia, Y.; Yin, F. Development of a Bridge Management System Based on the Building Information Modeling Technology. Sustainability 2019, 11, 4583. [Google Scholar] [CrossRef] [Green Version]
- Horgan, R. Fatal Taiwan Bridge Collapse Is Latest Example of Maintenance Failings. Available online: https://www.newcivilengineer.com/latest/fatal-taiwan-bridge-collapse-is-latest-example-of-maintenance-failings-07-10-2019 (accessed on 22 February 2022).
- Calvi, G.M.; Moratti, M.; O’Reilly, G.J.; Scattarreggia, N.; Monteiro, R.; Malomo, D.; Calvi, P.M.; Pinho, R. Once upon a Time in Italy: The Tale of the Morandi Bridge. Struct. Eng. Int. 2019, 29, 198–217. [Google Scholar] [CrossRef]
- Puž, G.; Radić, J.; Tenžera, D. Visual inspection in evaluation of bridge condition. Građevinar 2012, 64, 717. [Google Scholar] [CrossRef]
- Moore, M.; Phares, B.M.; Graybeal, B.; Rolander, D.; Washer, G. Reliability of Visual Inspection for Highway Bridges, Volume I: Final Report; U.S. Department of Transporation, Federal Highway Administration: Washington, DC, USA, 2001. [Google Scholar]
- Dorafshan, S.; Maguire, M. Bridge inspection: Human performance, unmanned aerial systems and automation. J. Civ. Struct. Health Monit. 2018, 8, 443–476. [Google Scholar] [CrossRef] [Green Version]
- Roads and Traffic Authority of New South Wales. Bridge Inspection Procedure Manual. 2007. Available online: https://roads-waterways.transport.nsw.gov.au/business-industry/partners-suppliers/document-types/guides-manuals/bridge-inspection.html (accessed on 22 February 2022).
- Rashidi, M.; Hoshyar, A.N.; Smith, L.; Bijan, S.; Siddique, R. A comprehensive taxonomy for structure and material deficiencies, preventions and remedies of timber bridges. J. Build. Eng. 2021, 34, 101624. [Google Scholar] [CrossRef]
- Rashidi, M.; Ghodrat, M.; Samali, B.; Kendall, B.; Zhang, C. Remedial Modelling of Steel Bridges through Application of Analytical Hierarchy Process (AHP). Appl. Sci. 2017, 7, 168. [Google Scholar] [CrossRef] [Green Version]
- Javidan, M.M.; Kim, J. Fuzzy-based method for efficient seismic performance evaluation of structures with uncertainty. Comput.-Aided Civ. Infrastruct. Eng. 2021, 1–22. [Google Scholar] [CrossRef]
- Gorji Azandariani, M.; Rousta, A.M.; Mohammadi, M.; Rashidi, M.; Abdolmaleki, H. Numerical and analytical study of ultimate capacity of steel plate shear walls with partial plate-column connection (SPSW-PC). Structures 2021, 33, 3066–3080. [Google Scholar] [CrossRef]
- Waheed, U.; Hudson, W.R.; Ralph, H. Public Infrastructure Asset Management, 2nd ed.; McGraw-Hill Education: New York, NY, USA, 2013. [Google Scholar]
- Sabrie, S. Sensors Handbook, 2nd ed.; McGraw-Hill Education: New York, NY, USA, 2010. [Google Scholar]
- O’Brien, E.; Carey, C.; Keenahan, J. Bridge damage detection using ambient traffic and moving force identification. Struct. Control. Health Monit. 2015, 22, 1396–1407. [Google Scholar] [CrossRef] [Green Version]
- Azim, M.R.; Gül, M. Damage Detection of Steel-Truss Railway Bridges Using Operational Vibration Data. J. Struct. Eng. 2020, 146, 04020008. [Google Scholar] [CrossRef]
- Pourzeynali, S.; Zhu, X.; Ghari Zadeh, A.; Rashidi, M.; Samali, B. Comprehensive Study of Moving Load Identification on Bridge Structures Using the Explicit Form of Newmark-β Method: Numerical and Experimental Studies. Remote Sens. 2021, 13, 2291. [Google Scholar] [CrossRef]
- Yu, Y.; Rashidi, M.; Samali, B.; Mohammadi, M.; Nguyen, T.N.; Zhou, X. Crack detection of concrete structures using deep convolutional neural networks optimized by enhanced chicken swarm algorithm. Struct. Health Monit. 2022. [Google Scholar] [CrossRef]
- Patch, G. Chapter 11—Software Design and Development. In Developing and Managing Embedded Systems and Products; Fowler, K.R., Silver, C.L., Eds.; Newnes: Oxford, UK, 2015; pp. 469–514. [Google Scholar]
- Nicolle, C.; Cruz, C. Semantic Building Information Model and Multimedia for Facility Management. In International Conference on Web Information Systems and Technologies; Springer: Berlin/Heidelberg, Germany, 2011; pp. 14–29. [Google Scholar]
- Chan, B.; Guan, H.; Hou, L.; Jo, J.; Blumenstein, M.; Wang, J. Defining a conceptual framework for the integration of modelling and advanced imaging for improving the reliability and efficiency of bridge assessments. J. Civil. Struct. Health Monit. 2016, 6, 703–714. [Google Scholar] [CrossRef] [Green Version]
- McGuire, B.; Atadero, R.; Clevenger, C.; Ozbek, M. Bridge Information Modeling for Inspection and Evaluation. J. Bridge Eng. 2016, 21, 04015076. [Google Scholar] [CrossRef]
- Barazzetti, L. Parametric as-built model generation of complex shapes from point clouds. Adv. Eng. Inform. 2016, 30, 298–311. [Google Scholar] [CrossRef]
- Brilakis, I.; Lourakis, M.; Sacks, R.; Savarese, S.; Christodoulou, S.; Teizer, J.; Makhmalbaf, A. Toward automated generation of parametric BIMs based on hybrid video and laser scanning data. Adv. Eng. Inform. 2010, 24, 456–465. [Google Scholar] [CrossRef]
- Rashidi, M.; Mohammadi, M.; Sadeghlou Kivi, S.; Abdolvand, M.M.; Truong-Hong, L.; Samali, B. A Decade of Modern Bridge Monitoring Using Terrestrial Laser Scanning: Review and Future Directions. Remote Sens. 2020, 12, 3796. [Google Scholar] [CrossRef]
- Gyetvai, N.; Truong-Hong, L.; Laefer, D.F. Laser Scan-Based Structural Assessment of Wrought Iron Bridges: Guinness Bridge, Ireland. Proc. Inst. Civ. Eng.-Eng. Hist. Herit. 2018, 171, 76–89. [Google Scholar] [CrossRef] [Green Version]
- Lubowiecka, I.; Armesto, J.; Arias, P.; Lorenzo, H. Historic bridge modelling using laser scanning, ground penetrating radar and finite element methods in the context of structural dynamics. Eng. Struct. 2009, 31, 2667–2676. [Google Scholar] [CrossRef]
- Wilford, W. Introduction to Mid-Range Terrestrial Laser Scanning. APT Bull. J. Preserv. Technol. 2020, 51, 1–46. [Google Scholar]
- Spring, A.P. History of Laser Scanning, Part 2: The Later Phase of Industrial and Heritage Applications. Photogramm. Eng. Remote Sens. 2020, 86, 479–501. [Google Scholar] [CrossRef]
- Tang, P.; Akinci, B.; Garrett, J. Laser Scanning for Bridge Inspection and Management. In Proceedings of the IABSE Symposium: Improving Infrastructure Worldwide, Weimar, Germany, 19–21 September 2007; pp. 17–24. [Google Scholar]
- Miśkiewicz, M.; Daszkiewicz, K.; Lachowicz, J.; Tysiac, P.; Jaskula, P.; Wilde, K. Nondestructive methods complemented by FEM calculations in diagnostics of cracks in bridge approach pavement. Autom. Constr. 2021, 128, 103753. [Google Scholar] [CrossRef]
- Artese, S.; Zinno, R. TLS for Dynamic Measurement of the Elastic Line of Bridges. Appl. Sci. 2020, 10, 1182. [Google Scholar] [CrossRef] [Green Version]
- Chen, S. Laser Scanning Technology for Bridge Monitoring; IntechOpen: London, UK, 2012. [Google Scholar]
- Stull, C.J.; Earls, C. A rapid assessment methodology for bridges damaged by truck strikes. Steel Compos. Struct. 2009, 9, 223–237. [Google Scholar] [CrossRef]
- Pérez, J.P.C.; De Sanjosé Blasco, J.J.; Atkinson, A.D.J.; Del Río Pérez, L.M. Assessment of the Structural Integrity of the Roman Bridge of Alcántara (Spain) Using TLS and GPR. Remote Sens. 2018, 10, 387. [Google Scholar] [CrossRef] [Green Version]
- Arbi, A.; Ide, K. The application of terrestrial laser scanner surveys for detailed inspection of bridges. In Proceedings of the 7th Australian Small Bridges Conference, Melbourne, Australia, 23–24 November 2015. [Google Scholar]
- Gawronek, P.; Makuch, M.; Mitka, B.; Gargula, T. Measurements of the Vertical Displacements of a Railway Bridge Using TLS Technology in the Context of the Upgrade of the Polish Railway Transport. Sensors 2019, 19, 4275. [Google Scholar] [CrossRef] [Green Version]
- Mill, T.; Ellmann, A.; Kiisa, M.; Idnurm, J.; Idnurm, S.; Horemuz, M.; Aavik, A. Geodetic monitoring of bridge deformations occurring during static load testing. Balt. J. Road Bridge Eng. 2015, 10, 17–27. [Google Scholar] [CrossRef] [Green Version]
- Mohammadi, M.; Rashidi, M.; Mousavi, V.; Karami, A.; Yu, Y.; Samali, B. Quality Evaluation of Digital Twins Generated Based on UAV Photogrammetry and TLS: Bridge Case Study. Remote Sens. 2021, 13, 3499. [Google Scholar] [CrossRef]
- Mohammadi, M.; Rashidi, M.; Mousavi, V.; Karami, A.; Yu, Y.; Samali, B. Case study on accuracy comparison of digital twins developed for a heritage bridge via UAV photogrammetry and terrestrial laser scanning. In Proceedings of the 10th International Conference on Structural Health Monitoring of Intelligent Infrastructure (SHMII 10), Porto, Portugal, 30 June–2 July 2021. [Google Scholar]
- Kwiatkowski, J.; Anigacz, W.; Beben, D. A Case Study on the Noncontact Inventory of the Oldest European Cast-iron Bridge Using Terrestrial Laser Scanning and Photogrammetric Techniques. Remote Sens. 2020, 12, 2745. [Google Scholar] [CrossRef]
- Gawronek, P.; Makuch, M. TLS Measurement during Static Load Testing of a Railway Bridge. ISPRS Int. J. Geo-Inf. 2019, 8, 44. [Google Scholar] [CrossRef] [Green Version]
- Tang, P.; Huber, D.; Akinci, B.; Lipman, R.; Lytle, A. Automatic reconstruction of as-built building information models from laser-scanned point clouds: A review of related techniques. Autom. Constr. 2010, 19, 829–843. [Google Scholar] [CrossRef]
- Tang, P.; Akinci, B. Automatic execution of workflows on laser-scanned data for extracting bridge surveying goals. Adv. Eng. Inform. 2012, 26, 889–903. [Google Scholar] [CrossRef]
- Tang, P.; Akinci, B. Formalization of workflows for extracting bridge surveying goals from laser-scanned data. Autom. Constr. 2012, 22, 306–319. [Google Scholar] [CrossRef]
- Kasireddy, V.; Akinci, B. Challenges in generation of as-is bridge information model: A case study. In Proceedings of the 32nd International Symposium on Automation and Robotics in Construction and Mining: Connected to the Future, Oulu, Finland, 15–18 June 2015. [Google Scholar]
- Hinks, T.; Carr, H.; Truong-Hong, L.; Laefer, D.F. Point Cloud Data Conversion into Solid Models via Point-Based Voxelization. J. Surv. Eng. 2013, 139, 72–83. [Google Scholar] [CrossRef] [Green Version]
- Bitelli, G.; Castellazzi, G.; D’Altri, A.M.; De Miranda, S.; Lambertini, A.; Selvaggi, I. Automated voxel model from point clouds for structural analysis of cultural heritage. ISPRS 2016, 41, 191–197. [Google Scholar]
- Castellazzi, G.; D’Altri, A.M.; de Miranda, S.; Ubertini, F. An innovative numerical modeling strategy for the structural analysis of historical monumental buildings. Eng. Struct. 2017, 132, 229–248. [Google Scholar] [CrossRef]
- Conde-Carnero, B.; Riveiro, B.; Arias, P.; Caamaño, J.C. Exploitation of geometric data provided by laser scanning to create FEM structural models of bridges. J. Perform. Constr. Facil. 2016, 30, 04015053. [Google Scholar] [CrossRef]
- Mehranfar, M.; Arefi, H.; Alidoost, F. Knowledge-based 3D reconstruction of bridge structures using UAV-based photogrammetric point cloud. J. Appl. Remote Sens. 2021, 15, 044503. [Google Scholar] [CrossRef]
- Truong-Hong, L.; Laefer, D.F. Laser Scanning for Bridge Inspection. In Laser Scanning: An Emerging Technology in Structural Engineering; CRC Press: Boca Raton, FL, USA, 2019; pp. 189–214. [Google Scholar]
- Heidari Mozaffar, M.; Varshosaz, M. Optimal Placement of a Terrestrial Laser Scanner with an Emphasis on Reducing Occlusions. Photogramm. Rec. 2016, 31, 374–393. [Google Scholar] [CrossRef]
- Song, M.; Shen, Z.; Tang, P. Data Quality-oriented 3D Laser Scan Planning. In Construction Research Congress 2014: Construction in a Global Network; American Society of Civil Engineers: Reston, VA, USA, 2014; pp. 984–993. [Google Scholar]
- Mahmood, S.; Majid, Z.; Idris, K.M. Terrestrial LiDAR sensor modeling towards optimal scan location and spatial density planning for 3D surveying. Appl. Geomat. 2020, 12, 467–480. [Google Scholar] [CrossRef]
- Biswas, H.K.; Bosché, F.; Sun, M. Planning for Scanning Using Building Information Models: A Novel Approach with Occlusion Handling. In Proceedings of the 32nd International Symposium on Automation and Robotics in Construction and Mining (ISARC 2015), Oulu, Finland, 15–18 June 2015; pp. 1–8. [Google Scholar]
- Jia, F.; Lichti, D.D. A Model-Based Design System for Terrestrial Laser Scanning Networks in Complex Sites. Remote Sens. 2019, 11, 1749. [Google Scholar] [CrossRef] [Green Version]
- Rebolj, D.; Pučko, Z.; Babič, N.Č.; Bizjak, M.; Mongus, D. Point cloud quality requirements for Scan-vs-BIM based automated construction progress monitoring. Autom. Constr. 2017, 84, 323–334. [Google Scholar] [CrossRef]
- Dai, F.; Rashidi, A.; Brilakis, I.; Vela, P. Comparison of Image-Based and Time-of-Flight-Based Technologies for Three-Dimensional Reconstruction of Infrastructure. J. Constr. Eng. Manag. 2013, 139, 69–79. [Google Scholar] [CrossRef]
- Genechten, B.V. Theory and Practice on Terrestrial Laser Scanning: Training Material Based on Practical Applications; Universidad Politecnica De Valencia: Valencia, Spain, 2008. [Google Scholar]
- Western Sydney University. Week 13: The Werrington South Site. Available online: https://www.westernsydney.edu.au/uws25/25_year_history/25_years_in_25_weeks/blog_posts/week_13 (accessed on 22 February 2022).
- Yang, R.; Meng, X.; Xiang, Z.; Li, Y.; You, Y.; Zeng, H. Establishment of a New Quantitative Evaluation Model of the Targets’ Geometry Distribution for Terrestrial Laser Scanning. Sensors 2020, 20, 555. [Google Scholar] [CrossRef] [Green Version]
- Zoller + Fröhlich GmbH. Z+F IMAGER® 5016, 3D Laser Scanner. Available online: https://www.zofre.de/en/laser-scanners/3d-laser-scanner/z-f-imagerr-5016 (accessed on 22 February 2022).
- Zoller + Fröhlich GmbH. Z+F LaserControl® Scout Manual; Zoller + Fröhlich GmbH Company: Wangen, Germany, 2019; Volume 9.1. [Google Scholar]
- Besl, P.J.; McKay, N.D. A method for registration of 3-D shapes. IEEE Trans. Pattern Anal. Mach. Intell. 1992, 14, 239–256. [Google Scholar] [CrossRef]
- Verein Deutscher Ingenieure and Verband Der Elektrotechnik. VDI/VDE 2634 BLATT 3, Optical 3D-Measuring Systems—Multiple View Systems Based on Area Scanning; VDI: Düsseldorf, Germany, 2008. [Google Scholar]
- Mousavi, V.; Khosravi, M.; Ahmadi, M.; Noori, N.; Haghshenas, S.; Hosseininaveh, A.; Varshosaz, M. The performance evaluation of multi-image 3D reconstruction software with different sensors. Measurement 2018, 120, 1–10. [Google Scholar] [CrossRef]
- GOM Gmbh Company. Gom Inspect SUITE Software; Braunschweig, Germany, 2020. Available online: https://www.gom.com/en/products/gom-suite/gom-inspect-pro?gclid=EAIaIQobChMI_43d-Z3f8gIVSteWCh2ltQ9MEAAYAyAAEgKGd_D_BwE (accessed on 22 February 2022).
- Trimble Solutions Corporation. Tekla Structures Software. Available online: https://www.tekla.com/products/tekla-structures (accessed on 22 February 2022).
- Koch, C.; Firmenich, B. An approach to distributed building modeling on the basis of versions and changes. Adv. Eng. Inform. 2011, 25, 297–310. [Google Scholar] [CrossRef]
- Yu, Y.; Rashidi, M.; Samali, B.; Mohammadi, M.; Nguyen, A. Computer vision-based classification of cracks on concrete bridges using machine learning techniques. In Proceedings of the the 10th International Conference on Structural Health Monitoring of Intelligent Infrastructure (SHMII 10), Porto, Portugal, 30 June–2 July 2021. [Google Scholar]
- Liu, J.; Mohammadi, M.; Zhan, Y.; Zheng, P.; Rashidi, M.; Mehrabi, P. Utilizing Artificial Intelligence to Predict the Superplasticizer Demand of Self-Consolidating Concrete Incorporating Pumice, Slag, and Fly Ash Powders. Materials 2021, 14, 6792. [Google Scholar] [CrossRef]
- Rashidi, M.; Samali, B.; Sharafi, P. A new model for bridge management: Part B: Decision support system for remediation planning. Aust. J. Civ. Eng. 2016, 14, 46–53. [Google Scholar] [CrossRef] [Green Version]
- Zinno, R.; Artese, S.; Clausi, G.; Magarò, F.; Meduri, S.; Miceli, A.; Venneri, A. Structural Health Monitoring (SHM). In The Internet of Things for Smart Urban Ecosystems; Cicirelli, F., Guerrieri, A., Mastroianni, C., Spezzano, G., Vinci, A., Eds.; Springer International Publishing: Cham, Switzerland, 2019; pp. 225–249. [Google Scholar]
Figure 1.
TLS-derived BrIM methodology workflow.

Figure 2.
Conceptual framework for data integration and BrIM development.
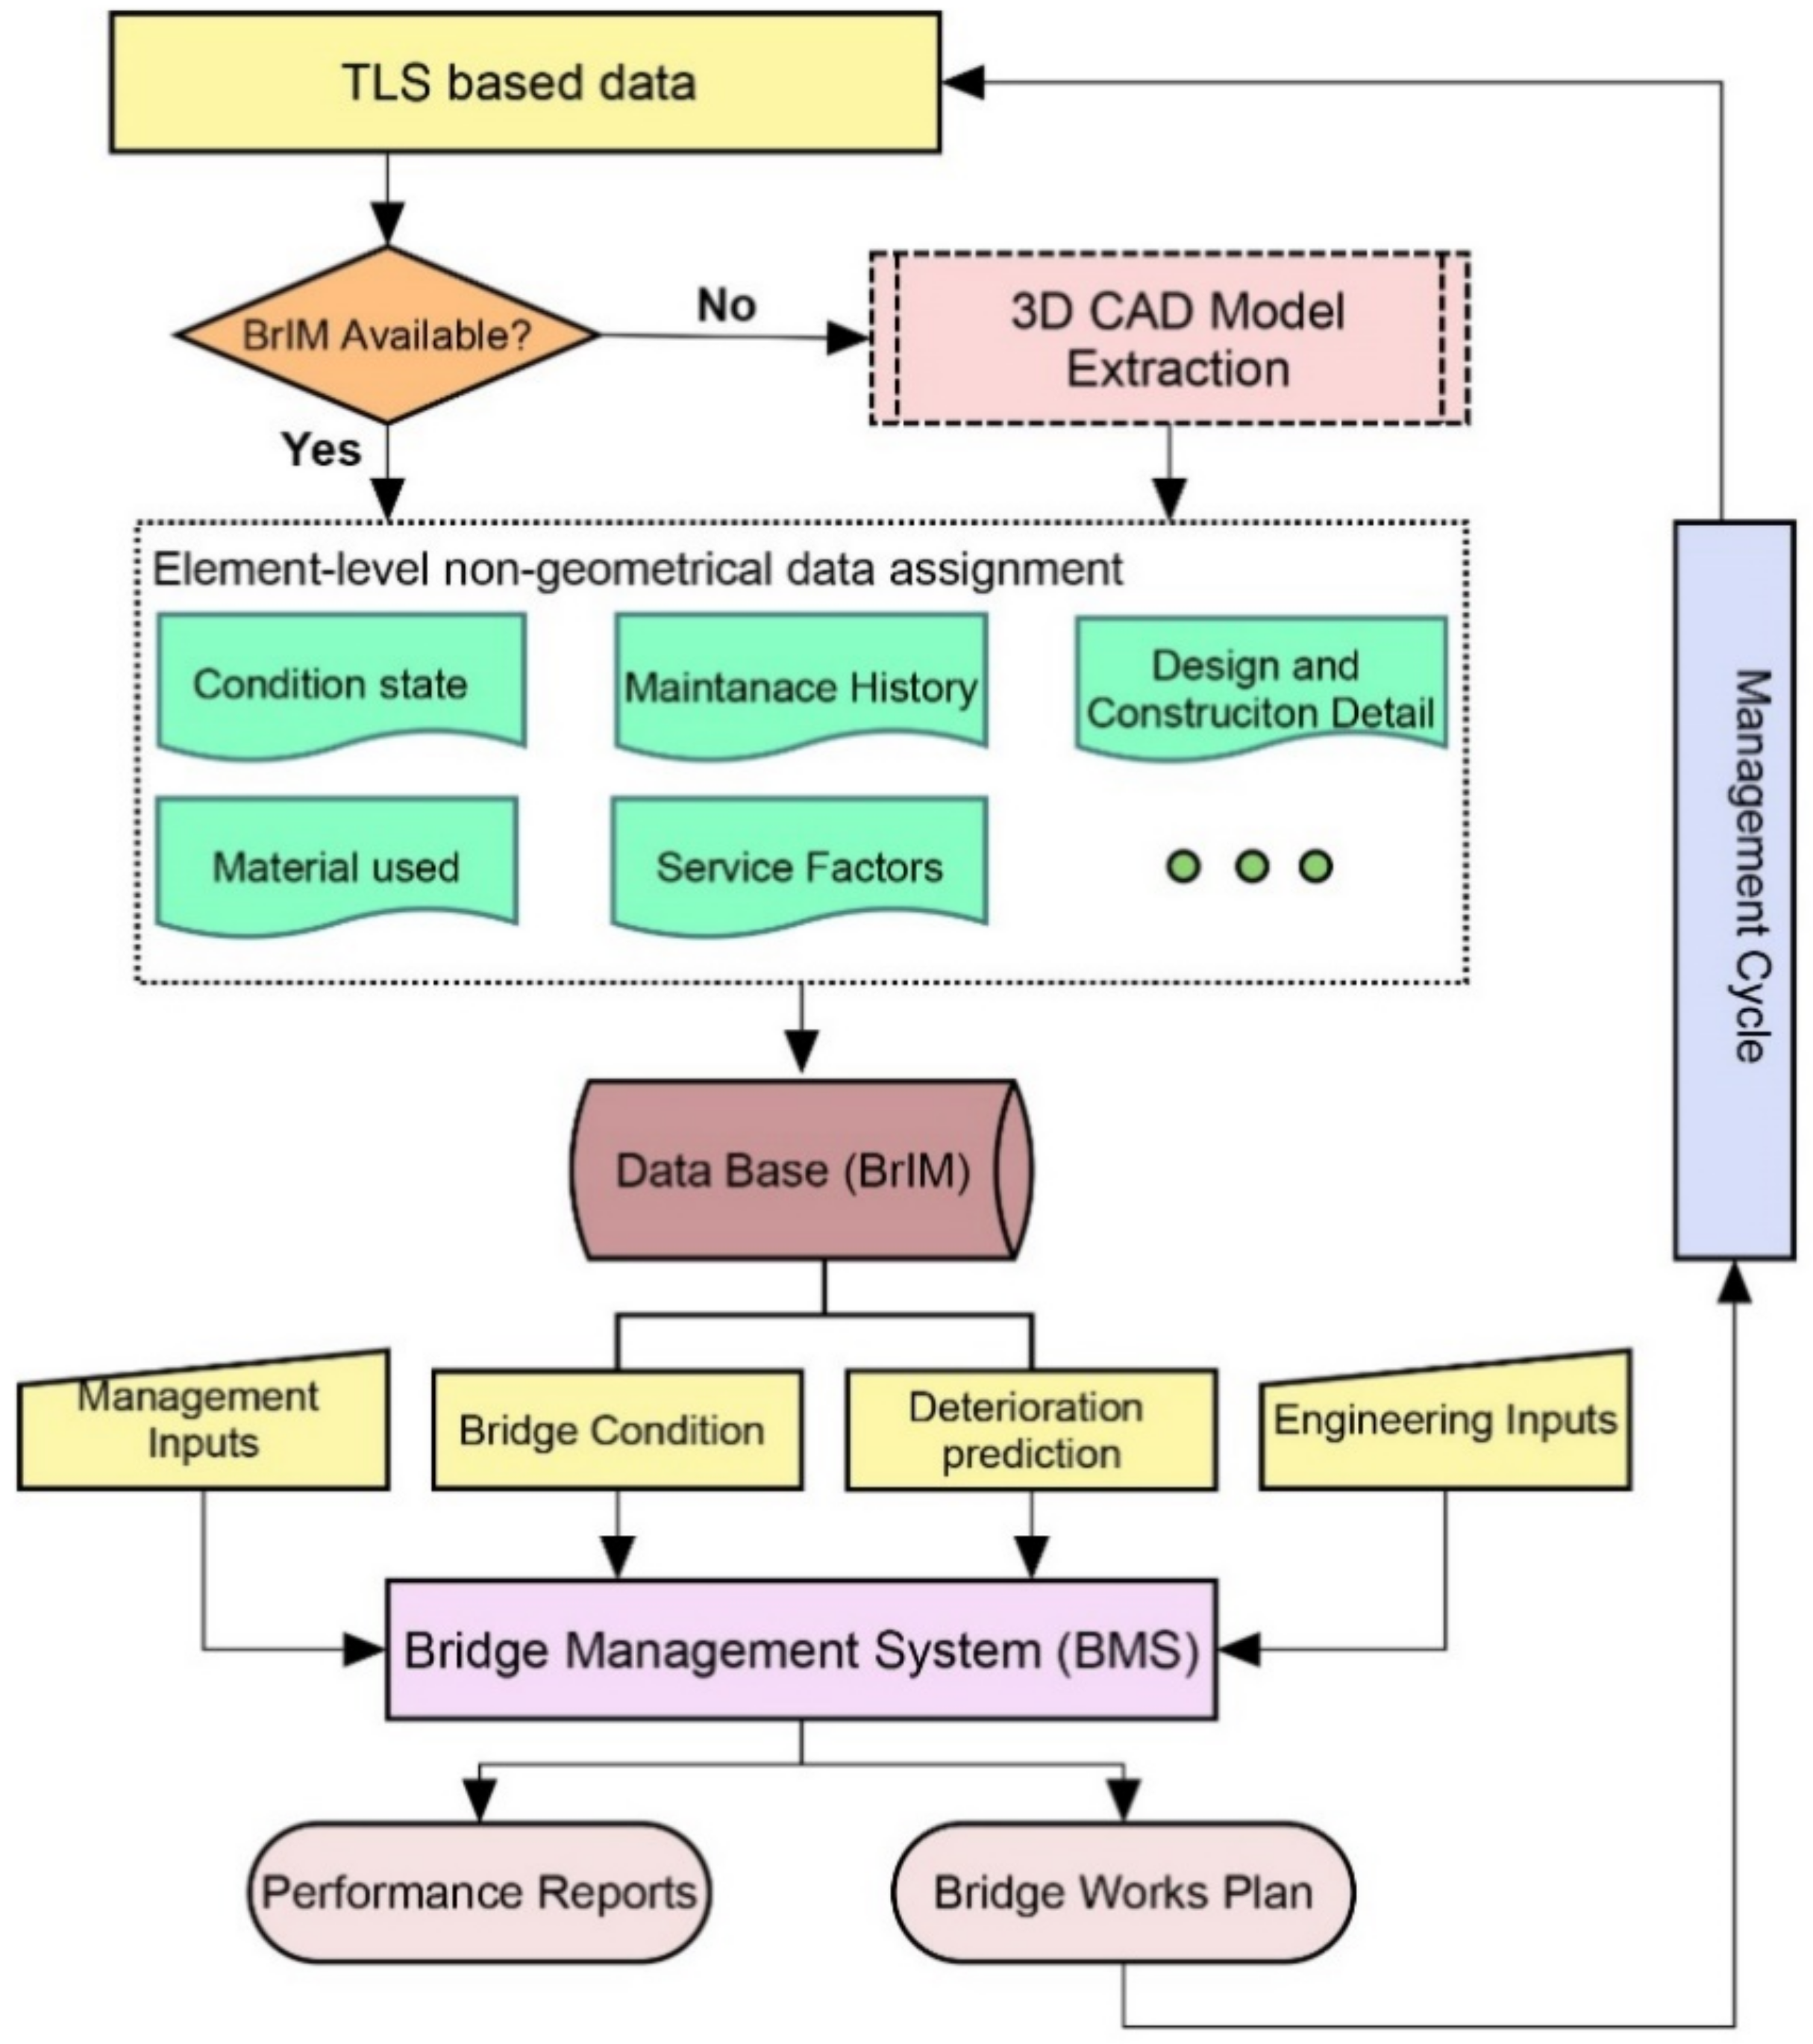
Figure 3.
Werrington Bridge: (a) Bridge satellite view, (b) Bridge status in 2021.
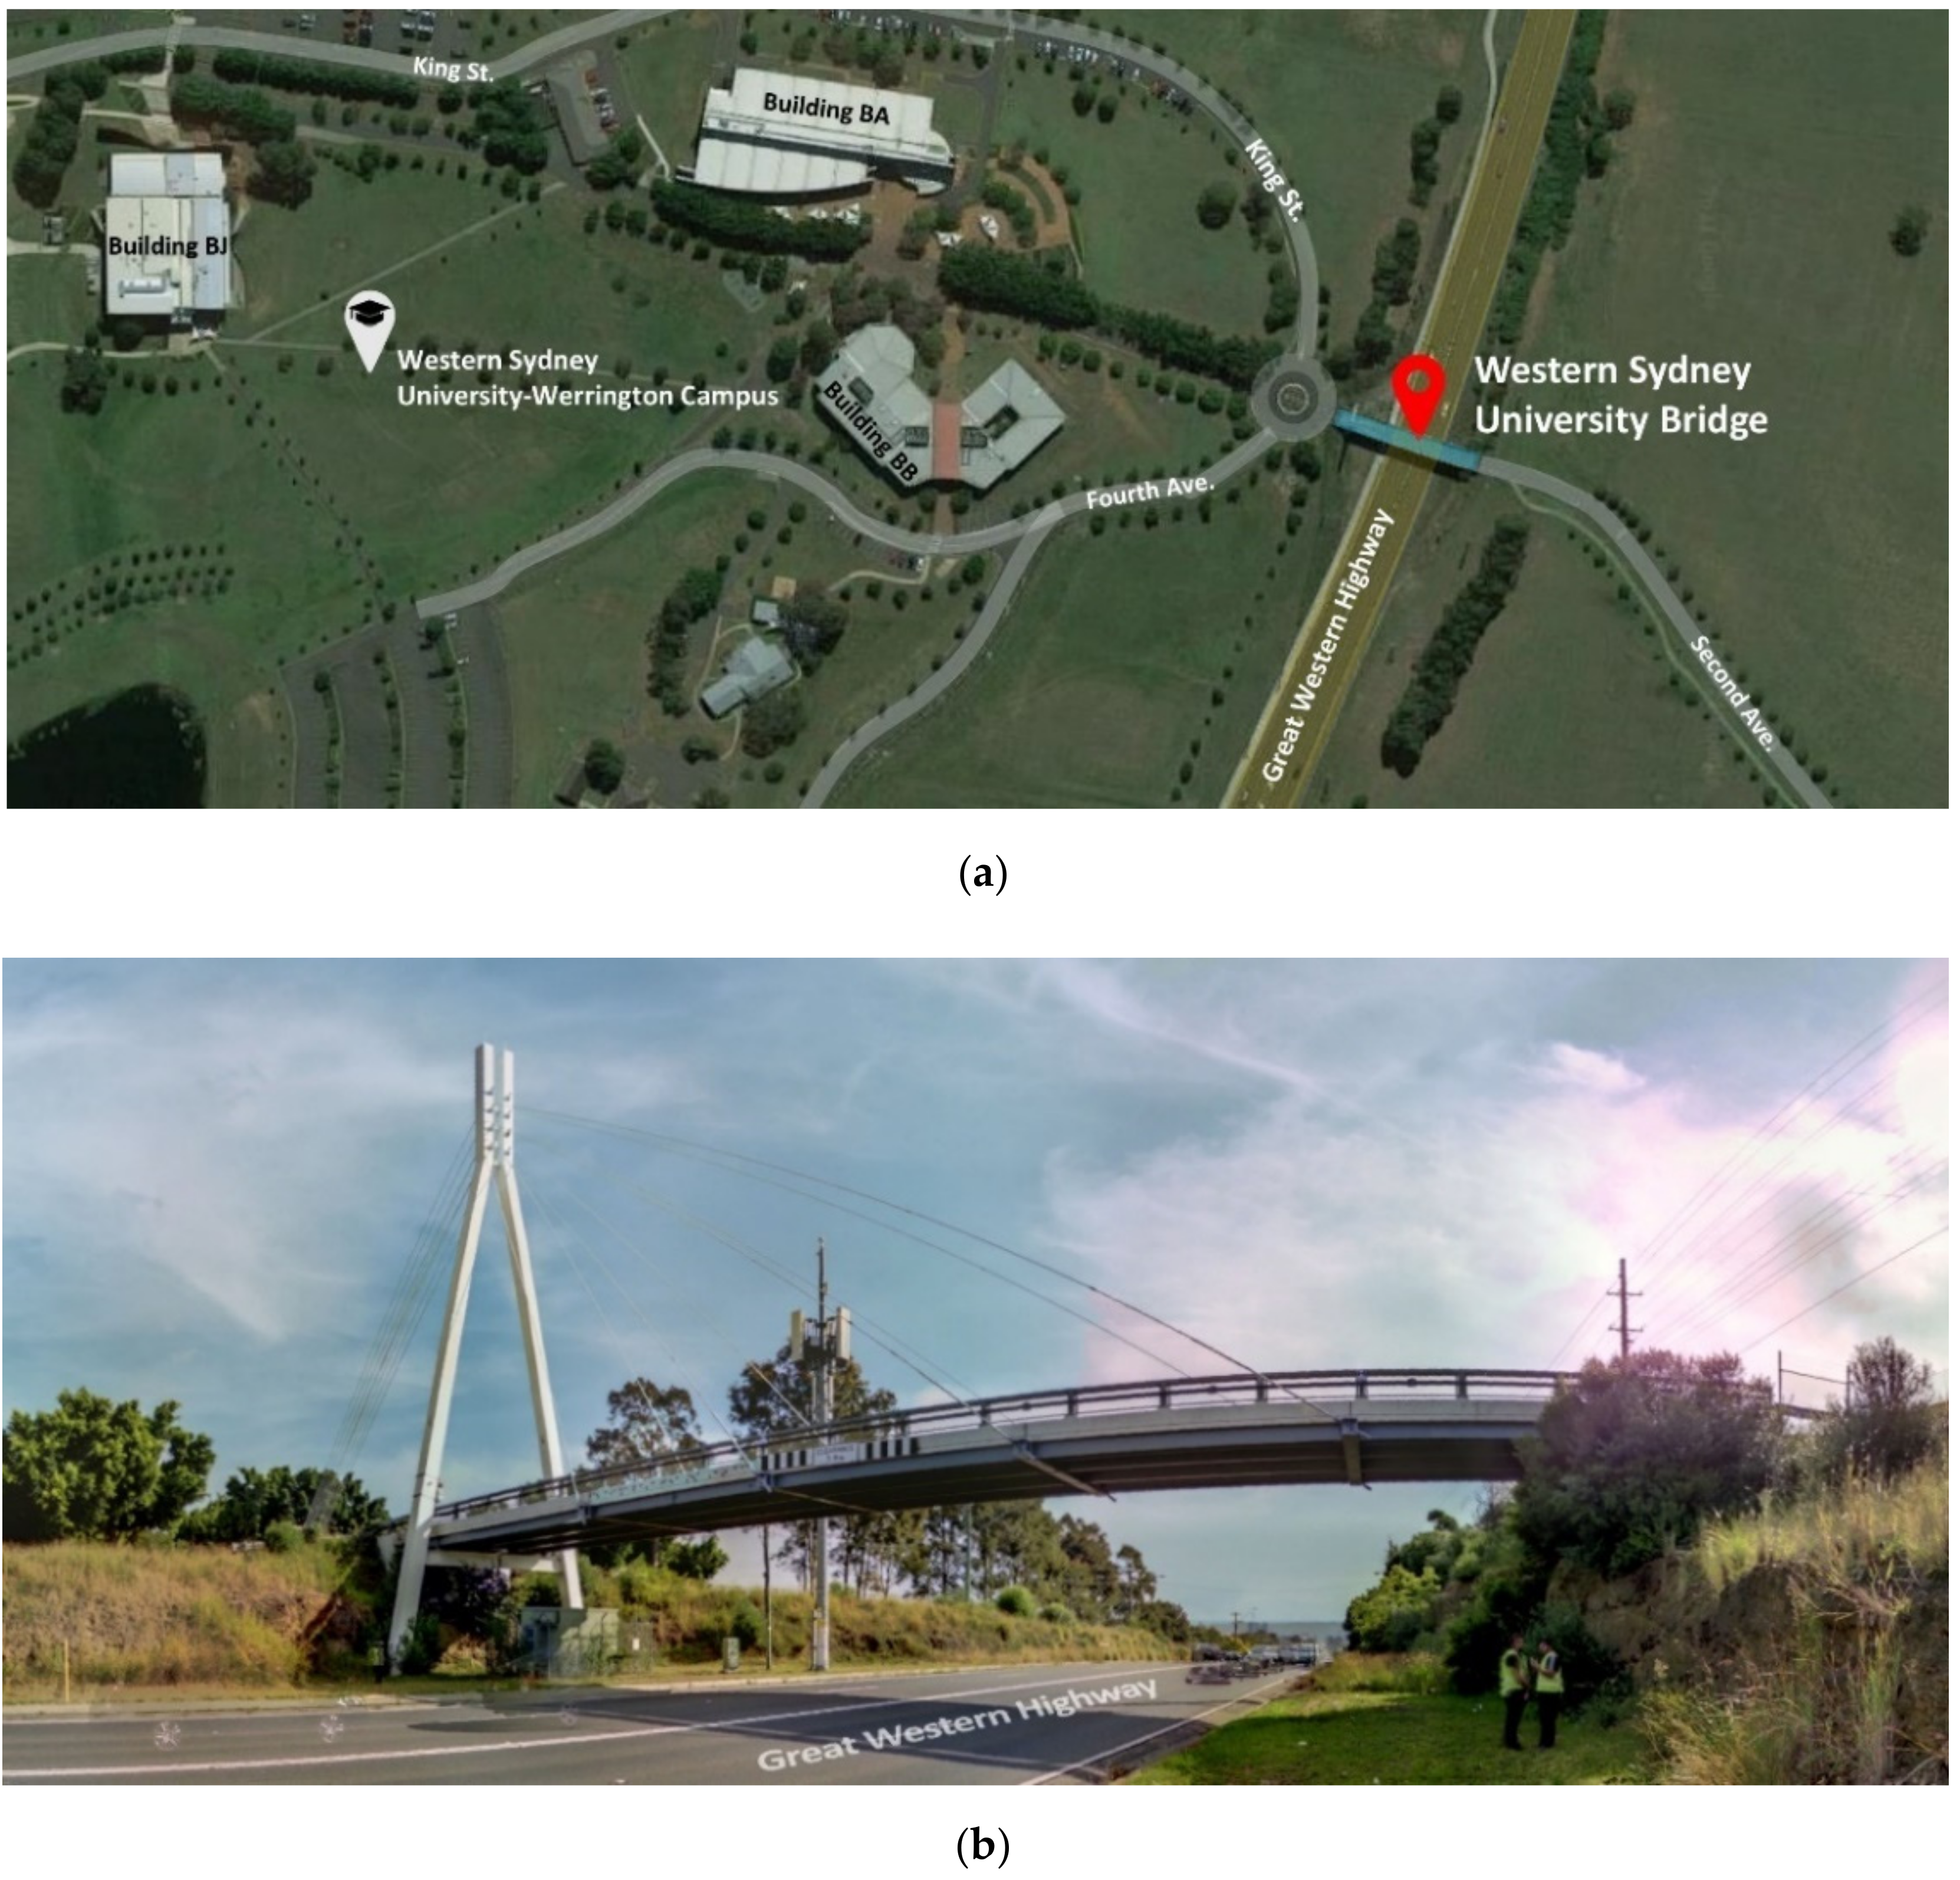
Figure 4.
Werrington bridge scan plan.

Figure 5.
Laser scanning of Werrington bridge.
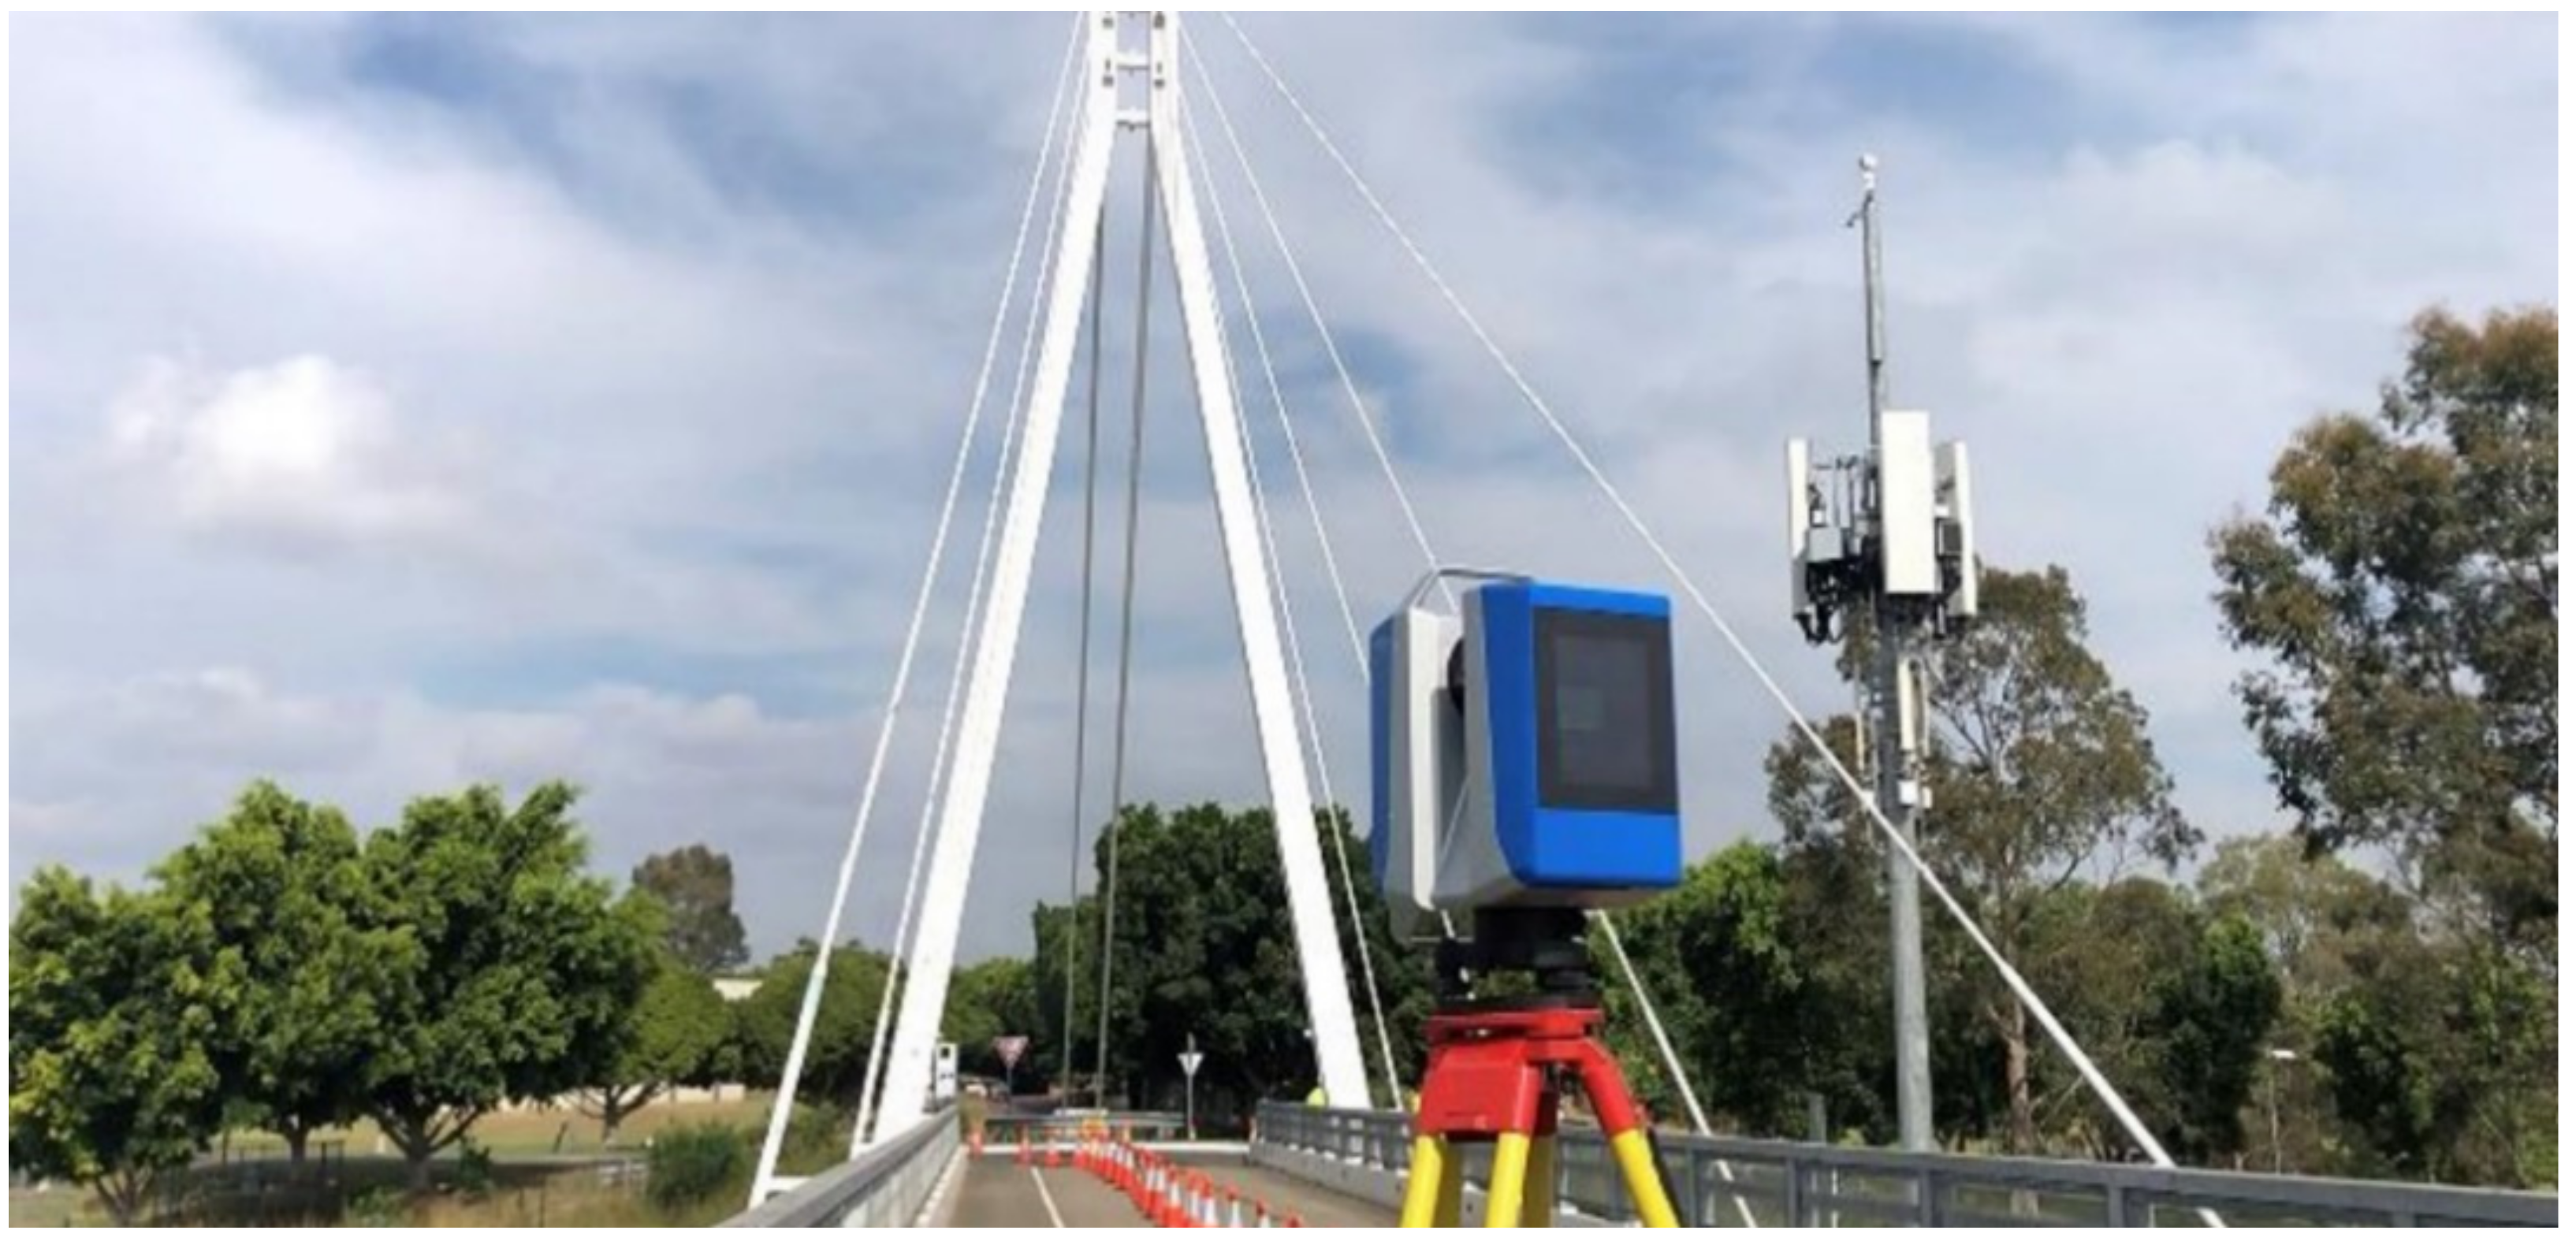
Figure 6.
Generated point cloud of Werrington bridge.
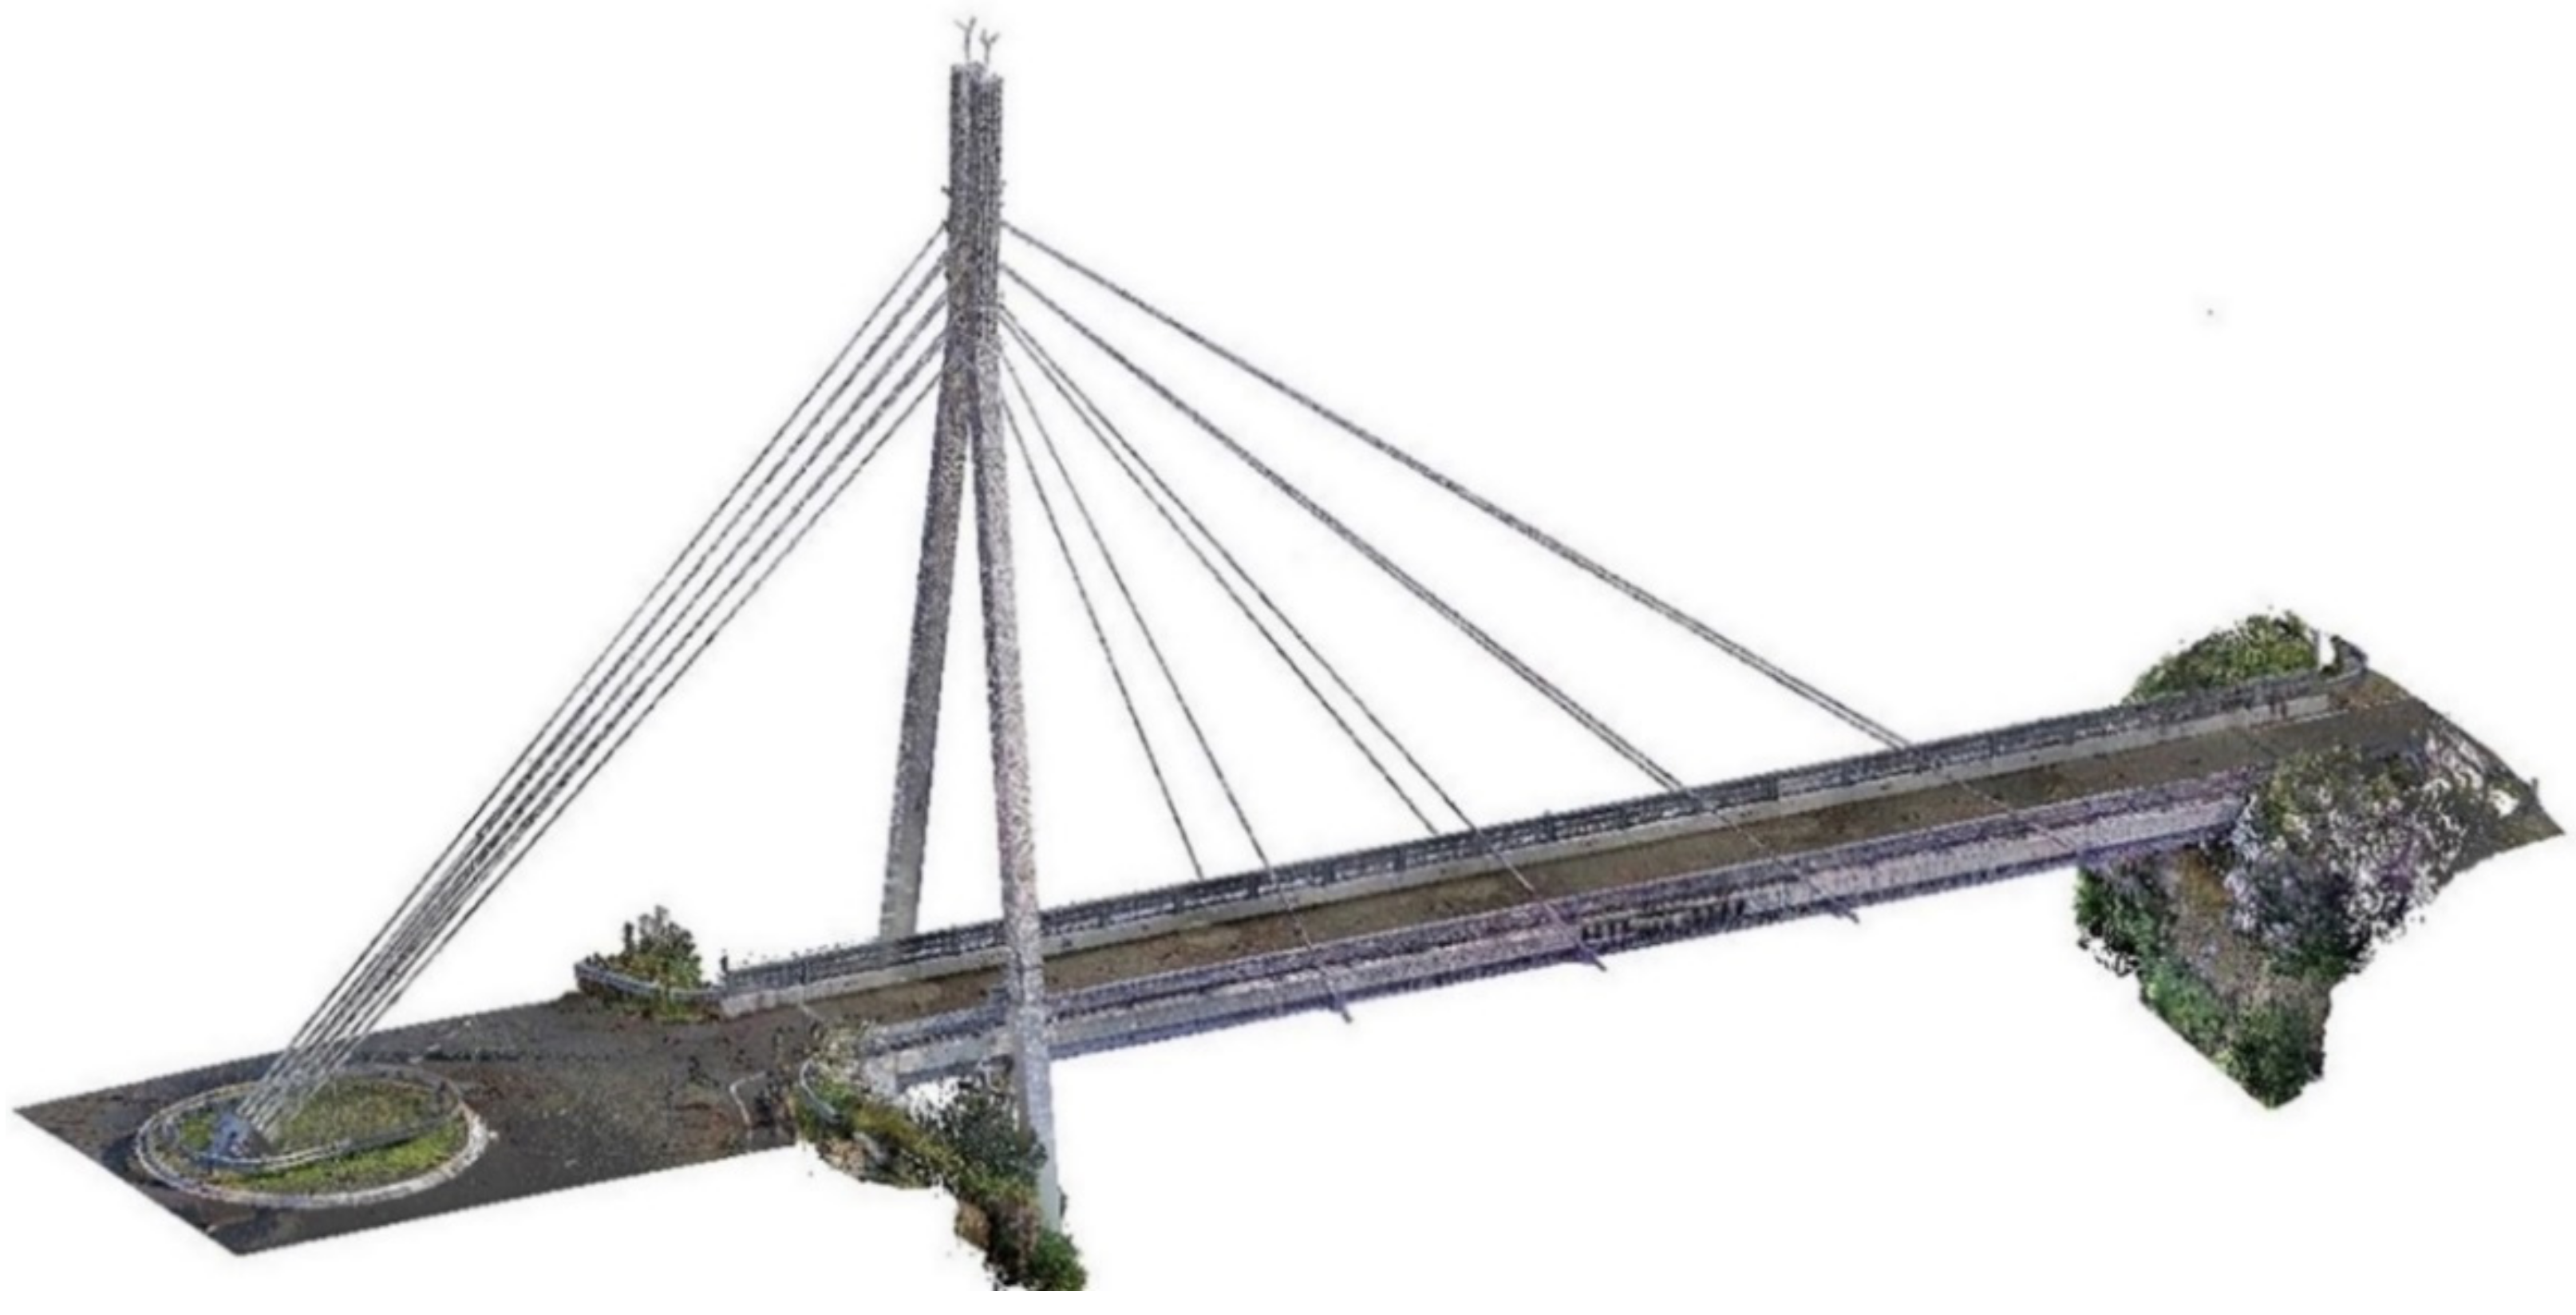
Figure 7.
Intended surveying objects and bridge components: (a) Selected bridge components and parameters, (b) Bridge top view and cross-sections.
Figure 7.
Intended surveying objects and bridge components: (a) Selected bridge components and parameters, (b) Bridge top view and cross-sections.
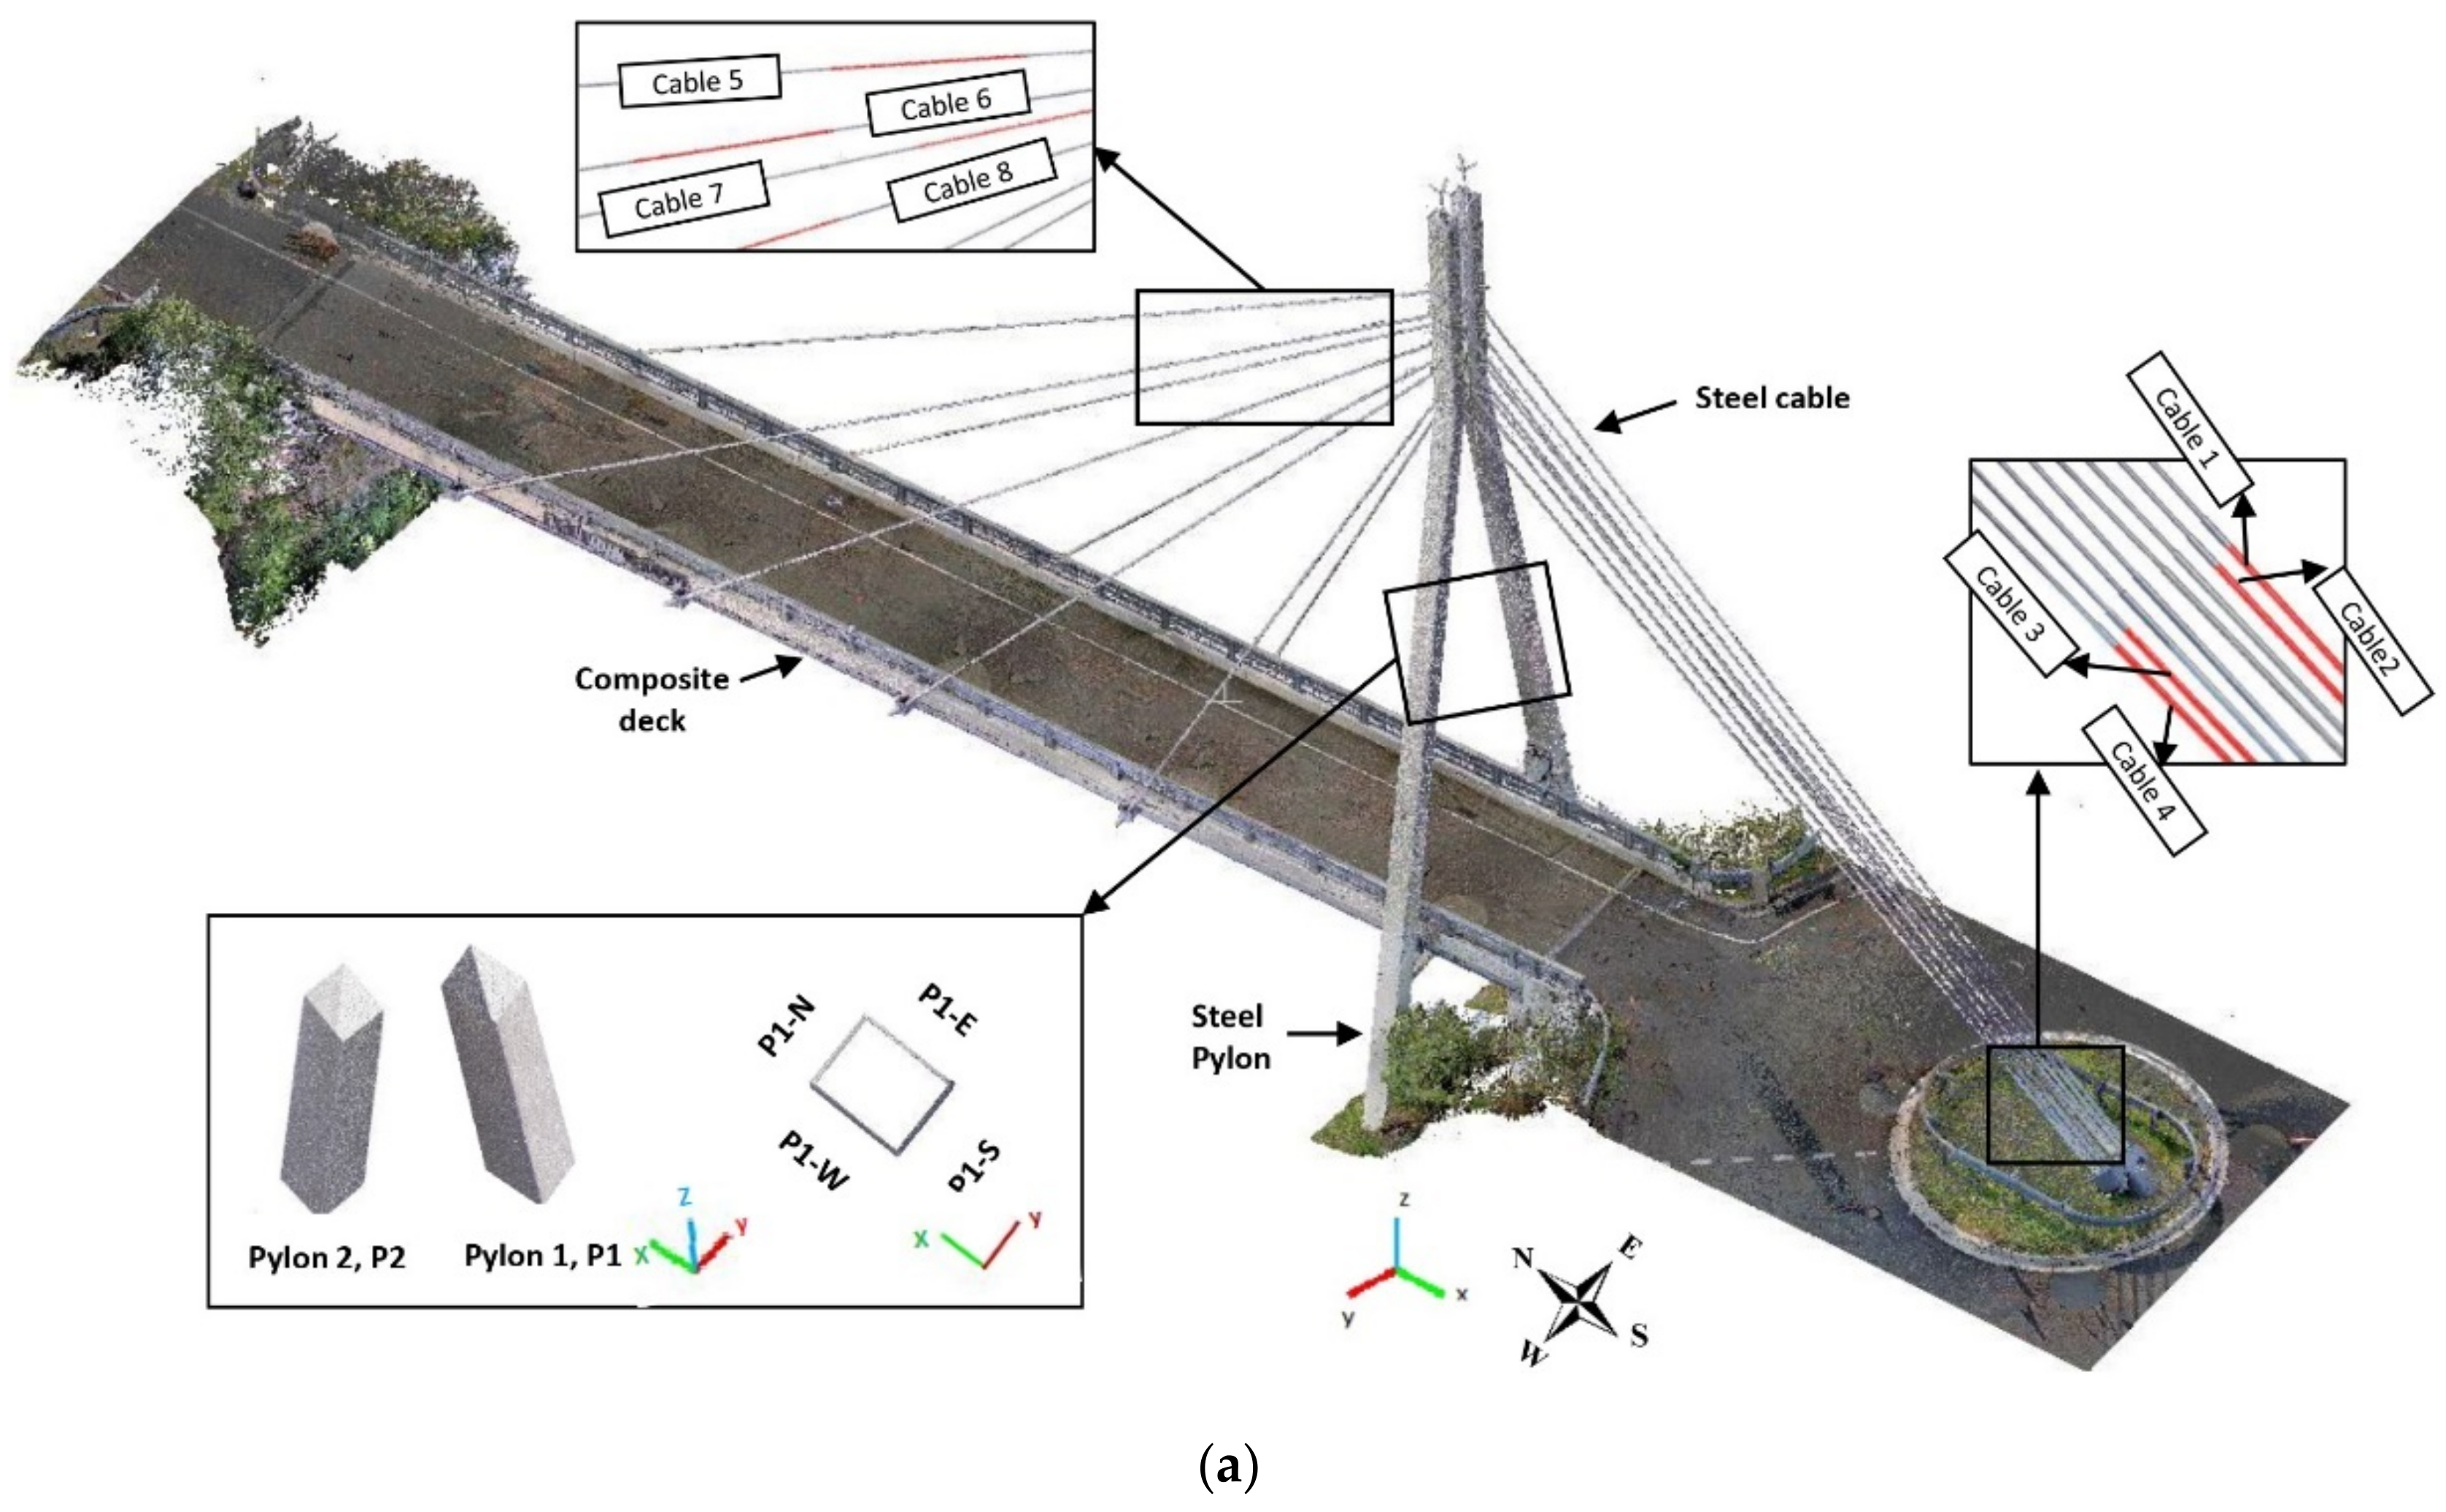
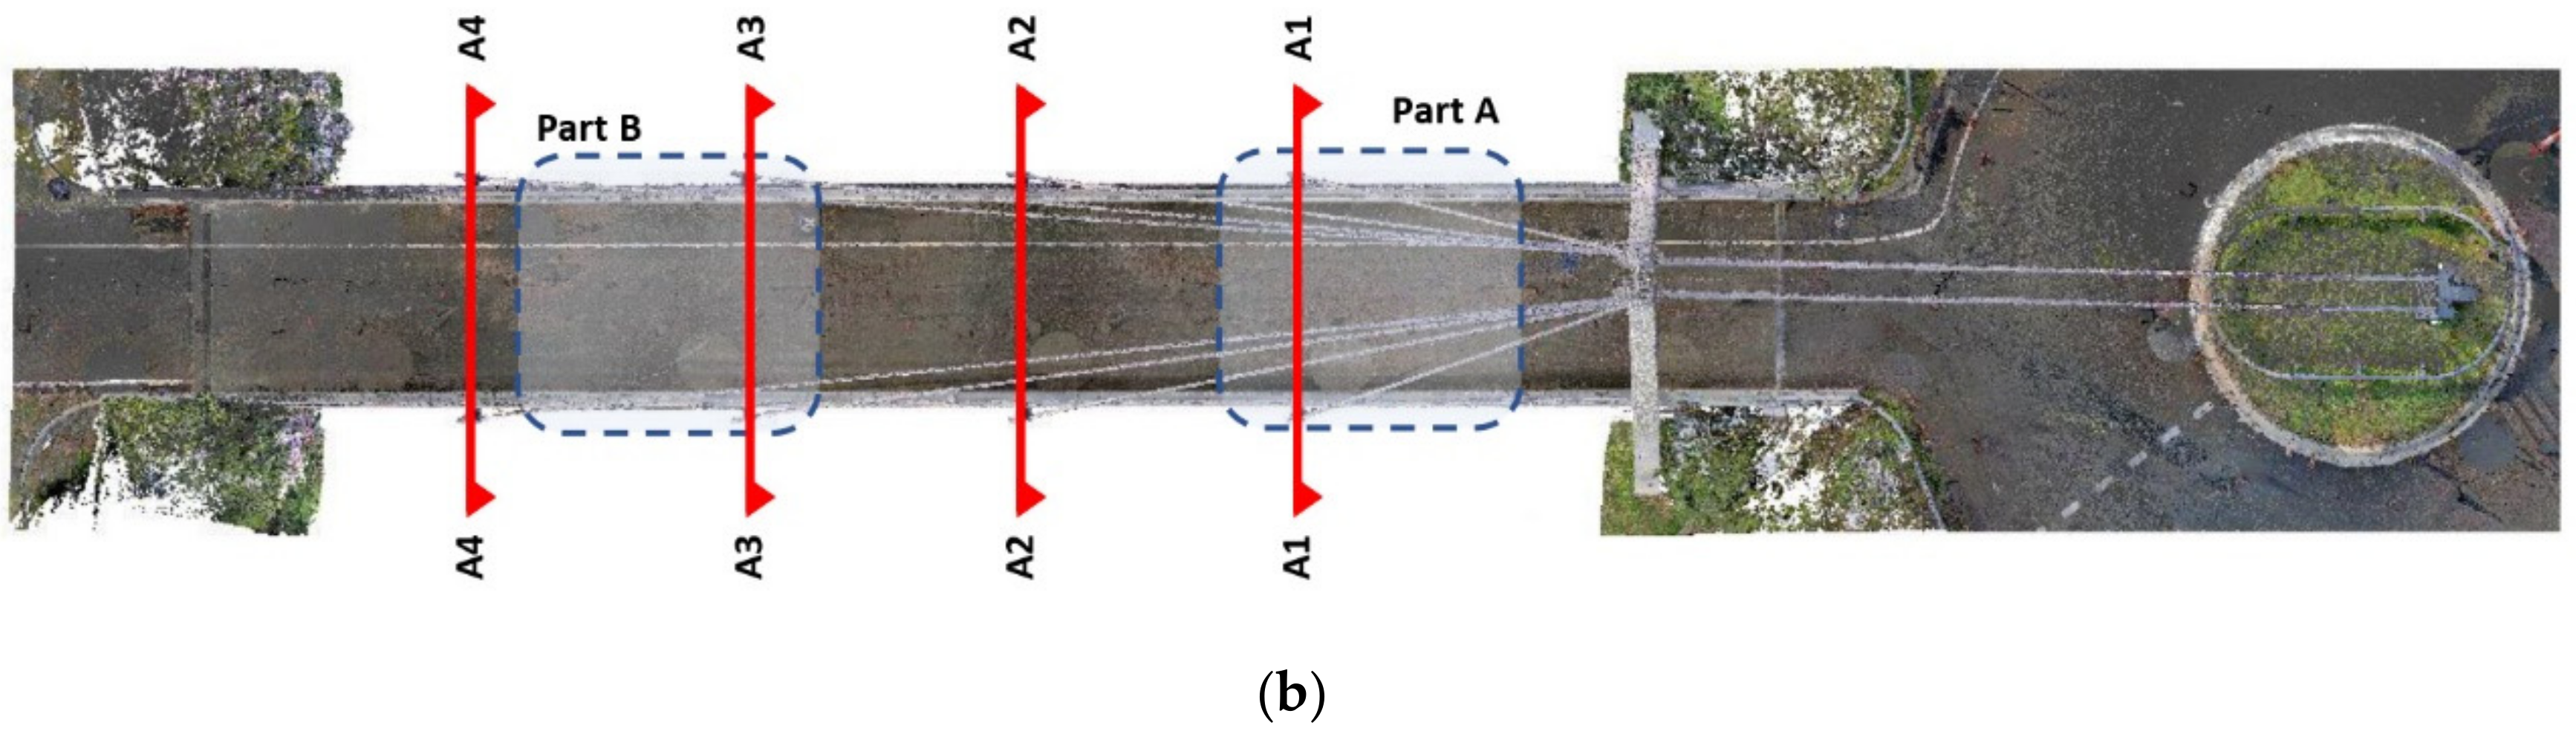
Figure 8.
Geometrical parameters for distance measurement: (a) extracted cross-sectional profile of the bridge, (b) As-designed CAD drawing, Unit: mm.
Figure 8.
Geometrical parameters for distance measurement: (a) extracted cross-sectional profile of the bridge, (b) As-designed CAD drawing, Unit: mm.
Figure 9.
Horizontal and vertical point cloud slicing and merging process.
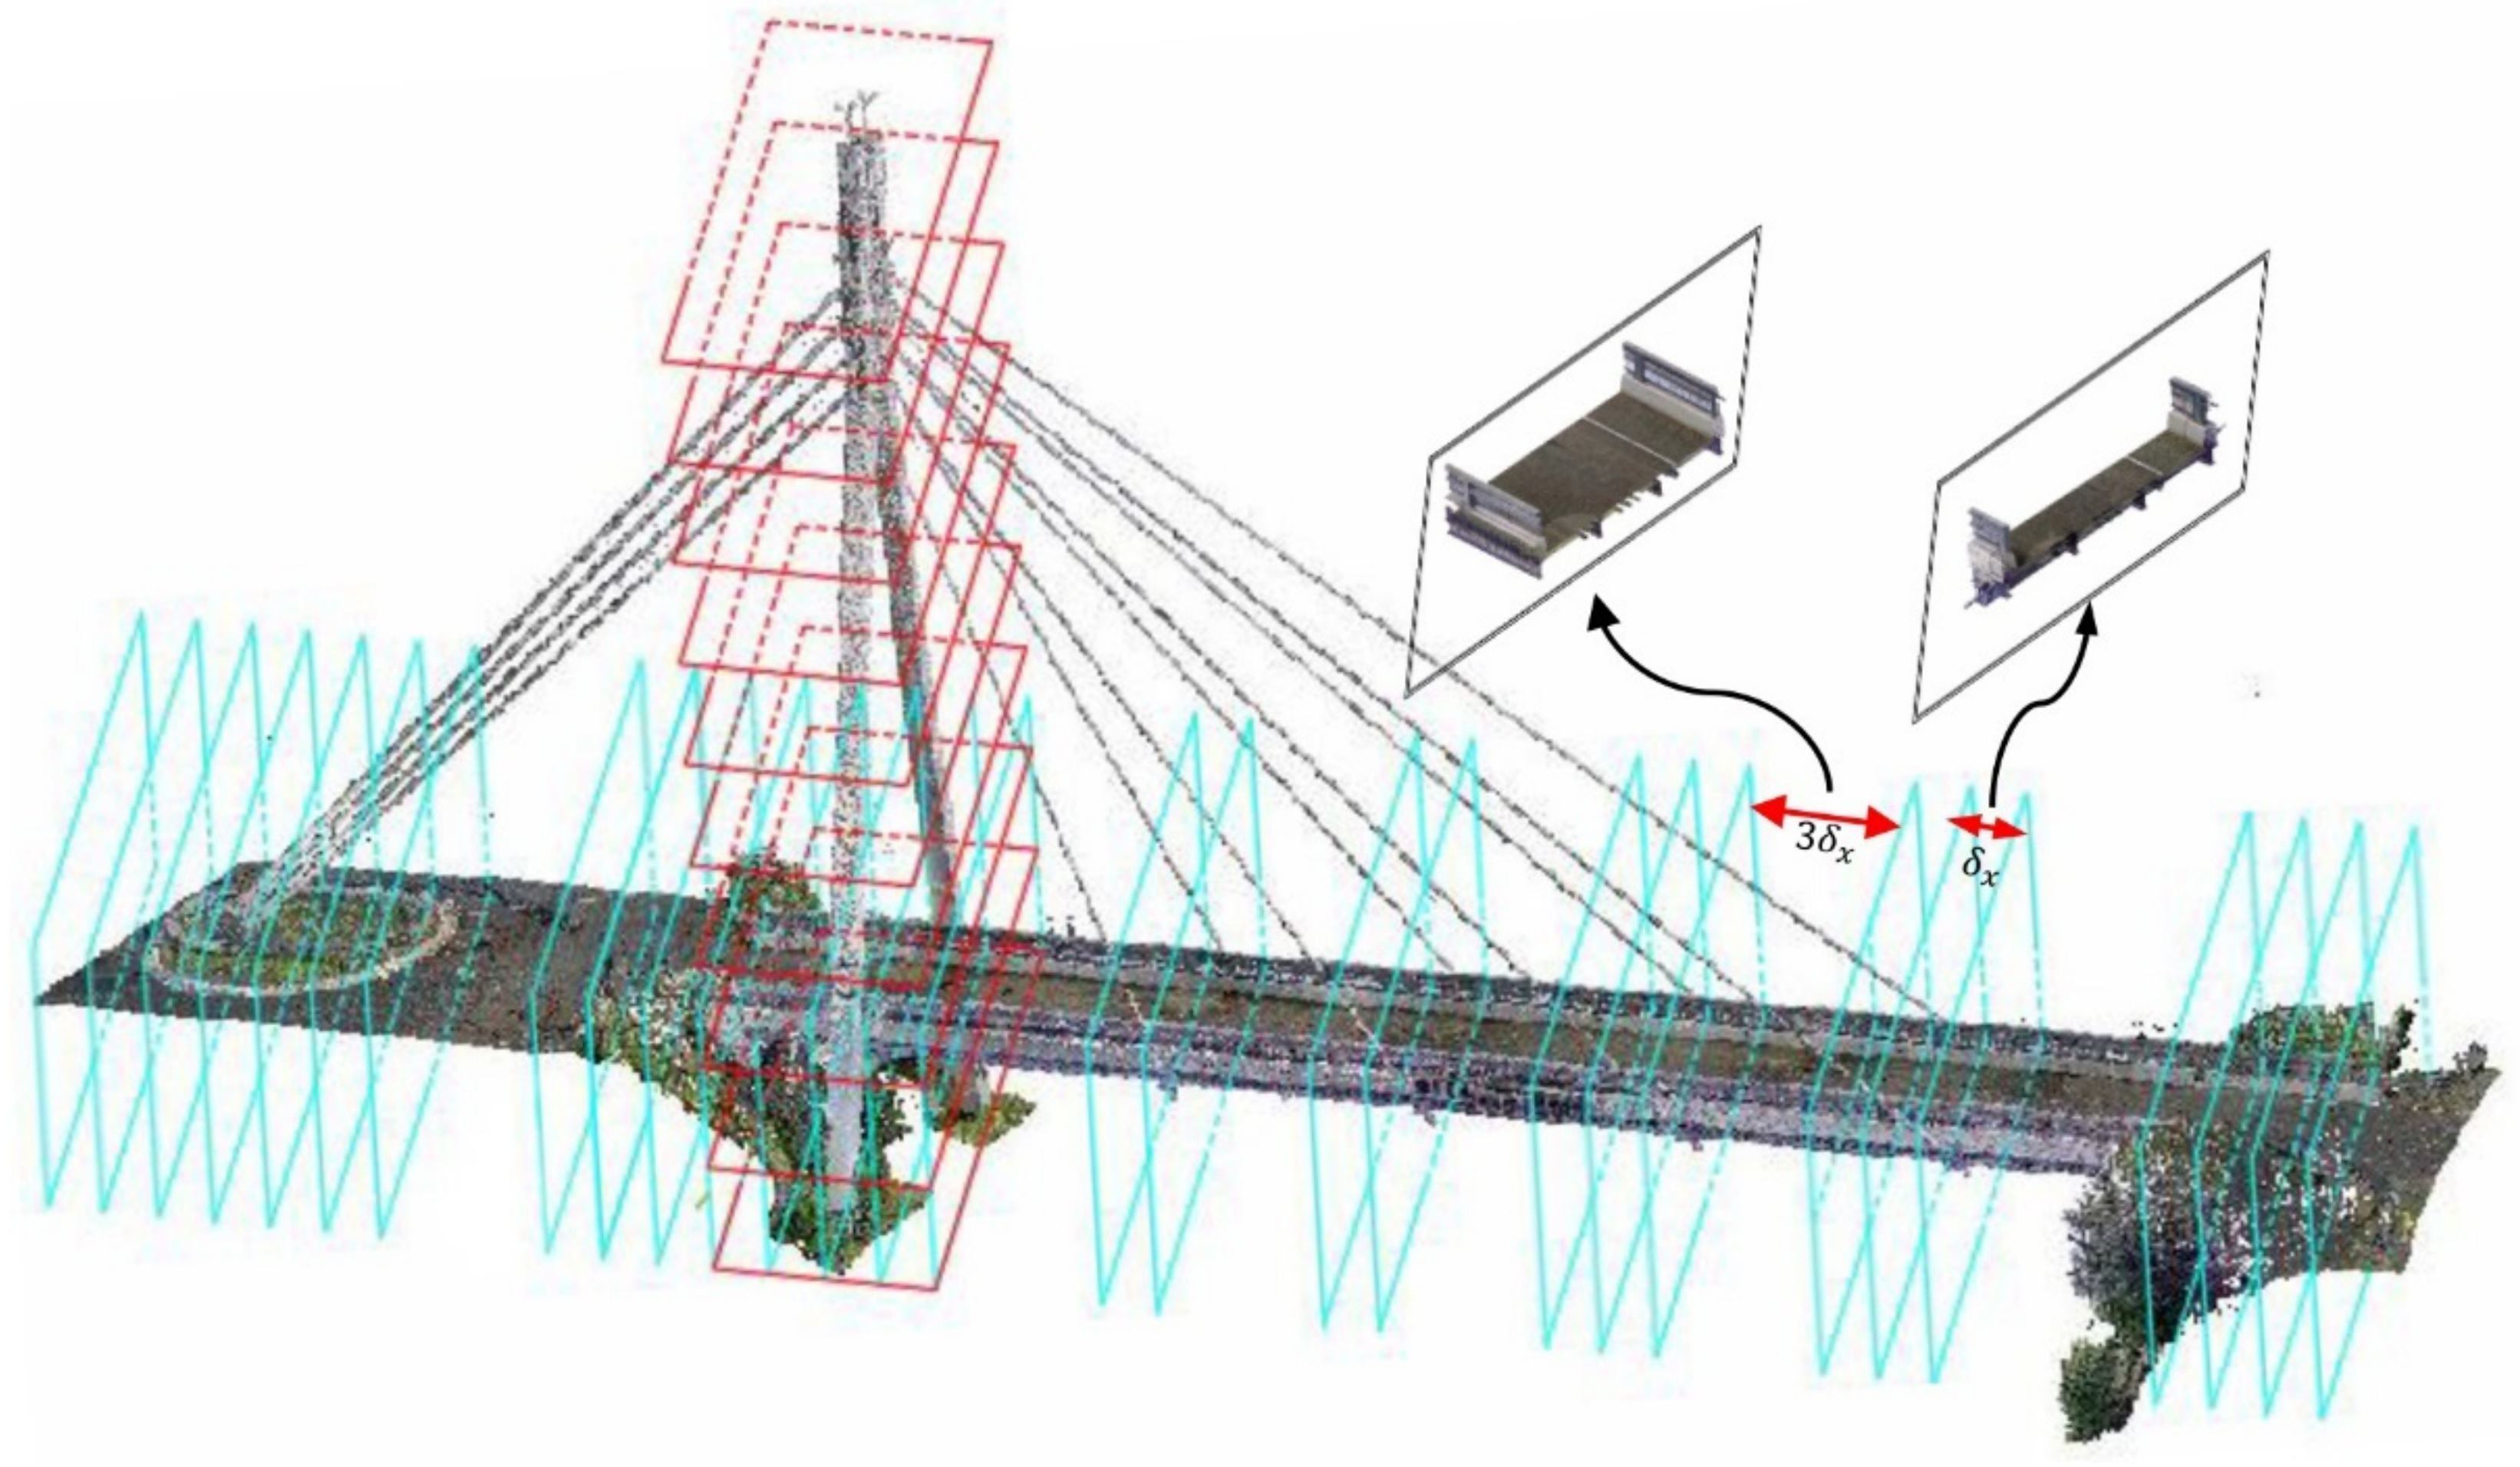
Figure 10.
Werrington Bridge 3D CAD model, agreement with the real bridge.
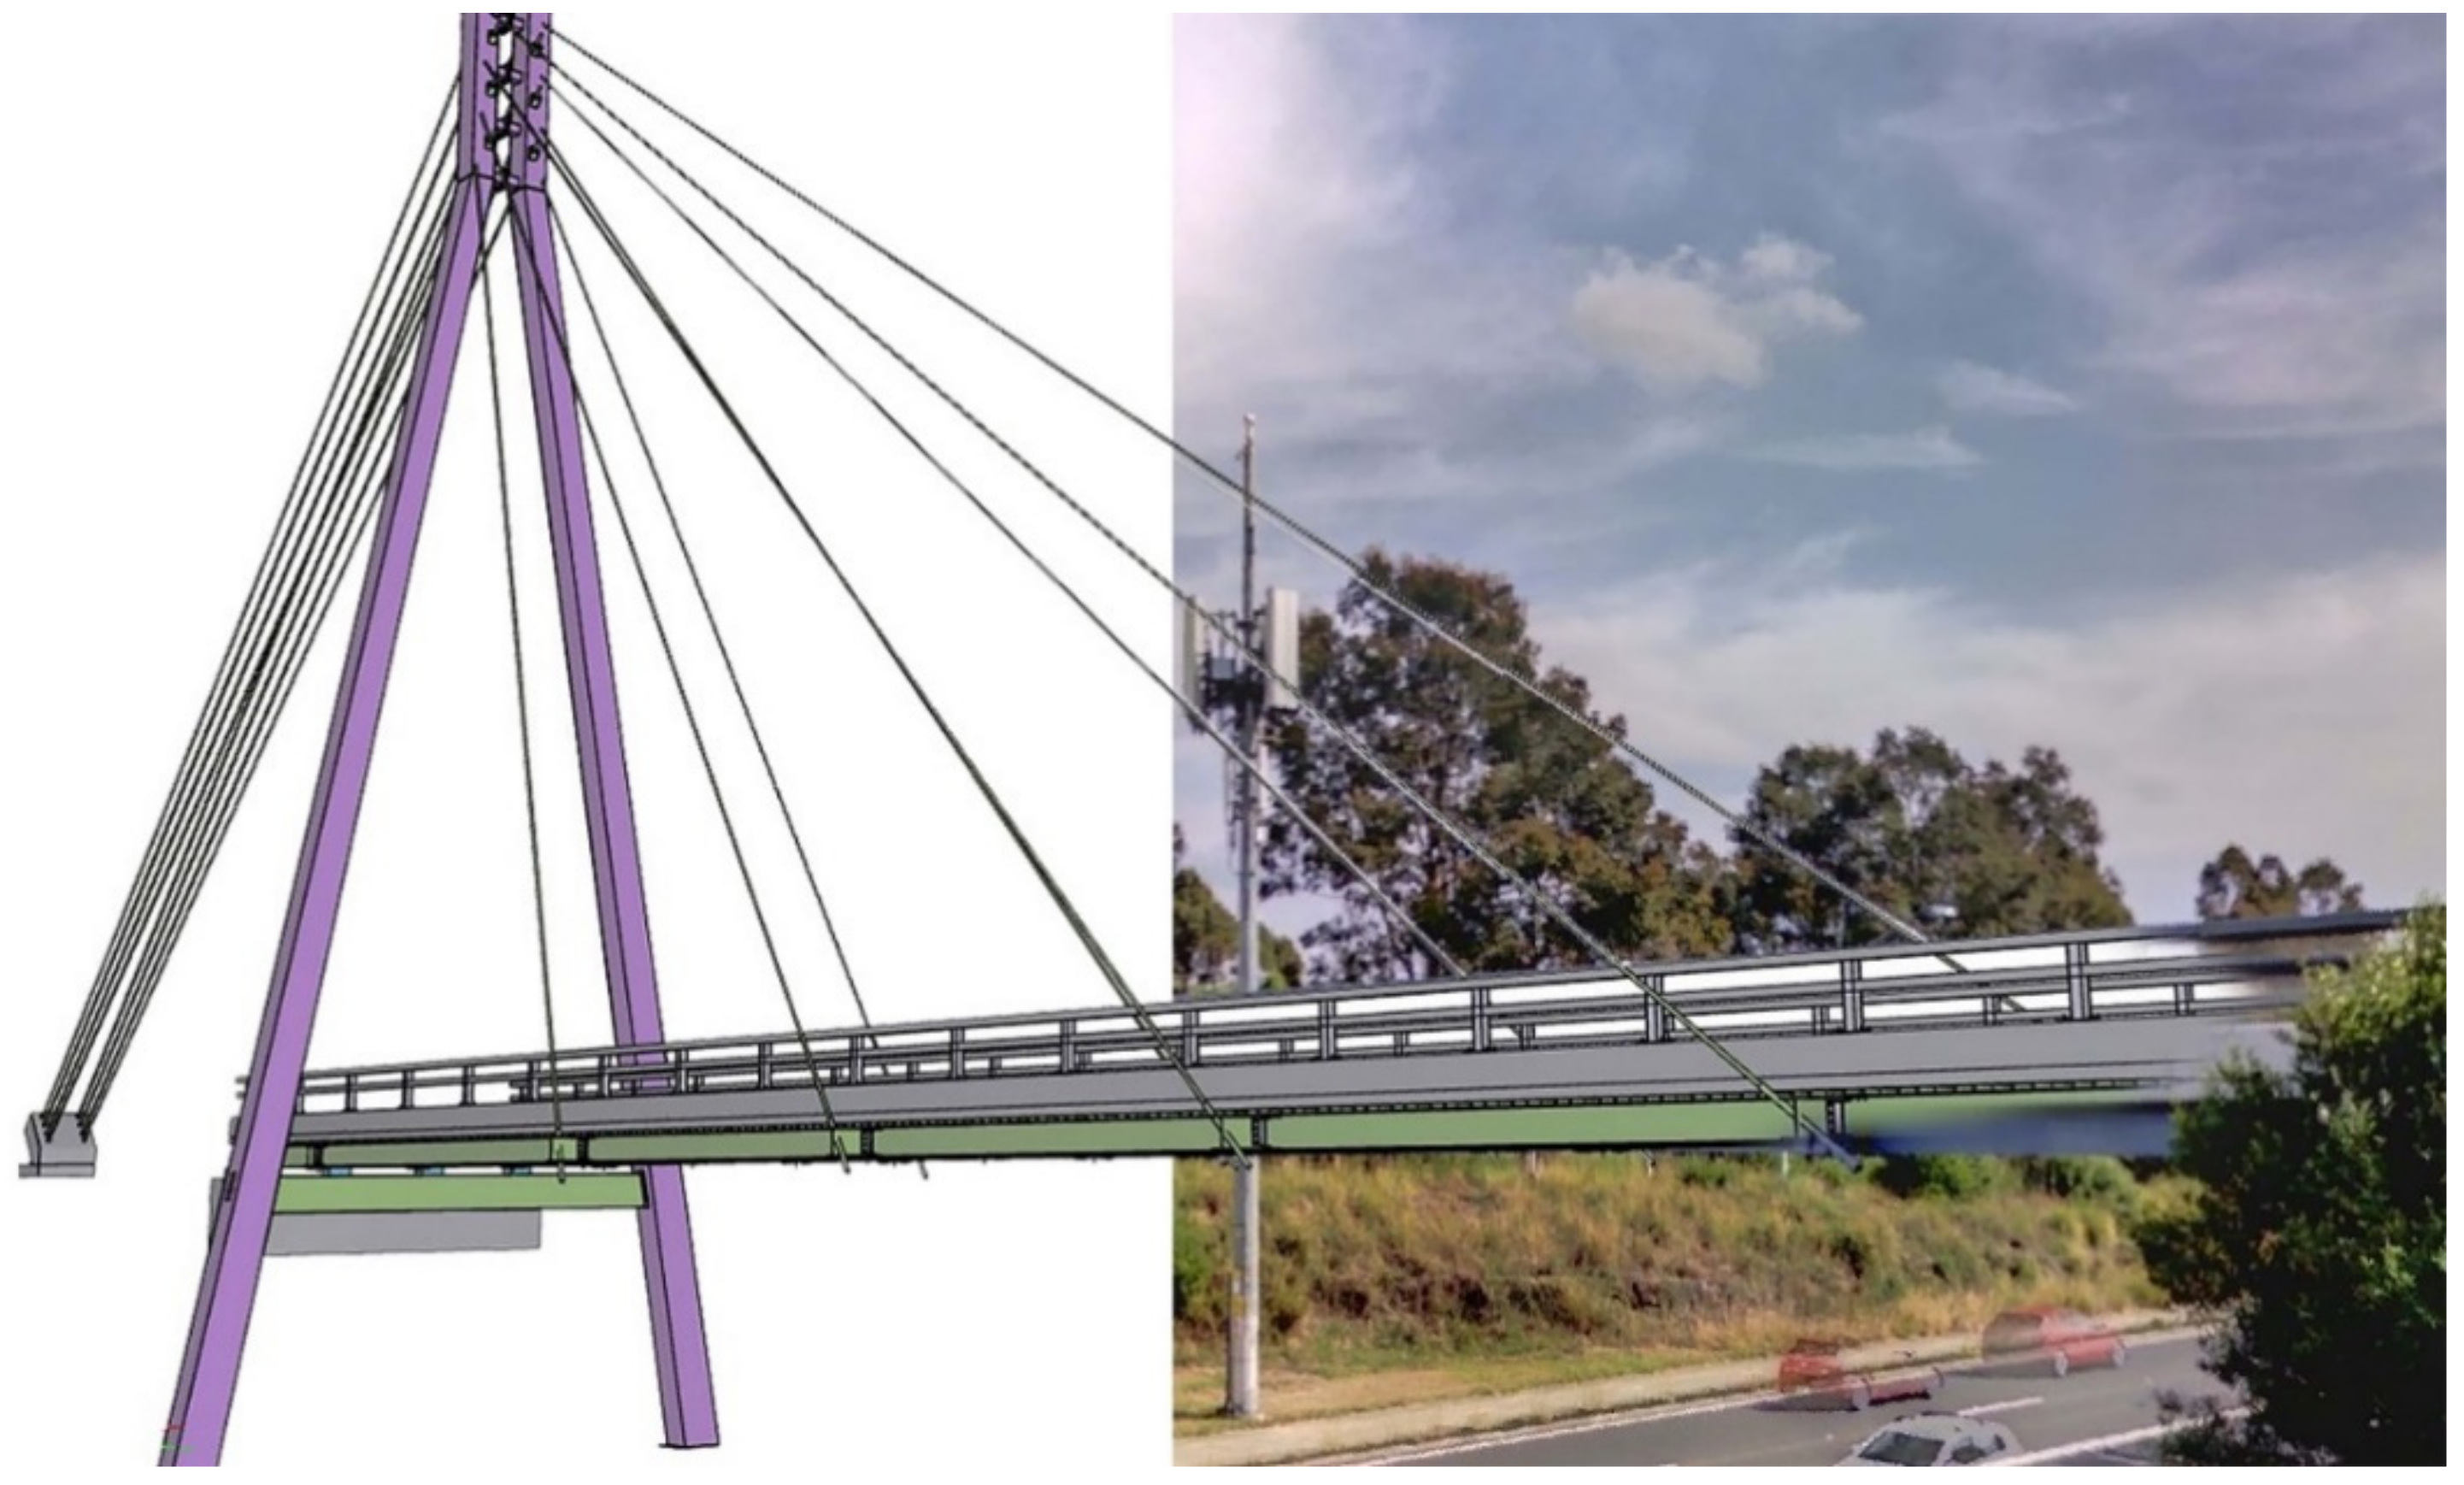
Figure 11.
Inspection of part A; (a) Sliced-based CAD model, (b) Mesh-based CAD model, (c) B-B cross-sectional profile.
Figure 11.
Inspection of part A; (a) Sliced-based CAD model, (b) Mesh-based CAD model, (c) B-B cross-sectional profile.
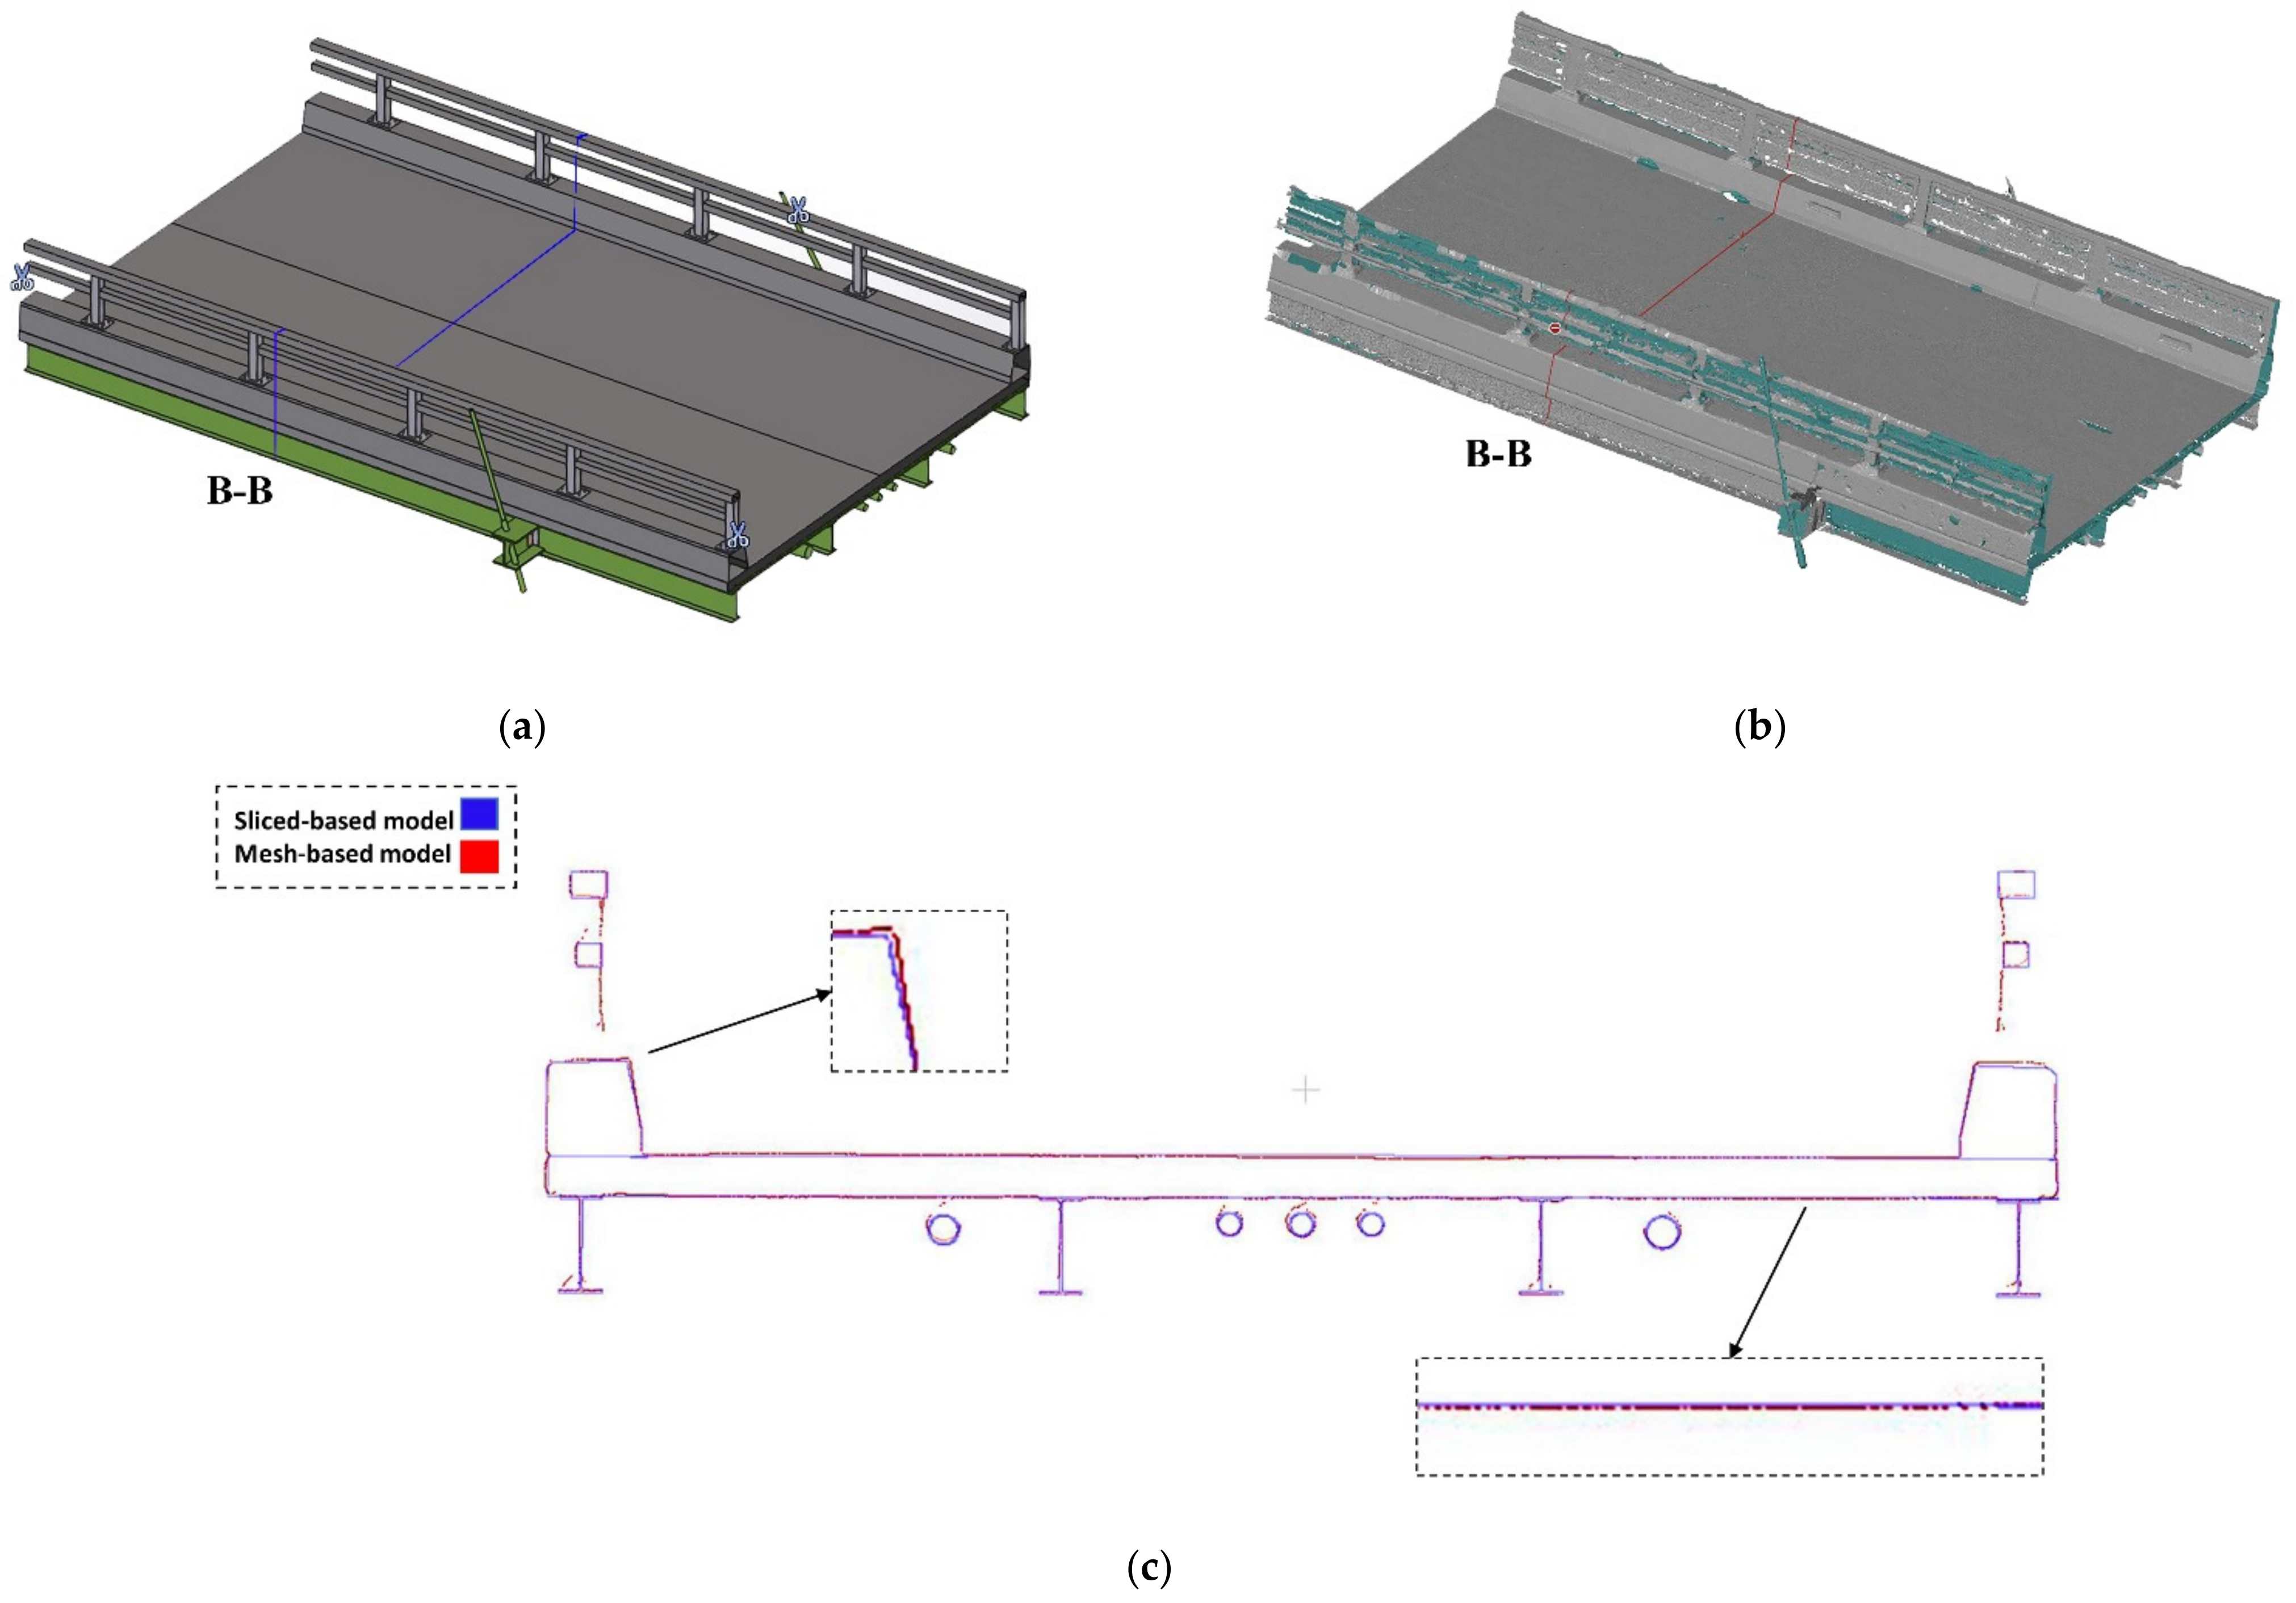
Figure 12.
Deviation of the 3D CAD model versus point cloud.
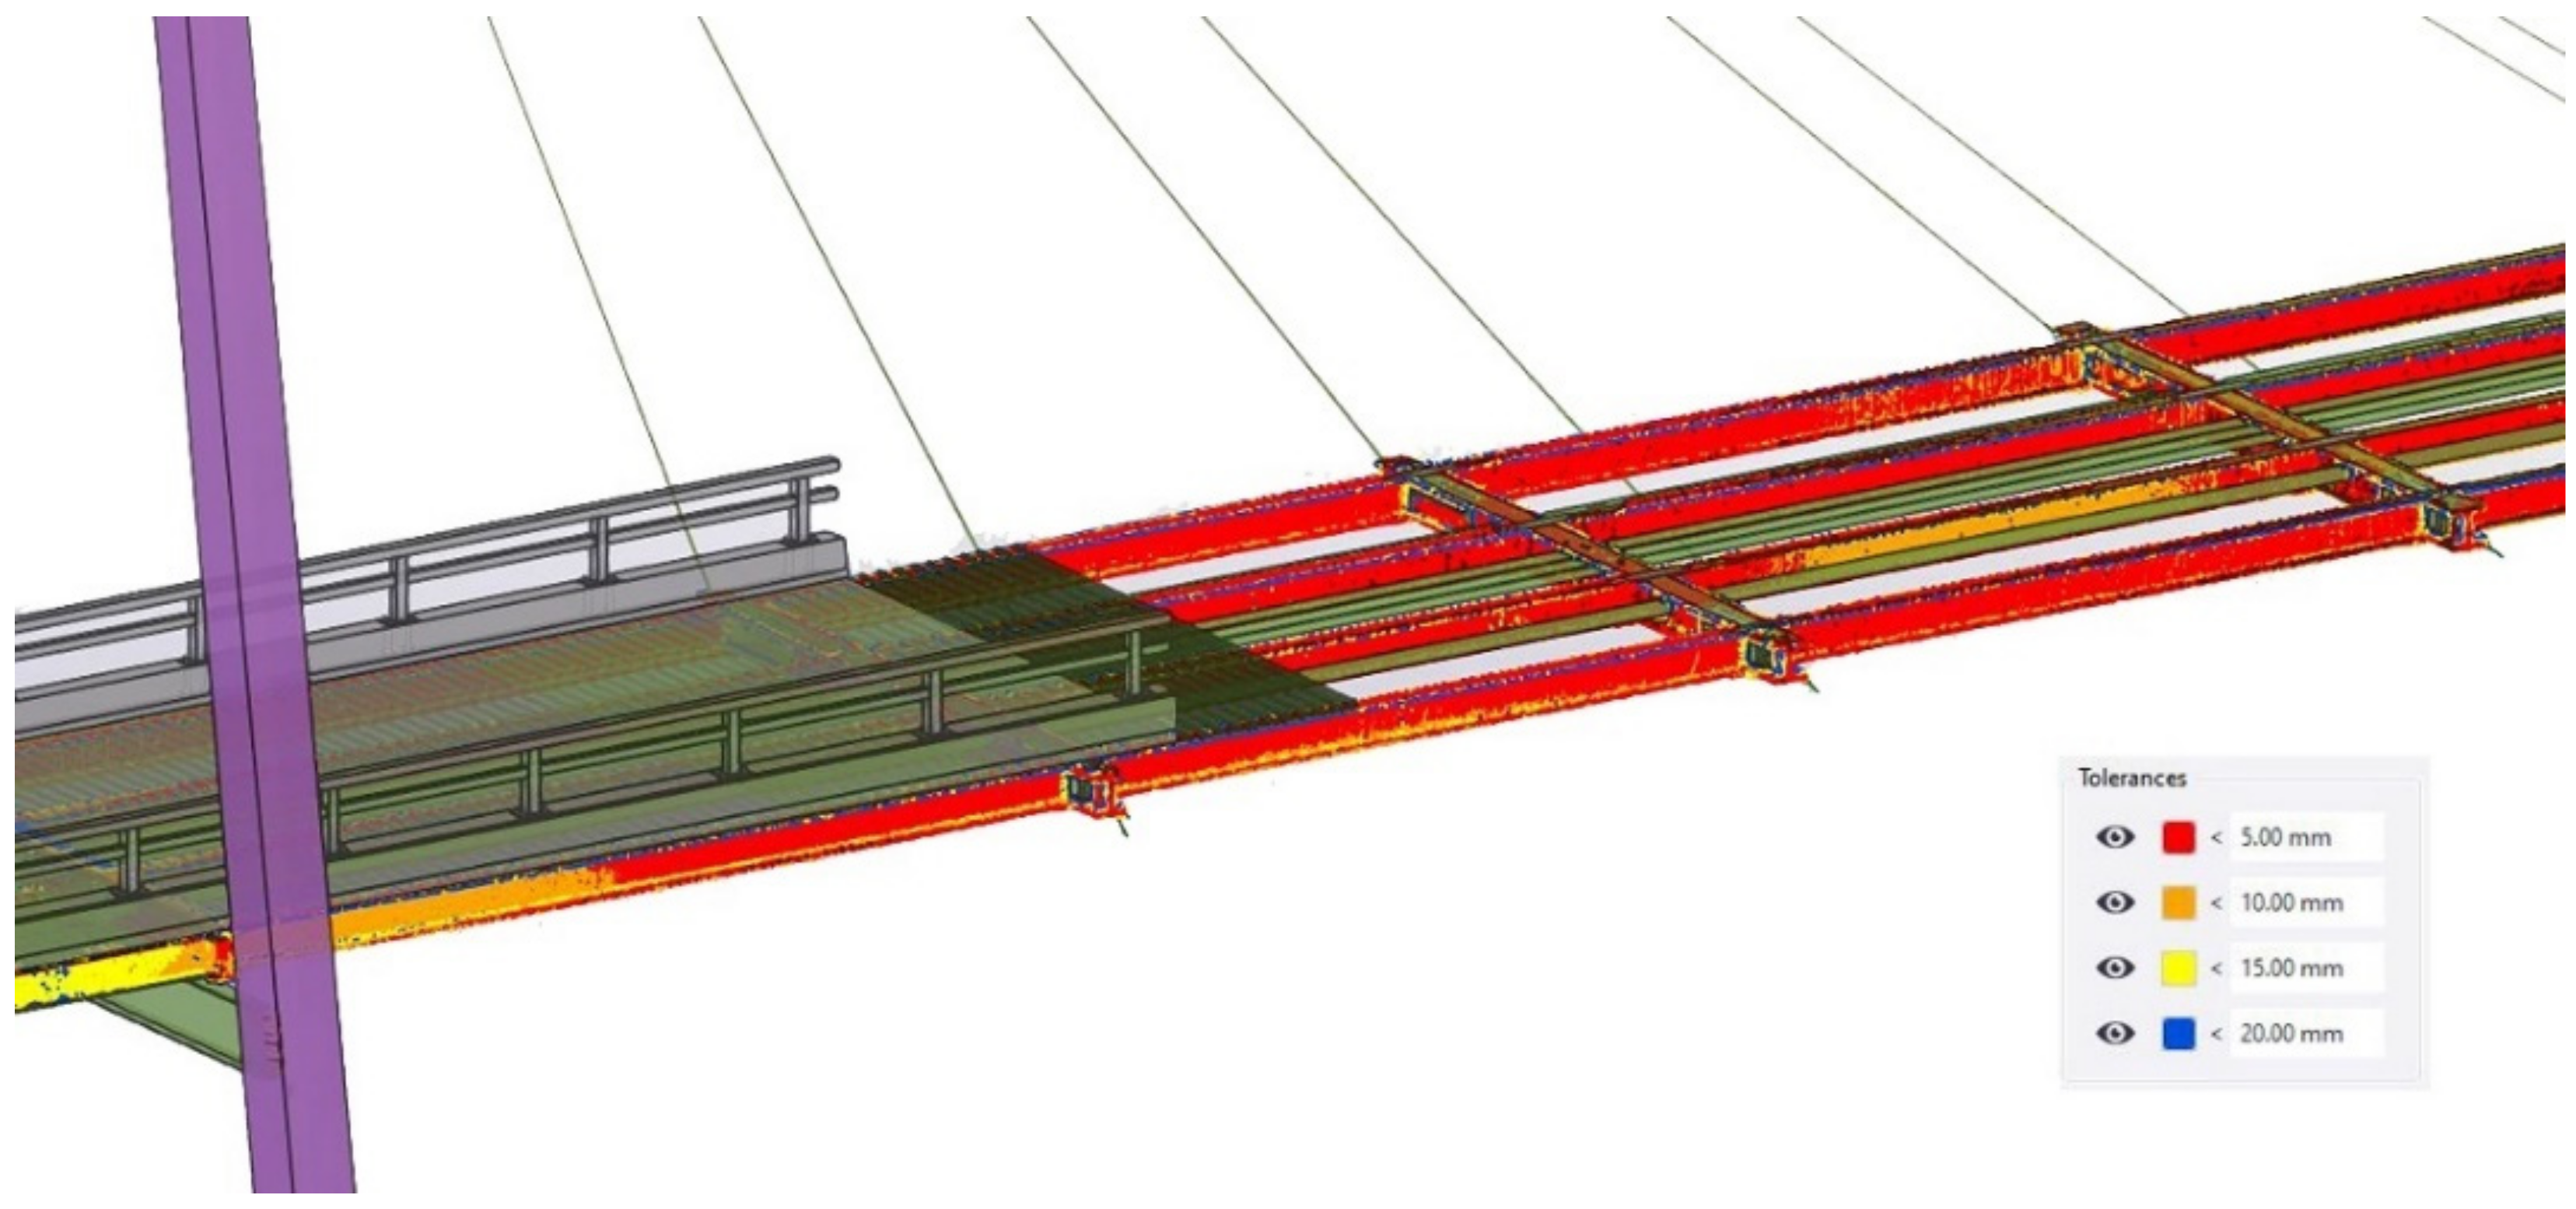
Figure 13.
Inspection data assignment and condition state report: (a) Clash detection and data assignment. (b) Element-level condition state report.
Figure 13.
Inspection data assignment and condition state report: (a) Clash detection and data assignment. (b) Element-level condition state report.


Table 1.
Surface deviation analysis, plane fitting analysis. Unit: mm.
| Plane | STD | Mean Absolute Error | Max Absolute Error | RMSE |
|---|---|---|---|---|
| P1-S | 1.779 | 1.059 | 12.300 | 1.453 |
| P1-N | 2.452 | 1.889 | 8.800 | 1.560 |
| P1-E | 1.765 | 1.212 | 14.700 | 1.283 |
| P1-W | 3.040 | 2.749 | 6.060 | 1.212 |
| P2-S | 2.356 | 1.793 | 7.378 | 1.529 |
| P2-N | 2.478 | 1.323 | 18.900 | 2.096 |
| P2-E | 10.386 | 7.777 | 10.294 | 6.884 |
| P2-W | 6.815 | 4.047 | 44.620 | 5.483 |
| Average | 3.883 | 2.731 | 15.381 | 2.687 |
Table 2.
Surface deviation analysis, cylinder fitting analysis. Unit: mm.
| Cylinder | TLS | As-Designed Diameter | Measurement Absolute Error | |||
|---|---|---|---|---|---|---|
| STD | Mean Absolute Error | MAX ABSOLUTE ERROR | Diameter | |||
| Cable 1 | 1.401 | 0.912 | 14.791 | 62.822 | 60.300 | 2.522 |
| Cable 2 | 1.473 | 4.231 | 12.134 | 62.614 | 60.300 | 2.314 |
| Cable 3 | 1.102 | 2.021 | 13.231 | 62.167 | 60.300 | 1.867 |
| Cable 4 | 1.321 | 0.601 | 15.221 | 62.212 | 60.300 | 1.912 |
| Cable 5 | 4.745 | 2.935 | 25.753 | 52.628 | 48.300 | 4.328 |
| Cable 6 | 4.291 | 2.922 | 23.424 | 52.061 | 48.300 | 3.761 |
| Cable 7 | 4.881 | 3.334 | 27.521 | 52.879 | 48.300 | 4.579 |
| Cable 8 | 4.692 | 2.981 | 29.332 | 47.218 | 48.300 | 1.082 |
| Average | 2.988 | 2.492 | 20.175 | - | - | 2.795 |
Table 3.
TLS error evaluation versus as-is measurements, Unit: mm.
| Cross-Sectional Profiles | TLS-Based Measurements | As-Is Measurements | Measurement Absolute Error | ||||||
|---|---|---|---|---|---|---|---|---|---|
| A | B | C | A | B | C | A | B | C | |
| Sec A1-A1 | 5507 | 386 | 355 | 5498 | 388 | 352 | 9 | 2 | 3 |
| Sec A2-A2 | 5504 | 387 | 352 | 5496 | 389 | 348 | 8 | 2 | 4 |
| Sec A3-A3 | 5503 | 387 | 357 | 5493 | 388 | 353 | 10 | 1 | 4 |
| Sec A4-A4 | 5492 | 388 | 343 | 5486 | 391 | 346 | 6 | 3 | 3 |
| Average | 5501 | 387 | 352 | 5493 | 389 | 349 | 8 | 2 | 3 |
Table 4.
TLS error evaluation versus as-designed dimensions, Unit: mm.
| Cross-Sectional Profiles | TLS-Based Measurements | As-Designed Dimensions | Measurement Absolute Error | |||||||||
|---|---|---|---|---|---|---|---|---|---|---|---|---|
| A | B | C | D | A | B | C | D | A | B | C | D | |
| Sec A1-A1 | 5507 | 386 | 355 | 566 | 5500 | 385 | 350 | 560 | 7 | 1 | 5 | 6 |
| Sec A2-A2 | 5504 | 387 | 352 | 568 | 5500 | 385 | 350 | 560 | 4 | 2 | 2 | 8 |
| Sec A3-A3 | 5503 | 387 | 357 | 566 | 5500 | 385 | 350 | 560 | 3 | 2 | 7 | 6 |
| Sec A4-A4 | 5492 | 388 | 343 | 559 | 5500 | 385 | 350 | 560 | 8 | 3 | 7 | 1 |
| Average | 5501 | 387 | 352 | 565 | - | - | - | - | 5 | 2 | 5 | 5 |
Table 5.
Deviations analysis between the slice-based vs mesh-based CAD models and point cloud, Unit: mm.
Table 5.
Deviations analysis between the slice-based vs mesh-based CAD models and point cloud, Unit: mm.
| Sliced-Based CAD Model | Mesh-Based CAD Model | TLS-Based Point Cloud | ||||||
|---|---|---|---|---|---|---|---|---|
| STD | Mean | RMSE | MAE | STD | Mean | RMSE | MAE | |
| Part A | 4.11 | 3.90 | 5.23 | 2.17 | 3.40 | 4.51 | 4.57 | 3.32 |
| Part B | 5.12 | 5.72 | 6.26 | 4.44 | 5.12 | 5.78 | 6.22 | 4.58 |
| Average | 4.62 | 4.81 | 5.75 | 3.31 | 4.26 | 5.15 | 5.40 | 3.95 |
Publisher’s Note: MDPI stays neutral with regard to jurisdictional claims in published maps and institutional affiliations. |
© 2022 by the authors. Licensee MDPI, Basel, Switzerland. This article is an open access article distributed under the terms and conditions of the Creative Commons Attribution (CC BY) license (https://creativecommons.org/licenses/by/4.0/).
Share and Cite
MDPI and ACS Style
Mohammadi, M.; Rashidi, M.; Mousavi, V.; Yu, Y.; Samali, B. Application of TLS Method in Digitization of Bridge Infrastructures: A Path to BrIM Development. Remote Sens. 2022, 14, 1148. https://doi.org/10.3390/rs14051148
AMA Style
Mohammadi M, Rashidi M, Mousavi V, Yu Y, Samali B. Application of TLS Method in Digitization of Bridge Infrastructures: A Path to BrIM Development. Remote Sensing. 2022; 14(5):1148. https://doi.org/10.3390/rs14051148
Chicago/Turabian StyleMohammadi, Masoud, Maria Rashidi, Vahid Mousavi, Yang Yu, and Bijan Samali. 2022. "Application of TLS Method in Digitization of Bridge Infrastructures: A Path to BrIM Development" Remote Sensing 14, no. 5: 1148. https://doi.org/10.3390/rs14051148
Note that from the first issue of 2016, this journal uses article numbers instead of page numbers. See further details here.