Article

The Sensitivity of Green-Up Dates to Different Temperature Parameters in the Mongolian Plateau Grasslands

1
Key Laboratory of Geographical Processes and Ecological Security in Changbai Mountains, Ministry of Education, School of Geographical Sciences, Northeast Normal University, Changchun 130024, China
2
Urban Remote Sensing Application Innovation Center, School of Geographical Sciences, Northeast Normal University, Changchun 130024, China
3
School of Information Engineering, Changchun University of Finance and Economics, Changchun 130024, China
*
Author to whom correspondence should be addressed.
Remote Sens. 2023, 15(15), 3830; https://doi.org/10.3390/rs15153830
Submission received: 17 June 2023 / Revised: 16 July 2023 / Accepted: 19 July 2023 / Published: 1 August 2023
(This article belongs to the Special Issue Remote Sensing of Land Surface Phenology II)

Abstract

:
The rise in global average surface temperature has promoted the advancement of spring vegetation phenology. However, the response of spring vegetation phenology to different temperature parameters varies. The Mongolian Plateau, one of the largest grasslands in the world, has green-up dates (GUDs) with unclear sensitivity to different temperature parameters. To address this issue, we investigated the responses of GUDs to different temperature parameters in the Mongolian Plateau grasslands. The results show that GUDs responded significantly differently to changes in near-surface temperature (TMP), near-surface temperature maximum (TMX), near-surface temperature minimum (TMN), and diurnal temperature range (DTR). GUDs advanced as TMP, TMX, and TMN increased, with TMN having a more significant effect, whereas increases in DTR inhibited the advancement of GUDs. GUDs were more sensitive to TMX and TMN than to TMP. The sensitivity of GUDs to DTR showed an increasing trend from 1982 to 2015 and showed this parameter’s great importance to GUDs. Our results also show that the spatial and temporal distributions of temperature sensitivity are only related to temperature conditions in climatic zones instead of whether they are arid.

Graphical Abstract

1. Introduction

Vegetation phenology is a sensitive indicator of global climate change [1]. The variations in spring phenology significantly impact the terrestrial ecosystem carbon cycle and surface energy [2,3]. Previous studies have shown that higher temperatures advance green-up dates (GUDs), especially in mid- to high-latitude regions [4,5,6], where temperature trends vary widely [7]. The Mongolian Plateau grasslands (MPG) are located in the range of 35°–55°N and are sensitive to climate warming [8,9]. In recent decades, the frequency of summer droughts and winter chilling in the plateau has increased [10]. However, the rates of change in climate variables have not been uniformly distributed across the plateau, resulting in uneven changes [11]. These changes may alter interactions between ecosystem components, leading to structural and functional changes among ecosystems [11]. With the current trend of global warming, significant changes in phenology have been widely observed. In particular, spring green-up advancements in response to a warming climate have been detected in many studies employing ground observations [5,12] and satellite data [13,14]. Temperature is considered to be the main factor affecting GUDs [15]. However, there are significant variances among GUD responses to different temperature parameters [16,17]. Over the past few decades, near-surface temperature maxima (TMXs) have increased more rapidly than near-surface temperature minima (TMNs), and many studies have been conducted on the different effects of TMX and TMN warming on GUDs [18,19,20]. Some studies have shown that GUDs are mainly controlled by TMXs [21,22]. For example, Piao et al. [23] and Fu et al. [24] suggested that spring phenology is triggered by TMX instead of TMN by comparing the relative correlation strength of GUDs with TMXs and TMNs in the Northern Hemisphere. However, other studies show that GUDs are mainly related to TMN [25,26]. A study on the Tibetan Plateau found that the negative partial correlation was stronger for its GUDs with winter TMNs than with TMXs [27]. These findings suggest that GUDs have complex relationships with TMNs and TMXs [28]. In addition, asymmetric warming also results in a smaller diurnal temperature range (DTR), whereas in other regions, future climate change may increase the DTR [29], which will make the GUDs’ responses to temperature more complex. Therefore, it is necessary to quantify the intensity of GUD responses to different temperature parameters.
The sensitivity of vegetation phenology to climate change can be measured using the linear regression coefficients of phenological parameters, which quantify their relationships. The synchronization of vegetation phenology sensitivity with climate change reflects the diverse responses of regional vegetation to climate. This sensitivity can determine the buffering capacity of species or communities and their ability to adapt to climate change [30]. The sensitivity of GUDs’ responses to temperature determines the magnitude of future climate warming [31]. Although the average phenology date in Europe has decreased by 3.4 DOY (day of year) per degree Celsius over the last three decades, the sensitivity of GUDs to climate change on different time scales remains controversial [32]. Current research on grasslands has focused on the effects of changes in mean temperature and precipitation patterns on GUDs, whereas differences in the influence of different temperature parameters on GUDs are still underdiscussed. The main objectives of this research were to (1) reveal the temporal and spatial variations in GUDs in the MPG; (2) investigate how GUDs respond to temperature in the MPG; and (3) quantify the sensitivity of GUDs to temperature.

2. Materials and Methods
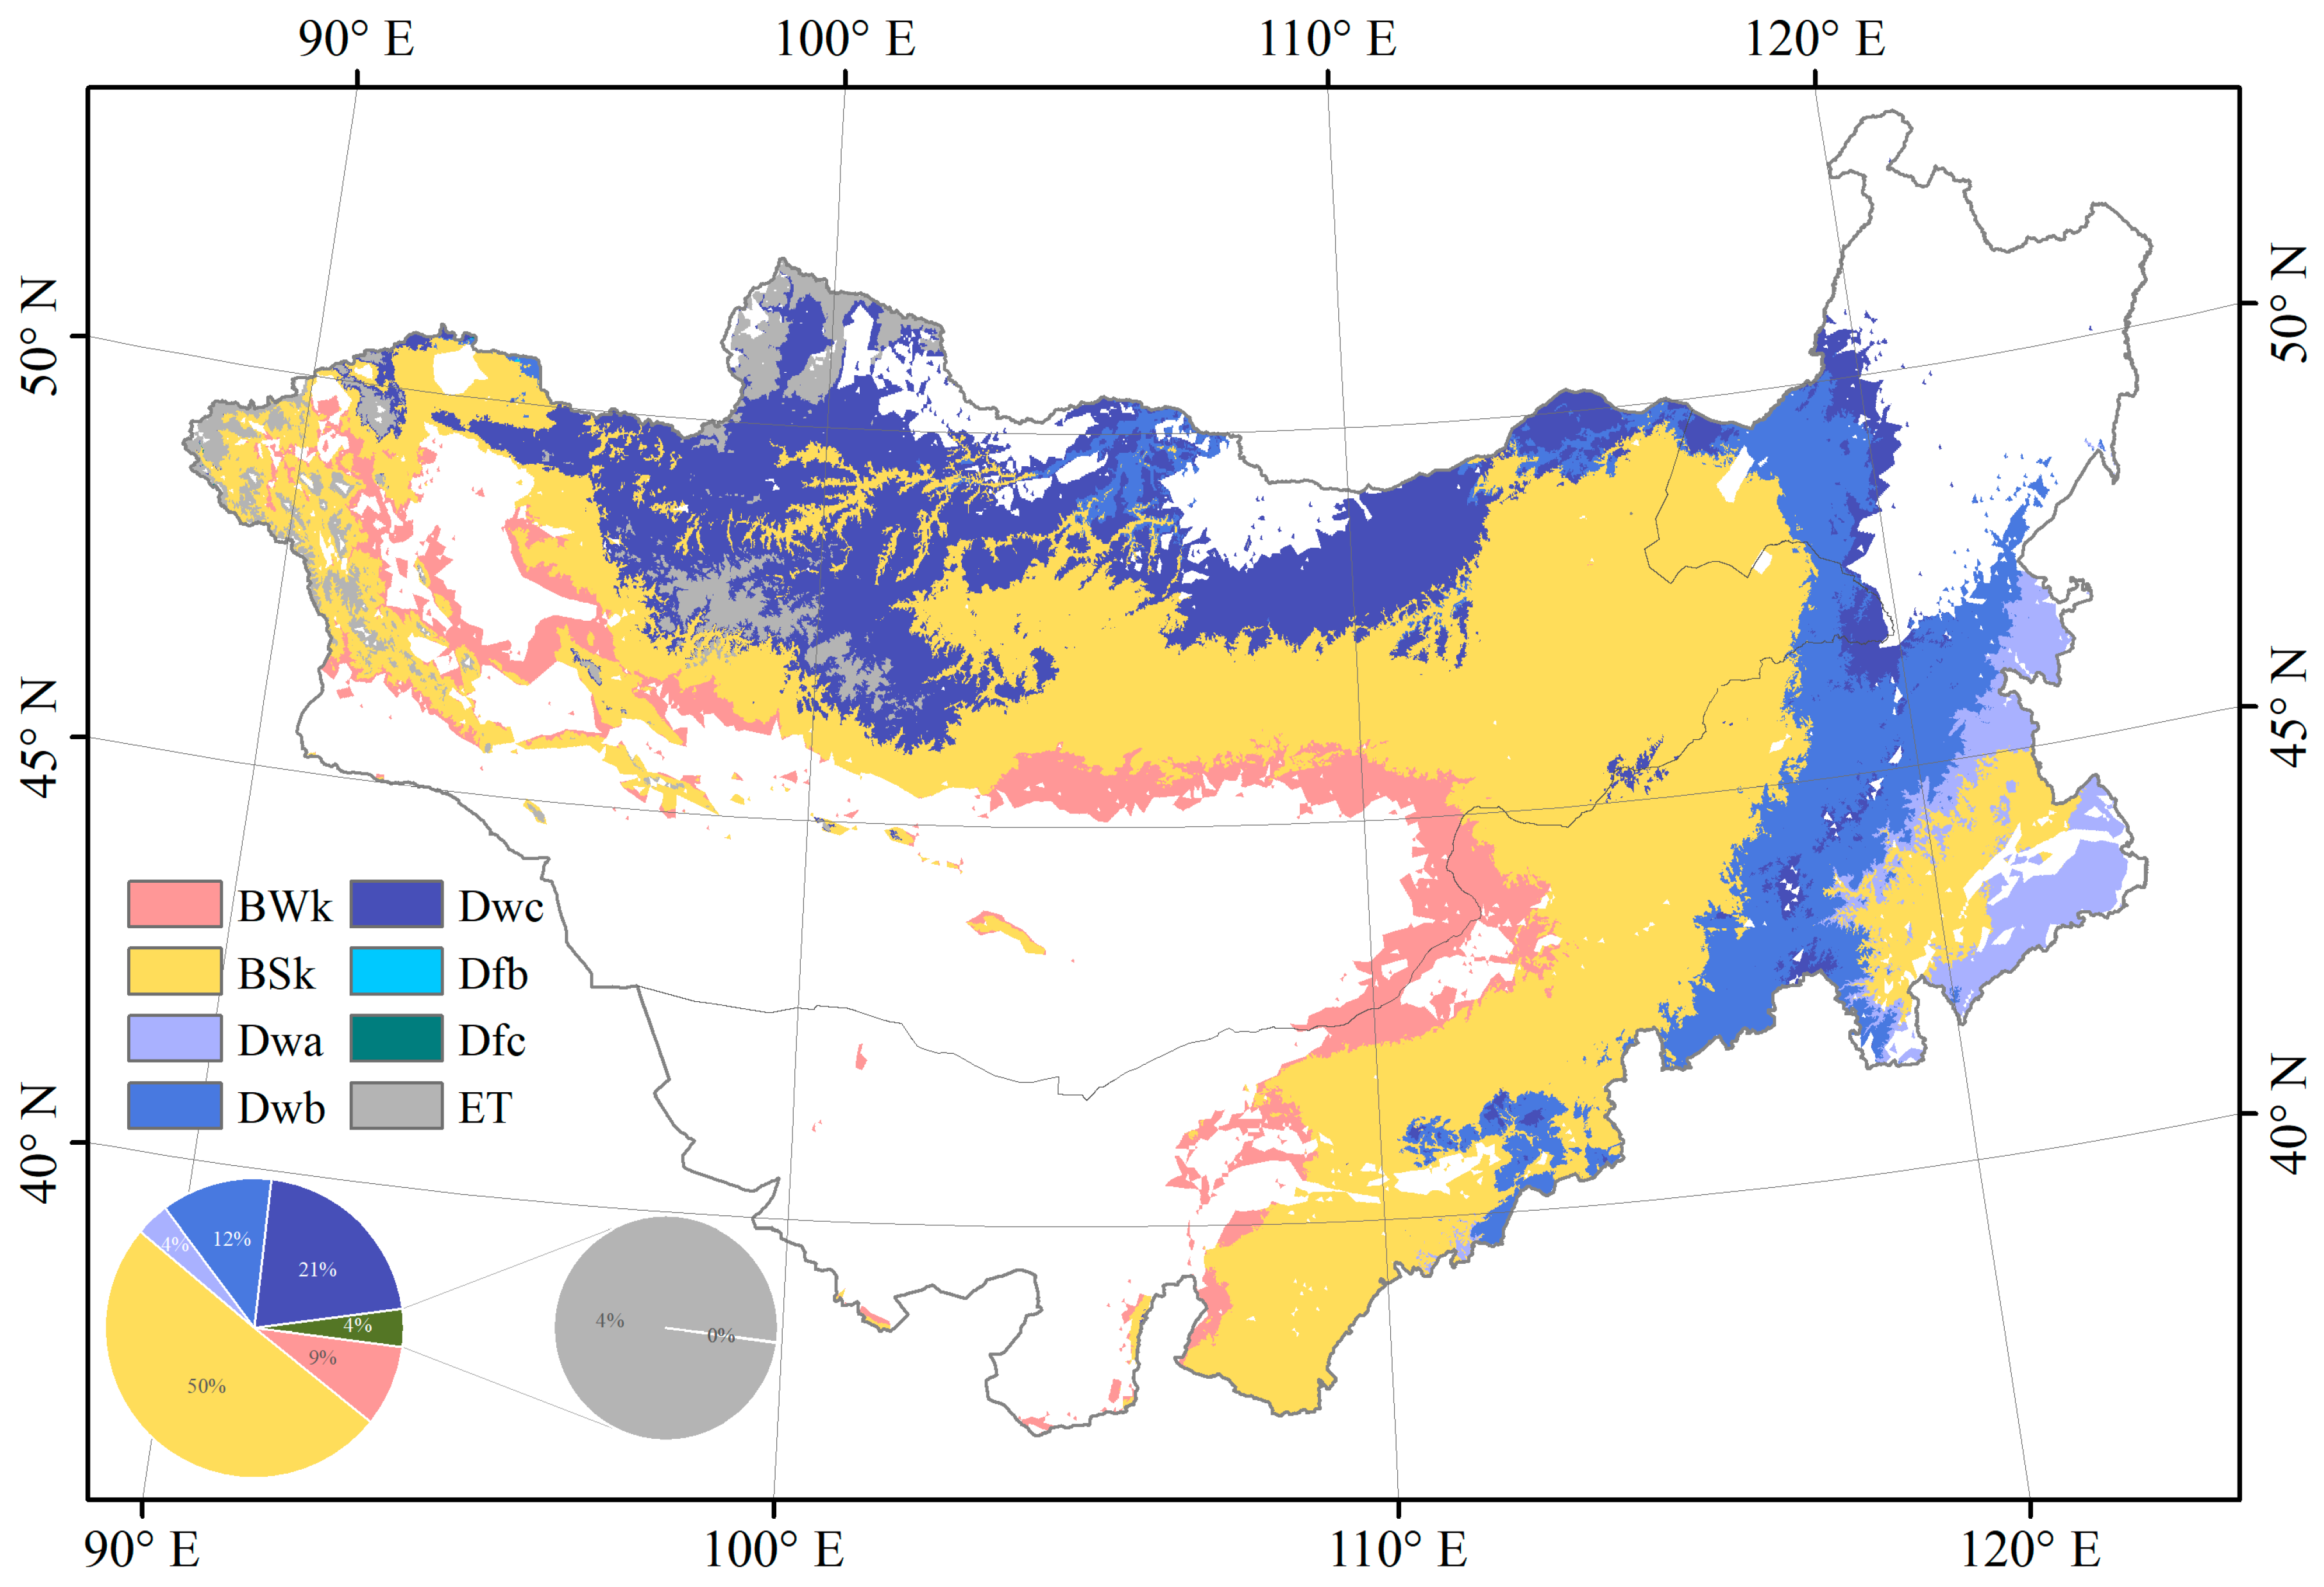
2.1. Study Area

The Mongolian Plateau grasslands (MPG) are located in the arid–semiarid climate zone of central Eurasia, which is considered to be sensitive to climate warming [8]. In this study, the Mongolian Plateau is defined as the region consisting of Mongolia and the Inner Mongolia Autonomous Region of China, with a total area of approximately 2.7 million km2, an average altitude of more than 1500 m asl, and a population of approximately 28 million.
Here, we used the International Geosphere Biosphere Programme (IGBP) project’s MCD12C1 dataset product to extract the study area’s data. The spatial resolution of the data is 500 m for each year since 2000. The dataset can be downloaded from https://ladsweb.modaps.eosdis.nasa.gov/. This version was algorithmically updated to reduce the uncertainty of individual years compared to the previous version (Collection 5). Because land cover types have changed over the years, our study used the MCD12C1 dataset to extract unchanged grassland areas from 2000 to 2015 to improve the reliability of the results. The spatial distribution is shown in Figure S1.

2.2. Climate Dataset

The CRUts 3.25 dataset available for 1982–2015 with a temporal resolution of one month and a spatial resolution of 0.5° [33] was utilized to calculate the TMN, TMX, TMP, and DTR values. The dataset can be downloaded from The CEDA (Centre for Environmental Data Analysis) Archive (https://catalogue.ceda.ac.uk/), accessed on 1 September 2021.

2.3. Köppen–Geiger Classification

The response of the GUD to the diurnal temperature range (DTR), near-surface temperature (TMP), near-surface temperature maximum (TMX), and near-surface temperature minimum (TMN) was explored based on the Köppen–Geiger Classification climate zones (Present and Future Köppen–Geiger Climate Classification Maps at 1 km Resolution Scientific Data, n.d.), accessed on 1 September 2021. As shown in Figure 1, the MPG is mainly covered by arid climate zones (including BWk and BSk), accounting for 60.03% of the total pixels; the cold climate zone (including Dwa, Dwc, Dfb, and Dfc) accounts for 36.29%; and the polar climate zone (ET) accounts for 3.68%. Table S1 displays the description and criterion for each climatic zone.

2.4. GUD Extraction

Normalized difference vegetation index (NDVI) data are commonly used to extract the characteristics of vegetation growth. In this study, 15-day NDVI data from the third-generation Global Inventory Modelling and Mapping Studies Modelling Study (GIMMS3g) dataset were used [34] (Pinzon & Tucker, 2014), which spanned from July 1981 to December 2015 with a spatial resolution of 8 km (https://ecocast.arc.nasa.gov/data/pub/gimms/), accessed on 1 January 2021. These datasets are preprocessed by geometric correction and radiometric correction and then optimized by cloud and cloud shadow screening and bad line removal for daily and per-track images. Maximum value composite (MVC) technology is utilized to form the final NDVI dataset. Therefore, it can provide a long time series and a high-quality dataset that is suitable for detecting vegetation dynamics in mid- to high-latitude regions.
First, missing values in the GIMMS3g NDVI dataset were filled. Then, the NDVI time series of the MPG was reconstructed by the Savitzky–Golay (SG) filtering method [13,35,36]. The SG filtering method does not have strict requirements for sensor type or NDVI scale, but rather for the original NDVI. In the third step, the dynamic threshold method was applied to determine the annual GUD. The dynamic threshold method defines the number of days corresponding to the preset NDVI amplitude of the fitted curve as the GUD. Before determination, the fitted NDVI curve must be standardized as follows:
R a t i o d a y = N D V I d a y N D V I m i n N D V I m a x N D V I m i n
where Ratioday represents the threshold, and NDVIday, NDVImax, and NDVImin represent the NDVI fitting values, maximum values, and minimum values on a certain pixel, respectively. In our study, a threshold of 0.2 was used to estimate the GUD. That is, the date corresponding to the curve reaching 20% of the NDVI annual amplitude within the year was taken as the GUD.

2.5. Analysis

We used partial correlation coefficients to calculate the correlations between GUD and other temperature variables for each preseason month in the MPG, with a confidence level of 0.95. Since the GUD mainly occurred before 160 DOY, which is in the middle of June, we selected the period of January to June as the preseason range. We calculated the correlation coefficients between the GUD and each temperature variable from January to June to determine the preseason length of each temperature variable that has the greatest influence on the GUD. The preseason range usually extends from January of the current year to the multiyear average GUD. A positive correlation here between the GUD and temperature would mean that GUD is delayed as temperature increases (the GUD value becomes higher, meaning later). The sensitivity of the GUD to temperature (ST) is often quantified by the slope coefficient of a linear regression model, with GUD as the dependent variable and the mean temperature in a defined period before the mean GUD as the independent variable.

3. Results

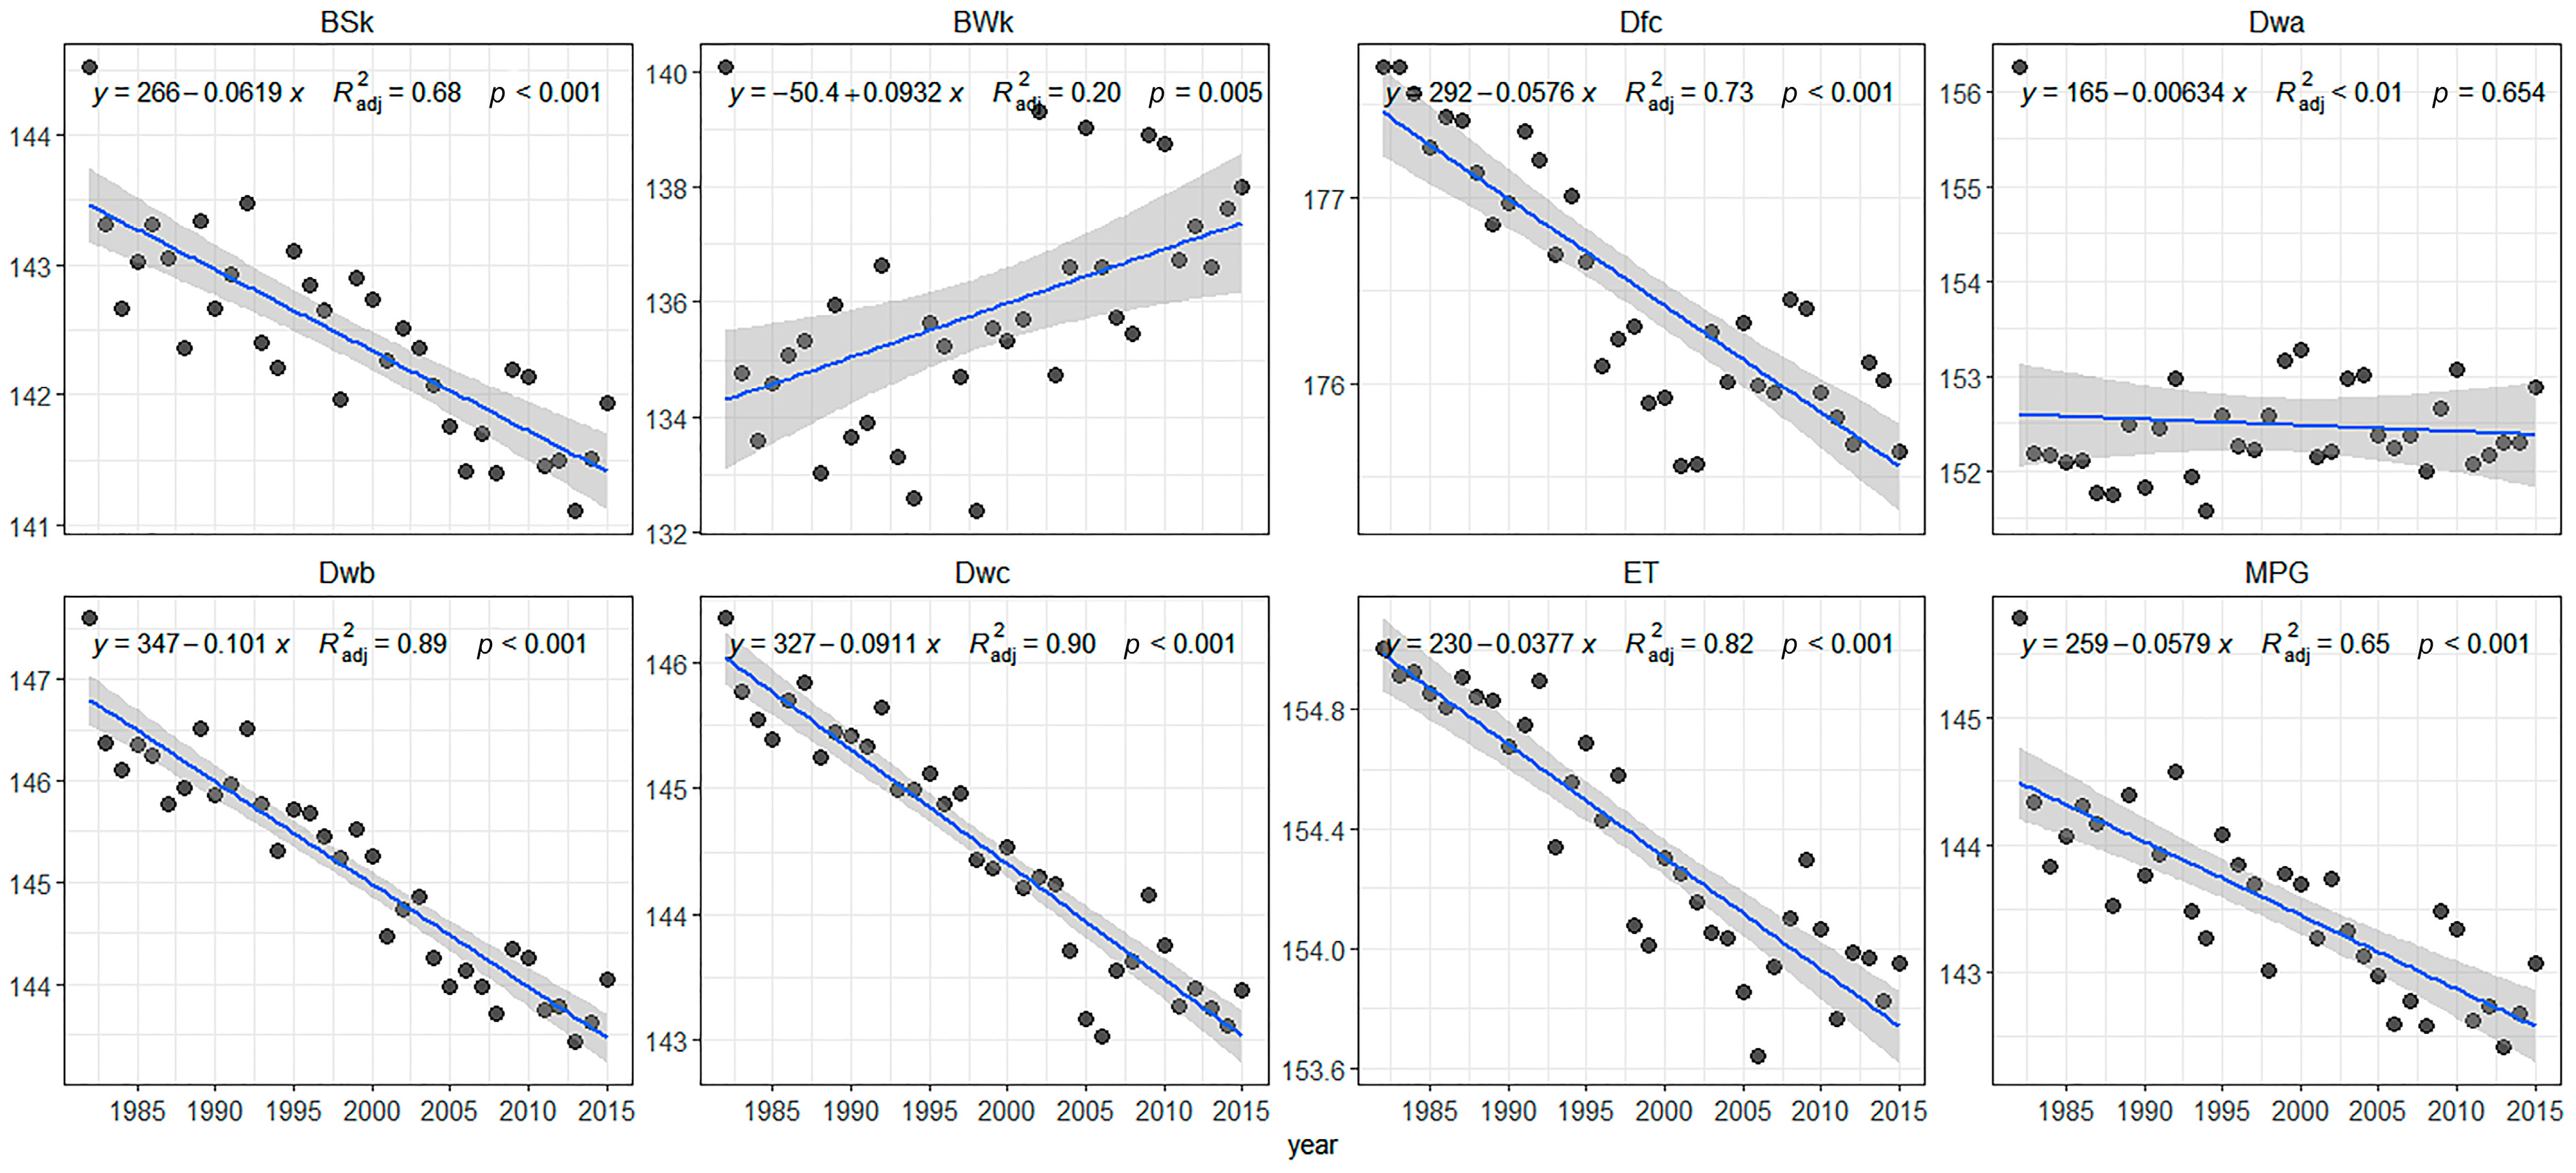
3.1. Distribution Pattern of the GUD

Generally, the GUD occurred between 130 and 160 DOY, accounting for 89.20% of the MPG (Figure 2a). The GUD was later on the eastern and northwestern borders and in the middle part of the study area. The GUD in the eastern barren area was generally early. Furthermore, the GUD in the middle and western parts of the study area differed from those in the nearby areas (Figure S2). In the past 34 years, 76.9% of pixels showed significant advancement trends (Figure 2b). The Bwk climate zones showed a significant delay trend. A similar delay trend was also found in the eastern area. Trends between −0.5 days/year and 0.5 days/year account for more than 98% of the study area’s trends (Figure S2).
Regarding differences among the climatic zones, BSk, Dtc, Dwb, Dwc, and ET exhibited significant advancement trends, with rates of 0.619, 0.576, 1.01, 0.911, and 0.377 days/decade, respectively (Figure 3). BWk displayed a clear delay trend, with a rate of 0.932 days/decade. Dwa did not exhibit a discernible trend.

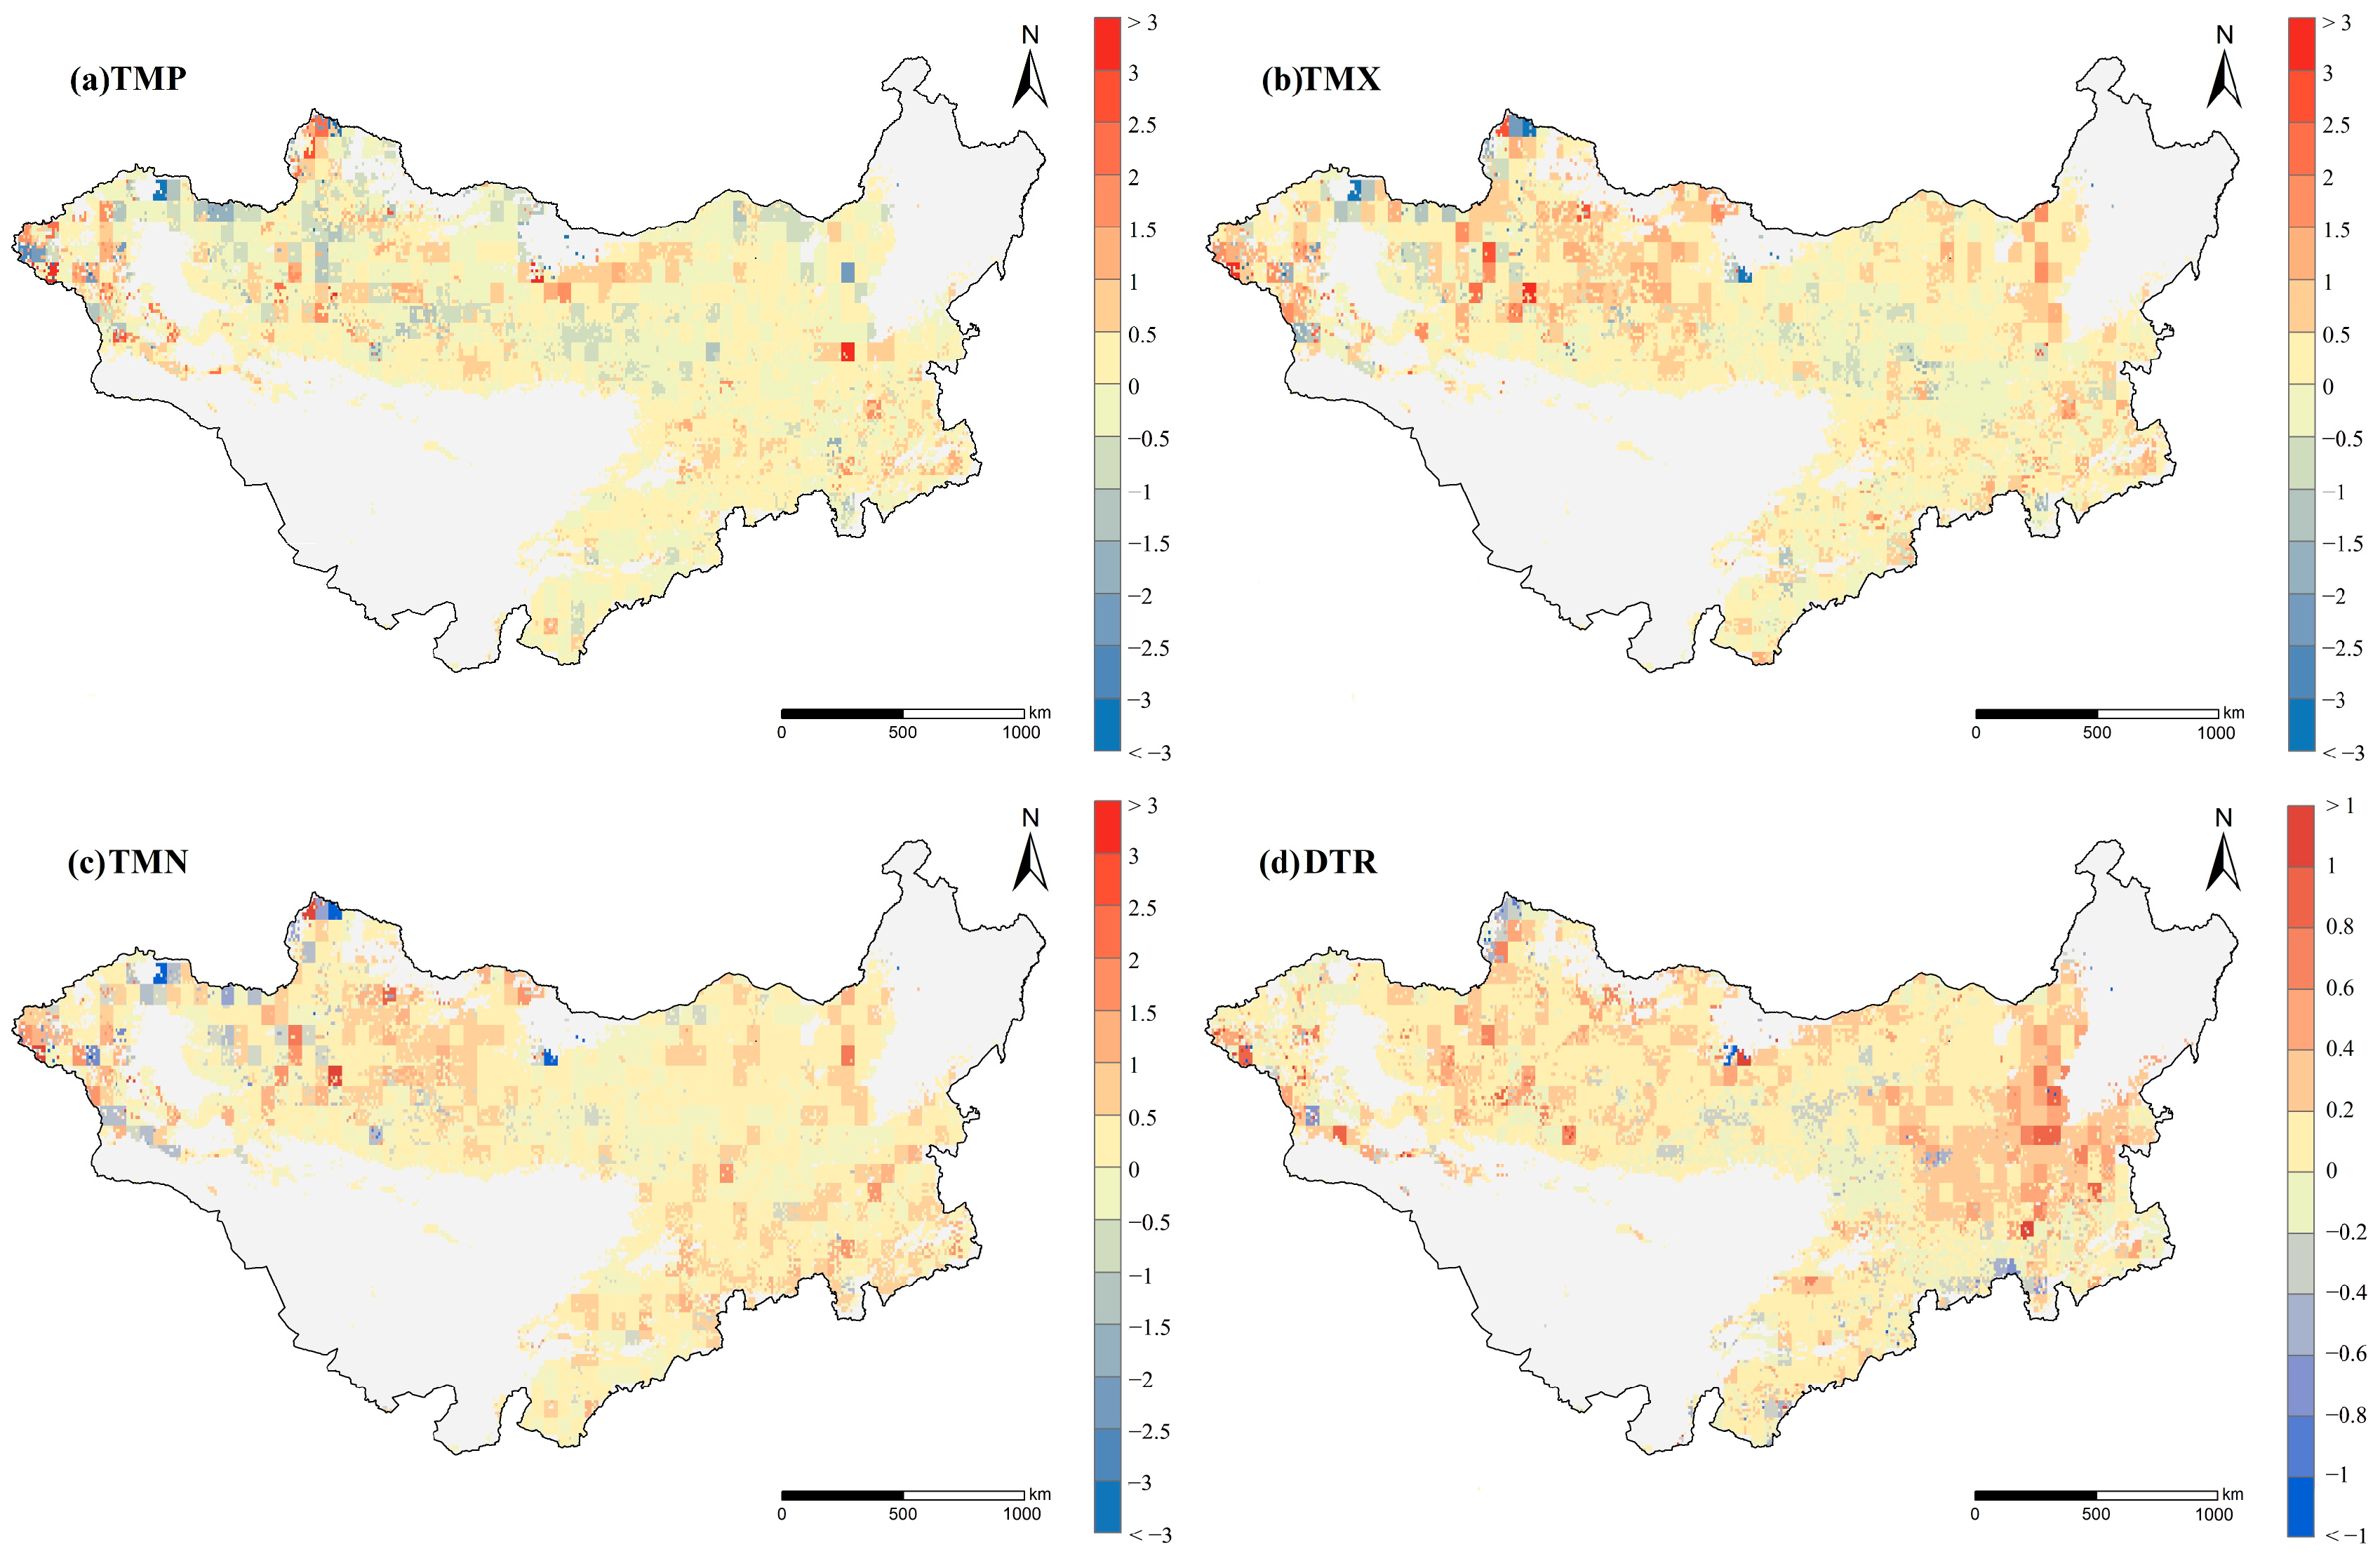
3.2. Correlation between Temperature and GUD

The correlations between the GUD and preseason TMP, TMX, and TMN exhibited comparable latitudinal divergence, with positive correlations observed in the middle MPG and negative correlations observed in the north and south (Figure 4a–c). In contrast, for 69.33% of the pixels, DTR had a positive correlation with GUD (69.33%, Table 1).
In the BWk and Dwa climate zones, an increase in TMP, TMX, and TMN resulted in a delay in GUD (Table S1). Conversely, an increase in DTR was more likely to cause advancement of the GUD. In other climate zones, GUD generally advanced with an increase in TMP, TMX, and TMN.
The GUD increased as the DTR decreased and as the TMP, TMX, and TMN increased in all climate zones. In May and June, the GUD was mainly influenced by the DTR, while in March, it was influenced by the TMP, and in January, it was influenced by both TMX and TMN (Figure 5 and Table S2).

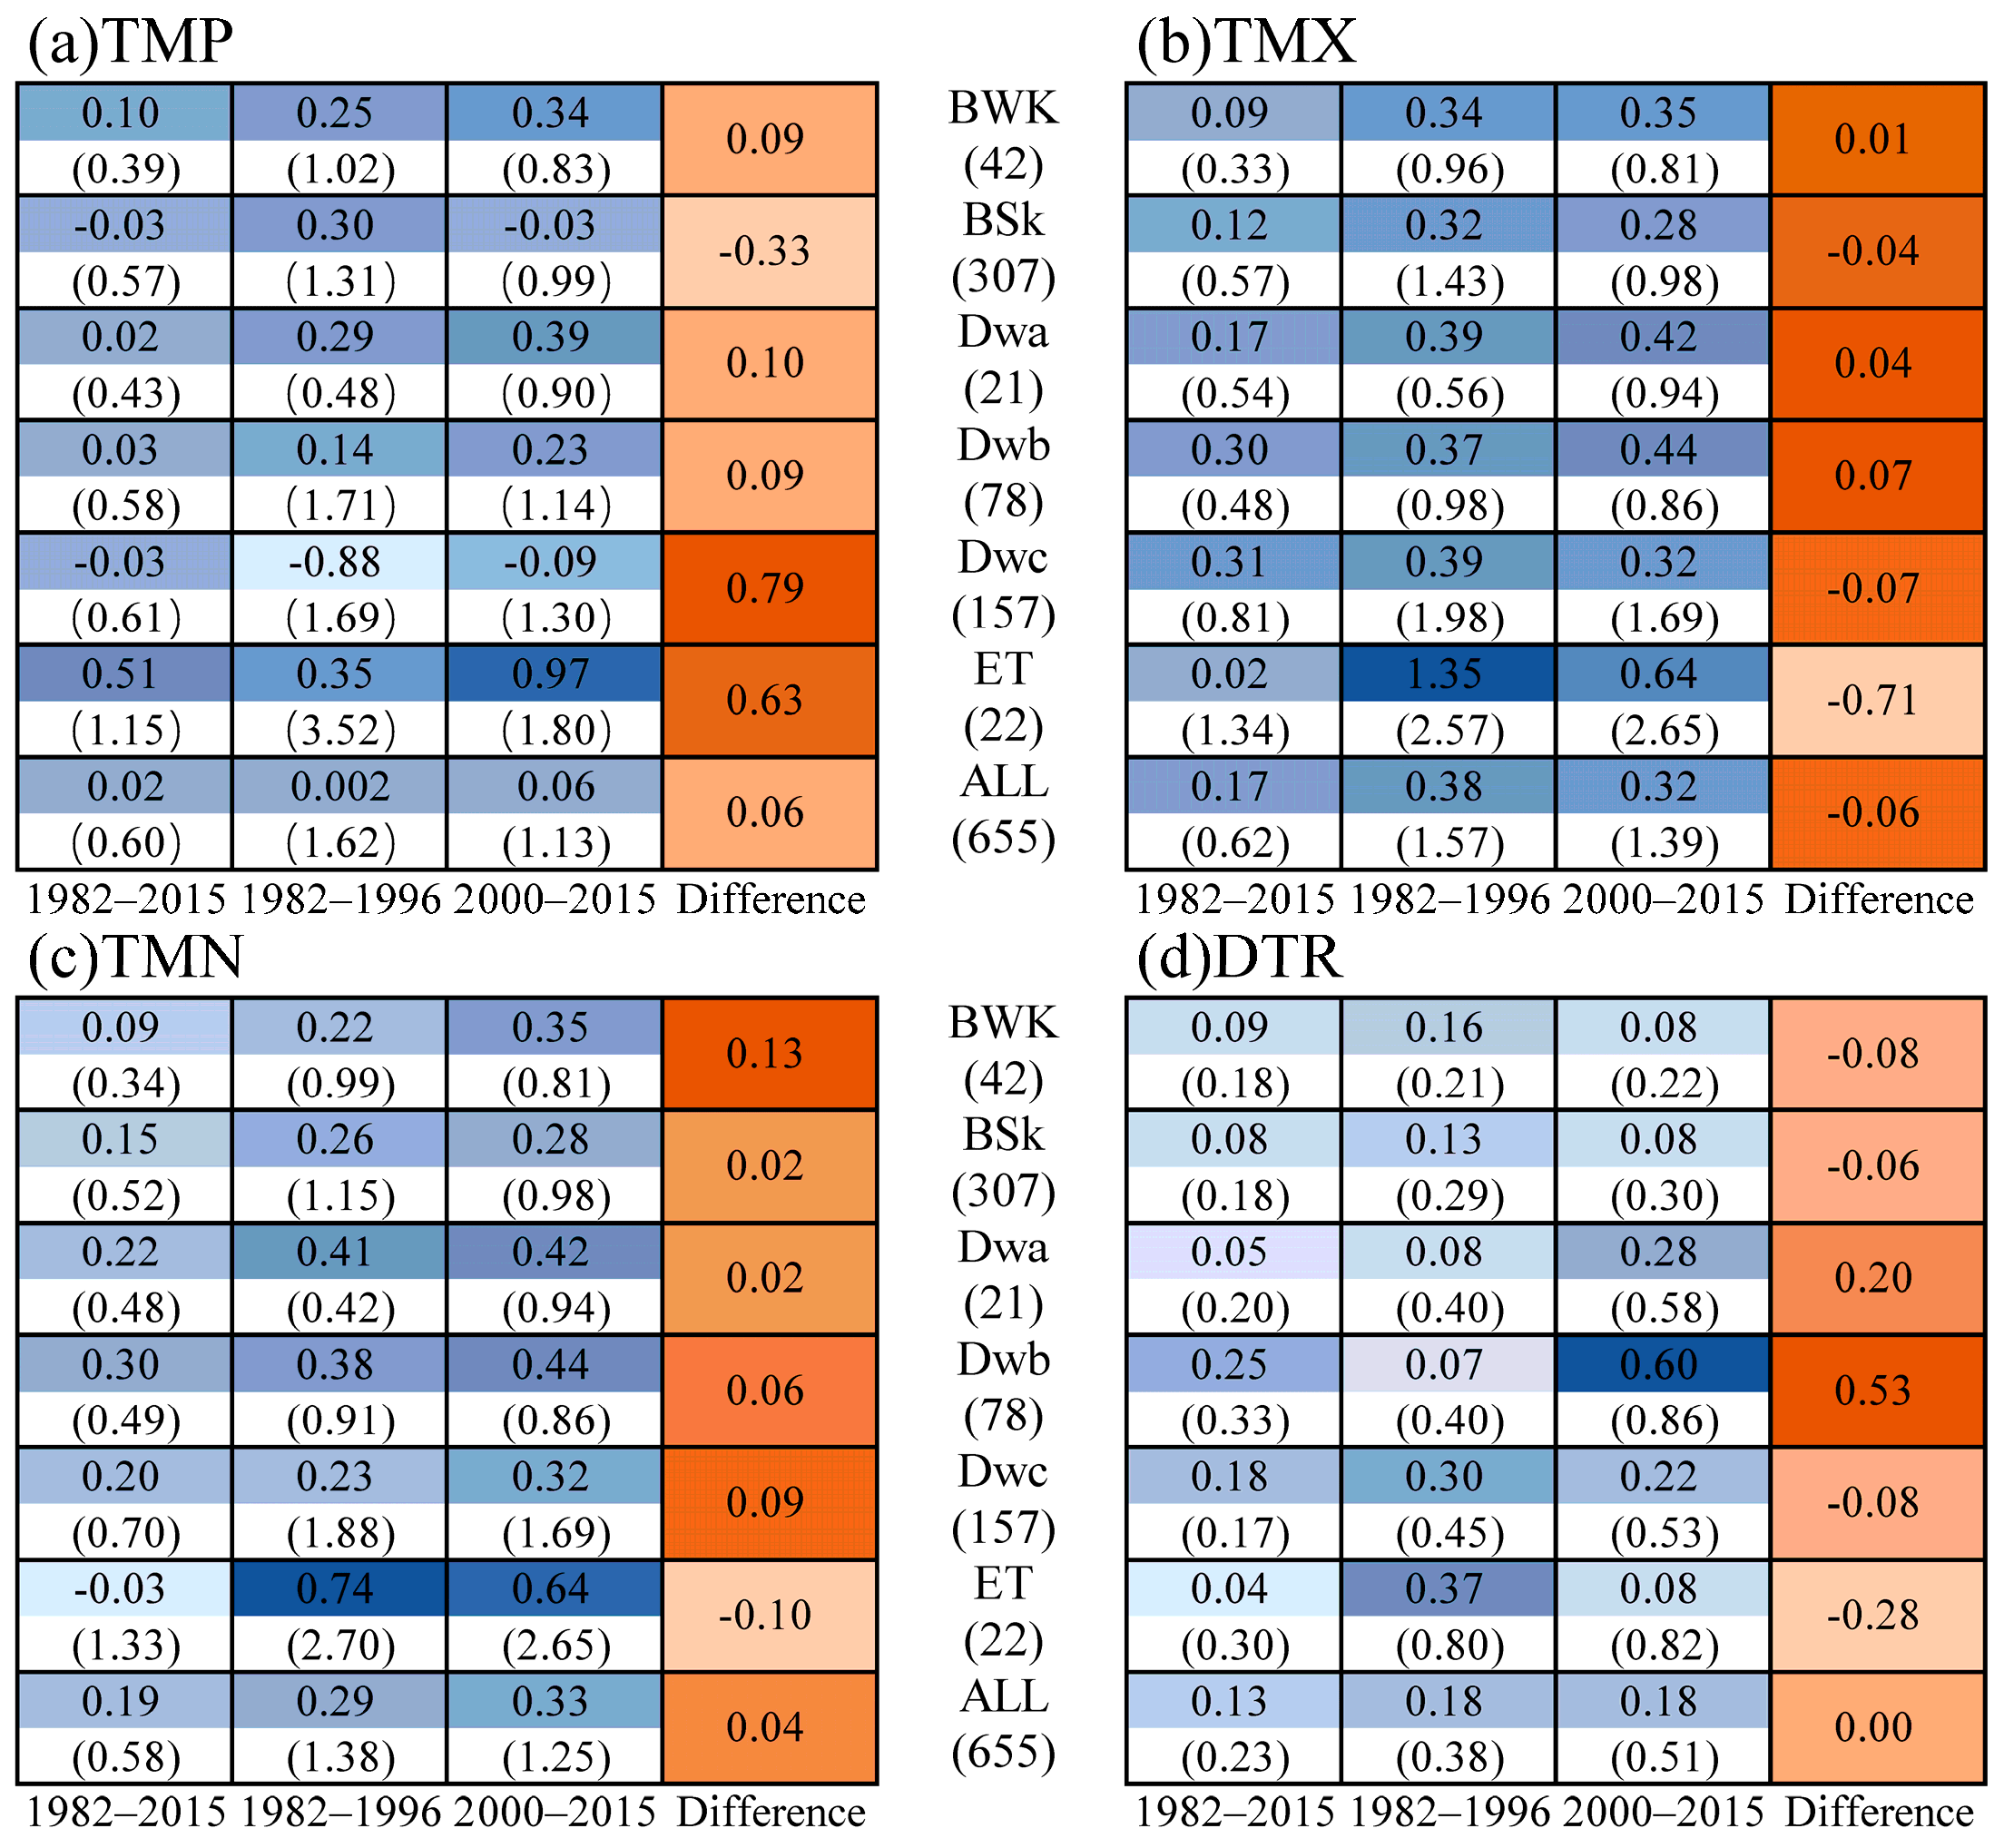
3.3. Sensitivity of the GUD to Temperature

The GUD exhibited a stronger sensitivity to TMX and a weaker sensitivity to TMP in the MPG. Figure 6 shows that an increase in TMP and DTR resulted in a delay in the GUD. The GUD in the northern MPG was highly responsive to TMX and TMN, while that in the western MPG was more sensitive to TMP. The sensitivities of the GUD to temperature (ST) varied across the different climate zones. The polar climate zone (ET) had the highest sensitivity of the GUD to TMP (0.51 d/°C). In the cold climate zone, the GUD became more sensitive to TMX and TMN, in particular, TMN in Dwa (0.3 d/°C) and TMX in Dwb and Dwc (0.3 d/°C, 0.31 d/°C).
The ST for each pixel from 1982 to 2015 was calculated using a 15-year moving window (Figure 7) and the differences among climatic zones (Figure 8). The sensitivity to DTR and TMP increased, while the sensitivity to TMP fluctuated (Figure 8). The GUD was most sensitive to TMN, and this sensitivity increased after 2000. However, it was less sensitive to TMP. The sensitivity of the GUD to DTR was much greater than that to TMX, TMN, and TMP only during the periods of 1996–2010 and 2000–2014.
The sensitivity changes in TMX and TMN were similar, changing from a decrease to an increase in 1997. Different ST trends were observed among the climatic zones (Figure 9). In cold zones, the GUD was more sensitive to temperature fluctuations than in warm zones. As the temperature increased, the maximum ST decreased among the different climate zones.
According to the annual TMP, TMX, TMN, and DTR (Figure S3) and the ST changes calculated using a moving window (Figure 8) from 1982 to 2015 in the Mongolian Plateau grassland, we divided the data into two periods (1982–1996 and 2000–2015) to compare the temporal differences among the climatic zones. The changes in sensitivity in ET to TMP (0.63 d/°C) and TMX (−0.71 d/°C) were the greatest, followed by the change in sensitivity to TMP (0.79 d/°C) in Dwc. The changes in sensitivity to DTR in Dwb (0.53 d/°C) and Dwa (0.2 d/°C) were smaller (Figure 9). However, the ST changes in each temperature parameter were small in the arid climate zones (BSk and BWk). Our results suggest that the GUD response to climate warming is still increasing in the MPG.

4. Discussion

4.1. Correlation between Temperature and the GUD

Both site observations and satellite observations suggested that TMX is the primary determinant of the GUD in the Northern Hemisphere, although the pattern of GUD response to different temperature parameters is more complex [21,23]. However, our study in the MPG revealed that TMN in January had a more significant impact on the GUD than did TMX, which was also observed in other plateaus, such as the Qinghai–Tibet Plateau [27]. Furthermore, the GUD in the MPG, which experiences perennial drought and scarce rainfall (e.g., BWk), is limited by water deficits compared to that in areas with hot summers and dry winters (e.g., Dwa) [37,38]. The increase in DTR, TMP, TMX, and TMN resulted in a delay in the GUD in BWk. In other climate zones, a decrease could result in an advance in the GUD.
TMX and TMN showed different relative importance to the GUD. Therefore, using TMP to analyze the response of the GUD to temperature changes could not reflect the actual influence of temperature on the GUD [23,39]. TMX contributed more to the advancement of the GUD than did TMN. Heat accumulation is necessary for plant growth in temperate regions [23,39]. Prior to the GUD, reaching the temperature threshold at night was more difficult, resulting in the TMN contributing less to the requirement [23]. In addition to TMX and TMN, DTR also affects the GUD in the MPG (Figure 10).
Previous studies have shown that TMX has the most significant effect on the GUD in the mid to high latitudes [40]. However, in our study, DTR was the main factor affecting the GUD (Figure 10). This difference may be because other studies only compared TMX and TMN. The GUD in BWk, Dwb, and Dwc was primarily controlled by DTR, while TMX and TMN were more variable in these climate zones. TMX influences photosynthesis, whereas TMN influences plant respiration. An increase in TMX allows vegetation to photosynthesize and accumulate more nutrients, while organic matter decomposition slows down as TMN decreases. Therefore, an increase in DTR promotes plant growth [23].
Vegetation in cold climate zones, such as ET and Dwa, is highly responsive to changes in TMX. This may be because in spring, high TMX enables plants to sequester carbon and capture heat [39]. TMN has a positive correlation with environmental humidity conditions and has been observed to reduce water stress on plants [41]. For example, BSk, which has a large DTR and low precipitation, is more susceptible to the effects of TMN.

4.2. Sensitivity of the GUD to Temperature

The GUD is sensitive to TMP across the whole MPG. However, it is sensitive to different temperature parameters when climate zones vary. This result suggests that large-scale research may narrow the response of vegetation to climate change on small regional scales.
On the one hand, the GUD is dominated by different temperature parameters in different climatic zones [42,43,44]. The diverse response of the GUD to temperature parameters in various climate zones may lead to insignificant sensitivity results in large-scale research. Higher ST was found in warmer areas in the 30°–80°N region, where the GUD showed an advancing trend [45]. In addition, a higher ST was also found in subarctic, subarctic alpine, and Arctic tundra belt regions than in warm, low-latitude regions. Similar results have been found in the Northern Hemisphere [46]. Compared to that in warm/dry climates, the proportional reduction in ST was greater in cold/wet climates [47]. Therefore, our study can improve our understanding of the response of vegetation phenology to temperature changes by using multiple indicators and climate zones.
On the other hand, some researchers have found that satellite monitoring may overlook the response of different species to climate change [47], resulting in inconsistent ST at the community and species levels [6,48]. In China, for every 1 °C increase in winter TMX, the GUD advanced 0.46 days, while it advanced 0.24 days in temperate desert grasslands [49]. In addition, changes in community composition due to temperature changes can also lead to changes in phenological sensitivity [50]. It is necessary to take the functional types of substratum vegetation into account in long-term series studies.
The determination of the GUD is a trade-off between the growth strategies of reducing growing risks and increasing resource utilization during the growing season [51,52]. Plants growing under unstable spring temperature conditions will adopt a conservative phenological strategy to reduce their risk from climate change or natural disasters [53,54]. Higher daytime temperatures could also exacerbate drought effects [55]. The arid climate zones (BWk and BSk) are less affected by warming because the GUD is affected by water stress, resulting in a lower sensitivity to temperature changes, but the potential mechanisms are not yet clear. Therefore, the effects of water stress on vegetation growth in the MPG require further investigation.

4.3. Limitations

Our study discusses the GUD in the context of a warming climate and explores the effects of four different temperature variables on the GUD. However, BWk, which is the most arid of all the climatic zones (described as desert by the Köppen–Geiger classification) and close to barren landcover (Figure 3), is highly susceptible to desertification and other influences, which could lead to significant differences in vegetation phenology to the other climatic zones. The sensitivities of the GUD to each temperature variable are also similar and may be influenced by other factors (e.g., water stress, landcover type, human activity, or disturbances) (Figure 3). Therefore, pests, diseases, and human activities could also have a large impact on the GUD. For example, grazing and fires can destroy vegetation and cause a sharp decline in the vegetation index, increasing the uncertainty in the GUD [10]. It is difficult to eliminate all disturbances over such a large area, which could lead to uncertainty. Therefore, more factors need to be considered to reduce uncertainty in the results in future research.

5. Conclusions

We found many associations between temperature parameters and the GUD in the Mongolian Plateau grasslands. The spatial patterns of correlations between the GUD and TMP, TMX, and TMN were similar, showing mainly positive correlations in the central part of the MPG, where their increase led to advancing GUD in more than 60% of the MPG. Conversely, the spatial pattern of GUD responses to preseason DTR was reversed.
The GUD in the MPG showed mainly positive correlations with the DTR from January to June, and its spatial pattern was opposite to those of TMP, TMX, and TMN. In other climate zones, the GUD generally advanced with decreasing DTR and increasing TMP, TMX, and TMN, except for in BWk and Dwa. The GUD was more likely to be affected by TMP in March, TMX in January, TMN in January, and DTR in May and June.
The GUD in the MPG was more sensitive to TMX and TMN than to TMP, and the sensitivity of the GUD to DTR showed a steady increasing trend over the past three decades. Both the spatial and temporal patterns of ST differed across the climate zones, with greater variation in ST in colder regions than in warmer regions. However, in the arid climate zones, due to water stress, the sensitivity of each temperature parameter was small, without significant change. Therefore, how water stress affects plant growth should be investigated in the future.

Supplementary Materials

The following supporting information can be downloaded at: https://www.mdpi.com/article/10.3390/rs15153830/s1, Table S1: Köppen–Geiger climate classes; Table S2: The percentages of correlation relationships between the GUD and temperature parameters in the Mongolian Plateau grasslands in each month (%); Figure S1: Landcover types based on MCD12C1 of the Mongolian Plateau; Figure S2: The mean value (upper) and trend (below) of the GUD and its changes with latitude in the Mongolian Plateau in 1982–2015; Figure S3: Annual TMP, TMX, TMN, and DTR (b) from 1982 to 2015 in the Mongolian Plateau grasslands.

Author Contributions

Conceptualization, methodology, and formal analysis: M.W. and J.Z.; writing and visualization: M.W., B.W., Q.W., H.C. and J.G.; writing—editing preparation: M.S.; supervision: J.Z. and H.Z. All authors have read and agreed to the published version of the manuscript.

Funding

This research was funded by the National Natural Science Foundation of China (Grant Nos. 42171321 and 41871330), the basic construction funds (innovation capacity building) for the budget of Jilin Province in 2023 (2023C030-1), and the National Key R&D Program of China (No. 2020YFA0714100).

Data Availability Statement

All data needed to reach the conclusions made in this paper are presented in the paper.

Conflicts of Interest

The authors declare no conflict of interest.

References

  1. Schwartz, M.D.; Ahas, R.; Aasa, A. Onset of Spring Starting Earlier across the Northern Hemisphere: Onset of NH Spring Starting Earlier. Glob. Chang. Biol. 2006, 12, 343–351. [Google Scholar] [CrossRef]
  2. Yang, B.; He, M.; Shishov, V.; Tychkov, I.; Vaganov, E.; Rossi, S.; Ljungqvist, F.C.; Bräuning, A.; Grießinger, J. New Perspective on Spring Vegetation Phenology and Global Climate Change Based on Tibetan Plateau Tree-Ring Data. Proc. Natl. Acad. Sci. USA 2017, 114, 6966–6971. [Google Scholar] [CrossRef] [PubMed]
  3. Richardson, A.D.; Keenan, T.F.; Migliavacca, M.; Ryu, Y.; Sonnentag, O.; Toomey, M. Climate Change, Phenology, and Phenological Control of Vegetation Feedbacks to the Climate System. Agric. For. Meteorol. 2013, 169, 156–173. [Google Scholar] [CrossRef]
  4. Jeong, S.-J.; Ho, C.-H.; Gim, H.-J.; Brown, M.E. Phenology Shifts at Start vs. End of Growing Season in Temperate Vegetation over the Northern Hemisphere for the Period 1982–2008. Glob. Chang. Biol. 2011, 17, 2385–2399. [Google Scholar] [CrossRef]
  5. Menzel, A.; Sparks, T.H.; Estrella, N.; Koch, E.; Aasa, A.; Ahas, R.; Alm-Kübler, K.; Bissolli, P.; Braslavská, O.; Briede, A.; et al. European Phenological Response to Climate Change Matches the Warming Pattern: European Phenological Response to Climate Change. Glob. Chang. Biol. 2006, 12, 1969–1976. [Google Scholar] [CrossRef]
  6. Steltzer, H.; Post, E. Seasons and Life Cycles. Science 2009, 324, 886–887. [Google Scholar] [CrossRef]
  7. Zhao, J.; Zhang, H.; Zhang, Z.; Guo, X.; Li, X.; Chen, C. Spatial and Temporal Changes in Vegetation Phenology at Middle and High Latitudes of the Northern Hemisphere over the Past Three Decades. Remote Sens. 2015, 7, 10973–10995. [Google Scholar] [CrossRef] [Green Version]
  8. Ying, H.; Zhang, H.; Zhao, J.; Shan, Y.; Zhang, Z.; Guo, X.; Rihan, W.; Deng, G. Effects of Spring and Summer Extreme Climate Events on the Autumn Phenology of Different Vegetation Types of Inner Mongolia, China, from 1982 to 2015. Ecol. Indic. 2020, 111, 105974. [Google Scholar] [CrossRef]
  9. Wang, M.; Zhao, J.; Zhang, H.; Zhang, Z.; Guo, X.; Zhang, T.; Wu, R. Detecting the Response Characteristics and Thresholds of Grassland Spring Phenology to Climatic Factors in the Mongolian Plateau. Ecol. Indic. 2023, 153, 110440. [Google Scholar] [CrossRef]
  10. Wurihan; Zhang, H.; Zhang, Z.; Guo, X.; Zhao, J.; Duwala; Shan, Y.; Hong, Y. Understanding the spatio-temporal pattern of fire disturbance in the eastern mongolia using modis product. Int. Arch. Photogramm. Remote Sens. Spat. Inf. Sci. 2018, XLII–3, 1921–1924. [Google Scholar] [CrossRef] [Green Version]
  11. Chen, L.; Huang, J.-G.; Ma, Q.; Hänninen, H.; Rossi, S.; Piao, S.; Bergeron, Y. Spring Phenology at Different Altitudes Is Becoming More Uniform under Global Warming in Europe. Glob. Chang. Biol. 2018, 24, 3969–3975. [Google Scholar] [CrossRef] [PubMed]
  12. Vitasse, Y.; Porte, A.J.; Kremer, A.; Michalet, R.; Delzon, S. Responses of Canopy Duration to Temperature Changes in Four Temperate Tree Species: Relative Contributions of Spring and Autumn Leaf Phenology. Oecologia 2009, 161, 187–198. [Google Scholar] [CrossRef]
  13. White, M.A.; de Beurs, K.M.; Didan, K.; Inouye, D.W.; Richardson, A.D.; Jensen, O.P.; O’Keefe, J.; Zhang, G.; Nemani, R.R.; van Leeuwen, W.J.D.; et al. Intercomparison, Interpretation, and Assessment of Spring Phenology in North America Estimated from Remote Sensing for 1982–2006. Glob. Chang. Biol. 2009, 15, 2335–2359. [Google Scholar] [CrossRef]
  14. Piao, S.; Fang, J.; Zhou, L.; Ciais, P.; Zhu, B. Variations in Satellite-Derived Phenology in China’s Temperate Vegetation. Glob. Chang. Biol. 2006, 12, 672–685. [Google Scholar] [CrossRef]
  15. Cui, X.; Xu, G.; He, X.; Luo, D. Influences of Seasonal Soil Moisture and Temperature on Vegetation Phenology in the Qilian Mountains. Remote Sens. 2022, 14, 3645. [Google Scholar] [CrossRef]
  16. Ding, M.; Li, L.; Nie, Y.; Chen, Q.; Zhang, Y. Spatio-Temporal Variation of Spring Phenology in Tibetan Plateau and Its Linkage to Climate Change from 1982 to 2012. J. Mt. Sci. 2016, 13, 83–94. [Google Scholar] [CrossRef]
  17. Donnelly, A.; Yu, R.; Liu, L. Trophic Level Responses Differ as Climate Warms in Ireland. Int. J. Biometeorol. 2015, 59, 1007–1017. [Google Scholar] [CrossRef]
  18. Lin, M.; Zhou, Y.; Li, X.; Asrar, G.R.; Mao, J.; Wanamaker, A.D.; Wang, Y. Divergent Responses of Spring Phenology to Daytime and Nighttime Warming. Agric. For. Meteorol. 2020, 281, 107832. [Google Scholar] [CrossRef]
  19. Wu, C.; Wang, X.; Wanag, H.; Ciais, P.; Peñuelas, J.; Myneni, R.B.; Desai, A.R.; Gough, C.M.; Gonsamo, A.; Black, A.T.; et al. Contrasting Responses of Autumn-Leaf Senescence to Daytime and Night-Time Warming. Nat. Clim. Change 2018, 8, 1092–1096. [Google Scholar] [CrossRef] [Green Version]
  20. Yang, Z.; Shen, M.; Jia, S.; Li, G.; Jin, C. Asymmetric Responses of the End of Growing Season to Daily Maximum and Minimum Temperatures on the Tibetan Plateau. J. Geophys. Res. Atmos. 2017, 122. [Google Scholar] [CrossRef]
  21. Peng, S.; Piao, S.; Ciais, P.; Friedlingstein, P.; Zhou, L.; Wang, T. Change in Snow Phenology and Its Potential Feedback to Temperature in the Northern Hemisphere over the Last Three Decades. Environ. Res. Lett. 2013, 8, 014008. [Google Scholar] [CrossRef] [Green Version]
  22. Rossi, S.; Isabel, N. Bud Break Responds More Strongly to Daytime than Night-Time Temperature under Asymmetric Experimental Warming. Glob. Chang. Biol. 2017, 23, 446–454. [Google Scholar] [CrossRef] [Green Version]
  23. Piao, S.; Tan, J.; Chen, A.; Fu, Y.H.; Ciais, P.; Liu, Q.; Janssens, I.A.; Vicca, S.; Zeng, Z.; Jeong, S.-J.; et al. Leaf Onset in the Northern Hemisphere Triggered by Daytime Temperature. Nat. Commun. 2015, 6, 6911. [Google Scholar] [CrossRef] [Green Version]
  24. Fu, Y.H.; Liu, Y.; Boeck, H.; Menzel, A.; Nijs, I.; Peaucelle, M.; Peñuelas, J.; Piao, S.; Janssens, I.A. Three Times Greater Weight of Daytime than of Night-Time Temperature on Leaf Unfolding Phenology in Temperate Trees. New Phytol. 2016. [Google Scholar] [CrossRef] [Green Version]
  25. Dox, I.; Gričar, J.; Marchand, L.J.; Leys, S.; Zuccarini, P.; Geron, C.; Prislan, P.; Mariën, B.; Fonti, P.; Lange, H.; et al. Timeline of Autumn Phenology in Temperate Deciduous Trees. Tree Physiol. 2021, 40, 1001–1013. [Google Scholar] [CrossRef]
  26. Shen, X.; Liu, B.; Lu, X. Weak Cooling of Cold Extremes Versus Continued Warming of Hot Extremes in China During the Recent Global Surface Warming Hiatus. J. Geophys. Res. Atmos. 2018, 123, 4073–4087. [Google Scholar] [CrossRef]
  27. Shen, M.; Piao, S.; Chen, X.; An, S.; Fu, Y.H.; Wang, S.; Cong, N.; Janssens, I.A. Strong Impacts of Daily Minimum Temperature on the Green-up Date and Summer Greenness of the Tibetan Plateau. Glob. Chang. Biol. 2016, 22, 3057–3066. [Google Scholar] [CrossRef] [PubMed]
  28. Wang, X.; Gao, Q.; Wang, C.; Yu, M. Spatiotemporal Patterns of Vegetation Phenology Change and Relationships with Climate in the Two Transects of East China. Glob. Ecol. Conserv. 2017, 10, 206–219. [Google Scholar] [CrossRef]
  29. Shen, X.; Liu, B.; Li, G.; Wu, Z.; Jin, Y.; Yu, P.; Zhou, D. Spatiotemporal Change of Diurnal Temperature Range and Its Relationship with Sunshine Duration and Precipitation in China. J. Geophys. Res. Atmos. 2014, 119, 13163–13179. [Google Scholar] [CrossRef]
  30. Thackeray, S.J.; Henrys, P.A.; Hemming, D.; Bell, J.R.; Botham, M.S.; Burthe, S.; Helaouet, P.; Johns, D.G.; Jones, I.D.; Leech, D.I.; et al. Phenological Sensitivity to Climate across Taxa and Trophic Levels. Nature 2016, 535, 241–245. [Google Scholar] [CrossRef] [PubMed] [Green Version]
  31. Wolkovich, E.M.; Cook, B.I.; Allen, J.M.; Crimmins, T.M.; Betancourt, J.L.; Travers, S.E.; Pau, S.; Regetz, J.; Davies, T.J.; Kraft, N.J.B.; et al. Warming Experiments Underpredict Plant Phenological Responses to Climate Change. Nature 2012, 485, 494–497. [Google Scholar] [CrossRef]
  32. Dai, W.; Jin, H.; Zhang, Y.; Zhou, Y.; Liu, T. Advances in plant phenology. Acta Ecol. Sin. 2020, 40, 6705–6719. [Google Scholar]
  33. Dee, D.P.; Uppala, S.M.; Simmons, A.J.; Berrisford, P.; Poli, P.; Kobayashi, S.; Andrae, U.; Balmaseda, M.A.; Balsamo, G.; Bauer, P.; et al. The ERA-Interim Reanalysis: Configuration and Performance of the Data Assimilation System. Q. J. R. Meteorol. Soc. 2011, 137, 553–597. [Google Scholar] [CrossRef]
  34. Pinzon, J.; Tucker, C. A Non-Stationary 1981–2012 AVHRR NDVI3g Time Series. Remote Sens. 2014, 6, 6929–6960. [Google Scholar] [CrossRef] [Green Version]
  35. Brown, M.E.; de Beurs, K.; Vrieling, A. The Response of African Land Surface Phenology to Large Scale Climate Oscillations. Remote Sens. Environ. 2010, 114, 2286–2296. [Google Scholar] [CrossRef] [Green Version]
  36. Chen, J.; Jönsson, P.; Tamura, M.; Gu, Z.; Matsushita, B.; Eklundh, L. A Simple Method for Reconstructing a High-Quality NDVI Time-Series Data Set Based on the Savitzky–Golay Filter. Remote Sens. Environ. 2004, 91, 332–344. [Google Scholar] [CrossRef]
  37. Pangtey, Y.P.S.; Rawal, R.S.; Bankoti, N.S.; Samant, S.S. Phenology of High-Altitude Plants of Kumaun in Central Himalaya, India. Int. J. Biometeorol. 1990, 34, 122–127. [Google Scholar] [CrossRef]
  38. Dorji, T.; Totland, Ø.; Moe, S.R.; Hopping, K.A.; Pan, J.; Klein, J.A. Plant Functional Traits Mediate Reproductive Phenology and Success in Response to Experimental Warming and Snow Addition in Tibet. Glob. Chang. Biol. 2013, 19, 459–472. [Google Scholar] [CrossRef] [PubMed]
  39. Shen, M. Spring Phenology Was Not Consistently Related to Winter Warming on the Tibetan Plateau. Proc. Natl. Acad. Sci. USA 2011, 108, E91–E92. [Google Scholar] [CrossRef]
  40. Deng, G.; Zhang, H.; Guo, X.; Shan, Y.; Ying, H.; Rihan, W.; Li, H.; Han, Y. Asymmetric Effects of Daytime and Nighttime Warming on Boreal Forest Spring Phenology. Remote Sens. 2019, 11, 1651. [Google Scholar] [CrossRef] [Green Version]
  41. Crimmins, T.M.; Crimmins, M.A.; Bertelsen, C.D. Onset of Summer Flowering in a ‘Sky Island’ Is Driven by Monsoon Moisture. New Phytol. 2011, 191, 468–479. [Google Scholar] [CrossRef] [PubMed]
  42. Craine, J.M.; Wolkovich, E.M.; Gene Towne, E.; Kembel, S.W. Flowering Phenology as a Functional Trait in a Tallgrass Prairie. New Phytol. 2012, 193, 673–682. [Google Scholar] [CrossRef]
  43. Prevéy, J.; Vellend, M.; Rüger, N.; Hollister, R.D.; Bjorkman, A.D.; Myers-Smith, I.H.; Elmendorf, S.C.; Clark, K.; Cooper, E.J.; Elberling, B.; et al. Greater Temperature Sensitivity of Plant Phenology at Colder Sites: Implications for Convergence across Northern Latitudes. Glob. Chang. Biol. 2017, 23, 2660–2671. [Google Scholar] [CrossRef] [Green Version]
  44. van Schaik, C.P.; Terborgh, J.W.; Wright, S.J. The Phenology of Tropical Forests: Adaptive Significance and Consequences for Primary Consumers. Annu. Rev. Ecol. Syst. 1993, 24, 353–377. [Google Scholar] [CrossRef]
  45. Shen, M.; Tang, Y.; Chen, J.; Yang, X.; Wang, C.; Cui, X.; Yang, Y.; Han, L.; Li, L.; Du, J.; et al. Earlier-Season Vegetation Has Greater Temperature Sensitivity of Spring Phenology in Northern Hemisphere. PLoS ONE 2014, 9, e88178. [Google Scholar] [CrossRef] [PubMed]
  46. Li, K.; Wang, C.; Sun, Q.; Rong, G.; Tong, Z.; Liu, X.; Zhang, J. Spring Phenological Sensitivity to Climate Change in the Northern Hemisphere: Comprehensive Evaluation and Driving Force Analysis. Remote Sens. 2021, 13, 1972. [Google Scholar] [CrossRef]
  47. Meng, F.; Zhang, L.; Niu, H.; Suonan, J.; Zhang, Z.; Wang, Q.; Li, B.; Lv, W.; Wang, S.; Duan, J.; et al. Divergent Responses of Community Reproductive and Vegetative Phenology to Warming and Cooling: Asymmetry Versus Symmetry. Front. Plant Sci. 2019, 10, 1310. [Google Scholar] [CrossRef] [Green Version]
  48. Suonan, J.; Classen, A.T.; Sanders, N.J.; He, J. Plant Phenological Sensitivity to Climate Change on the Tibetan Plateau and Relative to Other Areas of the World. Ecosphere 2019, 10, e02543. [Google Scholar] [CrossRef]
  49. Shen, X.; Liu, B.; Henderson, M.; Wang, L.; Wu, Z.; Wu, H.; Jiang, M.; Lu, X. Asymmetric Effects of Daytime and Nighttime Warming on Spring Phenology in the Temperate Grasslands of China. Agric. For. Meteorol. 2018, 259, 240–249. [Google Scholar] [CrossRef]
  50. Meng, F.; Cui, S.; Wang, S.; Duan, J.; Jiang, L.; Zhang, Z.; Luo, C.; Wang, Q.; Zhou, Y.; Li, X.; et al. Changes in Phenological Sequences of Alpine Communities across a Natural Elevation Gradient. Agric. For. Meteorol. 2016, 224, 11–16. [Google Scholar] [CrossRef] [Green Version]
  51. Tang, J.; Körner, C.; Muraoka, H.; Piao, S.; Shen, M.; Thackeray, S.J.; Yang, X. Emerging Opportunities and Challenges in Phenology: A Review. Ecosphere 2016, 7, e01436. [Google Scholar] [CrossRef] [Green Version]
  52. Bennie, J.; Kubin, E.; Wiltshire, A.; Huntley, B.; Baxter, R. Predicting Spatial and Temporal Patterns of Bud-Burst and Spring Frost Risk in North-West Europe: The Implications of Local Adaptation to Climate. Glob. Chang. Biol. 2010, 16, 1503–1514. [Google Scholar] [CrossRef]
  53. Zohner, C.M.; Benito, B.M.; Fridley, J.D.; Svenning, J.-C.; Renner, S.S. Spring Predictability Explains Different Leaf-out Strategies in the Woody Floras of North America, Europe and East Asia. Ecol. Lett. 2017, 20, 452–460. [Google Scholar] [CrossRef] [PubMed] [Green Version]
  54. Wang, T.; Ottlé, C.; Peng, S.; Janssens, I.A.; Lin, X.; Poulter, B.; Yue, C.; Ciais, P. The Influence of Local Spring Temperature Variance on Temperature Sensitivity of Spring Phenology. Glob. Chang. Biol. 2014, 20, 1473–1480. [Google Scholar] [CrossRef]
  55. Yu, H.; Luedeling, E.; Xu, J. Winter and Spring Warming Result in Delayed Spring Phenology on the Tibetan Plateau. Proc. Natl. Acad. Sci. USA 2010, 107, 22151–22156. [Google Scholar] [CrossRef]
Figure 1. Köppen–Geiger climate classification of the Mongolian Plateau grasslands.
Remotesensing 15 03830 g001
Figure 2. Spatial distribution of the mean GUD (a) and the GUD trend from 1982 to 2015 (b).
Remotesensing 15 03830 g002
Figure 3. Trends in GUDs in different climatic regions from 1982 to 2015 in the Mongolia Plateau Grassland. (The dots, blue line, and gray shadow represent the annual GUD values, linear trend, and confidence interval, respectively, for each climatic region.)
Remotesensing 15 03830 g003
Figure 4. Spatial distribution of the maximum correlation coefficient absolute values between four temperature parameters and the annual average GUD in the six months of the preseason in the Mongolian Plateau grasslands.
Remotesensing 15 03830 g004
Figure 5. Spatial distribution of preseason months corresponding to the maximum absolute values of correlation coefficients between the GUD and four temperature parameters in the Mongolian Plateau grasslands.
Remotesensing 15 03830 g005
Figure 6. Spatial patterns of GUD sensitivity to temperature parameters (ad). The histograms describe the proportion of sensitivity of the GUD in each pixel across different climate zones.
Remotesensing 15 03830 g006
Figure 7. Temporal change in the GUD sensitivity and TMP, TMX, TMN, and DTR in the Mongolian Plateau grasslands in a 15-year moving window for the period 1982–2015.
Remotesensing 15 03830 g007
Figure 8. The proportions of sensitivity between temperature parameters (TMP, TMX, TMN, and DTR, plotted in different colors) and GUD in each climate zone. The colored box above 0 represents the percentage of positive sensitivity, and the box below 0 represents the percentage of negative sensitivity.
Remotesensing 15 03830 g008
Figure 9. Temperature sensitivity and its standard deviation (SD, in parentheses) in the Mongolian Plateau grasslands in three periods and its difference between 2000–2015 and 1982–1996. The color scale indicates the magnitude of temperature sensitivity. The number of pixels for each climate zone is in parentheses below the climate zone name.
Remotesensing 15 03830 g009
Figure 10. The importance of temperature parameters to the GUD in the Mongolian Plateau grasslands across the climate zones. (%IncMSE here denotes the increase in the mean squared error. The larger this value, the more important the variable is.).
Remotesensing 15 03830 g010
Table 1. The percentages of correlation relationships between the GUD and temperature parameters in the Mongolian Plateau grasslands in each climate zone (%).
Climate ZoneTMPTMXTMNDTR
PostiveNegativePostiveNegativePostiveNegativePostiveNegative
BWk61.8438.1665.5934.4158.7641.2442.4157.59
BSk37.5165.4943.5656.4433.5466.4666.733.3
Dwa73.8826.1282.7517.2558.5741.4337.6762.33
Dwb19.5780.4328.6971.3115.4764.5384.3515.65
Dwc17.8282.1821.5078.515.4484.5685.5814.42
ET35.8364.1736.8363.1734.7165.2964.9235.08
Disclaimer/Publisher’s Note: The statements, opinions and data contained in all publications are solely those of the individual author(s) and contributor(s) and not of MDPI and/or the editor(s). MDPI and/or the editor(s) disclaim responsibility for any injury to people or property resulting from any ideas, methods, instructions or products referred to in the content.

