Article

Long-Term Characteristics of Surface Soil Moisture over the Tibetan Plateau and Its Response to Climate Change

1
Collaborative Innovation Center on Forecast and Evaluation of Meteorological Disasters, Nanjing University of Information Science & Technology, Nanjing 210044, China
2
Hydro-Climate Extremes Lab, Ghent University, 9000 Ghent, Belgium
3
Shandong Climate Center, Jinan 250031, China
4
School of Atmospheric Science & Remote Sensing, Wuxi University, Wuxi 214105, China
5
Faculty of Defense and Security, Rabdan Academy, Abu Dhabi 114646, United Arab Emirates
*
Author to whom correspondence should be addressed.
Remote Sens. 2023, 15(18), 4414; https://doi.org/10.3390/rs15184414
Submission received: 12 July 2023 / Revised: 31 August 2023 / Accepted: 5 September 2023 / Published: 7 September 2023

Abstract

:
Soil moisture over the Tibetan Plateau (TP) can affect hydrological cycles on local and remote scales through land–atmosphere interactions. However, TP long-term surface soil moisture characteristics and their response to climate change are still unclear. In this study, we firstly evaluate two satellite-based products—SSM/I (the Special Sensor Microwave Imagers) and ECV COMBINED (the Essential Climate Variable combined)—and three reanalysis products—ERA5-Land (the fifth generation of the land component of the European Centre for Medium-Range Weather Forecasts atmospheric reanalysis), MERRA2 (the second version of Modern-Era Retrospective Analysis for Research and Applications), and GLDAS Noah (the Noah land surface model driven by Global Land Data Assimilation System)—against two in situ observation networks. SSM/I and GLDAS Noah outperform the other soil moisture products, followed by MERRA2 and ECV COMBINED, and ERA5-Land has a certain degree of uncertainty in evaluating TP surface soil moisture. Analysis of long-term soil moisture characteristics during 1988–2008 shows that annual and seasonal mean soil moisture have similar spatial distributions of soil moisture decreasing from southeast to northwest. Additionally, a significant increasing trend of soil moisture is found in most of the TP region. With a non-linear machine learning method, we quantify the contribution of each climatic variable to warm-season soil moisture. It indicates that precipitation dominates soil moisture changes rather than air temperature. Pixel-wise partial correlation coefficients further show that there are significant positive correlations between precipitation and soil moisture over most of the TP region. The results of this study will help to understand the role of TP soil moisture in land–atmosphere coupling and hydrological cycles under climate change.

1. Introduction

Soil moisture (SM) stored in the unsaturated zone, second only to sea surface temperature (SST), can affect the global water and energy cycle, as well as land–atmosphere coupling, although it only accounts for 0.005% of Earth’s water by volume [1,2,3]. The basic mechanism is that changes in soil moisture directly control surface energy partitioning [4,5]. Decreasing soil moisture tends to reduce evapotranspiration and increase sensible heat according to surface energy balance, making the near-surface environment drier and warmer [6]. If soil moisture increases, more evapotranspiration and less sensible heat can make cloud formation and precipitation [7]. Soil moisture can also non-locally affect precipitation through modulating mesoscale circulations [8]. Decreasing soil moisture can strengthen land–atmosphere coupling [9], improve the possibility of extreme events (e.g., droughts and heatwaves) [10], and limit the vegetation growth and crop field [11,12].
The Tibetan Plateau (TP), known as “The third pole of the world” and “Asia’s water towers”, meets the water demand of about 2 billion people over its surrounding downstream regions [13]. However, the sustainability of TP terrestrial water storage has been threatened by climate change [14,15]. It is urgent to fully understand the responses of the water cycle to climate change over the TP and its underlying mechanism. As one of the main hydrological components, TP soil moisture can not only affect local land–atmosphere interactions through surface energy partitioning [16], but also remotely affect weather and climate through large-scale atmospheric circulations [17,18].
Soil moisture consists of surface and root-zone soil moisture [16]. The former represents the water content of the upper soil layer, and the latter means the water which is available to plant roots. So far, site-based observations are the most effective method for obtaining true soil moisture at different layers [2]. Plenty of techniques are used to measure soil moisture with ground instruments, such as the gravimetric method [19], time domain reflectometry [20], neutron probes [21], and heat pulse sensors [22]. However, the distribution of observation sites is quite sparse, especially for the TP region with harsh environmental conditions and complex topography [23], despite the fact that numerous scholars tried to establish global long-term observation networks with ground measurements [24].
Satellite observations provide an alternative way to estimate global-scale soil moisture. It has the advantages of low-cost, quick revisiting period and all-weather [25]. There are several widely used soil moisture products retrieved by multiple satellite sensors: the Special Sensor Microwave Imager (SSM/I), Soil Moisture Active Passive (SMAP), Soil Moisture and Ocean Salinity (SMOS), Advanced Scatterometer (ASCAT), and Advanced Microwave Scanning Radiometer-Earth Observing System/2 (AMSR-E/2) [26,27,28,29,30,31]. Additionally, the Essential Climate Variable combined (ECV COMBINED) soil moisture product with good performance is produced by European Space Agency Climate Change Initiative (ESA CCI) by merging the above several satellite observations [32].
Satellite-based soil moisture products have been widely used to study the soil moisture-climate relationships [33]. However, many scholars point out soil moisture retrieved with remote sensing only reflects surface moisture at a very shallow upper layer (0~5 cm) [33,34]. Considering this, they try to estimate root-zone soil moisture as an alternative based on satellite-based soil moisture [35], or directly use root-zone soil moisture simulated by climate models or land surface models [36]. For example, global long-term root-zone reanalysis data for ERA5-Land, MERRA2, and GLDAS Noah are widely used [37,38,39]. However, surface soil moisture and root-zone soil moisture are strongly connected. Feldman et al. [40] point out that satellite-based soil moisture has a good potential to capture the dynamics of vegetation water uptake, especially for grass and crop vegetation types. It is due to the existing hydraulic connectivity and spatiotemporal memory between surface and root-zone soil moisture [41,42]. Similar results were found in the interpretation of soil moisture–evapotranspiration coupling for surface and root-zone soil moisture [43]. Therefore, efforts are made to study surface soil moisture here.
There are some limitations and uncertainties existing in soil moisture products. For satellite-based surface soil moisture, its performance may be affected by the reference parameters used in the retrieval algorithm [26,44], and the accuracy of original microwave observations (subject to dense vegetation, surface water, anthropogenic radio-frequency interference, etc.) [32,45]. For reanalysis soil moisture, its performance can be affected by the assimilated reference observations, model parameterizations (e.g., deep convection and soil properties) as well as the representation of topography [46,47]. Therefore, it is necessary to evaluate the performance of soil moisture products before practical applications. Numerous research teams have made great efforts to try to establish long-term soil moisture observation networks over the TP with ground techniques [23,48,49,50,51], which provides the opportunity for achieving TP soil moisture validation. Related evaluation studies of soil moisture products have been conducted over the TP against observation networks, such as the Naqu network, Maqu network, Pali network, Ngari network, and the Shiquanhe network [47,52,53,54].
To our knowledge, until now, long-term annual and seasonal trends in soil moisture over the TP region have not been fully estimated, due to remote sensing products mostly starting after the 2000s [55]. At the background of climate warming, long-term soil moisture characteristics over the southeastern TP have been abruptly changed since the 1880s, showing enhanced variability and a decreasing trend [56]. Air temperature and precipitation are thought to be two main factors of controlling soil moisture changes over the TP [56,57]. Air temperature and precipitation have significantly changed during recent decades. After the 2000s, the rising rate of surface temperature over the TP region is more than 0.29 °C decade−1, especially for glacier regions [58]. Increasing precipitation during the most recent three decades is found in most of the TP region on annual and seasonal scales [59]. Recent studies show that precipitation, not air temperature, controls soil moisture changes over the TP [60,61]. These conclusions were obtained with linear correlations, but the relationships between soil moisture and climate are nonlinear [62]. Recently, machine learning-based attribution methods have been used to study the nonlinear relationships [63].
In this study, we firstly evaluate the performance of five common long-term surface soil moisture products against two sets of observations over the TP. These products include two satellite-based products (SSM/I and ECV COMBINED) and three reanalysis products (ERA5-Land, MERRA2 and GLDAS Noah). Soil moisture ground observations come from the coordinated enhanced observing period (CEOP) Asia-Australia monsoon project (CAMP) on the Tibetan Plateau (CAMP/Tibet) and a synthesis dataset released by Zhao Lin and Hu Guojie et al. (Zhao2021). Then, the mean and trend patterns of TP soil moisture are shown during 1988–2008 for these products on the annual and seasonal scales. Finally, we establish the nonlinear relationship between soil moisture and climatic variables during the warm season (May to October) with machine learning (e.g., random forest), and quantify the importance of each variable on soil moisture over the TP.

2. Study Area

TP is known as “The third pole of the world”, which has the largest frozen water storage after the polar regions. It is also termed “Asia’s water towers”, because it is the source of 13 major river systems that feed almost 2 billion people [13]. It is located in the southwestern part of China at 80–105°E and 28–37°N, and it is the highest plateau in the world, with an average elevation of above 4000 m (Figure 1c).
The elevated topography of the TP exerts great dynamic and thermal effects on the weather and climate of local and surrounding regions [64]. According to long-term climate data records during 1961–2010, the annual average air temperature over the TP is between −2.2~0 °C [65]. The highest air temperature occurs in July, which can reach 15 °C, while the lowest temperature in January can be as low as −10.3 °C. The precipitation over the TP is strongly affected by the westerlies and Asian summer monsoon [66], with approximately 80% of the precipitation occurring during the summer monsoon period. The annual mean precipitation over the TP is between 415 and 512 mm [67]. Due to the continuous increase in elevation, the total precipitation gradually decreases from southeast (with up to 900 mm) to northwest (only up to 60 mm) [26].
According to a Multi-source Integrated Chinese Land Cover (MICLCover) map generated by Ran et al. [68], there are 17 land cover classifications over the TP. Grasslands dominate the TP region, mainly distributed south of 35°N. Secondly, there are barren or sparsely vegetated areas, mainly distributed over the northern TP. There are also evergreen forests at the southeastern edge, which may be related to abundant summer monsoon precipitation. There are some permanent wetlands, water bodies and snow and ice spreading over the TP as well (Figure 1a).

3. Data and Methods

3.1. Data

In this study, two sets of in situ measurements (Table 1) are used to evaluate multi-source (i.e., satellite and reanalysis) soil moisture products (Table 2) over the TP. The following are detailed descriptions.

3.1.1. In Situ Measurements

CAMP/Tibet

The coordinated enhanced observing period (CEOP) Asia-Australia monsoon project (CAMP) on the Tibetan Plateau (CAMP/Tibet) starts from 1 October 2002 to 30 September 2004. A meso-scale observational network of CAMP/Tibet is set up in the central plateau, which produces a large amount of data for the study of energy and water cycle over the TP [69]. Surface soil moisture observations with the depth of −0.04 m at seven stations (black triangles in Figure 1b) in soil moisture and soil temperature (SMTMS) networks belonging to this meso-scale network are used in this study. At each station, hourly soil moisture data are provided with the unit of percent (%), and such data are converted to volumetric soil moisture (m3 m−3) by dividing by 100. Readers can refer to CAMP/Tibet in Table 1 for detailed information about the location, time range and depths for each CAMP/Tibet station. CAMP/Tibet observations have already been widely used in many scientific studies [70,71].

ZH2021

Zhao Lin and Hu Guojie et al. have released a synthesis dataset of permafrost thermal state for the Qinghai–Tibet (Xizang) Plateau in China, which is abbreviated as ZH2021 hereafter [48]. This dataset consists of meteorological variables (air temperature, precipitation, specific humidity, et al.), deep ground temperature, soil moisture, and soil temperature data with quality control. In this study, we only used daily surface (top-layer) soil moisture observations at five stations for evaluation (black circles in Figure 1b). Detailed information can be seen from ZH2021 in Table 1.

3.1.2. Satellite and Reanalysis Datasets

SSM/I

Based on a radiative transfer model, van der Velde et al. [26] have retrieved long-term soil moisture data at a depth of about the top 3 cm of the soil, specifically over the TP using brightness temperatures observed by the Special Sensor Microwave Imagers (SSM/I) sensors (F08, F11 and F13), facilitated through the Defense Meteorological Satellite Programme. The brightness temperature observations after calibration and bias corrections were provided by the Precipitation Research Group of Colorado State University. When validating against in situ measurements at the Naqu network and comparing with GLDAS Noah simulations, SSM/I soil moisture performs well. The data gaps in SSM/I are filled with a three-dimensional distinct transform method [72]. The temporal resolution is daily (F08 satellite operates from July 1987 to December 1991 at UTC 06:12, F11 satellite operates from December 1991 to May 1995 at UTC 18:11, and F13 operates from May 1995 to December 2008 at UTC 17:42), and the spatial resolution is 0.25° × 0.25°. Due to the limitation of temporal range for SSM/I soil moisture, our study period is 1988–2008. Readers can refer to van der Velde et al. [26] for more detailed information.

ECV COMBINED

The Essential Climate Variable combined (ECV COMBINED) soil moisture developed by the European Space Agency Climate Change Initiative (ESA CCI) project combines various single-sensor active and passive microwave soil moisture products [32]. Since its first release in 2012, ECV COMBINED soil moisture has been continuously updated 13 times, and it has now been updated to ECV COMBINED v07.1 [73]. Here, we use the latest version ECV COMBINED v07.1, which merges the retrieved soil moisture products from five active and twelve passive microwave sensors. Due to the inclusion of three new sensors of FengYun 3C, FengYun 3D and ASCAT-C, this dataset has improved in temporal and spatial coverage, making it the most accurate ESA CCI soil moisture to date. This global daily soil moisture data start from 01/11/1978 to 31/12/2021, with a spatial resolution of 0.25° × 0.25°.

ERA5-Land

The European Center for Medium-Range Weather Forecasts (ECMWF) has produced a global dataset for the land component of the fifth generation of European ReAnalysis (ERA5), hereafter referred to as ERA5-Land [74]. ERA5-Land provides many high spatiotemporal resolution surface variables from 1950 to present. As one of the variables, soil moisture in ERA5-Land is divided into four layers (0–7, 7–28, 28–100, and 100–289 cm). In this study, we use ERA5-Land soil moisture simulations at the depth of 0–7 cm to represent surface soil moisture. Its spatial resolution is 0.1° × 0.1°, and the temporal resolution includes hourly and monthly.

MERRA2

The second version of Modern-Era Retrospective Analysis for Research and Applications (MERRA2) is the latest reanalysis data produced by NASA’s Global Modeling and Assimilation Office (GMAO) [46]. MERRA2 optimizes the Goddard Earth Observing System (GEOS) model and analysis scheme and assimilates more observation types, resulting in improved data quality compared with its predecessor—MERRA. Validating against 119 observations over China, Hagan et al. [75] also proves that MERRA2 has better skill than the older generations with higher correlations and lower root mean square errors. MERRA2 global data start from 1980, with a spatial resolution of 0.625° × 0.5°. The soil column of MERRA2 is divided into three soil layers, namely, the 0–5 cm surface layer, the 0–100 cm root zone, and the prof layer from the surface down to the bedrock. In this study, MERRA2 surface soil moisture content (SFMC) at the depth of 0–5 cm is used. The hourly (M2T1NXLND) and monthly (M2TMNXLND) MERRA2 soil moisture can be accessible through the NASA Goddard Earth Sciences Data Information Services Center (GES DISC).

GLDAS Noah

The reanalysis data, Global Land Data Assimilation System version 2 (GLDAS-2) with 3 components, GLDAS-2.0, GLDAS-2.1 and GLDAS-2.2, have been released by NASA [38]. The GLDAS-2.0 0.25 degree 3-hourly (GLADS_NOAH025_3H) and monthly (GLDAS_NOAH025_M) product with open-loop simulation (no data assimilation) produced using Noah Model 3.6 is used in this study. The model is forced by the Princeton meteorological forcing data, which start from 1948 to 2014. The spatial resolution is 0.25 degree. It produces a series of land surface parameters, including soil moisture at the depths of 0–10, 10–40, 40–100 and 100–200 cm. Only the surface 0–10 cm soil moisture over the TP region is used for evaluation. It should be noted that the unit of GLDAS soil moisture is kg m−2. In comparison with the other products, the unit has been transferred to volumetric soil moisture (m3 m−3) according to Zhu and Shi [76]. Previous studies have documented the good performance of GLDAS Noah soil moisture over the TP region [77,78].
Table 2. Overview of the soil moisture datasets used in this study.
DatasetsTemporal CoverageTemporal ResolutionSpatial ResolutionUnitReferences
Satellite datasets
SSM/I07/1987–12/2008daily0.25°×0.25°m3 m−3van der Velde et al. [26]
ECV COMBINED11/1978–12/2021daily0.25°×0.25°m3 m−3Dorigo et al. [32]
Reanalysis datasets
ERA5-Land01/1950–presenthourly; monthly0.1°×0.1°m3 m−3Muñoz-Sabater et al. [74]
MERRA201/1980–presenthourly; monthly0.625°×0.5°m3 m−3Gelaro et al. [46]
GLDAS Noah01/1948–01/20153 hourly; monthly0.25°×0.25°kg m−2Rodell et al. [38]

3.1.3. Meteorological Data and Ancillary Data

The China Meteorological Forcing Dataset (CMFD) produced by He et al. [79] is of a high spatiotemporal resolution (3-hourly, 0.1° × 0.1°) with a duration from 1979 to 2018. The CMFD merges multi-source data, including remote sensing products, in situ station data and reanalysis data. Through validation, the CMFD is of superior quality than the GLDAS because of the participation of more stations in China. The dataset includes seven near-surface variables: precipitation rate, 2-m air temperature, surface pressure, specific humidity, 10-m wind speed, downward shortwave and longwave radiation. All variables except surface pressure are used to study the response of soil moisture to climatic variables over the TP.
Some ancillary data are also used here. The elevation data are the Global 30 Arc-Second Elevation (GTOPO30) with a horizontal grid spacing of approximately 1 km supported by the United States Geological Survey (USGS). The GTOPO30 elevation data are completed in late 1996. As for land cover classifications over the TP, we use a multi-source Integrated Chinese Land Cover (MICLCover) map of 17 land cover types with a spatial resolution of 1 km developed by Ran et al. [68]. This MICLCover map is generated using the decision-fuse method, which combines land cover/land use classification maps including a 1:1,000,000 vegetation map, a 1:100,000 land use map, a 1:1,000,000 swamp-wetland map, a glacier map and a Moderate-Resolution Imaging Spectroradiometer land cover map in 2001. Validation against ground sample sites across China shows that the overall accuracy of the MICLCover map is 71%, higher than the accuracy of other land cover maps.

3.2. Methods

3.2.1. Data Pre-Processing

To accomplish the data evaluation, the spatio-temporal characteristics of soil moisture products and in situ observations need to be matched. Due to the limited availability of SSM/I data, the time range for all soil moisture products is 1988–2008. For CAMP/Tibet observations with the duration of 01/10/2002–31/03/2004, we use the only full year, 2003, for comparison. Since the temporal range of ZH2021 observations at each station differs, with the earliest observation starting on 07/06/2001, the corresponding time ranges from products are selected based on in situ stations. The temporal resolutions for all data are first uniformly converted to daily for inter-comparison. According to the transit time 17:42 for the SSM/I satellite F13 from May 1995 to December 2008, hourly CAMP/Tibet data in 2003 are converted to daily data by selecting the value at 18:00. Similarly, the hourly ERA5-Land (18:00) and MERRA2 (17:30) products and the 3-hourly GLDAS Noah (18:00) product are converted to daily data by selecting the nearest time to 17:42. Daily data with missing values can be aggregated to monthly averages when at least five valid values are available within a month [26]. Regarding spatial matching, the product data are obtained for corresponding pixels/grids based on site locations (longitude, latitude) [45].
When using machine learning to attribute soil moisture changes, the spatial resolutions of all these soil moisture products remain unchanged, while climatic variables from the CMFD are resampled with bilinear interpolation to obtain the same spatial resolution as each soil moisture product.

3.2.2. Evaluation Metrics

Five evaluation metrics are used to evaluate the performance of soil moisture products, as follows:
R = i = 1 n θ i θ ¯ O i O ¯ i = 1 n θ i θ ¯ 2 i = 1 n O i O ¯ 2
BIAS = 1 n i = 1 n θ i O i
MAE = 1 n i = 1 n | θ i O i |
RMSE = i = 1 n θ i O i 2 n
ubRMSE = RMSE 2 BIAS 2
where R, BIAS, MAE, RMSE, and ubRMSE represent the Pearson correlation, bias, mean absolute error, root mean square error, and unbiased root mean square error, respectively.  θ  and  O  represent soil moisture values of the products and site observations. n is the count of available samples, while i indicates the given time point.  θ ¯  and  O ¯  indicate the average values of all samples for the products and site observations.

3.2.3. Trend Analysis

The annual trend and the seasonal trend (spring, summer, autumn and winter) of soil moisture over the TP region during 1988–2008 for each product are calculated with Theil–Sen’s slope method, which removes the effect of skewed data compared to the common linear regression method [80]. Numerous scientists have used it to calculate the trend of hydrological variables [81]. The widely used Mann–Kendall method is used to identify the significance level of soil moisture trends [82,83].

3.2.4. Random Forest

The Random Forest regression method was used to identify the relative importance of each climatic variable on soil moisture change over the TP. This Random Forest model is a robust machine learning method with multi-decision trees’ ensemble for classification or regression using a bagging function [84]. It can effectively lower the uncertainties of overfitting problems. In this study, we use the “TreeBagger” function of MATLAB R2021b software to realize the Random Forest regression. Firstly, we randomly divide warming season (May–October) soil moisture values in each product and climatic variables from the CMFD during 1988–2008 into two parts: two-thirds data for training and one-third for validation. All gridded soil moisture and climatic variables over the whole TP region are trained in the Random Forest model, together. Leaf node count is set to 5, regression trees’ size is set to 300.

3.2.5. Partial Correlation

In the Results section, we compare the relative importance of each climatic variable for all soil moisture products and find that precipitation is the most important variable in controlling soil moisture changes over the TP region. Therefore, we calculate the partial correlation between warming season soil moisture in each product and precipitation on the grid scale, excluding the effects of other climatic variables. The “partialcorr” function of MATLAB R2021b software is used to calculate the partial correlation.

4. Results

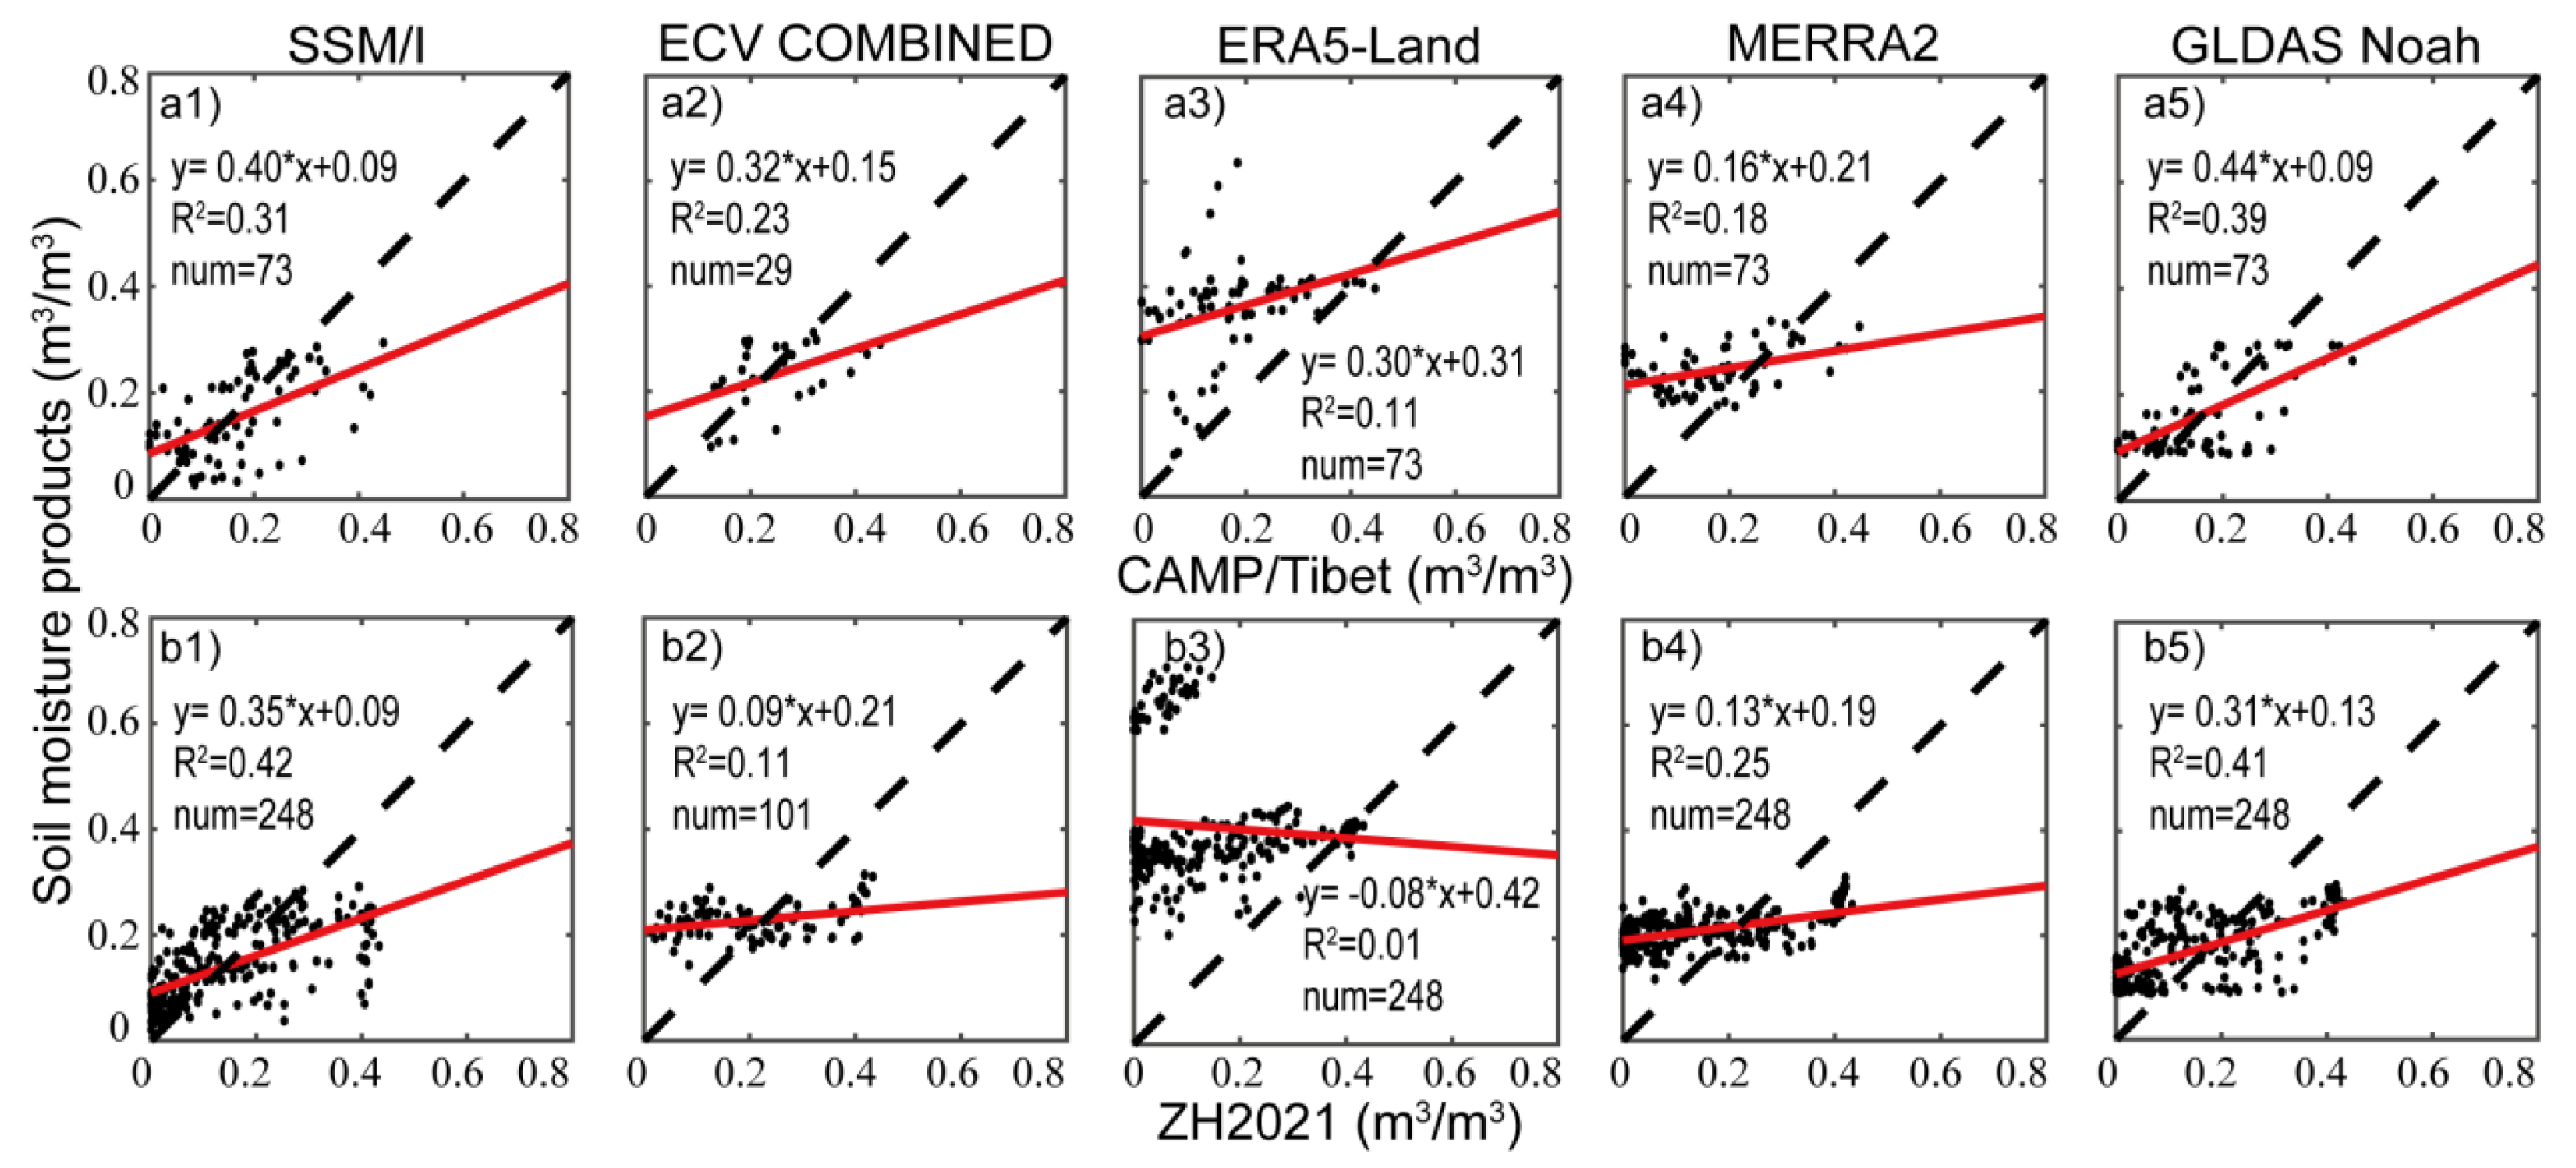
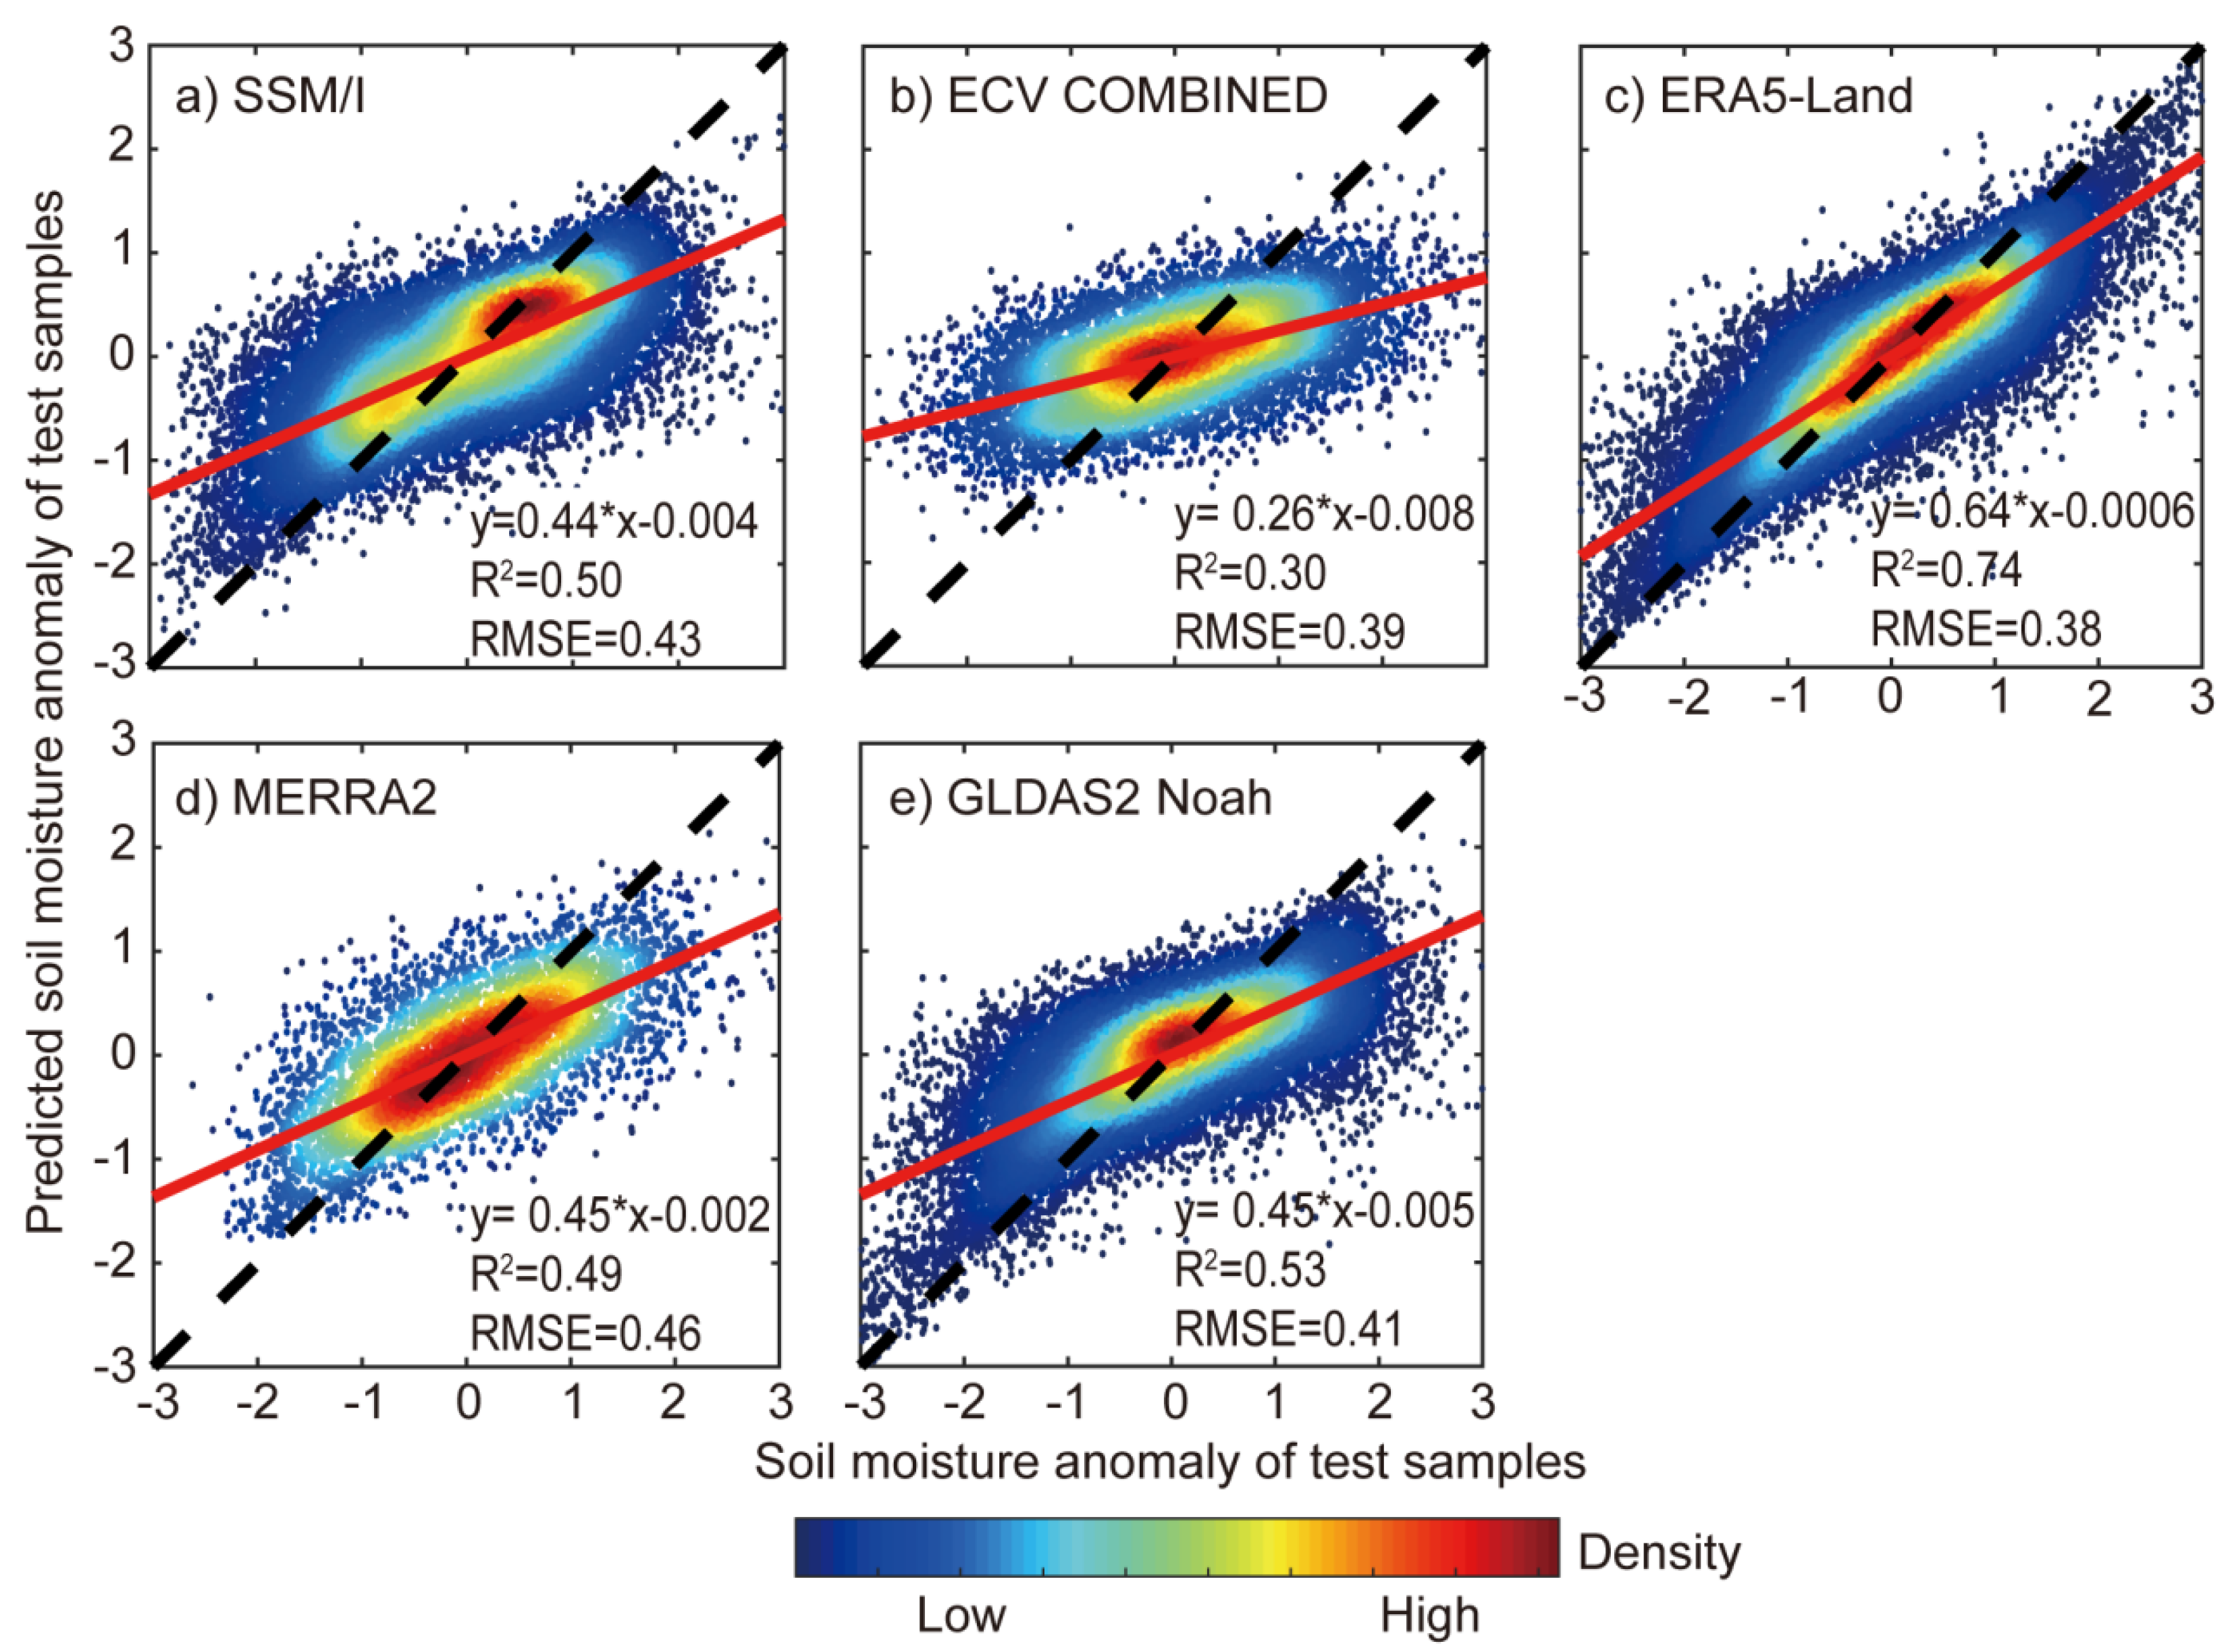
4.1. The Evaluation of Multi-Source Soil Moisture Products

Before studying soil moisture characteristics over the TP, we firstly evaluate the performance of these products used in this study against two in situ observation networks: CAMP/Tibet and ZH2021. In Figure 2, SSM/I and GLDAS Noah have the best fitting results, with R2 being more than 0.3 for two observation networks; more specifically, these two products’ R2 are more than 0.4 using ZH2021 as the reference, followed by MERRA2 with R2 of 0.18 and 0.25 and ECV COMBINED with R2 of 0.23 and 0.11. ERA5-Land has the lowest R2, 0.11 in CAMP/Tibet and 0.01 in ZH2021. The overall fitting results show that all products tend to overestimate soil moisture with different magnitudes, especially for ERA5-Land, with almost all samples being above the 1:1 line.
Next, in detail, we use five different metrics to evaluate the performance of used soil moisture products (Table 3). SSM/I and GLDAS Noah have the best performance with R > 0.56, BIAS close to zero, MAE < 0.09, RMSE < 0.11 and ubRMSE < 0.10. SSM/I marginally performs better than GLDAS Noah using ZH2021 as the reference, while GLDAS Noah is better than SSM/I with CAMP/Tibet as the benchmark. The performance of ECV COMBINED is very close to SSM/I and GLDAS Noah in terms of all metrics, especially for being better than SSM/I for RMSE and ubRMSE using CAMP/Tibet as the reference. Although MERRA2′s R of 0.50 is higher than ECV COMBINED’s R of 0.34 in ZH2021, the remaining metrics (BIAS, MAE, RMSE, ubRMSE) of MERRA2 are worse than ECV COMBINED. ERA5-Land has the lowest R, the same as in Figure 2, and the highest BIAS, MAE, RMSE and ubRMSE, compared to the other products. It indicates that ERA5-Land has great uncertainties in representing surface soil moisture over the TP, which may be related to the characterization of snow fields at high altitudes (> 3300 m a.s.l.) in the land model [74].

4.2. Long-Term Soil Moisture Characteristics over the TP

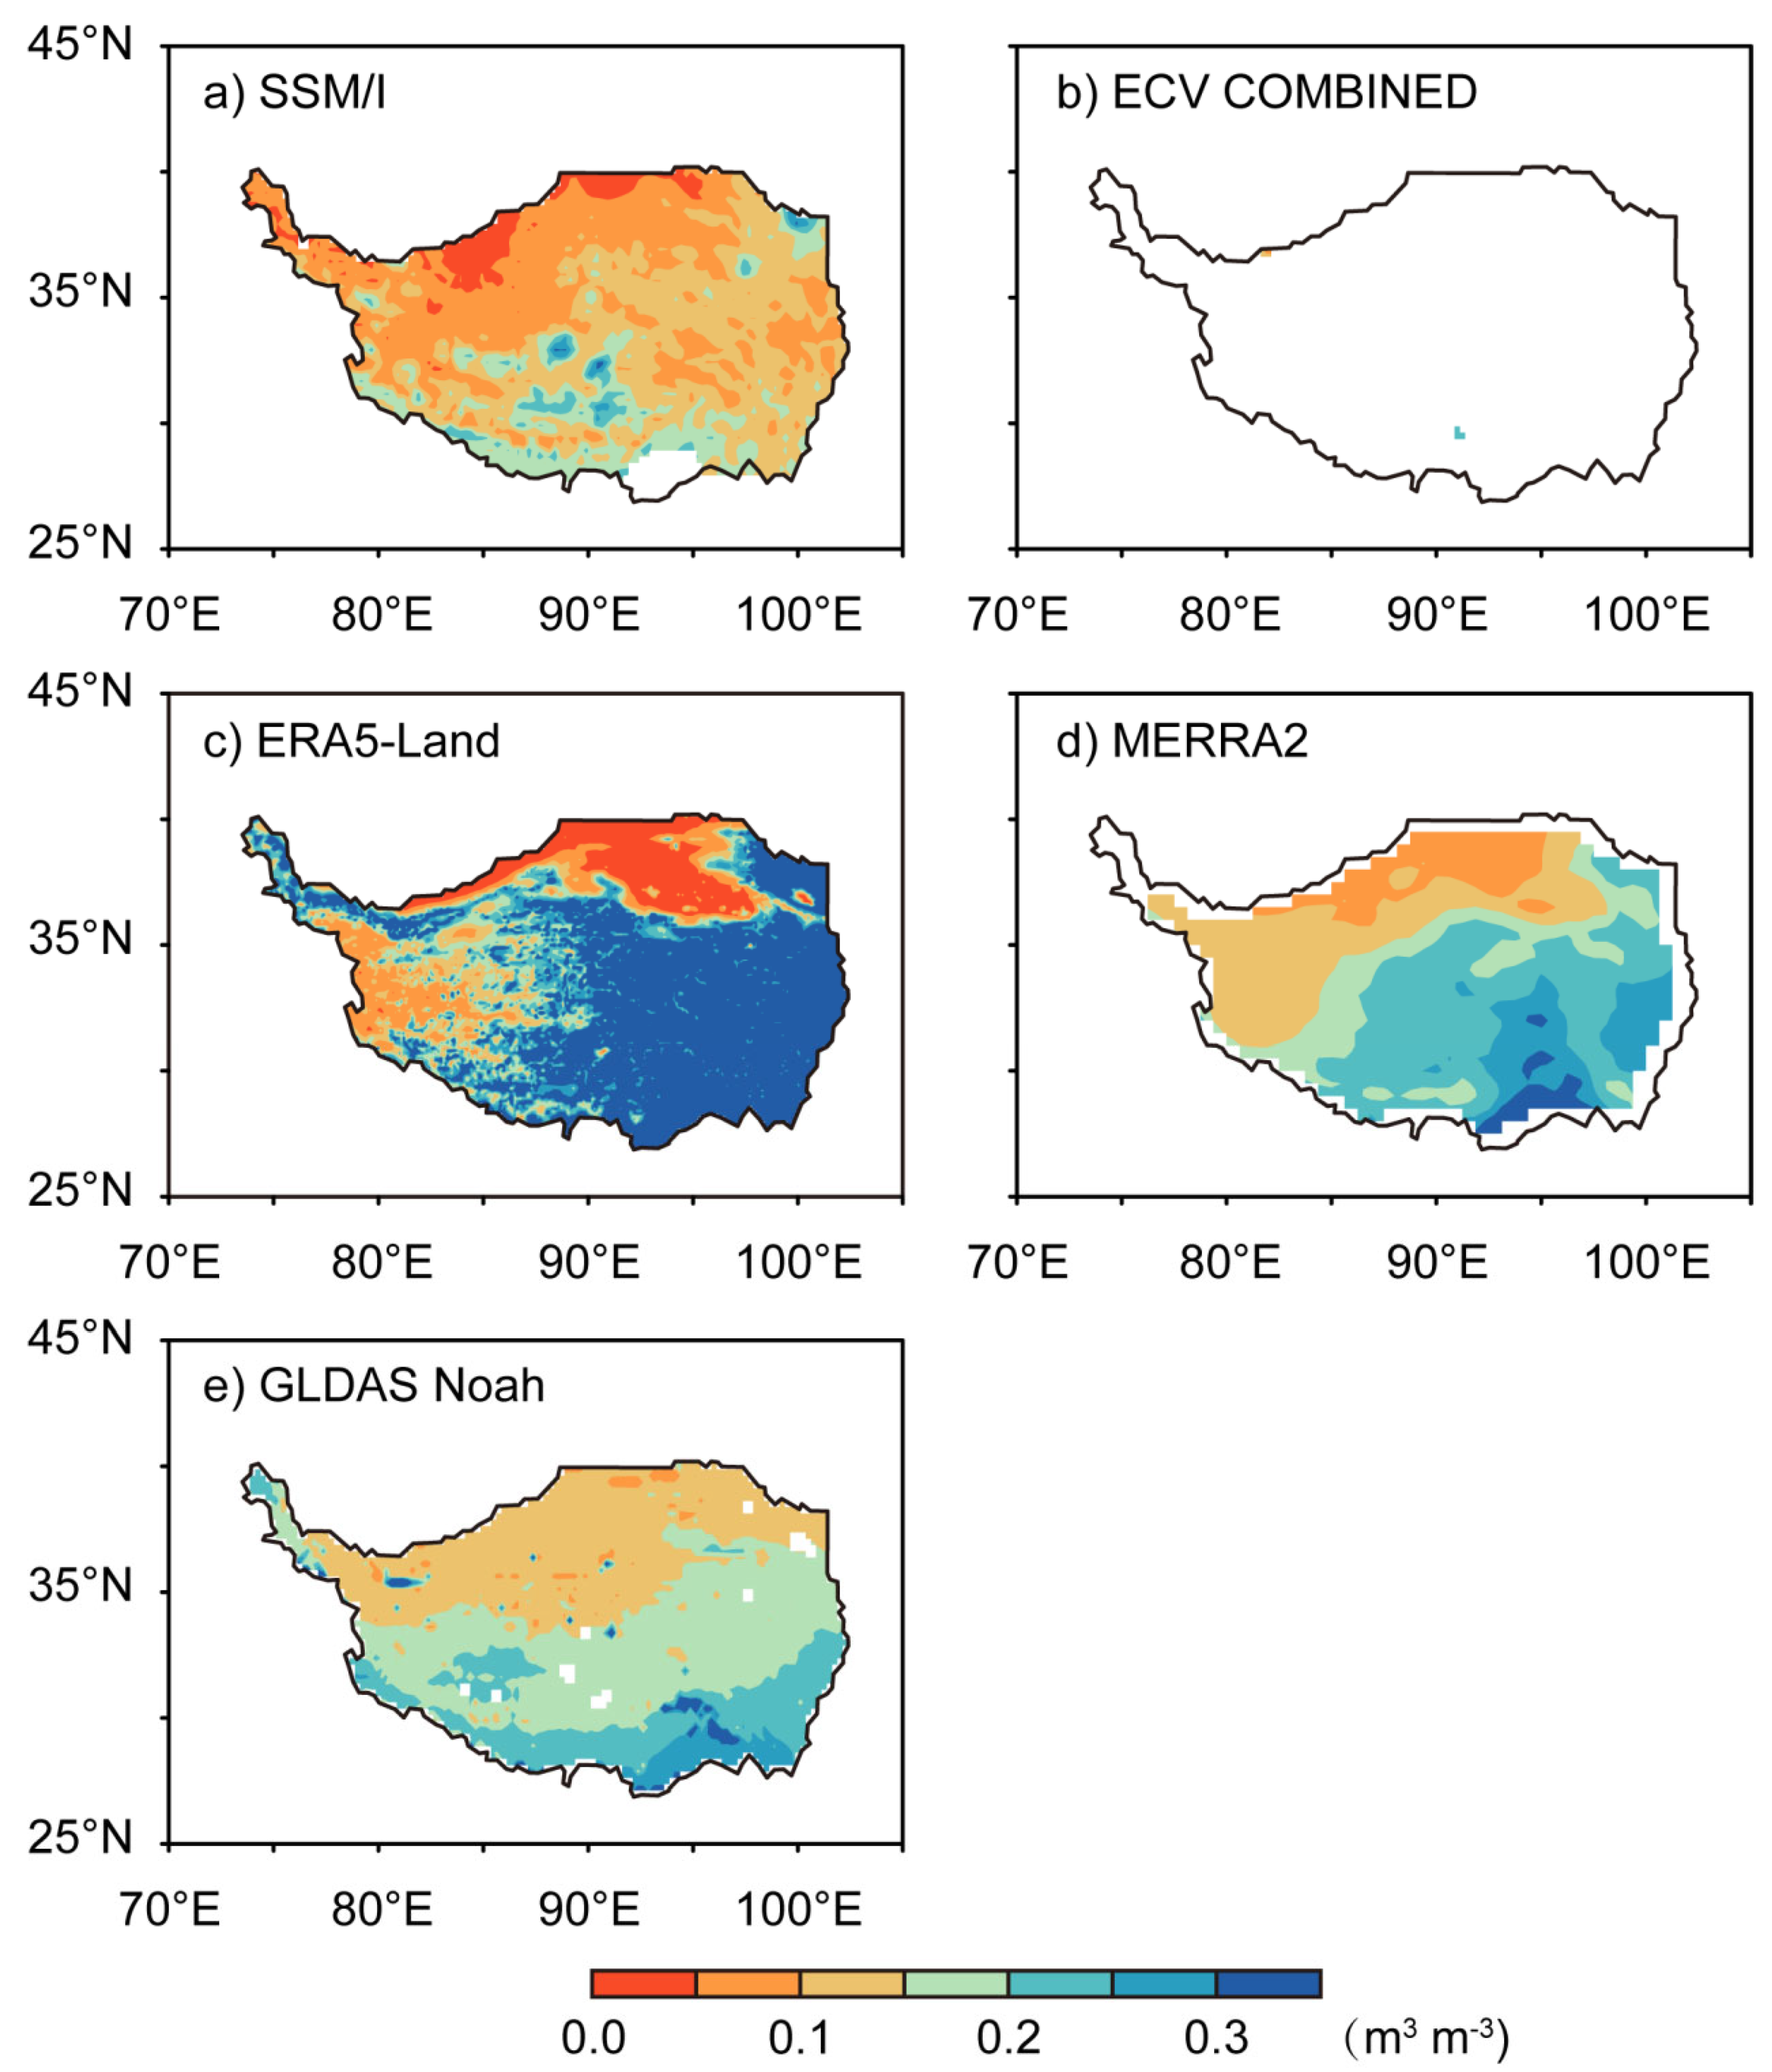
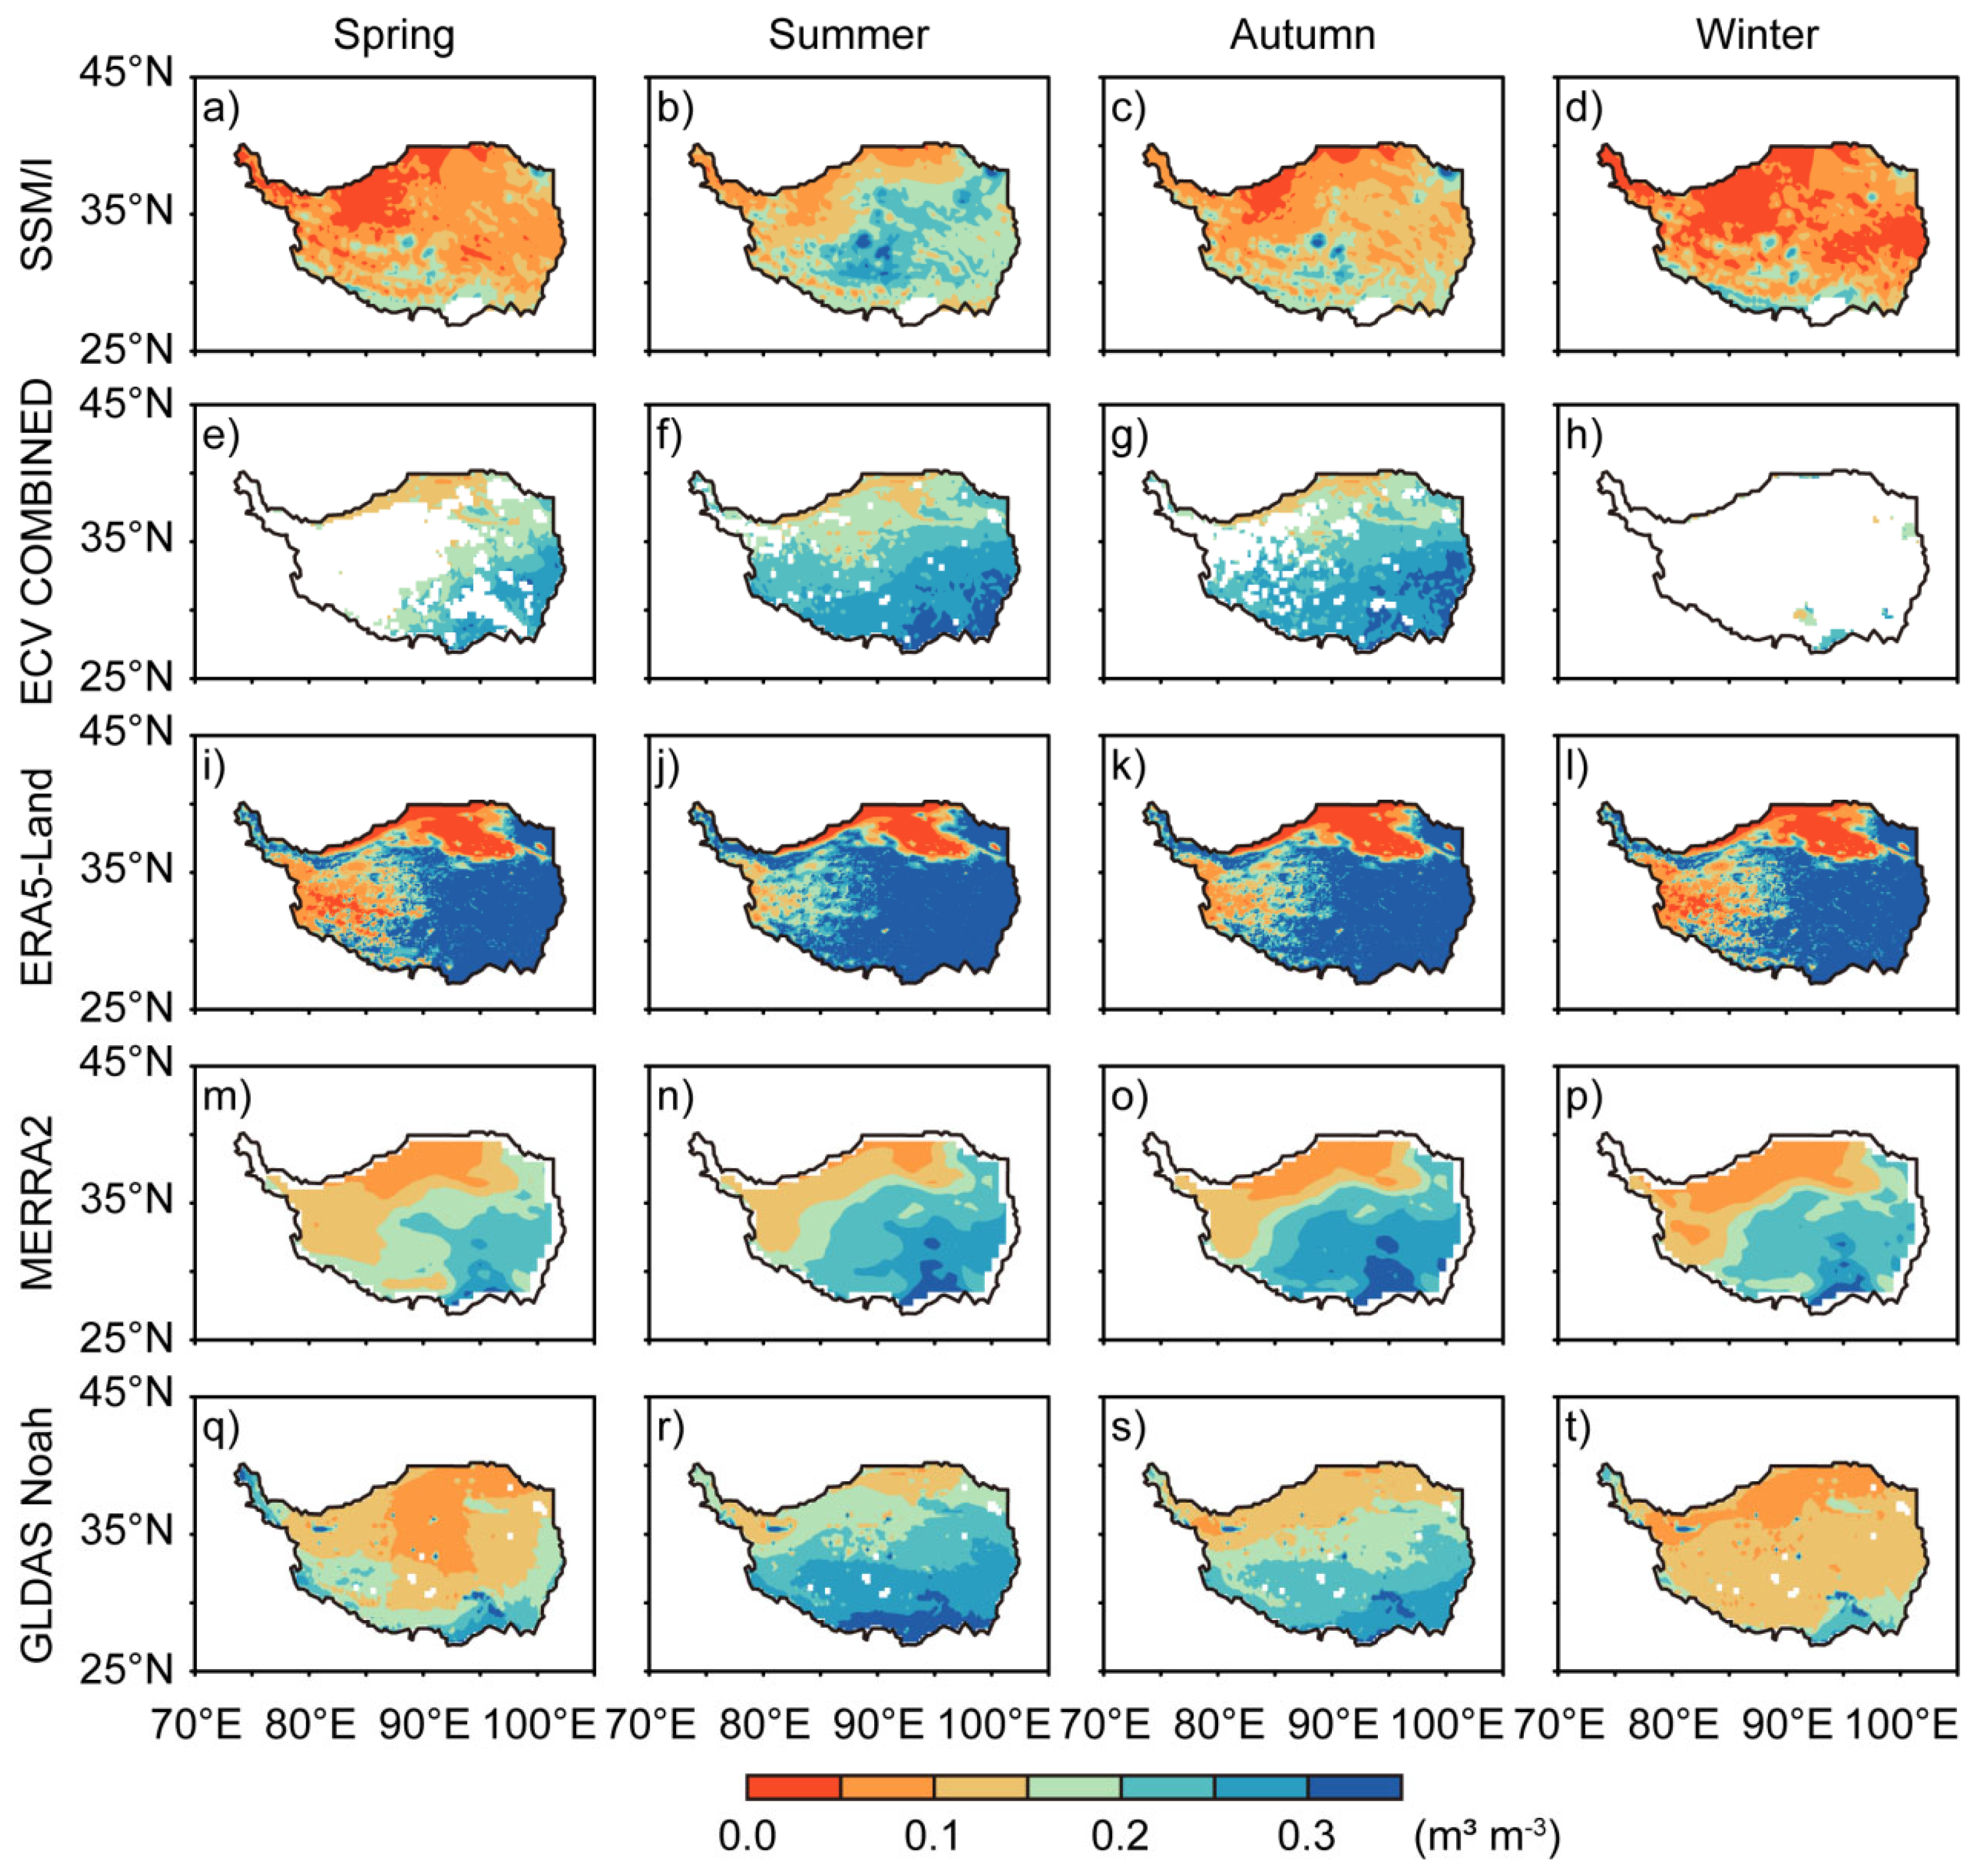
4.2.1. The Annual and Seasonal Mean Soil Moisture during 1988–2008

The multi-year mean soil moisture patterns during 1988–2008 over the TP using different products are shown in Figure 3. We find that all products except ECV COMBINED show similar spatial distributions, with higher values in the southeast of the TP region and lower values in the northwest. The multi-year mean soil moisture gradually increases from southeast to northwest. Only a few pixels with soil moisture values exist in ECV COMBINED. In terms of magnitudes, ERA5-Land has the highest values (more than 0.2 m3/m3 over most of the TP region), MERRA2 and GLDAS Noah have values ranging from 0.1 to 0.3 m3/m3, while SSM/I has the lowest values (less than 0.15 m3/m3 over most of the TP region).
We also explore the consistencies of seasonal mean soil moisture over the TP region for all products (Figure 4). ECV COMBINED with lots of missing multi-year mean values is mostly due to missing values in winter. There are plenty of values in the other three seasons, especially for summer and autumn seasons (Figure 4e–h). By comparing these seasonal mean values among the products, the following are shown to be consistent results: like multi-year mean values, the similar spatial distributions are found in all four seasons for all the other products, with the southeast region having higher values and the northeast region having lower values; mean values of summer and autumn have the highest values for all products, compared to spring and winter. The differences among these products are as follows: there are little seasonal differences of mean values for ERA5-Land and MERRA2; however, the obvious transition features are found in the remaining products of SSM/I, ECV COMBINED and GLDAS Noah, with the mean values firstly increasing from spring to summer and then decreasing from summer to winter.

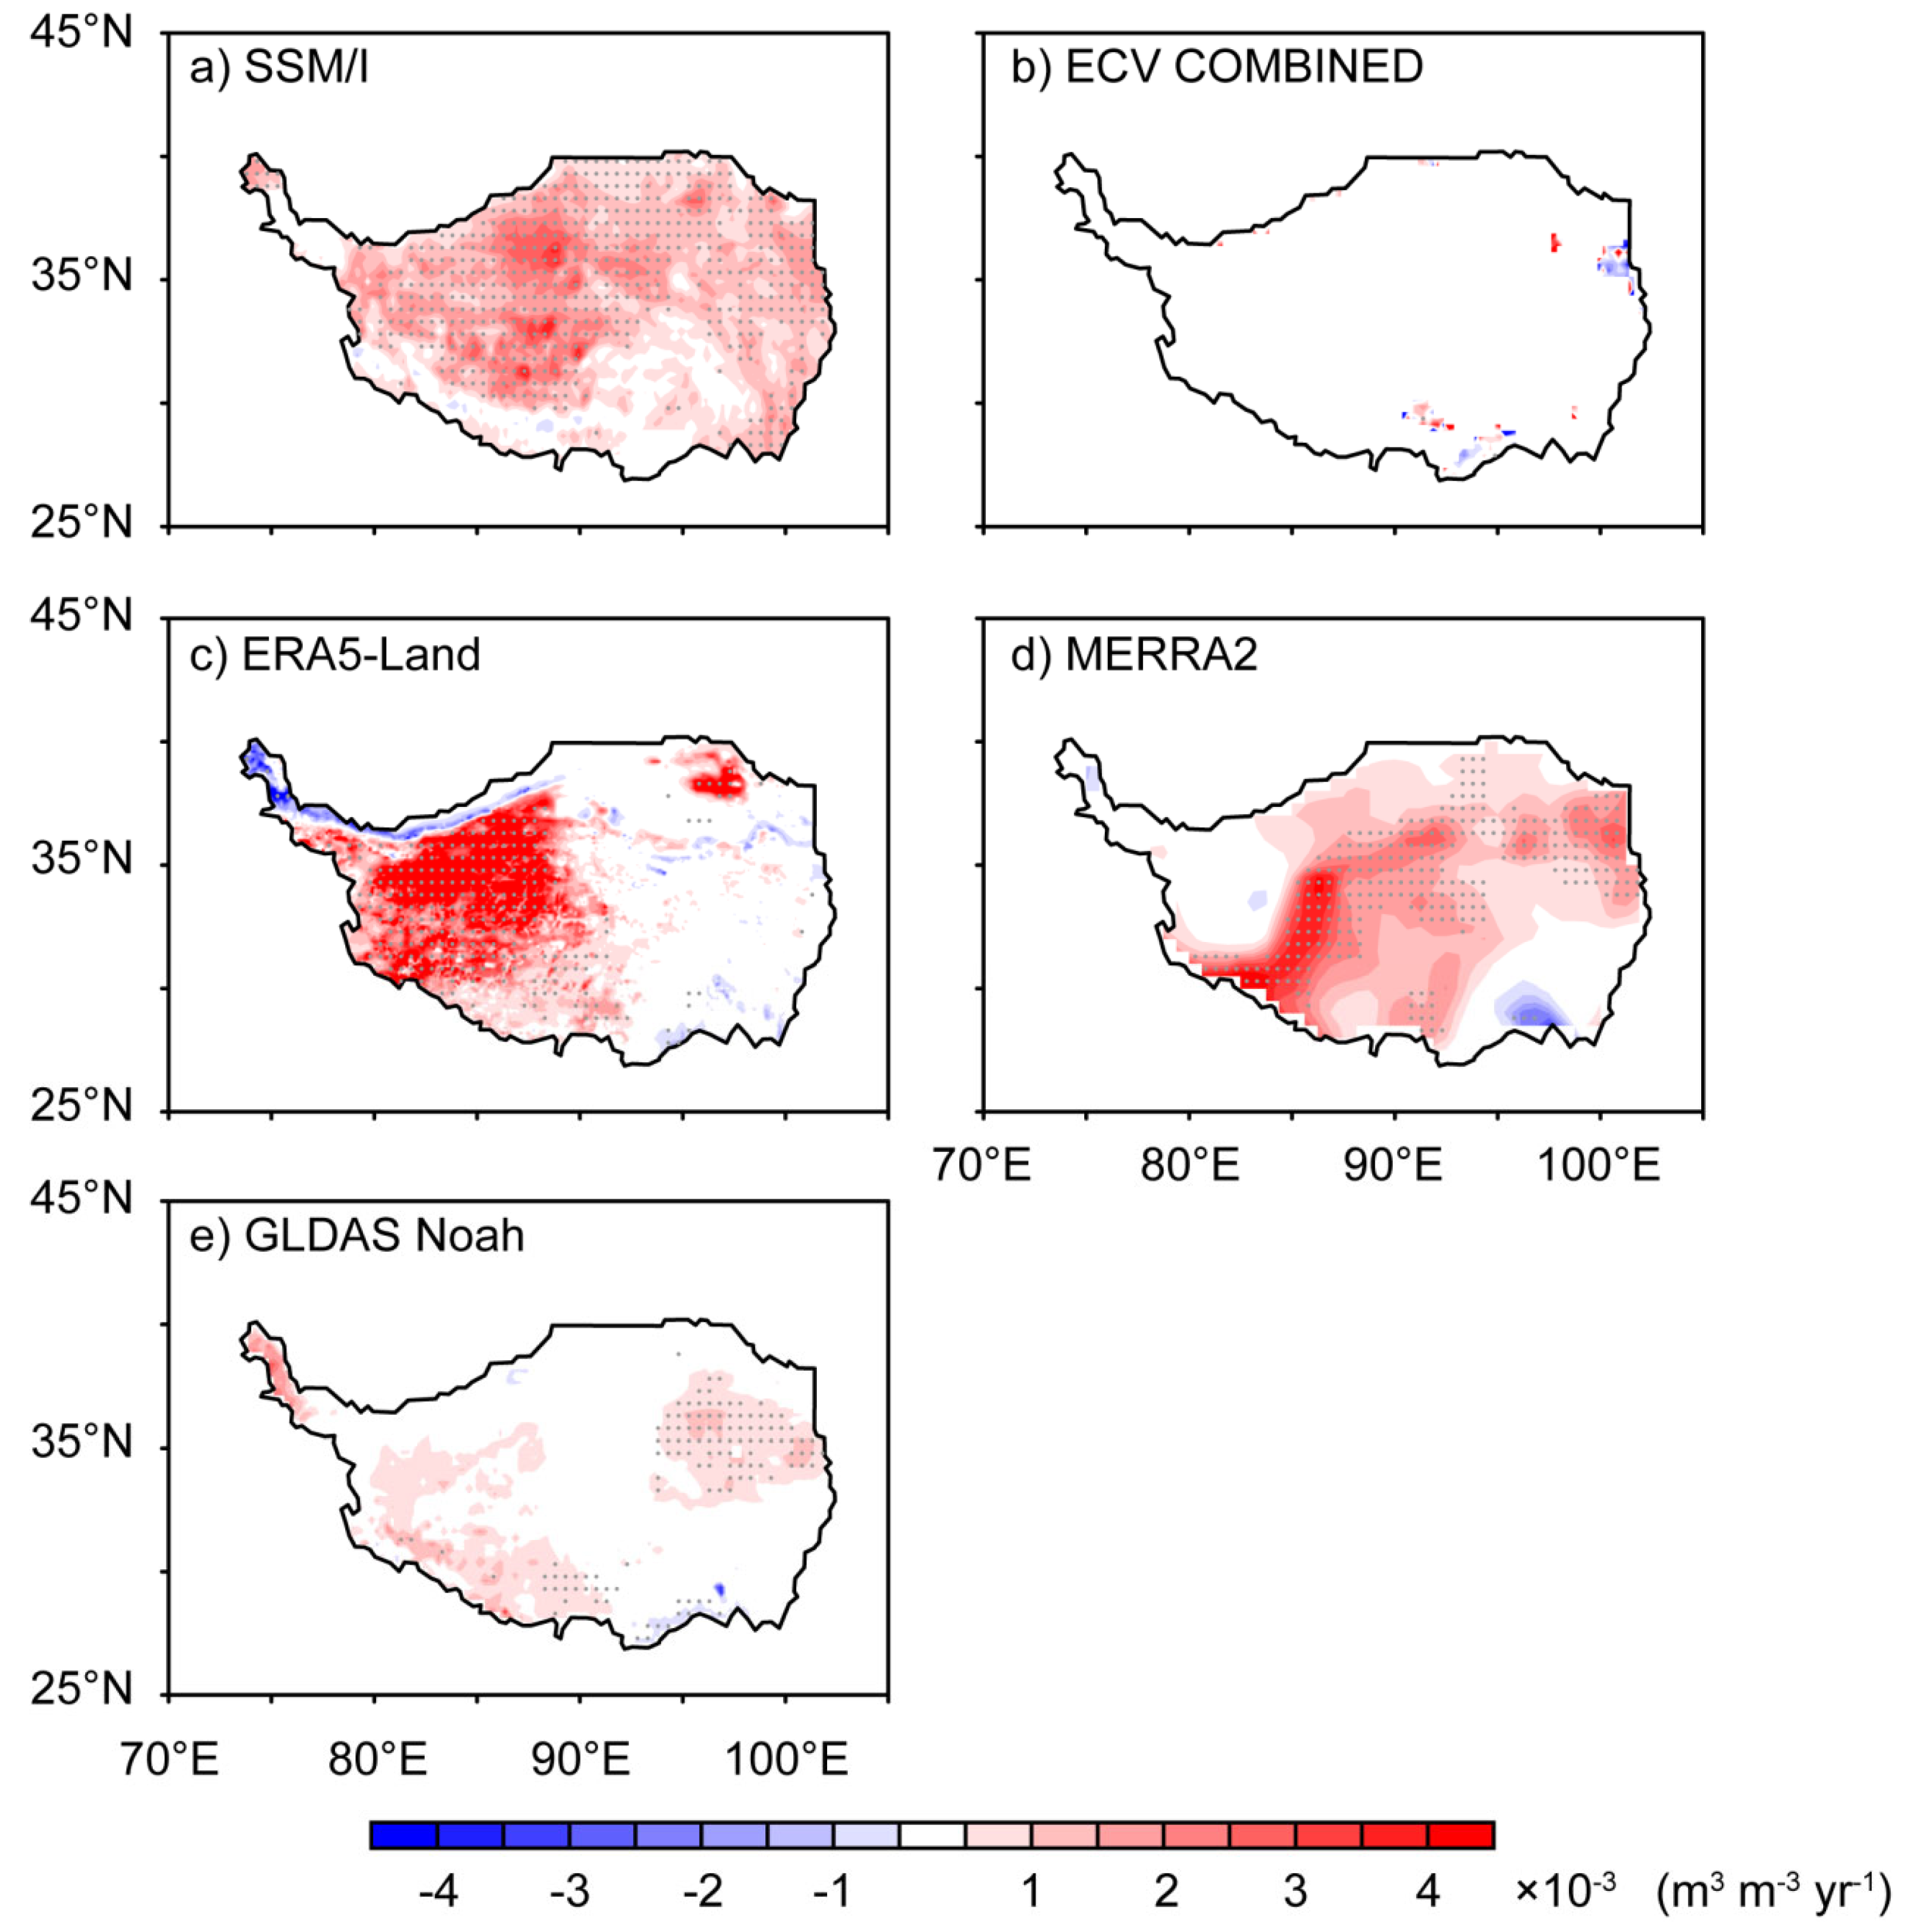
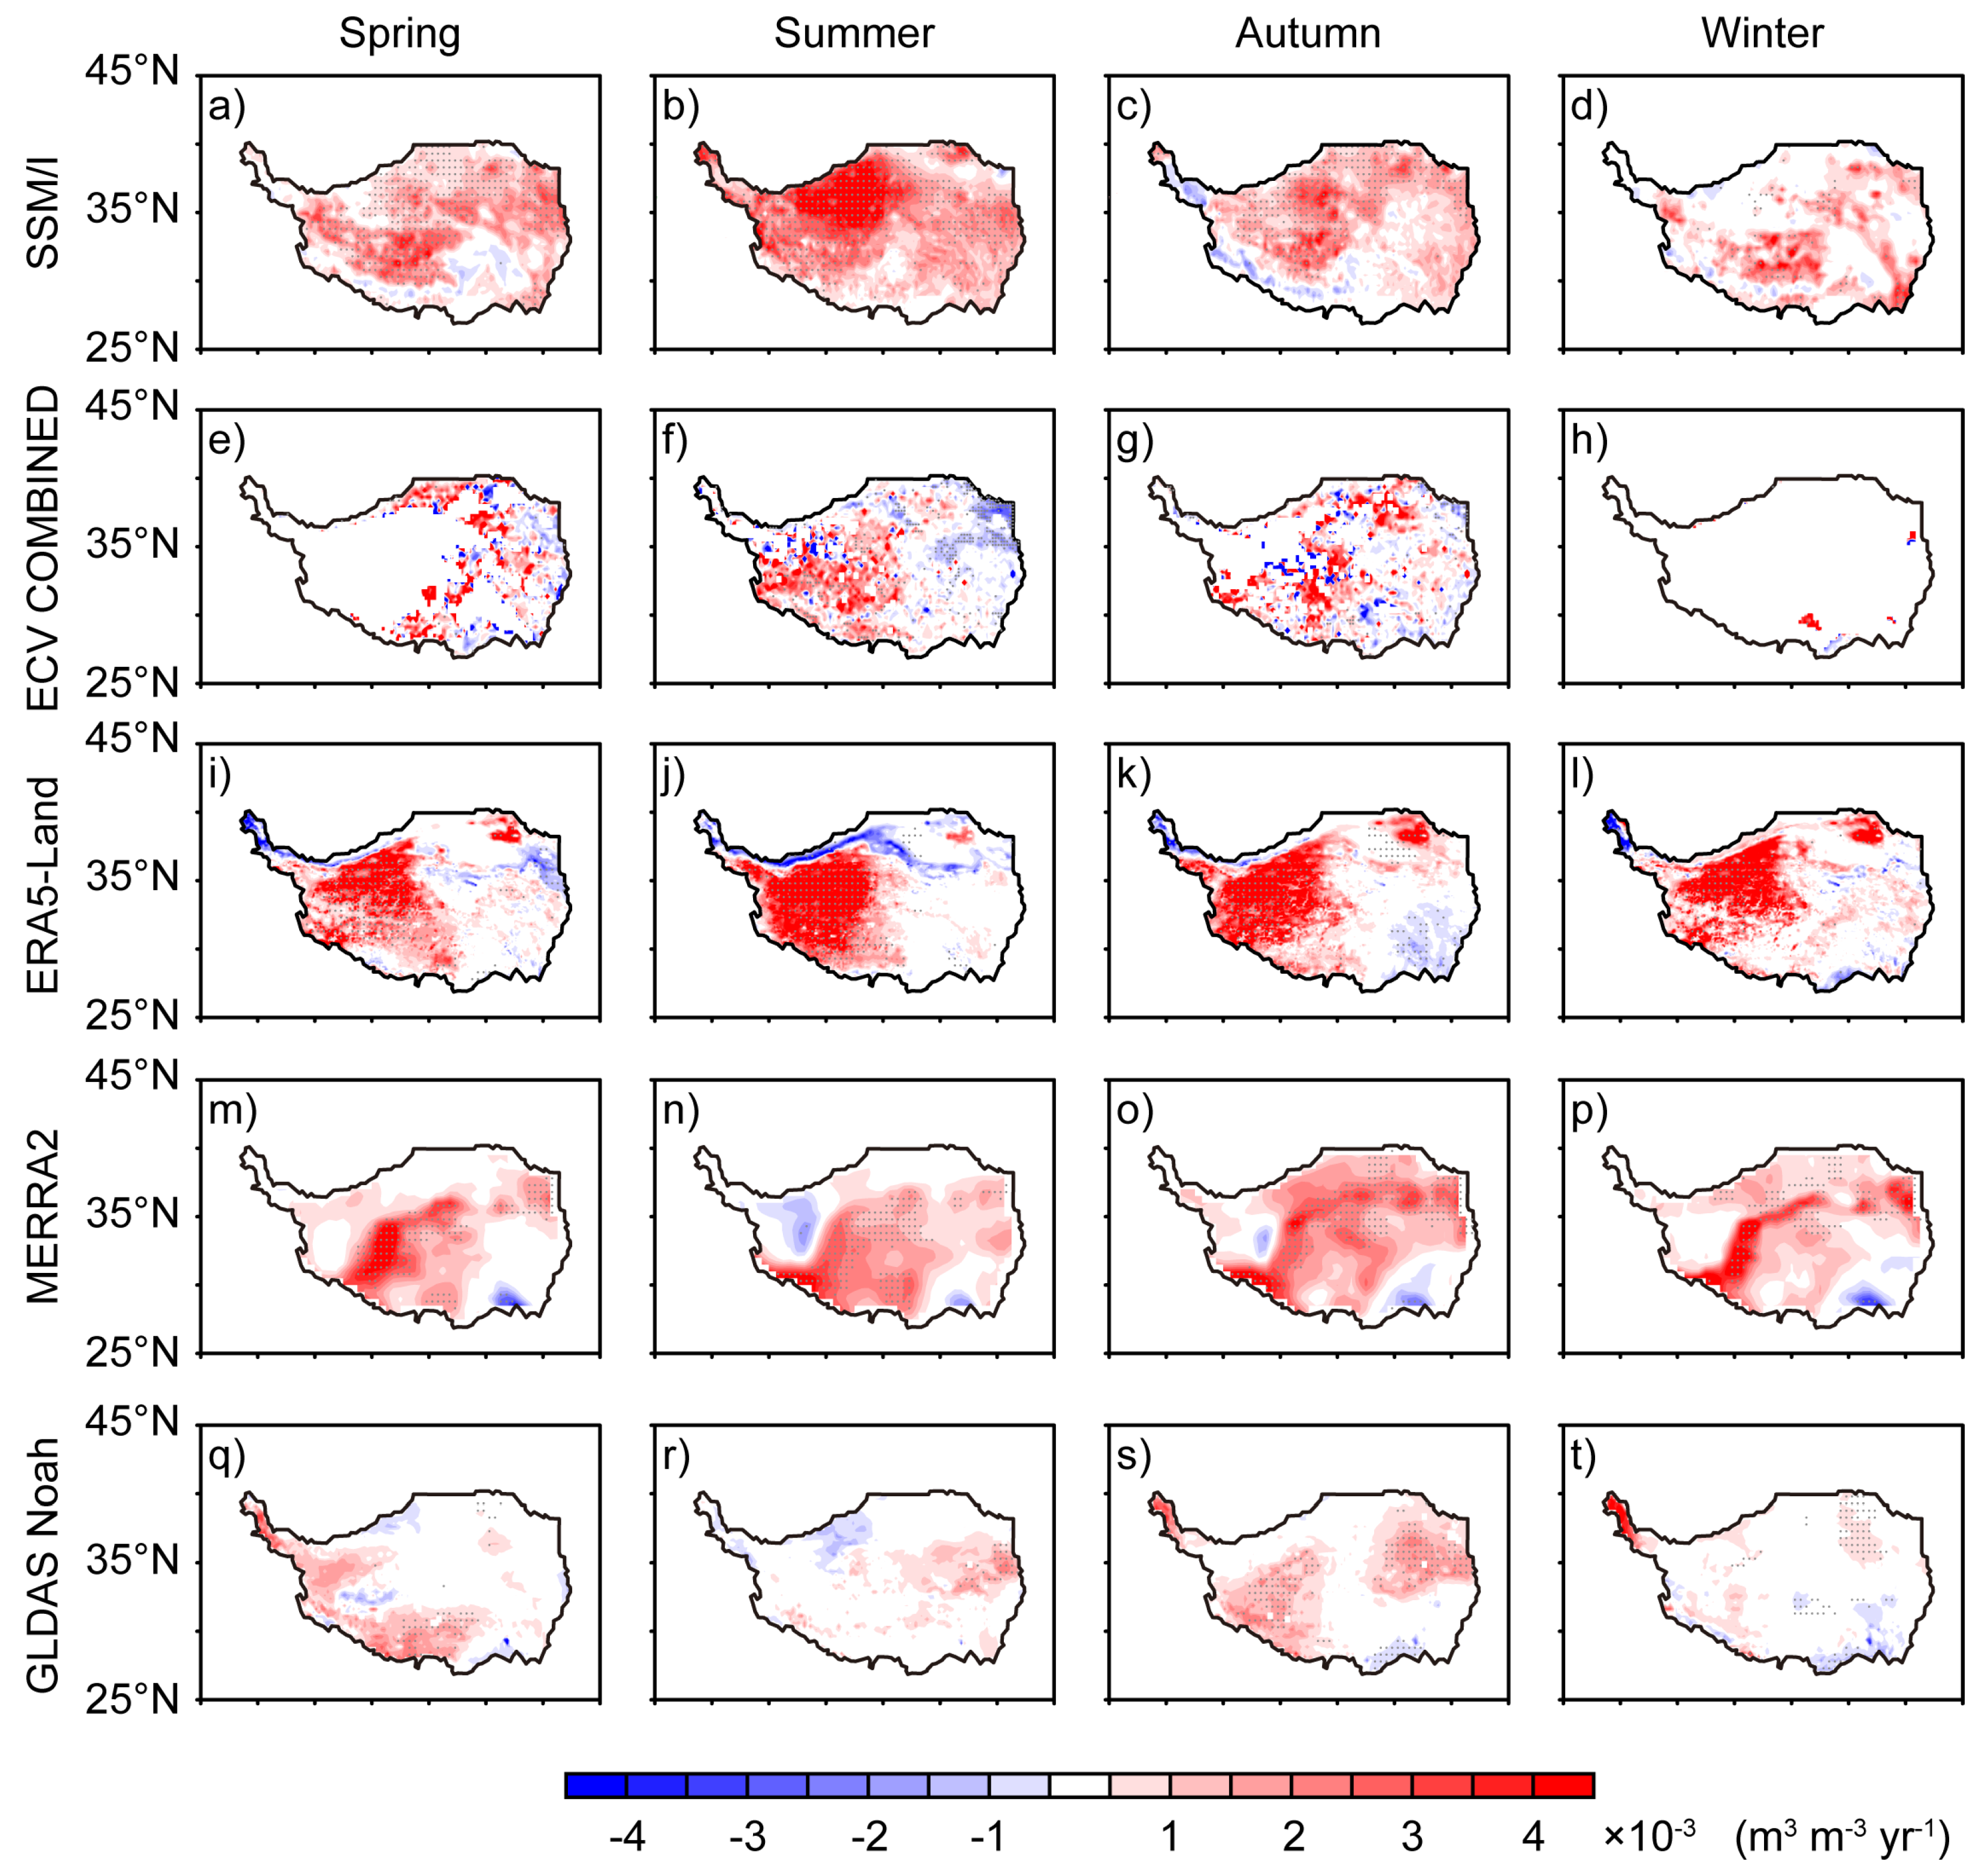
4.2.2. The Annual and Seasonal Trend of Soil Moisture during 1988–2008

Figure 5 shows the spatial distribution of soil moisture annual trend over the TP during 1988–2008 for all products. Except for ECV COMBINED, all products generally show significant increasing trends over the TP region. SSM/I has the increasing trend of about 2 × 10⁻³ m3/m3 over most of the TP region, especially in the central and western region with more than 2 × 10⁻³ m3/m3. ECV COMBINED does not have definitive trends since the distribution of its trend values is quite sparse. Significant increasing trends are found in the western TP region for ERA5-Land, while a few decreasing values are also found in the northern edge of the TP. For MERRA2, overall increasing trends exist in most of the TP region, especially for southwest, while decreasing trends are found in the southeast. GLDAS Noah has increasing trends in east and west of the TP region. It should be noted that most negative values in the figure have not passed the significant test at the significance level of 0.05. In terms of magnitudes, ERA5-Land has the biggest increasing trend, followed by MERRA2 and SSM/I, while GLDAS Noah shows the smallest increasing trend.
Soil moisture seasonal trends during 1988–2008 for all products are shown in Figure 6. Similar to the spatial distribution of soil moisture annual trend, each seasonal trend for all products generally shows an increasing pattern. The biggest increasing trends can be found in each season of ERA5-Land with more than 3 × 10⁻³ m3/m3, while GLDAS Noah has the smallest increasing trend of about 1 × 10⁻³ m3/m3. SSM/I has an increasing trend over most of the TP region, especially in the summer season, with more than 3 × 10⁻³ m3/m3. For ECV COMBINED, increasing trends are found in the east for spring, west for summer, and middle for autumn. For ERA5-Land, the biggest increasing trends with 3 × 10⁻³ m3/m3 are found in the west of the TP region for all seasons. Increasing trends are found in most of the TP region except for some west and southeast regions for MERRA2. Increasing trends of GLDAS Noah are found in the southwest TP in spring, eastern TP in summer, northeast and southwest TP in autumn, and some scattered regions in winter. Few negative values showing decreasing trends have passed the significance test at the significance level of 0.05.

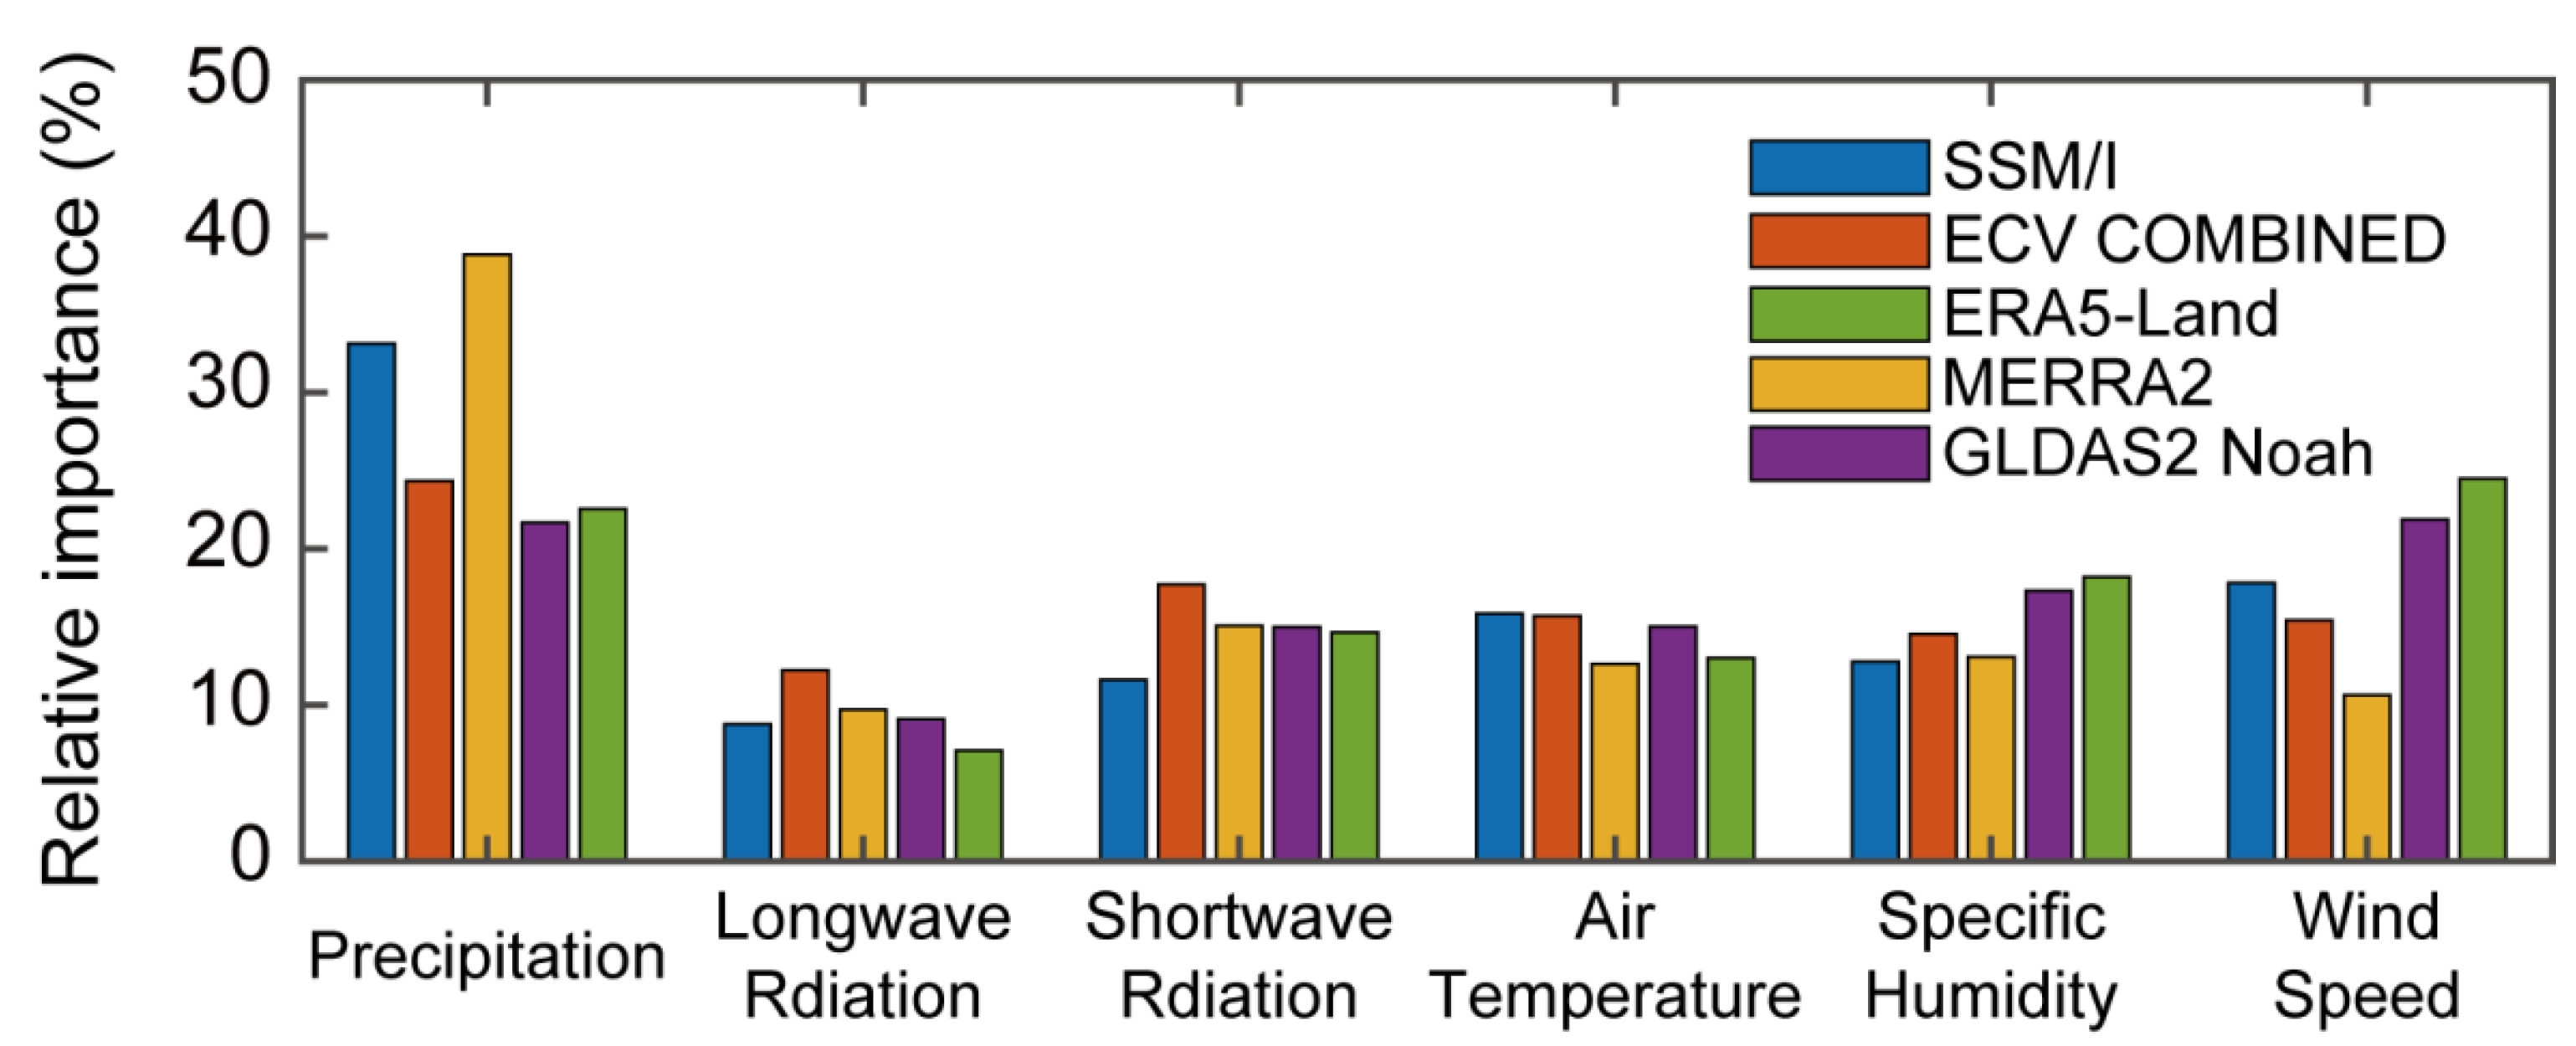
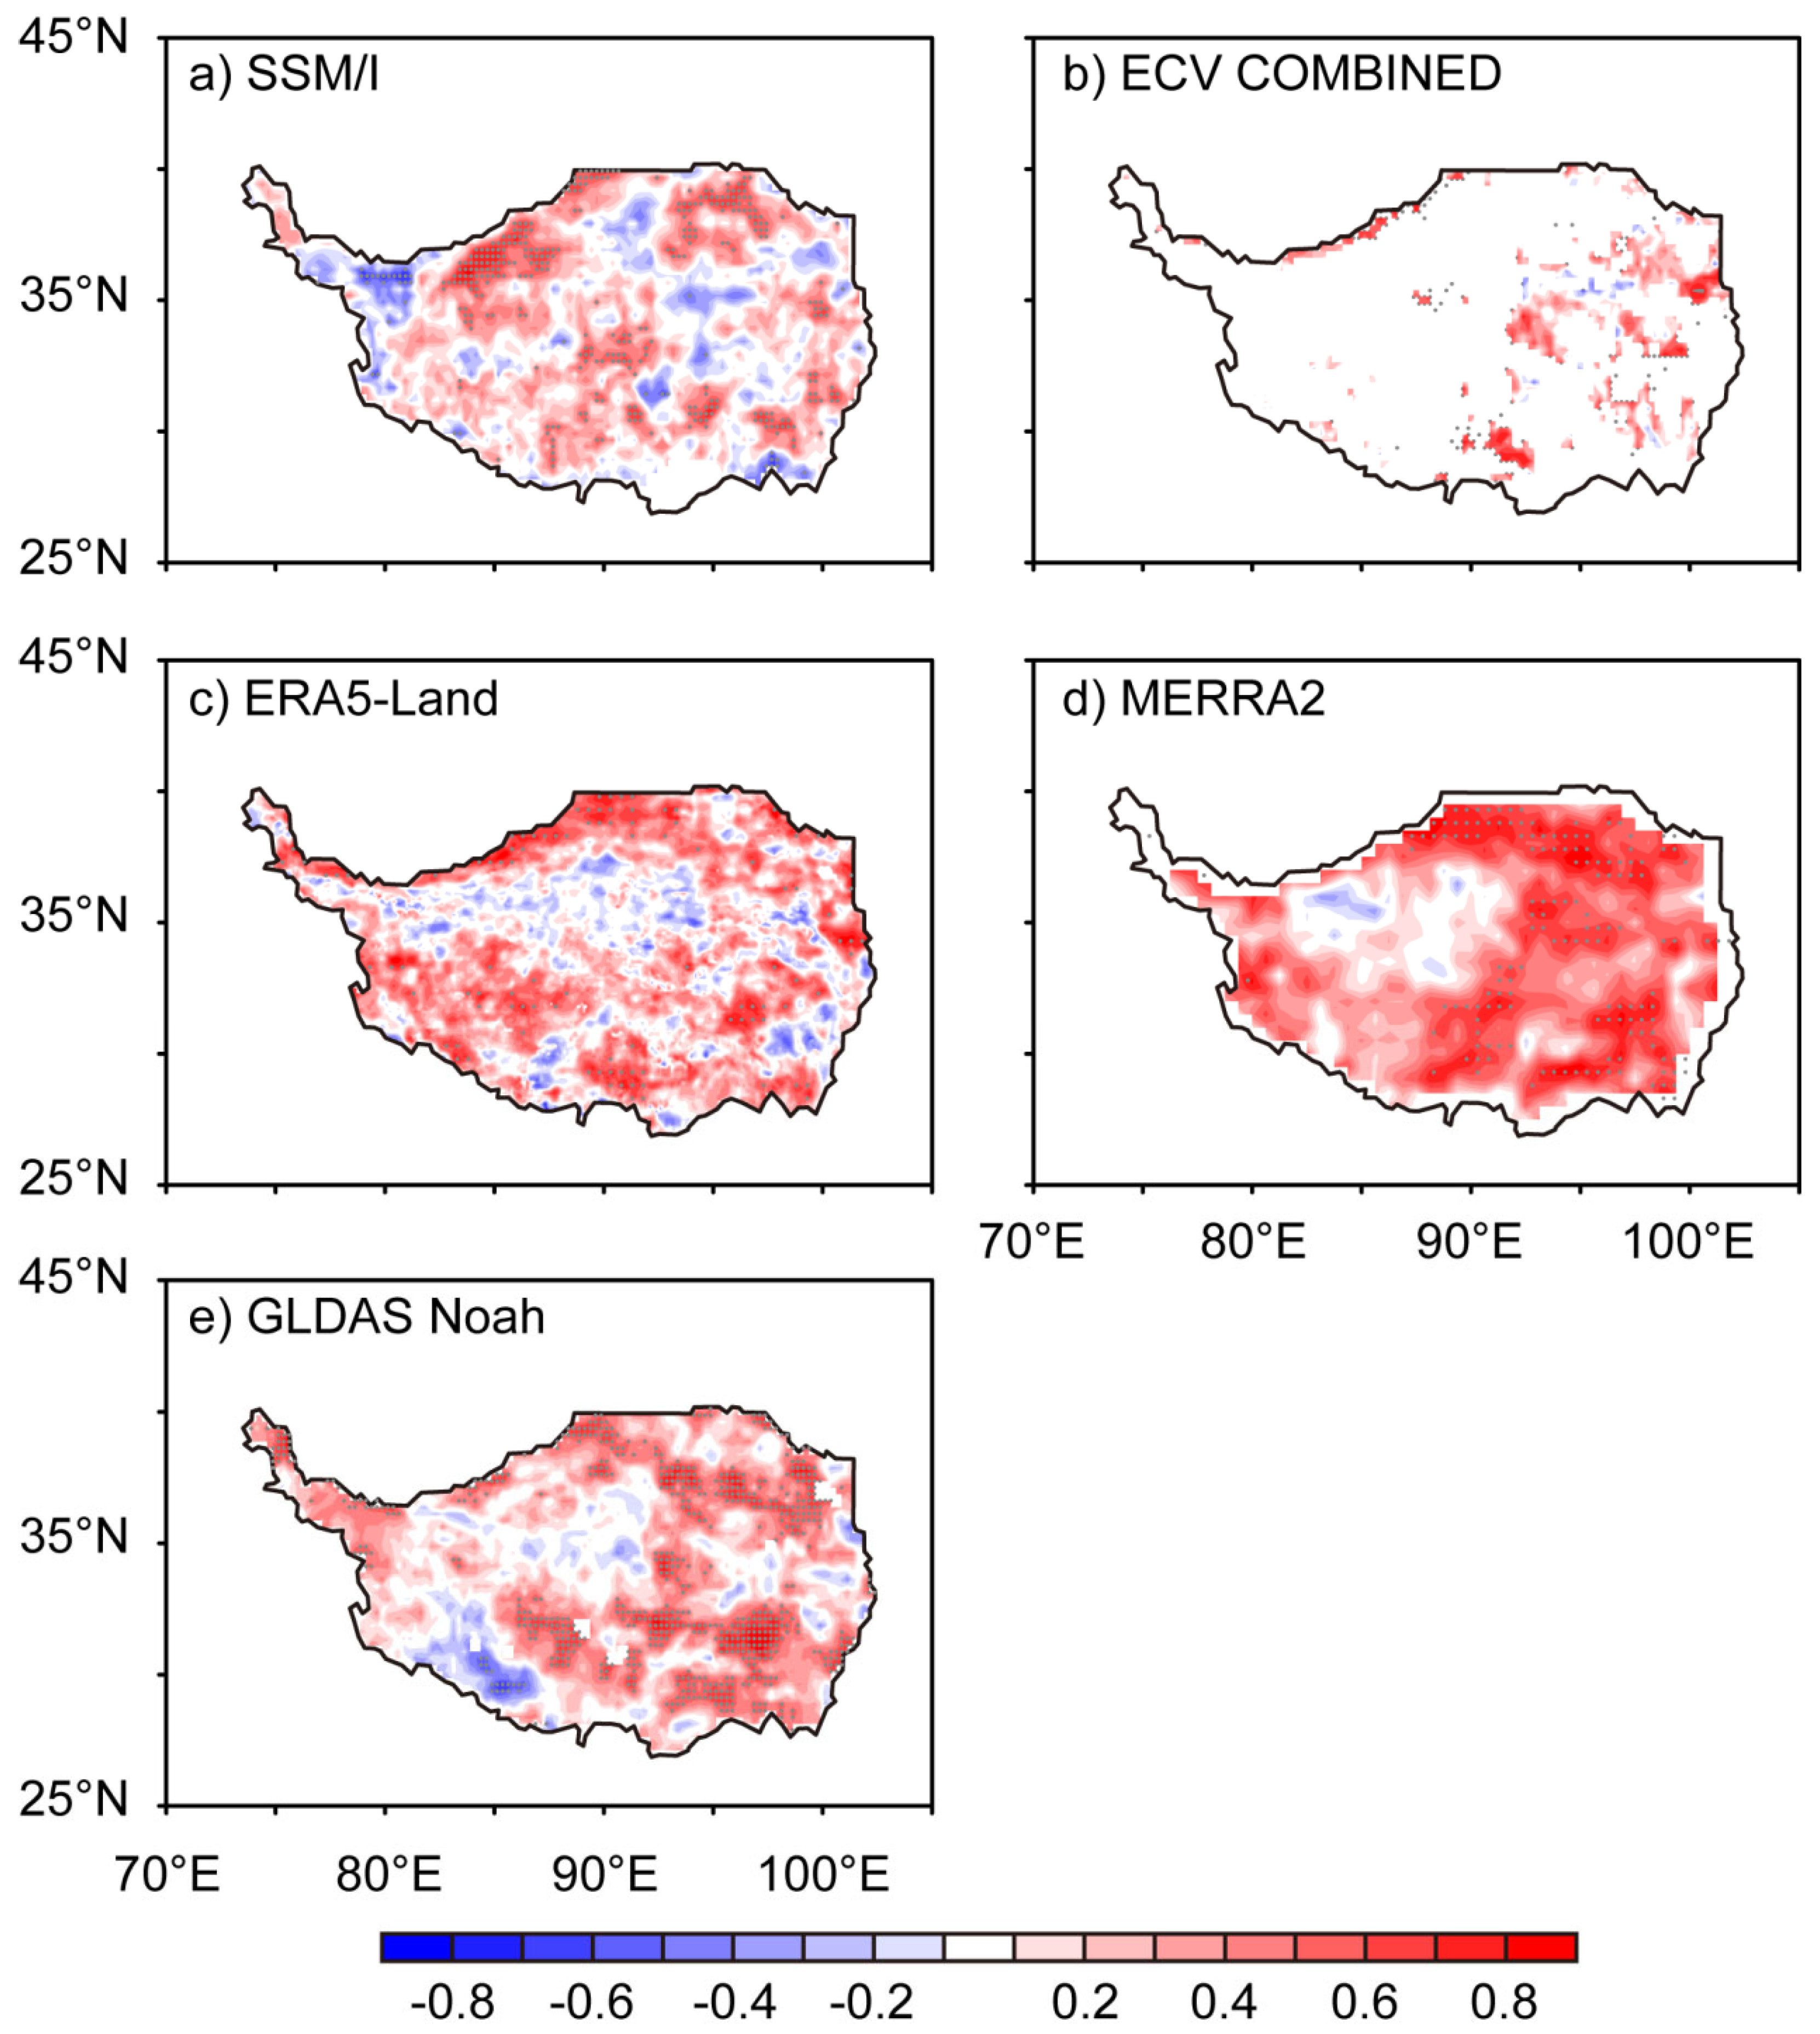
4.3. Quantifying the Relative Importance of Each Climatic Variable on TP Soil Moisture

The above-mentioned results indicate that soil moisture over the TP region is significantly increasing during 1988–2008 for all products on the annual and seasonal scales. Until now, it is unclear that which variable dominates TP soil moisture changes. This subsection estimates each climatic variable’s relative importance on TP soil moisture during warm seasons (Figure 7). The relative importance (%) of each variable shown in the figure is calculated with its absolute importance divided by the sum of absolute contributions of all climatic variables (precipitation, longwave radiation, shortwave radiation, air temperature, specific humidity and wind speed), while the absolute importance is obtained with the Random Forest regression (RF) method (see Section 3.2.4 for details). The sum percentages of all variables are equal to 100% for each product. The attribution results indicate that precipitation is the dominant factor for controlling the soil moisture of SSM/I, ECV COMBINED and MERRA2, especially for MERRA2, which has the highest contribution of about 39%, while precipitation and wind speed have considerable contributions to soil moisture changes, with more than 20% for ERA5-Land and GLDAS Noah. Additionally, the other variables’ (i.e., longwave radiation, shortwave radiation, air temperature, specific humidity) contributions are less than 20%, especially for longwave radiation, with about 10% contributions for all products.
The importance in each variable is calculated by taking all pixels as a whole. The result indicates that precipitation contributes more than air temperature. Then, we calculate the partial correlation between TP soil moisture and precipitation on the grid scale (Figure 8). The partial correlation results show that precipitation has significant positive correlations with soil moisture over most of the TP region during 1988–2008 for all products. In terms of the magnitude, MERRA2 has the highest values, with more than 0.8, followed by ERA5-Land and ECV COMBINED, with correlations of 0.4–0.8; SSM/I and GLDAS Noah have the lowest correlations, with 0.2–0.4.
Lastly, we evaluate the performance of the trained random forest regression model in each product (Figure 9). All products except for ECV COMBINED have the R2 with about or over 0.5, while ECV COMBINED’s R2 is 0.30. The difference may be due to there not being enough pixels to train the model, compared to the other products. For RMSE, ECV COMBINED has the second lowest value, with 0.39, compared to SSM/I, MERRA2, and GLDAS Noah, all with more than 0.40. Additionally, ERA5-Land has the lowest RMSE (0.38) and the highest R2 (0.74), indicating that it has the best trained model. The best performance of the ERA5-Land trained model here shows the greatest model-regressed nonlinear relationship between meteorological forcing and ERA5-Land soil moisture. It should be noted that the performance of the trained model has nothing to do with the performance/quality of the product itself. These two performance evaluations are with different purposes, and better performance here does not necessarily mean better performance there. The overall results show that all products have relatively good performance in the trained model.

5. Discussions

We evaluate the performance of five multi-source long-term soil moisture products with two sets of in situ observations networks. The evaluation results indicate that satellite-based SSM/I soil moisture observations perform well over the TP with higher R and lower BIAS, MAE, RMSE, and ubRMSE, while ECV COMBINED is no better than SSM/I, which may be due to too many missing values impacting the final calculation of the metrics. The reanalysis-based products tend to overestimate soil moisture values (Figure 2 and Table 3), especially for ERA5-Land. Similar overestimation results based on reanalysis products are also found in Xing et al. [55] and Wang et al. [61]. Wang et al. [61] point out that ERA5 and GLDAS obviously overestimate actual soil moisture values compared to satellite-based products. The overestimation of reanalysis products mainly depends on uncertainties of the model structure, parameterization, assimilation scheme and forcing data [85]. In addition, the mismatching between the coarse pixel of these products and the effective footprint of in situ observation sites, as well as inconsistent depths between the products and in situ observation sites, may also introduce some uncertainties into data evaluation [45]. Since soil moisture over the TP can be variable in space, there may also be uncertainty in evaluating the performance of soil moisture products in the entire TP using in situ observations of CAMP/Tibet and ZH2021, which are mainly distributed in the central plateau.
Through analyzing the characteristics, we discover the significant increasing trend of soil moisture over the TP. The wetting phenomenon has also been detected by van der Velde et al. [26]. Further, we attribute the increasing soil moisture over the TP region during recent decades to climatic variables with the nonlinear regression method—Random Forest. Here, we only focus on the warm season rather than the annual scale to avoid the effect of snow ablation on the attributed results. The attributed results indicate that precipitation dominates soil moisture changes over the TP rather than air temperature. Precipitation is the main source of moisture to the TP region, despite the fact that rising air temperature can reduce soil moisture with enhanced evapotranspiration. Precipitation’s dominant role in soil moisture over the TP has also been confirmed by Wang et al. [60] and Dai et al. [86].
Longwave radiation contributes the least to warm-season soil moisture changes over the TP region. A study conducted by Nayak et al. [87] performed sensitive experiments in India using the Noah Land surface model and found that the annual surface layer soil moisture change is the highest when introducing perturbations in longwave radiation. Our study is inconsistent with the study of Nayak et al. regarding the lowest/highest contribution of downward longwave radiation to soil moisture changes. One possible reason for the inconsistency is that the two studies focus on different timescales [88]; the spatial heterogeneity of downward longwave radiation may be another possible explanation [89]. In the near future, sensitive experiments with regional models should be carried out over the specific TP region to investigate the soil moisture change with perturbations in different climatic factors.
Although the trained Random Forest (RF) model has successfully predicted soil moisture for all products, the estimating performance of R2 is not high enough. This may be related to uncertainties from the selected input meteorological forcing data or the used machine learning method. Another state-of-the-art Extreme Gradient Boosting (XGBoost), which has also been widely used in related ecohydrological studies [90,91], may be an alternative method to improve the performance.

6. Conclusions

In this study, we firstly evaluated the performance of multi-source soil moisture products over the TP region with the two sets of in situ observations; then, we studied the long-term characteristics of soil moisture; lastly, the responses of soil moisture over the TP region to climatic variables were estimated with a machine learning method. The conclusions are as follows:
(a) SSM/I and GLDAS Noah soil moisture data outperform ECV COMBINED, ERA5-Land and MERRA2, which were followed by ECV COMBINED and MERRA2. ERA5-Land might not be proper for evaluating surface soil moisture over the TP, as it has the greatest difference from in situ observations, which may be due to uncertainties from the representation of snow fields at high altitudes (> 3300 m a.s.l.). The reanalysis products tend to overestimate soil moisture compared to satellite-based products.
(b) All products show a similar spatial distribution of annual mean soil moisture—decreasing from the southeast to the northwest—over the TP. For seasonal mean soil moisture, the soil moisture of all products except for ERA5-Land firstly increases from spring to summer and then decreases from autumn to winter. ERA5-Land almost has similar spatial distributions among four different seasons. A significant increase in soil moisture is found over most of the TP region during 1988–2008, especially in middle-west regions, on annual and seasonal scales for all products.
(c) With the Random Forest nonlinear regression method, we quantify the contribution of each climatic variable to warm-season soil moisture over the TP region. The attribution results indicate that precipitation controls soil moisture changes over the TP region rather than air temperature. Further, pixel-wise partial correlations between precipitation and soil moisture show that increasing precipitation would increase soil moisture over most of the TP region.

Author Contributions

This paper is a collaborative work by all of the authors. Conceptualization, C.Z., S.L. and D.F.T.H.; data curation, X.W. and D.F.; methodology, C.Z. and S.L.; formal analysis, C.Z. and S.L.; visualization, C.Z. and S.L.; writing—original draft preparation, C.Z. and S.L.; writing—review and editing, D.F.T.H., J.L. and W.U.; supervision, G.W.; funding acquisition, G.W. All authors have read and agreed to the published version of the manuscript.

Funding

This research is financially supported by the “Sino-German Cooperation Group” project in the Sino-German Science Center of the National Natural Science Foundation of China, grant number GZ1447.

Data Availability Statement

The CAMP/Tibet data can be available from https://data.eol.ucar.edu/dataset/76.129 (UCAR/NCAR–Earth Observing Laboratory, et al., 2011) (accessed on 2 November 2021). The ZH2021 data can be downloaded from the National Tibetan Plateau/Third Pole Environment Data Center (https://doi.org/10.11888/Geocry.tpdc.271107) (accessed on 23 March 2023). SSM/I soil moisture can be available from the National Tibetan Plateau Data Center (https://doi.org/10.11888/Soil.tpdc.271611) (accessed on 15 August 2022). ECV COMBINED soil moisture is available at https://www.esa-soilmoisture-cci.org/data (accessed on 23 February 2023). ERA5-Land hourly and monthly data can be available at https://doi.org/10.24381/cds.e2161bac and https://doi.org/10.24381/cds.68d2bb30 (accessed on 3 February 2023). The hourly (M2T1NXLND) and monthly (M2TMNXLND) MERRA2 soil moisture can be accessible through the NASA Goddard Earth Sciences Data Information Services Center (GES DISC) at https://doi.org/10.5067/RKPHT8KC1Y1T and https://doi.org/10.5067/8S35XF81C28F (accessed on 5 February 2023). GLDAS Noah data are accessible from https://doi.org/10.5067/342OHQM9AK6Q and https://doi.org/10.5067/9SQ1B3ZXP2C5 (accessed on 5 February 2023). The China Meteorological Forcing Dataset (CMFD) is obtained from the National Tibetan Plateau Data Center (TPDC) (https://doi.org/10.11888/AtmosphericPhysics.tpe.249369.file) (accessed on 22 February 2023). The GTOPO30 elevation data can be downloaded through EarthExplorer (https://earthexplorer.usgs.gov/) (accessed on 3 January 2023). The MICLCover data are accessible from https://cstr.cn/18406.11.Socioeco.tpdc.270467 (accessed on 4 January 2023).

Acknowledgments

The authors are grateful to the anonymous reviewers and editors for their constructive comments and suggestions.

Conflicts of Interest

The authors declare no conflict of interest.

References

  1. Bras, R.L. Hydrology: An Introduction to Hydrologic Science; Addison-Wesley: Boston, MA, USA, 1990. [Google Scholar]
  2. Peng, J.; Loew, A.; Merlin, O.; Verhoest, N.E.C. A review of spatial downscaling of satellite remotely sensed soil moisture. Rev. Geophys. 2017, 55, 341–366. [Google Scholar] [CrossRef]
  3. Peng, J.; Albergel, C.; Balenzano, A.; Brocca, L.; Cartus, O.; Cosh, M.H.; Crow, W.T.; Dabrowska-Zielinska, K.; Dadson, S.; Davidson, M.W. A roadmap for high-resolution satellite soil moisture applications–confronting product characteristics with user requirements. Remote Sens. Environ. 2021, 252, 112162. [Google Scholar] [CrossRef]
  4. Koster, R.D.; Dirmeyer, P.A.; Guo, Z.; Bonan, G.; Chan, E.; Cox, P.; Gordon, C.; Kanae, S.; Kowalczyk, E.; Lawrence, D. Regions of strong coupling between soil moisture and precipitation. Science 2004, 305, 1138–1140. [Google Scholar] [CrossRef] [PubMed]
  5. Miralles, D.G.; Teuling, A.J.; Van Heerwaarden, C.C.; Vilà-Guerau de Arellano, J. Mega-heatwave temperatures due to combined soil desiccation and atmospheric heat accumulation. Nat. Geosci. 2014, 7, 345–349. [Google Scholar] [CrossRef]
  6. Dirmeyer, P.A.; Cash, B.A.; Kinter, J.L., III; Stan, C.; Jung, T.; Marx, L.; Towers, P.; Wedi, N.; Adams, J.M.; Altshuler, E.L. Evidence for enhanced land–atmosphere feedback in a warming climate. J. Hydrometeorol. 2012, 13, 981–995. [Google Scholar] [CrossRef]
  7. Wei, J.; Dirmeyer, P.A. Dissecting soil moisture-precipitation coupling. Geophys. Res. Lett. 2012, 39, L19711. [Google Scholar] [CrossRef]
  8. Taylor, C.M.; de Jeu, R.A.; Guichard, F.; Harris, P.P.; Dorigo, W.A. Afternoon rain more likely over drier soils. Nature 2012, 489, 423–426. [Google Scholar] [CrossRef]
  9. Hsu, H.; Dirmeyer, P.A. Soil moisture-evaporation coupling shifts into new gears under increasing CO2. Nat. Commun. 2023, 14, 1162. [Google Scholar] [CrossRef]
  10. Miralles, D.G.; Gentine, P.; Seneviratne, S.I.; Teuling, A.J. Land–atmospheric feedbacks during droughts and heatwaves: State of the science and current challenges. Ann. NY Acad. Sci. 2019, 1436, 19–35. [Google Scholar] [CrossRef]
  11. Yao, Y.; Liu, Y.; Zhou, S.; Song, J.; Fu, B. Soil moisture determines the recovery time of ecosystems from drought. Glob. Chang. Biol. 2023, 29, 3562–3574. [Google Scholar] [CrossRef]
  12. Li, S.; Wang, G.; Zhu, C.; Lu, J.; Ullah, W.; Hagan, D.F.T.; Kattel, G.; Liu, Y.; Zhang, Z.; Song, Y. Vegetation growth due to CO2 fertilization is threatened by increasing vapor pressure deficit. J. Hydrol. 2023, 619, 129292. [Google Scholar] [CrossRef]
  13. Yao, T.; Bolch, T.; Chen, D.; Gao, J.; Immerzeel, W.; Piao, S.; Su, F.; Thompson, L.; Wada, Y.; Wang, L. The imbalance of the Asian water tower. Nat. Rev. Earth Environ. 2022, 3, 618–632. [Google Scholar] [CrossRef]
  14. Zhang, Q.; Shen, Z.; Pokhrel, Y.; Farinotti, D.; Singh, V.P.; Xu, C.-Y.; Wu, W.; Wang, G. Oceanic climate changes threaten the sustainability of Asia’s water tower. Nature 2023, 615, 87–93. [Google Scholar] [CrossRef] [PubMed]
  15. Li, X.; Long, D.; Scanlon, B.R.; Mann, M.E.; Li, X.; Tian, F.; Sun, Z.; Wang, G. Climate change threatens terrestrial water storage over the Tibetan Plateau. Nat. Clim. Chang. 2022, 12, 801–807. [Google Scholar] [CrossRef]
  16. Seneviratne, S.I.; Corti, T.; Davin, E.L.; Hirschi, M.; Jaeger, E.B.; Lehner, I.; Orlowsky, B.; Teuling, A.J. Investigating soil moisture–climate interactions in a changing climate: A review. Earth-Sci. Rev. 2010, 99, 125–161. [Google Scholar] [CrossRef]
  17. Ullah, W.; Guojie, W.; Gao, Z.; Tawia Hagan, D.F.; Bhatti, A.S.; Zhua, C. Observed linkage between Tibetan Plateau soil moisture and South Asian summer precipitation and the possible mechanism. J. Clim. 2021, 34, 361–377. [Google Scholar] [CrossRef]
  18. Zhu, C.; Ullah, W.; Wang, G.; Lu, J.; Li, S.; Feng, A.; Hagan, D.F.T.; Jiang, T.; Su, B. Diagnosing potential impacts of Tibetan Plateau spring soil moisture anomalies on summer precipitation and floods in the Yangtze River basin. J. Geophys. Res. Atmos. 2023, 128, e2022JD037671. [Google Scholar] [CrossRef]
  19. Wang, A.; Shi, X. A multilayer soil moisture dataset based on the gravimetric method in China and its characteristics. J. Hydrometeorol. 2019, 20, 1721–1736. [Google Scholar] [CrossRef]
  20. Robinson, D.A.; Jones, S.B.; Wraith, J.M.; Or, D.; Friedman, S.P. A review of advances in dielectric and electrical conductivity measurement in soils using time domain reflectometry. Vadose Zone J. 2003, 2, 444–475. [Google Scholar] [CrossRef]
  21. Hollinger, S.E.; Isard, S.A. A soil moisture climatology of Illinois. J. Clim. 1994, 7, 822–833. [Google Scholar] [CrossRef]
  22. Valente, A.; Morais, R.; Tuli, A.; Hopmans, J.; Kluitenberg, G. Multi-functional probe for small-scale simultaneous measurements of soil thermal properties, water content, and electrical conductivity. Sens. Actuators A Phys. 2006, 132, 70–77. [Google Scholar] [CrossRef]
  23. Ma, Y.; Hu, Z.; Xie, Z.; Ma, W.; Wang, B.; Chen, X.; Li, M.; Zhong, L.; Sun, F.; Gu, L. A long-term (2005–2016) dataset of hourly integrated land–atmosphere interaction observations on the Tibetan Plateau. Earth Syst. Sci. Data 2020, 12, 2937–2957. [Google Scholar] [CrossRef]
  24. Dorigo, W.; Wagner, W.; Hohensinn, R.; Hahn, S.; Paulik, C.; Xaver, A.; Gruber, A.; Drusch, M.; Mecklenburg, S.; van Oevelen, P. The International Soil Moisture Network: A data hosting facility for global in situ soil moisture measurements. Hydrol. Earth Syst. Sci. 2011, 15, 1675–1698. [Google Scholar] [CrossRef]
  25. Leng, P.; Li, Z.-L.; Duan, S.-B.; Gao, M.-F.; Huo, H.-Y. A practical approach for deriving all-weather soil moisture content using combined satellite and meteorological data. ISPRS J. Photogramm. Remote Sens. 2017, 131, 40–51. [Google Scholar] [CrossRef]
  26. Van Der Velde, R.; Salama, M.; Pellarin, T.; Ofwono, M.; Ma, Y.; Su, Z. Long term soil moisture mapping over the Tibetan plateau using Special Sensor Microwave/Imager. Hydrol. Earth Syst. Sci. 2014, 18, 1323–1337. [Google Scholar] [CrossRef]
  27. Yao, P.; Lu, H.; Shi, J.; Zhao, T.; Yang, K.; Cosh, M.H.; Gianotti, D.J.S.; Entekhabi, D. A long term global daily soil moisture dataset derived from AMSR-E and AMSR2 (2002–2019). Sci. Data 2021, 8, 143. [Google Scholar] [CrossRef] [PubMed]
  28. Entekhabi, D.; Njoku, E.G.; O’neill, P.E.; Kellogg, K.H.; Crow, W.T.; Edelstein, W.N.; Entin, J.K.; Goodman, S.D.; Jackson, T.J.; Johnson, J. The soil moisture active passive (SMAP) mission. Proc. IEEE 2010, 98, 704–716. [Google Scholar] [CrossRef]
  29. Kerr, Y.H.; Waldteufel, P.; Wigneron, J.-P.; Delwart, S.; Cabot, F.; Boutin, J.; Escorihuela, M.-J.; Font, J.; Reul, N.; Gruhier, C. The SMOS mission: New tool for monitoring key elements ofthe global water cycle. Proc. IEEE 2010, 98, 666–687. [Google Scholar] [CrossRef]
  30. Wagner, W.; Hahn, S.; Kidd, R.; Melzer, T.; Bartalis, Z.; Hasenauer, S.; Figa, J.; De Rosnay, P.; Jann, A.; Schneider, S. The ASCAT soil moisture product: A review of its. Meteorol. Z. 2013, 22, 1–29. [Google Scholar] [CrossRef]
  31. Koike, T.; Nakamura, Y.; Kaihotsu, I.; Davaa, G.; Matsuura, N.; Tamagawa, K.; Fujii, H. Development of an advanced microwave scanning radiometer (AMSR-E) algorithm for soil moisture and vegetation water content. Proc. Hydraul. Eng. 2004, 48, 217–222. [Google Scholar] [CrossRef]
  32. Dorigo, W.; Wagner, W.; Albergel, C.; Albrecht, F.; Balsamo, G.; Brocca, L.; Chung, D.; Ertl, M.; Forkel, M.; Gruber, A. ESA CCI Soil Moisture for improved Earth system understanding: State-of-the art and future directions. Remote Sens. Environ. 2017, 203, 185–215. [Google Scholar] [CrossRef]
  33. Denissen, J.M.; Teuling, A.J.; Reichstein, M.; Orth, R. Critical soil moisture derived from satellite observations over Europe. J. Geophys. Res. Atmos. 2020, 125, e2019JD031672. [Google Scholar] [CrossRef]
  34. Bassiouni, M.; Good, S.P.; Still, C.J.; Higgins, C.W. Plant water uptake thresholds inferred from satellite soil moisture. Geophys. Res. Lett. 2020, 47, e2020GL087077. [Google Scholar] [CrossRef]
  35. Ford, T.; Harris, E.; Quiring, S. Estimating root zone soil moisture using near-surface observations from SMOS. Hydrol. Earth Syst. Sci. 2014, 18, 139–154. [Google Scholar] [CrossRef]
  36. Farahmand, A.; Reager, J.; Madani, N. Drought cascade in the terrestrial water cycle: Evidence from remote sensing. Geophys. Res. Lett. 2021, 48, e2021GL093482. [Google Scholar] [CrossRef]
  37. Muñoz-Sabater, J.; Dutra, E.; Balsamo, G.; Boussetta, S.; Zsoter, E.; Albergel, C.; Agusti-Panareda, A. ERA5-Land: An improved version of the ERA5 reanalysis land component. In Proceedings of the Joint ISWG and LSA-SAF Workshop IPMA, Lisbon, Portugal, 26–28 June 2018; pp. 26–28. [Google Scholar]
  38. Rodell, M.; Houser, P.; Jambor, U.; Gottschalck, J.; Mitchell, K.; Meng, C.-J.; Arsenault, K.; Cosgrove, B.; Radakovich, J.; Bosilovich, M. The global land data assimilation system. Bull. Am. Meteorol. Soc. 2004, 85, 381–394. [Google Scholar] [CrossRef]
  39. Reichle, R.H.; Liu, Q.; Koster, R.D.; Draper, C.S.; Mahanama, S.P.; Partyka, G.S. Land surface precipitation in MERRA-2. J. Clim. 2017, 30, 1643–1664. [Google Scholar] [CrossRef]
  40. Feldman, A.F.; Short Gianotti, D.J.; Dong, J.; Akbar, R.; Crow, W.T.; McColl, K.A.; Konings, A.G.; Nippert, J.B.; Tumber-Dávila, S.J.; Holbrook, N.M. Remotely sensed soil moisture can capture dynamics relevant to plant water uptake. Water Resour. Res. 2023, 59, e2022WR033814. [Google Scholar] [CrossRef]
  41. Akbar, R.; Short Gianotti, D.; McColl, K.A.; Haghighi, E.; Salvucci, G.D.; Entekhabi, D. Hydrological storage length scales represented by remote sensing estimates of soil moisture and precipitation. Water Resour. Res. 2018, 54, 1476–1492. [Google Scholar] [CrossRef]
  42. Wang, J.; Qi, L.; He, J.-H.; Wu, Z.-W. Relationship between spring soil moisture in the Tibetan Plateau and summer precipitation in the Yangtze river basin and its possible mechanism. Chin. J. Geophys. 2016, 59, 3985–3995. [Google Scholar]
  43. Berg, A.; Sheffield, J. Historic and projected changes in coupling between soil moisture and evapotranspiration (ET) in CMIP5 models confounded by the role of different ET components. J. Geophys. Res. Atmos. 2019, 124, 5791–5806. [Google Scholar] [CrossRef]
  44. Bauer-Marschallinger, B.; Freeman, V.; Cao, S.; Paulik, C.; Schaufler, S.; Stachl, T.; Modanesi, S.; Massari, C.; Ciabatta, L.; Brocca, L. Toward global soil moisture monitoring with Sentinel-1: Harnessing assets and overcoming obstacles. IEEE Trans. Geosci. Remote Sens. 2018, 57, 520–539. [Google Scholar] [CrossRef]
  45. Fan, L.; Xing, Z.; De Lannoy, G.; Frappart, F.; Peng, J.; Zeng, J.; Li, X.; Yang, K.; Zhao, T.; Shi, J. Evaluation of satellite and reanalysis estimates of surface and root-zone soil moisture in croplands of Jiangsu Province, China. Remote Sens. Environ. 2022, 282, 113283. [Google Scholar] [CrossRef]
  46. Gelaro, R.; McCarty, W.; Suárez, M.J.; Todling, R.; Molod, A.; Takacs, L.; Randles, C.A.; Darmenov, A.; Bosilovich, M.G.; Reichle, R. The modern-era retrospective analysis for research and applications, version 2 (MERRA-2). J. Clim. 2017, 30, 5419–5454. [Google Scholar] [CrossRef] [PubMed]
  47. Bi, H.; Ma, J.; Zheng, W.; Zeng, J. Comparison of soil moisture in GLDAS model simulations and in situ observations over the Tibetan Plateau. J. Geophys. Res. Atmos. 2016, 121, 2658–2678. [Google Scholar] [CrossRef]
  48. Zhao, L.; Zou, D.; Hu, G.; Wu, T.; Du, E.; Liu, G.; Xiao, Y.; Li, R.; Pang, Q.; Qiao, Y. A synthesis dataset of permafrost thermal state for the Qinghai–Tibet (Xizang) Plateau, China. Earth Syst. Sci. Data 2021, 13, 4207–4218. [Google Scholar] [CrossRef]
  49. Zhang, P.; Zheng, D.; van der Velde, R.; Wen, J.; Zeng, Y.; Wang, X.; Wang, Z.; Chen, J.; Su, Z. Status of the Tibetan Plateau observatory (Tibet-Obs) and a 10-year (2009–2019) surface soil moisture dataset. Earth Syst. Sci. Data 2021, 13, 3075–3102. [Google Scholar] [CrossRef]
  50. Yang, K.; Qin, J.; Zhao, L.; Chen, Y.; Tang, W.; Han, M.; Lazhu; Chen, Z.; Lv, N.; Ding, B. A multiscale soil moisture and freeze–thaw monitoring network on the third pole. Bull. Am. Meteorol. Soc. 2013, 94, 1907–1916. [Google Scholar]
  51. Su, Z.; Wen, J.; Dente, L.; Van Der Velde, R.; Wang, L.; Ma, Y.; Yang, K.; Hu, Z. The Tibetan Plateau observatory of plateau scale soil moisture and soil temperature (Tibet-Obs) for quantifying uncertainties in coarse resolution satellite and model products. Hydrol. Earth Syst. Sci. 2011, 15, 2303–2316. [Google Scholar] [CrossRef]
  52. Liu, J.; Chai, L.; Lu, Z.; Qu, Y.; Wang, J.; Yang, S. Validation of Five Passive Microwave Remotely Sensed Soil Moisture Products over the Qinghai-Tibet Plateau, China. In Proceedings of the IGARSS 2019—2019 IEEE International Geoscience and Remote Sensing Symposium, Yokohama, Japan, 28 July–2 August 2019; pp. 6182–6185. [Google Scholar]
  53. Wang, G.; Hagan, D.F.T.; Lou, D.; Chen, T. Evaluation of soil moisture derived from FY3B microwave brightness temperature over the Tibetan Plateau. Remote Sens. Lett. 2016, 7, 817–826. [Google Scholar] [CrossRef]
  54. Dente, L.; Su, Z.; Wen, J. Validation of SMOS soil moisture products over the Maqu and Twente regions. Sensors 2012, 12, 9965–9986. [Google Scholar] [CrossRef]
  55. Xing, Z.; Fan, L.; Zhao, L.; De Lannoy, G.; Frappart, F.; Peng, J.; Li, X.; Zeng, J.; Al-Yaari, A.; Yang, K. A first assessment of satellite and reanalysis estimates of surface and root-zone soil moisture over the permafrost region of Qinghai-Tibet Plateau. Remote Sens. Environ. 2021, 265, 112666. [Google Scholar] [CrossRef]
  56. Wang, L.; Liu, H.; Grießinger, J.; Chen, D.; Sun, C.; Fang, C. Enhanced Variability and Declining Trend of Soil Moisture Since the 1880s on the Southeastern Tibetan Plateau. Water Resour. Res. 2023, 59, e2022WR033953. [Google Scholar] [CrossRef]
  57. Meng, X.; Deng, M.; Talib, J.; Taylor, C.; Wu, P.; Lyu, S.; Chen, H.; Li, Z.; Zhao, L. Diagnosing product variability in the soil moisture response to precipitation on the Tibetan Plateau. J. Hydrometeorol. 2023, 24, 625–639. [Google Scholar] [CrossRef]
  58. Chen, W.; Yao, T.; Zhang, G.; Woolway, R.I.; Yang, W.; Xu, F.; Zhou, T. Glacier surface heatwaves over the Tibetan Plateau. Geophys. Res. Lett. 2023, 50, e2022GL101115. [Google Scholar] [CrossRef]
  59. Wu, P.; Liu, Y.-J.; Wang, J.; Ding, Y.-H. Revisiting the variations of precipitation and water vapour budget over the Tibetan Plateau. Adv. Clim. Chang. Res. 2023, 14, 77–84. [Google Scholar] [CrossRef]
  60. Wang, L.; Lu, J.; Zhou, R.; Duan, G.; Wen, Z. Analysis of Soil Moisture Change Characteristics and Influencing Factors of Grassland on the Tibetan Plateau. Remote Sens. 2023, 15, 298. [Google Scholar] [CrossRef]
  61. Wang, H.; Zan, B.; Wei, J.; Song, Y.; Mao, Q. Spatiotemporal characteristics of soil Moisture and land–atmosphere coupling over the Tibetan Plateau derived from three gridded datasets. Remote Sens. 2022, 14, 5819. [Google Scholar] [CrossRef]
  62. Tawia Hagan, D.F.; Wang, G.; San Liang, X.; Dolman, H.A. A time-varying causality formalism based on the Liang–Kleeman information flow for analyzing directed interactions in nonstationary climate systems. J. Clim. 2019, 32, 7521–7537. [Google Scholar] [CrossRef]
  63. Li, W.; Migliavacca, M.; Forkel, M.; Denissen, J.M.; Reichstein, M.; Yang, H.; Duveiller, G.; Weber, U.; Orth, R. Widespread increasing vegetation sensitivity to soil moisture. Nat. Commun. 2022, 13, 3959. [Google Scholar] [CrossRef]
  64. Sun, H.; Liu, X. Impacts of dynamic and thermal forcing by the Tibetan Plateau on the precipitation distribution in the Asian arid and monsoon regions. Clim. Dyn. 2021, 56, 2339–2358. [Google Scholar] [CrossRef]
  65. Qu, Y.; Zhu, Z.; Chai, L.; Liu, S.; Montzka, C.; Liu, J.; Yang, X.; Lu, Z.; Jin, R.; Li, X. Rebuilding a microwave soil moisture product using random forest adopting AMSR-E/AMSR2 brightness temperature and SMAP over the Qinghai–Tibet Plateau, China. Remote Sens. 2019, 11, 683. [Google Scholar] [CrossRef]
  66. Cui, A.; Lu, H.; Liu, X.; Shen, C.; Xu, D.; Xu, B.; Wu, N. Tibetan plateau precipitation modulated by the periodically coupled westerlies and Asian monsoon. Geophys. Res. Lett. 2021, 48, e2020GL091543. [Google Scholar] [CrossRef]
  67. Yang, S.; Zeng, J.; Fan, W.; Cui, Y. Evaluating Root-Zone Soil Moisture Products from GLEAM, GLDAS, and ERA5 Based on In Situ Observations and Triple Collocation Method over the Tibetan Plateau. J. Hydrometeorol. 2022, 23, 1861–1878. [Google Scholar] [CrossRef]
  68. Ran, Y.; Li, X.; Lu, L.; Li, Z. Large-scale land cover mapping with the integration of multi-source information based on the Dempster–Shafer theory. Int. J. Geogr. Inf. Sci. 2012, 26, 169–191. [Google Scholar] [CrossRef]
  69. Ma, Y.; Su, Z.; Koike, T.; Yao, T.; Ishikawa, H.; Ueno, K.i.; Menenti, M. On measuring and remote sensing surface energy partitioning over the Tibetan Plateau––from GAME/Tibet to CAMP/Tibet. Phys. Chem. Earth Parts A/B/C 2003, 28, 63–74. [Google Scholar] [CrossRef]
  70. Jiang, H.; Yi, Y.; Zhang, W.; Yang, K.; Chen, D. Sensitivity of soil freeze/thaw dynamics to environmental conditions at different spatial scales in the central Tibetan Plateau. Sci. Total Environ. 2020, 734, 139261. [Google Scholar] [CrossRef] [PubMed]
  71. Ge, N.; Zhong, L.; Ma, Y.; Cheng, M.; Wang, X.; Zou, M.; Huang, Z. Estimation of land surface heat fluxes based on Landsat 7 ETM+ data and field measurements over the northern Tibetan Plateau. Remote Sens. 2019, 11, 2899. [Google Scholar] [CrossRef]
  72. Wang, G.; Garcia, D.; Liu, Y.; De Jeu, R.; Dolman, A.J. A three-dimensional gap filling method for large geophysical datasets: Application to global satellite soil moisture observations. Environ. Model. Softw. 2012, 30, 139–142. [Google Scholar] [CrossRef]
  73. Gruber, A.; Scanlon, T.; van der Schalie, R.; Wagner, W.; Dorigo, W. Evolution of the ESA CCI Soil Moisture climate data records and their underlying merging methodology. Earth Syst. Sci. Data 2019, 11, 717–739. [Google Scholar] [CrossRef]
  74. Muñoz-Sabater, J.; Dutra, E.; Agustí-Panareda, A.; Albergel, C.; Arduini, G.; Balsamo, G.; Boussetta, S.; Choulga, M.; Harrigan, S.; Hersbach, H. ERA5-Land: A state-of-the-art global reanalysis dataset for land applications. Earth Syst. Sci. Data 2021, 13, 4349–4383. [Google Scholar] [CrossRef]
  75. Hagan, D.F.T.; Parinussa, R.M.; Wang, G.; Draper, C.S. An evaluation of soil moisture anomalies from global model-based datasets over the people’s republic of China. Water 2019, 12, 117. [Google Scholar] [CrossRef]
  76. Zhu, Z.; Shi, C. Simulation and evaluation of CLDAS and GLDAS soil moisture data in China. Sci. Technol. Eng. 2014, 14, 138–144. [Google Scholar]
  77. Deng, M.; Meng, X.; Li, Z.; Lyv, Y.; Lei, H.; Zhao, L.; Zhao, S.; Ge, J.; Jing, H. Responses of soil moisture to regional climate change over the three rivers source region on the tibetan plateau. Int. J. Climatol. 2020, 40, 2403–2417. [Google Scholar] [CrossRef]
  78. Mingshan, D.; Xianhong, M.; Yingsai, M.; Yingying, A. Analysis on soil moisture characteristics of Tibetan Plateau based on GLDAS. J. Arid Meteorol. 2018, 36, 595. [Google Scholar]
  79. He, J.; Yang, K.; Tang, W.; Lu, H.; Qin, J.; Chen, Y.; Li, X. The first high-resolution meteorological forcing dataset for land process studies over China. Sci. Data 2020, 7, 25. [Google Scholar] [CrossRef] [PubMed]
  80. Wilcox, R.R. Fundamentals of Modern Statistical Methods: Substantially Improving Power and Accuracy; Springer: Berlin/Heidelberg, Germany, 2010; Volume 249. [Google Scholar]
  81. Lu, J.; Wang, G.; Li, S.; Feng, A.; Zhan, M.; Jiang, T.; Su, B.; Wang, Y. Projected land evaporation and its response to vegetation greening over China under multiple scenarios in the CMIP6 models. J. Geophys. Res. Biogeosci. 2021, 126, e2021JG006327. [Google Scholar] [CrossRef]
  82. Mann, H.B. Nonparametric tests against trend. Econom. J. Econom. Soc. 1945, 13, 245–259. [Google Scholar] [CrossRef]
  83. Kendall, M.G. Rank Correlation Methods; Griffin: London, UK, 1975. [Google Scholar]
  84. Rial, M.; Cortizas, A.M.; Rodríguez-Lado, L. Understanding the spatial distribution of factors controlling topsoil organic carbon content in European soils. Sci. Total Environ. 2017, 609, 1411–1422. [Google Scholar] [CrossRef]
  85. Chen, Y.; Yang, K.; Qin, J.; Zhao, L.; Tang, W.; Han, M. Evaluation of AMSR-E retrievals and GLDAS simulations against observations of a soil moisture network on the central Tibetan Plateau. J. Geophys. Res. Atmos. 2013, 118, 4466–4475. [Google Scholar] [CrossRef]
  86. Dai, L.; Fu, R.; Guo, X.; Du, Y.; Zhang, F.; Cao, G. Soil moisture variations in response to precipitation across different vegetation types on the northeastern Qinghai-Tibet plateau. Front. Plant Sci. 2022, 13, 854152. [Google Scholar] [CrossRef]
  87. Nayak, H.P.; Nayak, S.; Maity, S.; Patra, N.; Singh, K.S.; Dutta, S. Sensitivity of Land Surface Processes and Its Variation during Contrasting Seasons over India. Atmosphere 2022, 13, 1382. [Google Scholar] [CrossRef]
  88. Zhang, T.; Shen, S.; Cheng, C. Impact of radiations on the long-range correlation of soil moisture: A case study of the A’rou superstation in the Heihe River Basin. J. Geogr. Sci. 2019, 29, 1491–1506. [Google Scholar] [CrossRef]
  89. Yang, K.; He, J.; Tang, W.; Qin, J.; Cheng, C.C. On downward shortwave and longwave radiations over high altitude regions: Observation and modeling in the Tibetan Plateau. Agric. For. Meteorol. 2010, 150, 38–46. [Google Scholar] [CrossRef]
  90. Bartold, M.; Kluczek, M. A Machine Learning Approach for Mapping Chlorophyll Fluorescence at Inland Wetlands. Remote Sens. 2023, 15, 2392. [Google Scholar] [CrossRef]
  91. Karthikeyan, L.; Mishra, A.K. Multi-layer high-resolution soil moisture estimation using machine learning over the United States. Remote Sens. Environ. 2021, 266, 112706. [Google Scholar] [CrossRef]
Figure 1. Overview of the study area. (a) Land cover classifications over the Tibetan Plateau (TP). (b) Locations of the seven CAMP/Tibet sites (black triangles) and five ZH2021 sites (black circles) over the TP. (c) TP elevation in meters and its geographical location in China.
Remotesensing 15 04414 g001
Figure 2. The scatterplots of monthly soil moisture values of multi-source products (SSM/I, ECV COMBINED, ERA5-Land, MERRA2, and GLDAS Noah) against two sources of in situ observation networks: (a1a5) CAMP/Tibet and (b1b5) ZH2021. The num means the count of available monthly soil moisture values between products and ground observations. The black dashed lines indicate the 1:1 line.
Remotesensing 15 04414 g002
Figure 3. The annual mean soil moisture during 1988–2008 over the TP for (a) SSM/I, (b) ECV COMBINED, (c) ERA5-Land, (d) MERRA2, and (e) GLDAS Noah.
Remotesensing 15 04414 g003
Figure 4. The seasonal mean soil moisture during 1988–2008 over the TP in spring, summer, autumn, and winter for (ad) SSM/I, (eh) ECV COMBINED, (il) ERA5-Land, (mp) MERRA2, and (qt) GLDAS Noah.
Remotesensing 15 04414 g004
Figure 5. The annual trend of soil moisture during 1988–2008 over the TP region for (a) SSM/I, (b) ECV COMBINED, (c) ERA5-Land, (d) MERRA2, and (e) GLDAS Noah. The dotted region passed the significant test level (alpha = 0.05).
Remotesensing 15 04414 g005
Figure 6. The seasonal trend of soil moisture during 1988–2008 over TP region in spring, summer, autumn, and winter for (ad) SSM/I, (eh) ECV COMBINED, (il) ERA5-Land, (mp) MERRA2, and (qt) GLDAS Noah. The dotted region passed the significance level of 0.05.
Remotesensing 15 04414 g006
Figure 7. The relative importance of each climatic variable on soil moisture over the TP region during warm seasons of 1988–2008 for SSM/I, ECV COMBINED, ERA5-Land, MERRA2, and GLDAS Noah. The climatic variables are precipitation, longwave radiation, shortwave radiation, air temperature, specific humidity and wind speed.
Remotesensing 15 04414 g007
Figure 8. The partial correlation between precipitation and warming season soil moisture over TP region during 1988–2008 for SSM/I, ECV COMBINED, ERA5-Land, MERRA2, and GLDAS Noah. The dotted region passed the significant test level (alpha = 0.05).
Remotesensing 15 04414 g008
Figure 9. The scatterplots of warm-season soil moisture anomalies against those predicted with trained random forest regression method over TP region during 1988–2008 for SSM/I, ECV COMBINED, ERA5-Land, MERRA2, and GLDAS Noah.
Remotesensing 15 04414 g009
Table 1. Information on in situ measurements.
Sites NameLongitude (°E)Latitude (°N)Time RangeDepth (m)
CAMP/TibetAmdo91.6232.2401/10/2002–04/09/2003−2.79, −2.58, −2.00, −1.60, −1.30, −1.00, −0.80, −0.60, −0.40, −0.20, −0.04
BJ91.9031.3701/10/2002–31/03/2004−2.50, −2.10, −2.00, −1.60, −1.30, −1.00, −0.80, −0.60, −0.40, −0.20, −0.04
D6693.7835.5201/10/2002–31/03/2004−2.50, −2.25, −2.00, −1.60, −1.30, −1.00, −0.80, −0.60, −0.40, −0.20, −0.04
D10591.9433.0601/10/2002–31/03/2004−1.90, −1.85, −1.80, −1.60, −1.30, −1.00, −0.80, −0.60, −0.40, −0.20, −0.04
D11091.8732.6901/10/2002–31/03/2004−1.80, −1.60, −1.30, −1.00, −0.80, −0.60, −0.40, −0.20,−0.04, 0.00
MS360891.7831.2301/10/2002–31/03/2004−2.42, −2.00, −1.96, −1.60, −1.30, −1.00, −0.80, −0.60, −0.40, −0.20, −0.04
Tuotuohe92.4434.2201/10/2002–31/03/2004−2.71, −2.30, −2.00, −1.60, −1.30, −1.00, −0.80, −0.60, −0.40, −0.20, −0.04
ZH2021Ch0491.7431.8207/06/2001–31/12/2006−1.20, −0.95, −0.50, −0.15
Ch0694.0635.6201/01/2005–31/12/2016−1.80, −1.00, −0.40, −0.10
QT0193.0435.1401/01/2004–01/10/2014−1.80, −1.00, −0.50, −0.10
QT0392.9234.8201/01/2004–31/12/2014−2.40, −1.80, −0.90, −0.50, −0.05
QT0592.3433.9601/01/2004–31/12/2008−2.70, −2.10, −0.90, −0.60, −0.10
Table 3. Different metrics of evaluating multi-source soil moisture products with two sources of in situ observation networks: CAMP/Tibet and ZH2021.
RBIASMAERMSEubRMSE
CAMP/Tibet
SSM/I0.56−0.010.070.090.09
ECV COMBINED0.48−0.020.070.080.08
ERA5-Land0.330.190.190.230.12
MERRA20.420.080.100.120.10
GLDAS Noah0.630.000.070.080.08
ZH2021
SSM/I0.650.000.080.100.10
ECV COMBINED0.340.020.100.120.11
ERA5-Land−0.090.280.280.330.18
MERRA20.500.070.130.140.12
GLDAS Noah0.640.030.090.110.10
Disclaimer/Publisher’s Note: The statements, opinions and data contained in all publications are solely those of the individual author(s) and contributor(s) and not of MDPI and/or the editor(s). MDPI and/or the editor(s) disclaim responsibility for any injury to people or property resulting from any ideas, methods, instructions or products referred to in the content.

