
Crop Water Productivity from Cloud-Based Landsat Helps Assess California’s Water Savings
by
 , , , and
Daniel Foley
1,*,
Prasad Thenkabail
1,
Adam Oliphant
1,
Itiya Aneece
1 and
Pardhasaradhi Teluguntla
1,2 1
U.S. Geological Survey, 2255 N. Gemini Rd., Flagstaff, ZA 86001, USA
2
Bay Area Environmental Research Institute, NASA Ames Research Park, Building 18 Room 101, Moffett Field, CA 94035, USA
*
Author to whom correspondence should be addressed.
Remote Sens. 2023, 15(19), 4894; https://doi.org/10.3390/rs15194894
Submission received: 7 July 2023
/
Revised: 5 September 2023
/
Accepted: 6 September 2023
/
Published: 9 October 2023
(This article belongs to the Section Remote Sensing in Agriculture and Vegetation)
Abstract
:Demand for food and water are increasing while the extent of arable land and accessible fresh water are decreasing. This poses global challenges as economies continue to develop and the population grows. With agriculture as the leading consumer of water, better understanding how water is used to produce food may help support the increase of Crop Water Productivity (CWP; kg/m3), the ratio of crop output per unit of water input (or crop per drop). Previous large-scale CWP studies have been useful for broad water use modeling at coarser resolutions. However, obtaining more precise CWP, especially for specific crop types in a particular area and growing season as outlined here are important for informing farm-scale water management decision making. Therefore, this study focused on California’s Central Valley utilizing high-spatial resolution satellite imagery of 30 m (0.09 hectares per pixel) to generate more precise CWP for commonly grown and water-intensive irrigated crops. First, two products were modeled and mapped. 1. Landsat based Actual Evapotranspiration (ETa; mm/d) to determine Crop Water Use (CWU; m3/m2), and 2. Crop Productivity (CP; kg/m2) to estimate crop yield per growing season. Then, CWP was calculated by dividing CP by CWU and mapped. The amount of water that can be saved by increasing CWP of each crop was further calculated. For example, in the 434 million m2 study area, a 10% increase in CWP across the 9 crops analyzed had a potential water savings of 31.5 million m3 of water. An increase in CWP is widely considered the best approach for saving maximum quantities of water. This paper proposed, developed, and implemented a workflow of combined methods utilizing cloud computing based remote sensing data. The environmental implications of this work in assessing water savings for food and water security in the 21st century are expected to be significant.
1. Introduction
Water availability and its role in agriculture is becoming ever more crucial to the health of our nations, economies, and the natural environment. Water scarcity has become a worldwide concern in recent decades, and is expected to further increase due to socio-economic and climatic changes [1]. As the global population continues to climb in the 21st century, demand for food and water is accelerating whereas availability of sustainable arable land and accessible fresh water are declining. Food and water security for the estimated 10 billion people by 2050 and 12 billion people by 2100 will require a major shift in how land and water are used to produce food [2]. This looming problem may be mitigated by increasing agricultural Crop Water Productivity (CWP), or the ratio of crop yield over water consumed, to produce more food with less water [3]. Growing food demands and increasing standards of living have raised global water use 8-fold from around 500 to 4000 km3/yr from 1900–2010 [4]. In the last century water use grew at almost twice the rate of population increase [5]. Having accessible fresh water to grow enough food to feed the planet in the 21st century has become increasingly challenging as the world’s population added one billion people since 2007 and two billion since 1994 [6] reaching 8 billion in 2022 [7]. The need for irrigated food production is projected to increase by more than 50% by 2050; however, the amount of water withdrawn by agriculture can increase by only 10% with current infrastructure and availability [2].
With demand for agricultural products expected to exceed production by 2050, addressing the needs of an increasing global population coupled with decreased water availability presents a significant challenge. A solution to address this problem is to increase crop production while decreasing water consumption by sustainably improving CWP. A better understanding of the variables that affect CWP including crop water use may support production of more crops with less water. Several studies have been done to calculate Actual Evapotranspiration (ETa) using remote sensing (e.g. Wong et al. [8], Schauer and Senay [9], Senay et al. [10], He et al. [11], Semmens et al. [12]). As these studies and others demonstrate great capabilities in Evapotranspiration and water use analysis, few provide sufficient data on crop yield per unit of water used. Remote sensing based CWP studies that can distinguish various crops from diverse fields are still in the nascent stage, especially using higher spatial resolution data such as Landsat [13,14,15]. However, the potential usefulness for such studies is great given the ability of high-resolution remote sensing to capture field level CWP and assess different crops in different growing seasons.
Due to a steadily increasing demand for water during the last few decades, water scarcity has become a threat to the sustainable development of society [16]. Globally, agriculture comprises approximately 70–90% of human freshwater use [4,17,18]. Better quantification of agricultural water use relative to crop yield may help improve how water is used to produce food at field and regional extents. Establishing a framework to better understand CWP is important for rapidly changing agricultural regions shifting from lower value annual crops to higher value and more water-intensive perennials. For example, in the Central Valley of California (CVC) row crops have been increasingly shifted to longer-lived drought intolerant cropland such as orchards in recent years [19]. CWP studies with remote sensing data that can be tracked over time to adapt to changing agricultural practices may support improved understanding of the impacts of crop changes on CWP.
The overarching goal of this study is to better understand, model, map, and monitor agricultural CWP of some of the leading world crops using remote sensing. This study aims to provide a set of methodologies to calculate ETa and CWP with Google Earth Engine (GEE) at 30 m resolution. Our approach was to develop a suite of methods utilizing various data sets including ground based meteorological data and local agricultural statistics for a benchmark study location as a test of concept. Major research questions to answer include: What is the CWP of world staple crops and high-water consuming crops, how does CWP vary between crops, and how much water can be potentially saved by increasing CWP? Major objectives of this paper include to establish methods for ETa and CWP modeling, mapping, and monitoring. In the future this benchmark study site may be used to provide insight to scale up to larger areas and greater time-series leveraging the power of cloud computing.
2. Materials and Methods
2.1. Study Area
The area of study is within the CVC, a narrow (50–110 km) north–south trending, elongated (640 km) alluvial valley with a highly irrigated agriculture industry estimated to be worth over $50 billion [20]. As variation in weather and growing/irrigation practices can vary across the valley, we chose a CVC county-scale region for analysis. We used geospatial datasets containing overlapping Landsat images with low cloud cover in close proximity to weather stations to provide ground data. We focused on the southern CVC, which has a hotter and drier climate relative to its northern section and thus more heavily irrigated crops. Therefore, the region centered around the California Irrigation Management Information System (CIMIS) Firebaugh/Telles weather station number 7 (Latitude: 36.851222, Longitude: −120.59092) was chosen (Figure 1). This station at an elevation of 56 m [21] and approximately 61 km west of Fresno surrounded by mostly low gradient agricultural land collects inputs utilized in our modeling approach. This area, with its diverse row, paddy, orchard, and vineyard crops, is ideal for assessing commonly-grown and water-intensive crops of interest. The zone of study is 1135.54 km2 in area (373 km2 cropland) with a perimeter of 135.26 km that comprises about 1.25 million pixels in Landsat 8 imagery at 30 m resolution.
All analyses were performed in our study area predominantly in Fresno County within the greater San Joaquin Watershed (SJW). The SJW contains various land use types including cropland, pasture-based livestock farming, and forests. Major crops grown in the SJW include nuts, vegetables, cotton, fruits, and field crops. The soils are mostly clay loams to fine sandy loams [22]. The SJW has a typical Mediterranean climate, with cool, rainy winters and hot, dry summers. Its annual average rainfall ranges from 200 to 300 mm with the majority of rainfall during November to April with little from May to October [23]. With its variable climatic conditions, the CVC is highly dependent on irrigation demanding 80% of California’s complex water allocation system delivering almost five times the amount of surface water than the annual average state runoff can support [24]. Several irrigation districts provide water to users through irrigation canals and aqueducts in the SJW. With sparse surface water and increased stress on the water supply system due to prolonged drought, many farmers have turned to limited groundwater sources [23].
2.2. Meteorological Data
Meteorological data provided by the CIMIS weather station network were used to derive Reference Evapotranspiration (ETo) to aid in calculations of crop water use. CIMIS was established by the California Department of Water Resources and the University of California Davis in 1982 to provide weather information for irrigation management [25]. This system provides over 145 automated weather stations that collect and store climatological data around California. Integral to this study, the CIMIS network also calculates and disseminates standardized ETo updated on a daily basis. CIMIS methods for ETo calculation use hourly equations as described by Allen et al. [26] that are summed over 24 h computing daily ETo (mm/d) [27]. These daily ETo (mm/d) values derived from grass reference measurements were taken from dates corresponding with each Landsat image analyzed.
2.3. Cropland Data
The Cropland Data Layer (CDL) from the U.S. Department of Agriculture (USDA) National Agricultural Statistics Service (NASS) [28] was used to select almonds, cotton, winter wheat, pistachios, grapes, barley, rice, corn, and walnuts (Figure 1). The CDL is a comprehensive, raster-formatted, georeferenced, crop specific land cover classification product that utilizes orthorectified imagery to geospatially identify field crop types [29]. This remote-sensing based annual product has provided conterminous coverage of the U.S. at 30 m resolution since 2010 [30,31]. The food and fiber crops present in the study area in various amounts were chosen to be representative of world staple and prominent high-water consuming crops.
2.4. Landsat Satellite Sensor Data
Monitoring change in agricultural systems is vital for understanding food production, water conservation, climate change, and evaluating major environmental challenges [31,32]. This can be completed more efficiently by analyzing large agricultural areas with satellite-based remote sensing. Landsat 8 Tier 1 Collection 1 Surface Reflectance images imported and processed via the GEE cloud-based image catalog were used for analysis. The imagery contains five visible and near-infrared (VNIR) bands and two short-wave infrared (SWIR) bands processed to orthorectified surface reflectance, as well as two thermal infrared (TIR) bands processed to orthorectified brightness temperature pre-processed by the United States Geological Survey (USGS). These data have been atmospherically corrected using the Landsat Surface Reflectance Code algorithm and includes a cloud, shadow, and snow mask produced using the C Function of Mask algorithm as well as a per-pixel saturation mask [33]. To select viable images a filter was applied in GEE to select 18% or less overall cloud cover for all Landsat 8 images covering the study area in 2016. This atmospheric threshold was established by examining images to maximize cloudless scenes of cropland areas at this location. Images were then visually inspected for cloud-free coverage of study area croplands. To provide more accurate raster ETa maps, 15 cloud-free Landsat 8 images from 2016 were utilized for ETa analysis in this study.
2.4.1. Growing Season and NDVI
The growing season of each crop was determined based on Normalized Difference Vegetation Index (NDVI), a widely recognized remote sensing index to monitor crop health and phenology. As cropping patterns change in the CVC, 2016 was chosen due to the diversity of both annual row and perennial tree crops present in the relatively small agricultural study area at this time. Next, as California experienced a drought considered to be one of the worst in state history from 2012–2016 [34,35], CWP was of great concern as agricultural drought impacts in California were often buffered by local groundwater [36]. Moreover, a GEE time-series yearly rainfall analysis from 2000–2021 using the Climate Hazards group Infrared Precipitation with Stations (CHIRPS) [37] was performed over the CVC. From this assessment, 2016 was chosen on being the maximum CVC year of annual precipitation between 2012–2016 to not reflect extreme drought conditions yet to still be within the moderate 25–75% percentile range from 2000–2021.
To determine NDVI of select crop types, data points were manually input to pinpoint nine crop types [28] within the study area as separate geometries in GEE. Then, GEE time-series image processing of NDVI at these points spanning the 2016 Landsat 8 image collection at 18% or less cloud cover was performed. In this analysis, NDVI represents the ratio of the difference between the near-infrared (NIR) and red bands divided by the sum of the NIR and red bands utilzing Equation (1) where nir and r are measured surface reflectance values of NIR and red spectral bands [38].
Year-round NDVI data specific to each crop type from 19 Landsat images with at least one image per month were produced. Whereas only 15 cloud free images were used for per pixel ETa calculation, more images could be used for NDVI yearly analysis as points of selection for each crop could be selected outside of sparsely cloudy areas. These measurements were used to determine substantial increases and decreases in NDVI to demarcate the beginning and ending of each growing season for subsequent ETa, Crop Water Use (CWU), and CWP calculations. The growing season for cotton, winter wheat, grapes, barley, rice, and corn was estimated to be 15 May–15 November, 15 January–15 May, 15 March–15 November, 15 January–15 May, 15 May–15 November, and 15 April–15 September, respectively. As these Landsat 8 images providing daily ETa values were scattered throughout the year, to estimate growing season, the start and end date was rounded either to the 1st or 15th of the month depending on which date the image was closer to. The growing season was considered year-round for tree nut crops including almonds, pistachios, and walnuts.
2.4.2. Land Surface Temperature Data from Thermal Bands
Land Surface Temperature (LST) derived from TIR imagery acquired from satellites such as Landsat has successfully been used to estimate evapotranspiration over a range of spatial scales [12]. LST (°C) maps were produced from instantaneous Landsat 8 thermal band values collected at the time of overpass to aid in ETa calculation. To determine image thermal properties, the TIR Band 10 (B10) containing brightness temperature was selected to provide less image noise relative to TIR Band 11. While originally collected with a resolution of 100 m/pixel, B10 has been resampled using cubic convolution to 30 m with a wavelength of 10.6–11.2 and a scale of 0.1 [33].
2.5. Methods for Workflow
The methods for this research are outlined in Figure 2.
ETa has become a standard measurement for water resource users and managers to accurately determine consumptive water use over large spatial and temporal extents. This measurement represents a major component in the water cycle as most water consumption can be derived via ETa as water returns to the atmosphere via evaporation from the surface and transpiration from plants. ETa is an ideal measurement for remote sensing as it occurs throughout the day making it optimal for polar orbiting satellites such as Landsat that have a single site visit per day during daylight hours. Methods for determining CWP were based on daily ETa calculated for each Landsat 8 image analyzed are described below.
2.5.1. Step 1: Reference Evapotranspiration (ETo)
Reference Evapotranspiration (ETo) represents the amount of water used by a specific reference crop, usually a well-watered grass with known measurements [39]. ETo characterizes the rate of evapotranspiration from a hypothetical reference crop with an assumed crop height of 0.12 m, a fixed surface resistance of 70 s/m, and an albedo of 0.23 [40]. We acquired daily grass reference ETo from 19 CIMIS weather stations throughout the southern CVC corresponding to each Landsat image date analyzed [28]. ETo (mm/d) data was then Kriging interpolated to produce raster maps for each Landsat image date analyzed throughout 2016 to aid in ETa calculation.
2.5.2. Step 2: Evaporative Fraction (ETf)
Evaporative Fraction (ETf) is the ratio of latent heat to total available energy over land surfaces to infer daily energy balance information based on midday remote sensing measurements [41]. To determine ETf, LST maps were produced from instantaneous thermal values at the time of image acquisition for pixel selection based on methods from Senay et al. [42]. This included a Hot Pixel (Th) from non-vegetated land, a Cold Pixel (Tc) from cropland, and a Pixel X (Tx) representing the LST of any pixel for analysis. Hot and Cold Pixels were selected based on the 94th–95th and 5th–6th percentile temperature ranges of a LST histogram. Maps of these were overlaid to select pixels between these designated temperature ranges to produce per pixel ETf (unitless) maps at the time of overpass with Equation (2) for each image analyzed.
where:
- ETf = Evaporative Fraction, 0–1 (unitless);
- Tc = Land Surface Temperature of cold pixel (°C);
- Th = Land Surface Temperature of hot pixel (°C);
- Tx = Land Surface Temperature of any pixel (°C).
2.5.3. Step 3: Actual Evapotranspiration (ETa) and Crop Water Use (CWU)
ETa was calculated based on the Simplified Surface Energy Balance (SSEB) model (Equation (3)) [42]. This was determined per pixel by multiplying a ETo map (mm/d) by an ETf (unitless) map, producing an ETa (mm/d) raster map (Figure 3). This model was selected as a test of concept for our methodology as SSEB has been well established worldwide in various environments allowing scalability for the diverse and complex CVC cropping patterns. This model provides a framework for ETa monitoring in irrigated croplands suitable for this study with highly irrigated and variable crop fields allowing flexibility for local conditions. However, we acknowledge there are more advanced versions of SSEB based remote sensing ETa models such as Senay et al. 2013 [43], 2018 [44], 2022 [45], and 2023 [46].
Image analysis was performed utilizing GEE cloud computing of Landsat images to produce ETa (mm/d) raster maps at 30 m resolution for 15 images spanning 2016 (Figure 4). Crop specific ETa was then determined by overlaying a CDL crop type map to generate 115,000 evenly spaced points across the image. Values from these points were then extracted to export a dataset designating both ETa and crop type per point. From this, ETa was averaged per crop for each image to provide daily ETa (mm/d) per crop per image. For January and May, cloud free Landsat 8 images were not available to produce a complete per pixel study area ETa map. Therefore, January and May ETa were interpolated based on a ratio of calculated ETa/NDVI per crop from each image analyzed based on crop specific NDVI analysis selected from cloud free points in January and May images. This ratio was then averaged over the less than a year growing seasons for cotton, winter wheat, grapes, barley, rice, and corn. For the tree crops almonds, pistachios, and walnuts considered to have year-round growing seasons, the ETa/NDVI ratio to estimate January and May ETa was determined by averaging three-month intervals of ETa/NDVI closest to the corresponding interpolated month. This per crop growing season ETa/NDVI ratio was then multiplied by respective January and May NDVI per crop to estimate a daily ETa (mm/d) to represent May and January allowing for ETa estimation per month throughout 2016.
Daily ETa values calculated from this study were utilized to extrapolate total CWU (m3) and CWU per area (m3/m2). Out of the 15 Landsat images used in this study, February, April, July, August, and September had two images per month. Therefore, the two ETa values per month were averaged to provide a daily average crop ETa (mm/d) per month. For months with only one cloud free image available or an interpolated ETa, the ETa calculated that month was used to represent daily crop ETa (mm/d) for that month. Next, ETa (mm/d) was converted to mm/month by multiplying by days per month. Then, ETa (m/month) was multiplied by crop area (m2) to produce total CWU (m3) per month. If the crop growing season started or ended approximately at the month halfway mark (cotton, winter wheat, grapes, barley, rice, and corn), total CWU (m3) for that month was divided by half. Then, the monthly total CWU (m3) of each crops respective growing season was summed to estimate total CWU (m3) per crop. The total CWU (m3) was then divided by crop area (m2) to produce CWU per area (m3/m2).
2.6. Methods for Calculating Crop Productivity (kg/m2)
Crop Productivity (CP), a measure of crop yield (kg) per area (m2) (Equation (4)) was used to determine CWP. CP (kg/m2) was calculated from the California Department of Food and Agriculture (CDFA) [47,48] published 2016 ratio of crop yield per crop area and then scaled to the study area. This statewide ratio (kg/m2) was then multiplied by crop area (m2) to estimate crop yield within the study area (Table 1). Similar to crop estimation methods of Cai and Sharma [15] who used district level statistical data to linearly extrapolate yield for water productivity, the accuracy is bounded by a satisfactory range as census data is governed by accepted state and national standards [15,48].
2.7. Methods for Calculating Crop Water Productivity (CWP)
CWP (kg/m3) is the ratio of Crop Productivity (CP; kg/m2) divided by Crop Water Use (CWU; m3/m2) (Equation (5)) or total crop yield (kg) divided by total CWU (m3) for a given area representing the volume of water used to produce a certain amount of crop [49]. Prior to calculating CWP, CWU was calculated for each crop type based on ETa (mm/d), and CP was estimated from agricultural reports [48]. From this, an average CWP was calculated for almonds, cotton, winter wheat, pistachios, grapes, barley, rice, corn, and walnuts by dividing each respective CP by CWU. The estimated 2016 growing season in the study area for almonds, pistachios, and walnuts was considered year-round with cotton, wheat, grapes, barley, rice, and corn estimated to be 185, 122, 246, 122, 185, 185 days respectively.
2.8. Methods for Estimating Crop Water Savings or Yield Increase by Increasing CWP
Changes in CWP can be used to determine potential crop water savings or yield increases. For a hypothetical demonstration, the value of CWP (kg/m3) per crop was increased by 10, 20, and 30%. First, crop yield (kg) was determined by multiplying total CWU (m3) by CWP per crop. To estimate the amount of water (m3) that could be saved by increasing CWP and maintaining yield, the original total crop yield was divided by the CWP value increased at 10, 20, and 30% to provide new total CWU (m3) estimates at each respective CWP increase. These modified total CWU estimates were then subtracted from the original total CWU to provide the amount of water that can be saved (m3) by increasing CWP. Next, to determine potential yield increase while maintaining total CWU (m3), CWP increased at 10, 20, and 30% was multiplied by the original total CWU (m3) per crop. From this, the original total crop yield may be subtracted from the increased yield calculated at each respective CWP increase to provide the amount of yield gained by increasing CWP.
There are three main ways to increase CWP: reduce applied water use while maintaining crop yields, increase crop yield while maintaining CWU, or a combination of decreasing CWU and increasing crop yield. While CWP analysis can elucidate water savings potential and provide an incentive to increase CWP, a detailed methodology on how to do so is beyond the scope of our objectives. For broad-scale CWP solutions, a combination of biological water-saving measures with engineering solutions and agronomic and soil manipulation may be most successful [50]. Existing agricultural tactics that can be implemented at the farm to national scale include precision agriculture, drip irrigation, organic soil remedies, buffer strips and wetland restoration, new crop varieties that reduce needs for water and fertilizer, perennial grains and tree-cropping systems, paying farmers for environmental services, soil management practices, and proper plant nutrition [49,51,52,53,54,55,56,57,58].
3. Results
3.1. Crop Type Areas
Results from the nine crops analyzed comprised 38.24% of the 1135.93 km2 area (Table 2).
3.2. Actual Evapotranspiration (ETa) Results
ETa calculated in this study ranged considerably with rice at the highest ETa (4.39 mm/d) and pistachios at the lowest (1.45 mm/d) (Table 3). Corn, cotton, and almonds had higher ETa at 4.23, 3.50, and 3.32 mm/d respectively. Barley, winter wheat, and walnuts had lower ETa at 1.89, 1.82, 1.76 mm/d respectively. Grapes had moderate ETa at 2.68 mm/d. Given the CDL based crop area [28] and total CWU (m3) per crop derived in this study, a ratio of CWU per area also determined to asses CWU (Table 3). CWU (m3/m2) also ranged considerably with almonds representing the highest at 1.21 m3/m2 and winter wheat the lowest at 0.25 m3/m2. Rice, grapes, and cotton were also higher water consumers per area with values of 0.91, 0.90, and 0.72 m3/m2 respectively. Corn had a moderate CWU per area at 0.70 m3/m2. On the lower end were walnuts, pistachios, and barley at 0.64, 0.53, and 0.27 m3/m2 respectively.
3.2.1. Comparison of Actual Evapotranspiration (ETa)
ETa calculated in this study were compared with scientific publications documenting ETa for the same crops. This resulted in 29 different ETa values from 21 sources (Table 4). Some sources included either more than one year of study and location or provided ETa for more than one crop type. Although uncertainties exist in comparing ETa from various locations and different years, this provides a baseline benchmark for comparison.
3.2.2. ETa from This Study in Comparison to OpenET
Actual Evapotranspiration (ETa) values calculated in this study, referred to here as Foley ETa (for naming purposes to note comparison) were compared to OpenET [47] (Figure 5). OpenET is a remote sensing-based evapotranspiration product that provides an ensemble monthly evapotranspiration approximating consumptive water use based on satellite data (including Landsat, Sentinel-2, GOES, and others), weather station networks and models, and field boundary and crop type datasets [47]. The OpenET ensemble product integrated from the GEE catalog used in this study is derived from well-established Surface Energy Balance (SEB) ETa models including ALEXI/DisALEXI [79,80], geeSEBAL [81,82], METRIC [83,84,85], PT-JPL [86], SSEBop [43,44], and SIMS [87,88]. This ensemble product is comparable to Foley ETa as it also utilized grass surface reference ETo from CIMIS data [47].
To compare Foley ETa (mm/d) from this study to OpenET, the total monthly OpenET value (mm) was disaggregated by dividing by the number of days in the month. For example, the total monthly value for June 2016 was divided by 30 (days) to provide a daily mm/d value. Then in GEE, 500 randomly selected points within the study area were utilized to acquire a per-pixel ETa value from OpenET and Foley ETa for each crop type. Outliers (5.27% of sample) were removed using Cook’s Distance analysis [89] and linear regression analysis was done on the remaining points in R programming language for statistical computing [90]. With all crops pooled for June 2016 the R2 value was 0.89 (Figure 5). This coefficient of determination relationship demonstrates a strong statistical correlation with ETa calculated in this study.
3.3. Crop Water Productivity Results
An average CWP was determined and mapped for almonds, cotton, winter wheat, pistachios, grapes, barley, rice, corn, and walnuts for the 2016 growing season (Table 5, Figure 6). Winter wheat resulted in the highest CWP at 2.07 kg/m3 whereas almonds had the lowest at 0.21 kg/m3. Corn, barley, and grapes had higher CWP of 1.66, 1.48, and 1.27 kg/m3 respectively. Pistachios, walnuts, and cotton had lower CWP of 0.79, 0.76, and 0.26 kg/m3 respectively. These values provide insight into how much water a crop used to produce a certain amount of yield in a given area. A higher CWP value indicates the crop is using less water to produce more yield relative to lower CWP. For example, not taking into account other factors such as nutritional content, winter wheat has a ten-fold higher CWP than almonds, suggesting it takes significantly more water to produce the same biomass of yield of almonds versus winter wheat.
A literature review of CWP documenting the reference, location, and year of measurement was compared to CWP in this study in Table 6. Twenty-six sources providing CWP were reviewed resulting in 44 CWP values as some sources listed multiple years of study, locations, and/or crops. This provided at least two different published CWP values per crop for comparison.
3.4. Crop Water Savings and Yield Increase Results
Increasing CWP calculations show that modest increases in CWP can result in drastic decreases of water use with substantial potential for water savings or significant yield increases (Table 7). For example, almonds with a CWP of 0.21 kg/m3 were estimated to consume approximately 192 million m3 of water; increasing CWP by 10, 20, and 30% would result in CWP of 0.23, 0.25, and 0.27 kg/m3 respectively. With holding yield constant, this in turn results in decreasing total CWU to approximately 175, 160, and 148 million m3 while providing potential water savings of approximately 17, 32, and 44 million m3 respectively. Or alternatively by holding total CWU constant and increasing CWP, this demonstrates that yield increases considerably with increasing CWP (Table 7). For instance, almonds with an estimated total yield of 40.52 million kg, had a predicted increased yield increase of 4.05, 8.1, and 12.16 million kg at respective CWP increases of 10, 20, and 30%.
To put water savings potential into a perspective that can be more readily visualized a comparison to a known body of water is effective. With a CWP increase of 10% in almonds, an estimated 6980 Olympic swimming pools (2500 m3) or 685 Lincoln Memorial Reflecting Ponds in Washington, DC, USA (25,500 m3) worth of water could be saved. Furthermore, CWP can be used to estimate water footprint, a measure of human water consumption in volume of water per unit of product [112,113,114,115,116]. Based on our assessment of this particular study area and time frame with an estimated almond yield of 40,520,371 kg using 191,968,502 m3 of water and with one almond kernel weighing 1.2 g [117,118], given the many uncertainties present it can be generally estimated that approximately 5.7 L of water were consumed to produce one almond. This type of analysis can provide insight into making more informed water management decisions.
4. Discussion
This innovative suite of methodologies to determine ETa at 30 m resolution with Landsat images for individual crops at field to regional scales has the potential to expand to other agricultural areas and time frames. The methods here demonstrated that ETf can be determined per crop type utilizing our approach for hot and cold pixel selection from thermal image bands. Furthermore, this method of deriving ETo using meteorological data in conjunction with GIS interpolation analysis can be applied to other regions. In the absence of site-specific crop yield measurements, we show how yield can be estimated from extrapolating agricultural reports scaled to a designated area. These aspects have shown that various datasets can be combined to provide more insight on CWP.
The economics of water use in crop production provide insight on predicting and interpreting water allocation procedures that can guide users toward socially desirable outcomes [113]. California was the top agricultural commodity producing state in the USA, generating over $46 billion while exporting approximately 26% of its agricultural production in 2016 [48]. Therefore, the value a crop can generate is of great concern in assessing water management decisions. This provides further incentive for CWP study where the known market value a crop is sold for in a given year can be ascertained. This is especially apparent when limited local water is used to grow crops for export as California is the USA’s sole exporter for numerous agricultural commodities, exporting 99% or more of several crops including almonds [48].
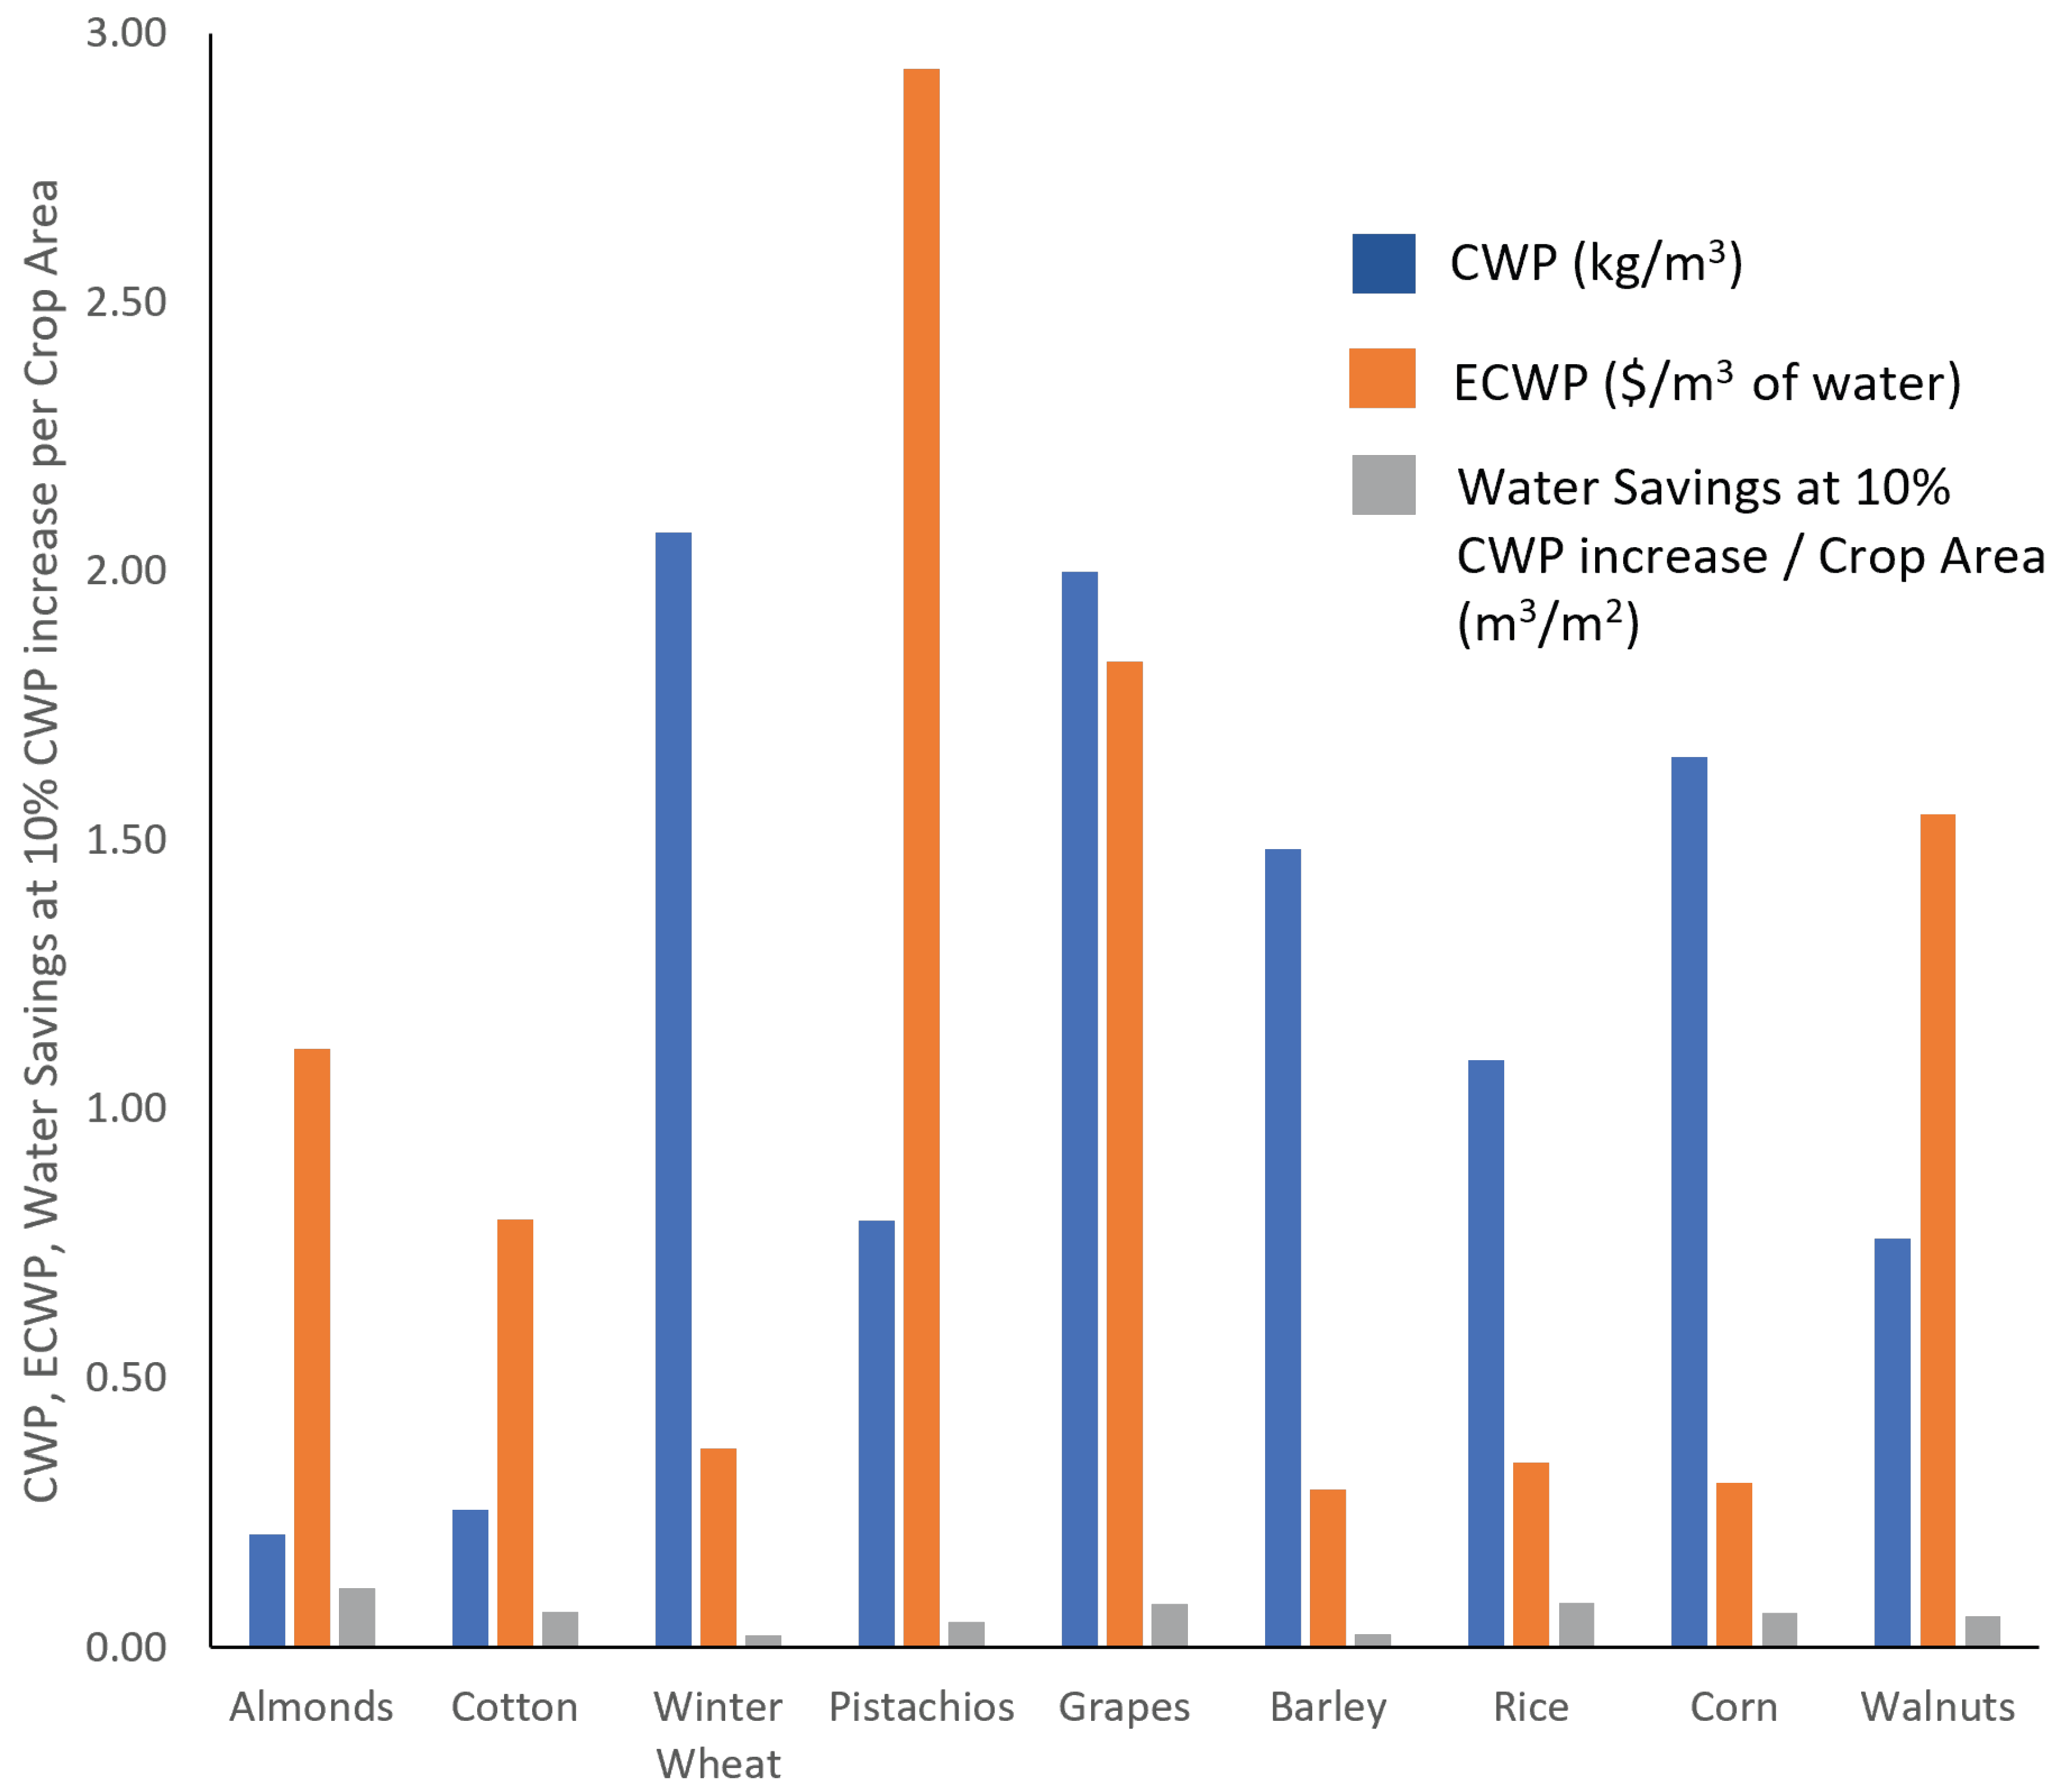
Economic Crop Water Productivity (ECWP) is the ratio of a monetary value ($) of crop output divided by the amount of water input (m3) providing a measure of net economic benefits per unit of water ($/m3) consumed [114,115]. ECWP was calculated based on the 2016 price of a crop sold by weight ($/kg) in California for almonds, winter wheat, pistachios, grapes, barley, rice, corn, and walnuts from CDFA agricultural reports [116]. For cotton, the dollar value was derived from the average 2013 and 2014 market price per yield utilized to estimate 2016 value for ECWP calculations in absence of 2016 CDFA cotton values [116]. To estimate ECWP ($/m3), the statewide value of crop per kilogram ($/kg) was multiplied by CWP (kg/m3) determined for the study area. This ratio essentially demonstrates how much money is generated from a yield of crop produced from a m3 unit of water consumed. Of crops analyzed in this study, the orchard nut crops and grapes were estimated to be highest with pistachios at 2.93 ($/m3) whereas barley was the lowest at 0.29 ($/m3) (Table 8). This indicates from an economic standpoint not considering other factors such as associated growing time and cost of production, it can be inferred that more money per m3 of water used is generated from sales of pistachios than barley at point of sale by over ten-fold. Results of CWP, ECWP, and a ratio of water savings potential at 10% CWP increase divided by crop area (m3/m2) is displayed in Figure 7. This figure illustrates tree nut orchard crops tend to have low CWP yet high ECWP and relatively high potential for water savings per area (m3/m2) compared to row crops.
Up-to-date monitoring and feedback systems to assess CWP may support safeguarding the production of crops. Advances in satellite remote sensing imagery and data capture make it possible to chart crop progress in real-time. Information generated from remote sensing can be utilized for agriculture in a variety of ways to assess water use and to optimize crop yields. This benchmark study site in the CVC has provided a test of concept to expand to larger areas including state, national, and international extents. It may be possible to automate this suite of methodologies with cloud computing for rapid assessment of CWP in other areas and time frames. This could help assess how crops use water to produce food and identify opportunities to manage water. We acknowledge that many CWP uncertainties exist in estimating remote sensing-based ETa, CWU, and crop yield including many variables such as crop characteristics, soil properties, irrigation system efficiency, and management practices. However, this study has provided a base methodology for more refined calibration and automation.
5. Conclusions
We present a suite of methodologies to measure Actual Evapotranspiration (ETa; mm/d) to determine Crop Water Use (CWU; m3/m2), Crop Productivity (CP; kg2/m2), and Crop Water Productivity (CWP; kg/m3) or “crop per drop” for commonly-grown and water-intensive irrigated crops utilizing cloud computing. As cropping patterns change over time and different crops consume varying amounts of water, analyzing CWP by crop type over growing seasons on a yearly basis may help inform crop growing and water management decision making. With a finite irrigation water supply and crops affected by market prices, CWP and Economic Crop Water Productivity (ECWP) may allow for making more informed water optimization strategies. This study proposed and implemented comprehensive approaches to CWU and CWP assessments, modeling, and mapping using 30 m resolution Landsat data with potential for greater time-series assessments. Significant findings from this study indicate that agricultural CWP (kg/m3) was significantly higher for annual food crops such as winter wheat (2.07), corn (1.66), barley (1.48), and rice (1.09) when compared with orchard crops like pistachios (0.79), walnuts (0.76), and almonds (0.21). Grapes (1.27) had intermediate CWP with cotton lower at (0.26). However, ECWP ($/m3) was highest for the plantation or cash crops like pistachios (2.93), walnuts (1.55), grapes (1.16), almonds (1.11), and cotton (0.79) relative to annual crops like winter wheat (0.37), rice (0.34), corn (0.31), and barley (0.29). This study estimated the potential water savings at 10%, 20%, and 30% increase in CWP for each crop. In the 434 million m2 cropland area, a 10% increase in CWP across all nine crops was estimated to result in water savings of 31.5 million m3 or 31.5 billion liters of water. An increase of CWP obtainable by various agricultural and irrigation improvements is widely considered the best approach to saving maximum quantities of water.
Establishing a viable methodology for CWP and ETa measurement over large spatial and temporal extents may help to reduce uncertainties in CWU and CWP calculations. Our methods were used to determine ETa comparable to OpenET and CWP for nine globally dominant crops in irrigated croplands within the Central Valley of California. Such calculations are especially useful to track the role crop types play in overall water use in drought prone regions. Moreover, these methods can be expanded to model numerous crops at regional, national, and global scales for various years where remote sensing images, meteorological data, and crop yield information are available. Such CWP models may help implement better water management strategies and make substantial contributions in addressing food and water security in the 21st century.
Author Contributions
Conceptualization, D.F., P.T. (Prasad Thenkabail) and P.T. (Pardhasaradhi Teluguntla); methodology, D.F., P.T. (Prasad Thenkabail) and A.O.; validation, P.T. (Prasad Thenkabail) and P.T. (Pardhasaradhi Teluguntla); formal analysis, D.F. and I.A.; data curation, D.F. and I.A.; writing—original draft preparation, D.F.; writing—review and editing, D.F., P.T. (Prasad Thenkabail) and I.A.; visualization, D.F. and I.A.; supervision, P.T. (Prasad Thenkabail). All authors have read and agreed to the published version of the manuscript.
Funding
This research was funded by the National Land Imaging (NLI) Program, Land Change Science (LCS) program, and the Core Science Systems (CSS) of the United States Geological Survey (USGS).
Data Availability Statement
Data used in this study are available online through the ScienceBase Catalog. Additional data to accompany this manuscript for remote sensing and cloud computing methods to calculate Actual Evapotranspiration and Crop Water Productivity of select crops in the Central Valley of California will be made available at: https://doi.org/10.5066/P9OICUG4; https://www.sciencebase.gov/catalog/item/62b37d68d34e8f4977cb7839. This is part of the U.S. Geological Survey Information Product Data System (IPDS) data release IP-142281.
Acknowledgments
This research was supported by the National Land Imaging (NLI) Program, Land Change Science (LCS) program, and the Core Science Systems (CSS) of the United States Geological Survey (USGS). The research was conducted in the science facilities of the USGS Western Geographic Science Center (WGSC). Any use of trade, firm, or product names is for descriptive purposes only and does not imply endorsement by the U.S. Government.
Conflicts of Interest
The authors declare no conflict of interest.
References
- Kahil, T.; Albiac, J.; Fischer, G.; Strokal, M.; Tramberend, S.; Greve, P.; Tang, T.; Burek, P.; Burtscher, R.; Wada, Y. A nexus modeling framework for assessing water scarcity solutions. Curr. Opin. Environ. Sustain. 2019, 40, 72–80. [Google Scholar] [CrossRef]
- FAO. The Future of Food and Agriculture—Trends and Challenges; Annual Report, 296; FAO: Rome, Italy, 2017. [Google Scholar]
- Mekonnen, M.; Hoekstra, A. Water footprint benchmarks for crop production: A first global assessment. Ecol. Indic. 2014, 46, 214–223. [Google Scholar] [CrossRef]
- Wada, Y.; Flörke, M.; Hanasaki, N.; Eisner, S.; Fischer, G.; Tramberend, S.; Satoh, Y.; Van Vliet, M.; Yillia, P.; Ringler, C.; et al. Modeling global water use for the 21st century: The Water Futures and Solutions (WFaS) initiative and its approaches. Geosci. Model Dev. 2016, 9, 175–222. [Google Scholar] [CrossRef]
- FAO. Water for Sustainable Food and Agriculture. In A Report Produced for the G20 Presidency of Germany Food and Agriculture Organization of the United Nations Rome; FAO: Rome, Italy, 2017. [Google Scholar]
- UN. World Population Prospects. United Nations, Department of Economic and Social Affairs, Population Division; Highlights; ST/ESA/SER.A/423; UN: New York, NY, USA, 2019. [Google Scholar]
- Pison, G. World population: 8 billion today, how many tomorrow? Popul. Soc. 2022, 604, 1–4. [Google Scholar]
- Wong, A.; Jin, Y.; Medellín-Azuara, J.; Paw U, K.; Kent, E.; Clay, J.; Gao, F.; Fisher, J.; Rivera, G.; Lee, C.; et al. Multiscale assessment of agricultural consumptive water use in California’s Central Valley. Water Resour. Res. 2021, 57, e2020WR028876. [Google Scholar] [CrossRef]
- Schauer, M.; Senay, G. Characterizing crop water use dynamics in the Central Valley of California using Landsat-derived evapotranspiration. Remote Sens. 2019, 11, 1782. [Google Scholar] [CrossRef]
- Senay, G.; Schauer, M.; Friedrichs, M.; Velpuri, N.; Singh, R. Satellite-based water use dynamics using historical Landsat data (1984–2014) in the southwestern United States. Remote Sens. Environ. 2017, 202, 98–112. [Google Scholar] [CrossRef]
- He, R.; Jin, Y.; Kandelous, M.; Zaccaria, D.; Sanden, B.; Snyder, R.; Jiang, J.; Hopmans, J. Evapotranspiration estimate over an almond orchard using Landsat satellite observations. Remote Sens. 2017, 9, 436. [Google Scholar] [CrossRef]
- Semmens, K.; Anderson, M.; Kustas, W.; Gao, F.; Alfieri, J.; McKee, L.; Prueger, J.; Hain, C.; Cammalleri, C.; Yang, Y.; et al. Monitoring daily evapotranspiration over two California vineyards using Landsat 8 in a multi-sensor data fusion approach. Remote Sens. Environ. 2016, 185, 155–170. [Google Scholar] [CrossRef]
- Teixeira, A.; Victoria, D.; Andrade, R.; Leivas, J.; Bolfe, E.; Cruz, C. Coupling MODIS images and agrometeorological data for agricultural water productivity analyses in the Mato Grosso state, Brazil. Remote Sens. Agric. Ecosyst. Hydrol. XVI 2014, 9239, 278–291. [Google Scholar]
- Teixeira, A.; Scherer-Warren, M.; Hernandez, F.; Andrade, R.; Leivas, J. Large-scale water productivity assessments with MODIS images in a changing semi-arid environment: A Brazilian case study. Remote Sens. 2013, 5, 5783–5804. [Google Scholar] [CrossRef]
- Cai, X.; Sharma, B. Integrating remote sensing, census and weather data for an assessment of rice yield, water consumption and water productivity in the Indo-Gangetic river basin. Agric. Water Manag. 2010, 97, 309–316. [Google Scholar] [CrossRef]
- Mekonnen, M.; Hoekstra, A. Four billion people facing severe water scarcity. Sci. Adv. 2016, 2, e1500323. [Google Scholar] [CrossRef] [PubMed]
- Velasco-Muñoz, J.; Aznar-Sánchez, J.; Belmonte-Ureña, L.; Román-Sánchez, I. Sustainable water use in agriculture: A review of worldwide research. Sustainability 2018, 10, 1084. [Google Scholar] [CrossRef]
- Thenkabail, P. Global croplands and their importance for water and food security in the twenty-first century: Towards an ever green revolution that combines a second green revolution with a blue revolution. Remote Sens. 2010, 2, 2305–2312. [Google Scholar] [CrossRef]
- Wilson, T.; Sleeter, B.; Cameron, D. Future land-use related water demand in California. Environ. Res. Lett. 2016, 11, 054018. [Google Scholar] [CrossRef]
- CFDA. California Agricultural Production Statistics 2021 Crop Year. In: California Agricultural Production. 2021. Available online: https://www.cdfa.ca.gov/statistics/ (accessed on 13 January 2023).
- CIMIS. CIMIS Station Reports. 2022. Available online: https://wwwcimis.water.ca.gov/ (accessed on 28 June 2022).
- Chen, H.; Luo, Y.; Potter, C.; Moran, P.; Grieneisen, M.; Zhang, M. Modeling pesticide diuron loading from the San Joaquin watershed into the Sacramento-San Joaquin Delta using SWAT. Water Res. 2017, 121, 374–385. [Google Scholar] [CrossRef]
- Xue, J.; Huo, Z.; Kisekka, I. Assessing impacts of climate variability and changing cropping patterns on regional evapotranspiration, yield and water productivity in California’s San Joaquin watershed. Agric. Water Manag. 2021, 250, 106852. [Google Scholar] [CrossRef]
- Wilson, T.; Matchett, E.; Byrd, K.; Conlisk, E.; Reiter, M.; Wallace, C.; Flint, L.; Flint, A.; Joyce, B.; Moritsch, M. Climate and land change impacts on future managed wetland habitat: A case study from California’s Central Valley. Landsc. Ecol. 2022, 37, 861–881. [Google Scholar] [CrossRef]
- Cohen-Vogel, D.; Osgood, D.; Parker, D.; Zilberman, D. The California Irrigation Management Information System (CIMIS): Intended and unanticipated impacts of public investment. Choices 1998, 13, 1–4. [Google Scholar]
- Allen, R.; Pruitt, W.; Wright, J.; Howell, T.; Ventura, F.; Snyder, R.; Itenfisu, D.; Steduto, P.; Berengena, J.; Yrisarry, J.; et al. A recommendation on standardized surface resistance for hourly calculation of reference ETo by the FAO56 Penman-Monteith method. Agric. Water Manag. 2006, 81, 1–22. [Google Scholar] [CrossRef]
- Snyder, R.; Pedras, C.; Montazar, A.; Henry, J.; Ackley, D. Advances in ET-based landscape irrigation management. Agric. Water Manag. 2015, 147, 187–197. [Google Scholar] [CrossRef]
- USDA National Agricultural Statistics Service Cropland Data Layer. Published Crop-Specific Data Layer. 2022. Available online: https://data.nal.usda.gov/dataset/cropscape-cropland-data-layer (accessed on 8 July 2022).
- Boryan, C.; Yang, Z.; Mueller, R.; Craig, M. Monitoring US agriculture: The US Department of Agriculture, National Agricultural Statistics Service, Cropland Data Layer program. Geocarto Int. 2011, 26, 341–358. [Google Scholar] [CrossRef]
- Lark, T.; Schelly, I.; Gibbs, H. Accuracy, bias, and improvements in mapping crops and cropland across the United States using the USDA Cropland Data Layer. Remote Sens. 2021, 13, 968. [Google Scholar] [CrossRef]
- Lark, T.; Mueller, R.; Johnson, D.; Gibbs, H. Measuring land-use and land-cover change using the US Department of Agriculture’s Cropland Data Layer: Cautions and recommendations. Int. J. Appl. Earth Obs. Geoinf. 2017, 62, 224–235. [Google Scholar]
- Byerlee, D.; De Janvry, A.; Sadoulet, E.; Townsend, R.; Klytchnikova, I. World Development Report 2008: Agriculture for Development; World Bank: Washington, DC, USA, 2007. [Google Scholar]
- United States Geological Survey. Landsat 8. 2022. Available online: https://www.usgs.gov/landsat-missions/landsat-8 (accessed on 8 July 2022).
- Ullrich, P.; Xu, Z.; Rhoades, A.; Dettinger, M.; Mount, J.; Jones, A.; Vahmani, P. California’s drought of the future: A midcentury recreation of the exceptional conditions of 2012–2017. Earth’s Future 2018, 6, 1568–1587. [Google Scholar] [CrossRef]
- Kern, J.D.; Su, Y.; Hill, J. A retrospective study of the 2012–2016 California drought and its impacts on the power sector. Environ. Res. Lett. 2020, 15, 094008. [Google Scholar] [CrossRef]
- Lund, J.; Medellin-Azuara, J.; Durand, J.; Stone, K. Lessons from California’s 2012–2016 drought. J. Water Resour. Plan. Manag. 2018, 144, 04018067. [Google Scholar] [CrossRef]
- Funk, C.; Peterson, P.; Landsfeld, M.; Pedreros, D.; Verdin, J.; Shukla, S.; Husak, G.; Rowland, J.; Harrison, L.; Hoell, A.; et al. The climate hazards infrared precipitation with stations—a new environmental record for monitoring extremes. Sci. Data 2015, 2, 1–21. [Google Scholar] [CrossRef]
- Shrestha, R.; Di, L.; Eugene, G.; Kang, L.; Shao, Y.; Bai, Y. Regression model to estimate flood impact on corn yield using MODIS NDVI and USDA Cropland Data Layer. J. Integr. Agric. 2017, 16, 398–407. [Google Scholar] [CrossRef]
- Zhao, Z.; Wang, H.; Wang, C.; Li, W.; Chen, H.; Deng, C. Changes in reference evapotranspiration over Northwest China from 1957 to 2018: Variation characteristics, cause analysis and relationships with atmospheric circulation. Agric. Water Manag. 2020, 231, 105958. [Google Scholar] [CrossRef]
- Allen, R.; Pereira, L.; Raes, D.; Smith, M. Crop Evapotranspiration-Guidelines for Computing Crop Water Requirements-FAO Irrigation and Drainage Paper 56; FAO: Rome, Italy, 1998; Volume 300, p. D05109. [Google Scholar]
- Nichols, W.; Cuenca, R. Evaluation of the evaporative fraction for parameterization of the surface energy balance. Water Resour. Res. 1993, 29, 3681–3690. [Google Scholar] [CrossRef]
- Senay, G.; Budde, M.; Verdin, J.; Melesse, A. A coupled remote sensing and simplified surface energy balance approach to estimate actual evapotranspiration from irrigated fields. Sensors 2007, 7, 979–1000. [Google Scholar] [CrossRef]
- Senay, G.B.; Bohms, S.; Singh, R.K.; Gowda, P.H.; Velpuri, N.M.; Alemu, H.; Verdin, J.P. Operational evapotranspiration mapping using remote sensing and weather datasets: A new parameterization for the SSEB approach. JAWRA J. Am. Water Resour. Assoc. 2013, 49, 577–591. [Google Scholar] [CrossRef]
- Senay, G.B. Satellite psychrometric formulation of the Operational Simplified Surface Energy Balance (SSEBop) model for quantifying and mapping evapotranspiration. Appl. Eng. Agric. 2018, 34, 555–566. [Google Scholar] [CrossRef]
- Senay, G.B.; Friedrichs, M.; Morton, C.; Parrish, G.E.; Schauer, M.; Khand, K.; Kagone, S.; Boiko, O.; Huntington, J. Mapping actual evapotranspiration using Landsat for the conterminous United States: Google Earth Engine implementation and assessment of the SSEBop model. Remote Sens. Environ. 2022, 275, 113011. [Google Scholar] [CrossRef]
- Senay, G.B.; Parrish, G.E.; Schauer, M.; Friedrichs, M.; Khand, K.; Boiko, O.; Kagone, S.; Dittmeier, R.; Arab, S.; Ji, L. Improving the Operational Simplified Surface Energy Balance Evapotranspiration Model Using the Forcing and Normalizing Operation. Remote Sens. 2023, 15, 260. [Google Scholar] [CrossRef]
- Melton, F.S.; Huntington, J.; Grimm, R.; Herring, J.; Hall, M.; Rollison, D.; Erickson, T.; Allen, R.; Anderson, M.; Fisher, J.B.; et al. OpenET: Filling a critical data gap in water management for the western United States. JAWRA J. Am. Water Resour. Assoc. 2022, 58, 971–994. [Google Scholar] [CrossRef]
- CFDA. California Agricultural Statistics Review 2016–2017; California Department of Food and Agriculture: Sacremento, CA, USA, 2017.
- Foley, D.; Thenkabail, P.; Aneece, I.; Teluguntla, P.; Oliphant, A. A meta-analysis of global crop water productivity of three leading world crops (wheat, corn, and rice) in the irrigated areas over three decades. Int. J. Digit. Earth 2019, 13, 939–975. [Google Scholar] [CrossRef]
- Ali, M.; Talukder, M. Increasing water productivity in crop production—A synthesis. Agric. Water Manag. 2008, 95, 1201–1213. [Google Scholar] [CrossRef]
- Foley, J.A.; Ramankutty, N.; Brauman, K.A.; Cassidy, E.S.; Gerber, J.S.; Johnston, M.; Mueller, N.D.; O’Connell, C.; Ray, D.K.; West, P.C.; et al. Solutions for a cultivated planet. Nature 2011, 478, 337–342. [Google Scholar] [CrossRef] [PubMed]
- Kijne, J.; Tuong, T.; Bennett, J.; Bouman, B.; Oweis, T. Ensuring food security via improvement in crop water productivity. Chall. Program Water Food Backgr. Pap. 2003, 1, 20–26. [Google Scholar]
- Bouman, B. A conceptual framework for the improvement of crop water productivity at different spatial scales. Agric. Syst. 2007, 93, 43–60. [Google Scholar] [CrossRef]
- Molden, D.; Oweis, T.Y.; Pasquale, S.; Kijne, J.W.; Hanjra, M.A.; Bindraban, P.S.; Bouman, B.A.; Mahoo, H.F.; Silva, P.; Upadhyaya, A. Pathways for increasing agricultural water productivity. In A Comprehensive Assessment of Water Management in Agriculture; Earthscan: London, UK, 2007. [Google Scholar]
- Brauman, K.A.; Siebert, S.; Foley, J.A. Improvements in crop water productivity increase water sustainability and food security—A global analysis. Environ. Res. Lett. 2013, 8, 024030. [Google Scholar] [CrossRef]
- Kang, S.; Hao, X.; Du, T.; Tong, L.; Su, X.; Lu, H.; Li, X.; Huo, Z.; Li, S.; Ding, R. Improving agricultural water productivity to ensure food security in China under changing environment: From research to practice. Agric. Water Manag. 2017, 179, 5–17. [Google Scholar] [CrossRef]
- Faramarzi, M.; Yang, H.; Schulin, R.; Abbaspour, K.C. Modeling wheat yield and crop water productivity in Iran: Implications of agricultural water management for wheat production. Agric. Water Manag. 2010, 97, 1861–1875. [Google Scholar] [CrossRef]
- Waraich, E.A.; Ahmad, R.; Ashraf, M.Y.; Saifullah; Ahmad, M. Improving agricultural water use efficiency by nutrient management in crop plants. Acta Agric. Scand. Sect. B-Soil Plant Sci. 2011, 61, 291–304. [Google Scholar] [CrossRef]
- Xue, J.; Huo, Z.; Wang, S.; Wang, C.; White, I.; Kisekka, I.; Sheng, Z.; Huang, G.; Xu, X. A novel regional irrigation water productivity model coupling irrigation-and drainage-driven soil hydrology and salinity dynamics and shallow groundwater movement in arid regions in China. Hydrol. Earth Syst. Sci. 2020, 24, 2399–2418. [Google Scholar] [CrossRef]
- Bellvert, J.; Adeline, K.; Baram, S.; Pierce, L.; Sanden, B.; Smart, D. Monitoring crop evapotranspiration and crop coefficients over an almond and pistachio orchard throughout remote sensing. Remote Sens. 2018, 10, 2001. [Google Scholar] [CrossRef]
- Stevens, R.; Ewenz, C.; Grigson, G.; Conner, S. Water use by an irrigated almond orchard. Irrig. Sci. 2012, 30, 189–200. [Google Scholar] [CrossRef]
- French, A.; Hunsaker, D.; Thorp, K. Remote sensing of evapotranspiration over cotton using the TSEB and METRIC energy balance models. Remote Sens. Environ. 2015, 158, 281–294. [Google Scholar] [CrossRef]
- Liu, C.; Zhang, X.; Zhang, Y. Determination of daily evaporation and evapotranspiration of winter wheat and maize by large-scale weighing lysimeter and micro-lysimeter. Agric. For. Meteorol. 2002, 111, 109–120. [Google Scholar] [CrossRef]
- Goldhamer, D.; Kjelgren, R.; Williams, L.; Beede, R. Water use requirements of pistachio trees and response to water stress. In Proceedings of the National Conference on Advances in Evapotranspiration, American Society of Agricultural Engineers, Chicago, IL, USA, 16–17 December 1985. [Google Scholar]
- Marino, G.; Zaccaria, D.; Snyder, R.; Lagos, O.; Lampinen, B.; Ferguson, L.; Grattan, S.; Little, C.; Shapiro, K.; Maskey, M.; et al. Actual evapotranspiration and tree performance of mature micro-irrigated pistachio orchards grown on saline-sodic soils in the San Joaquin Valley of California. Agriculture 2019, 9, 76. [Google Scholar] [CrossRef]
- Teixeira, A.; Bastiaanssen, W.; Bassoi, L. Crop water parameters of irrigated wine and table grapes to support water productivity analysis in the São Francisco river basin, Brazil. Agric. Water Manag. 2007, 94, 31–42. [Google Scholar] [CrossRef]
- Phogat, V.; Skewes, M.; McCarthy, M.; Cox, J.; Šimůnek, J.; Petrie, P. Evaluation of crop coefficients, water productivity, and water balance components for wine grapes irrigated at different deficit levels by a sub-surface drip. Agric. Water Manag. 2017, 180, 22–34. [Google Scholar] [CrossRef]
- Araya, A.; Stroosnijder, L.; Girmay, G.; Keesstra, S. Crop coefficient, yield response to water stress and water productivity of teff (Eragrostis tef (Zucc.). Agric. Water Manag. 2011, 98, 775–783. [Google Scholar] [CrossRef]
- Nagaz, K.; Toumi, I.; Masmoudi, M.; Mechilia, N. Soil salinity and barley production under full and deficit irrigation with saline water in Arid conditions of Southern Tunisia. Res. J. Agron 2008, 2, 90–95. [Google Scholar]
- Pohankova, E.; Hlavinka, P.; Orsag, M.; Takac, J.; Kersebaum, K.; Gobin, A.; Trnka, M. Estimating the water use efficiency of spring barley using crop models. J. Agric. Sci. 2018, 156, 628–644. [Google Scholar] [CrossRef]
- Alberto, M.; Wassmann, R.; Hirano, T.; Miyata, A.; Hatano, R.; Kumar, A.; Padre, A.; Amante, M. Comparisons of energy balance and evapotranspiration between flooded and aerobic rice fields in the Philippines. Agric. Water Manag. 2011, 98, 1417–1430. [Google Scholar] [CrossRef]
- Tyagi, N.; Sharma, D.; Luthra, S. Determination of evapotranspiration and crop coefficients of rice and sunflower with lysimeter. Agric. Water Manag. 2000, 45, 41–54. [Google Scholar] [CrossRef]
- Linquist, B.; Snyder, R.; Anderson, F.; Espino, L.; Inglese, G.; Marras, S.; Moratiel, R.; Mutters, R.; Nicolosi, P.; Rejmanek, H.; et al. Water balances and evapotranspiration in water-and dry-seeded rice systems. Irrig. Sci. 2015, 33, 375–385. [Google Scholar] [CrossRef]
- Hossen, M.; Mano, M.; Miyata, A.; Baten, M.; Hiyama, T. Surface energy partitioning and evapotranspiration over a double-cropping paddy field in Bangladesh. Hydrol. Process. 2012, 26, 1311–1320. [Google Scholar] [CrossRef]
- Kang, S.; Gu, B.; Du, T.; Zhang, J. Crop coefficient and ratio of transpiration to evapotranspiration of winter wheat and maize in a semi-humid region. Agric. Water Manag. 2003, 59, 239–254. [Google Scholar] [CrossRef]
- Trout, T.; DeJonge, K. Crop water use and crop coefficients of maize in the great plains. J. Irrig. Drain. Eng. 2018, 144, 04018009. [Google Scholar] [CrossRef]
- Fulton, A.; Little, C.; Snyder, R.; Lampinen, B.; Buchner, R. Evaluation of crop coefficients and evapotranspiration in English walnut. In Proceedings of the 2017 ASABE Annual International Meeting, American Society of Agricultural and Biological Engineers, Spokane, WA, USA, 16–19 July 2017; p. 1. [Google Scholar]
- Irrigation Management in Walnut Using Evapotranspiration, Soil and Plant Based Data; Report to the California Walnut Board; Walnut Research Report; California Walnut Board: Folsom, CA, USA, 2004; pp. 113–136.
- Anderson, M.; Norman, J.; Mecikalski, J.; Otkin, J.; Kustas, W. A climatological study of evapotranspiration and moisture stress across the continental United States based on thermal remote sensing: 1. Model formulation. J. Geophys. Res. Atmos. 2007, 112. [Google Scholar] [CrossRef]
- Anderson, M.; Gao, F.; Knipper, K.; Hain, C.; Dulaney, W.; Baldocchi, D.; Eichelmann, E.; Hemes, K.; Yang, Y.; Medellin-Azuara, J.; et al. Field-scale assessment of land and water use change over the California Delta using remote sensing. Remote Sens. 2018, 10, 889. [Google Scholar] [CrossRef]
- Bastiaanssen, W.; Menenti, M.; Feddes, R.; Holtslag, A. A remote sensing surface energy balance algorithm for land (SEBAL). 1. Formulation. J. Hydrol. 1998, 212, 198–212. [Google Scholar] [CrossRef]
- Laipelt, L.; Kayser, R.H.B.; Fleischmann, A.S.; Ruhoff, A.; Bastiaanssen, W.; Erickson, T.A.; Melton, F. Long-term monitoring of evapotranspiration using the SEBAL algorithm and Google Earth Engine cloud computing. ISPRS J. Photogramm. Remote Sens. 2021, 178, 81–96. [Google Scholar] [CrossRef]
- Allen, R.; Tasumi, M.; Morse, A.; Trezza, R. A Landsat-based energy balance and evapotranspiration model in Western US water rights regulation and planning. Irrig. Drain. Syst. 2005, 19, 251–268. [Google Scholar] [CrossRef]
- Allen, R.G.; Tasumi, M.; Trezza, R. Satellite-based energy balance for mapping evapotranspiration with internalized calibration (METRIC)—Model. J. Irrig. Drain. Eng. 2007, 133, 380–394. [Google Scholar] [CrossRef]
- Allen, R.; Irmak, A.; Trezza, R.; Hendrickx, J.M.; Bastiaanssen, W.; Kjaersgaard, J. Satellite-based ET estimation in agriculture using SEBAL and METRIC. Hydrol. Process. 2011, 25, 4011–4027. [Google Scholar] [CrossRef]
- Fisher, J.B.; Tu, K.P.; Baldocchi, D.D. Global estimates of the land–atmosphere water flux based on monthly AVHRR and ISLSCP-II data, validated at 16 FLUXNET sites. Remote Sens. Environ. 2008, 112, 901–919. [Google Scholar] [CrossRef]
- Melton, F.S.; Johnson, L.F.; Lund, C.P.; Pierce, L.L.; Michaelis, A.R.; Hiatt, S.H.; Guzman, A.; Adhikari, D.D.; Purdy, A.J.; Rosevelt, C.; et al. Satellite irrigation management support with the terrestrial observation and prediction system: A framework for integration of satellite and surface observations to support improvements in agricultural water resource management. IEEE J. Sel. Top. Appl. Earth Obs. Remote Sens. 2012, 5, 1709–1721. [Google Scholar] [CrossRef]
- Pereira, L.; Paredes, P.; Melton, F.; Johnson, L.; Wang, T.; López-Urrea, R.; Cancela, J.; Allen, R. Prediction of crop coefficients from fraction of ground cover and height. Background and validation using ground and remote sensing data. Agric. Water Manag. 2020, 241, 106197. [Google Scholar] [CrossRef]
- Cook, R.D. Detection of influential observation in linear regression. Technometrics 1977, 19, 15–18. [Google Scholar]
- R Core Team. R: A Language and Environment for Statistical Computing; R Foundation for Statistical Computing: Vienna, Austria, 2021. [Google Scholar]
- Goldhamer, D.; Fereres, E. Establishing an almond water production function for California using long-term yield response to variable irrigation. Irrig. Sci. 2017, 35, 169–179. [Google Scholar] [CrossRef]
- Egea, G.; Nortes, P.; González-Real, M.; Baille, A.; Domingo, R. Agronomic response and water productivity of almond trees under contrasted deficit irrigation regimes. Agric. Water Manag. 2010, 97, 171–181. [Google Scholar] [CrossRef]
- Tejero, I.; Moriana, A.; Pleguezuelo, C.; Zuazo, V.; Egea, G. Sustainable deficit-irrigation management in almonds (Prunus dulcis L.): Different strategies to assess the crop water status. In Water Scarcity and Sustainable Agriculture in Semiarid Environment; Scientia Horticulturae: Sevilla, Spain, 2018; pp. 271–298. [Google Scholar]
- Zwart, S.; Bastiaanssen, W. Review of measured crop water productivity values for irrigated wheat, rice, cotton and maize. Agric. Water Manag. 2004, 69, 115–133. [Google Scholar] [CrossRef]
- Biradar, C.; Thenkabail, P.; Platonov, A.; Xiao, X.; Geerken, R.; Noojipady, P.; Turral, H.; Vithanage, J. Water productivity mapping methods using remote sensing. Appl. Remote. Sens. 2008, 2, 023544. [Google Scholar]
- Cai, X.; Thenkabail, P.S.; Biradar, C.M.; Platonov, A.; Gumma, M.; Dheeravath, V.; Cohen, Y.; Goldshleger, N.; Ben-Dor, E.; Alchanatis, V.; et al. Water productivity mapping using remote sensing data of various resolutions to support more crop per drop. J. Appl. Remote Sens. 2009, 3, 033557. [Google Scholar]
- Platonov, A.; Thenkabail, P.S.; Biradar, C.M.; Cai, X.; Gumma, M.; Dheeravath, V.; Cohen, Y.; Alchanatis, V.; Goldshlager, N.; Ben-Dor, E.; et al. Water productivity mapping (WPM) using Landsat ETM+ data for the irrigated croplands of the Syrdarya River basin in Central Asia. Sensors 2008, 8, 8156–8180. [Google Scholar] [CrossRef] [PubMed]
- Singh, R.; van Dam, J.C.; Feddes, R.A. Water productivity analysis of irrigated crops in Sirsa district, India. Agric. Water Manag. 2006, 82, 253–278. [Google Scholar] [CrossRef]
- Kumari, M.; Singh, O.; Meena, D.C. Crop water requirement, water productivity and comparative advantage of crop production in different regions of Uttar Pradesh, India. Int. J. Curr. Microbiol. Appl. Sci. 2017, 6, 2043–2052. [Google Scholar] [CrossRef]
- Bastiaanssen, W.; Steduto, P. The water productivity score (WPS) at global and regional level: Methodology and first results from remote sensing measurements of wheat, rice and maize. Sci. Total Environ. 2017, 575, 595–611. [Google Scholar] [CrossRef] [PubMed]
- Fritsch, S.; Wylie, P. Finding More Yield and Profit from Your Farming System; Australian Government, Grains Research and Development Corporation: Hornsby, NSW, Australia, 2015; Available online: https://grdc.com.au/resources-and-publications/grdc-update-papers/tab-content/grdc-update-papers/2015/02/finding-more-yield-and-profit-from-your-farming-system (accessed on 13 January 2021).
- Cossani, C.; Slafer, G.; Savin, R. Nitrogen and water use efficiencies of wheat and barley under a Mediterranean environment in Catalonia. Field Crop. Res. 2012, 128, 109–118. [Google Scholar] [CrossRef]
- Sadras, V.; Angus, J. Benchmarking water-use efficiency of rainfed wheat in dry environments. Aust. J. Agric. Res. 2006, 57, 847–856. [Google Scholar] [CrossRef]
- Katerji, N.; Van Hoorn, J.; Fares, C.; Hamdy, A.; Mastrorilli, M.; Oweis, T. Salinity effect on grain quality of two durum wheat varieties differing in salt tolerance. Agric. Water Manag. 2005, 75, 85–91. [Google Scholar] [CrossRef]
- Teixeira, A.; Bassoi, L. Crop water productivity in semi-arid regions: From field to large scales. Ann. Arid. Zone 2009, 48, 1–13. [Google Scholar]
- Er-Raki, S.; Ezzahar, J.; Merlin, O.; Amazirh, A.; Hssaine, B.; Kharrou, M.; Khabba, S.; Chehbouni, A. Performance of the HYDRUS-1D model for water balance components assessment of irrigated winter wheat under different water managements in semi-arid region of Morocco. Agric. Water Manag. 2021, 244, 106546. [Google Scholar] [CrossRef]
- Katerji, N.; Mastrorilli, M.; Rana, G. Water use efficiency of crops cultivated in the Mediterranean region: Review and analysis. Eur. J. Agron. 2008, 28, 493–507. [Google Scholar] [CrossRef]
- Cantero-Martınez, C.; Angas, P.; Lampurlanés, J. Growth, yield and water productivity of barley (Hordeum vulgare L.) affected by tillage and N fertilization in Mediterranean semiarid, rainfed conditions of Spain. Field Crop. Res. 2003, 84, 341–357. [Google Scholar] [CrossRef]
- Siddique, K.; Tennant, D.; Perry, M.; Belford, R. Water use and water use efficiency of old and modern wheat cultivars in a Mediterranean-type environment. Aust. J. Agric. Res. 1990, 41, 431–447. [Google Scholar] [CrossRef]
- Nouna, B.; Katerji, N.; Mastrorilli, M. Using the CERES-Maize model in a semi-arid Mediterranean environment. Eval. Model Perform. Eur. J. Agron. 2000, 13, 309–322. [Google Scholar]
- Zhang, Y.; Kendy, E.; Qiang, Y.; Changming, L.; Yanjun, S.; Hongyong, S. Effect of soil water deficit on evapotranspiration, crop yield, and water use efficiency in the North China Plain. Agric. Water Manag. 2004, 64, 107–122. [Google Scholar] [CrossRef]
- Mekonnen, M.; Hoekstra, A. The green, blue and grey water footprint of crops and derived crop products. Hydrol. Earth Syst. Sci. 2011, 15, 1577–1600. [Google Scholar] [CrossRef]
- Hellegers, P. The role of economics in irrigation water management. Int. Comm. Irrig. Drain. 2006, 55, 157–163. [Google Scholar] [CrossRef]
- Molden, D. Accounting for Water Use and Productivity; IWMI: Colombo, Sri Lanka, 1997. [Google Scholar] [CrossRef]
- Hellegers, P.J.; Soppe, R.; Perry, C.; Bastiaanssen, W. Combining remote sensing and economic analysis to support decisions that affect water productivity. Irrig. Sci. 2009, 27, 243–251. [Google Scholar] [CrossRef]
- CFDA. California Agricultural Statistics Review 2017–2018. State of California; California Department of Food and Agriculture: Sacramento, CA, USA, 2018.
- Fulton, J.; Norton, M.; Shilling, F. Water-indexed benefits and impacts of California almonds. Ecol. Indic. 2019, 96, 711–717. [Google Scholar] [CrossRef]
- United States Department of Agriculture. USDA National Nutrient Database for Standard Reference; Nutrient Data Laboratory: Beltsville, MD, USA, 2016; Volume 28.
Figure 1.
Select crop type Cropland Data Layer (CDL) map. Study area map displaying almonds, cotton, winter wheat, pistachios, grapes, barley, rice, corn, and walnuts within the Central Valley of California centered around Firebaugh, California for 2016. Data inset map displays Fresno County highlighted.
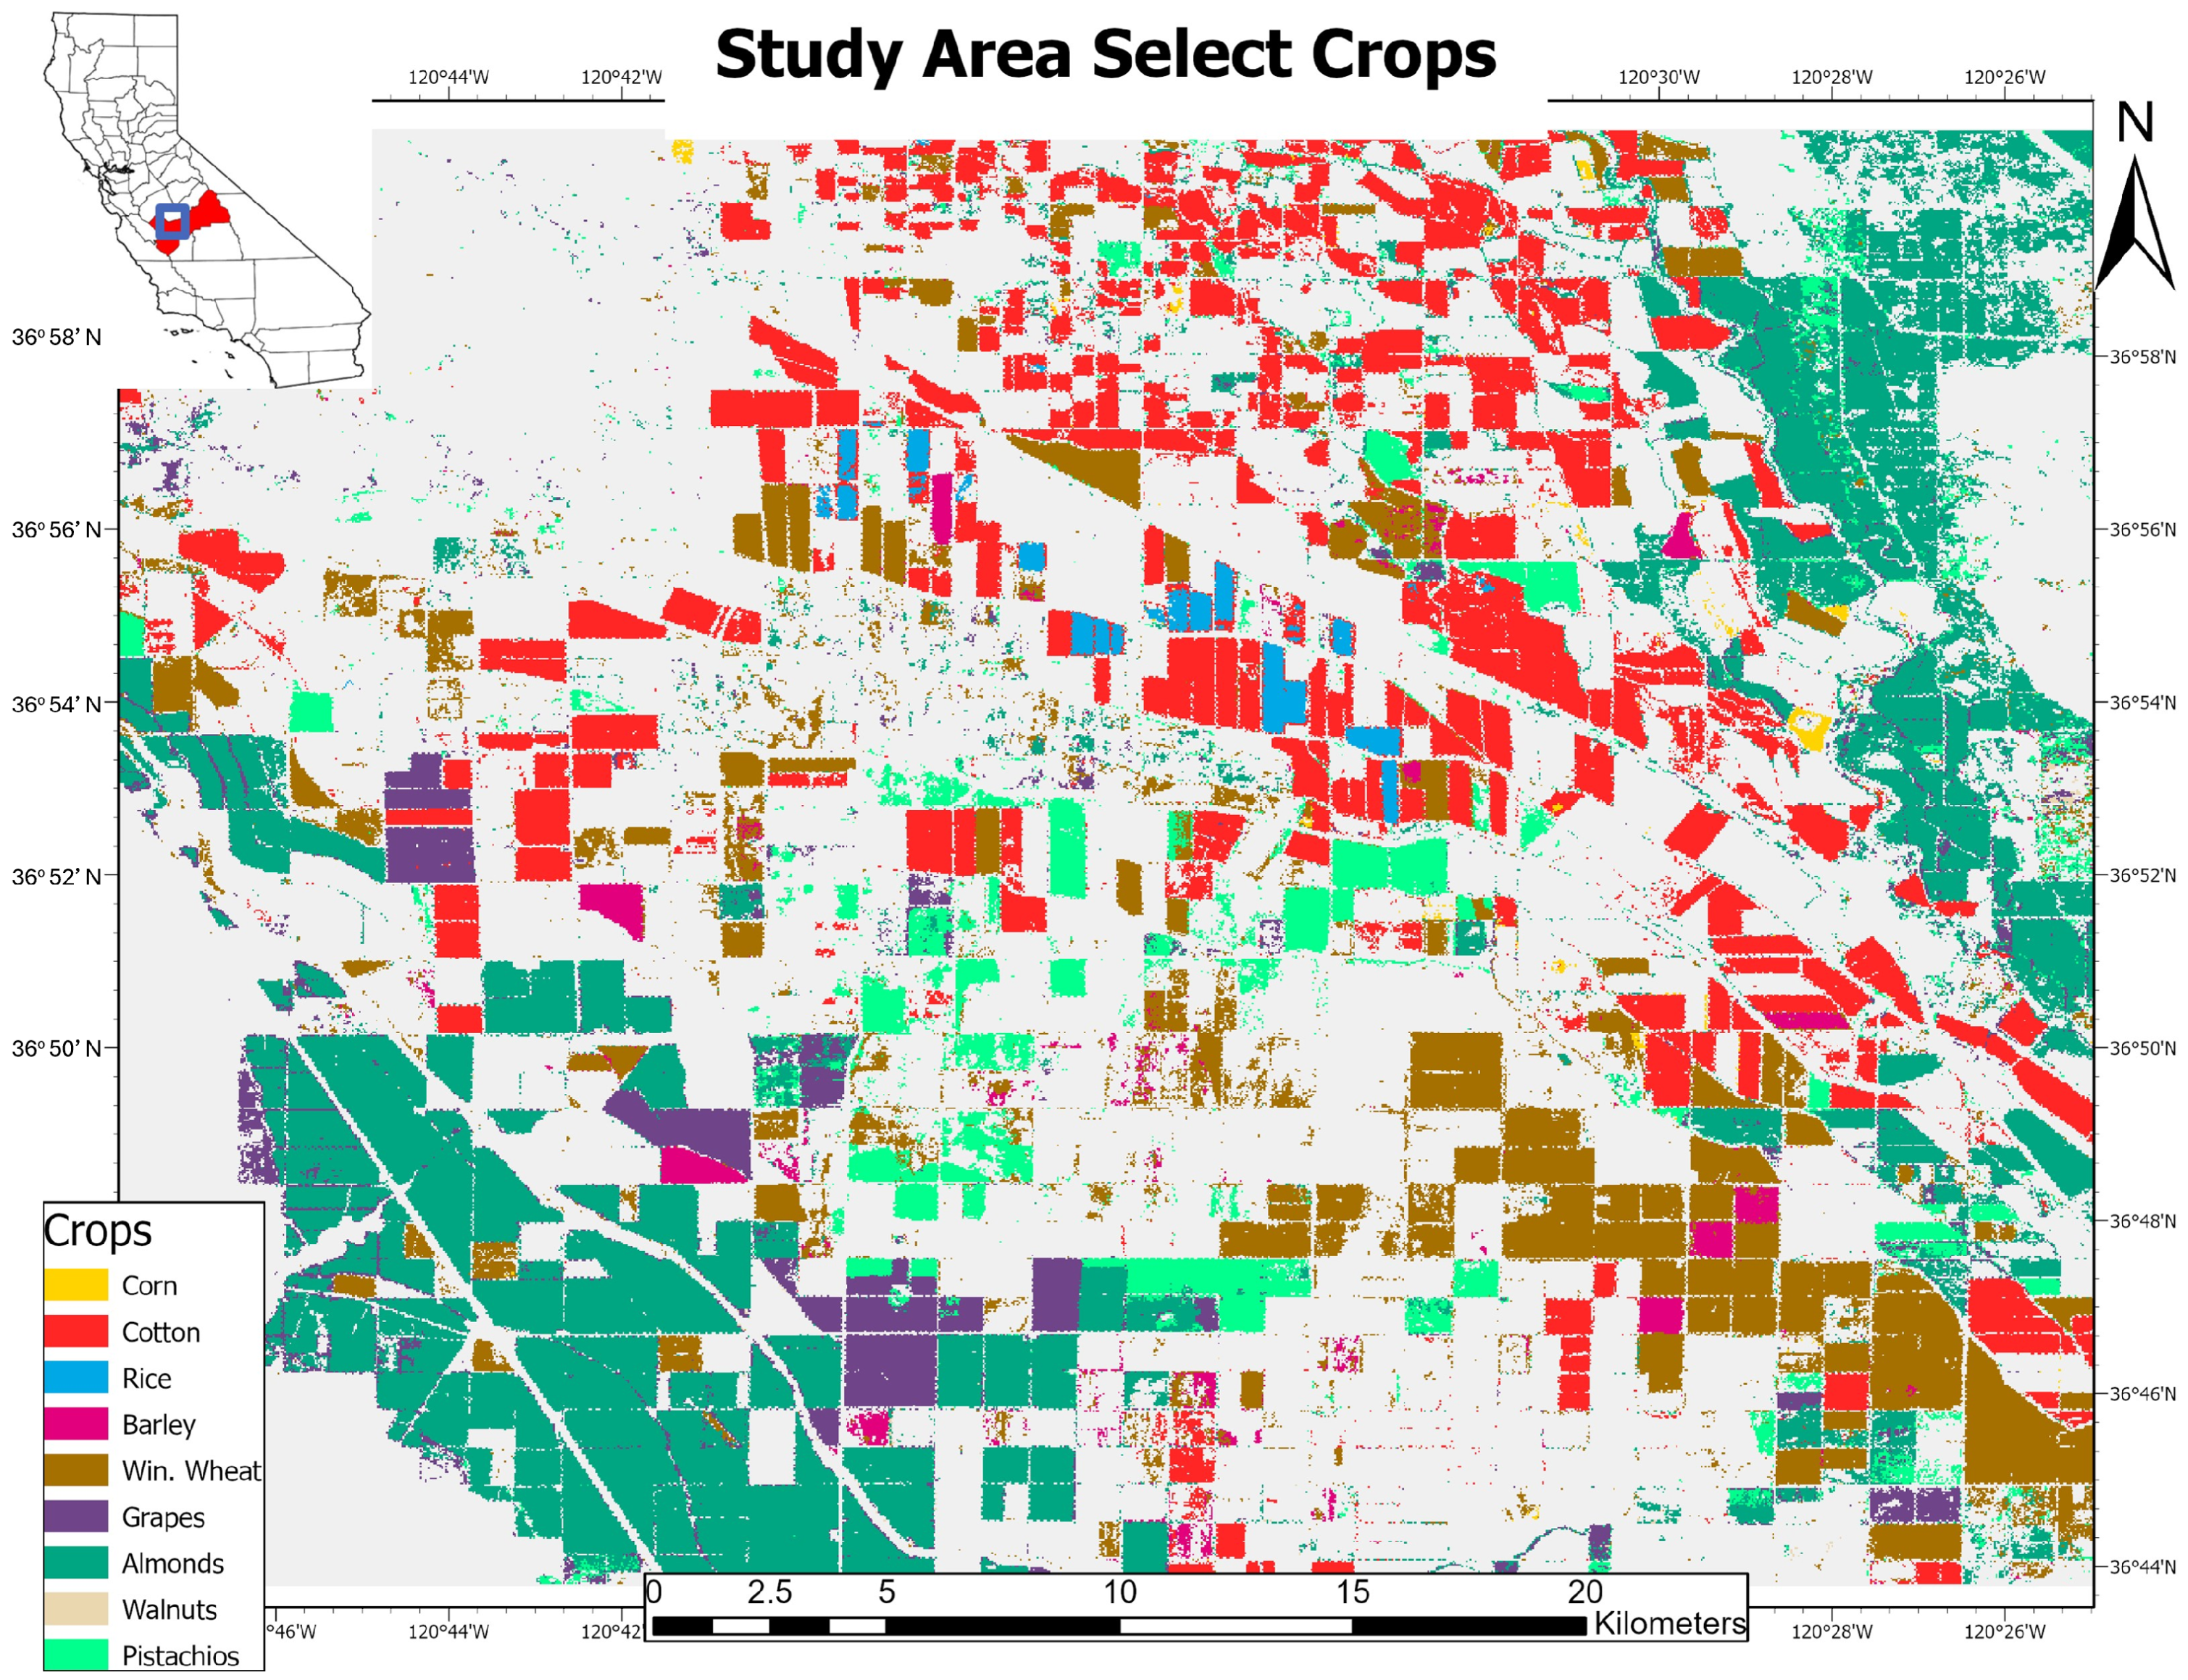
Figure 2.
Crop Water Productivity (CWP) methodology flowchart. Order of operations utilized in this CWP analysis. Crop Yield, Crop Area, and Crop Productivity were based on a single annual value per crop type. ETf, ETo, ETa were derived as daily values throughout the year. ETf and ETa values were calculated per pixel from Landsat 8 images. ETo was acquired from CIMIS data corresponding to Landsat 8 image overpass dates. CWP, CWU, and Economic CWP values were derived from these previous datasets. ETa = Actual Evapotranspiration, ETo = Reference Evapotranspiration, ETf = Evaporative Fraction, CIMIS = California Irrigation Management Information System [21], CDL = Cropland Data Layer [28].
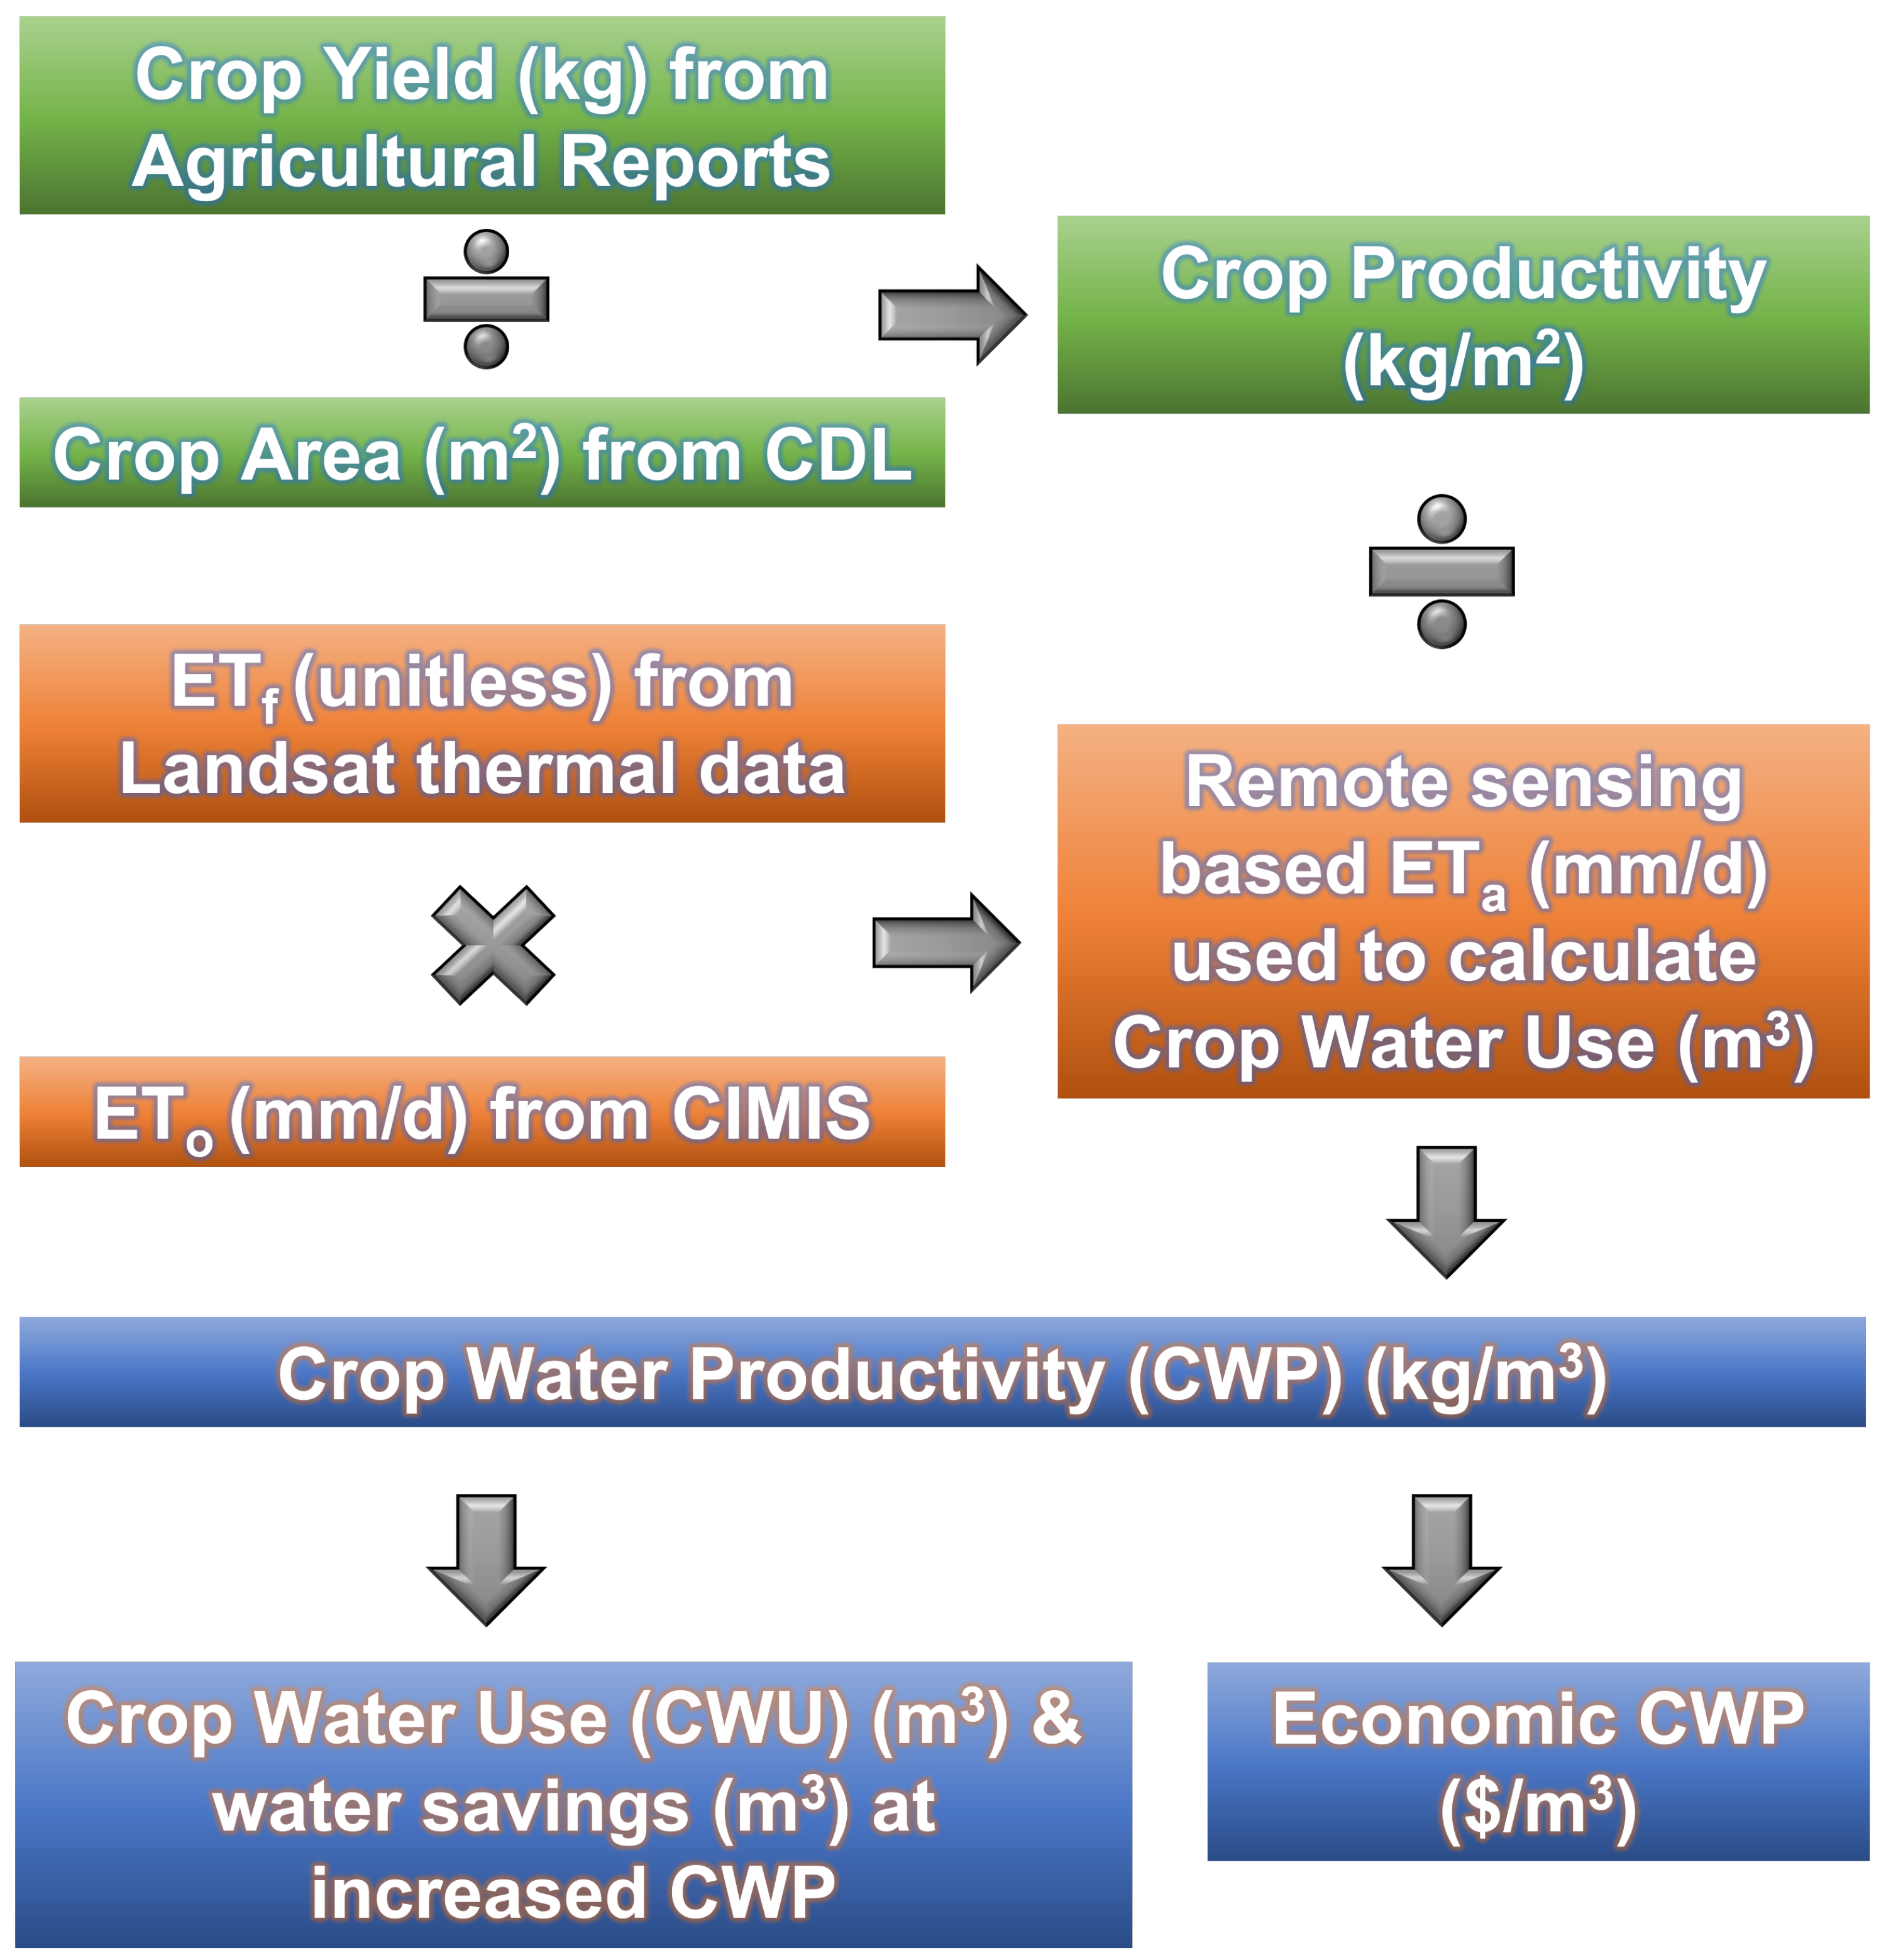
Figure 3.
Actual Evapotranspiration (ETa) map production process. Per pixel ETa (mm/d) maps at 30 m resolution produced from image processing by multiplying Evaporative Fraction (ETf) (unitless) by Reference Evapotranspiration (ETo) (mm/d).
Figure 3.
Actual Evapotranspiration (ETa) map production process. Per pixel ETa (mm/d) maps at 30 m resolution produced from image processing by multiplying Evaporative Fraction (ETf) (unitless) by Reference Evapotranspiration (ETo) (mm/d).
Figure 4.
Actual Evapotranspiration (ETa) study area map. Example of per pixel ETa (mm/d) map from a Landsat 8 image [33] for 7 August 2016. Higher ETa displayed in red and lower ETa in blue at 30 m resolution.
Figure 4.
Actual Evapotranspiration (ETa) study area map. Example of per pixel ETa (mm/d) map from a Landsat 8 image [33] for 7 August 2016. Higher ETa displayed in red and lower ETa in blue at 30 m resolution.

Figure 5.
Comparison of calculated Actual Evapotranspiration (Foley ETa) with OpenET. Calculated ETa from this study referred to as Foley ETa (mm/d) plotted versus OpenET (mm/d) [47] for nine commonly grown and water intensive crops in the Central Valley of California field site for June 2016. Note that monthly OpenET in total mm has been disaggregated to mm/d by dividing by days in the month. The linear regression equation is Foley ETa = 1.04*OpenET + 0.293 with R2 = 0.89.
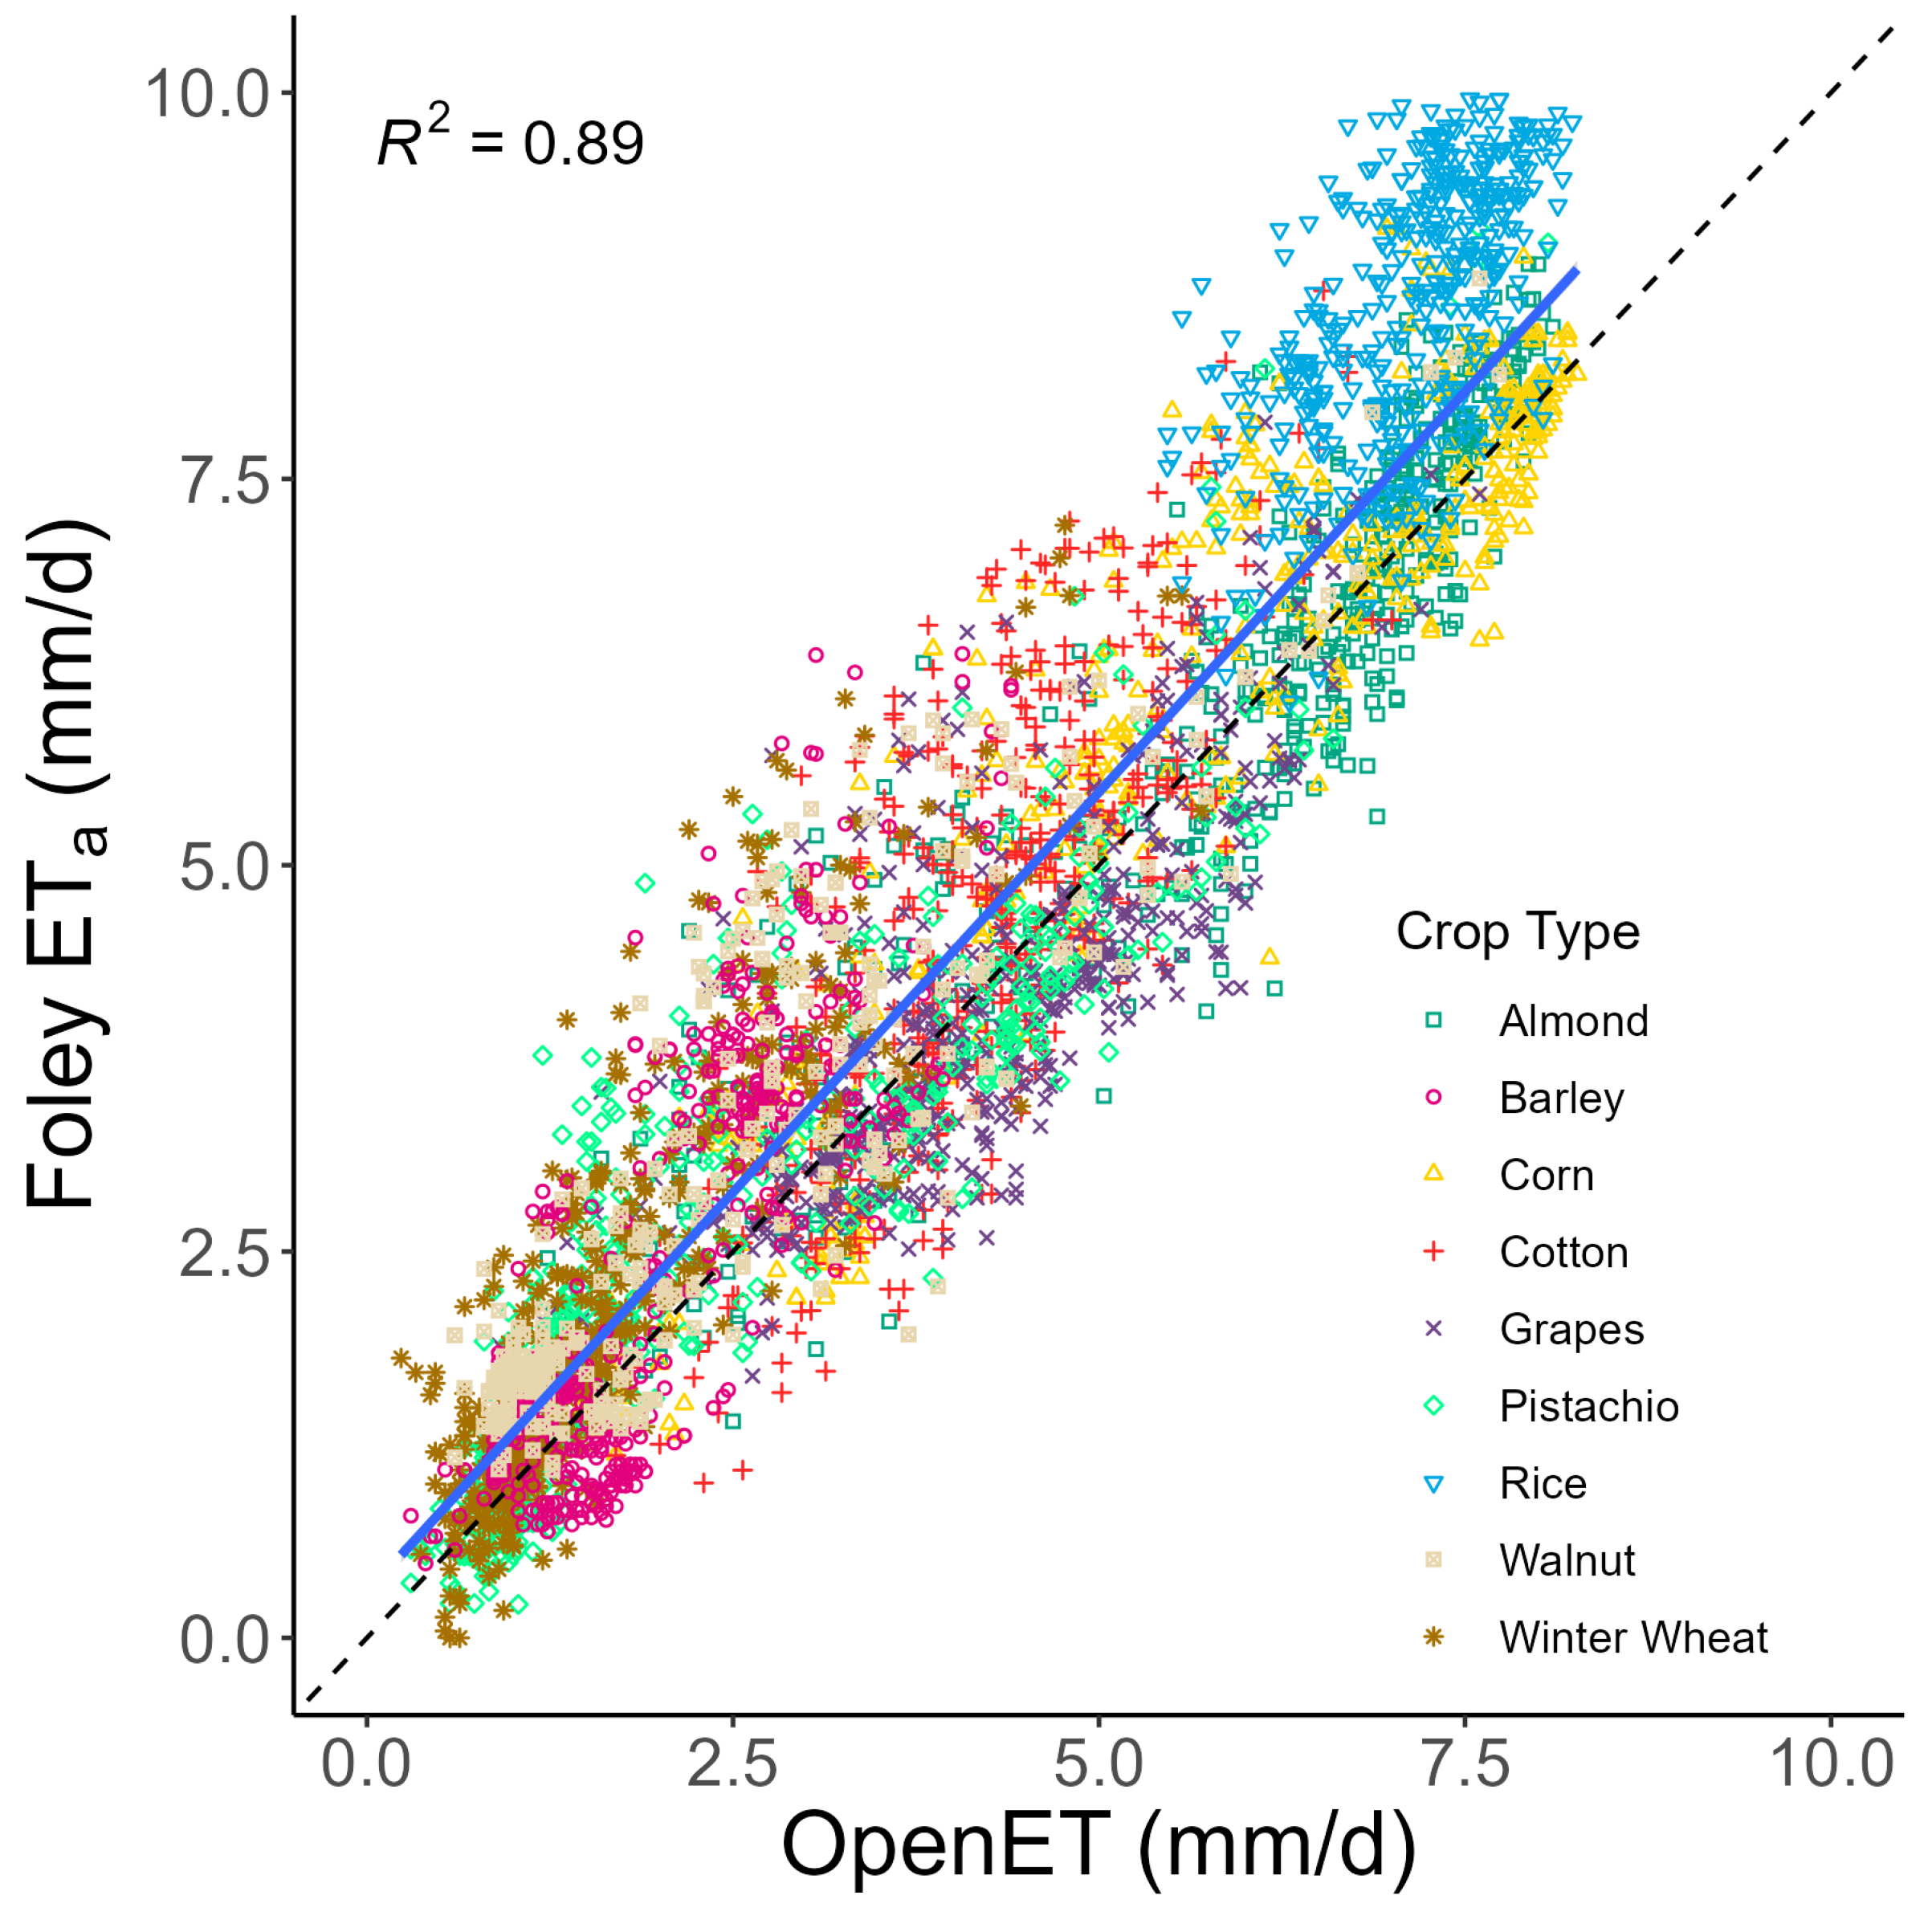
Figure 6.
Crop Water Productivity (CWP) map of the study area. Average CWP (kg/m3) for nine commonly grown and water intensive crops in the Central Valley of California in 2016 by crop type. Higher CWP displayed in red and lower CWP displayed in blue.
Figure 6.
Crop Water Productivity (CWP) map of the study area. Average CWP (kg/m3) for nine commonly grown and water intensive crops in the Central Valley of California in 2016 by crop type. Higher CWP displayed in red and lower CWP displayed in blue.

Figure 7.
Plot of CWP, ECWP, and water savings potential at 10% CWP increase per area. CWP (kg/m3), ECWP ($/m3) [116], and the ratio of water savings potential at 10% CWP increase per crop area (m3/m2) plotted for nine commonly grown and water intensive crops in 2016 in the Central Valley of California study area. CWP = Crop Water Productivity, ECWP = Economic Crop Water Productivity.

Table 1.
Crop Productivity (CP) (kg/m2) data. CP and yield (kg) estimated for nine commonly-grown and water-intensive crops in the Central Valley of California study area. Based on CDFA yield per area data for 2016 [48].
Table 1.
Crop Productivity (CP) (kg/m2) data. CP and yield (kg) estimated for nine commonly-grown and water-intensive crops in the Central Valley of California study area. Based on CDFA yield per area data for 2016 [48].
| Crop Type | Crop Area (m2) | Crop Yield (kg) | Crop Productivity (kg/m2) |
|---|---|---|---|
| Almonds | 158,556,066 | 40,520,371 | 0.26 |
| Cotton | 108,200,973 | 20,132,373 | 0.19 |
| Winter Wheat | 84,959,597 | 44,567,062 | 0.52 |
| Pistachios | 37,588,230 | 15,799,336 | 0.42 |
| Grapes | 29,242,400 | 32,948,449 | 1.13 |
| Barley | 8,538,869 | 3,445,550 | 0.40 |
| Rice | 5,247,748 | 5,201,005 | 0.99 |
| Corn | 1,497,109 | 1,738,476 | 1.16 |
| Walnuts | 509,877 | 249,177 | 0.49 |
Table 2.
Table of crop area. Crop area (m2) and percentage of study area for almonds, cotton, winter wheat, pistachios, grapes, barley, rice, corn, and walnuts [28].
Table 2.
Table of crop area. Crop area (m2) and percentage of study area for almonds, cotton, winter wheat, pistachios, grapes, barley, rice, corn, and walnuts [28].
| Number | Crop | Percent of Study Area (%) | Area (m2) |
|---|---|---|---|
| 1 | Almonds | 13.96 | 158,556,066 |
| 2 | Cotton | 9.53 | 108,200,973 |
| 3 | Winter Wheat | 7.48 | 84,959,597 |
| 4 | Pistachios | 3.31 | 37,588,230 |
| 5 | Grapes | 2.57 | 29,242,400 |
| 6 | Barley | 0.75 | 8,538,869 |
| 7 | Rice | 0.46 | 5,247,748 |
| 8 | Corn | 0.13 | 1,497,109 |
| 9 | Walnuts | 0.04 | 509,877 |
| All select crop | 38.24 | 434,340,869 | |
| All Other | 61.76 | 888,071,759 | |
| Total | 100 | 1,135,931,091 |
Table 3.
Table of Crop Water Use (CWU). Table displaying crop area (m2) [28], averaged daily Actual Evapotranspiration (ETa) (mm/d), total CWU (m3), and CWU per area (m3/m2) by crop type per growing season.
Table 3.
Table of Crop Water Use (CWU). Table displaying crop area (m2) [28], averaged daily Actual Evapotranspiration (ETa) (mm/d), total CWU (m3), and CWU per area (m3/m2) by crop type per growing season.
| Crop Type | Crop Area (m2) | ETa (mm/d) | Total CWU (m3) | CWU per Area (m3/m2) |
|---|---|---|---|---|
| Almonds | 158,556,066 | 3.32 | 191,968,501 | 1.21 |
| Cotton | 108,200,973 | 3.50 | 78,273,341 | 0.72 |
| Winter Wheat | 84,959,597 | 1.82 | 21,512,784 | 0.25 |
| Pistachios | 37,588,230 | 1.45 | 19,945,161 | 0.53 |
| Grapes | 29,242,400 | 2.68 | 26,249,854 | 0.90 |
| Barley | 8,538,869 | 1.89 | 2,322,164 | 0.27 |
| Rice | 5,247,748 | 4.39 | 4,767,264 | 0.91 |
| Corn | 1,497,109 | 4.23 | 1,050,105 | 0.70 |
| Walnuts | 509,877 | 1.76 | 328,008 | 0.64 |
| Total | 434,340,869 | 346,417,181 |
Table 4.
Actual Evapotranspiration (ETa) compared to scientific publications. Comparison of average ETa (mm/d) calculated from this study to a literature review of published sources. References, locations, and available measurement years from each source are listed. Note for USA locations the state is provided.
| Crop Type | This Study | From References | ||||
|---|---|---|---|---|---|---|
| ETa Calculated (mm/d) | ETa Average Reference (mm/d) | ETa References (mm/d) | Location | Year (s) | References | |
| Almonds | 3.32 | 4.06 | 4.01 | California | 2018 | [59] |
| 3.30 | California | 2018 | [59] | |||
| 4.36 | California | 2016 | [60] | |||
| 4.57 | Australia | 2008–2009 | [61] | |||
| Cotton | 3.50 | 4.84 | 4.76 | Arizona | 2009 | [62] |
| 4.91 | Arizona | 2011 | [62] | |||
| Winter wheat | 1.82 | 2.00 | 1.60 | China | 1995–2000 | [63] |
| 2.40 | China | 1987–1997 | [63] | |||
| Pistachios | 1.45 | 4.46 | 3.73 | California | 2016 | [60] |
| 4.43 | California | 1984 | [64] | |||
| 5.23 | California | 2016–2017 | [65] | |||
| Grapes | 2.68 | 3.23 | 3.85 | Brazil | 2002-2003 | [66] |
| 1.32 | Australia | 2010-2012 | [67] | |||
| 4.15 | California | 2013–2014 | [12] | |||
| 3.60 | California | 2013–2014 | [12] | |||
| Barley | 1.89 | 2.49 | 2.48 | Ethiopia | 2010 | [68] |
| 2.25 | Tunisia | 2001–2002 | [69] | |||
| 2.74 | Czech Republic | 2011–2014 | [70] | |||
| Rice | 4.39 | 4.64 | 4.05 | Philippines | 2008–2009 | [71] |
| 5.30 | India | 1994 | [72] | |||
| 6.10 | California | 2007 | [73] | |||
| 3.10 | Bangladesh | 2007 | [74] | |||
| Corn | 4.23 | 4.32 | 5.77 | California | 2018 | [59] |
| 4.49 | California | 2018 | [59] | |||
| 3.15 | China | 1987–1997 | [75] | |||
| 3.87 | Colorado | 2008–2013 | [76] | |||
| Walnuts | 1.76 | 4.65 | 4.89 | California | 1998 | [77] |
| 4.65 | California | 2011–2016 | [77] | |||
| 4.41 | California | 2002 | [78] | |||
Table 5.
Crop Water Productivity (CWP) by crop type. Average CWP (kg/m3) displayed for nine crops within the study area for 2016. Total crop yield, total Crop Water Use (CWU), and CWP is represented for each crops growing season. Total CWU is based on daily average ETa calculated in this study.
Table 5.
Crop Water Productivity (CWP) by crop type. Average CWP (kg/m3) displayed for nine crops within the study area for 2016. Total crop yield, total Crop Water Use (CWU), and CWP is represented for each crops growing season. Total CWU is based on daily average ETa calculated in this study.
| Crop Type | Crop Area | Yield | CWU | CWP | |
|---|---|---|---|---|---|
| (%) | (m2) | (kg) | (m3) | (kg/m3) | |
| Almonds | 13.96 | 158,556,066 | 40,520,371 | 191,968,502 | 0.21 |
| Cotton | 9.53 | 108,200,973 | 20,132,373 | 78,273,341 | 0.26 |
| Winter Wheat | 7.48 | 84,959,597 | 44,567,062 | 21,512,784 | 2.07 |
| Pistachios | 3.31 | 37,588,230 | 15,799,336 | 19,945,161 | 0.79 |
| Grapes | 2.57 | 29,242,400 | 32,948,449 | 26,249,854 | 1.26 |
| Barley | 0.75 | 8,538,869 | 3,445,550 | 2,322,164 | 1.48 |
| Rice | 0.46 | 5,247,748 | 5,201,005 | 4,767,264 | 1.09 |
| Corn | 0.13 | 1,497,109 | 1,738,476 | 1,050,105 | 1.66 |
| Walnuts | 0.04 | 509,877 | 249,177 | 328,008 | 0.76 |
Table 6.
Crop Water Productivity (CWP) compared to scientific publications. CWP (kg/m3) calculated in this study compared to published sources by crop type documenting location, year(s) when available, and reference. Note USA locations list the state where data were acquired.
Table 6.
Crop Water Productivity (CWP) compared to scientific publications. CWP (kg/m3) calculated in this study compared to published sources by crop type documenting location, year(s) when available, and reference. Note USA locations list the state where data were acquired.
| This Study | From References | ||||||
|---|---|---|---|---|---|---|---|
| Crop Type | Crop Area (%) | CWP | CWP Average | CWP | Location | Year (s) | References |
| Almonds | 13.96 | 0.21 | 0.39 | 0.28 | California | 2005–2009 | [91] |
| 0.25 | Spain | 2004–2006 | [92] | ||||
| 0.21 | Spain | 2017 | [93] | ||||
| 0.69 | California | 2001–2009 | [23] | ||||
| 0.53 | California | 2010–2018 | [23] | ||||
| Cotton | 9.53 | 0.26 | 0.36 | 0.24 | Global | 1977–2002 | [94] |
| 0.52 | California | 2001–2009 | [23] | ||||
| 0.62 | California | 2010–2018 | [23] | ||||
| 0.42 | Uzbekistan | 2007 | [95] | ||||
| 0.46 | Uzbekistan | 2007 | [96] | ||||
| 0.28 | Uzbekistan | 2006 | [97] | ||||
| 0.23 | India | 2002 | [98] | ||||
| 0.08 | India | 2014 | [99] | ||||
| Winter Wheat | 7.48 | 2.07 | 1.36 | 1.15 | Global | 1977–2002 | [94] |
| 1.09 | Global | 1979–2016 | [49] | ||||
| 0.98 | Global | 1998–2008 | [100] | ||||
| 1.20 | Australia | 2007–2012 | [101] | ||||
| 1.60 | Spain | 2004–2007 | [102] | ||||
| 2.10 | Mediterranean | [103] | |||||
| 1.40 | Italy | [104] | |||||
| Pistachios | 3.31 | 0.79 | 0.32 | 0.28 | California | 2001–2009 | [23] |
| 0.35 | California | 2010–2018 | [23] | ||||
| Grapes | 2.57 | 1.26 | 3.32 | 1.77 | Brazil | 2002–2003 | [66] |
| 5.92 | Australia | 2010–2012 | [67] | ||||
| 4.48 | California | 2001–2009 | [23] | ||||
| 4.67 | California | 2010–2018 | [23] | ||||
| 2.37 | Brazil | 2005 | [105] | ||||
| 2.44 | Brazil | 2005 | [105] | ||||
| 2.46 | Mexico | 2005 | [106] | ||||
| 2.49 | Mexico | 2006 | [106] | ||||
| Barley | 0.75 | 1.51 | 1.51 | 1.03 | Ethiopia | 2010 | [68] |
| 1.50 | Spain | 2004–2007 | [102] | ||||
| 1.70 | Mediterranean | [107] | |||||
| 1.70 | Mediterranean | [108] | |||||
| 1.60 | Australia | [109] | |||||
| Rice | 0.46 | 1.09 | 0.99 | 1.10 | Global | 1977–2002 | [94] |
| 0.89 | Global | 1979–2016 | [49] | ||||
| 0.98 | Global | 1998–2008 | [100] | ||||
| Corn | 0.13 | 1.86 | 1.86 | 1.90 | Global | 1977–2002 | [94] |
| 1.87 | Global | 1979–2016 | [49] | ||||
| 2.25 | Global | 1998–2008 | [100] | ||||
| 1.60 | Italy | 1996–1997 | [110] | ||||
| 1.70 | China | [111] | |||||
| Walnuts | 0.04 | 0.76 | 0.47 | 0.48 | California | 2001–2009 | [23] |
| 0.45 | California | 2010–2018 | [23] | ||||
Table 7.
Crop water savings potential with CWP increase of 10%, 20%, and 30%. Calculations demonstrate that with a constant yield and increasing CWP, total Crop Water Use (CWU) decreases and water savings increase substantially. Or by holding total CWU constant and increasing CWP, yield increases significantly.
| Crop Type | CWP (kg/m3) | CWU (m3) | Water Savings (m3) | Yield (kg) | |
|---|---|---|---|---|---|
| CWP + 0% | Almonds | 0.21 | 1.92 × 10⁸ | 0 | 4.05 × 10⁷ |
| Cotton | 0.26 | 7.83 × 10⁷ | 0 | 2.01 × 10⁷ | |
| Winter Wheat | 2.07 | 2.15 × 10⁷ | 0 | 4.46 × 10⁷ | |
| Pistachios | 0.79 | 1.99 × 10⁷ | 0 | 1.58 × 10⁷ | |
| Grapes | 1.26 | 2.62 × 10⁷ | 0 | 5.24 × 10⁷ | |
| Barley | 1.48 | 2.32 × 10⁶ | 0 | 3.45 × 10⁶ | |
| Rice | 1.09 | 4.77 × 10⁶ | 0 | 5.20 × 10⁶ | |
| Corn | 1.66 | 1.05 × 10⁶ | 0 | 1.74 × 10⁶ | |
| Walnuts | 0.76 | 3.28 × 10⁵ | 0 | 2.49 × 10⁵ | |
| CWP + 10% | Almonds | 0.23 | 1.75 × 10⁸ | 1.75 × 10⁷ | 4.46 × 10⁷ |
| Cotton | 0.28 | 7.12 × 10⁷ | 7.12 × 10⁶ | 2.21 × 10⁷ | |
| Winter Wheat | 2.28 | 1.96 × 10⁷ | 1.96 × 10⁶ | 4.90 × 10⁷ | |
| Pistachios | 0.87 | 1.81 × 10⁷ | 1.81 × 10⁶ | 1.74 × 10⁷ | |
| Grapes | 1.40 | 2.39 × 10⁷ | 2.39 × 10⁶ | 5.77 × 10⁷ | |
| Barley | 1.63 | 2.11 × 10⁶ | 2.11 × 10⁵ | 3.79 × 10⁶ | |
| Rice | 1.20 | 4.33 × 10⁶ | 4.33 × 10⁵ | 5.72 × 10⁶ | |
| Corn | 1.82 | 9.55 × 10⁵ | 9.55 × 10⁴ | 1.91 × 10⁶ | |
| Walnuts | 0.84 | 2.98 × 10⁵ | 2.98 × 10⁴ | 2.74 × 10⁵ | |
| CWP + 20% | Almonds | 0.25 | 1.60 × 10⁸ | 3.20 × 10⁷ | 4.86 × 10⁷ |
| Cotton | 0.31 | 6.52 × 10⁷ | 1.30 × 10⁷ | 2.42 × 10⁷ | |
| Winter Wheat | 2.49 | 1.79 × 10⁷ | 3.59 × 10⁶ | 5.35 × 10⁷ | |
| Pistachios | 0.95 | 1.66 × 10⁷ | 3.32 × 10⁶ | 1.90 × 10⁷ | |
| Grapes | 1.52 | 2.19 × 10⁷ | 4.37 × 10⁶ | 6.29 × 10⁷ | |
| Barley | 1.78 | 1.94 × 10⁶ | 3.87 × 10⁵ | 4.13 × 10⁶ | |
| Rice | 1.31 | 3.97 × 10⁶ | 7.95 × 10⁵ | 6.24 × 10⁶ | |
| Corn | 1.99 | 8.75 × 10⁵ | 1.75 × 10⁵ | 2.09 × 10⁶ | |
| Walnuts | 0.91 | 2.73 × 10⁵ | 5.47 × 10⁴ | 2.99 × 10⁵ | |
| CWP + 30% | Almonds | 0.27 | 1.48 × 10⁸ | 4.43 × 10⁷ | 5.27 × 10⁷ |
| Cotton | 0.33 | 6.02 × 10⁷ | 1.81 × 10⁷ | 2.62 × 10⁷ | |
| Winter Wheat | 2.69 | 1.65 × 10⁷ | 4.96 × 10⁶ | 5.79 × 10⁷ | |
| Pistachios | 1.03 | 1.53 × 10⁷ | 4.60 × 10⁶ | 2.05 × 10⁷ | |
| Grapes | 1.65 | 2.02 × 10⁷ | 6.06 × 10⁶ | 6.82 × 10⁷ | |
| Barley | 1.93 | 1.79 × 10⁶ | 5.36 × 10⁵ | 4.48 × 10⁶ | |
| Rice | 1.42 | 3.67 × 10⁶ | 1.10 × 10⁶ | 6.76 × 10⁶ | |
| Corn | 2.15 | 8.08 × 10⁵ | 2.42 × 10⁵ | 2.26 × 10⁶ | |
| Walnuts | 0.99 | 2.52 × 10⁵ | 7.57 × 10⁴ | 3.24 × 10⁵ | |
| CWP + 0% | All Crops | 3.46 × 10⁸ | 0 | 1.65 × 10⁸ | |
| CWP + 10% | 3.15 × 10⁸ | 3.15 × 10⁷ | 1.81 × 10⁸ | ||
| CWP + 20% | 2.89 × 10⁸ | 5.77 × 10⁷ | 1.98 × 10⁸ | ||
| CWP + 30% | 2.66 × 10⁸ | 7.99 × 10⁷ | 2.14 × 10⁸ |
Table 8.
Table of Economic Crop Water Productivity (ECWP). ECWP ($/m3) and ratio of crop monetary value per unit of mass ($/kg) based on CWP from this study and 2016 market value from the California Department of Food Agriculture [116]. Data is displayed for the nine crops in the Central Valley of California study area.
| Crop Type | CWP (kg/m3) | Value per kg (USD/kg) | Total Value (1000 USD) | ECWP (USD/m3) |
|---|---|---|---|---|
| Almonds | 0.21 | 5.27 | 183,148 | 1.11 |
| Cotton | 0.26 | 3.09 | 53,303 | 0.79 |
| Winter Wheat | 2.07 | 0.18 | 6813 | 0.37 |
| Pistachios | 0.79 | 3.70 | 50,197 | 2.93 |
| Grapes | 1.26 | 0.92 | 41,258 | 1.16 |
| Barley | 1.48 | 0.20 | 584 | 0.29 |
| Rice | 1.09 | 0.32 | 1406 | 0.34 |
| Corn | 1.66 | 0.18 | 271 | 0.31 |
| Walnuts | 0.76 | 2.04 | 436 | 1.55 |
Disclaimer/Publisher’s Note: The statements, opinions and data contained in all publications are solely those of the individual author(s) and contributor(s) and not of MDPI and/or the editor(s). MDPI and/or the editor(s) disclaim responsibility for any injury to people or property resulting from any ideas, methods, instructions or products referred to in the content. |
© 2023 by the authors. Licensee MDPI, Basel, Switzerland. This article is an open access article distributed under the terms and conditions of the Creative Commons Attribution (CC BY) license (https://creativecommons.org/licenses/by/4.0/).
Share and Cite
MDPI and ACS Style
Foley, D.; Thenkabail, P.; Oliphant, A.; Aneece, I.; Teluguntla, P. Crop Water Productivity from Cloud-Based Landsat Helps Assess California’s Water Savings. Remote Sens. 2023, 15, 4894. https://doi.org/10.3390/rs15194894
AMA Style
Foley D, Thenkabail P, Oliphant A, Aneece I, Teluguntla P. Crop Water Productivity from Cloud-Based Landsat Helps Assess California’s Water Savings. Remote Sensing. 2023; 15(19):4894. https://doi.org/10.3390/rs15194894
Chicago/Turabian StyleFoley, Daniel, Prasad Thenkabail, Adam Oliphant, Itiya Aneece, and Pardhasaradhi Teluguntla. 2023. "Crop Water Productivity from Cloud-Based Landsat Helps Assess California’s Water Savings" Remote Sensing 15, no. 19: 4894. https://doi.org/10.3390/rs15194894
Note that from the first issue of 2016, this journal uses article numbers instead of page numbers. See further details here.