
Red Palm Weevil Detection in Date Palm Using Temporal UAV Imagery
by
 , , and
Stephanie Delalieux
1,*,
Tom Hardy
2,
Michel Ferry
3,
Susi Gomez
3,
Lammert Kooistra
2,
Maria Culman
1,4 and
and
Laurent Tits
1 1
Department of Remote Sensing, Flemish Institute for Technological Research, VITO, Boeretang 200, 2400 Mol, Belgium
2
Laboratory of Geo-Information Science and Remote Sensing, Wageningen University and Research, 6708 PB Wageningen, The Netherlands
3
Phoenix Research Centre, Apartado 996, 03201 Elche, Spain
4
Division of Forest, Nature and Landscape, KU Leuven, 3001 Leuven, Belgium
*
Author to whom correspondence should be addressed.
Remote Sens. 2023, 15(5), 1380; https://doi.org/10.3390/rs15051380
Submission received: 23 December 2022
/
Revised: 16 February 2023
/
Accepted: 25 February 2023
/
Published: 28 February 2023
(This article belongs to the Special Issue Spectral Imaging Technology for Crop Disease Detection)
Abstract
:Red palm weevil (RPW) is widely considered a key pest of palms, creating extensive damages to the date palm trunk that inevitably leads to palm death if no pest eradication is done. This study evaluates the potential of a remote sensing approach for the timely and reliable detection of RPW infestation on the palm canopy. For two consecutive years, an experimental field with infested and control palms was regularly monitored by an Unmanned Aerial Vehicle (UAV) carrying RGB, multispectral, and thermal sensors. Simultaneously, detailed visual observations of the RPW effects on the palms were made to assess the evolution of infestation from the initial stage until palm death. A UAV-based image processing chain for nondestructive RPW detection was built based on segmentation and vegetation index analysis techniques. These algorithms reveal the potential of thermal data to detect RPW infestation. Maximum temperature values and standard deviations within the palm crown revealed a significant (α = 0.05) difference between infested and non-infested palms at a severe infestation stage but before any visual canopy symptoms were noticed. Furthermore, this proof-of-concept study showed that the temporal monitoring of spectral vegetation index values could contribute to the detection of infested palms before canopy symptoms are visible. The seasonal significant (α = 0.05) increase of greenness index values, as observed in non-infested trees, could not be observed in infested palms. These findings are of added value for steering management practices and future related studies, but further validation of the results is needed. The workflow and resulting maps are accessible through the Mapeo® visualization platform.
Keywords:
date palm; red palm weevil; UAV; photogrammetry; segmentation; decision tree; remote sensing; vegetation index1. Introduction
Red palm weevil (RPW) is considered the most dangerous pest for palms worldwide; it causes rapid palm death and has high economic and environmental consequences. The pest originates in South East Asia and has rapidly extended its geographical and host range within the last few decades. Despite tremendous efforts to stop its further proliferation, the pest is spreading globally. Insufficient participation of farmers and other stakeholders, weak quarantine enforcement, and difficult early detection are major obstacles to its successful management and control [1,2].
RPW adults cause feeding damage to the leaves, but the larvae induce the most destructive damage as they chew up the fibers inside the palm tree, resulting in boreholes in the trunk. Since these damages occur inside the trunk, the first signs are hard to detect. As the infestation progresses, the tree starts rotting from the inside, resulting in yellowing and wilting of the leaves. When these latter symptoms become visible, the palm tree is already severely damaged and dies.
So far, the RPW detection relies on weevil traps and visual inspections by palm owners themselves or, in some countries, by private or public organizations. The visual inspection of each individual palm tree, in either public areas or commercial plantations, is very laborious because it must be repeated at least every month to be meaningful. It is also very costly, especially when the visual inspection is entrusted to private companies or administrations. An accurate and cost-effective early detection technology could thus contribute to a more efficient and successful RPW control and eradication program [3].
Therefore, various approaches for the detection of RPW infestations have been recently studied and evaluated [4,5], including acoustic sensors [6,7,8,9,10,11], and sniffer dogs or electronic noses [12,13,14]. However, these methods have shown their shortcomings: odor sensing is neither accurate nor selective since it is impacted by other volatiles [15]. Noise detection requires a sound probe to be inserted into the tree trunk, which is intrusive to the plant growth and might create a nest for insects, including RPW. This latter problem was mitigated by [15] using an optical fiber DAS. However, this solution is still very site-specific and specifically meant to detect infestations in local nurseries or plantations.
Another main limitation in many of the studies that can be found in literature is the absence or lack of precision as to the degree of the infestation and the correct recognition of the symptoms. Until now, none of the above-mentioned technological techniques provided the desired results for monitoring RPW at a large scale. Scientists are still making efforts to discover some effective, efficient, and environmentally safe methods for RPW early detection. If an infestation is discovered early, treatment efficacy is higher, but as long as the heart of the palm is not yet damaged and the trunk is still stable, the palm can be treated and will probably recover [16].
By reviewing the existing literature, it became clear that remote sensing is the preferred method to use for continuous, proper monitoring of RPW over extensive areas. Furthermore, a complete set of contextual, structural, spatial, spectral, thermal, and temporal information available from remote sensing is needed for successful detection. All this should be supported with detailed and accurate ground observations.
Satellite and aerial-based sensors allow the identification of regions with high concentrations of palms and even individual palm trees over vast areas [17,18,19,20,21,22]. Yet, they often lack the detail needed to detect subtle disease symptoms. Bannari et al. [23,24] did a preliminary study to detect RPW-infested palm trees with very high resolution (30 cm) spaceborne WorldView-3 imagery (not freely available). They concluded that chlorophyll-related spectral indices offer a potentially viable and important alternative for discrimination and mapping different levels of RPW stress. The study, however, lacks detail on the description of the symptoms on which the different infestation levels were selected. It is, therefore, hard to know to what degree they could detect infested trees before the symptoms were clearly visible.
In addition to the optical domain, thermal cameras have also been used for years in remote sensing studies to assess plant stress in agriculture (e.g., [25]). Starting from the hypothesis that RPW larvae cut off the vascular system while feeding on the date palm trunk tissues, in [16,26], the authors examined the possibility of generating quantitative remote sensing products of RPW infection by manned airborne thermal imaging. They concluded from their study that thermal RS is potentially a non-invasive tool for assessing RPW infection in palm trees. However, they also noted the relatively high costs and suggested testing this technique on lower-cost platforms. Available literature suggests that baseline information on temperature profiles of RPW-infested date palms acquired from IR cameras has the potential to mark the damage. However, this method is unreliable when the surface and inside temperature do not differ much [5]. Furthermore, fixed cameras can only gather information in a limited area.
The very high (cm) resolution of UAV-based images can provide detailed information on the palm health status [21]. Zheng et al. [27] demonstrated the potential of a multi-class oil palm detection model (MOPAD) for individual oil palm tree detection and observation of growing status (healthy, dead, mismanaged, smallish, and yellowish palms) from UAV RGB images. They concluded that multispectral imagery would be even more appropriate to detect diseases in palms.
Though spatially detailed multidate observations are rare, they can provide information on the phenology and might significantly improve the accuracy and time of the RPW detection throughout the season. Wood et al. [28] successfully identified plant-level phenological differences (i.e., differences in growing season length and timing within vegetation functional groups) and demonstrated improved vegetation classification accuracy by utilizing multi-flight UAV classification approaches.
Ecke et al. [29] reviewed 99 papers covering the last ten years of research on UAV-based monitoring of forests threatened by biotic and abiotic stressors. Despite the many advantages of UAVs, such as their flexibility, relatively low costs, and the possibility to fly below the cloud cover, they also mentioned some shortcomings: (1) multitemporal and long-term monitoring of forests is clearly underrepresented; (2) the rare use of hyperspectral and LiDAR sensors must drastically increase; (3) complementary data from other RS sources are not sufficiently being exploited; (4) a lack of standardized workflows poses a problem to ensure data uniformity; (5) complex machine learning algorithms and workflows obscure interpretability and hinder widespread adoption; (6) the data pipeline from acquisition to final analysis often relies on commercial software at the expense of open-source tools.
As described above, many studies on the detection of RPW attacks in palms are performed due to this pest’s economic and ornamental impact, but all with their shortcomings. Based on these previous findings and the main gaps or limitations described in RPW- and UAV-related publications and reviews, the objective of this research is to evaluate and present a novel, objective, and user-friendly red palm weevil detection approach based on RGB, multispectral, and thermal UAV monitoring combined with detailed in-situ observations. An automatic, standardized UAV processing workflow is developed and presented. Our proposed approach, as such, addresses some of the defined shortcomings in UAV-based forest disease studies, as stated by [29]. More specifically, it addresses multitemporal monitoring, standardized workflow development, and the need for a detailed description of observed field-based RPW symptoms throughout time. Spectral vegetation indices and tree-based decision models are used to select features related to a RPW infestation.
Therefore, we believe our study is of interest to the UAV forest disease detection community in terms of multitemporal disease monitoring and standardized algorithm development and visualization. Furthermore, we hope to give better insights to the RPW experts in the field. Once further validated, we expect this approach to help in better steering palm management in rural and urban areas, leading to economic benefits for countries worldwide. We demonstrate the potential of thermal UAV imagery and temporal image analysis for RPW detection at a stage before symptoms at the crown level become visible. Furthermore, we show that a temporal pattern in spectral characteristics exists in non-infested palm trees and that deviations from this pattern are found in infested ones. The presented approach can be utilized in regions with a high infestation probability. These at-risk regions can be obtained from airborne or spaceborne studies, e.g., [17,18,19,20,21,22].
2. Materials and Methods
2.1. Study Area and Experimental Set-Up
An experimental plot set-up was outlined by Estación Phoenix (Phoenix Research Station, or PRS) in Aspe, near the city of Elche in the province of Alicante, Spain, in a semi-arid climate region. A total of 43 palms were planted, from which only 30 palm trees remained for this experiment (Figure 1), to be monitored with RGB, MSP, and thermal cameras mounted on a UAV. The other 13 trees died due to forced RPW infestations in a preliminary trial (2019–2020).
The trial under investigation (2020–2021) consisted of eighteen date palms (Phoenix dactylifera), from which nine palms were infested (red, Figure 1) with RPW adults recently caught in a network of traps around the town of Aspe. The other nine palms (green, Figure 1) were kept pest-free with chemical treatments. The experimental setup was done in a completely randomized way. The palms used for this experiment were clones of the Medjool variety, known to be susceptible to RPW, and are therefore assumed to behave similarly because they have the same genetics. At the start of the experiment, the palms examined had a trunk height of 40 to 80 cm. From that size to 2–3 meters in height, date palms are sensitive to RPW because they produce offshoots, known to be the first entry point for RPW. The remaining petiole bases in the trunk’s lower part also constitute oviposition sites.
2.2. Dataset
All the infested palms were inspected carefully, especially around the date of the UAV flights, to observe the symptoms and assess the infestation progress. All the symptoms were photographed. The palm trees were also regularly (Table 1) monitored by UAV (DJI- Inspire 1 and DJI Matrice 210 RTKmodels). Image datasets were recorded with different types of cameras (Table 2): an RGB Zenmuse FC350 camera with a focal length of 3.61 mm; a Sequoia multispectral camera; a Micasense Red Edge-MX camera; and a FLIR Duo Pro R Thermal camera (7.5–13.5 μm). May 2021 will be discarded from further research due to bad weather leading to imagery of suboptimal quality. Flights were performed at altitudes of 20–25 m, resulting in image resolutions of around 1 cm for RGB and 2 cm for multispectral and thermal imagery.
2.3. Methodology
The first infestations took place in July 2020. Our method of infestation mimicked the removal of offshoots, which is one of the main reasons for the local explosive dispersion of the RPW in natural conditions. This management action creates wounds of sufficient size that can lead to successful oviposition if the wound is not immediately protected [28]. We therefore adopted the following method for infestation: (1) a small wound was realized in the trunk, (2) adults were placed in this hole, and (3) a net was placed around the whole trunk to prevent adults from escaping.
Initially, three adult females and two adult males were inserted in each wound on the 16th of July 2020. According to the estimated degree of infestation during the following inspections, new infestations were realized to, as closely as possible, simulate the natural evolution of infestation progress (Figure 2). This graph was realized by the PRS team (Ferry and Gomez) based on knowledge and previous expertise.
Re-infestations in the same wound or a new wound were necessary to have similar exponential reproduction processes in all the palms. As only nine palms were available for infestation, it was the only way to have as many palms as possible at more or less the same degree of infestation at the time of each UAV flight. In addition, under the climatic conditions, mortality was high during the winter period, requiring re-infestation in the spring to obtain the desired infestation grades before the planned end of the trial. Therefore, re-infestations were done in November 2020 and May and July 2021.
The collected UAV images were processed with the structure from motion (SfM) photogrammetry technique through the Mapeo® processing platform (https://mapeo.vito.be/, accessed on 15 November 2021). Mapeo® is an end-to-end image processing solution. It provides an easy-to-use interface for ordering and visualizing UAV-based products, extracting statistical information, and downloading the data products. The SfM workflow consisted of: (1) tie-point extraction and matching (alignment), (2) geometric camera self-calibration and refinement of the georeferencing (optimization), (3) dense point cloud generation, (4) dense point cloud classification, (5) digital surface model (DSM) generation, (6) digital terrain model (DTM) generation, and (7) ortho-mosaic generation based on the DTM. More details can be found in [30,31]. The thermal imagery was calibrated based on simultaneous pyrometer measurements of white and black targets that were placed in the field. An empirical line approach [32] was applied to transform the digital number (DN) values into meaningful temperature values.
The canopy height model (CHM) was calculated by extracting the DTM from the DSM. Subsequently, the background was removed by excluding all pixels with CHM values below 0.4 m for further analysis. As this action did not remove all background, the individual trees were subsequently segmented and smoothed using the i.segment GRASS GIS function called from R [33].
Vegetation indices (VI) are often used in remote sensing studies, as they minimize the influence of distorting factors, such as ground reflectance, solar irradiance, the sun elevation angle, and the atmosphere. In this study, the vegetation indices listed in Table 3 were explored. Moreover, zonal statistics (median, min, max, minority, majority, variety, and variance) per palm segment were calculated.
A non-parametric statistical Wilcoxon Signed-Rank Test was applied to test whether or not there was a significant difference between the non-infested and infested palm VI population means [61]. Next to this, all obtained features of the palm segments were used as input for a tree-based model (TBM) (rpart) [62]. Tree-based modeling is a non-parametric supervised classification method that does not require the assumption of probability distributions. Other advantages are that specific interactions can be detected without previous inclusion in the model, non-homogeneity can be taken into account, mixed data types can be used, and dimension reduction of high-dimensional datasets is facilitated [63]. The TBM technique presented here could classify palm canopy features based on ‘recursive partitioning’. Single tree models were pruned based on the complexity parameter to avoid overfitting. This is the minimum improvement the model needs at each node and is based on the cost complexity of the model. The most informative features were selected from the tree. The rpart method uses Gini impurity to select splits when performing classification. This Gini Impurity measures the disorder of a set of elements. It is calculated as the probability of mislabeling an element, assuming the element is randomly labeled. This is done according to the distribution of all the classes from the set [62]. An overall measure of variable importance was calculated as the sum of the goodness of split measures for each split for which it was the primary variable. Plus, the goodness (adjusted agreement) for all splits in which it was a surrogate.
Since a palm canopy consists of leaves of different ages, from very young sprouting leaves in the central part of the canopy to senescing leaves at the outer canopy, a concentric ring approach was performed (Figure 3).
Rings of 0.5, 1, 1.5, 2, and 2.5 m diameter were created to address the different groups of leaves in a palm canopy. The group of spear leaves (grey) has not yet opened. They are growing vertically and have limited photosynthetic activity. In the high crown leaves (light green) group, the leaves are opening and progressively inclining from the vertical to the horizontal position. Their photosynthetic activity is gradually increasing. The leaves in the group of mature leaves (darker green) are fully open and mature. They have reached the maximum length and have high photosynthetic activity. The leaves belonging to the low crown leaves (very dark green and yellow) inclined below the horizontal position are senescing. Their photosynthetic activity is low, and they will eventually dry.
Based on the previously mentioned methodological steps, a dedicated RPW detection image processing workflow (Figure 4) was built to ensure a standardized way of processing, from raw image data to the final RS-derived detection method.
The resulting maps were uploaded on a viewer platform, Mapeo©, to share the findings with the end-user.
3. Results
3.1. Visual Inspection
During visual inspection, clear RPW infestation symptoms were observed at the trunk level from 1.5 months after the first infestation, when chewed fiber and oozing were observed in all the infested palms. In some palms, larvae, cocoons, adults, and dry offshoots were detected, and the areas of infestation were distinct from the initial ones. A typical strong smell could be perceived in some of the infested palms. During the following inspections (Figure 5 and Figure 6), these symptoms became more apparent. However, this increasing severity of symptoms slowed down noticeably from October 2020 to March 2021. On the contrary, from May to September 2021, the symptoms increased very quickly, and all the palms, except one (palm No. 37), collapsed. In September, the first infestation symptoms at the canopy level (dry central leaves) appeared for four infested palms (No. 14, 29, 30, 38).
The results of the infestation protocol were satisfactory, as eight out of nine of the infested palms were so deeply infested that the RPW killed them. Palm No. 37 was very infested, although not enough to be killed, so we were able to sanitize it.
Based on the results, we present a classification of the palms in six classes of infestation after the Start of Infestation—SoI: Low-L, Low to Medium—L-M, Medium-M, Medium to Very Infested—M-VI, Very Infested—VI, Totally infested—VVI (Table 4). This classification is based on the observations at the moment of the inspection but also, retrospectively, on the results of the observations on the following date.
All of the infested palms were dissected except palm No. 37. The dissection results showed a large and diverse population of weevils (larvae of different stages, pupae, adults in cocoons, or free) (Figure 6). In all the cases, larvae reached the terminal bud.
From the observations in this experiment and the known evolution of the infestation, as illustrated in Figure 2, the challenge to detect infestation signals early by remote sensing becomes even more clear. The intensity of the infestation signal, related to RPW-induced physiological changes in the case of remote sensing, will remain weak for many months.
3.2. UAV Image Analysis
RGB and multispectral-based vegetation indices were calculated, and the index values per palm crown were extracted using the segmentation output.
As mentioned in Section 2, a first soil background masking was applied using a CHM threshold of 0.2 m. An additional segmentation algorithm was applied to exclude the remaining background pixels. The result of this segmentation step is shown in Figure 7 (left). In the central image of Figure 7, the extracted palm canopy NDRE values are shown, ranging from low (red) to high (green). Our concentric ring approach is demonstrated in the right image, where median values of the NDRE rings were calculated and displayed on the same color scale (red = low, green = higher median NDRE values).
To assess the seasonal behavior of palm tree VIs, we looked into all available UAV data (from September 2020 to September 2021) and performed a multitemporal analysis on the indices. When looking into the NDRE ring statistics, a significant difference between non-infested and infested palm population means could be made (Wilcoxon Signed-Rank Test, alpha = 0.05). The infested trees always appeared to have higher NDRE values for each part of the canopy (shown only for the inner ring and the whole canopy in Figure 8).
The difference between the infested and non-infested populations decreased toward the end of the experiment. This is due to a steady increase in NDRE values of the inner parts of the non-infested palm canopies (green) throughout the monitoring period. In contrast, the NDRE values for the inner canopy parts of the infested trees (red) did not show this trend (Figure 8). No significant differences (alpha = 0.05) were found between the mean NDRE value populations of the infested palm trees throughout time. From visual observations, rather, a decreasing trend throughout time was observed. For the non-infested palm trees, a significant increase (alpha = 0.05) in NDRE mean values was observed from September 2020 to September 2021, from June 2021 to September 2021, and from July 2021 to September 2021.
For the whole canopy (Figure 8 at the right), the non-infested palms exhibit a seasonal effect with overall increasing NDRE values towards the end of the season (a significant increase from June until December 2021). This seasonal pattern is no longer observable in the infested trees in 2021.
From Figure 9, where we zoomed in on one specific acquisition date, we observe that NDRE values (and also the values of other greenness-related indices–not shown here) decrease from the inner to the outer part of the palm canopy. This happens especially for the infested trees (significant difference between population means of the inner and outer rings). The standard deviations of the infested trees’ mean values are larger than those of the non-infested palms.
Figure 10 shows these findings on an RGB orthophoto from the UAV mission performed on the 6th of September 2021, overlaid with median NDRE ring values.
In addition to the multispectral VIs, RGB VIs were also tested. The indices were used as input in a tree-based model. The model selected the RCC index of July 2021 as the best indicator to distinguish between infested and non-infested palm trees (Figure 11). If the index value was equal to or higher than 0.38, the palm tree was expected to be non-infested.
Notwithstanding this, no significant difference (alpha = 0.05) was found when comparing the non-infested and infested RGB VIs populations with a Wilcoxon Signed Rank Test. p-values ranged from 0.07 to 0.86. The best results were obtained for the RCC and BCC indices for July 2021 and the WI index for September 2021, all with p-values of 0.07. Although RCC was found to be a good indicator of RPW infestation in July 2021, it was not in September 2021. Temporal analysis was not feasible due to the RGB data acquisitions, for which no radiometric calibration panels were available.
As the last step, we added thermal information to the canopy features list. Statistics were calculated per segmented canopy. Applying a Wilcoxon Signed-Rank Test with alpha = 0.05 resulted in significant differences between the mean of infested and non-infested palm groups from June 2021 onwards (Table 5).
Table 5 shows that the most relevant features were maximum temperature, standard deviation, and variance to detect the infestation in an earlier stage. However, the infestation had been severe since the beginning of the thermal data acquisitions (June 2021). In September, all thermal features, except for minimum and minority, could differentiate between infested and non-infested palms. Boxplots of the most promising features (maximum and variance/standard deviation) are shown in Figure 12 for the three groups under investigation (“Non-infested palms remaining from previous trial”, “Non-infested Medjool palms from this trial”, and “Infested Medjool palms from this trial”) for the successful thermal UAV campaigns (June, July, and September 2021).
The processed imagery is accessible through the Mapeo® platform upon request of the account details: www.mapeo.be accessed on 24 February 2023. A screenshot of the visualization platform is shown in Figure 13.
4. Discussion
In this study, a controlled experiment was set up to get a better insight into the impact of RPW attacks on the spectral signature of the palm crown. Furthermore, we wanted to assess how canopy-level spectral and thermal changes caused by RPW attacks developed and evolved over the growing season. The field-based monitoring confirmed that, similar to natural infestation processes, an exponential reproduction and spreading of RPW females occurred. This was based only on symptoms observed at the trunk level. No visual symptoms at the canopy level could be observed before September 2021, which corresponded to the end of the experiment. This reflects the huge challenge of this research, i.e., early detection of signals of infestations by remote sensing again. During the slow RPW population growth period, few weevils will escape from the infested palms. Most weevils will remain in the infested palm until serious damage occurs. At that moment, the risk of successful and significant spreading of the pest occurs. Therefore, even if remote sensing cannot detect an infestation at an early stage, it is still instrumental in detecting the infestation before the final massive dispersal of the weevils.
From our results, it was clear that the concentric approach is recommended to study the impact of RPW infestations. The spectral variety within a canopy is too high to interpret observed spectral changes correctly. We advise following this approach for future studies on palm canopies.
The RGB VIs did not show satisfactory results in discriminating between non-infested and infested palm trees, with no significant differences between the means of the two populations (non-infested and infested). This did not confirm the findings from the hyperspectral field-based study of Yones et al. [65], who concluded that specific waveband zones in the RGB domain (514–664 nm) were sufficient to identify non-infested trees. According to them, the spectral ranges (529–589 nm) and (693–695 nm) could be used to identify moderately infested, and (720–724 nm) severely infested date palm trees.
The multispectral greenness VIs presented higher values for infested palm trees in our study. This is inconsistent with what was expected. Greenness VI values are usually higher for non-infested plants compared to diseased plants. This was also found by [23]. The authors stated that the Green Normalized Difference Vegetation Index (gNDVI) was sensitive to palm tree bio-physiological agitation caused by RPW attacks, with significant discrimination performance between non-infested, moderate, and severely infested trees. We could not confirm this finding. However, looking into the temporal profile, the NDRE values of the non-infested palm canopies in September were remarkably higher than those from June and July, while the opposite tendency was observed for the infested palm trees. Over the whole period, the overall NDRE values were higher for infested palm canopies than for non-infested ones. The standard deviations of the infested trees were also larger than those of the non-infested palms.
As high NDRE values correlate with better overall health status than low NDRE values, it is not the health status of the palms that could explain the inverse and paradoxical result that was obtained. In addition, it is doubtful that small damages created by the larvae in the trunk only two months after infestation could cause a physiological change detectable at the crown level. However, NDRE mean values comparison allows distinguishing the two groups of palms from the beginning. Furthermore, at the last stage of infestation, drying of the central leaves was clearly visible for half of the infested palms, when the central leaves of the non-infested palms were perfectly green and consequently should have presented notable higher NDRE values, and not the contrary, if these values were linked to infestation. Although all the palms were of the same variety, of the same age, and cultivated in the same conditions, they inevitably present developmental and morphology differences. Between the two groups of palms, we observed that the medium crown diameter of the non-infested ones was overall a bit smaller than the ones of the infested palms. This difference most probably originated from a difference in the mean canopy density between the two groups of palms. This could partially explain why the NDRE mean values of the non-infested palms are lower than those of the infested ones (at least until the infested palms present visible symptoms of infestation at the crown level). In addition, the risk of residual soil bias, due to partial overlapping of the soil by the leaves, is higher for the palms that present a less dense canopy. This is true, especially, in the more external part of the crown but even in the central ring zone (0.5 m radius from the center of the palm) for the palms with a smaller crown. Concerning the canopy density and differentiated leaves development between the two groups of palms, differences in the leaves’ geometrical features (especially the angles that leaves and leaflets make with the vertical) could have also interfered with the reflectance values. Finally, a parameter, partially linked to the previous ones, could have also contributed meaningfully to the production of the paradoxical result regarding NDRE values: the difference in the shadow bias between the two groups of palms created by part of the leaves on the part of the other leaves of the same palm, especially the central ones. The importance of the shadow problem, in particular in the central part of the crown, is visible in the RGB images. For this parameter, the difference between the two groups of palms is especially visible when the infested palms reach the last stage of infestation. We could expect more shadow in non-infested palms with a denser canopy structure than in infested ones. We would therefore recommend monitoring the structural changes of the canopy due to RPW attacks in future studies. Furthermore, applying shadow masking algorithms on the UAV imagery should be investigated. However, this is a very tough task since removing shadow pixels without losing informative data is hard.
One important conclusion we can draw from our paradoxical result is that the natural variability in the physical crown features between palms could produce reflectance and VI differences. Consequently, that could mask the effect of RPW infestation and even lead to erroneous conclusions if only a single-date image is available. Multispectral images must be analyzed with care for the detection of RPW-infested date palms and require testing complementary methods to eliminate the various biases resulting from the natural heterogeneity in the crown’s physical characteristics.
Notwithstanding this, we could conclude that temporal multispectral monitoring allows for RPW infestation detection, since no significant increase in greenness values throughout time could be observed in the infested palms. This, however, requires multiple flights, making this approach more expensive and less operational-friendly than originally aimed.
Although our experiment consisted of a limited number of palm samples, the thermal UAV data did result in interesting insights into the RPW presence. It indicates that the previous findings using manned aircraft imagery [26,66,67,68] can, to a certain extent, be extrapolated to UAV-based thermal sensing. We could only make a good discrimination between non-infested and infested palm groups based on mean thermal canopy values in a well-advanced infestation stage. Before this stage, only maximum temperatures, variance, and standard deviation of the thermal information made it possible to distinguish between both populations. For this, it is of utmost importance that the segmentation process of the palm canopy is accurate and eliminates all soil backgrounds. If the soil in the background is still present, high maximum temperature values will correspond to soil pixels and result in misleading results. The thermal results are, therefore, promising but should be validated on larger datasets.
To summarize, a novel and user-friendly red palm weevil detection approach is presented in this paper. An automatic processing workflow for RGB, multispectral, and thermal UAV imagery was generated and validated with detailed in-situ observations. Maximum canopy temperatures and temporal spectral monitoring showed the potential to detect the presence of RPW before symptoms were visible at the canopy level. Additional experiments, including regular field observations for validation, are needed to make final conclusions. As mentioned earlier, our proposed approach may be of high importance in terms of optimized management in rural and urban areas. It will lead to economic benefits for countries around the world.
5. Conclusions
In recent years, palm trees have increasingly been infested by red palm weevils. To limit the palm trees’ loss and to control this pest, nondestructive detection of this infestation is needed. Therefore, the main objective of this study was to investigate the capacity of RGB, multispectral, and thermal UAV imagery to predict the presence of RPW infestations. A dedicated processing workflow was set up with concentric canopy statistics to limit the impact of the intrinsic heterogeneity inside the palm crown on the detection results. The experimental results indicate that thermal imagery is the most valuable information for RPW infestation prediction. This finding corresponds to the conclusions of earlier studies [16,26,67,68], in which the authors concluded that RPW infestations cause a significant increase in the internal temperature of a palm trunk compared with non-infested palms. However, the internal temperature does not always correspond with external crown temperatures, which makes RPW infestation detection based on UAV imagery more challenging and the thermal effects less pronounced. Only maximum temperature and standard deviations of the temperature within the crown revealed good discriminatory performance between infested and non-infested palms from June onwards. Mean crown temperatures were only informative at a progressed infestation stage.
These experimental results should be validated on larger datasets before more conclusive findings can be made. However, this study provides highly valuable information concerning further research intending to develop an operational RPW infestation detection system.
Author Contributions
Conceptualization, methodology, S.D., M.F., S.G., L.K.; formal analysis, investigation, S.D., T.H.; writing—original draft preparation, S.D.; writing—review and editing, L.K., M.F., M.C., L.T.; project administration, S.D. All authors have read and agreed to the published version of the manuscript.
Funding
The research presented in this paper is funded by BELSPO (Belgian Science Policy Office) in the frame of the STEREO IIIprogramme projects PalmDrone (SR/67/216) and PalmWatch (SR/67/379).
Data Availability Statement
Processed data can be accessed through the Mapeo® platform: www.mapeo.be, accessed on 24 February 2023. You may send an email to the corresponding author to receive a Mapeo® account. The availability of the data on this platform will be limited in time (until mid 2023). Afterwards, data and sample code can be accessed for another two years through a virtual machine on the Terrascope platform (https://terrascope.be, accessed on 24 February 2023).
Acknowledgments
We acknowledge Johan Mijnendonckx, Klaas Pauly, and Sam Oswald (VITO) for assisting in field measurements, image preprocessing, and thermal image processing, respectively. Furthermore, we thank the whole Mapeo team for image processing and visualization activities.
Conflicts of Interest
The authors declare no conflict of interest.
References
- Ferry, M.; Cousin, R.; Chabernaud, D.; Ferrero, F. An Effective Strategy to Obtain Very Rapidly the Red Palm Weevil Decline in an Area Planted with Ornamental Palms. Arab. J. Plant Prot. 2019, 37, 188–197. [Google Scholar] [CrossRef]
- Elshafie, H.; Faleiro, J.; Abdel Farag El-Shafie, H.; Romeno Faleiro, J. Red Palm Weevil, Rhynchophorus Ferrugineus (Coleoptera: Curculionidae): Global Invasion, Current Management Options, Challenges, and Future Prospects Characterization of Local Entomopathogenic Bacillus Strains View Project Red Palm Weevil Rhynchophorus Ferrugineus (Coleoptera: Curculionidae): Global Invasion, Current Management Options, Challenges and Future Prospects. Arab. J. Plant Prot. 2019, 37, 170–177. [Google Scholar]
- Mohammed, M.E.A.; El-Shafie, H.A.F.; Alhajhoj, M.R. Recent Trends in the Early Detection of the Invasive Red Palm Weevil, Rhynchophorus Ferrugineus (Olivier). In Invasive Species—Introduction Pathways, Economic Impact, and Possible Management Options; IntechOpen: Rijeka, Croatia, 2020. [Google Scholar]
- Eldin, H.A.; Waleed, K.; Samir, M.; Tarek, M.; Sobeah, H.; Salam, M.A. A Survey on Detection of Red Palm Weevil Inside Palm Trees: Challenges and Applications. In Proceedings of the ACM International Conference Proceeding Series; Association for Computing Machinery, Cairo, Egypt, 11 November 2020; pp. 119–125. [Google Scholar]
- Koubaa, A.; Aldawood, A.; Saeed, B.; Hadid, A.; Ahmed, M.; Saad, A.; Alkhouja, H.; Alkanhal, M. Smart Palm: An IoT Framework for Red Palm Weevil Early Detection. Agronomy 2019, 10, 987. [Google Scholar] [CrossRef]
- Hetzroni, A.; Soroker, V.; Cohen, Y. Toward Practical Acoustic Red Palm Weevil Detection. Comput. Electron. Agric. 2016, 124, 100–106. [Google Scholar] [CrossRef]
- Mankin, R.W. Recent Developments in the Use of Acoustic Sensors and Signal Processing Tools to Target Early Infestations of Red Palm Weevil in Agricultural Environments. Fla. Entomol. 2011, 94, 761–765. [Google Scholar] [CrossRef]
- Rach, M.M.; Gomis, H.M.; Granado, O.L.; Malumbres, M.P.; Campoy, A.M.; Martín, J.J.S. On the Design of a Bioacoustic Sensor for the Early Detection of the Red Palm Weevil. Sensors 2013, 13, 1706–1729. [Google Scholar] [CrossRef]
- Mankin, R.W.; Al-Ayedh, H.Y.; Aldryhim, Y.; Rohde, B. Acoustic Detection of Rhynchophorus Ferrugineus (Coleoptera: Dryophthoridae) and Oryctes Elegans (Coleoptera: Scarabaeidae) in Phoenix Dactylifera (Arecales: Arecacae) Trees and Offshoots in Saudi Arabian Orchards. J. Econ. Entomol. 2016, 109, 622–628. [Google Scholar] [CrossRef] [Green Version]
- Pinhas, J.; Soroker, V.; Hetzroni, A.; Mizrach, A.; Teicher, M.; Goldberger, J. Automatic Acoustic Detection of the Red Palm Weevil. Comput. Electron. Agric. 2008, 63, 131–139. [Google Scholar] [CrossRef]
- Siriwardena, K.A.P.; Fernando, L.C.P.; Nanayakkara, N.; Perera, K.F.G.; Kumara, A.D.N.T.; Nanayakkara, T. Portable Acoustic Device for Detection of Coconut Palms Infested by Rynchophorus Ferrugineus (Coleoptera: Curculionidae). Crop. Prot. 2010, 29, 25–29. [Google Scholar] [CrossRef]
- Rizzolo, A.; Bianchi, G.; Lucido, P.; Cangelosi, B.; Pozzi, L.; Villa, G.; Clematis, F.; Pasini, C.; Curir, P. Electronic Nose for the Early Detection of Red Palm Weevil (Rhynchophorus Ferrugineous Olivier) Infestation in Palms: Preliminary Results. In Proceedings of the Acta Horticulturae; International Society for Horticultural Science, Angers, France, 25 September 2015; Volume 1099, pp. 347–356. [Google Scholar]
- Suma, P.; la Pergola, A.; Longo, S.; Soroker, V. The Use of Sniffing Dogs for the Detection of Rhynchophorus Ferrugineus. Phytoparasitica 2013, 42, 269–274. [Google Scholar] [CrossRef]
- Nakash, J.; Osem, Y.; Kehat, M. A Suggestion to Use Dogs for Detecting Red Palm Weevil (Rhynchophorus Ferrugineus) Infestation in Date Palms in Israel. Phytoparasitica 2000, 28, 153–155. [Google Scholar] [CrossRef]
- Ashry, I.; Mao, Y.; Al-Fehaid, Y.; Al-Shawaf, A.; Al-Bagshi, M.; Al-Brahim, S.; Ng, T.K.; Ooi, B.S. Early Detection of Red Palm Weevil Using Distributed Optical Sensor. Sci. Rep. 2020, 10, 3155. [Google Scholar] [CrossRef] [PubMed] [Green Version]
- Soroker, V.; Suma, P.; la Pergola, A.; Cohen, Y.; Alchanatis, V.; Colomb, O. Early Detection and Monitoring of Red Palm Weevil: Approaches and Challenges. In Proceedings of the Palm Pest Mediterranean Conference, Nice, France, 16–18 January 2013. [Google Scholar]
- Culman, M.; Delalieux, S.; Tricht, K.V. Palm Tree Inventory from Aerial Images Using Retinanet. In Proceedings of the 2020 Mediterranean and Middle-East Geoscience and Remote Sensing Symposium, M2GARSS 2020, Tunis, Tunisia, 9–11 March 2020. [Google Scholar]
- Culman, M.; Delalieux, S.; van Tricht, K. Individual Palm Tree Detection Using Deep Learning on RGB Imagery to Support Tree Inventory. Remote Sens 2020, 12, 3476. [Google Scholar] [CrossRef]
- Culman, M.; Rodríguez, A.C.; Wegner, J.D.; Delalieux, S.; Somers, B. Deep Learning for Sub-Pixel Palm Tree Classification Using Spaceborne Sentinel-2 Imagery. In Proceedings of the SPIE—The International Society for Optical Engineering; (online) Spain, 13–18 September 2021, Volume 11856. [CrossRef]
- Zheng, J.; Fu, H.; Li, W.; Wu, W.; Zhao, Y.; Dong, R.; Yu, L. Cross-Regional Oil Palm Tree Counting and Detection via a Multi-Level Attention Domain Adaptation Network. ISPRS J. Photogramm. Remote Sens. 2020, 167, 154–177. [Google Scholar] [CrossRef]
- Zheng, J.; Wu, W.; Yuan, S.; Fu, H.; Li, W.; Yu, L. Multisource-Domain Generalization-Based Oil Palm Tree Detection Using Very-High-Resolution (VHR) Satellite Images. IEEE Geosci. Remote Sens. Lett. 2022, 19, 1–5. [Google Scholar] [CrossRef]
- Zheng, J.; Yuan, S.; Wu, W.; Li, W.; Yu, L.; Fu, H.; Coomes, D. Surveying Coconut Trees Using High-Resolution Satellite Imagery in Remote Atolls of the Pacific Ocean. Remote Sens. Environ. 2023, 287, 113485. [Google Scholar] [CrossRef]
- Bannari, A.; Mohamed, A.M.A.; Peddle, D.R. Biophysiological Spectral Indices Retrieval and Statistical Analysis for Red Palm Weevil Stressattack Prediction Using Worldview-3 Data. In Proceedings of the International Geoscience and Remote Sensing Symposium (IGARSS), Beijing, China, 10–15 July 2016; Institute of Electrical and Electronics Engineers Inc.: Piscataway, NJ, USA, 2016; Volume 2016, pp. 3512–3515. [Google Scholar]
- Bannari, A.; Mohamed, A.M.A.; El’battay, A. Water Stress Detection as an Indicator of Red Palm Weevil Attack Using WorldView 3 Data. In Proceedings of the IEEE International Geoscience and Remote Sensing Symposium (IGARSS), Fort Worth, TX, USA, 23–28 July 2017. [Google Scholar]
- Poblete, T.; Navas-Cortes, J.A.; Camino, C.; Calderon, R.; Hornero, A.; Gonzalez-Dugo, V.; Landa, B.B.; Zarco-Tejada, P.J. Discriminating Xylella Fastidiosa from Verticillium Dahliae Infections in Olive Trees Using Thermal- and Hyperspectral-Based Plant Traits. ISPRS J. Photogramm. Remote Sens. 2021, 179, 133–144. [Google Scholar] [CrossRef]
- Golomb, O.; Alchanatis, V.; Cohen, Y.; Levin, N.; Cohen, Y.; Soroker, V. Detection of Red Palm Weevil Infected Trees Using Thermal Imaging. In Proceedings of the Precision Agriculture 2015—Papers Presented at the 10th European Conference on Precision Agriculture, ECPA, Tel Aviv, Israel, 12–16 July 2015; Wageningen Academic Publishers: Wageningen, The Netherlands, 2015; pp. 643–650. [Google Scholar]
- Zheng, J.; Fu, H.; Li, W.; Wu, W.; Yu, L.; Yuan, S.; Tao, W.Y.W.; Pang, T.K.; Kanniah, K.D. Growing Status Observation for Oil Palm Trees Using Unmanned Aerial Vehicle (UAV) Images. ISPRS J. Photogramm. Remote Sens. 2021, 173, 95–121. [Google Scholar] [CrossRef]
- Wood, D.J.A.; Preston, T.M.; Powell, S.; Stoy, P.C. Multiple UAV Flights across the Growing Season Can Characterize Fine Scale Phenological Heterogeneity within and among Vegetation Functional Groups. Remote Sens. 2022, 14, 1290. [Google Scholar] [CrossRef]
- Ecke, S.; Dempewolf, J.; Frey, J.; Schwaller, A.; Endres, E.; Klemmt, H.J.; Tiede, D.; Seifert, T. UAV-Based Forest Health Monitoring: A Systematic Review. Remote Sens. 2022, 14, 3205. [Google Scholar] [CrossRef]
- Vanbrabant, Y.; Tits, L.; Delalieux, S.; Pauly, K.; Verjans, W.; Somers, B. Multitemporal Chlorophyll Mapping in Pome Fruit Orchards from Remotely Piloted Aircraft Systems. Remote Sens. 2019, 11, 1468. [Google Scholar] [CrossRef] [Green Version]
- Vanbrabant, Y.; Delalieux, S.; Tits, L.; Pauly, K.; Vandermaesen, J.; Somers, B. Pear Flower Cluster Quantification Using RGB Drone Imagery. Agronomy 2020, 10, 407. [Google Scholar] [CrossRef] [Green Version]
- Smith, G.M.; Milton, E.J. The Use of the Empirical Line Method to Calibrate Remotely Sensed Data to Reflectance. Int. J. Remote Sens. 1999, 20, 2653–2662. [Google Scholar] [CrossRef]
- Bivand, R.; Krug, R.; Neteler, M.; Jeworutzki, S.; Vanderhaeghe, F. Package “rgrass7” Title Interface Between GRASS Geographical Information System and R. 2022. Available online: https://cran.r-project.org/web/packages/rgrass/ (accessed on 24 February 2023).
- Woebbecke, D.M.; Sentinel, B.S.; Meyer, G.E.; von Bargen, K.; Mortensen, D.A. Color Indices for Weed /Identification under Various Soil, Residue, and Lighting Conditions; American Society of Agricultural Engineers: St. Joseph, MI, USA, 1994. [Google Scholar]
- Meyer, G.E. Machine Vision Identification of Plants; IntechOpen: Rijeka, Croatia, 2011. [Google Scholar]
- Hunt, E.R., Jr.; Cavigelli, M.; Daughtry, C.S.T.; McMurtrey, J.I.I.I.; Walthall, C.L. Evaluation of Digital Photography from Model Aircraft for Remote Sensing of Crop Biomass and Nitrogen Status. Precis. Agric. 2005, 6, 359–378. [Google Scholar] [CrossRef]
- Gitelson, A.A.; Kaufman, Y.J.; Stark, R.; Rundquist, D. Novel Algorithms for Remote Estimation of Vegetation Fraction. Remote Sens. Environ. 2002, 80, 76–87. [Google Scholar] [CrossRef] [Green Version]
- de Swaef, T.; Maes, W.H.; Aper, J.; Baert, J.; Cougnon, M.; Reheul, D.; Steppe, K.; Roldán-Ruiz, I.; Lootens, P. Applying Rgb-and Thermal-Based Vegetation Indices from UAVs for High-Throughput Field Phenotyping of Drought Tolerance in Forage Grasses. Remote Sens. 2021, 13, 147. [Google Scholar] [CrossRef]
- Steele, M.R.; Gitelson, A.A.; Rundquist, D.C.; Merzlyak, M.N. Nondestructive Estimation of Anthocyanin Content in Grapevine Nondestructive Estimation of Anthocyanin Content in Grapevine Leaves Leaves. Am. J. Bot. 2009, 96, 1861–1868. [Google Scholar]
- Weng, Q. Proceedings of the EORSA 2018: The Fifth International Workshop on Earth Observation and Remote Sensing Applications (EORSA 2018), X’an, China, 18–20 June 2018; ISBN 9781538666425.
- Bendig, J.; Yu, K.; Aasen, H.; Bolten, A.; Bennertz, S.; Broscheit, J.; Gnyp, M.L.; Bareth, G. Combining UAV-Based Plant Height from Crop Surface Models, Visible, and near Infrared Vegetation Indices for Biomass Monitoring in Barley. Int. J. Appl. Earth Obs. Geoinf. 2015, 39, 79–87. [Google Scholar] [CrossRef]
- Hague, T.; Tillett, N.D.; Wheeler, H. Automated Crop and Weed Monitoring in Widely Spaced Cereals. Precis. Agric. 2006, 7, 21–32. [Google Scholar] [CrossRef]
- Gitelson, A.A.; Gritz, Y.; Merzlyak, M.N. Relationships between Leaf Chlorophyll Content and Spectral Reflectance and Algorithms for Non-Destructive Chlorophyll Assessment in Higher Plant Leaves. J. Plant Physiol. 2003, 160, 271–282. [Google Scholar] [CrossRef]
- Perry, C.R.; Lautenschlager, L.F. Functional Equivalence of Spectral Vegetation Indices. Remote Sens. Environ. 1984, 14, 169–182. [Google Scholar] [CrossRef]
- Jiang, Z.; Huete, A.R.; Didan, K.; Miura, T. Development of a Two-Band Enhanced Vegetation Index without a Blue Band. Remote Sens. Environ. 2008, 112, 3833–3845. [Google Scholar] [CrossRef]
- Pinty, B.; Verstraete, M.M. GEMI: A Non-Linear Index to Monitor Global Vegetation from Satellites. Vegetatio 1992, 101, 15–20. [Google Scholar] [CrossRef]
- Gitelson, A.A.; Kaufman, Y.J.; Merzlyak, M.N. Use of a Green Channel in Remote Sensing of Global Vegetation from EOS-MODIS. Remote Sens. Environ. 1996, 58, 289–298. [Google Scholar] [CrossRef]
- Camps-Valls, G.; Campos-Taberner, M.; Moreno-Martínez, Á.; Walther, S.; Duveiller, G.; Cescatti, A.; Mahecha, M.D.; Muñoz-Marí, J.; García-Haro, F.J.; Guanter, L.; et al. A Unified Vegetation Index for Quantifying the Terrestrial Biosphere. Sci. Adv. 2021, 7, eabc7447. [Google Scholar] [CrossRef] [PubMed]
- Daughtry, C.S.T.; Walthall, C.L.; Kim, M.S.; de Colstoun, E.B.; McMurtrey, J.E. Estimating Corn Leaf Chlorophyll Concentration from Leaf and Canopy Reflectance. Remote Sens. Environ. 2000, 74, 229–239. [Google Scholar] [CrossRef]
- Qi, J.; Chehbouni, A.; Huete, A.R.; Kerr, Y.H.; Sorooshian, S. A Modified Soil Adjusted Vegetation Index. Remote Sens. Environ. 1994, 48, 119–126. [Google Scholar] [CrossRef]
- Rouse, J.W.; Haas, R.H.; Deering, D.W.; Schell, J.A.; Harlan, J.C. Monitoring the Vernal Advancement and Retrogradation (Green Wave Effect) of Natural Vegetation; Great Plains Corridor: College Station, TX, USA, 1973. [Google Scholar]
- Barnes, E.; Clarke, T.; Richards, S.; Colaizzi, P.; Haberland, J.; Kostrzewski, M.; Waller, P.; Choi, C.; Riley, E.; Thompson, T.; et al. Coincident Detection OF Crop Water Stress, Nitrogen Status and Canopy Density Using Ground-Based Multispectral Data. In Proceedings of the 5th International Conference on Precision Agriculture and other resource management, Bloomington, MN, USA, 16–19 July 2000. [Google Scholar]
- McFEETERS, S.K. The Use of the Normalized Difference Water Index (NDWI) in the Delineation of Open Water Features. Int. J. Remote Sens. 1996, 17, 1425–1432. [Google Scholar] [CrossRef]
- Baret, F.; Guyot, G. Potentials and Limits of Vegetation Indices for LAI and APAR Assessment. Remote Sens. Environ. 1991, 35, 161–173. [Google Scholar] [CrossRef]
- Birth, G.S.; Mcvey, G.R. Measuring the Color of Growing Turf with a Reflectance Spectrophotometer1. Agron. J. 1968, 60, 640–643. [Google Scholar] [CrossRef]
- Thiam, A.K. Geographic Information Systems and Remote Sensing Methods for Assessing and Monitoring Land Degradation in the Sahel Region: The Case of Southern Mauritania; Clark University: Worcester, MA, USA, 1998. [Google Scholar]
- Deering, D.W. Measuring Forage Production of Grazing Units from Landsat MSS Data. In Proceedings of the 10th International Symposium on Remote Sensing of Environment, ERIM, Ann Arbor, MI, USA, 6 October 1975; pp. 1169–1178. [Google Scholar]
- Tucker, C.J. Red and Photographic Infrared Linear Combinations for Monitoring Vegetation. Remote Sens. Environ. 1979, 8, 127–150. [Google Scholar] [CrossRef] [Green Version]
- Louhaichi, M.; Borman, M.M.; Johnson, D.E. Spatially Located Platform and Aerial Photography for Documentation of Grazing Impacts on Wheat. Geocarto. Int. 2001, 16, 65–70. [Google Scholar] [CrossRef]
- Kataoka, T.; Kaneko, T.; Okamoto, H.; Hata, S. Crop Growth Estimation System Using Machine Vision. In Proceedings of the 2003 IEEE/ASME International Conference on Advanced Intelligent Mechatronics (AIM 2003), Kobe, Japan, 20–24 July 2003; Volume 2, pp. b1079–b1083. [Google Scholar]
- Wilcoxon, F. Individual Comparisons by Ranking Methods. Biom. Bull. 1945, 1, 80–83. [Google Scholar] [CrossRef]
- Therneau, T.; Atkinson, B.; Ripley, B. Package “Rpart”. Available online: https://cran.r-project.org/web/packages/rpart (accessed on 24 February 2023).
- Delalieux, S.; van Aardt, J.; Keulemans, W.; Schrevens, E.; Coppin, P. Detection of Biotic Stress (Venturia Inaequalis) in Apple Trees Using Hyperspectral Data: Non-Parametric Statistical Approaches and Physiological Implications. Eur. J. Agron. 2007, 27, 130–143. [Google Scholar] [CrossRef]
- Fan, Y.; Roupsard, O.; Bernoux, M.; le Maire, G.; Panferov, O.; Kotowska, M.M.; Knohl, A. A Sub-Canopy Structure for Simulating Oil Palm in the Community Land Model (CLM-Palm): Phenology, Allocation and Yield. Geosci. Model Dev. 2015, 8, 3785–3800. [Google Scholar] [CrossRef] [Green Version]
- Yones, M.; El-Shirbeny, M.A.; Khdery, G.; Ali, A.M. Hyperspectral Indices for Assessing Damage by the Red Palm Weevil Rhynchophorus Ferrugineus (Coleoptera: Curculionidae) in Date Palms Bt Project View Project Precision Farming View Project. Int. J. Geosci. Geomat. 2014, 2, 16–23. [Google Scholar]
- Kurdi, H.; Al-Aldawsari, A.; Al-Turaiki, I.; Aldawood, A.S. Early Detection of Red Palm Weevil, Rhynchophorus Ferrugineus (Olivier), Infestation Using Data Mining. Plants 2021, 10, 95. [Google Scholar] [CrossRef]
- El-Faki, M.S.; El-Shafie, H.A.F.; Al-Hajhoj, M.B.R. Potentials for Early Detection of Red Palm Weevil (Coleoptera: Curculionidae)-Infested Date Palm (Arecaceae) Using Temperature Differentials. Can. Entomol. 2015, 148, 239–245. [Google Scholar] [CrossRef]
- Mozib, E.-F. Effect of Red Palm Weevil, Rhynchophorus Ferrugineus (Olivier) Infestation on Temperature Profiles of Date Palm Tree. J. Entomol. Nematol. 2013, 5, 77–83. [Google Scholar] [CrossRef] [Green Version]
Figure 1.
Overview of the experiment, with red circles referring to RPW-infested palm trees of the Medjool variety; green circles referring to non-infested palms of the Medjool variety, and blue circles referring to non-infested palm trees remaining from a previous experiment.
Figure 1.
Overview of the experiment, with red circles referring to RPW-infested palm trees of the Medjool variety; green circles referring to non-infested palms of the Medjool variety, and blue circles referring to non-infested palm trees remaining from a previous experiment.

Figure 2.
Rough estimation of the exponential reproduction and spreading (red arrow) of the RPW females, based on the results obtained for one of the infested palms that presented the earliest symptoms of deep infestation.
Figure 2.
Rough estimation of the exponential reproduction and spreading (red arrow) of the RPW females, based on the results obtained for one of the infested palms that presented the earliest symptoms of deep infestation.
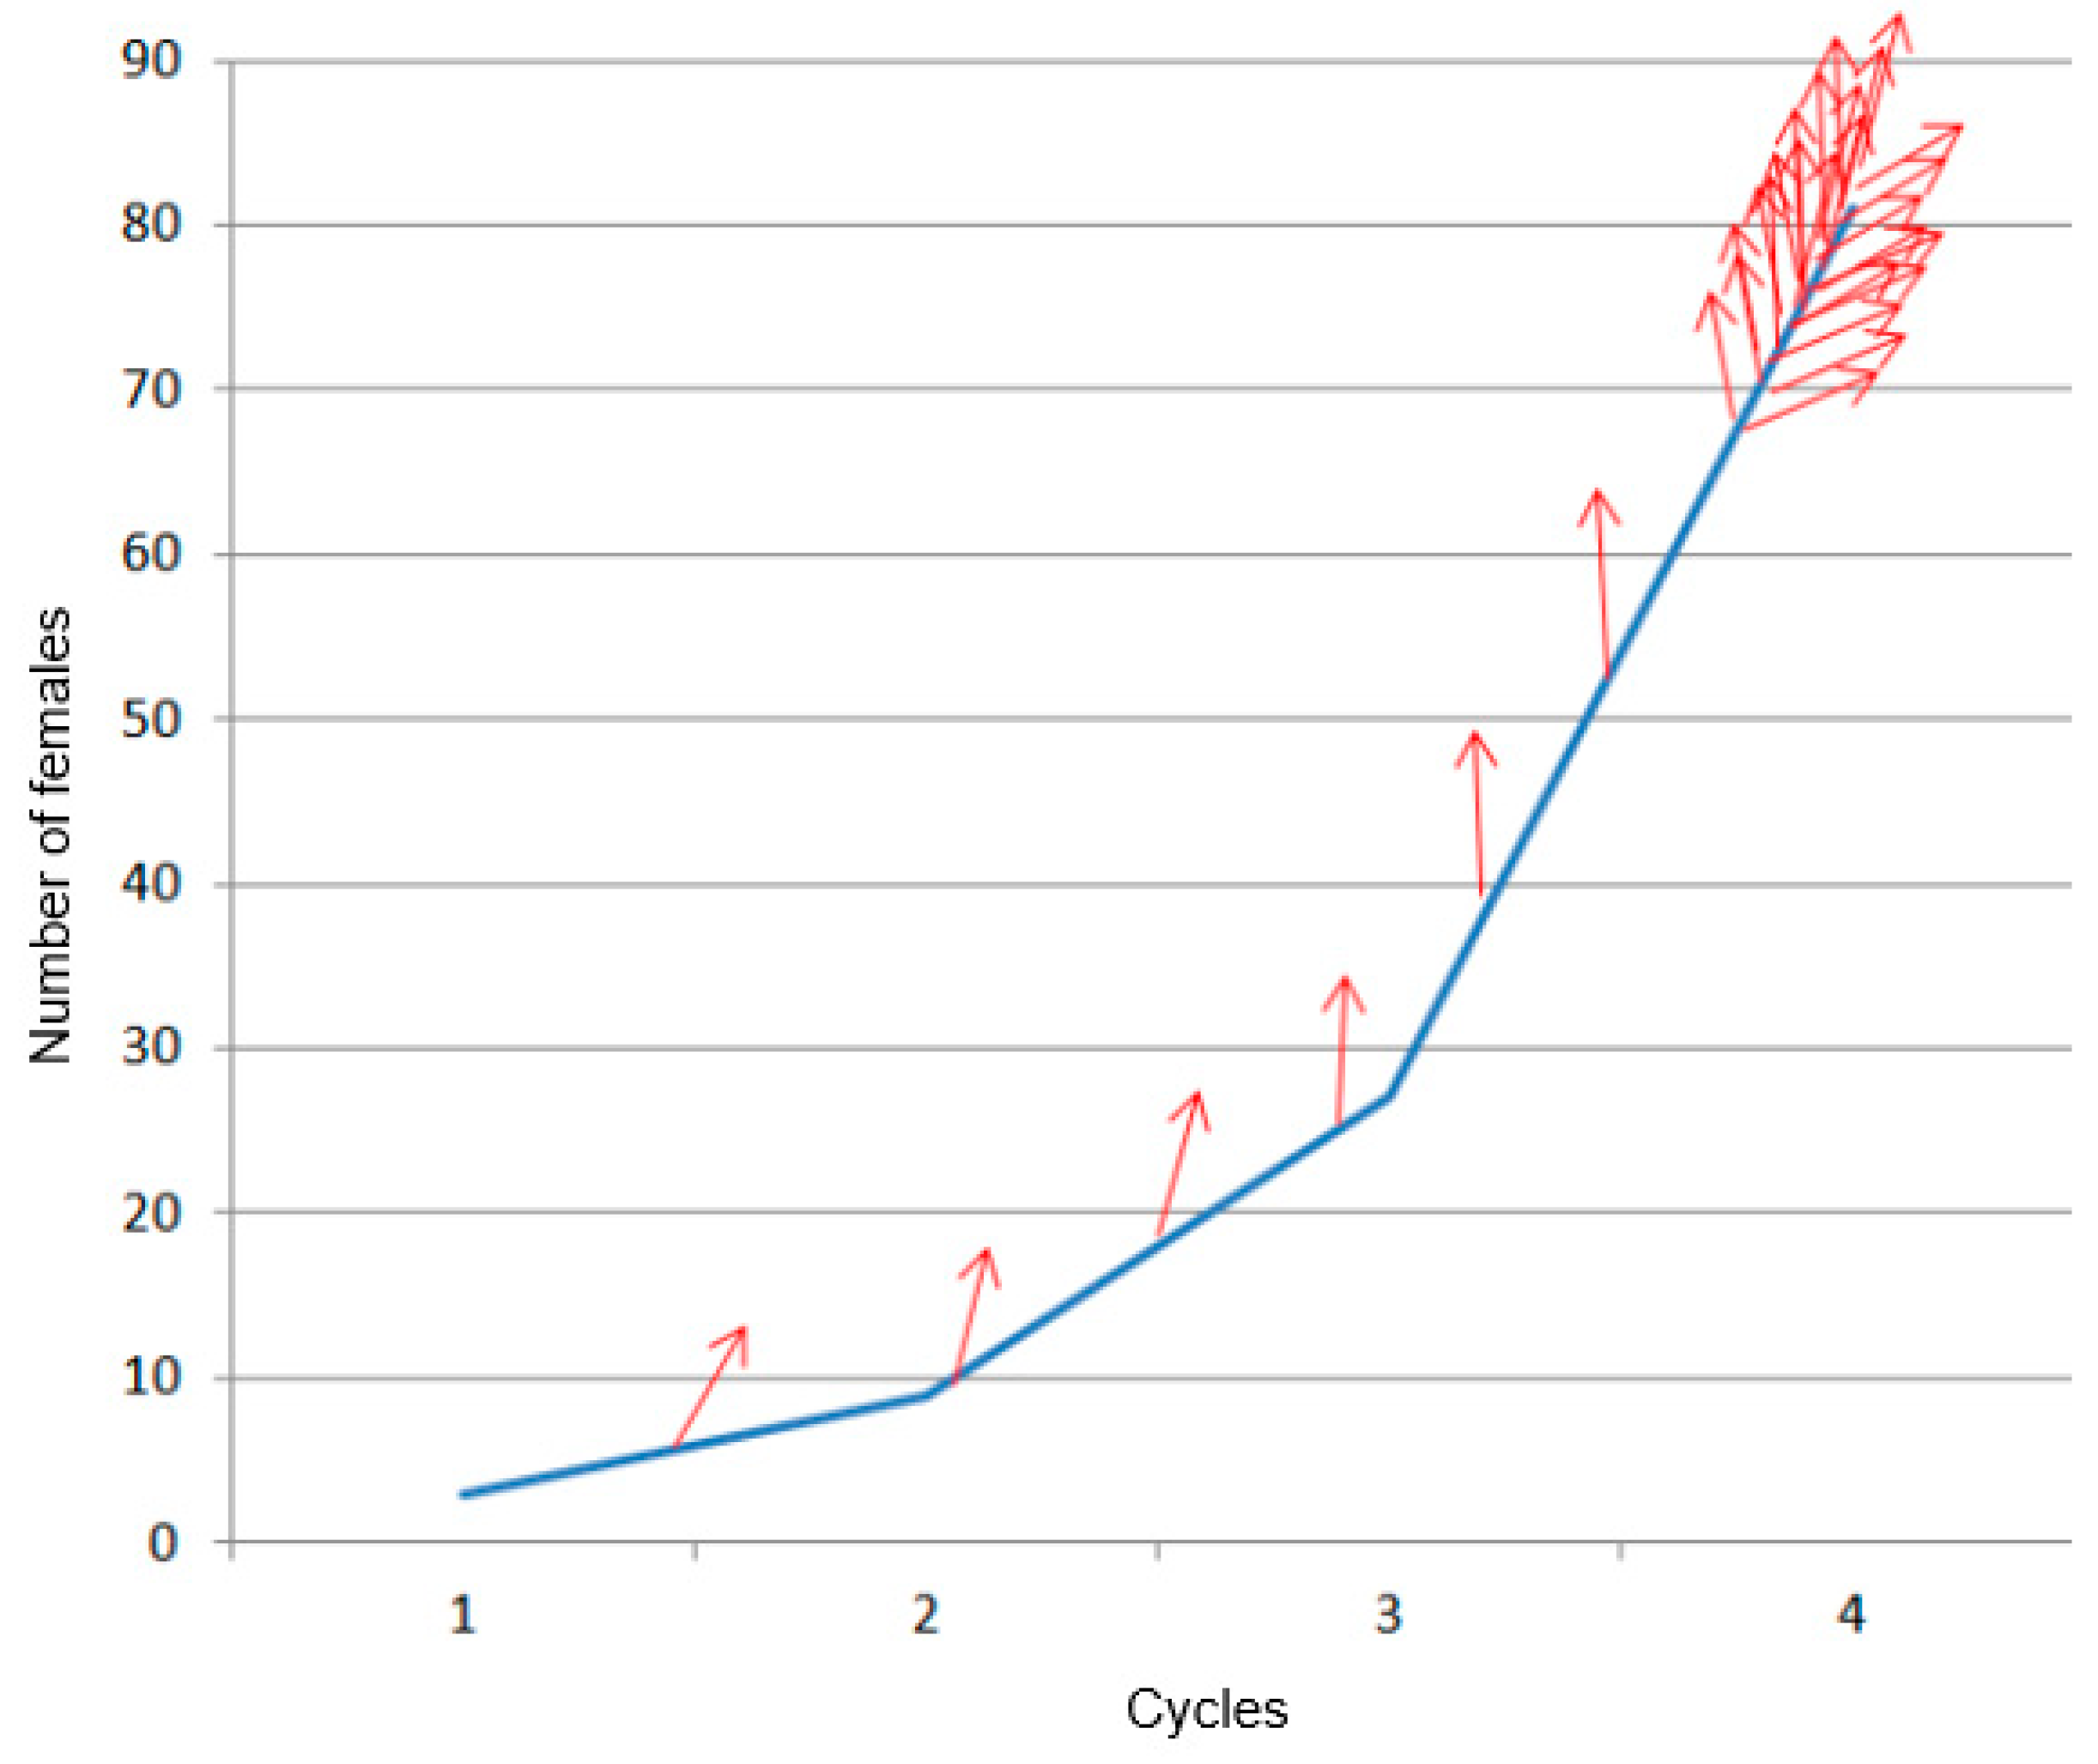
Figure 3.
Image illustrating the heterogeneity of palm leaf phenology inside the canopy (adapted from [64]), with the concentric ring approach illustrated (dashed circles).
Figure 3.
Image illustrating the heterogeneity of palm leaf phenology inside the canopy (adapted from [64]), with the concentric ring approach illustrated (dashed circles).
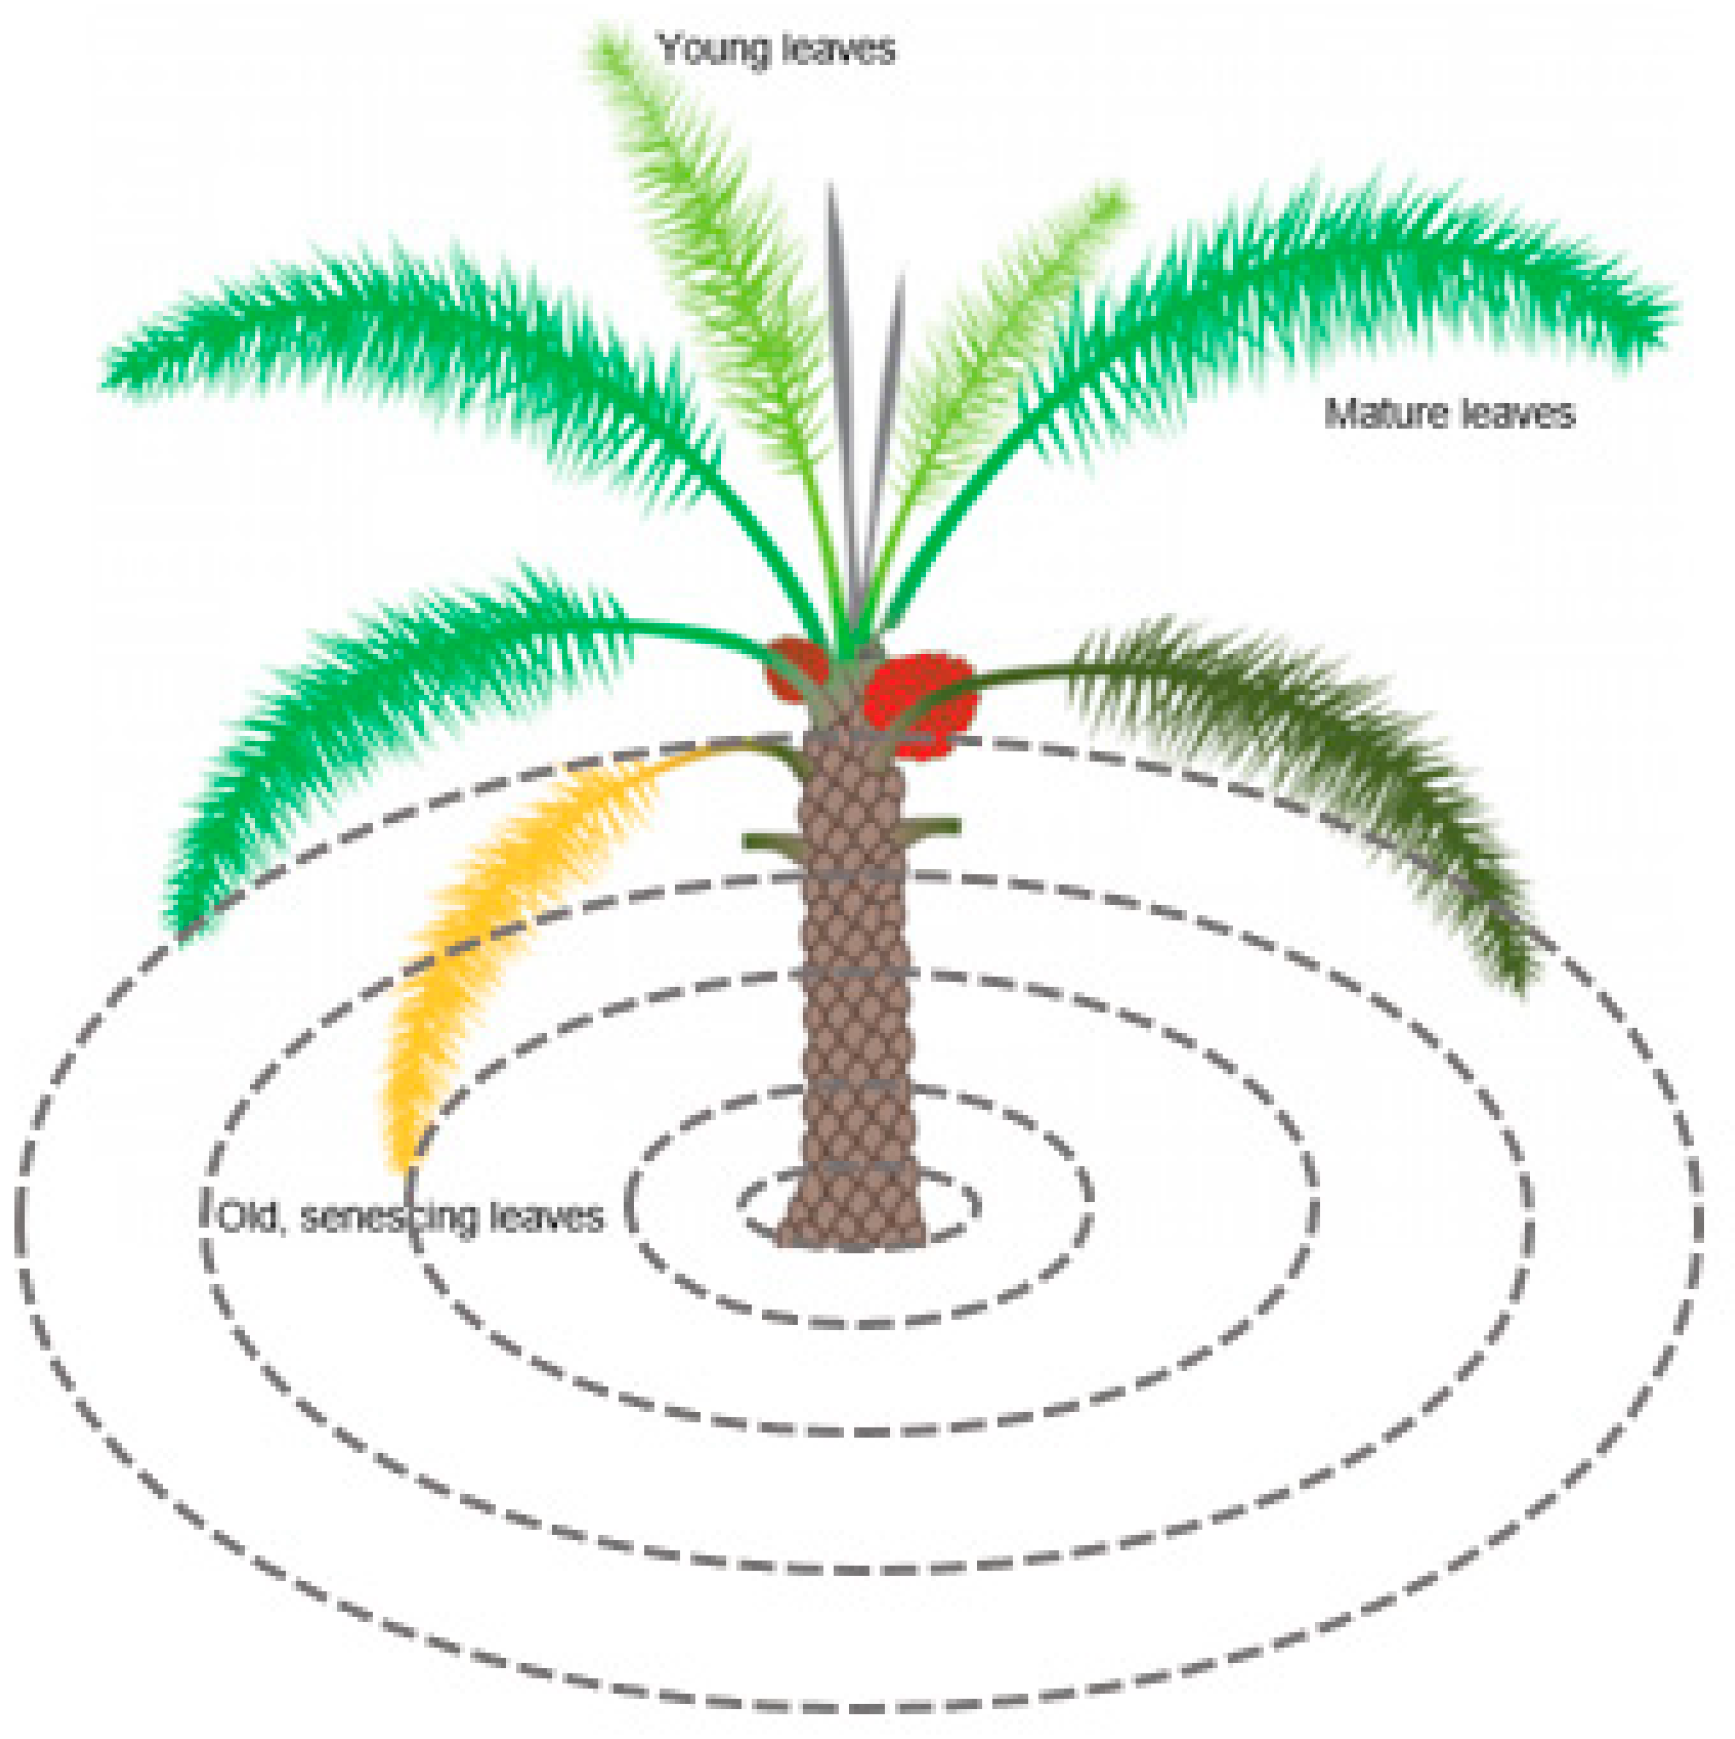
Figure 4.
Workflow diagram depicting the different image processing steps of the RPW detection method.
Figure 4.
Workflow diagram depicting the different image processing steps of the RPW detection method.
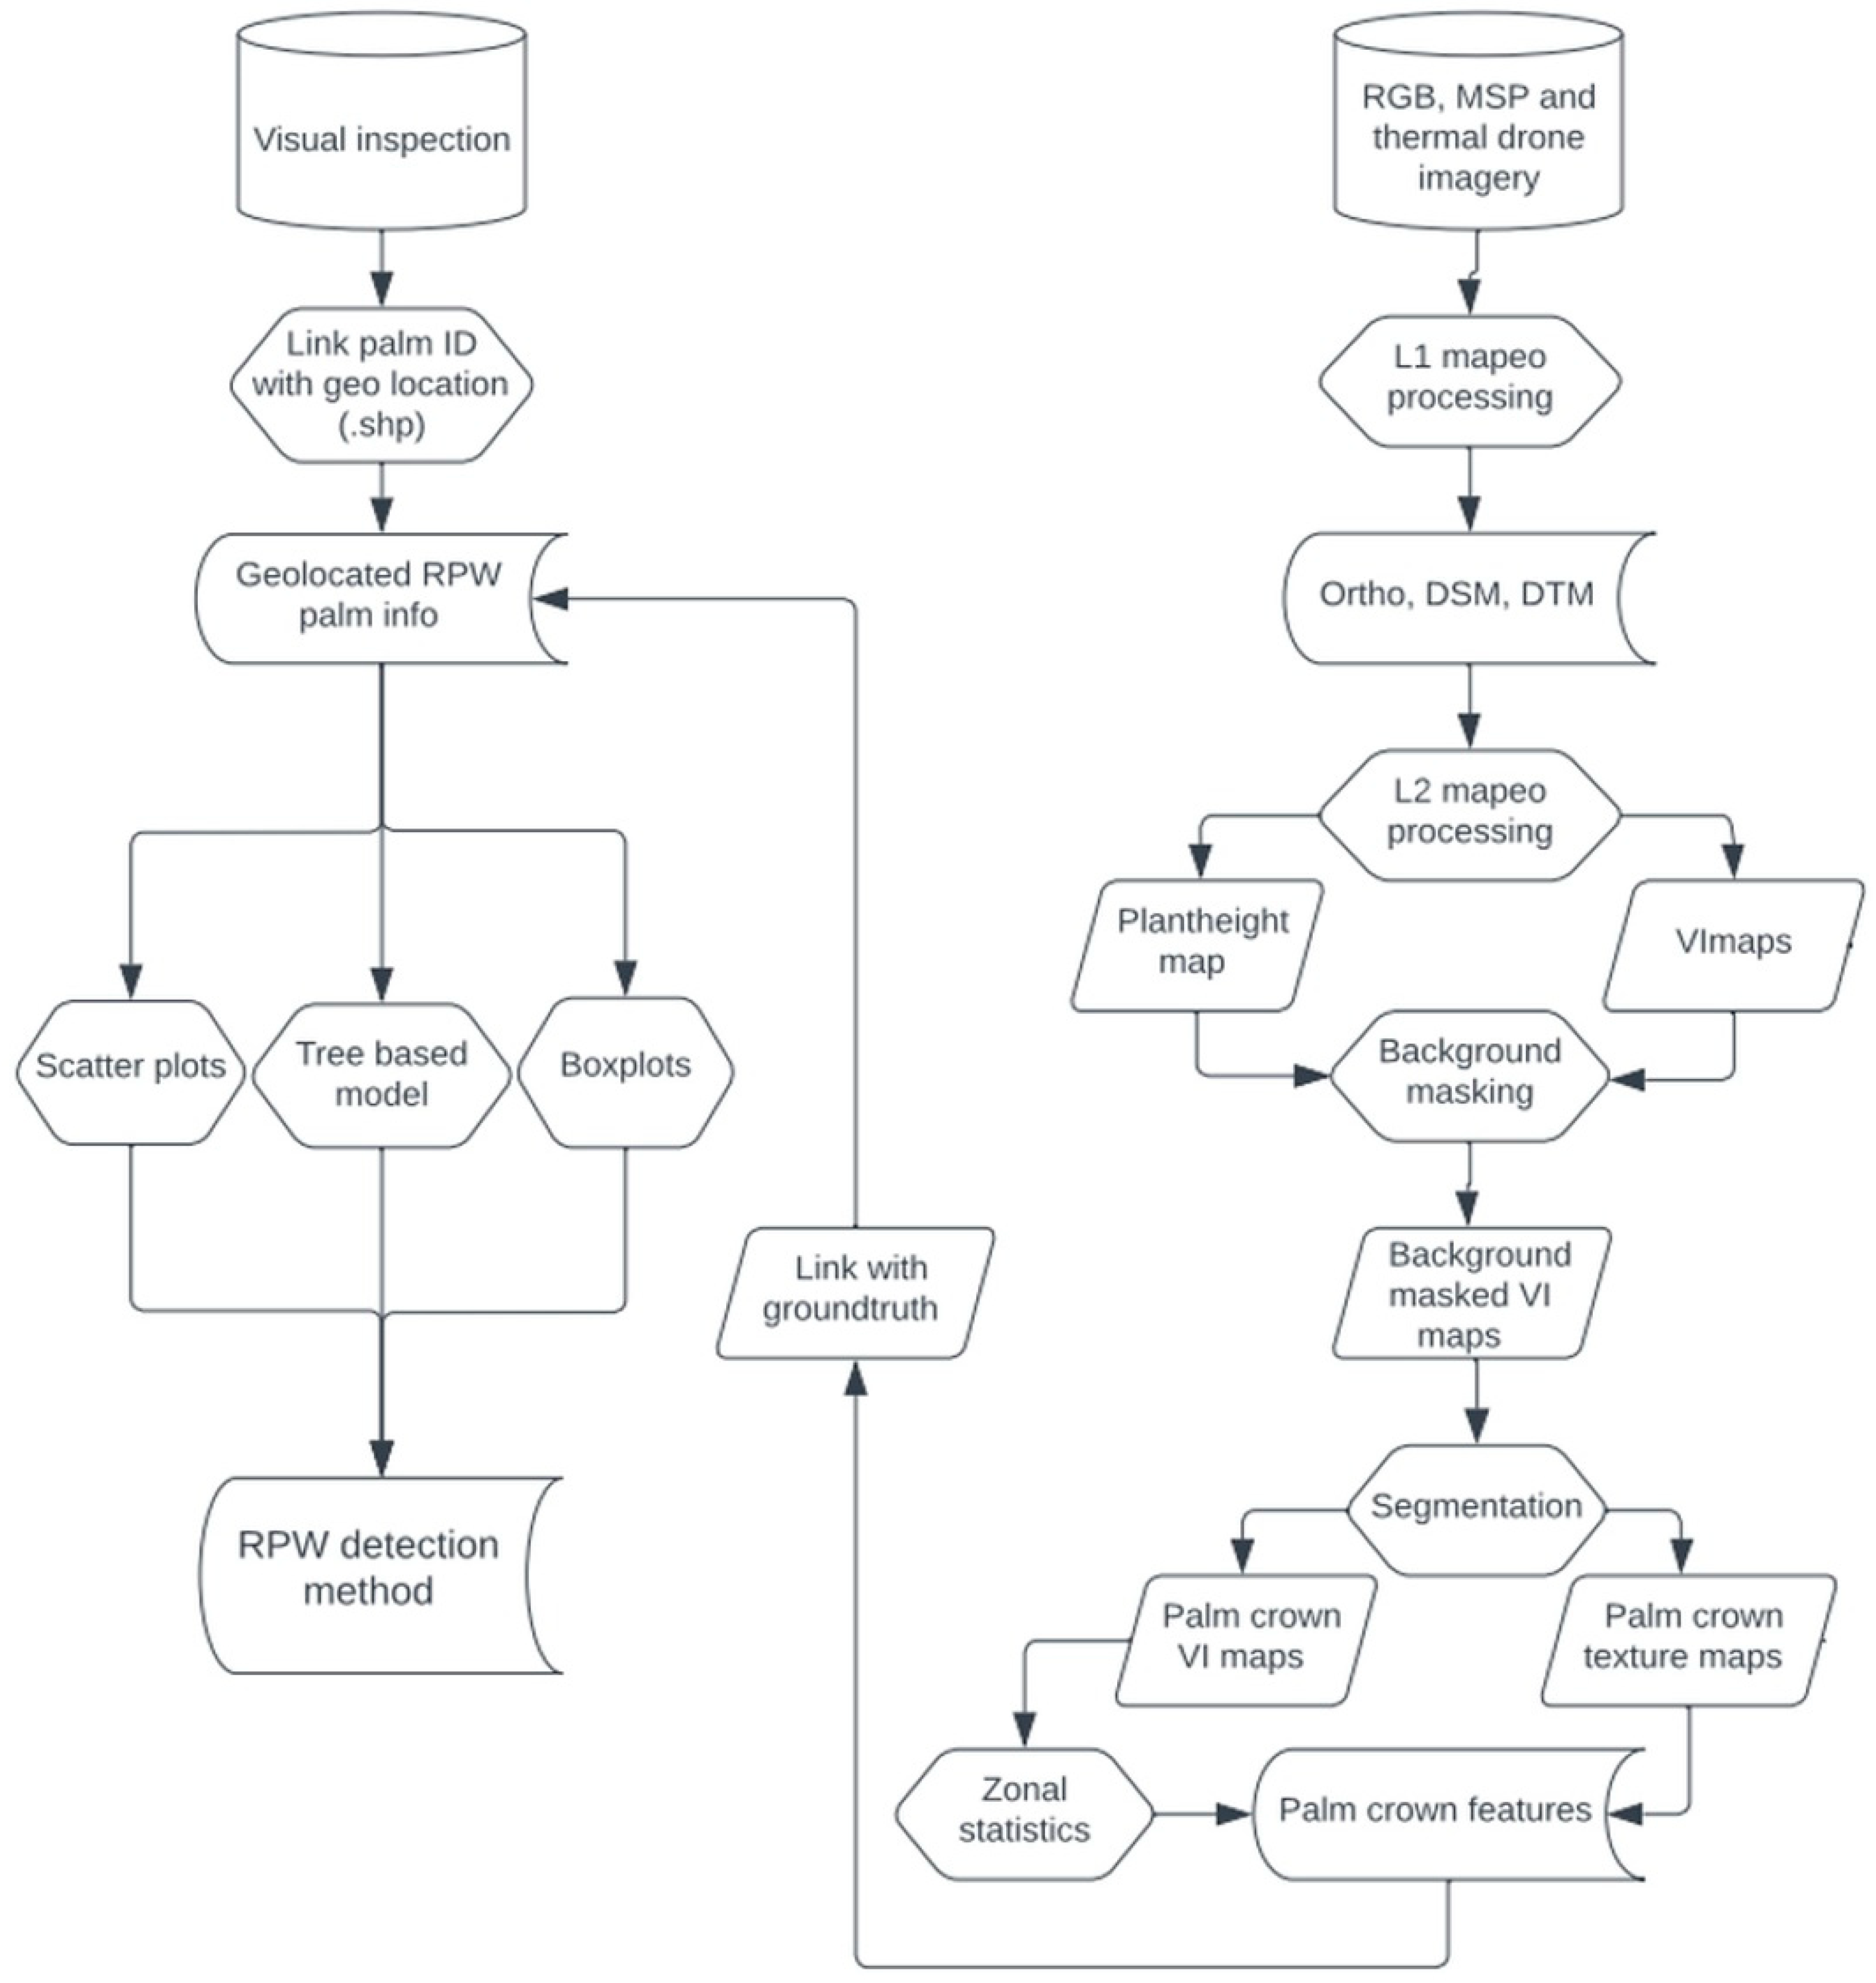
Figure 5.
(left) Two pictures from November 2020: Chewed fiber, oozing, presence of larvae and adults two and half months after the first infestation. (right) Two pictures from May 2021: more cocoons, more and deeper holes, more chewed fiber, noise produced by the larvae easy to detect.
Figure 5.
(left) Two pictures from November 2020: Chewed fiber, oozing, presence of larvae and adults two and half months after the first infestation. (right) Two pictures from May 2021: more cocoons, more and deeper holes, more chewed fiber, noise produced by the larvae easy to detect.
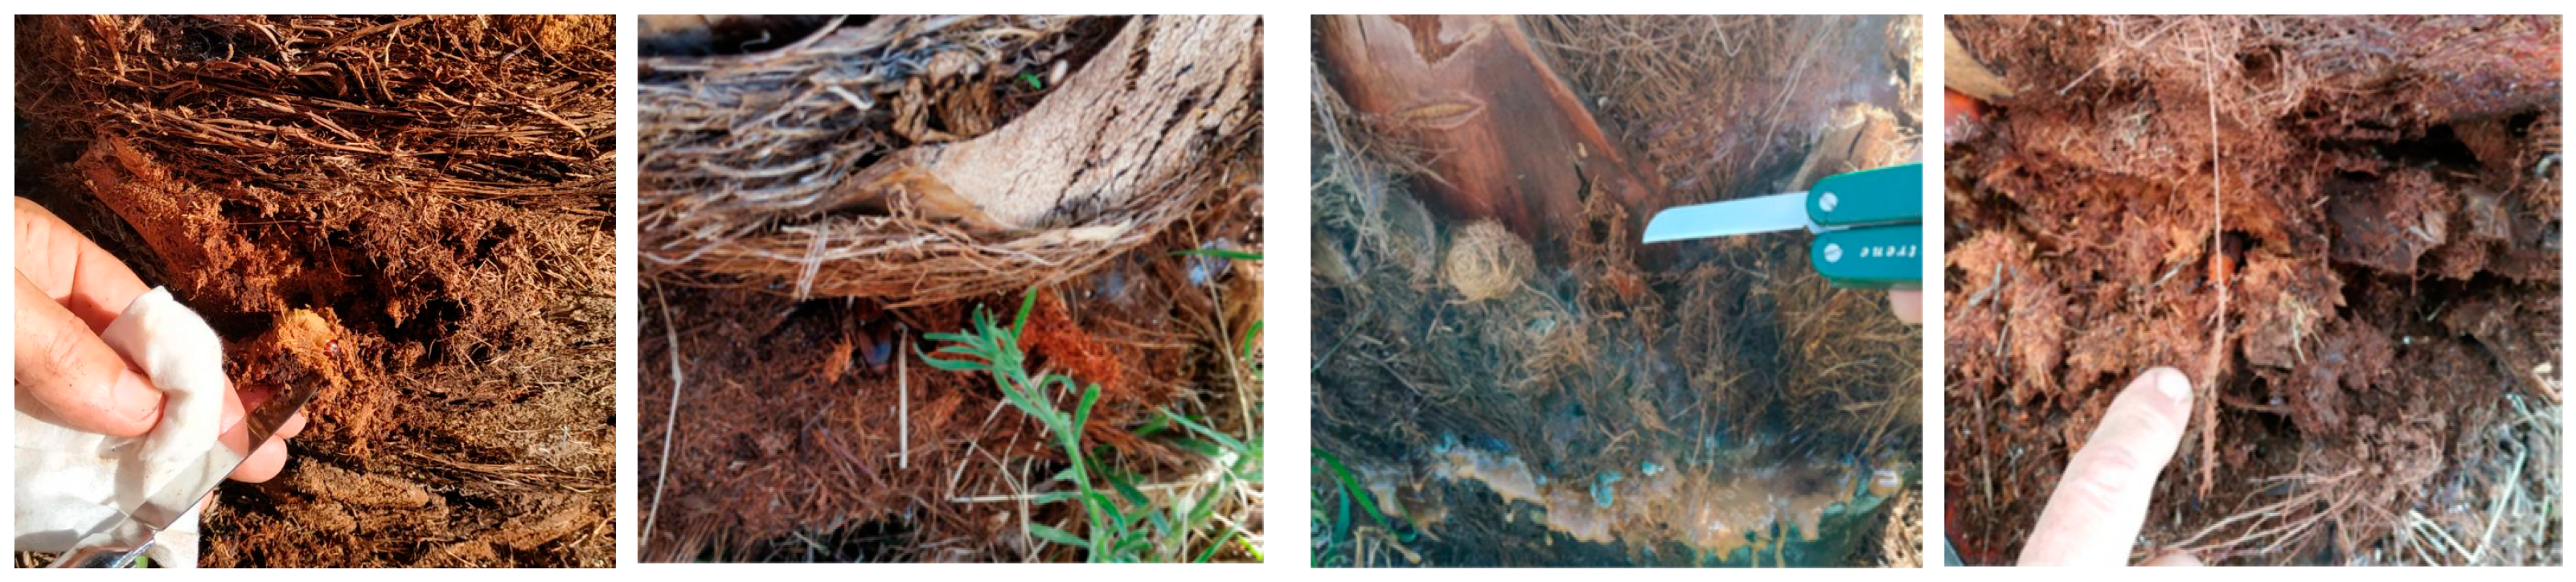
Figure 6.
(left) Two pictures from the 21st of September: A lot of chewed fiber, big holes, many cocoons and adults, visible symptoms at the crown level; (right) Two pictures of the dissection of the infested palms.
Figure 6.
(left) Two pictures from the 21st of September: A lot of chewed fiber, big holes, many cocoons and adults, visible symptoms at the crown level; (right) Two pictures of the dissection of the infested palms.
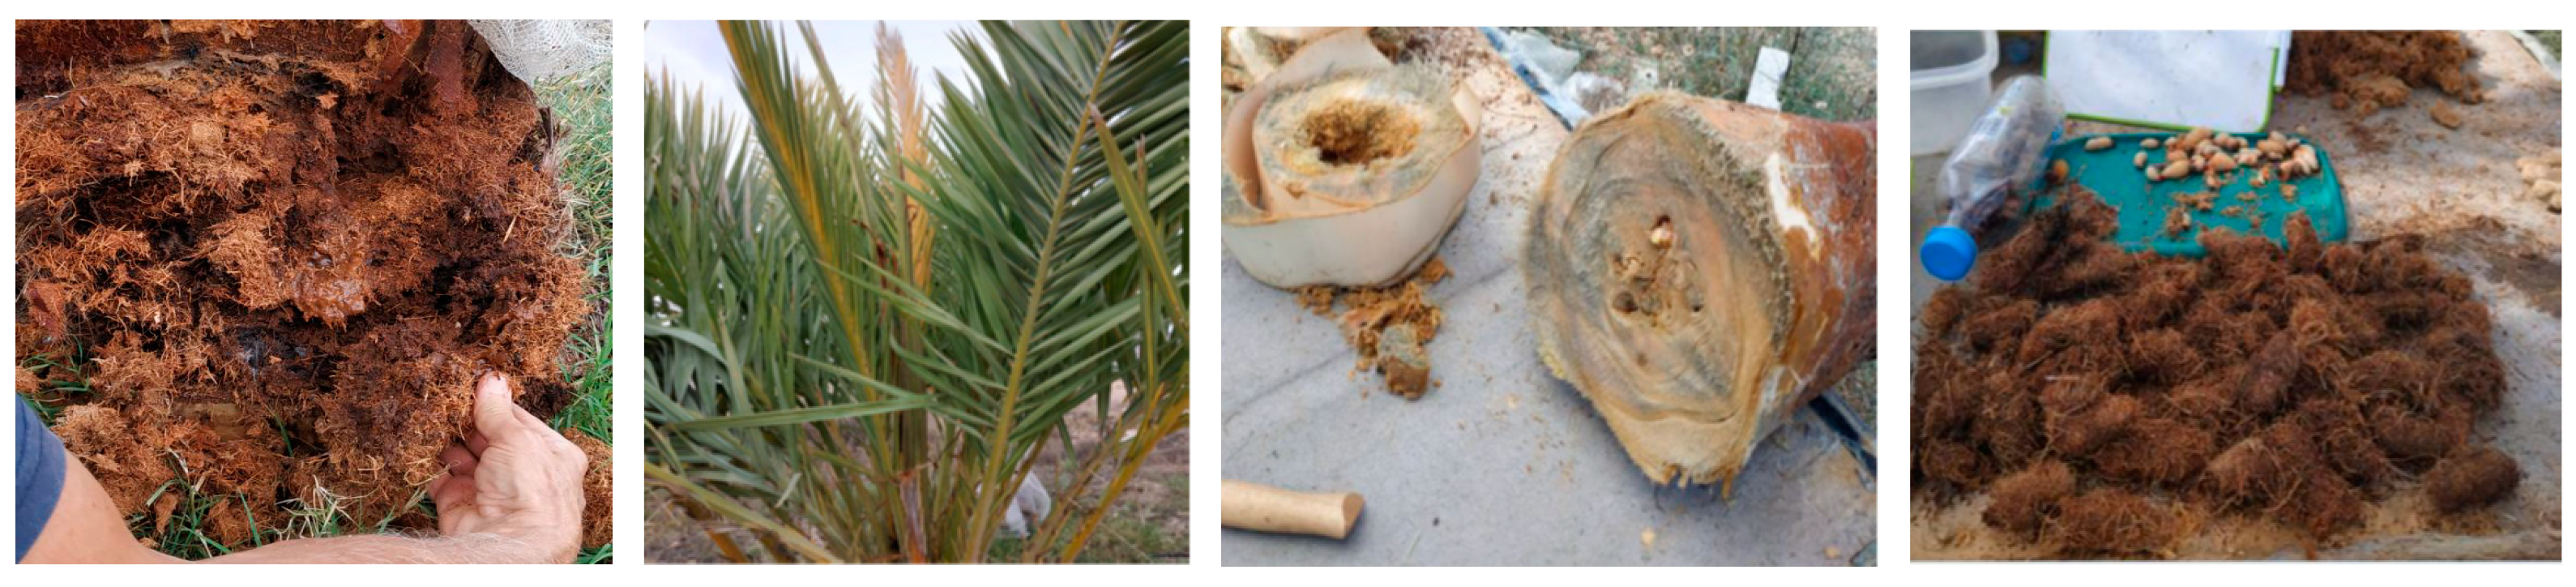
Figure 7.
(Left) Palm (No. 30) segmentation result based on CHM threshold of 0.4 m (06/09/2021); (center) NDRE vegetation index calculated on the palm crown pixels; (right) mean NDRE ring statistics.
Figure 7.
(Left) Palm (No. 30) segmentation result based on CHM threshold of 0.4 m (06/09/2021); (center) NDRE vegetation index calculated on the palm crown pixels; (right) mean NDRE ring statistics.
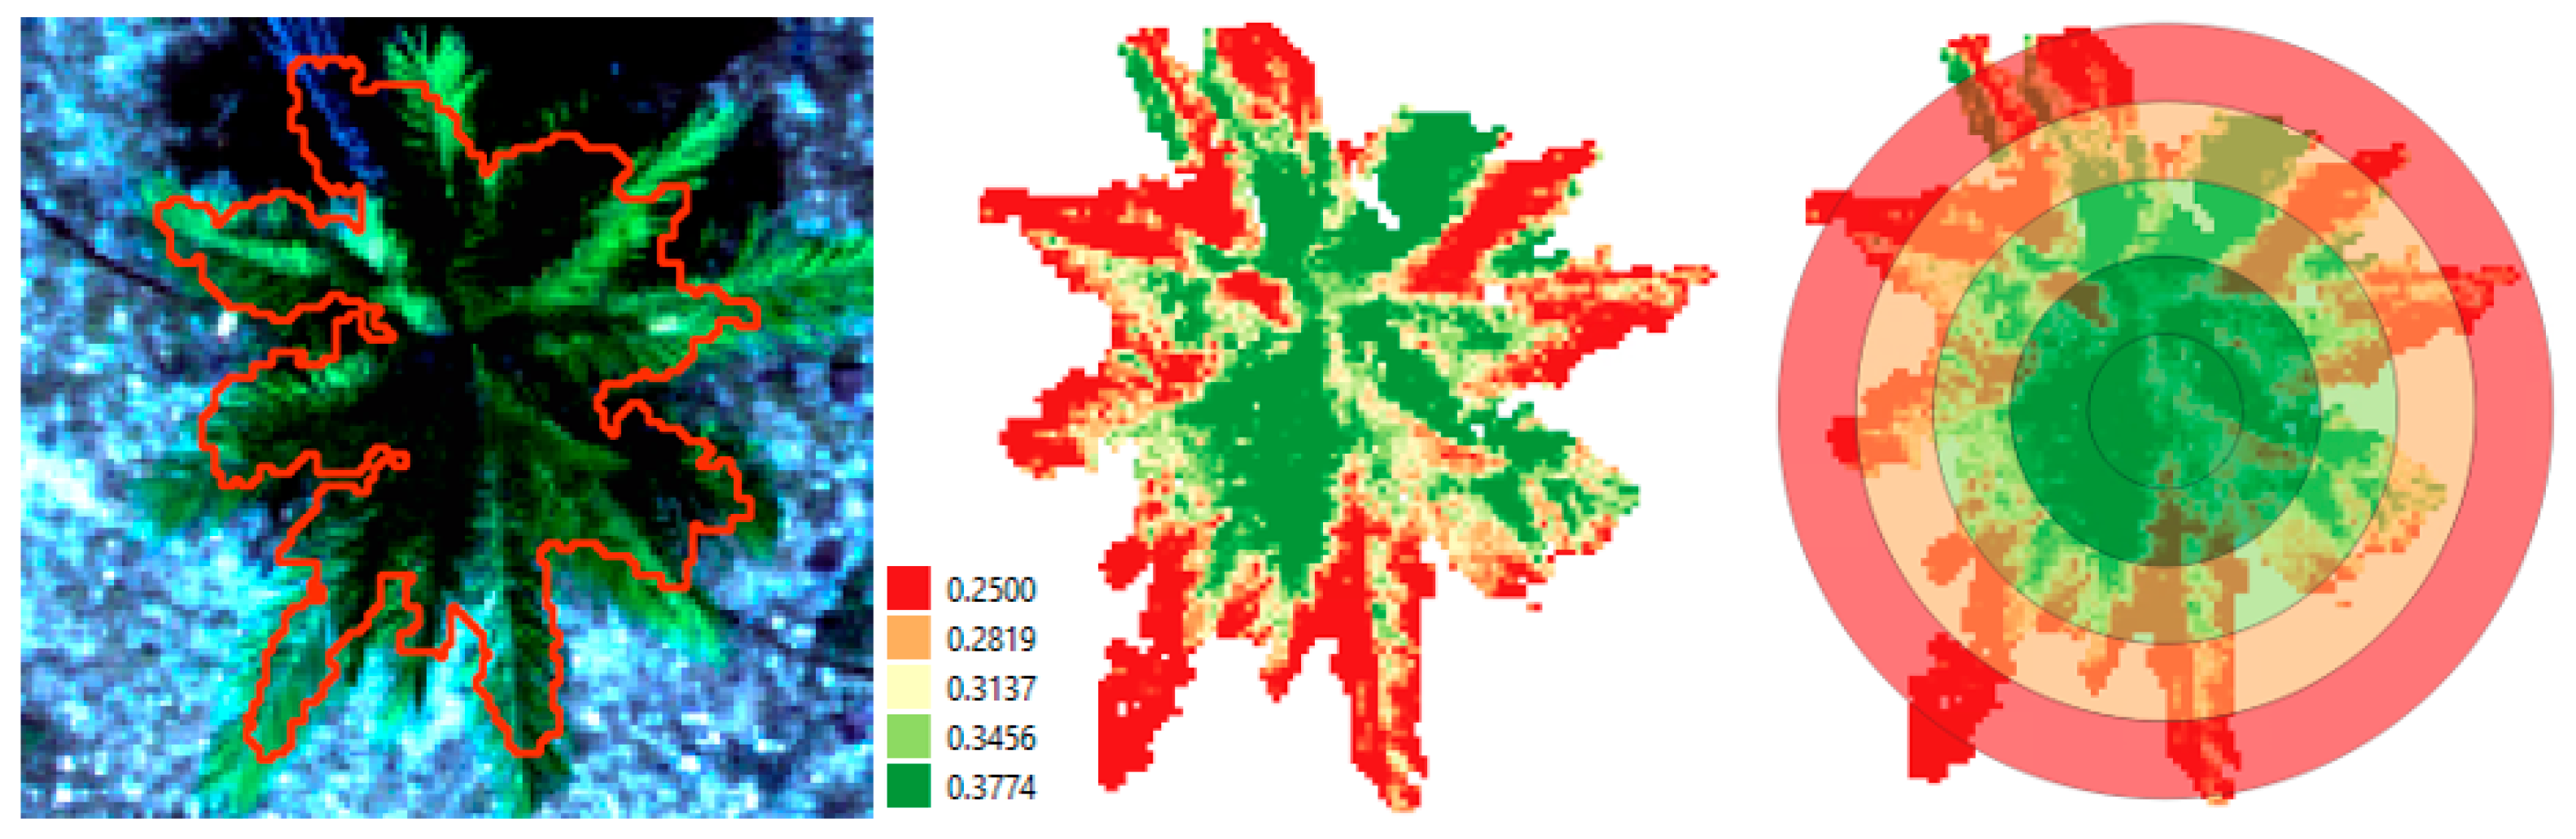
Figure 8.
Boxplots of median NDRE ring values for all inner rings (left) and the whole canopy (right) for September and December 2020, June, July, and September 2021 (red: infested, green: non-infested). Outliers are indicated with little circles.
Figure 8.
Boxplots of median NDRE ring values for all inner rings (left) and the whole canopy (right) for September and December 2020, June, July, and September 2021 (red: infested, green: non-infested). Outliers are indicated with little circles.
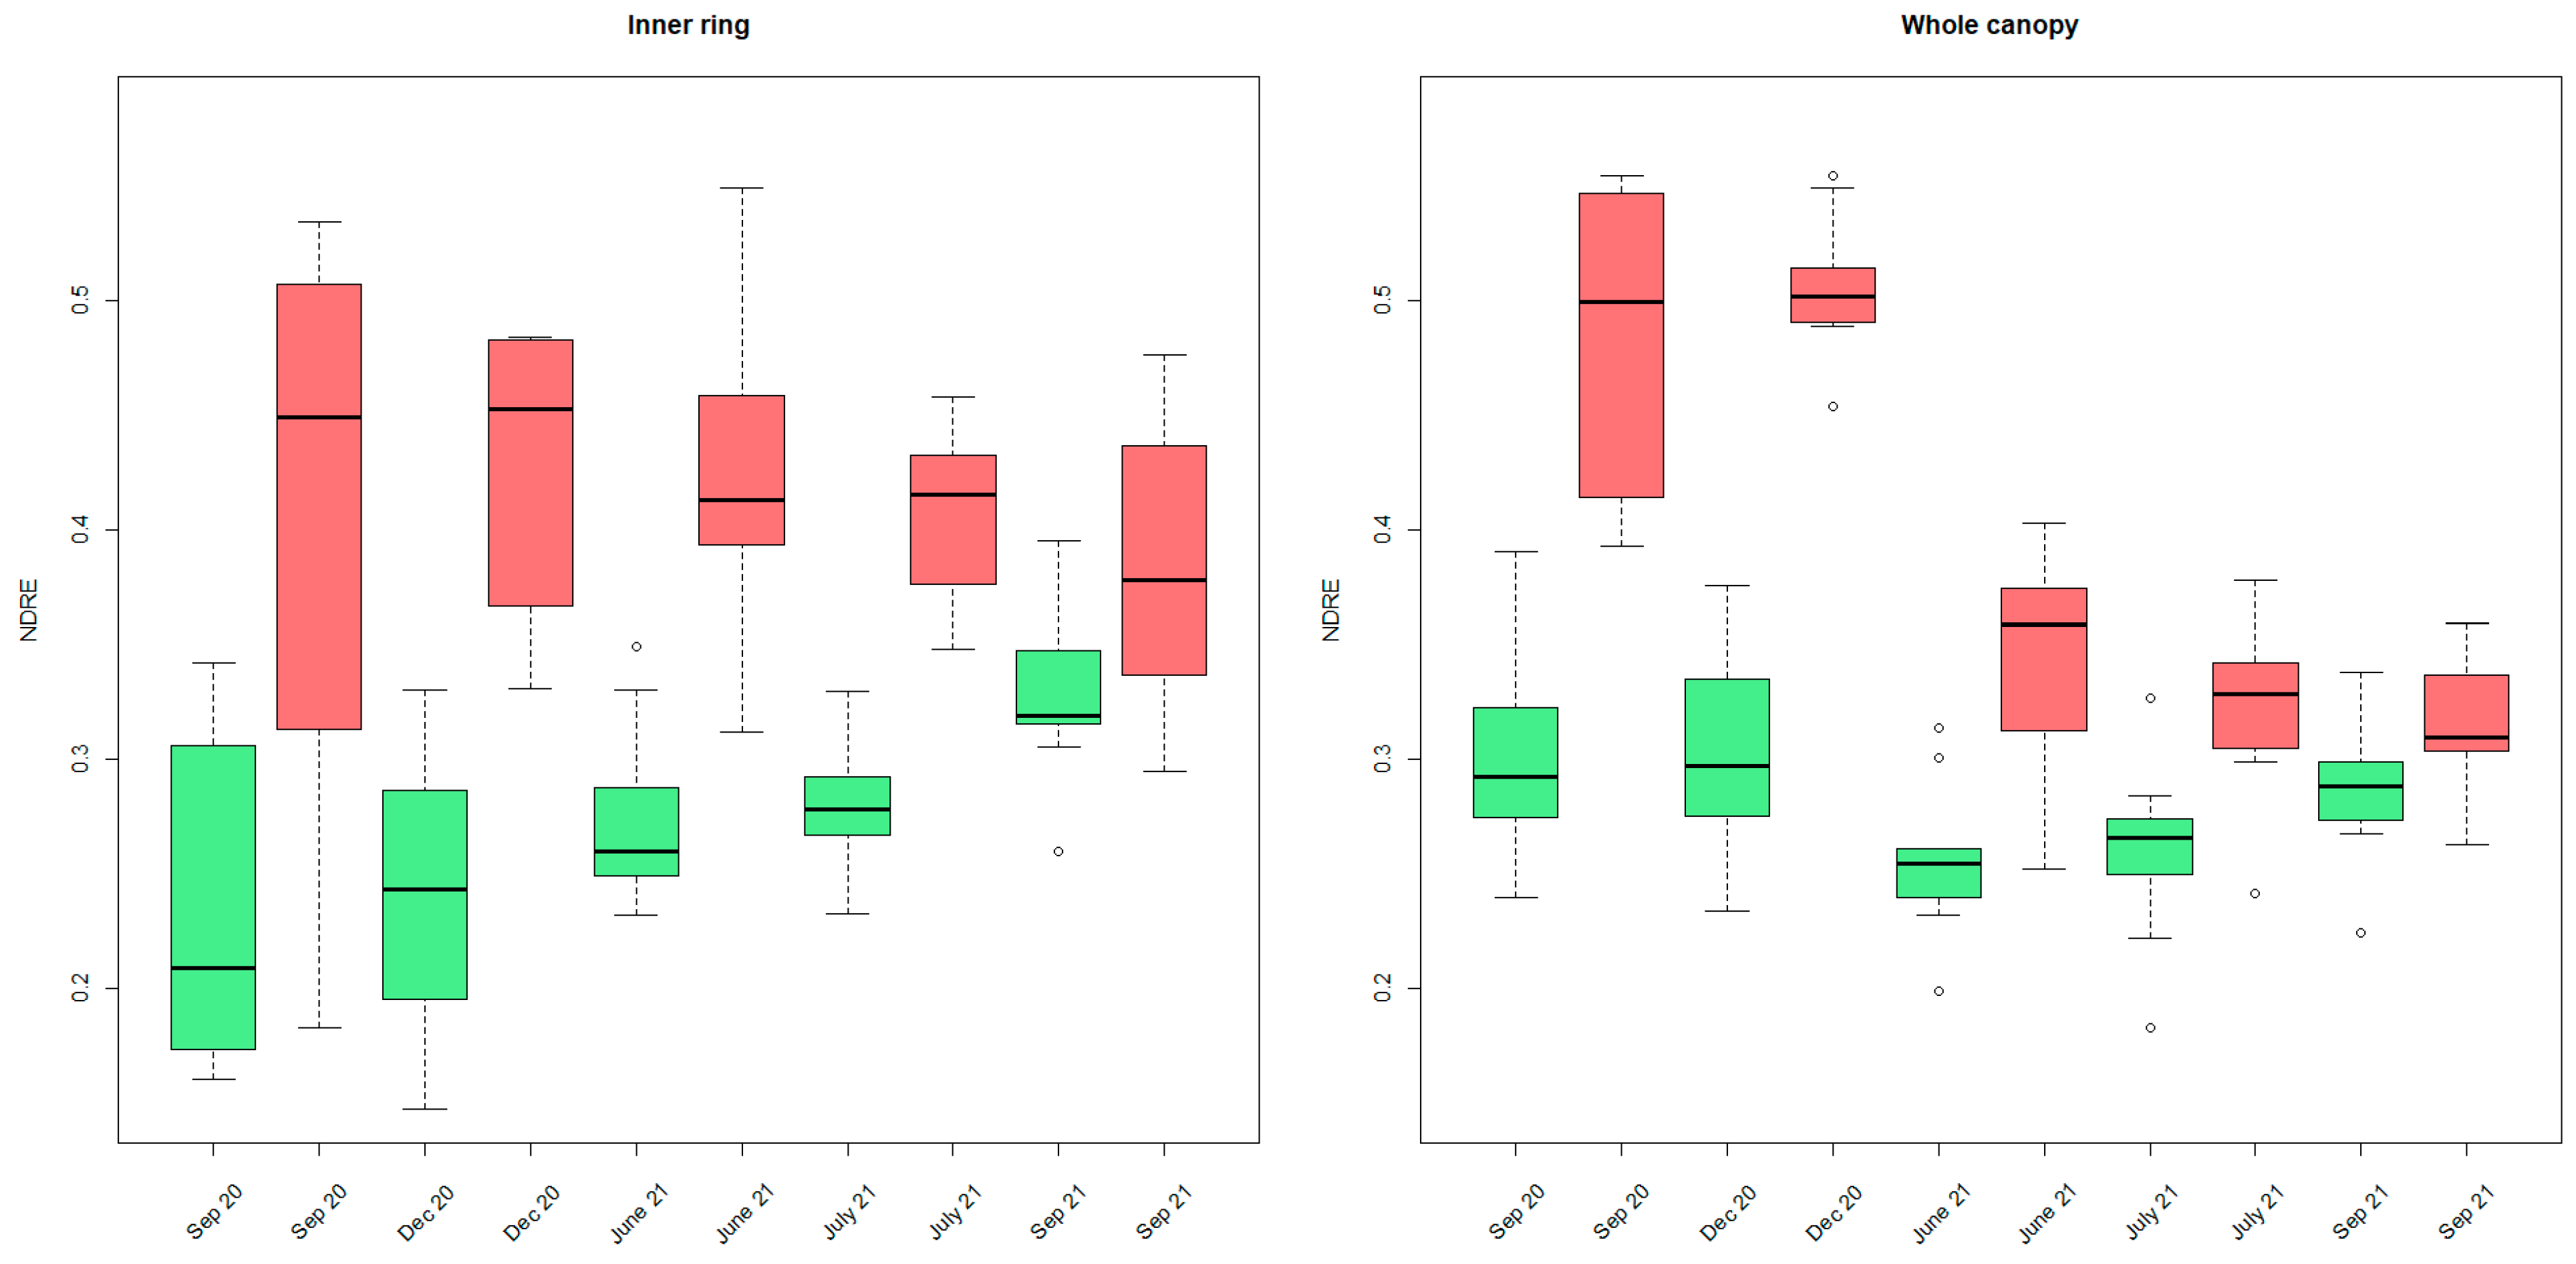
Figure 9.
Boxplot of median NDRE ring values for inner to outer canopy rings for July 2021 (red: infested, green: non-infested). Outliers are presented by little circles.
Figure 9.
Boxplot of median NDRE ring values for inner to outer canopy rings for July 2021 (red: infested, green: non-infested). Outliers are presented by little circles.
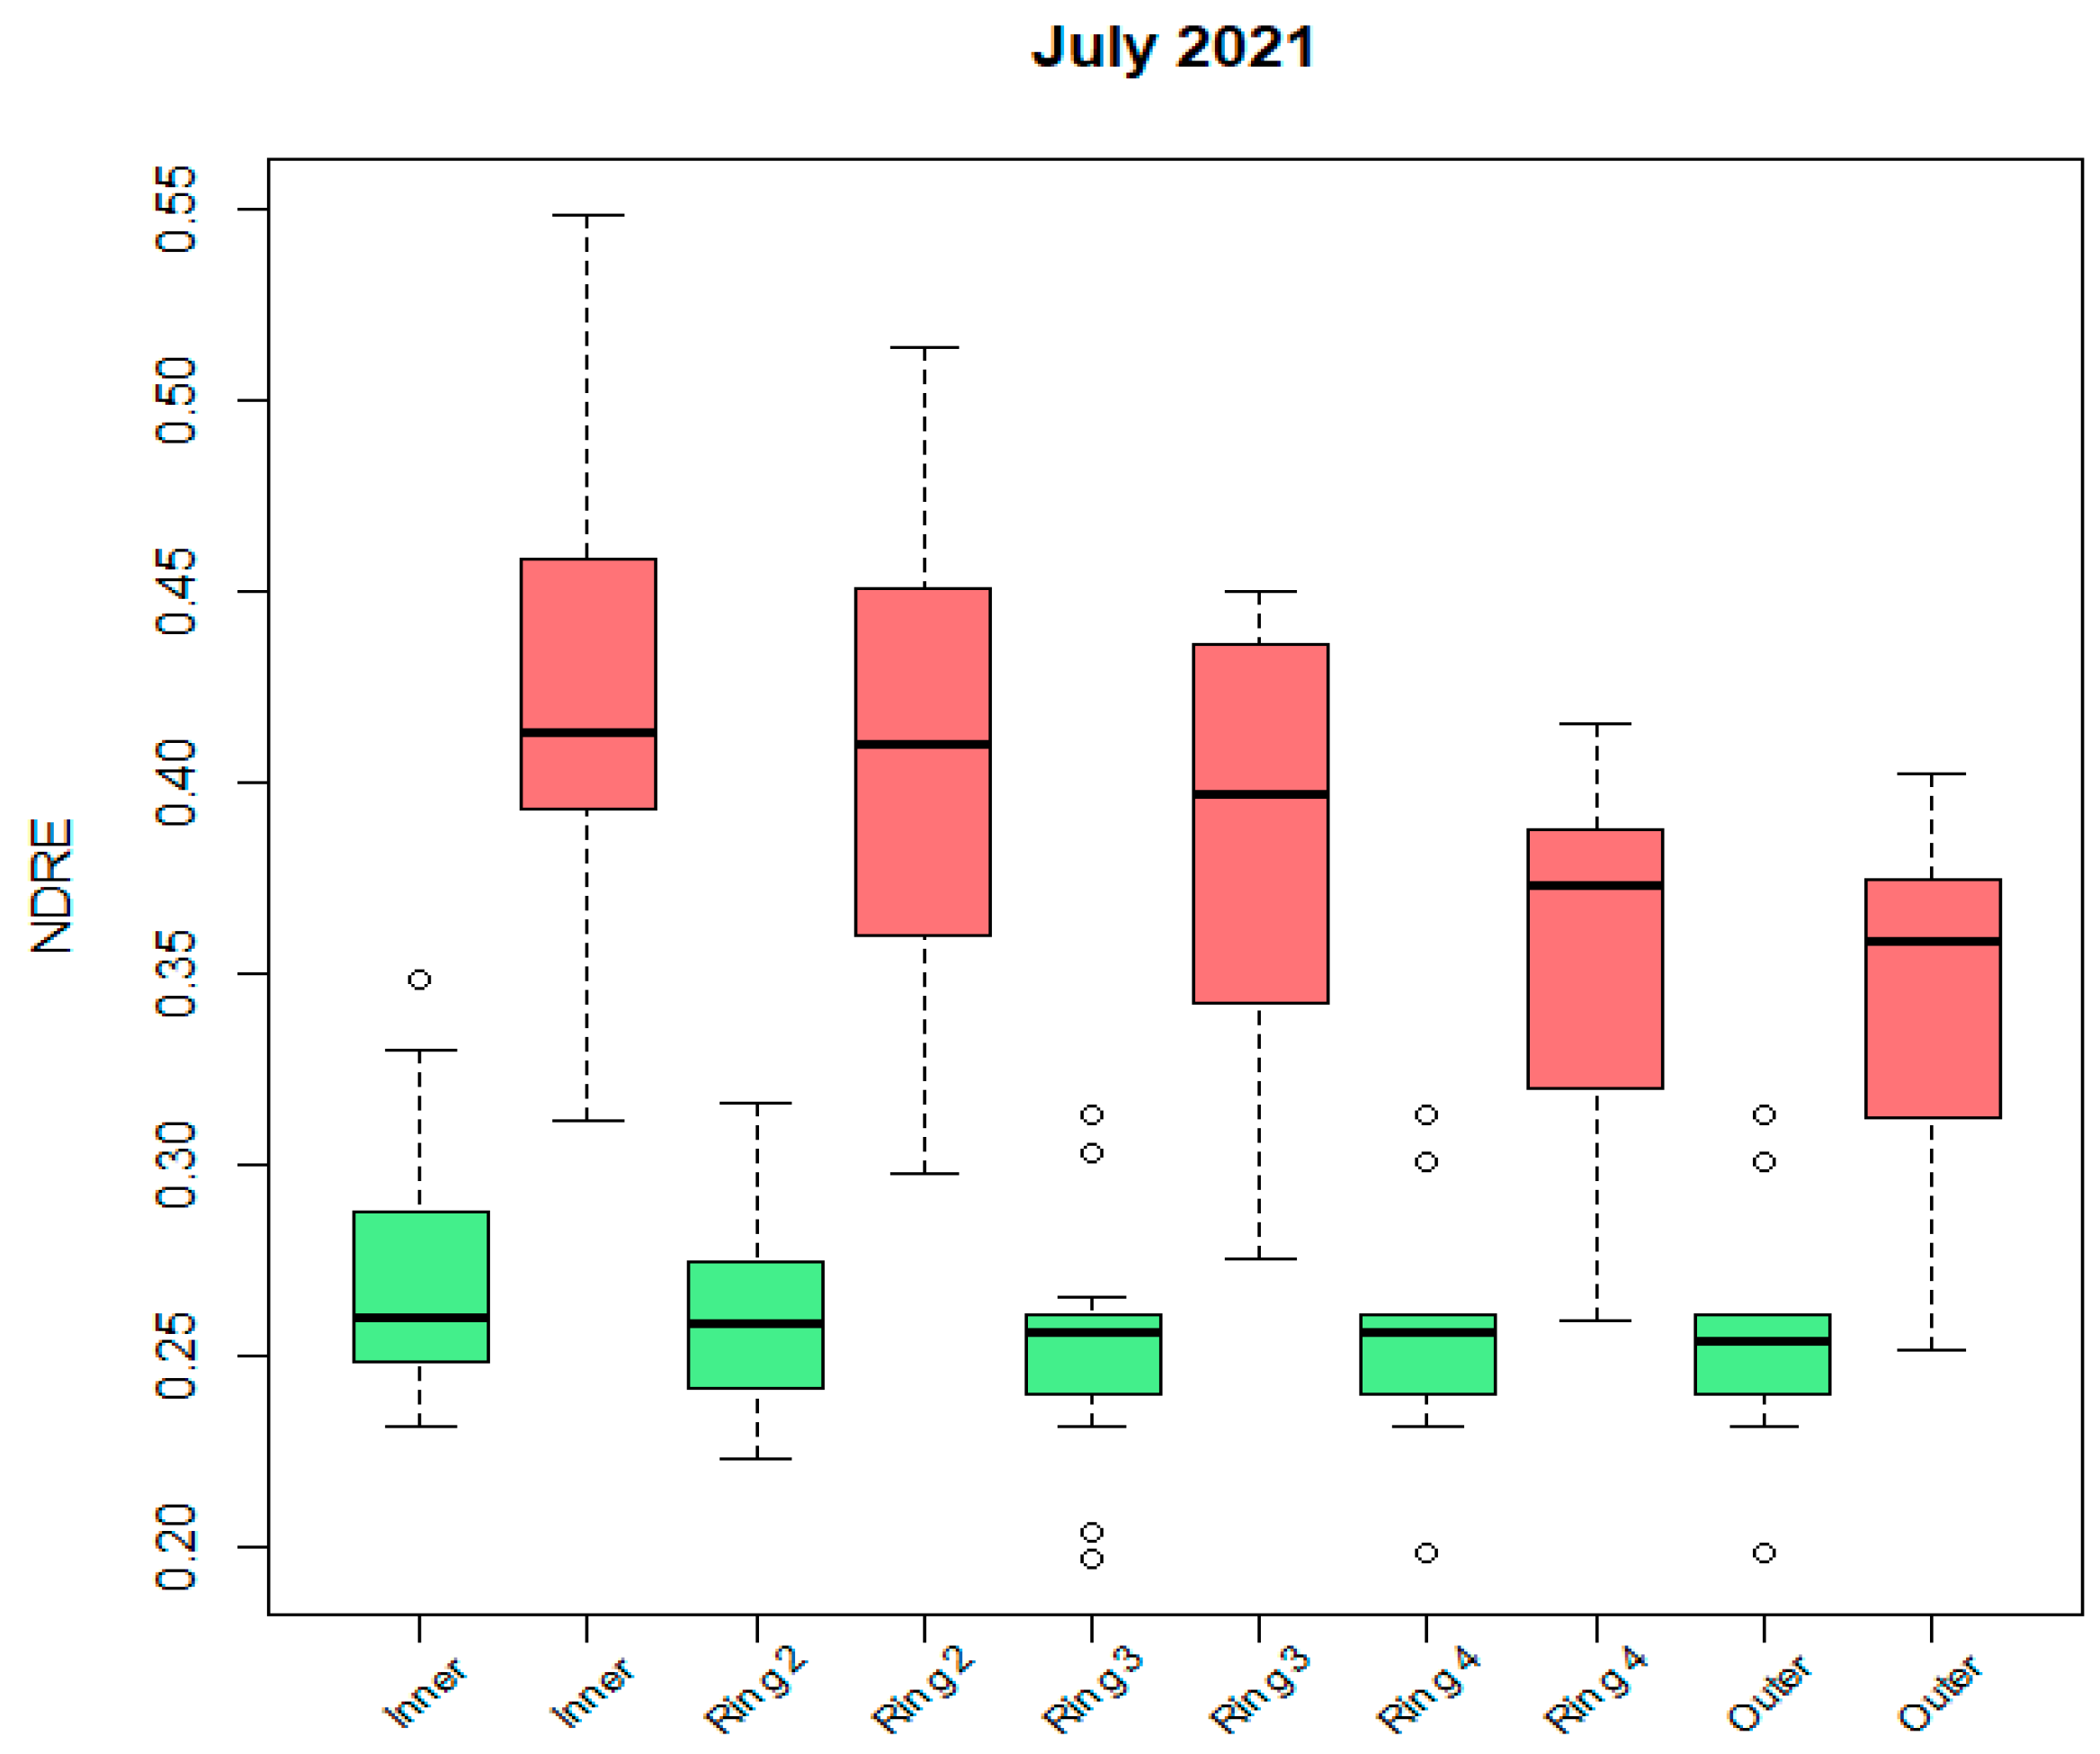
Figure 10.
RGB orthophoto (6 September 2021) overlaid with median NDRE ring values. A graduate color scale from red to green was applied, with green circles corresponding to high NDRE and red circles corresponding to low NDRE values. Dashed red boxes indicate infested palms.
Figure 10.
RGB orthophoto (6 September 2021) overlaid with median NDRE ring values. A graduate color scale from red to green was applied, with green circles corresponding to high NDRE and red circles corresponding to low NDRE values. Dashed red boxes indicate infested palms.
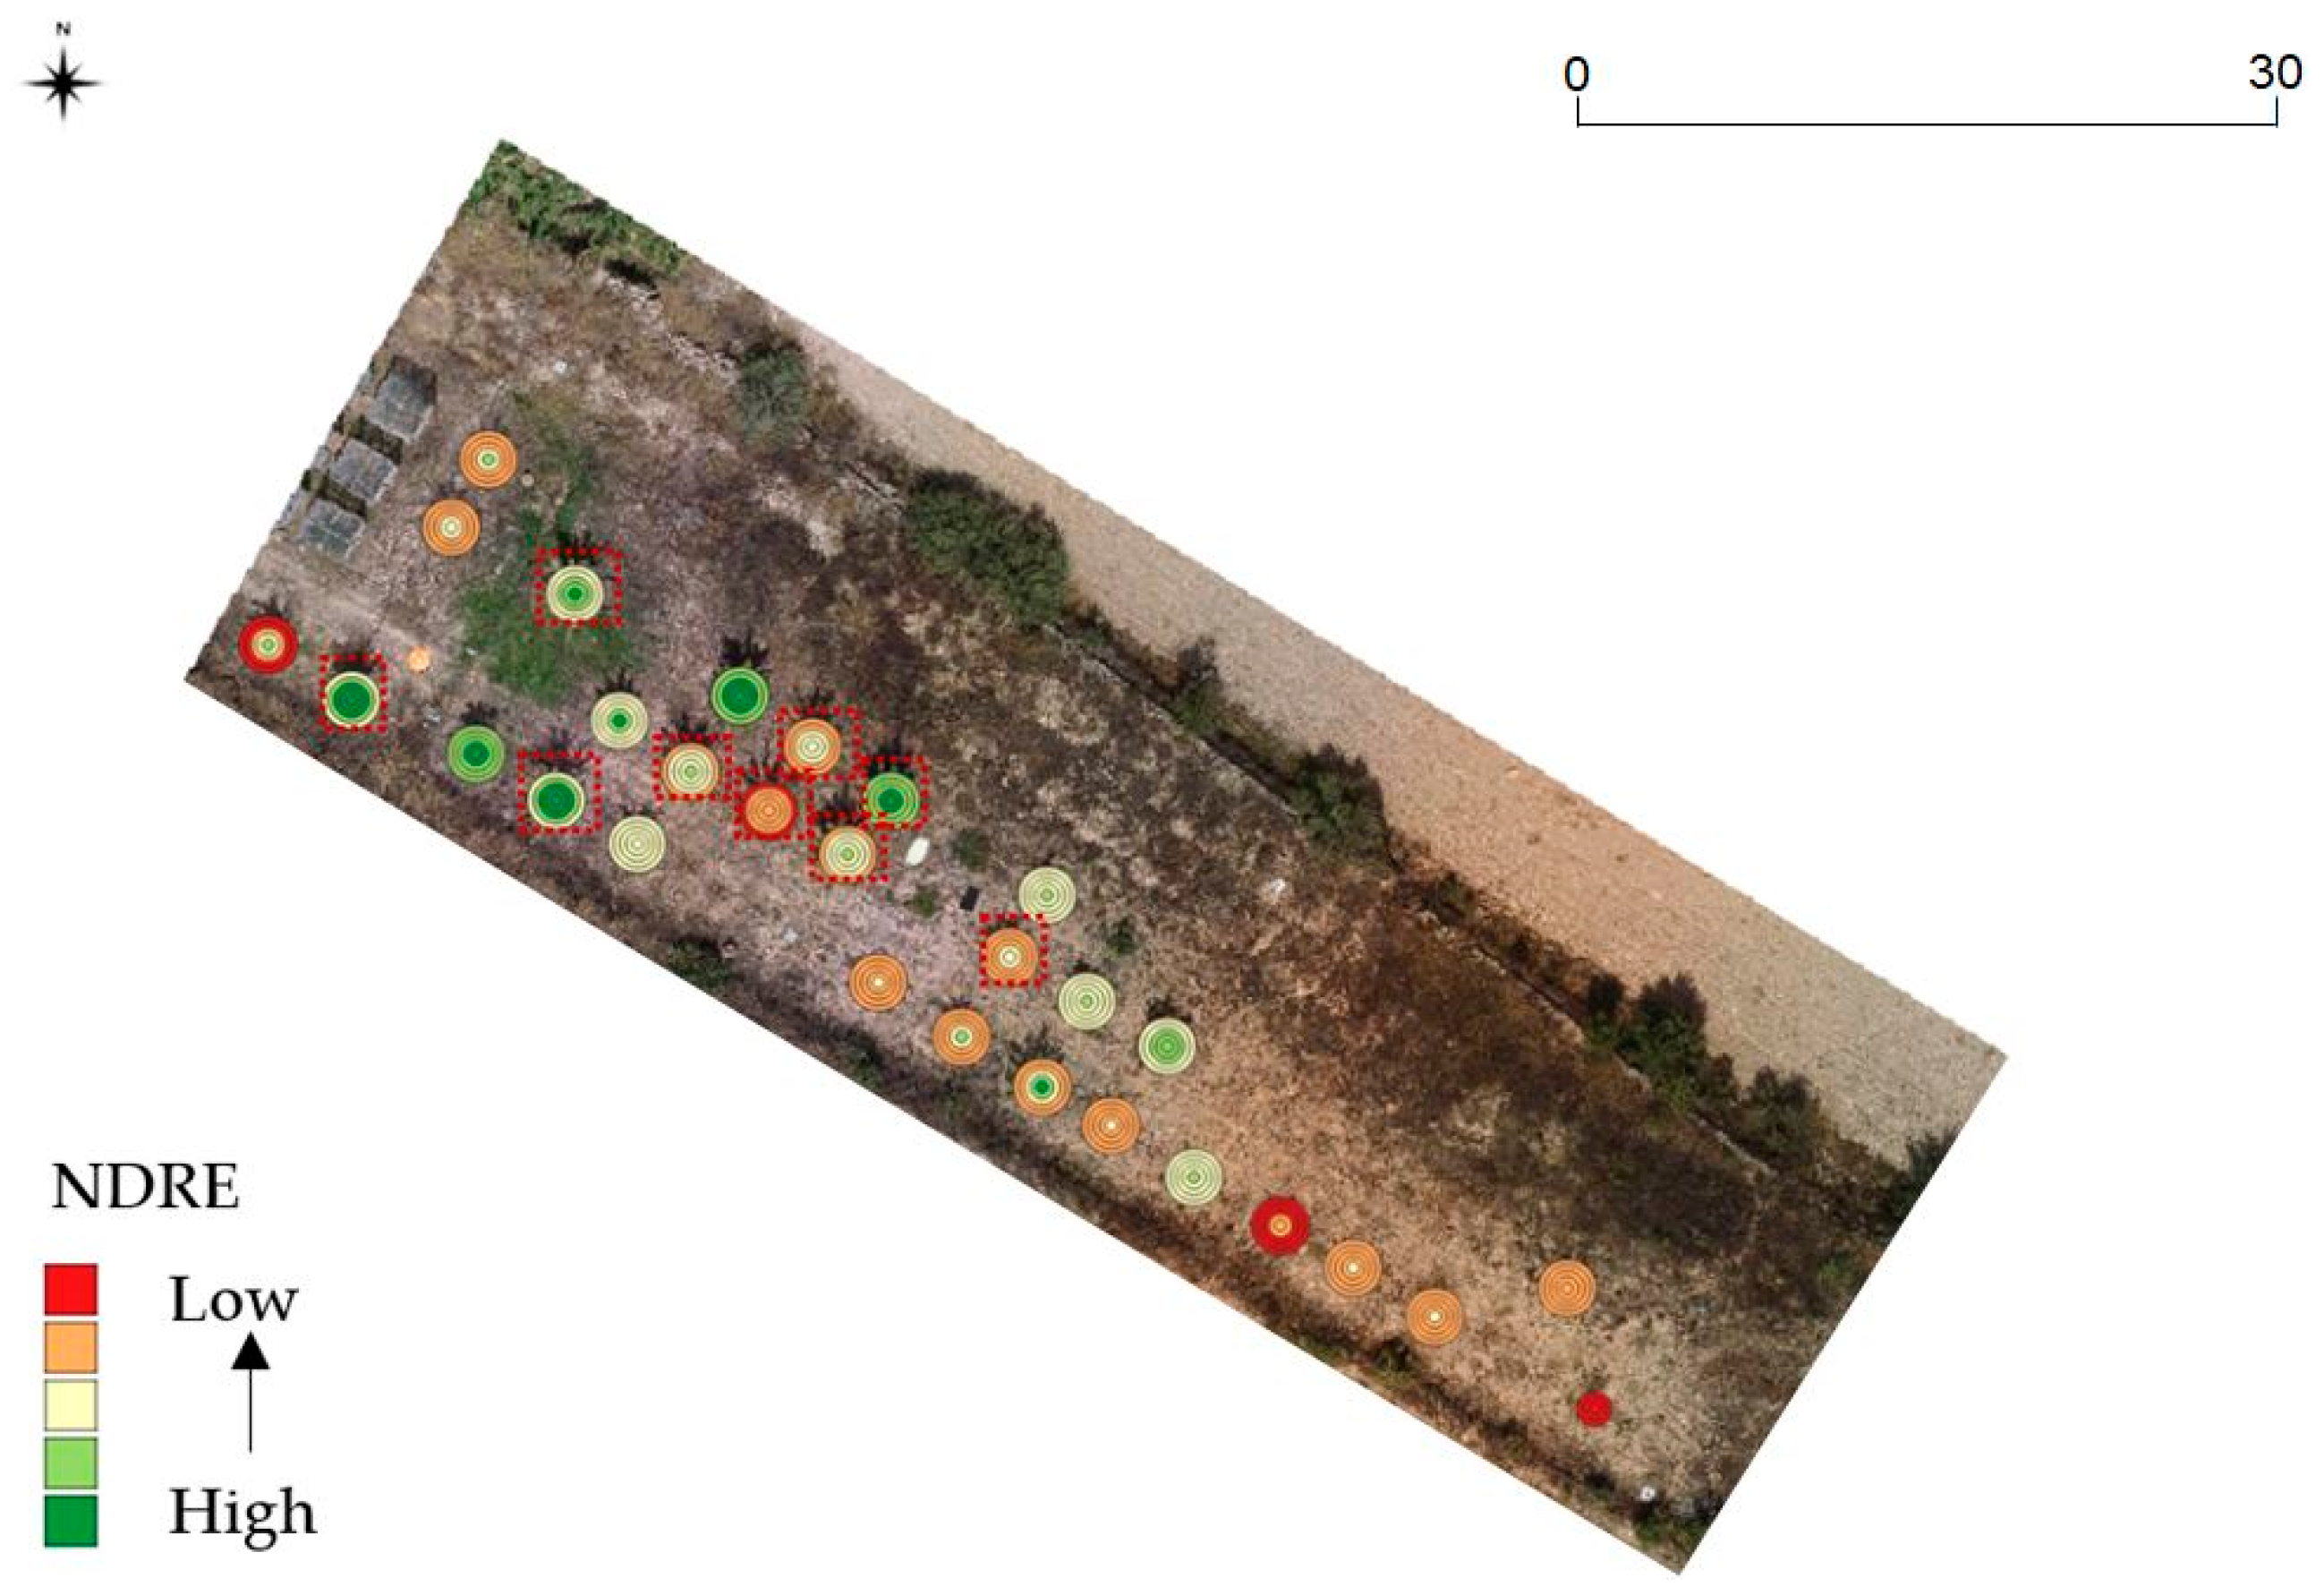
Figure 11.
Boxplot showing the RCC index values of July 2021 for non-infested (remaining palms of the first experiment (left); Medjool variety (center), and infested (Medjool variety (right)) palms.
Figure 11.
Boxplot showing the RCC index values of July 2021 for non-infested (remaining palms of the first experiment (left); Medjool variety (center), and infested (Medjool variety (right)) palms.

Figure 12.
Boxplots of (top) the maximum temperatures in the palm canopies (from left to right: June, July, and September 2021) and (bottom) the variance of the temperature in the palm canopies (from left to right: June, July, and September 2021) for non-infested (remaining palms of the first experiment (green); Medjool variety (yellow)) and infested (Medjool variety (orange)) palms. Black dots represent outliers.
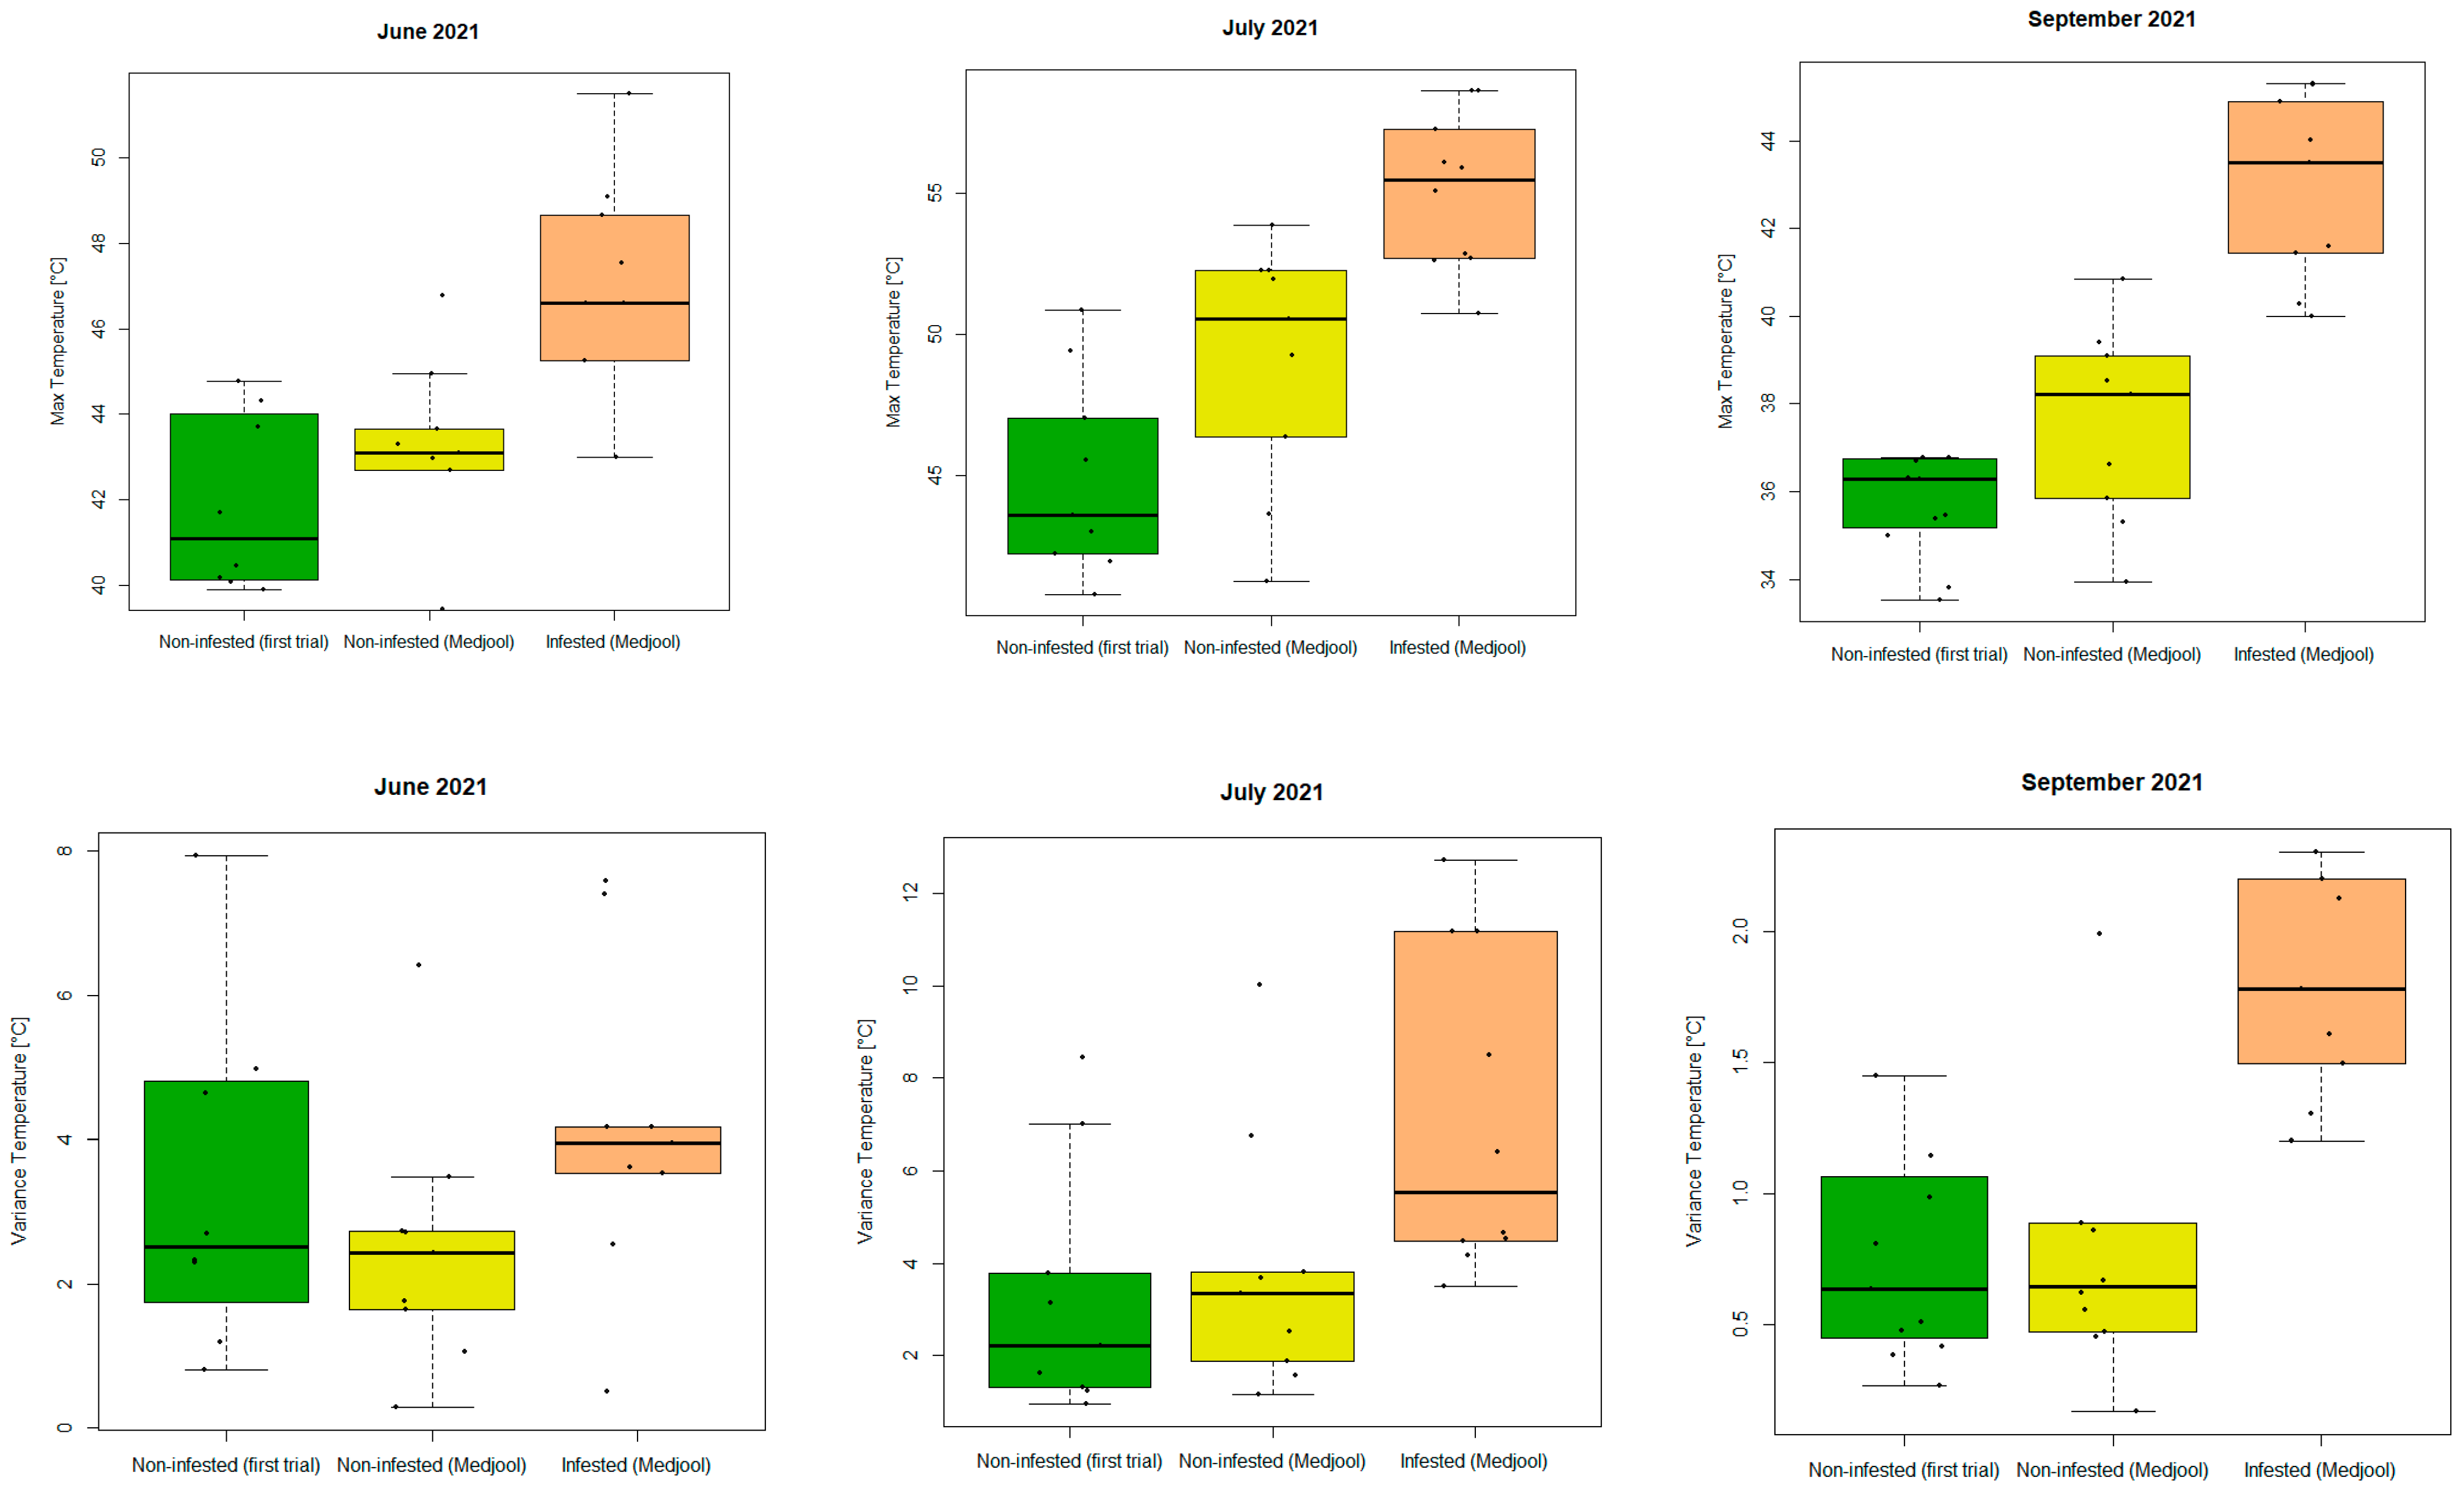
Figure 13.
A screenshot of the Mapeo® visualization platform on which all processed data is available. The current view shows the orthophoto of 6 September 2021 overlaid with the segmented canopy NDRE values.
Figure 13.
A screenshot of the Mapeo® visualization platform on which all processed data is available. The current view shows the orthophoto of 6 September 2021 overlaid with the segmented canopy NDRE values.


Table 1.
Overview of the UAV flight campaigns and the acquired imagery.
| Acquisition Date | RGB | Multispectral | Thermal |
|---|---|---|---|
| 29/9/2020 | ✓ | ✓ | No sensor available |
| 15/12/2020 | ✓ | ✓ | No sensor available |
| 11/05/2021 | Bad weather | Bad weather | Bad weather |
| 23/06/2021 | ✓ | ✓ | ✓ |
| 22/07/2021 | ✓ | ✓ | ✓ |
| 06/09/2021 | ✓ | ✓ | ✓ |
Table 2.
UAV sensor characteristics.
| Sequoia | |||
| Lens | Bandwidth | Central Wavelength | Resolution |
| Green | 40 nm | 550 nm | 1280 × 960 |
| Red | 40 nm | 660 nm | 1280 × 960 |
| Red-edge | 10 nm | 735 nm | 1280 × 960 |
| NIR | 40 nm | 790 nm | 1280 × 960 |
| RGB | 4608 × 3456 | ||
| Micasense RedEdge-MX | |||
| Lens | Bandwidth | Central Wavelength | Resolution |
| Blue | 20 nm | 475 nm | 1280 × 960 |
| Green | 20 nm | 560 nm | 1280 × 960 |
| Red | 10 nm | 668 nm | 1280 × 960 |
| Red-edge | 10 nm | 717 nm | 1280 × 960 |
| NIR | 40 nm | 840 nm | 1280 × 960 |
| Zenmuse FC350 | |||
| RGB | 1280 × 960 | ||
| FLIR Duo Pro R | |||
| Thermal | 7.5–13.5 μm | 640 × 512 | |
Table 3.
List of calculated vegetation indices with formula and citations.
| Acronym | Indices | Definition | Author |
|---|---|---|---|
| RCC | Red Chromatic Coordinate index | R/(R + G + B) | [34] |
| GCC | Green Chromatic Coordinate index | G/(R + G + B) | [34] |
| BCC | Blue Chromatic Coordinate index | B/(R + G + B) | [34] |
| ExG | Excess green index | 2G − B − R | [34] |
| ExG2 | Excess Green Index v2 | (2G − B − R)/(R + G + B) | [34] |
| ExR | Excess Red Index | (1.4R − G)/(R + G + B) | [35] |
| ExGR | Excess Green minus Excess Red | ExG2 − ExR | [35] |
| GRVI | Green Red vegetation index | (G − R)/(G + R) | [36,37] |
| GBVI | Green Blue Vegetation Index | (G − B)/(G + B) | [38] |
| BRVI | Blue Red Vegetation Index | (B − R)/(B + R) | [38] |
| GR | Simple red–green ratio | G/R | [39] |
| G_R | Green-Red Difference | G − R | [38] |
| B_G | Blue-Green Difference | B − G | [38] |
| VDVI | Visible-band Difference Vegetation Index | (2G − R − B)/(2G + R + B) | [40] |
| VARI | Visible atmospherically resistant index | (G − R)/(G + R − B) | [37] |
| MGRVI | Modified green–red vegetation index | (G^2 − R^2)/(G^2 + R^2) | [41] |
| CIVE | Colour Index Of Vegetation | 0.441R − 0.881G + 0.385B + 18.787 | [40] |
| VEG | Vegetative Index | G/(R^(0.667)*B^(0.334)) | [42] |
| WI | Woebbecke Index | (G − B)/(R − G) | [34] |
| CLG | Green-band Chlorophyll Index | (RE/G) − 1 | [43] |
| CTVI | Corrected Transformed Vegetation Index | ((NDVI + 0.5)/abs(NDVI + 0.5))*sqrt(abs(NDVI + 0.5)) | [44] |
| EVI2 | Two-band Enhanced Vegetation Index | G * (NIR − R)/(NIR + 2.4R +1) | [45] |
| GEMI | Global Environmental Monitoring Index | (((NIR^2 − R^2) * 2 + (NIR * 1.5) + (R * 0.5) )/(NIR + R + 0.5)) * (1 − ((((NIR^2 − R^2) * 2 + (NIR * 1.5) + (R * 0.5) )/(NIR + R + 0.5)) * 0.25)) − ((R − 0.125)/(1 − R)) | [46] |
| GNDVI | Green Normalised Difference Vegetation Index | (NIR − G)/(NIR + G) | [47] |
| KNDVI | Kernel Normalised Difference Vegetation Index | tanh(((NIR − R)/(NIR + R)))^2 | [48] |
| MCARI | Modified Chlorophyll Absorption Ratio Index | ((RE − R) − (RE − G))*(RE/R) | [49] |
| MSAVI | Modified Soil Adjusted Vegetation Index | NIR + 0.5 − (0.5 * sqrt((2 * NIR + 1)^2 − 8 * (NIR − (2 * R)))) | [50] |
| MSAVI2 | Modified Soil Adjusted Vegetation Index 2 | (2 * (NIR + 1) − sqrt((2 * NIR + 1)^2 − 8 * (NIR − R)))/2 | [50] |
| NDVI | Normalised Difference Vegetation Index | (NIR − R)/(NIR + R) | [51] |
| NDRE | Normalised DifferenceRed Edge Index | (NIR − RE)/(NIR + RE) | [52] |
| NDWI | Normalised Difference Water Index | (G − NIR)/(G + NIR) | [53] |
| NRVI | Normalised Ratio Vegetation Index | (R/NIR − 1)/(R/NIR + 1) | [54] |
| RVI | Ratio Vegetation Index | R/NIR | |
| SR | Simple Ratio Vegetation Index | NIR/R | [55] |
| TTVI | Thiam’s Transformed Vegetation Index | sqrt(abs((NIR − R)/(NIR + R) + 0.5)) | [56] |
| TVI | Transformed Vegetation Index | sqrt((NIR − R)/(NIR + R) + 0.5) | [57] |
| NGRDI | Normalized Green-Red Difference Index | (G − R)/(G + R) | [58] |
| GLI | Green Leaf Index | (2G − R − B)/(2G + R + B) | [59] |
| CIVE | Color index of vegetation extraction | 0.441R − 0.81G + 0.385B + 18.7874 | [60] |
| CCCI | Canopy Chlorophyll Content INDE | ((NIR − RE)/(NIR + RE))/((NIR − R)/(NIR + R)) | [52] |
| WDVI | Weighted Difference Vegetation Index | NIR − 2R | |
| CIred | Chlorophyll index | (NIR/R)-1 |
Table 4.
Classification of infested palm symptoms (Start of Infestation—SoI: Low-L, Low to Moderate—L-M, Moderate-M, Moderate to Very Infested—M-VI, Very Infested—VI, Extremely or Very very infested—VVI).
Table 4.
Classification of infested palm symptoms (Start of Infestation—SoI: Low-L, Low to Moderate—L-M, Moderate-M, Moderate to Very Infested—M-VI, Very Infested—VI, Extremely or Very very infested—VVI).
| Palm n° | 04/09/20 | 17/11/20 | 30/03/21 | 25/05/21 | 07/07/21 | 03/09/21 | 13/09/21 |
|---|---|---|---|---|---|---|---|
| 14 | SoI– | L-M | M | M | VI | VI | VVI |
| 16 | SoI | M | M | M-VI | VI | VI | VVI |
| 26 | SoI | L-M | L-M | M | M_VI | VVI | VVI |
| 28 | SoI | M | M | M-VI | VI | VI | VVI |
| 29 | SoI | M | M | VI | VVI | VVI | VVI |
| 30 | SoI | L-M | L-M | L-M | VI | VI | VVI |
| 37 | SoI | L-M | L-M | M | M-VI | M-VI | M-VI |
| 38 | SoI-L | L | L | L | L | M | VI |
| 41 | SoI | M | M | M | M-VI | M | VI |
Table 5.
Results of the Wilcoxon Signed-Rank Test (alpha = 0.05) applied on thermal canopy information.
Table 5.
Results of the Wilcoxon Signed-Rank Test (alpha = 0.05) applied on thermal canopy information.
| Temperature Statistics | June 21 p Value | July 21 p Value | September 21 p Value |
|---|---|---|---|
| Mean | 0.377 | 0.055 | 0.017 * |
| Median | 0.999 | 0.348 | 0.022 * |
| Standard deviation | 0.042 * | 0.016 * | 0.010 * |
| Min | 0.791 | 0.487 | 0.447 |
| Max | 0.033 * | 0.002 * | 0.001 * |
| Range | 0.051 | 0.005 * | 0.010 * |
| Minority | 0.791 | 0.487 | 0.447 |
| Majority | 0.536 | 0.236 | 0.028 * |
| Variety | 0.133 | 0.030 * | 0.008 * |
| Variance | 0.042 * | 0.016 * | 0.010 * |
* significant p < 0.05.
Disclaimer/Publisher’s Note: The statements, opinions and data contained in all publications are solely those of the individual author(s) and contributor(s) and not of MDPI and/or the editor(s). MDPI and/or the editor(s) disclaim responsibility for any injury to people or property resulting from any ideas, methods, instructions or products referred to in the content. |
© 2023 by the authors. Licensee MDPI, Basel, Switzerland. This article is an open access article distributed under the terms and conditions of the Creative Commons Attribution (CC BY) license (https://creativecommons.org/licenses/by/4.0/).
Share and Cite
MDPI and ACS Style
Delalieux, S.; Hardy, T.; Ferry, M.; Gomez, S.; Kooistra, L.; Culman, M.; Tits, L. Red Palm Weevil Detection in Date Palm Using Temporal UAV Imagery. Remote Sens. 2023, 15, 1380. https://doi.org/10.3390/rs15051380
AMA Style
Delalieux S, Hardy T, Ferry M, Gomez S, Kooistra L, Culman M, Tits L. Red Palm Weevil Detection in Date Palm Using Temporal UAV Imagery. Remote Sensing. 2023; 15(5):1380. https://doi.org/10.3390/rs15051380
Chicago/Turabian StyleDelalieux, Stephanie, Tom Hardy, Michel Ferry, Susi Gomez, Lammert Kooistra, Maria Culman, and Laurent Tits. 2023. "Red Palm Weevil Detection in Date Palm Using Temporal UAV Imagery" Remote Sensing 15, no. 5: 1380. https://doi.org/10.3390/rs15051380
Note that from the first issue of 2016, this journal uses article numbers instead of page numbers. See further details here.