Article

Trunk-Constrained and Tree Structure Analysis Method for Individual Tree Extraction from Scanned Outdoor Scenes

1
Institute of Computer Science and Engineering, Xi’an University of Technology, No. 5 South of Jinhua Road, Xi’an 710048, China
2
Shaanxi Key Laboratory of Network Computing and Security Technology, Xi’an 710048, China
3
College of Mathematics and Statistics, Hengyang Normal University, Hengyang 421002, China
4
School of Artificial Intelligence and Computer Science, Jiangnan University, 1800 of Lihu Road, Wuxi 214122, China
*
Author to whom correspondence should be addressed.
Remote Sens. 2023, 15(6), 1567; https://doi.org/10.3390/rs15061567
Submission received: 10 February 2023 / Revised: 7 March 2023 / Accepted: 7 March 2023 / Published: 13 March 2023

Abstract

:
The automatic extraction of individual tree from mobile laser scanning (MLS) scenes has important applications in tree growth monitoring, tree parameter calculation and tree modeling. However, trees often grow in rows and tree crowns overlap with varying shapes, and there is also incompleteness caused by occlusion, which makes individual tree extraction a challenging problem. In this paper, we propose a trunk-constrained and tree structure analysis method to extract trees from scanned urban scenes. Firstly, multi-feature enhancement is performed via PointNet to segment the tree points from raw urban scene point clouds. Next, the candidate local tree trunk clusters are obtained by clustering based on the intercepted local tree trunk layer, and the real local tree trunk is obtained by removing noise data. Then, the trunk is located and extracted by combining circle fitting and region growing, so as to obtain the center of the tree crown. Further, the points near the tree’s crown (core points) are segmented through distance difference, and the tree crown boundary (boundary points) is distinguished by analyzing the density and centroid deflection angle. Therefore, the core and boundary points are deleted to obtain the remaining points (intermediate points). Finally, the core, intermediate and boundary points, as well as the tree trunks, are combined to extract individual tree. The performance of the proposed method was evaluated on the Pairs-Lille-3D dataset, which is a benchmark for point cloud classification, and data were produced using a mobile laser system (MLS) applied to two different cities in France (Paris and Lille). Overall, the precision, recall, and F1-score of instance segmentation were 90.00%, 98.22%, and 99.08%, respectively. The experimental results demonstrate that our method can effectively extract trees with multiple rows of occlusion and improve the accuracy of tree extraction.

Graphical Abstract

1. Introduction

The rapid development of 3D acquisition techniques has provided new data and tools for vegetation modeling. MLS is an instrument well suited to obtaining high-precision urban scene point cloud data (PCD). Automatically identifying and mapping trees is a long-standing goal in the area of forest remote sensing, and there is great interest in developing robust solutions to segmenting species with complex structures [1].
The vegetation in urban areas supports ecology by promoting biodiversity, carbon storage and urban temperature reduction, maintaining the carbon–oxygen balance [2], purifying the environment [3], and regulating the climate [4]. The accurate detection of individual tree information from MLS point clouds has been a long-standing goal of remote sensing applications. Individual tree information can be widely used in various applications, such as urban road planning, tree 3D modeling [5], tree monitoring [6,7], tree species identification [8], biomass estimation [9] and structural characteristics quantifying [10,11].
Recently, in most approaches, delineating individual tree from PCD has been paid the most attention. Many scientific studies have been undertaken aiming to segment scanned scenes into different objects [12,13,14,15,16] and capture the attributes of trees [17,18,19,20,21] (e.g., tree height, trunk diameter and diameter at breast height), and outstanding work on 3D object detection based on LiDAR data has been undertaken [22,23]. In this work, we focus on the current methods used for individual tree extraction from MLS. These methods can be roughly divided into three categories: normalized cut methods (NCut), region growth methods and clustering-based methods.
Dong et al. [24] proposed a multilayered tree crown extraction method using graph-based segmentation. Firstly, the tree crown height model (CHM) was constructed, and then the trunk information was obtained by analyzing the histogram of the PCD. Then, graph-based segmentation was performed to extract individual tree. However, noise points around the trunk will affect the accuracy of detection. To solve the problem of the low extraction accuracy caused by the difficulty of pole identification, Fan et al. [25,26] proposed an individual tree extraction method based on confidence guidance. According to the local features of poles, the confidence of trunk estimation is used to guide the order of segmentation, and then the optimized min-cut is used to extract individual tree. However, the extraction of individual tree is limited by the accuracy, and the earlier segmentation clustering could undermine adjacent crown identification, meaning the accuracy will be low in the overlapping scenes. Individual tree detection based on NCut involves manually estimating the number of trees in a multi-tree cluster to determine the iteration termination condition. NCut requires large storage space, time-consuming and expensive in large scenarios and is inefficient when the PCD is dense.
Husain et al. [27] first divided the MLS data into regular 2D grids, then vertically sliced the grids containing candidate trees into three layers. They then created a circle with a specified radius and obtained individual clusters by growth region before finally merging them to obtain individual tree. Since the location of the trunk in [27] depends on the size of the established search area, it is difficult to extract a complete trunk when other rods are present near the trunk. Li et al. [28] proposed a dual growth method to automatically extract individual tree from MLS data. Here, the trunk is identified via various pole objects, and then individual tree are extracted via the dual growth method based on the extraction of seed points. The experimental results indicate that when there are pole objects close to a trunk, the method struggles to identify a real trunk. Luo et al. [29] proposed a pointwise direction embedding deep network (PDE-Net) to predict the direction vector of each tree cluster pointing to the tree center to distinguish the tree boundary. But the effective direction prediction largely depends on the classification accuracy of the tree. In addition, when the PCD is sparse, the correct extraction of individual tree cannot be ensured due to the impossibility of conducting regional analysis.
When extracting individual tree, Torchta et al. [30] first divided the trees into horizontal slices, then extracted the most qualified clusters according to the distance between points. Areas with the minimum number of points formed clusters. The angles and distances of the cluster centers were determined, and they finally realized the extraction of individual tree. This method struggles to extract trees in dense tree scenes, and the performance of individual tree extraction is limited by incomplete data. Li et al. [31] proposed a branch–trunk-constrained hierarchical clustering method to extract individual tree from MLS data. Ning et al. [32] presented a method of top-to-bottom individual tree extraction. First, the appropriate feature set is obtained, and then the outdoor scenic spot cloud data are segmented into tree points and non-tree points using support vector machines (SVM). Then, spectral clustering is used to extract individual tree. Finally, a weighted constraint rule is proposed to refine the individual tree clusters. The algorithm must specify the number of clusters, and this leads to low segmentation robustness in complex scenes. The principal direction and region growing are used to remove the ground and building façade information, and then the trunk and crown are extracted according to the clustering of tree branches and the trunk–space relation. Finally, a hierarchical clustering method is proposed to complete segmentation. However, according to the research findings, these clustering-based methods are affected by the degree of closeness between objects [33].
Most of the existing methods can segment and extract individual tree effectively [34,35,36,37,38,39,40,41]. However, when multiple trees are connected and occluded, or trees are adjacent to other objects in complex scenes, the individual tree extraction result will be unsatisfactory. In these complex scenes with a variety of non-tree objects, trees and non-tree objects will be close to each other, thus blocking or creating connections between trees, which can easily lead to the problem of incorrect or missing recognitions. When multiple trees are occluded, the boundaries of adjacent tree crowns are indistinguishable in the final extraction, and this will result in inaccurate segmentation. The current method is also affected by the density of the PCD.
For complex scenes containing multiple trees, tree crowns generally overlap and occlude one another, but the distance between tree trunks is relatively large. As such, we propose an individual tree extraction method for outdoor scenes based on trunk-constrained and tree structure analysis. The main contributions of our work are as follows:
(1)
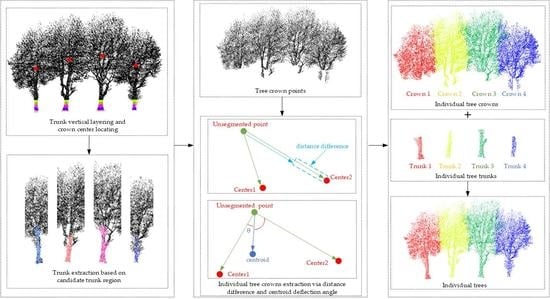
A comprehensive framework combining semantic segmentation with trunk-constrained and tree structure analysis is constructed for individual tree extraction. It can solve the problem whereby trees are often distributed in multiple rows, and there are overlaps between the canopies.
(2)
A new method for locating tree position and crown center based on the local tree trunk method is proposed. The real local tree trunks are identified by restricting the height, the number of points and the angle between the trunk and the ground, the crown centers are located by circle fitting, and complete trunks are extracted according to region growing in relation to the proposed candidate trunk region.
(3)
A novel individual tree extraction method based on distance difference and centroid deflection angle is proposed. Exploiting tree point classification and the effective instance segmentation strategy, the proposed method can obtain more satisfactory individual tree extraction results.
The rest of the paper is organized as follows. In Section 2, our method for individual tree extraction is presented. In Section 3, experiments and evaluations of the proposed method are conducted with a real dataset, and the experiment results are discussed in detail. Finally, conclusions are drawn, and future work is presented in Section 4.

2. Materials and Methods

In some special outdoor scenes with multiple rows of street trees, there are multiple trees shielding each other and connected to one another. The crowns of multiple trees generally overlap, but the distances between the tree trunks are relatively large. As such, we propose a novel method for outdoor scenes based on trunk-constrained and tree structure analysis. The entire pipeline of the method is illustrated in Figure 1.
Firstly, we extract the local features of objects from the raw PCD and undertake semantic segmentation based on multi-feature enhancement using PointNet, which we proposed in another work [42], to improve the accuracy of tree detection. Next, the local tree trunks are extracted from the tree PCD via feature analysis. These local tree trunks are then sliced vertically, and tree trunks are located by circle fitting. The center of the tree crown can then be obtained from the position of the tree trunk. Then, the trunk candidate region is constructed according to the tree trunk position and the radius of the fitted circle. The completed tree trunk is obtained using region growing in the trunk candidate region, which narrows the range of trunk extraction and thus improves efficiency. Finally, we divide the multi-tree cluster into individual tree clusters by applying the different strategy to points at different positions in the tree cluster.

2.1. Tree Trunks Extraction

Since the effective extraction of an individual tree largely depends on the quality of the tree trunk extraction, to improve the accuracy of tree trunk extraction, we must first extract local tree trunks using feature analysis and then use circle fitting to locate the tree trunk. Finally, we extract the complete tree trunk via region growing from the trunk candidate region.

2.1.1. Local Tree Trunks Extraction

For the extraction of candidate local tree trunk clusters, the maximum z max and minimum z min Z-coordinates are obtained from the tree PCD, and then the tree height according to Equation (1) is calculated:
H t r e e = z max z min
The tree trunk is located at the bottom of the tree. After several experiments and statistical analysis, we found that the results are the most accurate and effective when the height of the local tree trunk is set at 1/7. Retain the Z-coordinate of the local tree trunk using z min to z min + H t r e e × 1 / 7 , and the candidate individual local tree trunk clusters are obtained by Euclidean clustering.
The candidate local tree trunk clusters may contain some non-trunk objects, which are necessary to remove. Fan et al. [26] assessed all the characteristics of tree trunks and ranked the confidence of tree trunk identification to obtain the real trunk. Inspired by this, three constraints, including the number of cluster points, the height of clusters and whether the principal direction of the cluster is perpendicular to the ground, are proposed to improve the extraction accuracy of the local tree trunk. That is to say, clusters with fewer points than N t h ( N t h = 50) are deleted, clusters with heights below H t r e e × 1 / 8 are excluded, and clusters in which the angle between the principal direction of the current cluster and the Z-axis is less than 20 ° will also be deleted. Clusters in which the height is lower than that of the local tree trunk do not belong to the real local trunk cluster, and we delimit the height at H = H t r e e × 1 / 8 . Since the local tree trunk is perpendicular to the ground, whether it is a linear vertical object or not can be determined from the angle between the principal direction of the local tree trunk cluster and the Z-axis. When calculating the angle, the covariance matrix of the candidate local tree trunk clusters needs to be created, and then the eigenvalues and corresponding eigenvectors of each cluster can be obtained through PCA (principal components analysis). Given that the scanned scene data P = { p i | i = 1 , 2 , , N } , the k neighboring points of point p i will be q j = { ( x j , y j , z j ) | j = 1 , 2 , , k } . The local covariance matrix M of p i is constructed via:
M = 1 N i = 1 N ( p i P ¯ ) ( p i P ¯ ) T
where N is the number of points in the point cloud, and P ¯ is the center point of the PCD, which is calculated via P ¯ = 1 / N i = 1 N p i . The eigenvector corresponding to the largest eigenvalue represents the principal direction. The angle θ between the principal direction and the Z-axis is calculated using Equations (3) and (4):
N · V = N x × V x + N y × V y + N z × V z
θ = cos 1 ( N · V ) × 180 ° π
where N ( N x , N y , N z ) is the normalized coordinate in the direction of the Z-axis, and V ( V x , V y , V z ) is the normalized coordinate in the principal direction. We delete the clusters in which θ is smaller than θ t h , and finally derive the real local tree trunk clusters. θ t h represents the angle between the principal direction of the local cluster and the Z-axis, and it determines whether the local trunk cluster is a linear vertical object. The cluster belongs to a linear vertical object only when the principal direction is roughly the same as the direction of the Z-axis, but it will generally not be absolutely perpendicular, and we delimit the θ t h = 20 ° .

2.1.2. Tree Trunk Locating

After obtaining the real local tree trunk clusters, tree trunk positions should also be obtained. Since the shape of the tree trunk is more or less cylindrical, and the horizontal section is similar to a circle, the locations of tree trunk clusters can be obtained through circle fitting.
Ground points may be misclassified as tree trunks, so to ensure the accuracy of location identification, it is necessary to eliminate the influence of noise data. The local tree trunk clusters are vertically divided into five layers (as shown in Figure 2), and then circle fitting is performed for the middle three layers only. Circle fitting is a circle detection method based on the RANSAC model of maximization checking, and circle curve fitting is based on the least squares approach. The circle equation is shown in Equation (5), which can be further expanded to obtain Equation (6).
( x a ) 2 + ( y b ) 2 = r 2
x 2 + y 2 2 a x 2 b y + a 2 + b 2 = r 2
Here, ( x , y ) is the point of the local tree trunk cluster, ( a , b ) is the center of the fitted circle and r is the fitted circle radius. Let A = 2 a , B = 2 b and C = a 2 + b 2 r 2 . Then, Equation (6) can be simplified to Equation (7).
x 2 + y 2 A x B y + C = 0
To ensure the minimum fitting error, it is necessary that the partial derivative of each parameter be 0, which satisfies the minimum of γ in γ =   ( x 2 + y 2 A x B y + C ) . We then calculate the center ( a , b ) and radius r of the fitted circle according to the least squares fitting method.
a = A 2 , b = B 2 , r = a 2 + b 2 c
After circle fitting, the fitted center and radius of the local tree trunk clusters can be calculated. Take ( a , b ) to be the center of the tree trunk and r to be the radius of the tree trunk, and finally, the position of the tree trunk can be located. Our approach also ensures that trunks can be positioned correctly even when they have irregular shapes (the selection portion of Figure 2). In our proposed method, the final position is obtained by averaging the center of the fitted circle from the three layers of the local tree trunk, and this reduces the influence of irregular trunks.

2.1.3. Trunks Extracted by Region Growing

After locating the position of the tree, the complete tree trunk needs to be extracted from the tree PCD. To reduce the scope of the segmentation region and improve the accuracy of segmentation, we construct the trunk candidate region, and the trunk is obtained by region growing in the trunk candidate region. The trunk extraction process is displayed in Figure 3 below.
(1)
For a trunk t r u 1 , take o 1 as its center and expand the range of Δ r × r 1 in the horizontal direction to construct the trunk candidate region. The radius of the candidate region is Δ r ( Δ r = 5 ) times the trunk’s radius r 1 . Therefore, for all tree points t i T , if the horizontal distance from t i to o 1 satisfies d H ( t i , o 1 ) Δ r × r 1 , then t i is added to the candidate region b u f 1 , and d H is calculated via Equation (9):
d H ( t i , o ) = ( t i x o x ) 2 + ( t i y o y ) 2
(2)
The eigenvalue ( λ 1 > λ 2 > λ 3 0 ) and eigenvector ( v 1 , v 2 , v 3 ) of the point in b u f 1 are obtained from the PCA and e 3 represents the normal vector. The curvature σ 1 is calculated by Equation (10), and the curvature is sorted in ascending order.
σ 1 = λ 1 λ 1 + λ 2 + λ 3
(3)
We create an empty sequence S of seed points and an empty cluster C l u , and then select the point with the smallest curvature from b u f 1 and place it in set S .
(4)
Take the first seed point from S and search for its neighboring points. If the angle between the normal vector of the neighborhood point and the normal vector of the seed point is less than the smooth threshold S t h = 1 / 9 π , the current point is added to the c l u 1 , and then we judge whether the curvature of the neighboring points is less than the curvature threshold C t h = 0.12 . If it is lower, it will be added to S until all neighborhood points are processed.
(5)
Delete the first seed point from S and repeat step (4). Cluster c l u 1 is segmented when S is empty.
(6)
Select the first unsegmented point from the sorted curvature data to act as the seed point, and then repeat the above steps until all the points are segmented, to derive cluster C l u = { c l u i | i = 1 , 2 , , N c l u } . In this way, the extraction of complete tree trunks in the trunk candidate region is obtained.

2.2. Individual Tree Extraction

2.2.1. Tree Crown Center Calculation

To extract an individual tree, it is necessary to analyze the positional relation between the remaining points and the center of the tree crown. The center of the tree crown is generally located vertically above the tree trunk. As such, use the averages of the X- and Y-coordinates of the tree trunk to be the approximate coordinates of the crown’s center. We delete the trunks from the tree PCD, and the average Z-coordinates of the remaining points are taken as the Z-coordinates of the crown center. Further, the crown centers are marked the same label as the trunks. The calculated coordinates of all central crown points are denoted as E = { e i | i = 1 , 2 , , N e } , where N e is the number of central crown points. Figure 4a,b displays different views of crown centers.

2.2.2. Individual Tree Extraction by Distance Difference and Centroid Deflection Angle

According to the located crown centers, the tree crown cluster can be further divided into individual tree crown clusters or multi-tree crown clusters. A cluster containing only one center is defined as an individual tree crown cluster. In contrast, clusters containing multiple crown centers are defined as multi-tree crown clusters and must be further segmented. The most challenging task of individual tree extraction is to segment multi-tree crown clusters. We must first remove the trunks from the tree PCD and then undertake an analysis of the spatial distance and local density to determine the point’s location. Different strategies to deal with points in different positions (core, boundary and intermediate points) have been proposed and are detailed below.
Generally, points closer to the center of a tree’s crown are more likely to belong to that tree. However, in a dense scene with large differences in shape and size, only considering the spatial distance may assign points with wide crown to trees with narrow crown. To overcome this challenge, points near the crown center (core points) are identified and segmented by the distance difference. The distances from unsegmented points to the centers of all tree crowns are sorted in ascending order, and then the difference between the minimum distance and the sub minimum distance is calculated as the “distance difference”. First, we calculate the distance difference. If the distance difference is greater than the distance threshold D t h , this means that the distance from the current unsegmented point to the closest crown center is far less than the distance to the sub closest crown center. Therefore, the current unsegmented point can be considered as a core point and assigned to the tree with the closest crown center. If the opposite case pertains, and the distances between the current unsegmented point and two crown centers are similar, the current point is considered as a non-core point. Based on this approach, all core points and non-core points can be segmented.
For points near the external boundary of a crown, the local density of points constituting the crown should be higher than that of points outside the crown. As such, the crown boundary can be clearly distinguished by analyzing the local density of the points in the boundary (boundary points) and the centroid deflection angle. We set the neighborhood search radius to R s and identify the point with a number of neighbors below M i n P t s as the boundary point. We calculate the centroid of the current boundary point and it is generally located between the boundary point and the center of the crown. Therefore, the boundary point belongs to the tree, the centroid declination angle of which is small. The centroid declination angle is the angle θ 11 between b 1 k 1 and b 1 e 1 . In Figure 5, θ 11 is significantly smaller than θ 12 , and b 1 belongs to t r e e 1 . Finally, the segmentation of all boundary points is achieved by analyzing the centroid declination angle.
Ultimately, the remaining points (intermediate points) of the crown are obtained by deleting the core and boundary points from the unsegmented points, and they are further processed using the distance difference and centroid deflection angle. Before dividing the intermediate points, we first derive the centers of the closest crown and the sub closest crown. Then the similarity between intermediate points and the crown centers is computed. The lower the similarity, the smaller the distance to the current center of the crown. When moving from the intermediate point to the centroid, the direction is towards the side of the current crown center, and finally the intermediate point is assigned to the tree that has a crown center with minimum similarity.
The segmentation process of individual tree is as follows:
(1)
The set of unsegmented points is C = { c i | i = 1 , 2 , , N c } , and N c is the number of unsegmented points. The spatial distance d 1 i from point c 1 ( c 1 x , c 1 y , c 1 z ) C to each crown center e i ( e i x , e i y , e i z ) E is achieved according to Equation (11). All distances are sorted in ascending order—the minimum distance is d 11 , the sub minimum distance is d 12 , and the corresponding crown centers are e 1 ( e 1 x , e 1 y , e 1 z ) and e 2 ( e 2 x , e 2 y , e 2 z ) .
d 1 i = ( c 1 x e i x ) 2 + ( c 1 y e i y ) 2 + ( c 1 z e i z ) 2
(2)
The distance difference is D 12 = d 12 d 11 . If D 12 > D t h , assign c 1 to the tree with e 1 . If D 12 < D t h , add c 1 to the remaining unsegmented point set U = { u i | i = 1 , 2 , , N u } . N u is the number of remaining unsegmented points. Repeat steps (1) and (2) for all points in set C , and obtain the segmentation results of all core points.
(3)
For U , the neighborhood points are obtained using the search radius R s . If the number of neighborhood points is less than M i n P t s , the point is added to the boundary point set B = { b i | i = 1 , 2 , , N b } , and then the centroids of the boundary points are calculated from the neighborhood points. The centroids set is defined as K = { k i | i = 1 , 2 , , N k } , where N k is the number of centroids.
(4)
The vector D ( e 1 , b 1 ) = e 1 b 1 , and D ( k 1 , b 1 ) = k 1 b 1 . The angle θ 11 of D ( e 1 , b 1 ) and D ( k 1 , b 1 ) is computed according to Equations (12) and (13).
θ 11 = cos 1 ( D ( e 1 , b 1 ) · D ( k 1 , b 1 ) D ( e 1 , b 1 ) D ( k 1 , b 1 ) )
Here, D ( e 1 , b 1 ) and D ( k 1 , b 1 ) are the moduli of vectors D ( e 1 , b 1 ) and D ( k 1 , b 1 ) . The radian value is converted to an angle value via Equation (13).
θ 11 = θ 11 × 180.0 π
Then the vector D ( e 2 , b 1 ) = e 2 b 1 and the angle θ 12 of D ( e 2 , b 1 ) and D ( k 1 , b 1 ) is also estimated. If θ 11 < θ 12 , assign b 1 to the tree with e 1 , otherwise assign b 1 to the tree with e 2 , and repeat step 4) until all boundary points are segmented.
(5)
The intermediate point set Q = ( q i | i = 1 , 2 , , N q ) is obtained by deleting the core points and boundary points, and the distance d 11 from q 1 to e 1 is calculated by step 1). The distance d 12 from q 1 to e 2 , and the angles θ 11 between q 1 k 1 and q 1 e 1 and θ 12 between q 1 k 1 and q 1 e 2 are determinedrespectively based on 4). Normalize the distance and angle using Equations (14) and (15).
d 11 = d 11 d 11 + d 12 , d 12 = d 12 d 11 + d 12
θ 11 = θ 11 θ 11 + θ 12 , θ 12 = θ 12 θ 11 + θ 12
The similarity S i m ( e 1 ) between q 1 and e 1 and the S i m ( e 2 ) between q 1 and e 2 are obtained by Equations (16) and (17), respectively, where α and β are the weight of distance and the angle.
S i m ( e 1 ) = α e d 11 + β e θ 11 , S i m ( e 2 ) = α e d 12 + β e θ 12
α + β = 1
If S i m ( e 1 ) < S i m ( e 2 ) , assign q 1 to the tree with e 1 . In contrast, assign q 1 to the tree with e 2 , and repeat step 5.
The crown points of an individual tree are labeled via the above processing steps. Therefore, the crown and trunk points with the same label are combined to obtain the individual tree, as displayed in Figure 6.

3. Results

To verify the effectiveness of this method, we use the Paris-Lille-3D dataset [43] to conduct experiments, and compare the results with those of the clustering method [44] and the 3D Forest method [30]. Our method is implemented on Windows 10 using an Intel i5-8500 CPU and a single NVIDIA GeForce GTX 1660Ti GPU.

3.1. Paris-Lille-3D Dataset

Paris-Lille-3D (Figure 7) is a dataset and a benchmark used for point cloud classification. The data are produced by a mobile laser system (MLS) applied to two different cities in France (Paris and Lille). The scanned road length is about 2 km and includes about 140 million points. The point cloud has been labeled entirely by hand, with 50 and 9 classes that are used by the research community for automatic point cloud segmentation and classification algorithms, respectively. We conduct experiments using crude classification into the following categories: ground, buildings, bollards, poles, trashcans, barriers, trees, cars, and vegetation. The trees in this paper are mainly macrophanerophytes with independent trunks. Vegetation with no individual trunks (e.g., bushes) is not considered as the target objects. Since the non-tree objects in the dataset are complex and diverse, the dataset is directly classified into nine categories.

3.2. Analysis of Individual Tree Extraction Results

The basis of the proposed method is to remove the ground, buildings and other non-tree objects via Ning et al.’s method [42]. In this step, the values of the parameters used are all identical to those in [42], except that the number of output categories is nine rather than two, because the number of output categories is determined according to the standard semantic segmentation of the dataset. The five raw scenes are displayed in Figure 8, and the semantic segmentation results are illustrated in Figure 9.
In Figure 9, all the categories are represented using different colors: red represents trees, and anything not red represents non-tree objects. We then remove all the other objects from the dataset to derive all the tree PCD.
Table 1 lists the relevant parameters extracted from individual tree in different scenes. D t h represents the distance difference threshold, which is derived from the shapes and structures of trees. R s represents the neighborhood search radius, which is used to obtain the number of neighborhood points, and M i n P t s represents the minimum number of neighborhood points. The values of R s and M i n P t s depend on the density of the PCD. α and β are used to balance distance and angle which represent the weights of the distance and the angle, respectively.
The individual tree extraction process is displayed in Figure 10, Figure 11 and Figure 12. Figure 10 illustrates the process applied to Scene 1, Scene 2 and Scene 3. Multi-tree clusters are obtained by semantic segmentation and Euclidean clustering (Figure 10a). The trunks are obtained by feature analysis, circle fitting and region growing (Figure 10b). Next, according to the trunk location and the trunk candidate region, the crown centers are obtained (Figure 10c), wherein red represents the crown centers. Finally, extraction is completed via the method of distance difference and centroid deflection angle (Figure 10d). Individual tree can be extracted based on our method, and the overlapping and occluded canopy boundaries can be clearly distinguished. Figure 10d indicates that our method can effectively extract individual overlapping trees, and tree boundaries can be successfully segmented via the analysis of distance difference and centroid deflection angle.
Figure 11 illustrates the individual tree extraction process as applied to multi-tree clusters in Scene 4. The scene in Figure 11a contains 11 overlapping trees. The correct trunks are extracted via circle fitting and region growth (Figure 11b). The crown centers extracted in Figure 11c essentially represent the center of the tree crown. Our method can be used to extract individual tree from a scene in which the trees are irregularly arranged (Figure 11d). All 11 trees in the scene can be correctly extracted, and only a few segmentation points are misclassified. The boundary points of the crown are also correctly identified.
Figure 12 illustrates the individual tree extraction process applied to two multi-tree clusters in Scene 5. In Figure 12, although there is a small amount of data missing in the dataset, our method can also extract the individual tree completely. The experimental results demonstrate that our method is robust to extract individual tree in a scene with dense trees and a small amount of missing data. Most of the trees are correctly segmented, and the boundary points are clearly identified in cases of occlusion and connection.

3.3. Comparative Analysis of Experimental Results

To evaluate the performance of our method as applied to individual tree extraction, it is compared with the methods of [30,44].
Figure 13, Figure 14, Figure 15 and Figure 16 illustrate the experimental results of individual tree extraction for Scene 2, Scene 3, Scene 4 and Scene 5, respectively. The clustering method [44] and 3D Forest method [30] achieved inaccurate boundary segmentation when extracting individual connected trees from Scene 2, Scene 3 and Scene 4, as shown in the selected box portion of Figure 13a. Figure 13b shows the extraction results from reference [30]. It can be seen from the box annotation that there are some points with incorrect boundaries. Figure 14 presents the segmentation results for Scene 3. Regarding the four connected trees marked by the boxes in Figure 14a,b, following both the clustering method of [44] and the 3D Forest method [30], some tree points are misclassified, and the tree boundary is not clear enough. Misclassified segmentation points are shown in the boxes of Figure 15a,b.By contrast, our method can extract connected trees, and most of the tree points are correctly segmented. For complex outdoor scenes with multiple rows of occluded and overlapping trees, the methods of [44] and [30] are prone to over-segmentation and under-segmentation, as shown by the segments in the black boxes in Figure 16a, the individual tree are over-segmented into multiple clusters, and multiple trees are incorrectly segmented into one tree. Our method, based on distance difference and centroid deflection angle, can more accurately and effectively extract individual tree from complex scenes. Our boundary segmentation results of connected trees are more accurate, and the segmentation points of misclassification are fewer.
To verify the effectiveness of the proposed method, we quantitatively analyze the experimental results through six indicators. T P (true positive) represents the number of correctly extracted individual tree, F N (false negative) represents the number of undetected individual tree (that is, when an individual tree and other nearby trees are divided into the same tree), and F P (false positive) indicates the number of non-trees detected as trees (that is, a point cluster that is not a tree is regarded as a tree). T P , F N and F P represent correct segmentation, under-segmentation, and over-segmentation, respectively. P (precision) is the precision rate, indicating the proportion of correctly extracted trees out of all detected trees. R (recall) is the recall rate, indicating the proportion of correctly extracted trees out of all actual trees. F (F1-score) is a comprehensive index used to evaluate the overall accuracy of tree extraction. The values of P , R and F are calculated according to Equation (18).
{ P = T P T P + F P R = T P T P + F N F = 2 × P × R P + R ,
Figure 13. Comparison results in Scene 2. (a) Clustering based method [44]. (b) 3D Forest method [30]. (c) Our method.
Remotesensing 15 01567 g013
Figure 14. Comparison results in Scene 3. (a) Clustering based method [44]. (b) 3D Forest method [30]. (c) Our method.
Remotesensing 15 01567 g014
Figure 15. Comparison in Scene 4. (a) Clustering based method [44]. (b) 3D Forest method [30]. (c) Our method.
Remotesensing 15 01567 g015
Figure 16. Comparison results in Scene 5. (a) Clustering based method [44]. (b) 3D Forest method [30]. (c) Our method.
Remotesensing 15 01567 g016
Table 2 lists the quantitative comparison results of three methods in four scenarios. It can be seen that the 3D Forest method has the lowest accuracy among the three methods. The 3D Forest method is prone to under-segmentation when trees are connected with other objects. The clustering method is superior to the 3D Forest method, but it still shows over-segmentation and under-segmentation of trees. Compared with the clustering method [44] and the 3D Forest method [30], our proposed method is the most effective. For those overlap of tree crowns in Figure 15c, the precision, recall and F1-score of the proposed method are 100%, 92.86% and 96.30% respectively, which is higher than 3D Forest method and clustering based method.

4. Conclusions

In this paper, we have proposed a new method based on trunk constraints and structure analysis to extract individual tree from complex outdoor scenes. Benefiting from the effectiveness of the trunk extraction from the candidate trunk region, the accuracy of the located tree crown center position and the robustness of the crown points segmentation strategies in different position. Experimental results derived from the five scenes in the Paris-Lille-3D dataset demonstrate that the proposed method can extract individual tree effectively. Compared with the clustering-based method and 3D Forest method, the proposed method negates the influence of crown overlapping and under-segmentation. Overall, the precision, recall and F1-score of our proposed segmentation approach applied to the cited datasets are 90.00%, 98.22%, and 99.08%, respectively.
In future work, we will improve the robustness of the method by applying it to a dataset with a large amount of missing data and forests. Additional deep learning should also be explored with the goal of improving tree classification accuracy. Further, the fusion of orthophoto images and LiDAR point clouds would provide a better means of greatly improving the efficiency and accuracy of urban tree detection, especially for larger-scale urban scenes.

Author Contributions

Conceptualization, X.N., Y.H.; methodology, Y.H.; software, Y.H.; validation, X.N., Y.H. and Y.M.; writing—original draft preparation, X.N., Y.H., Y.M.; writing—review and editing, X.N., Z.L., H.J., Z.W. and Y.W. All authors have read and agreed to the published version of the manuscript.

Funding

This research was supported by the National Natural Science Foundation of China (Nos. 61871320, 61872291) and Shaanxi key Laboratory project (No. 17JS099).

Data Availability Statement

The data presented in this study are available on request from the corresponding author. The data are not publicly available due to privacy restrictions.

Conflicts of Interest

The authors declare no conflict of interest.

References

  1. Williams, J.; Schonlieb, C.-B.; Swinfield, T.; Lee, J.; Cai, X.; Qie, L.; Coomes, D.A. 3D Segmentation of Trees through a Flexible Multiclass Graph Cut Algorithm. IEEE Trans. Geosci. Remote Sens. 2020, 58, 754–776. [Google Scholar] [CrossRef]
  2. Corada, K.; Woodward, H.; Alaraj, H.; Collins, C.M.; de Nazelle, A. A systematic review of the leaf traits considered to contribute to removal of airborne particulate matter pollution in urban areas. Environ. Pollut. 2021, 269, 116104. [Google Scholar] [CrossRef]
  3. Liu, J.; Skidmore, A.K.; Wang, T.; Zhu, X.; Premier, J.; Heurich, M.; Beudert, B.; Jones, S. Variation of leaf angle distribution quantified by terrestrial LiDAR in natural European beech forest. ISPRS J. Photogramm. Remote Sens. 2019, 148, 208–220. [Google Scholar] [CrossRef]
  4. Zhao, Y.; Hu, Q.; Li, H.; Wang, S.; Ai, M. Evaluating carbon sequestration and PM2.5 removal of urban street trees using mobile laser scanning data. Remote Sens. 2018, 10, 1759. [Google Scholar] [CrossRef] [Green Version]
  5. Yadav, M.; Lohani, B. Identification of trees and their trunks from mobile laser scanning data of roadway scenes. Int. J. Remote Sens. 2019, 41, 1233–1258. [Google Scholar] [CrossRef]
  6. Du, S.; Lindenbergh, R.; Ledoux, H.; Stoter, J.; Nan, L. AdTree: Accurate, Detailed, and Automatic Modelling of Laser-Scanned Trees. Remote Sens. 2019, 11, 2074. [Google Scholar] [CrossRef] [Green Version]
  7. Luo, Z.; Zhang, Z.; Li, W.; Chen, Y.; Wang, C.; Nurunnabi, A.A.M.; Li, J. Detection of individual trees in UAV LiDAR point clouds using a deep learning framework based on multichannel representation. IEEE Trans. Geosci. Remote Sens. 2022, 60, 1–15. [Google Scholar] [CrossRef]
  8. Wu, B.; Yu, B.; Yue, W.; Shu, S.; Tan, W.; Hu, C.; Huang, Y.; Wu, J.; Liu, H. A Voxel-Based Method for Automated Identification and Morphological Parameters Estimation of Individual Street Trees from Mobile Laser Scanning Data. Remote Sens. 2013, 5, 584–611. [Google Scholar] [CrossRef] [Green Version]
  9. Holopainen, M.; Vastaranta, M.; Kankare, V.; Räty, M.; Vaaja, M.; Liang, X.; Yu, X.; Hyyppä, J.; Hyyppä, H.; Viitala, R.; et al. Biomass estimation of individual trees using stem and crown diameter tls measurements. Int. Arch. Photogramm. Remote Sens. Spat. Inf. Sci. 2012, XXXVIII-5, 91–95. [Google Scholar] [CrossRef] [Green Version]
  10. Huo, L.; Lindberg, E.; Holmgren, J. Towards low vegetation identification: A new method for tree crown segmentation from LiDAR data based on a symmetrical structure detection algorithm (SSD). Remote Sens. Environ. 2022, 270, 112857. [Google Scholar] [CrossRef]
  11. Hu, T.; Wei, D.; Su, Y.; Wang, X.; Zhang, J.; Sun, X.; Liu, Y.; Guo, Q. Quantifying the shape of urban street trees and evaluating its influence on their aesthetic functions based on mobile lidar data. ISPRS J. Photogramm. Remote Sens. 2022, 184, 203–214. [Google Scholar] [CrossRef]
  12. Ning, X.J.; Tian, G.; Wang, Y.H. Shape classification guided method for automated extraction of urban trees from terrestrial laser scanning point clouds. Multimed. Tools Appl. 2021, 80, 33357–33375. [Google Scholar] [CrossRef]
  13. Kuželka, K.; Slavík, M.; Surový, P. Very High Density Point Clouds from UAV Laser Scanning for Automatic Tree Stem Detection and Direct Diameter Measurement. Remote Sens. 2020, 12, 1236. [Google Scholar] [CrossRef] [Green Version]
  14. Windrim, L.; Bryson, M. Detection, Segmentation, and Model Fitting of Individual Tree Stems from Airborne Laser Scanning of Forests Using Deep Learning. Remote Sens. 2020, 12, 1469. [Google Scholar] [CrossRef]
  15. Zhang, W.; Wan, P.; Wang, T.; Cai, S.; Chen, Y.; Jin, X.; Yan, G. A Novel Approach for the Detection of Standing Tree Stems from Plot-Level Terrestrial Laser Scanning Data. Remote Sens. 2019, 11, 211. [Google Scholar] [CrossRef] [Green Version]
  16. Chen, Y.; Wu, R.; Yang, C.; Lin, Y. Urban vegetation segmentation using terrestrial LiDAR point clouds based on point non-local means network. Int. J. Appl. Earth Obs. Geoinf. 2021, 105, 102580. [Google Scholar] [CrossRef]
  17. Brolly, G.; Király, G.; Lehtomäki, M.; Liang, X. Voxel-Based Automatic Tree Detection and Parameter Retrieval from Terrestrial Laser Scans for Plot-Wise Forest Inventory. Remote Sens. 2021, 13, 542. [Google Scholar] [CrossRef]
  18. Kolendo, Ł.; Kozniewski, M.; Ksepko, M.; Chmur, S.; Neroj, B. Parameterization of the Individual Tree Detection Method Using Large Dataset from Ground Sample Plots and Airborne Laser Scanning for Stands Inventory in Coniferous Forest. Remote Sens. 2021, 13, 2753. [Google Scholar] [CrossRef]
  19. Gollob, C.; Ritter, T.; Wassermann, C.; Nothdurft, A. Influence of Scanner Position and Plot Size on the Accuracy of Tree Detection and Diameter Estimation Using Terrestrial Laser Scanning on Forest Inventory Plots. Remote Sens. 2019, 11, 1602. [Google Scholar] [CrossRef] [Green Version]
  20. Cabo, C.; Ordóñez, C.; López-Sánchez, C.A.; Armesto, J. Automatic dendrometry: Tree detection, tree height and diameter estimation using terrestrial laser scanning. Int. J. Appl. Earth Obs. Geoinf. 2018, 69, 164–174. [Google Scholar] [CrossRef]
  21. Oveland, I.; Hauglin, M.; Giannetti, F.; Kjørsvik, N.S.; Gobakken, T. Comparing Three Different Ground Based Laser Scanning Methods for Tree Stem Detection. Remote Sens. 2018, 10, 538. [Google Scholar] [CrossRef] [Green Version]
  22. Lv, Z.; Li, G.; Jin, Z.; Benediktsson, J.A.; Foody, G.M. Iterative Training Sample Expansion to Increase and Balance the Accuracy of Land Classification from VHR Imagery. IEEE Trans. Geosci. Remote Sens. 2021, 59, 139–150. [Google Scholar] [CrossRef]
  23. Lv, Z.; Wang, F.; Cui, G.; Benediktsson, J.A.; Lei, T.; Sun, W. Spatial–Spectral Attention Network Guided with Change Magnitude Image for Land Cover Change Detection Using Remote Sensing Images. IEEE Trans. Geosci. Remote Sens. 2022, 60, 1–12. [Google Scholar] [CrossRef]
  24. Dong, T.; Zhang, X.; Ding, Z.; Fan, J. Multilayered tree crown extraction from LiDAR data using graphbased segmentation. Comput. Electron. Agric. 2020, 170, 105213. [Google Scholar] [CrossRef]
  25. Fan, W.; Yang, B.; Liang, F.; Dong, Z. Using mobile laser scanning point clouds to extract urban roadside trees for ecological benefits estimation. Int. Arch. Photogramm. Remote Sens. Spat. Inf. Sci. 2020, 43, 211–216. [Google Scholar] [CrossRef]
  26. Fan, W.; Yang, B.; Dong, Z.; Liang, F.; Xiao, J.; Li, F. Confidence-guided roadside individual tree extraction for ecological benefit estimation. Int. J. Appl. Earth Obs. Geoinf. 2021, 102, 102368. [Google Scholar] [CrossRef]
  27. Husain, A.; Vaishya, R.C. An automated approach for street trees detection using mobile laser scanner data. Remote Sens. Appl. Soc. Environ. 2020, 20, 100371. [Google Scholar] [CrossRef]
  28. Li, L.; Li, D.; Zhu, H.; Li, Y. A dual growing method for the automatic extraction of individual trees from mobile laser scanning data. ISPRS J. Photogramm. Remote Sens. 2016, 120, 37–52. [Google Scholar] [CrossRef]
  29. Luo, H.; Khoshelham, K.; Chen, C.; He, H. Individual tree extraction from urban mobile laser scanning point clouds using deep pointwise direction embedding. ISPRS J. Photogramm. Remote Sens. 2021, 175, 326–339. [Google Scholar] [CrossRef]
  30. Trochta, J.; Krůček, M.; Vrška, T.; Král, K. 3D Forest: An application for descriptions of three-dimensional forest structures using terrestrial LiDAR. PLoS ONE 2017, 12, e0176871. [Google Scholar] [CrossRef] [Green Version]
  31. Li, J.T.; Cheng, X.J.; Xiao, Z.H. A branch-trunk-constrained hierarchical clustering method for street trees individual extraction from mobile laser scanning point clouds. Measurement 2022, 189, 110440. [Google Scholar] [CrossRef]
  32. Ning, X.J.; Tian, G.; Wang, Y.H. Top-Down Approach to the Automatic Extraction of Individual Trees from Scanned Scene Point Cloud Data. Adv. Electr. Comput. Eng. 2019, 19, 11–18. [Google Scholar] [CrossRef]
  33. Chen, X.; Wu, H.; Lichti, D.; Han, X.; Ban, Y.; Li, P.; Deng, H. Extraction of indoor objects based on the exponential function density clustering model. Inf. Sci. 2022, 607, 1111–1135. [Google Scholar] [CrossRef]
  34. Yang, J.; Kang, Z.; Cheng, S.; Yang, Z.; Akwensi, P.H. An individual tree segmentation method based on watershed algorithm and three-dimensional spatial distribution analysis from airborne LiDAR point clouds. IEEE J. Sel. Top. Appl. Earth Observ. Remote Sens. 2020, 13, 1055–1067. [Google Scholar] [CrossRef]
  35. Yan, W.; Guan, H.; Cao, L.; Yu, Y.; Li, C.; Lu, J. A self-adaptive mean shift tree-segmentation method using UAV LiDAR data. Remote Sens. 2020, 12, 515. [Google Scholar] [CrossRef] [Green Version]
  36. Dai, W.; Yang, B.; Dong, Z.; Shaker, A. A new method for 3D individual tree extraction using multispectral airborne LiDAR point clouds. ISPRS J. Photogramm. Remote Sens. 2018, 144, 400–411. [Google Scholar] [CrossRef]
  37. Yun, T.; Jiang, K.; Li, G.; Eichhorn, M.P.; Fan, J.; Liu, F.; Chen, B.; An, F.; Cao, L. Individual tree crown segmentation from airborne LiDAR data using a novel Gaussian filter and energy function minimization-based approach. Remote Sens. Environ. 2021, 256, 112307. [Google Scholar] [CrossRef]
  38. Dersch, S.; Heurich, M.; Krueger, N.; Krzystek, P. Combining graph-cut clustering with object-based stem detection for tree segmentation in highly dense airborne lidar point clouds. ISPRS J. Photogramm. Remote Sens. 2021, 172, 207–222. [Google Scholar] [CrossRef]
  39. Wang, Y.; Jiang, T.; Liu, J.; Li, X.; Liang, C. Hierarchical instance recognition of individual roadside trees in environmentally complex urban areas from UAV laser scanning point clouds. ISPRS Int. J. GeoInf. 2020, 9, 595. [Google Scholar] [CrossRef]
  40. Yang, W.; Liu, Y.; He, H.; Lin, H.; Qiu, G.; Guo, L. Airborne LiDAR and photogrammetric point cloud fusion for extraction of urban tree metrics according to street network segmentation. IEEE Access 2021, 9, 97834–97842. [Google Scholar] [CrossRef]
  41. Tusa, E.; Monnet, J.M.; Barré, J.B.; Mura, M.D.; Dalponte, M.; Chanussot, J. Individual Tree Segmentation Based on Mean Shift and Crown Shape Model for Temperate Forest. IEEE Geosci. Remote Sens. Lett. 2021, 18(12), 2052–2056. [Google Scholar] [CrossRef]
  42. Ning, X.; Ma, Y.; Hou, Y.; Lv, Z.; Jin, H.; Wang, Y. Semantic Segmentation Guided Coarse-to-Fine Detection of Individual Trees from MLS Point Clouds Based on Treetop Points Extraction and Radius Expansion. Remote Sens. 2022, 14, 4926. [Google Scholar] [CrossRef]
  43. Roynard, X.; Deschaud, J.E.; Goulette, F. Paris-Lille-3D: A large and high-quality ground-truth urban point cloud dataset for automatic segmentation and classification. Int. J. Robot. Res. 2018, 37, 545–557. [Google Scholar] [CrossRef] [Green Version]
  44. Xu, S.; Ye, N.; Xu, S.; Zhu, F. A supervoxel approach to the segmentation of individual trees from LiDAR point clouds. Remote Sens. Lett. 2018, 9, 515–523. [Google Scholar] [CrossRef]
Figure 1. Pipeline of the proposed framework.
Remotesensing 15 01567 g001
Figure 2. Trunk vertical layering. The different colors represent different vertical layers.
Remotesensing 15 01567 g002
Figure 3. Process of trunk extraction.
Remotesensing 15 01567 g003
Figure 4. Crown center from different views. (a) Front view of crown center. (b) Top view of crown center. The red dots represent the crown center.
Remotesensing 15 01567 g004
Figure 5. Crown boundary point segmentation.
Remotesensing 15 01567 g005
Figure 6. Individual trees extraction result. The different colors represent different individual tree.
Remotesensing 15 01567 g006
Figure 7. Part of Paris-Lille-3D dataset.
Remotesensing 15 01567 g007
Figure 8. The raw PCD of five scenes.
Remotesensing 15 01567 g008
Figure 9. The semantic segmentation results of five scenes.
Remotesensing 15 01567 g009
Figure 10. Individual tree extraction process of Scene 1, Scene 2 and Scene 3. (a) The PCD of trees. (b) Trunk extraction results. (c) Crown center extraction results. (d) Individual tree extraction results.
Remotesensing 15 01567 g010
Figure 11. Individual tree extraction process of Scene 4. (a) The PCD of trees. (b) Trunk extraction result. (c) Crown center extraction result. (d) Individual tree extraction result.
Remotesensing 15 01567 g011
Figure 12. Individual tree extraction process of Scene 5. (a) The PCD of trees. (b) Trunk extraction result. (c) Crown center extraction result. (d) Individual tree extraction result.
Remotesensing 15 01567 g012
Table 1. Parameters of individual tree extraction.
Scene D t h R s M i n P t s α β
Scene11.83.018000.80.2
Scene21.83.018000.80.2
Scene31.83.018000.80.2
Scene42.03.018000.80.2
Scene41.83.018000.80.2
Scene52.54.010,0000.70.3
Scene52.52.04000.90.1
Table 2. Quantitative comparison results on four scenes.
SceneMethod T P F N F P P R F
Scene 2Clustering method [44]3220.60000.60000.6000
3D Forest [30]5020.714310.8333
Ours500111
Scene 3Clustering method [44]600111
3D Forest [30]5130.62500.83330.7143
Ours600111
Scene 4Clustering method [44]11380.57890.78570.6666
3D Forest [30]5990.35710.35710.3571
Ours131010.92860.9630
Scene 5Clustering method [44]12880.60000.60000.6000
3D Forest [30]12880.60000.60000.6000
Ours20000.600011
AverageClustering method [44]---0.69470.74640.7167
3D Forest [30]---0.57410.79760.6262
Ours---0.90000.98220.9908
Disclaimer/Publisher’s Note: The statements, opinions and data contained in all publications are solely those of the individual author(s) and contributor(s) and not of MDPI and/or the editor(s). MDPI and/or the editor(s) disclaim responsibility for any injury to people or property resulting from any ideas, methods, instructions or products referred to in the content.

