Article

Exploring Spatiotemporal Characteristics and Driving Forces of Straw Burning in Hunan Province, China, from 2010 to 2020

1
College of Life Science and Technology, Central South University of Forestry and Technology, Changsha 410004, China
2
National Engineering Laboratory for Applied Technology of Forestry and Ecology in South China, Central South University of Forestry and Technology, Changsha 410004, China
3
Ecological Environment Monitoring Center of Hunan Province, Changsha 410014, China
4
Technology Innovation Center for Ecological Protection and Restoration in Dongting Lake Basin, Ministry of Natural Resources, Changsha 410007, China
5
School of Environmental and Natural Sciences, Bangor University, Deiniol Road, Bangor LL57 2UW, UK
*
Author to whom correspondence should be addressed.
Remote Sens. 2024, 16(8), 1438; https://doi.org/10.3390/rs16081438
Submission received: 26 February 2024 / Revised: 8 April 2024 / Accepted: 12 April 2024 / Published: 18 April 2024
(This article belongs to the Section Environmental Remote Sensing)

Abstract

:
Straw burning is a significant source of atmospheric pollutants, releasing particulate matter and trace gases. Capturing the characteristics of straw burning and understanding its influencing factors are important prerequisites for regulating straw burning. Based on the fire points detected by the Moderate-resolution Imaging Spectroradiometer (MODIS) in Hunan province, China, from 2010 to 2020, this study analyzed the spatiotemporal variations of straw burning and employed Geographically Weighted Regression (GWR) models to investigate the underlying forces driving straw burning. The results show that the spatiotemporal characteristics of straw burning in Hunan Province can be categorized into two distinct periods: 2010 to 2014 and 2015 to 2020. The period from 2010 to 2014 witnessed a rapid increase, while the period from 2015 to 2020 experienced fluctuating decreases. The shift is closely linked to the implementation of the straw burning ban policy in 2015. Spatially, the areas with a high number of fire points are primarily located in the southern regions, especially in the border regions between Chenzhou, Yongzhou, Hengyang, and Shaoyang cities. A significant change was found in the impact of economic development and human activity factors on straw burning before and after 2015. These factors include crop yield, Gross Domestic Product (GDP), and road network development. From the implementation of the straw burning ban policy, increases in GDP and settlement density will have a dampening effect on straw burning in a region. Straw burning locations may shift towards regions with relatively slow economic development. The results could serve as a foundation for decision-making to address the issue of straw burning.

1. Introduction

Air pollution is a severe environmental issue in many developing countries due to its hazardous effects on human and ecosystem health [1,2]. Fine particulate matter with an aerodynamic diameter smaller than 2.5 μm (PM2.5) is one of the most significant pollutants, causing hazy weather and affecting human health [3,4,5]. Biomass burning is one of the major sources of PM2.5 and its gaseous precursors [6,7,8,9]. Among these, straw burning is an important source that has caused heavy haze episodes during harvest seasons worldwide [10]. Emissions of atmospheric pollutants from open straw burning have been previously estimated in several countries [11,12,13]. In China, the contribution of the open burning of straw to PM2.5 emissions in north and northeast China increased significantly to 56.4–66.4% in 2016 [10]. Compared to industrial and traffic sources, emissions from biomass sources, especially open straw burning, can be directly linked to atmospheric pollutants. Thus, characterizing the spatial and temporal variations of emissions from open straw burning is necessary for formulating emission policies and developing technology for reusing the straw.
Advancements in remote sensing technology for monitoring fire points have increased the research on extracting ground fire points using high-resolution satellite data in specific regions [14,15,16,17]. These studies focus on monitoring fire points in large-scale areas, utilizing mature technologies and research methods. Traditional monitoring of straw burning based on satellite remote sensing data requires substantial manpower and material resources, resulting in a time-consuming and inefficient process. Remote sensing methods can overcome the limitations of traditional methods and rapidly acquire information about the location of straw burning, which is highly significant in enhancing the effectiveness of government oversight and the efficient management of straw burning. Previous studies have made significant efforts to investigate the temporal and spatial variations of fire points [18,19,20,21]. For example, Verma et al. [22] quantified the spatiotemporal changes in straw burning in Madhya Pradesh, India, from 2002 to 2016 and revealed an increasing trend in the number of fire points. Li et al. [19] analyzed the changes in straw burning in Henan Province, China. They identified a gradual evolution from the northern and central regions to the southwestern and southeastern regions by identifying the locations where straw burning occurred in 2000, 2008, and 2014. Zhang et al. [16] found that the accuracy of detecting straw burning fires from MODIS data in Henan Province during the autumn crop harvest period could reach 86.54%, based on field inspections. The straw-burning fires were spatially concentrated in the central, eastern, and southern regions of Henan Province. Temporally, they mainly occurred from September 27 to October 20. Zhang et al. [23] analyzed the spatial and temporal evolution characteristics of straw burning in China from 2014 to 2018 across various spatial and temporal scales. They found that the number of straw burning fires decreased annually, with concentrations in October-November and February-April, and spatial clustering in northeast, northern, and central China. These studies have shed light on the impact of straw burning on the quality of the atmospheric environment. However, exploring the driving mechanisms of straw burning remains a significant challenge [24].
Previous studies [23,25,26] have shown that the spatial pattern of straw burning at a national scale in China exhibits a gradual increase in density from west to east and from south to north. Given the regional differences in straw burning, many studies have been extended to the provincial or regional level to characterize the spatial and temporal aspects of straw burning [16,19,21,27]. However, these studies have primarily focused on the northeastern and eastern regions of the country and have not adequately addressed the distribution and detailed spatial and temporal patterns of straw burning in Hunan Province, a major fire center in southern China. Before the publication of the “Air Pollution Prevention and Control Action Plan” in China, there were four main regions where straw burning was widespread [28,29]: (1) the Huang-Huai-Hai region, (2) the eastern plains of the middle and lower reaches of the Yangtze River, (3) southern China, particularly the Guangdong, Guangxi, Hunan, and Hainan provinces, and (4) northeastern China. The Huang-Huai-Hai region covers areas at the confluence of the Yellow River, Huai River, and Yangtze River basins in China, including provinces such as Henan, Anhui, Jiangsu, and Shandong. Over the past decade, a series of measures to control straw burning has been implemented in China. As the patterns of straw burning vary across different provinces, they are influenced not only by the distribution of resources but also by the implementation efforts of control strategies. Therefore, a comprehensive analysis at the provincial level will most likely be effective in assessing the rationale behind policies related to straw burning and help in designing effective and concrete policy responses.
Hunan Province is an important grain-producing region in China. A previous study showed that, in 2010, the proportion of open straw burning in Hunan Province ranked first in China, reaching a peak of 43.1% of the total cultivated area [26]. Analyzing the factors that contribute to straw burning is of great practical importance for controlling fire points of straw burning and improving air quality in the study area. Therefore, this study collected fire point data from 2010 to 2020 in Hunan Province, China, to comprehensively assess the factors that drive regional straw burning and propose effective response strategies. Specifically, we analyzed the spatial and temporal variation of straw burning in Hunan Province from 2010 to 2020 to identify disparities in fire points in terms of both time and location. Local effects and the factors influencing straw burning were explored using Geographically Weighted Regression (GWR) models to reasonably explain the spatial phenomenon. We also compared the changes in the effects of various factors from 2010 to 2014 and 2015 to 2020. These analyses provide valuable insights for enhancing the effectiveness of government regulations and effectively addressing the issue of straw burning.
This paper is organized as follows. The study area and datasets are introduced in Section 2. Section 2 describes the methodology, including the kernel density estimation and GWR models. Section 3 reports the results and Section 4 provides a discussion of the results. Section 5 summarizes this study and draws conclusions.

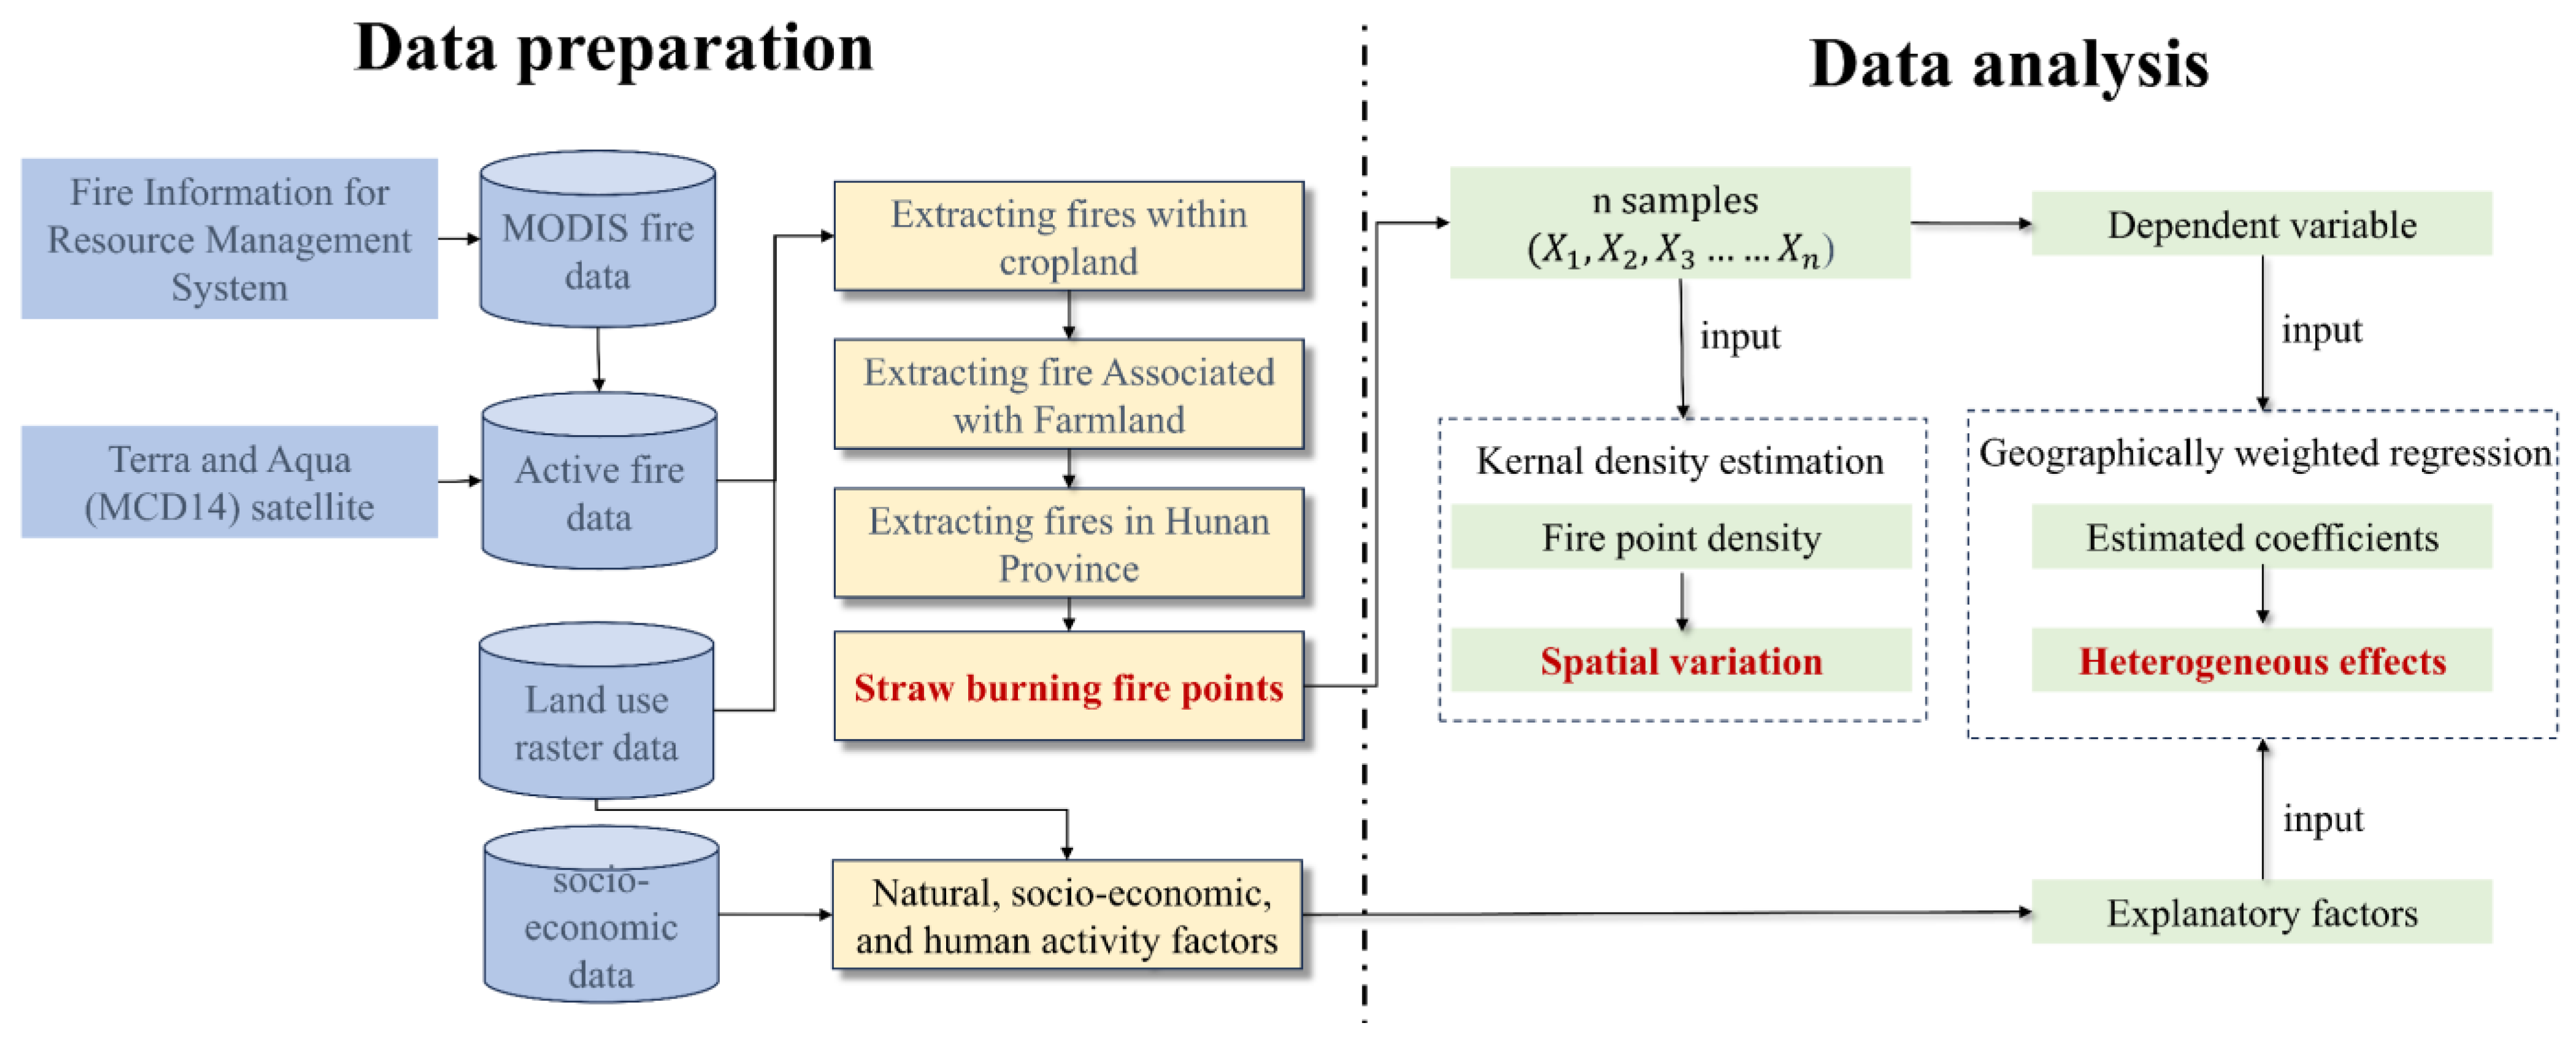
2. Materials and Methods

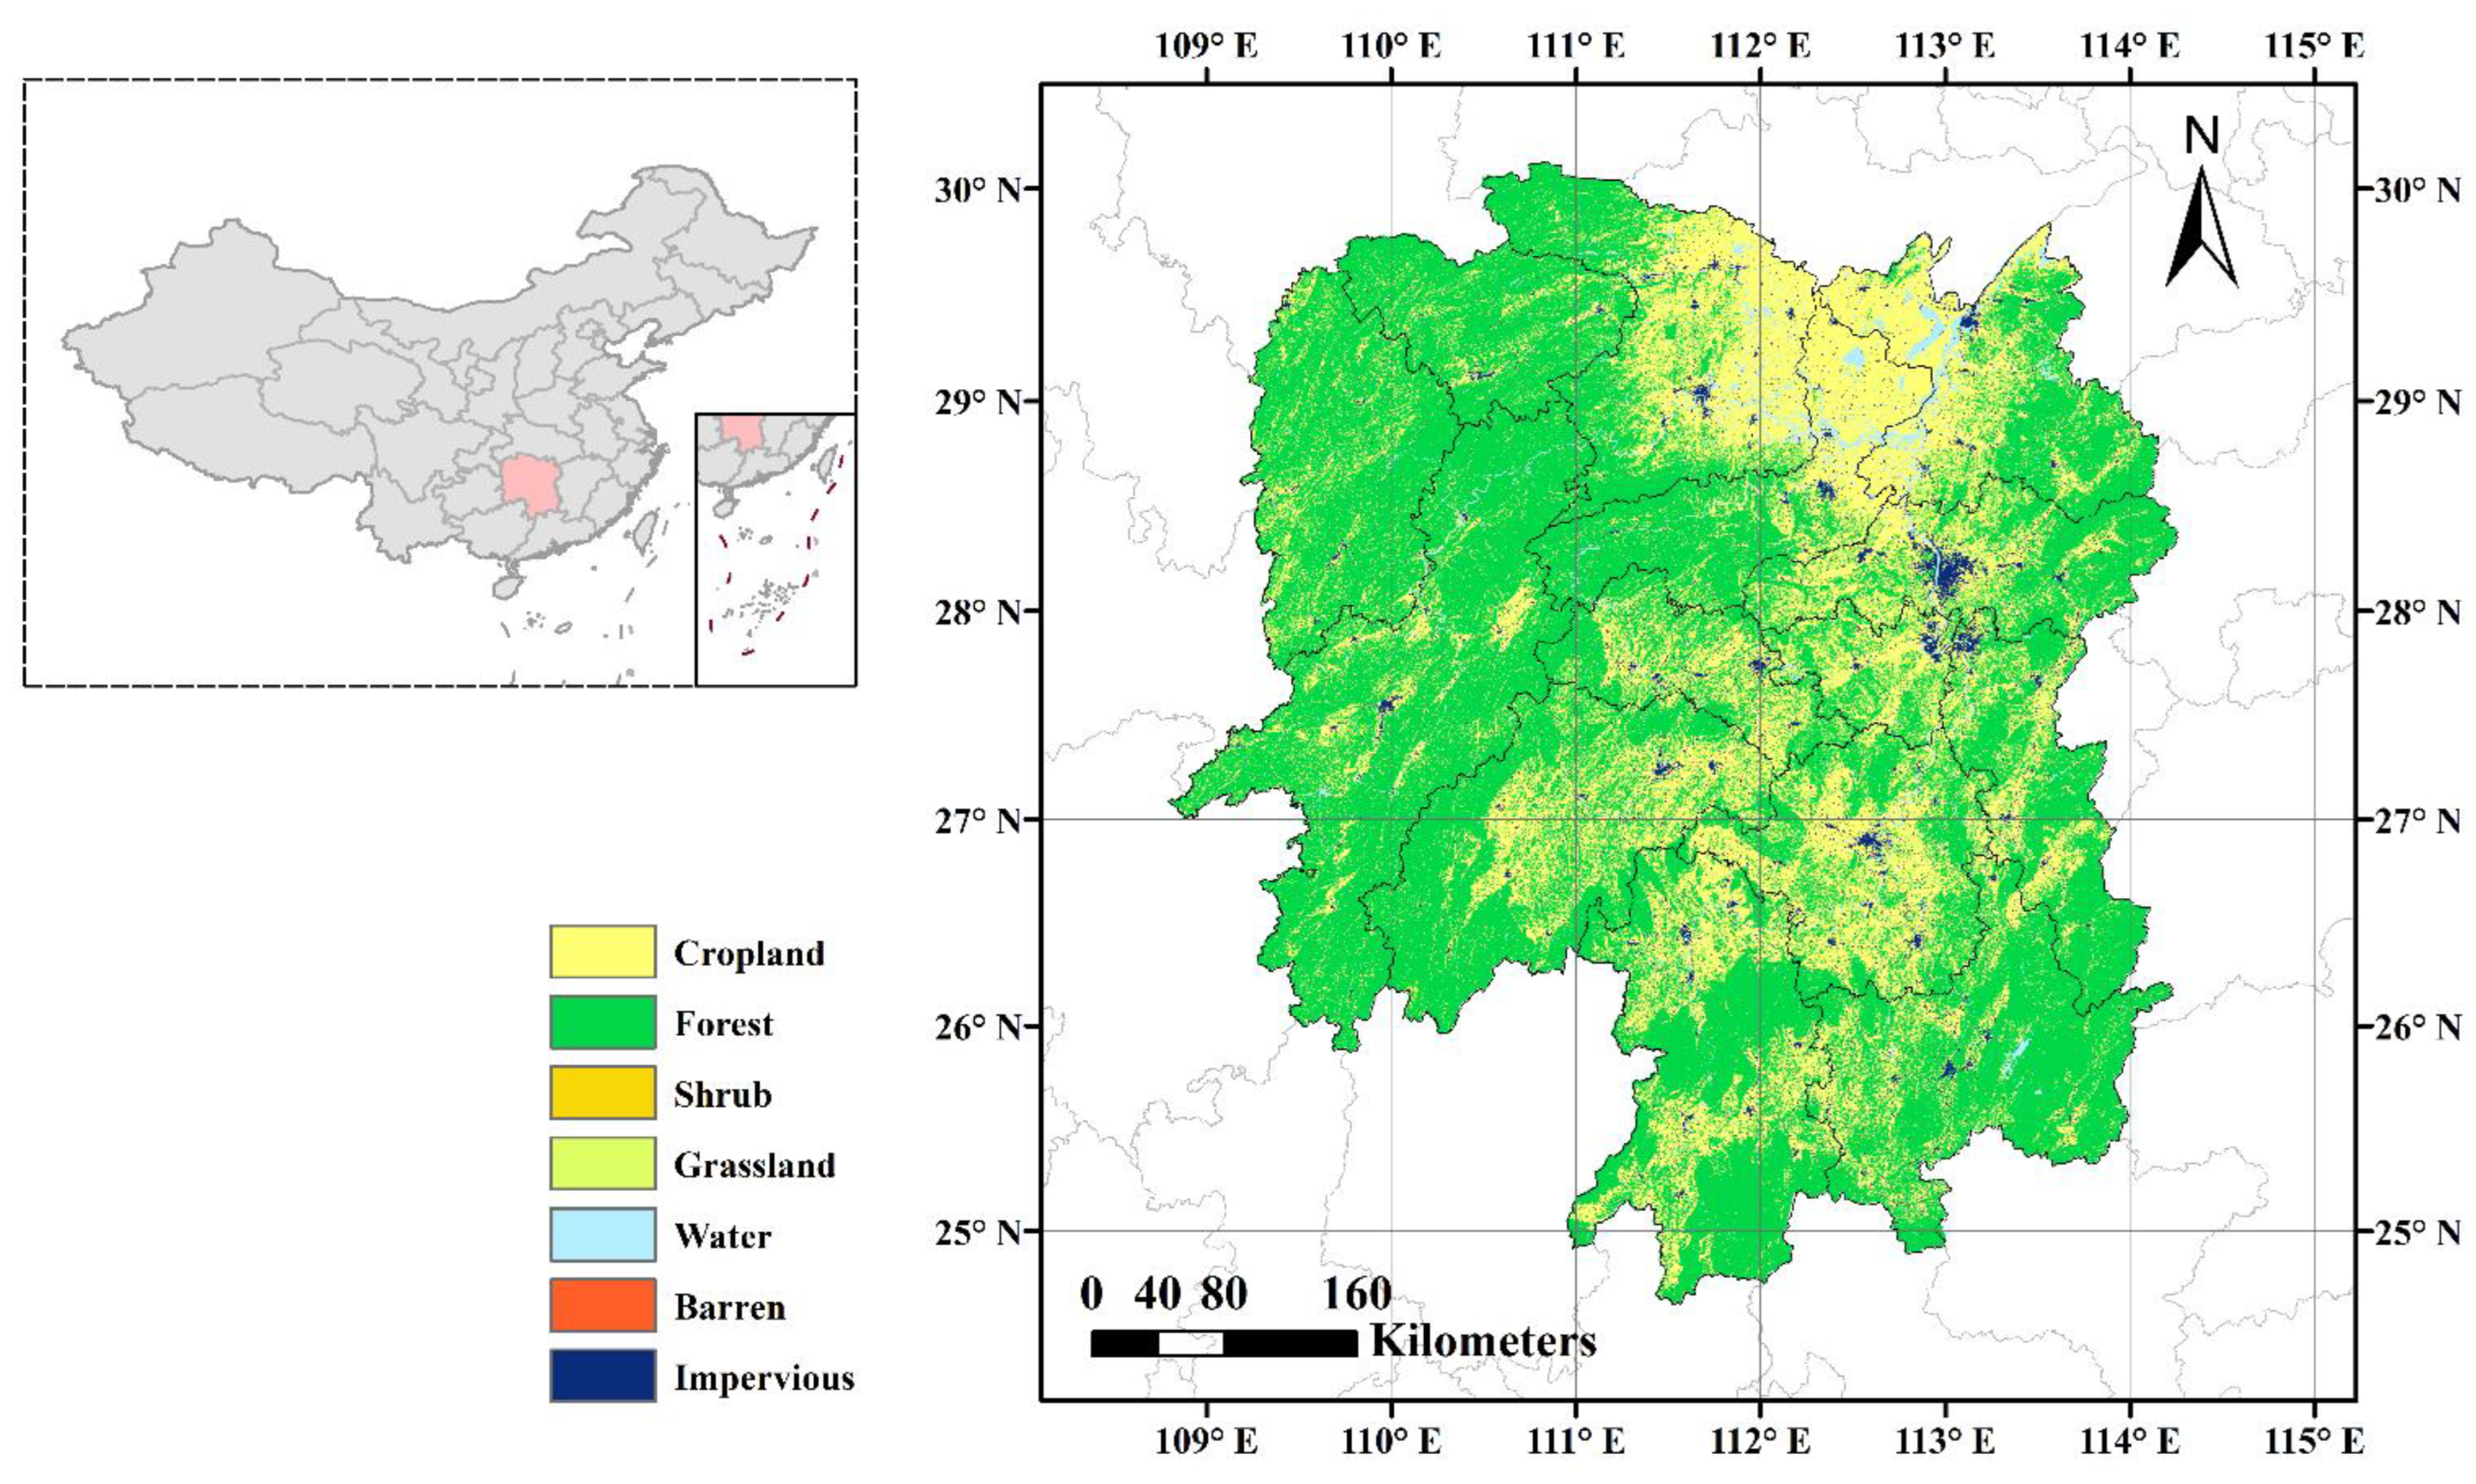
2.1. Study Area and Straw Burning Data

Hunan Province is situated in the central and southern regions of China, spanning from 108°47′ to 114°15′E longitude and 24°39′ to 30°08′N latitude. It covers a total area of 211,800 km2 and comprises 13 cities and 122 counties. By the end of 2021, the population of permanent residents reached 66.22 million, and the per capita GDP was 69,400 yuan. The landforms of Hunan Province are diverse, with mountains and hills dominating the region. The province is surrounded by mountains to the east, south, and west, while the central area consists of hills. In the north, there are lake basin plains. Diverse soil types provide favorable conditions for agriculture, forestry, animal husbandry, and fishery production in Hunan Province, as depicted in Figure 1. It is a predominantly agricultural province with distinctive natural resources. It has become an important region for grain production in China and requires efficient monitoring technology to oversee the burning of straw in the area.
In order to obtain data on straw burning in Hunan Province from 2010 to 2020, the methods were used as follows, as shown in Figure 2. First, we downloaded the MODIS fire data from the Fire Information for Resource Management System (FIRMS, https://firms.modaps.eosdis.nasa.gov/, last access: 30 September 2021). The MODIS Fire and Thermal Anomalies product is available from the Terra (MOD14) and Aqua (MYD14) satellites, as well as a combined Terra and Aqua (MCD14) satellite product, which can show active fire detections and thermal anomalies. The sensor resolution is 1 km, and the temporal resolution is daily. Each active fire data contains information such as latitude, longitude, time, brightness, and so on. Second, we extracted the land use raster data of each fire point, excluding the fire points that were not in the range of farmland. Thermal anomalies associated with forest fires, grassland fires, industrial emissions, and coal-fired power plants were also excluded. Only the thermal anomalies related to farmland, especially straw burning, were retained. Third, the administrative boundary data were used for masking to produce a database of straw burning fire points in Hunan Province. Finally, based on the extracted data on straw burning and the vector data of China’s administrative divisions, a regional statistical analysis was conducted to obtain data on straw burning in different regions in Hunan Province. The distribution of fire points is presented in Figure A1 (refer to Appendix A). Table 1 presents the sources and types of data used in this study.

2.2. Kernel Density Estimation

In this paper, we use the spatial smoothing function of Kernel Density Estimation (KDE) to analyze the distribution density of point elements related to straw burning in various regions. The objective is to uncover the evolutionary trend of geographical element diversification, as well as the characteristics of concentration and dispersion. Additionally, we aim to examine the spatial and morphological characteristics of straw burning in different regions. KDE is a nonparametric method used to estimate the Probability Density Function (PDF) of the underlying data [30]. It is highly effective in visualizing and analyzing the density variations in the spatial distribution of point elements.
This method does not require prior knowledge about the data distribution when estimating, and it does not make any assumptions about the distribution of the data. It is a method to study the characteristics of the data distribution using the data sample itself. Therefore, it is widely used in many areas of basic research and engineering practice [31,32].
Specifically, the method assumes that X 1 , X 2 , X 3 X n are samples from a continuous distribution f x ,   x ϵ R with n values, then f x is estimated to be:
f ^ x = 1 n h i = 1 n K ( x X i h ) ,   x R ,
where the f ^ x is the kernel density estimation value, n is the number of samples, K is the kernel function, and h is the defaulted bandwidth.

2.3. Geographically Weighted Regression Models

To investigate the factors contributing to straw burning in Hunan Province from 2010 to 2020, we identified ten explanatory variables, including natural, socioeconomic, and human activity factors. Natural factors include elevation, slope, and aspect. Socioeconomic factors include the area of crops sown, crop yield, population density, and the Gross Domestic Product (GDP). Human activity factors include road density, settlement density, and distance from roads. Based on the spatial and temporal distribution characteristics of straw burning, the number of fire points from 2010 to 2014 and 2015 to 2020 was used as the dependent variables in this study when applying the GWR model. Table 2 presents the descriptive statistics for all variables.
Unlike global linear regression models such as ordinary least squares (OLS), Geographically Weighted Regression (GWR) models can capture the spatial effects of independent variables [33]. These models examine the local characteristics of explanatory variables to provide plausible explanations for spatial phenomena [34].
The normal formula of GWR is expressed as Equation (2):
y i u , v = β 0 u , v + k β k u , v × x i u , v + ε i u , v ,
where y i and x i are dependent variable and independent variable at the i t h location. u , v is the geographical coordinate of the i t h location. The parameter β k refers to the estimated coefficient for independent variables and varies from location to location. The model incorporates the geographical coordinates of observations and efficiently captures the local variations in variable effects.
For a given geographic location u , v , β k u , v can be estimated using locally weighted least squares, as shown in Equation (3):
min i = i n [ y i k   β k u , v × x i , k ] 2 × w i ( u , v ) ,
where w i ( u , v ) is the spatial weight at the location ( u ,   v ) . The Gaussian kernel function, as in Equation (4), is employed to evaluate the spatial effects:
w i j = exp d i j b 2 ,
where d i j denotes the distance between observation i and j . b is an adaptive bandwidth size, controlling the degree to which spatial effects are considered.
In this study, the Akaike Information Criterion (AICc) and coefficient of determination (R-square) are used to evaluate model performance. A higher value of the two metrics suggests a better fit of a model. The AICc is defined by Equation (5):
I C c = 2 × l l f + 2 × n E N P + 1 / ( n E N P 2 ) ,
where the l l f refers to the value of the loglikelihood function, n is the number of observations, and E N P denotes the number of parameters.

3. Results

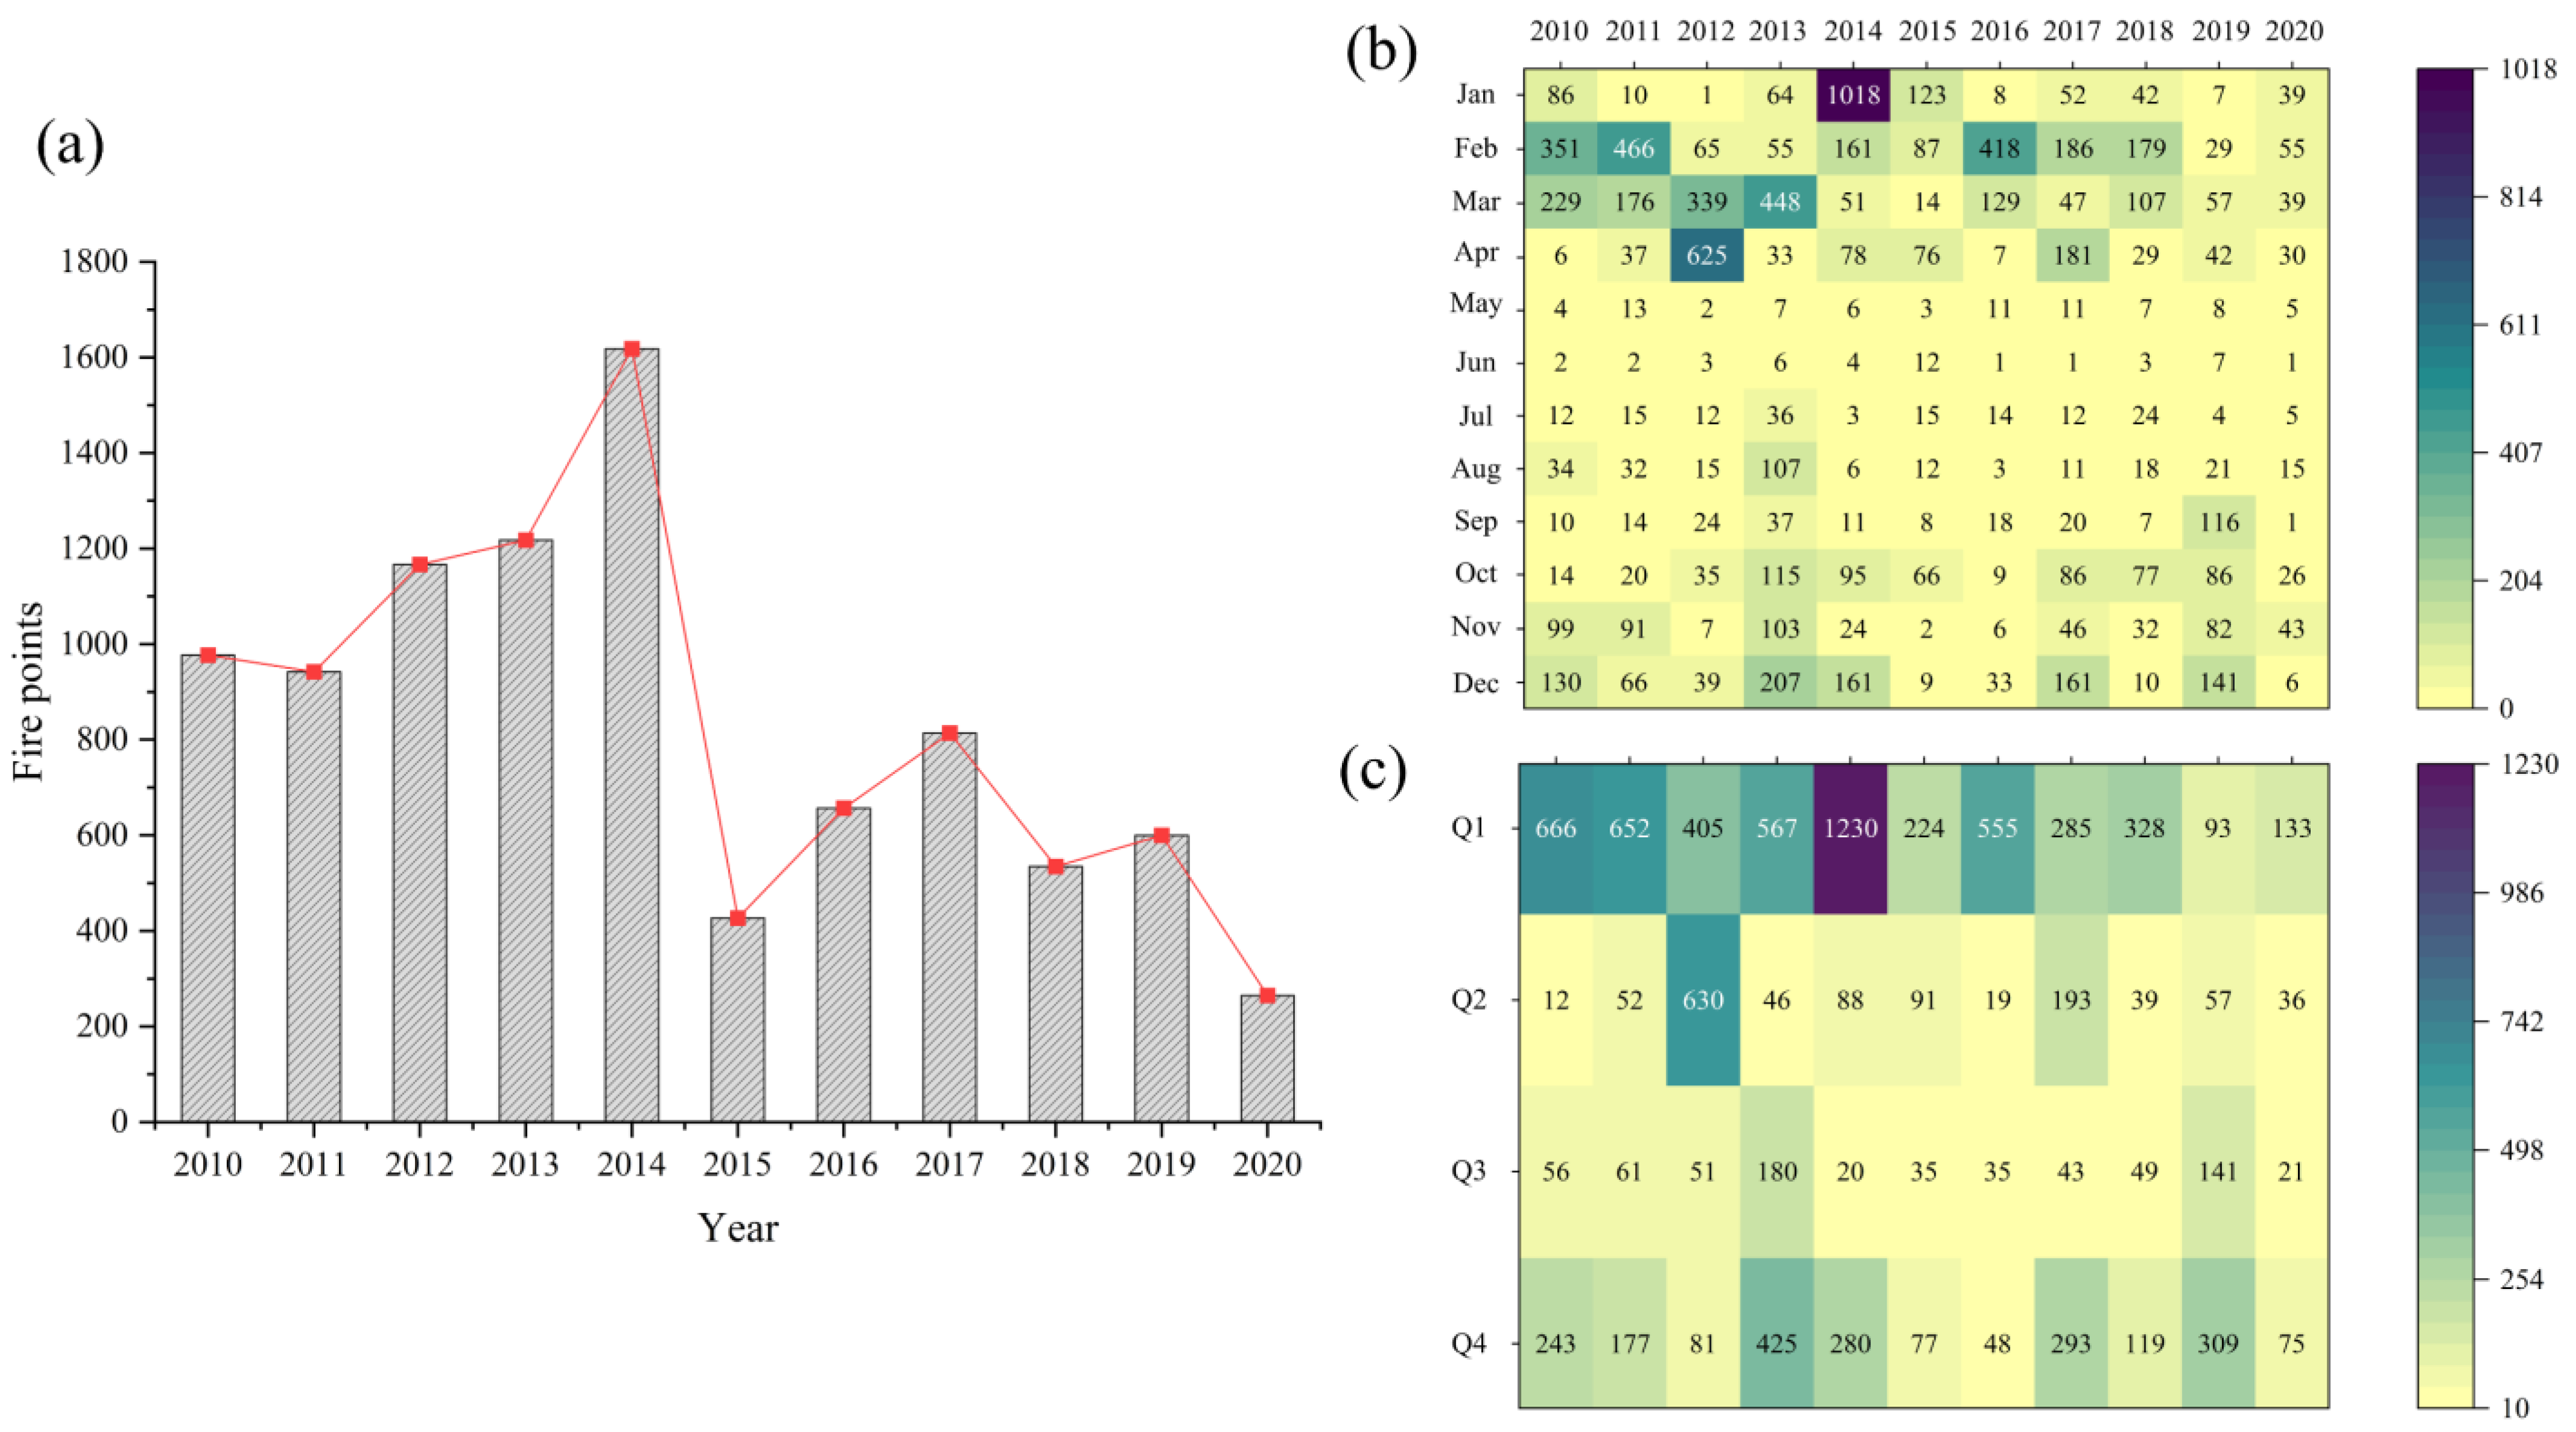
3.1. Temporal Variations of Straw Burning in Hunan Province

As shown in Figure 3a, from 2010 to 2020, there were 9220 fire points in Hunan Province. The highest number was 1618 in 2014, representing 17.5% of the total, while the lowest was 265 in 2020, accounting for 2.87% of the total. Between 2010 and 2020, when comparing the annual quantities, it was not difficult to find that the changes in fire points in Hunan Province exhibited obvious periodic characteristics. There are two main stages of straw burning in Hunan Province. The first stage occurred from 2010 to 2014. The total number of fire points was 5922 from 2010 to 2014, accounting for 64.23% of the overall total. The initial stage saw a significant increase in the number of fire points. This indicates a clear upward trend and falls into the category of rapid growth stage. A sharp decrease occurred in 2015, and the number of straw fire points in 2015 decreased by 73.61% compared to 2014. The second stage occurred from 2015 to 2020, with an initial increase from 2015 to 2017, followed by fluctuations after 2018, and ultimately a significant decline in 2020. The number of fire points in 2020 decreased by 59.67% compared to 2016 and 55.83% compared to 2019.
Moreover, the differences in the monthly variation of fire points were more pronounced. As shown in Figure 3b,c, the number of fire points has two peak intervals during the year: one from January to April and the second from November to December. It also shows a trend of fluctuating growth from June to December. The number of fire points in May and June of each year was relatively low, with the monthly average not exceeding 20 fire points. In addition, straw burning is primarily concentrated in spring and winter, with a noticeable decrease in the number of fires during summer and autumn. As a result, straw burning is mainly concentrated in the first and fourth quarters of the year.

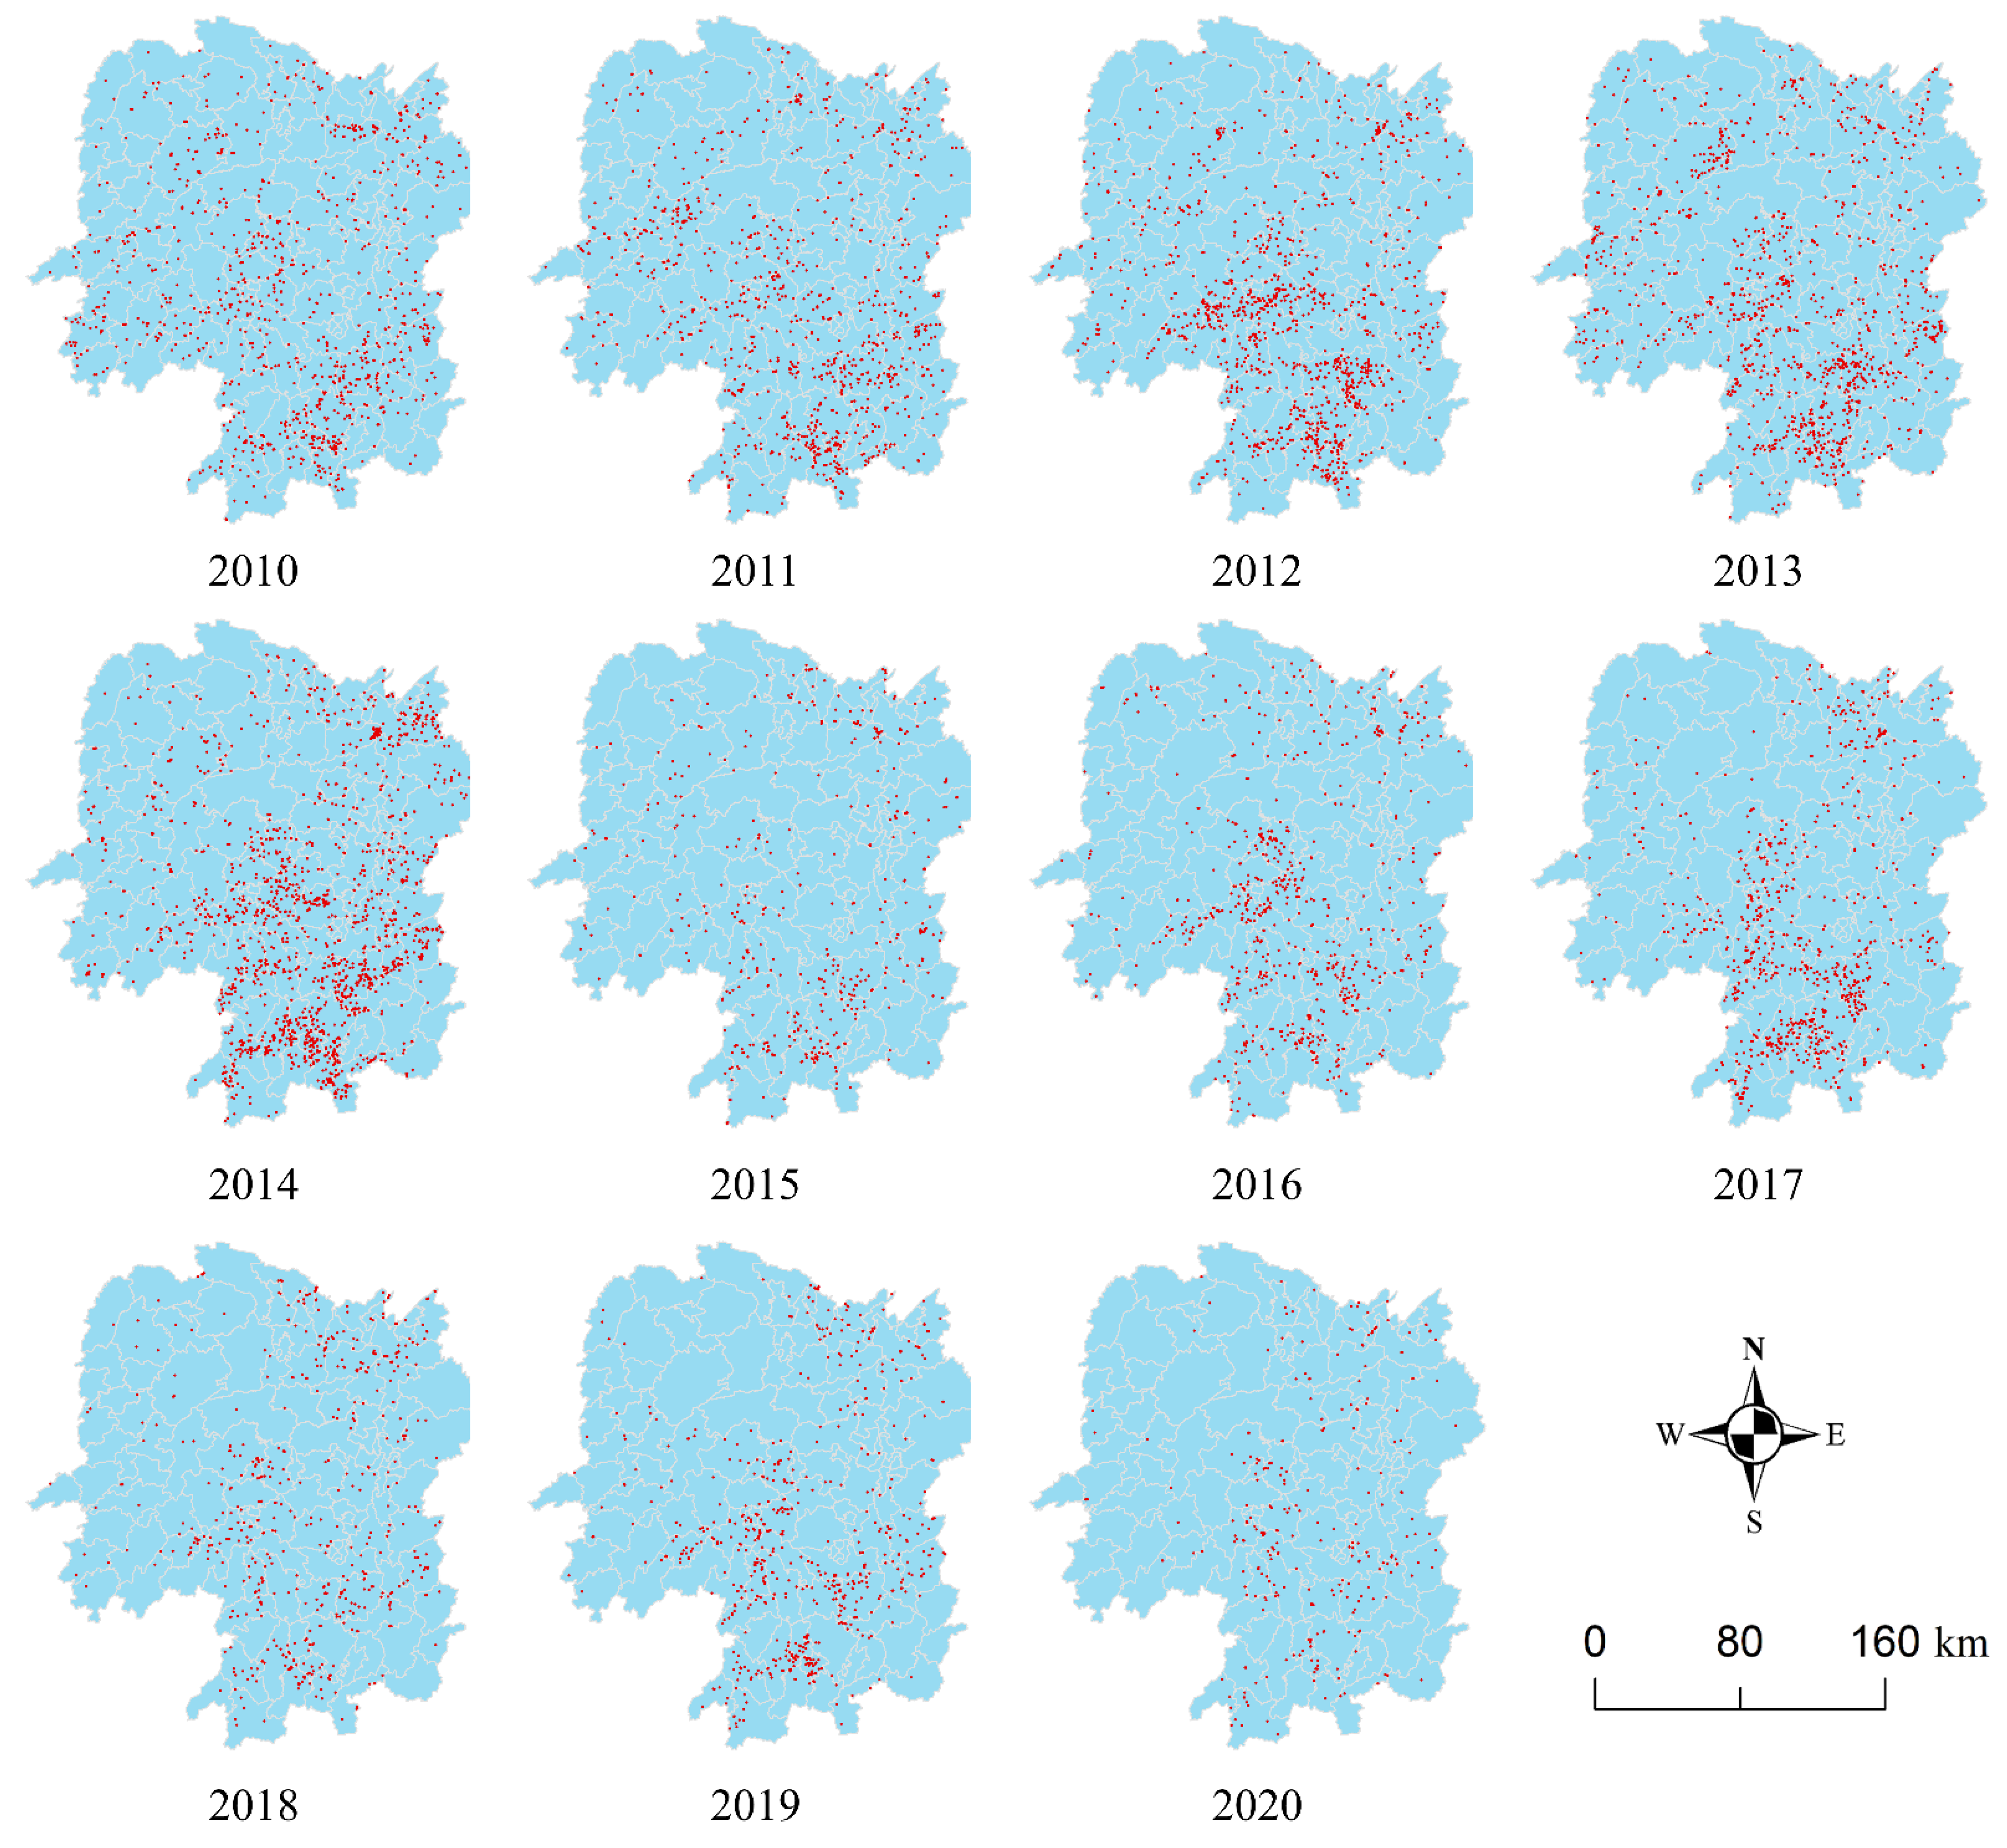
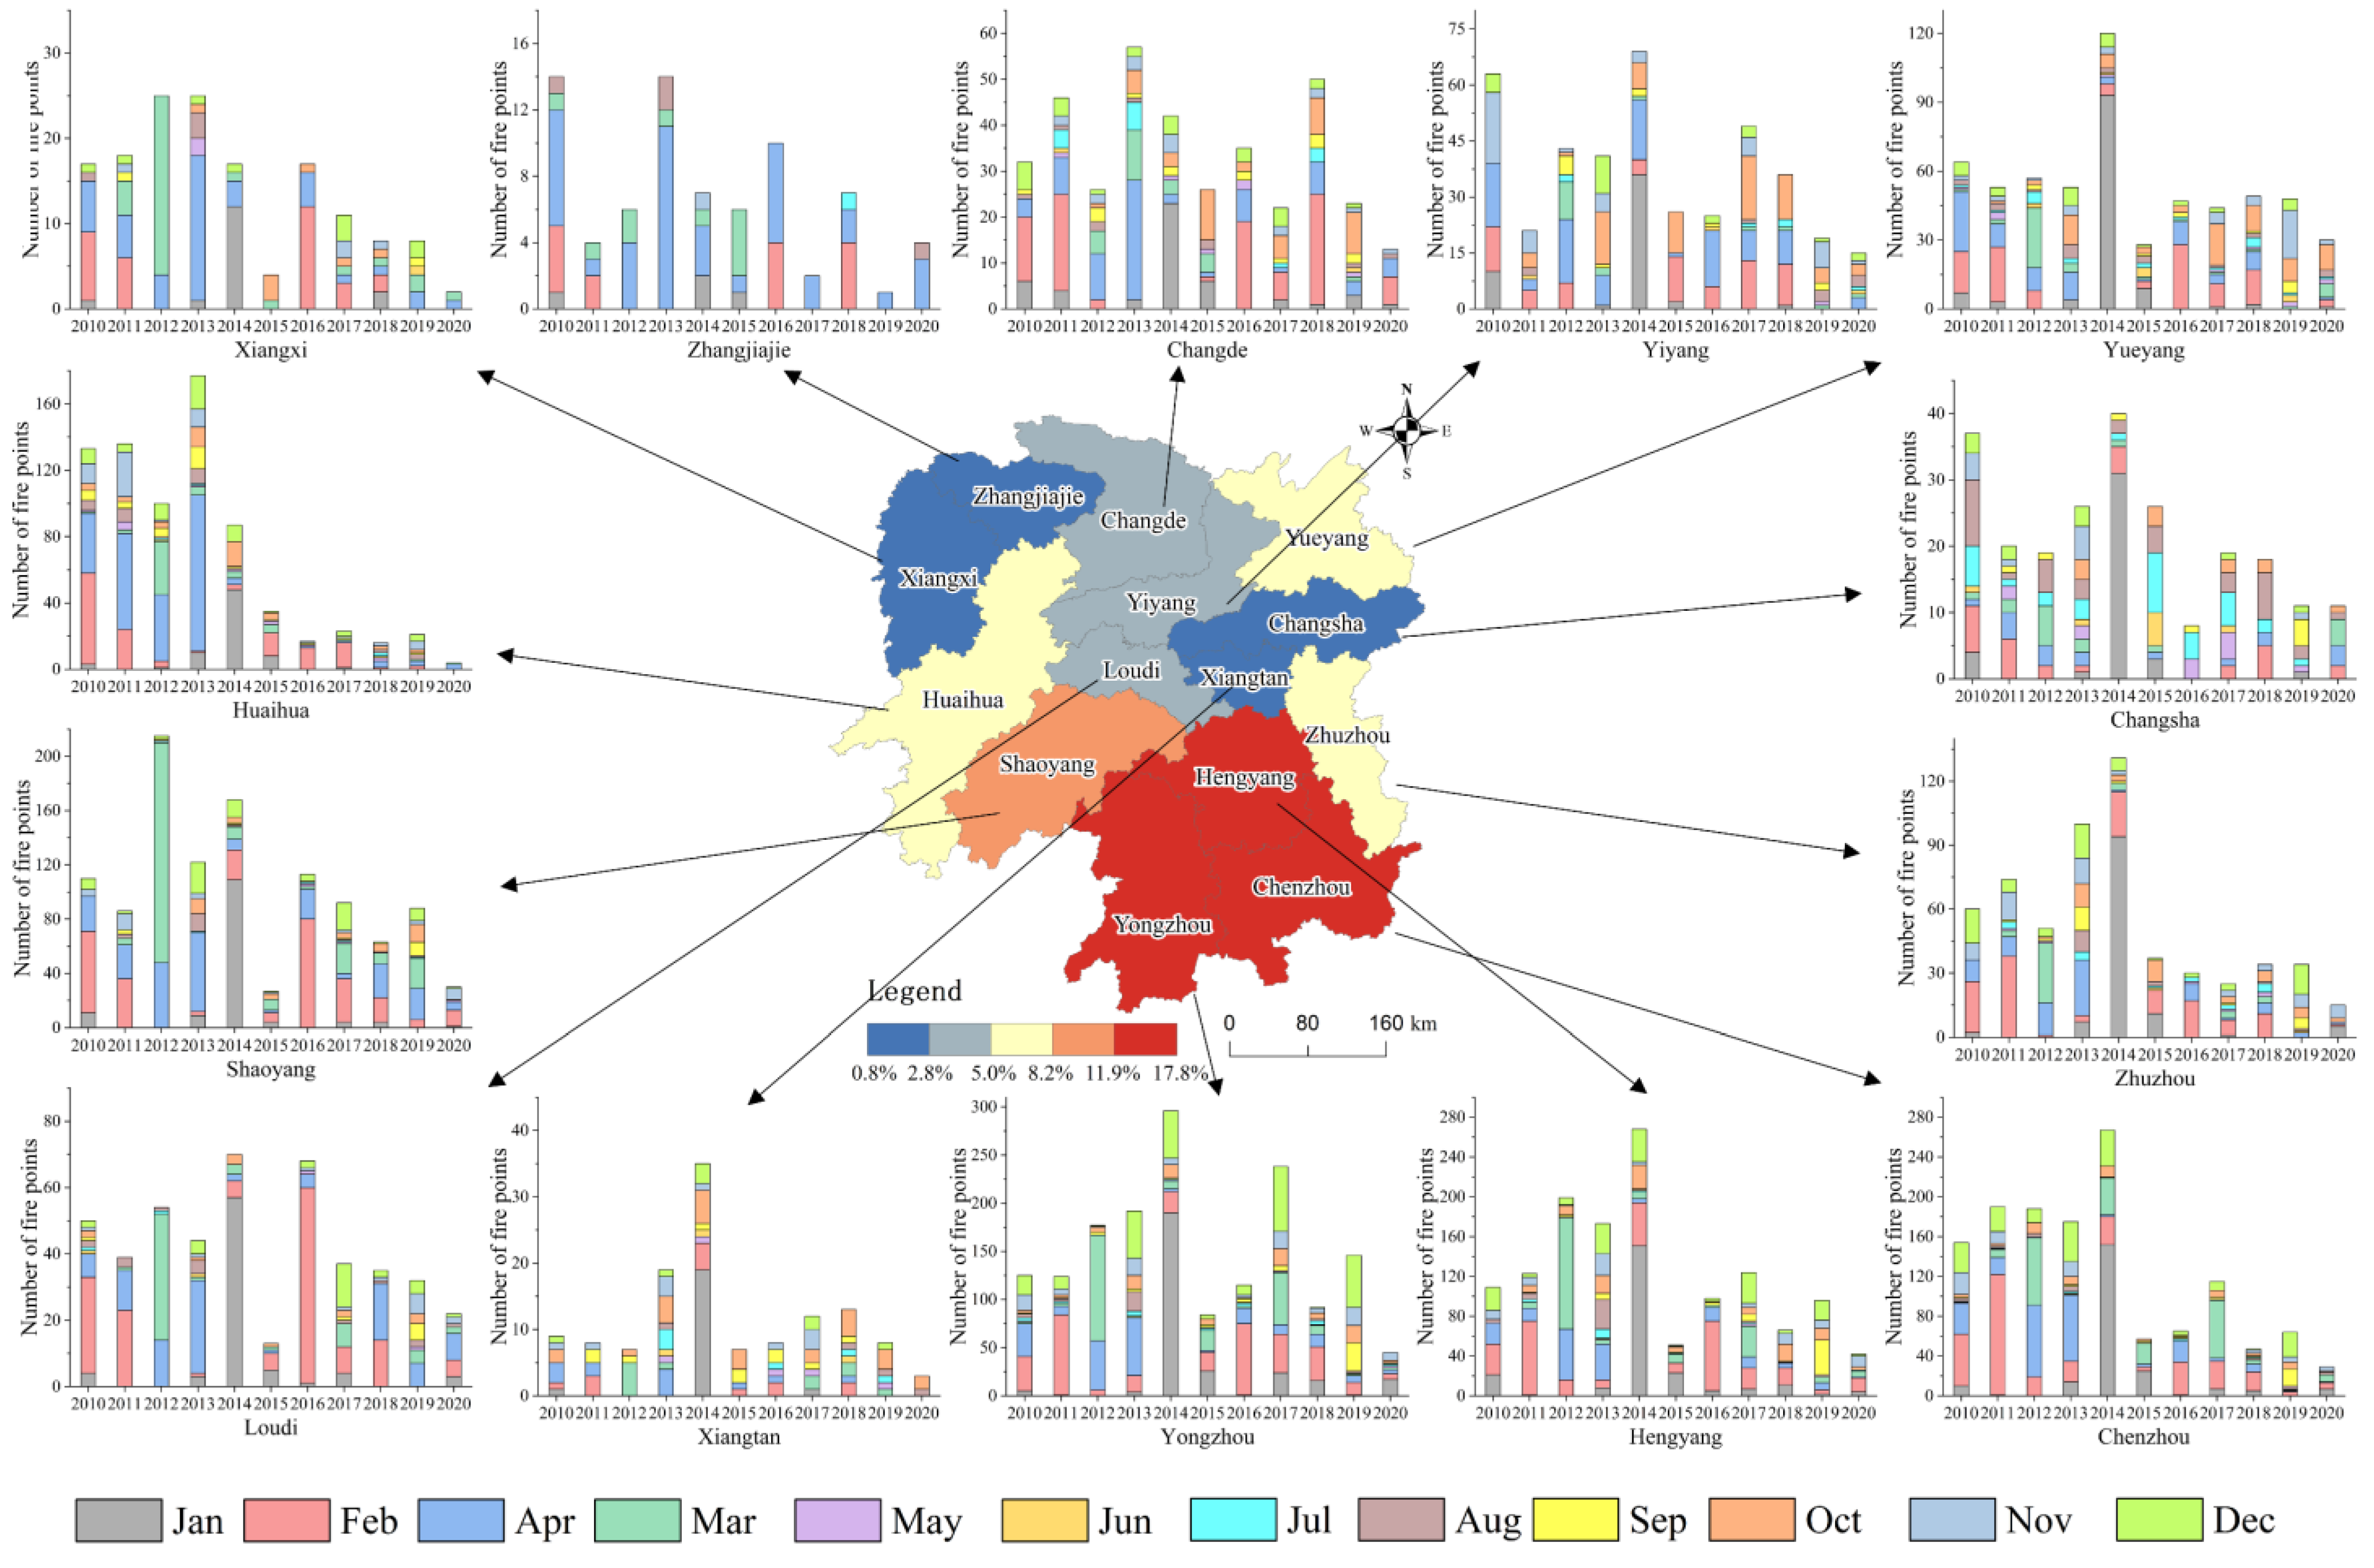
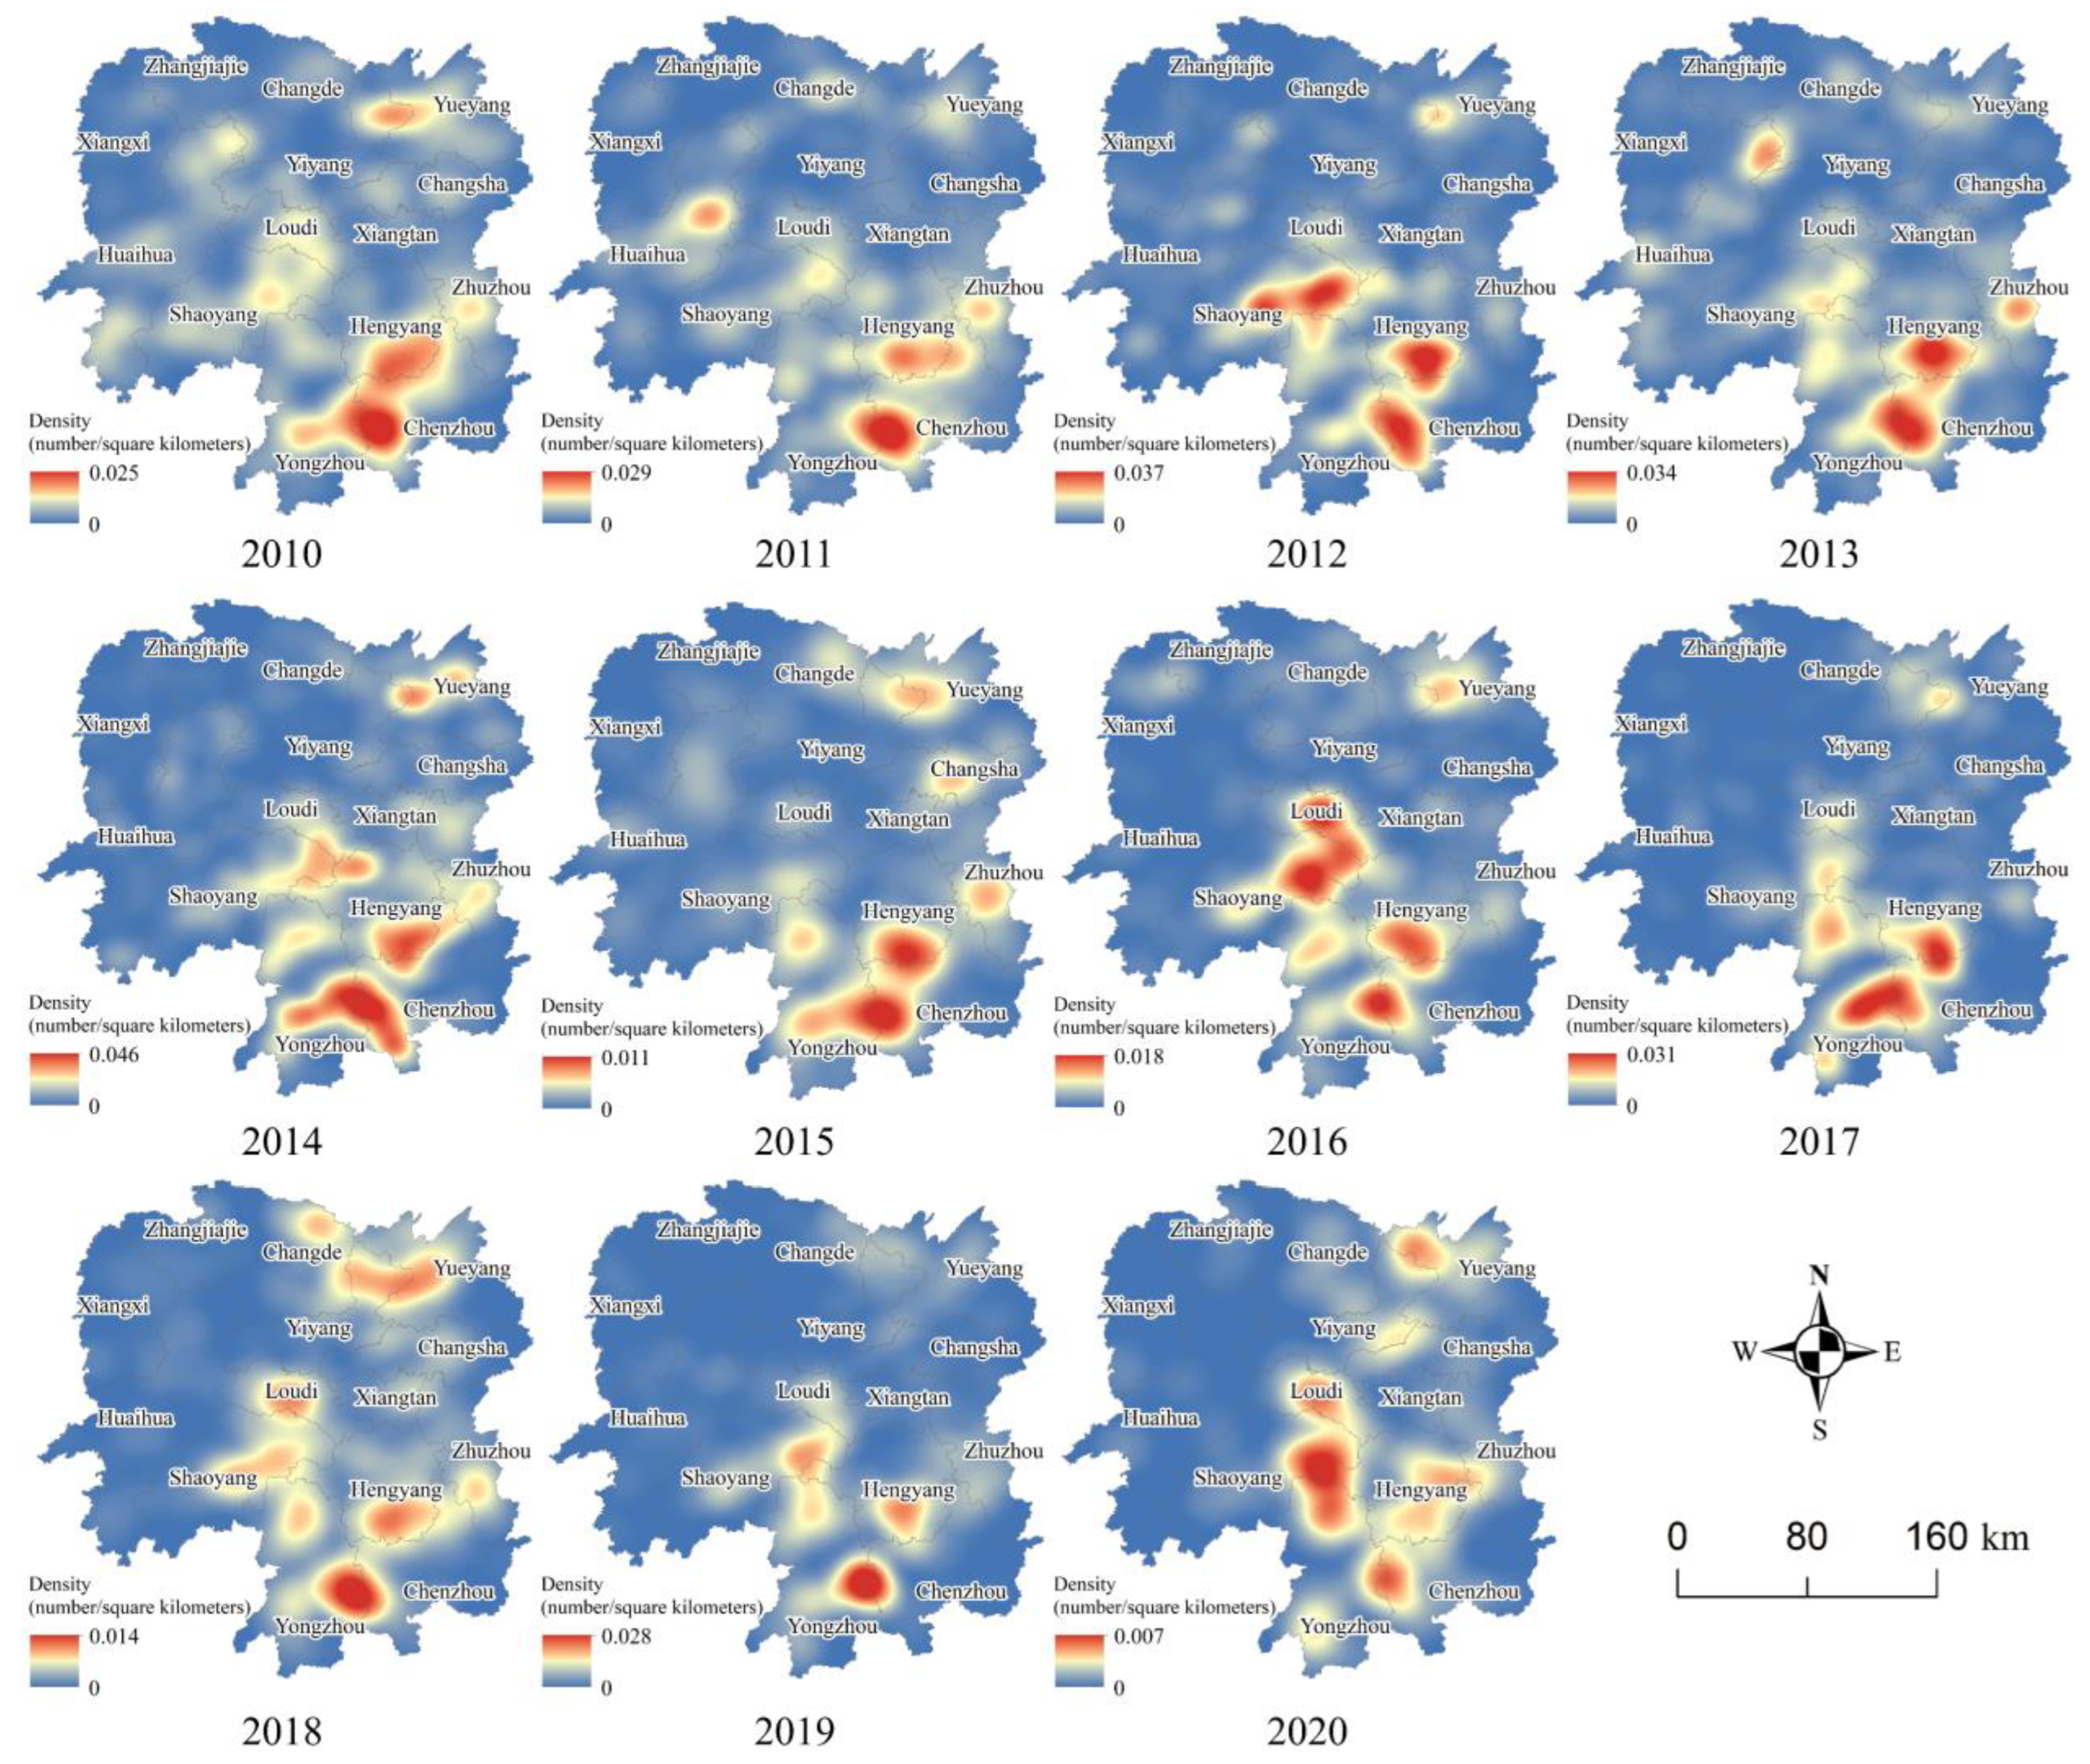
3.2. Spatial Distribution of Straw Burning

Figure 4 shows the distribution of fire points for the 14 cities of Hunan Province from 2010 to 2020. The peak years in the 14 cities during this decade differed slightly. Changde, Zhangjiajie, Xiangxi, and Huaihua cities had the highest number of fire points in 2013, but the numbers decreased in 2014. In 2014, the number of fire points in other cities remained high. Moreover, the number of fire points in several cities in the eastern and western regions of Hunan Province significantly decreased in 2015. For instance, cities such as Zhuzhou and Chenzhou in the east, as well as Huaihua and Shaoyang in the west, experienced a sudden decline in the number of fire incidents. In comparison, the number of fire points in cities in northern and central Hunan Province showed minimal fluctuations before and after 2015. These cities include Xiangxi, Zhangjiajie, Changde, Yiyang, Yueyang, Loudi, and Yongzhou. The high number of fire points in 2014 occurred in the northern, eastern, and southern regions of Hunan, including the cities of Yueyang, Zhuzhou, Hengyang, Chenzhou, Yongzhou, Shaoyang, and Huaihua. The high number of fire points in 2020 is primarily concentrated in southern Hunan, which includes Shaoyang, Yongzhou, Chenzhou, and Hengyang. However, it is significantly lower compared to 2014.
As depicted in Figure 5, the dense areas of fire points in Hunan Province are primarily concentrated in the northeastern, southwestern, and southern regions. From 2010 to 2014, the number of fire spots significantly increased from the southern to the southeastern and central regions, extending as far as Yueyang city. The number of fire points also increased to 1.66 times that of 2010. The density centers of fire points in Hunan Province have gradually shifted from one to three. These density centers were mainly distributed at the junction of Yongzhou, Chenzhou, Shaoyang, Loudi, and Hengyang cities. From 2015 to 2020, a distinct center of density emerged only in 2017 and 2019, primarily at the junction of Yongzhou and Chenzhou cities. From a province-wide perspective, the dense areas of fire points in Hunan Province exhibited a pattern of initial increase, followed by a sharp decline, a gradual recovery, and, ultimately, a decrease from 2010 to 2020. Fire point density is also decreasing. The results of this change are closely related to the increased administrative supervision and punishment of straw burning in Hunan Province. This reflects the effectiveness of the province’s ban on straw burning policy. On the other hand, the high density of fires is mostly concentrated near the intersections of different cities. This is likely due to the lack of effective administrative supervision at the urban fringe, which increases the likelihood of straw burning in these areas compared to other locations.

3.3. Spatial and Temporal Variations of Driving Forces

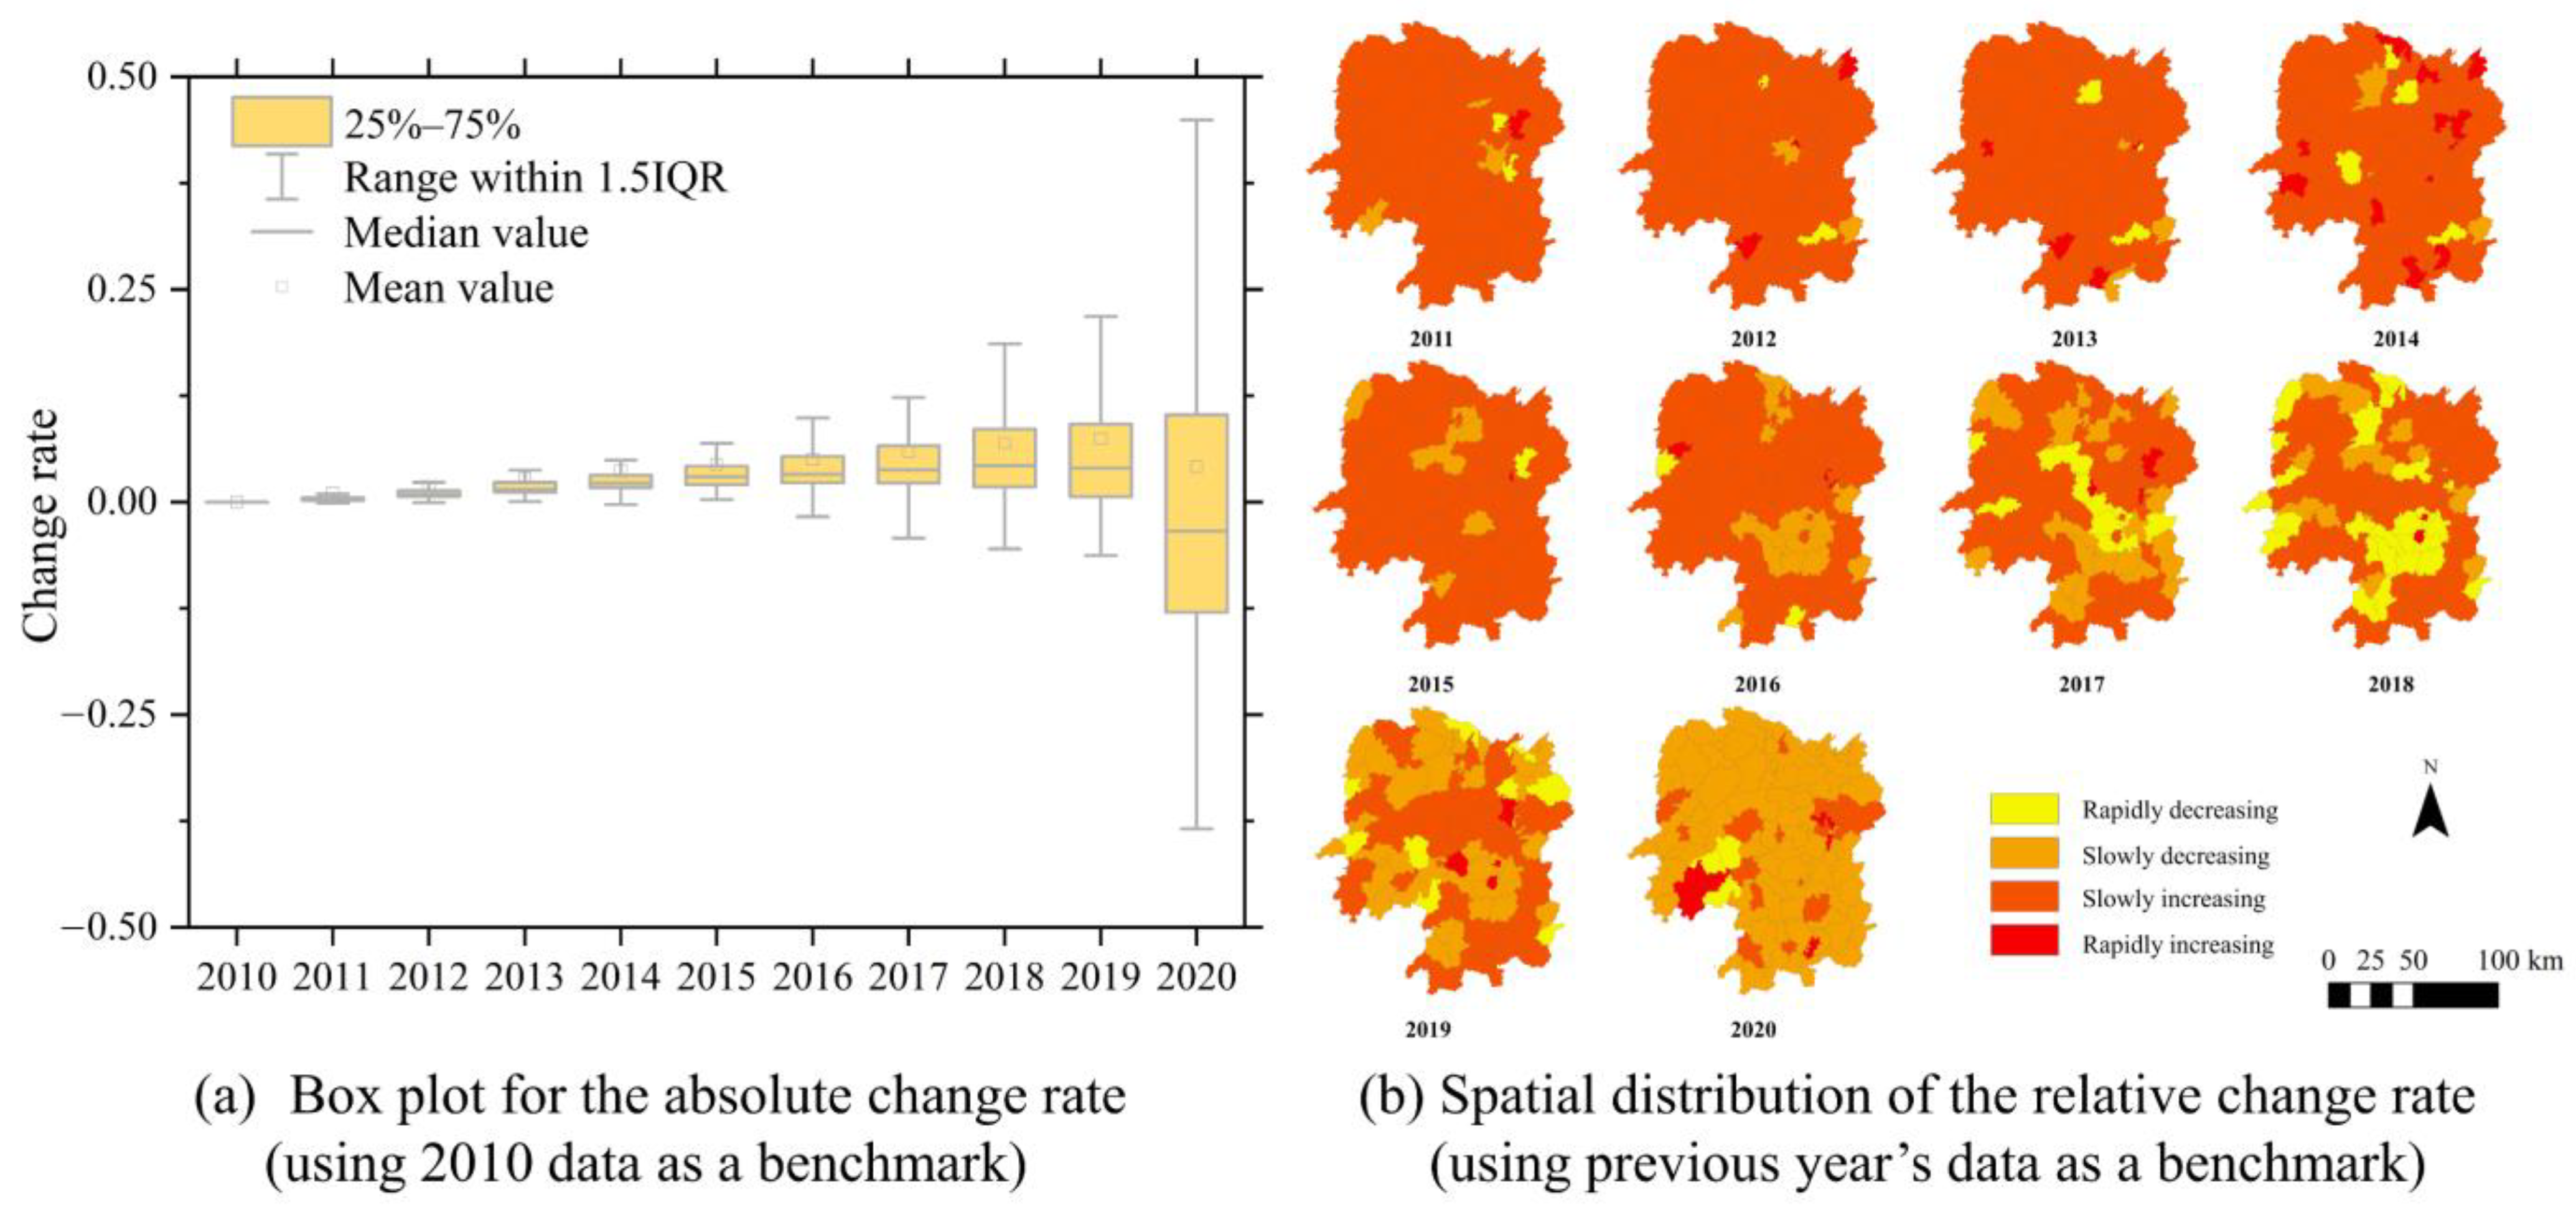
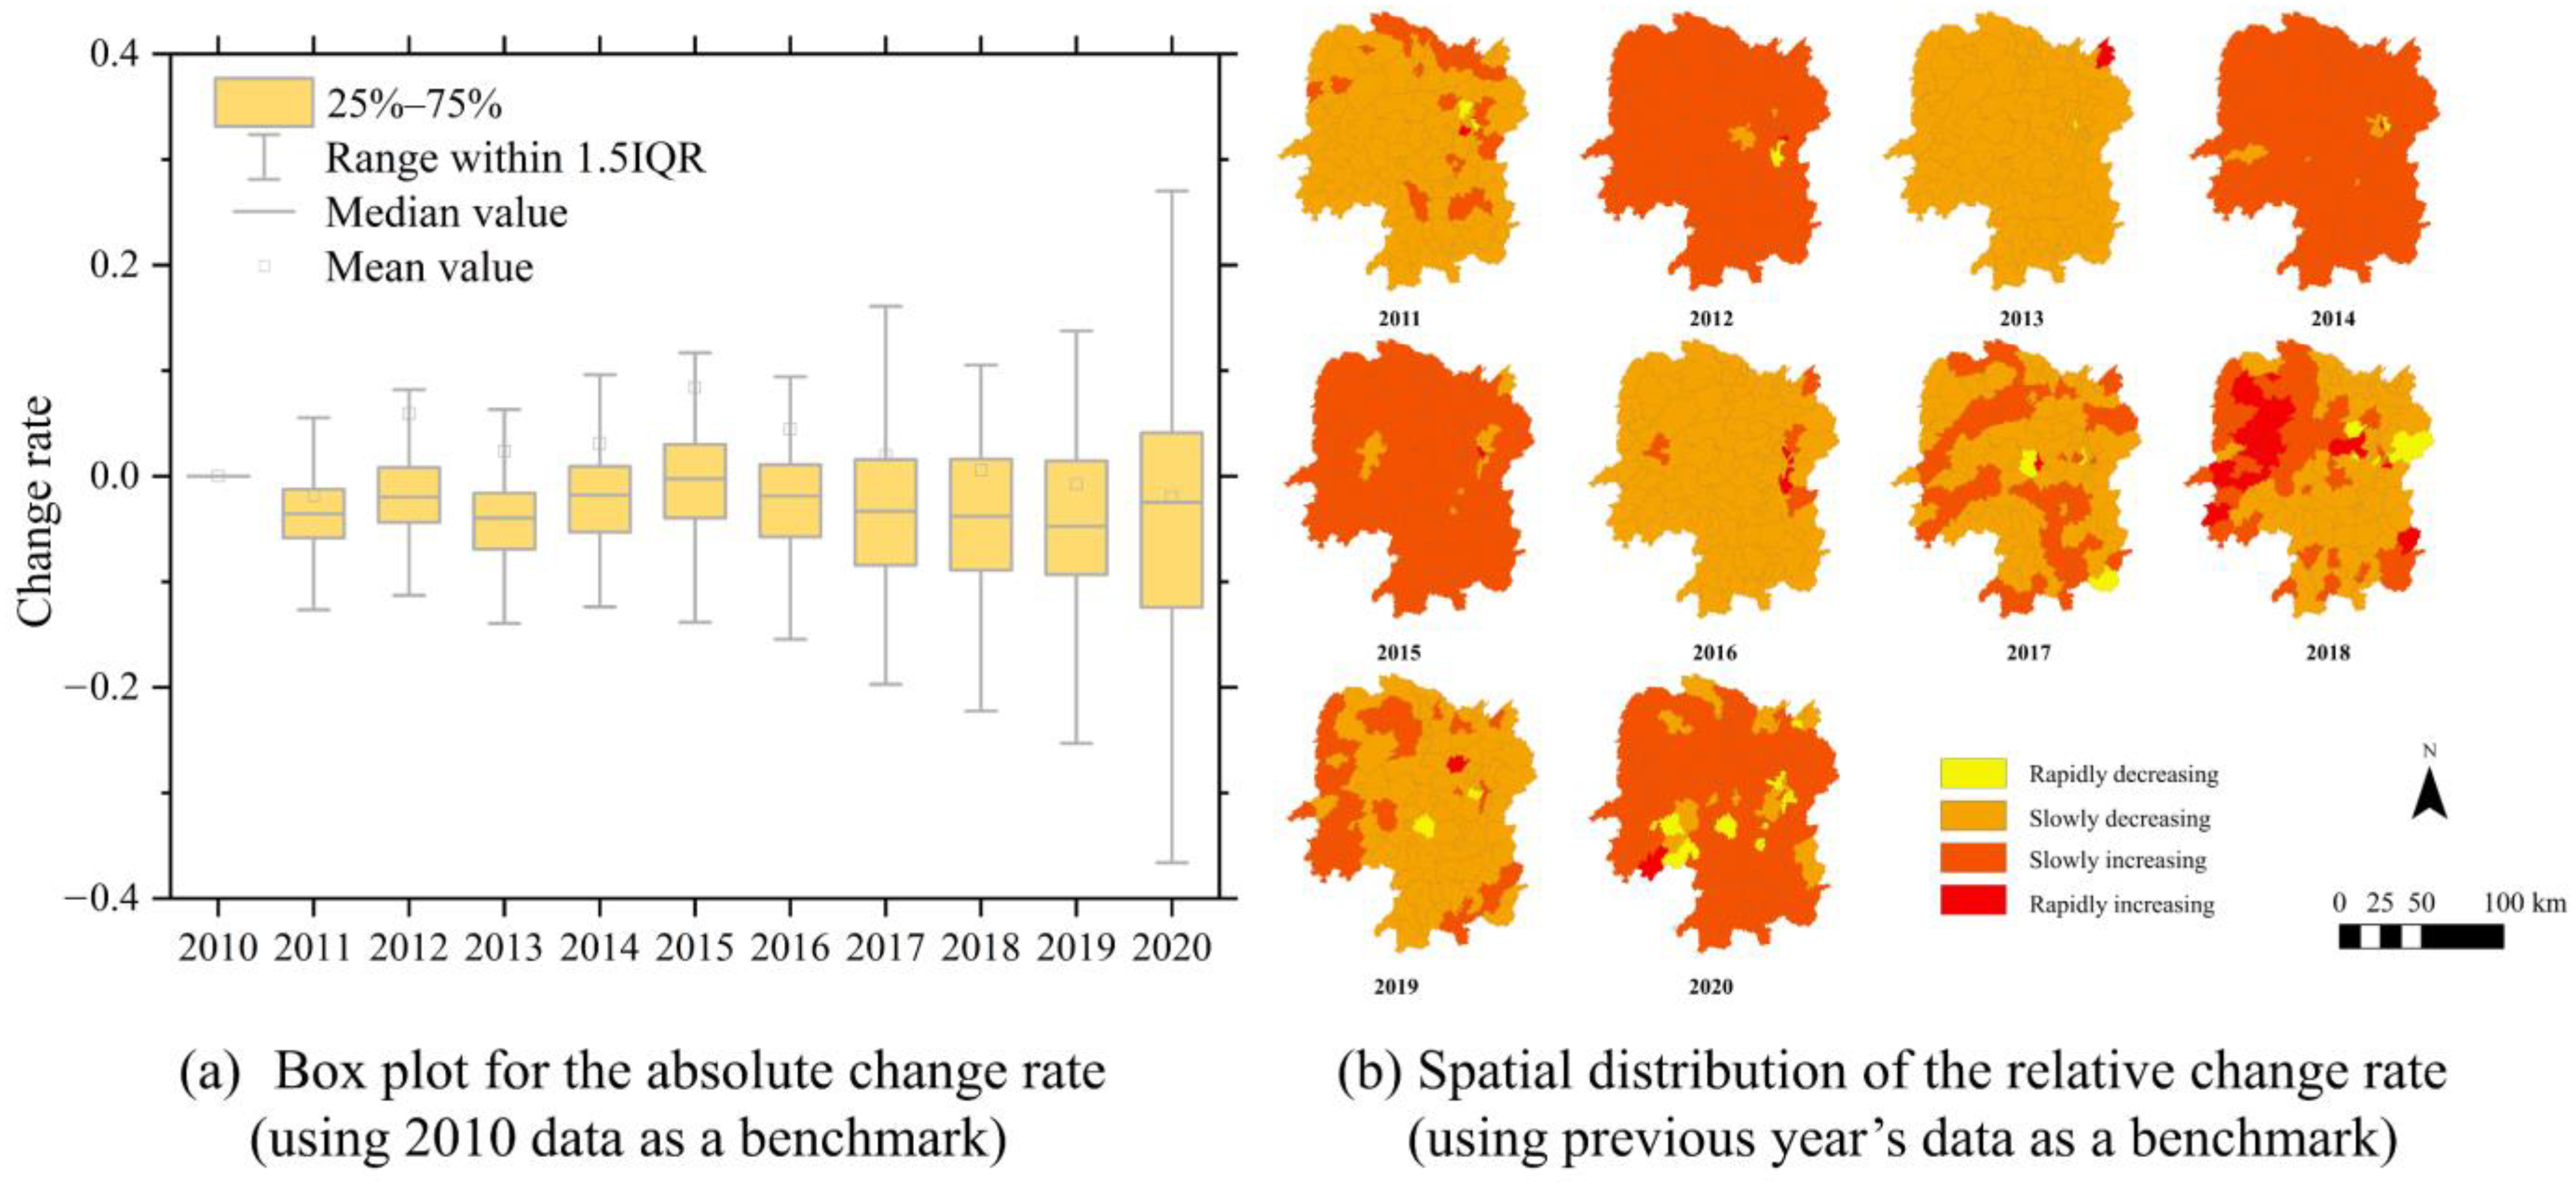
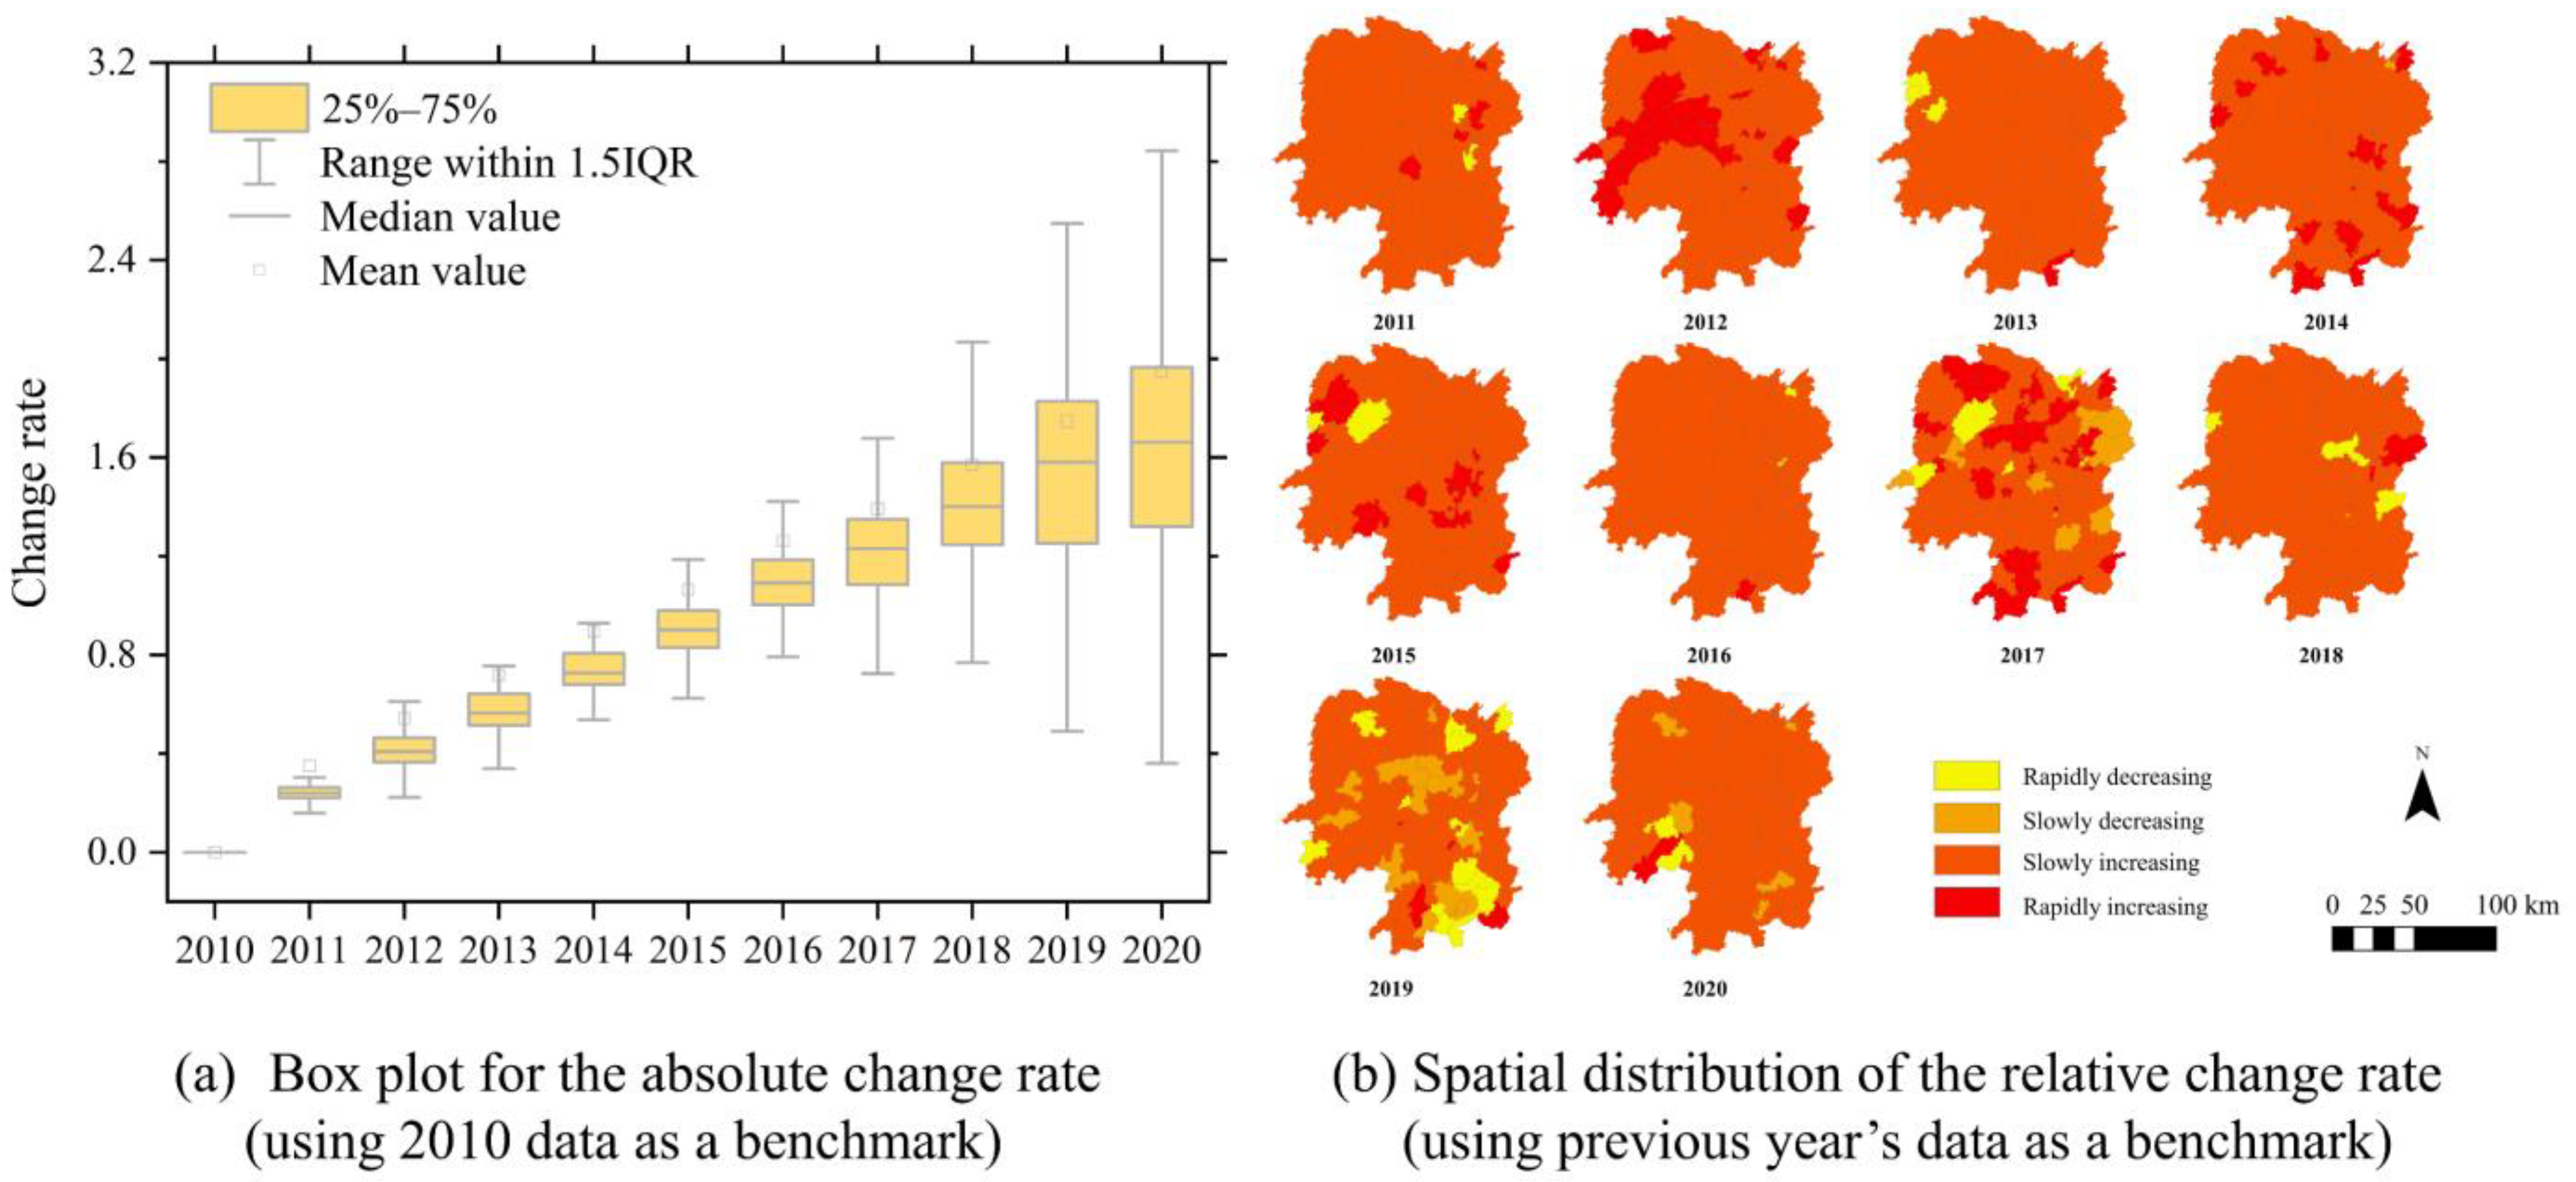
3.3.1. Annual Change Rate

Influenced by socioeconomic and natural factors, there are significant spatial variations in the practice of straw burning across different counties in Hunan Province. From 2010 to 2020, straw burning in Hunan Province displayed different characteristics during two periods: 2010–2014 and 2015–2020. To understand the potential drivers, we calculated the year-by-year rates of change for various factors including natural factors, socioeconomic factors, and human activity factors, as shown in Section 2.3 [27]. The change rate is divided into two types: absolute and relative change rates. The absolute change rate of the i th factor in year t is calculated as A R t i = x t i x 1 i x 1 i , which requires the first year’s data as a benchmark. The relative change rate of the i th factor in year t is calculated as R R t i = x t i x t 1 i x t 1 i , which requires the previous year’s data as a benchmark; thus, these figures display the change rates of different factors from 2011 to 2020 (See Appendix A).
The absolute change rate shows the global variations in associated factors, while the relative change rate shows the local characteristics of associated factors. According to Figure A2a, the population as a whole is growing from 2010 to 2018 and stabilizes or even shows a decreasing trend by 2019 and 2020. The increasing size of the box each year indicates a gradual population difference between regions. Figure A2b shows that the population of most districts steadily increased from 2010 to 2014. However, between 2016 and 2020, the number of regions in Hunan Province experiencing negative population growth increased significantly, especially in Hengyang and Yongzhou. These two regions also have a high number of fire points. The GDP reflects the economic growth in each region of Hunan Province. Figure A3b shows that the GDP of most regions in Hunan Province has been growing rapidly from 2010 to 2020, with a particularly significant increase during the period from 2010 to 2014. The number of fire incidents increased uniformly in all regions from 2010 to 2014. However, there was a noticeable shift in the relationship between the growth of GDP and the number of fire points in each region from 2015 to 2020, especially in 2017 and 2019. The sown area of crops could be an important factor affecting straw burning. According to Figure A4b, the sown area of crops in the southern and central regions of Hunan Province exhibited an annual increase from 2010 to 2015. This increase has a strong spatial correlation with straw burning. However, between 2016 and 2020, there was a significant spatial imbalance in the rate of change in crop-sown areas. Crop yield is correlated with straw burning. Figure A5a shows that crop yield fluctuated and increased from 2010 to 2015. However, from 2016 to 2020, there is an overall decreasing trend in crop yield. As shown in Figure A5b, there were significant increases in crop yield in 2012 and 2014 compared to the previous year. Additionally, the density of straw burning was higher during this period. However, the rate of change in crop yield was negative in most areas of Hunan Province in 2013. As a result, the density of straw burning was lower in 2013 compared to 2012. This result shows a possible correlation between crop yield and straw burning. From 2015 to 2020, there was a change in the correlation between crop yield and the amount of straw burning. These results may indicate that the relationship between straw burning and its driving forces is spatially heterogeneous. To quantify the relationship between straw burning and its drivers, we constructed GWR models to analyze the spatial distribution of fire points. The models considered the distinct characteristics of the two phases of straw burning (2010–2014 and 2015–2020). The analysis enables us to identify changes in the relationship between fire points and various factors, influenced by policies.

3.3.2. Geographical Variability Test and Model Evaluation

It is worth noting that the effects of some variables may not differ across regions, which means that the coefficients on these variables may be spatially fixed. In order to identify local and global variables, we performed the geographic variability test by calculating the difference in AICc (DIFF of Criterion) between the original GWR model and the switched model. Specifically, in the switched GWR model, the k th coefficient is fixed, while the other coefficients are set as in the original GWR model. Following the theory of Nakaya et al. [35], the difference in the AICc of the two models (denoted as DIFF of Criterion) is used as a model comparison indicator. If the AICc of the original model is smaller than that of the switched GWR model, implying a better fit of the original model and the negative value of the DIFF of Criterion, then the kth coefficient varies over space. In other words, for a variable, if the value of DIFF of Criterion is greater than 0, it is typically identified as a global variable. Table 3 reports the results of DIFF of Criterion for two models. For all variables, the values of DIFF of Criterion are negative, suggesting spatial variability of coefficients associated with these variables. Therefore, all of these variables are set as the local variables.
The presence of multicollinearity can lead to incorrect model estimates. To diagnose multicollinearity among the independent variables under consideration, we employed a metric known as the variance inflation factor (VIF). A VIF value greater than 10 typically indicates the presence of high multicollinearity [36]. Therefore, we calculated the VIF values of the 10 variables (refer to Appendix A) and removed variables with VIF values larger than 10, including slope and crop-sown area. Finally, we utilized the remaining eight explanatory variables to fit the models. Compared to traditional linear regression models, GWR can reveal spatial heterogeneity of variables and may achieve higher accuracy. Therefore, we compared the ability of OLS and GWR in model fitting. We quantified the fitness of OLS and GWR models by calculating AICc and R2. As shown in Table 4, the R2 of the GWR models is higher than that of the OLS models, and the AICc is smaller than that of the OLS models. Specifically, the R2 values of the GWR models are significantly higher by 44.8% and 28.2% compared to the R2 values of the OLS models. The results indicate that the GWR models can significantly improve the model performance compared to the OLS models.

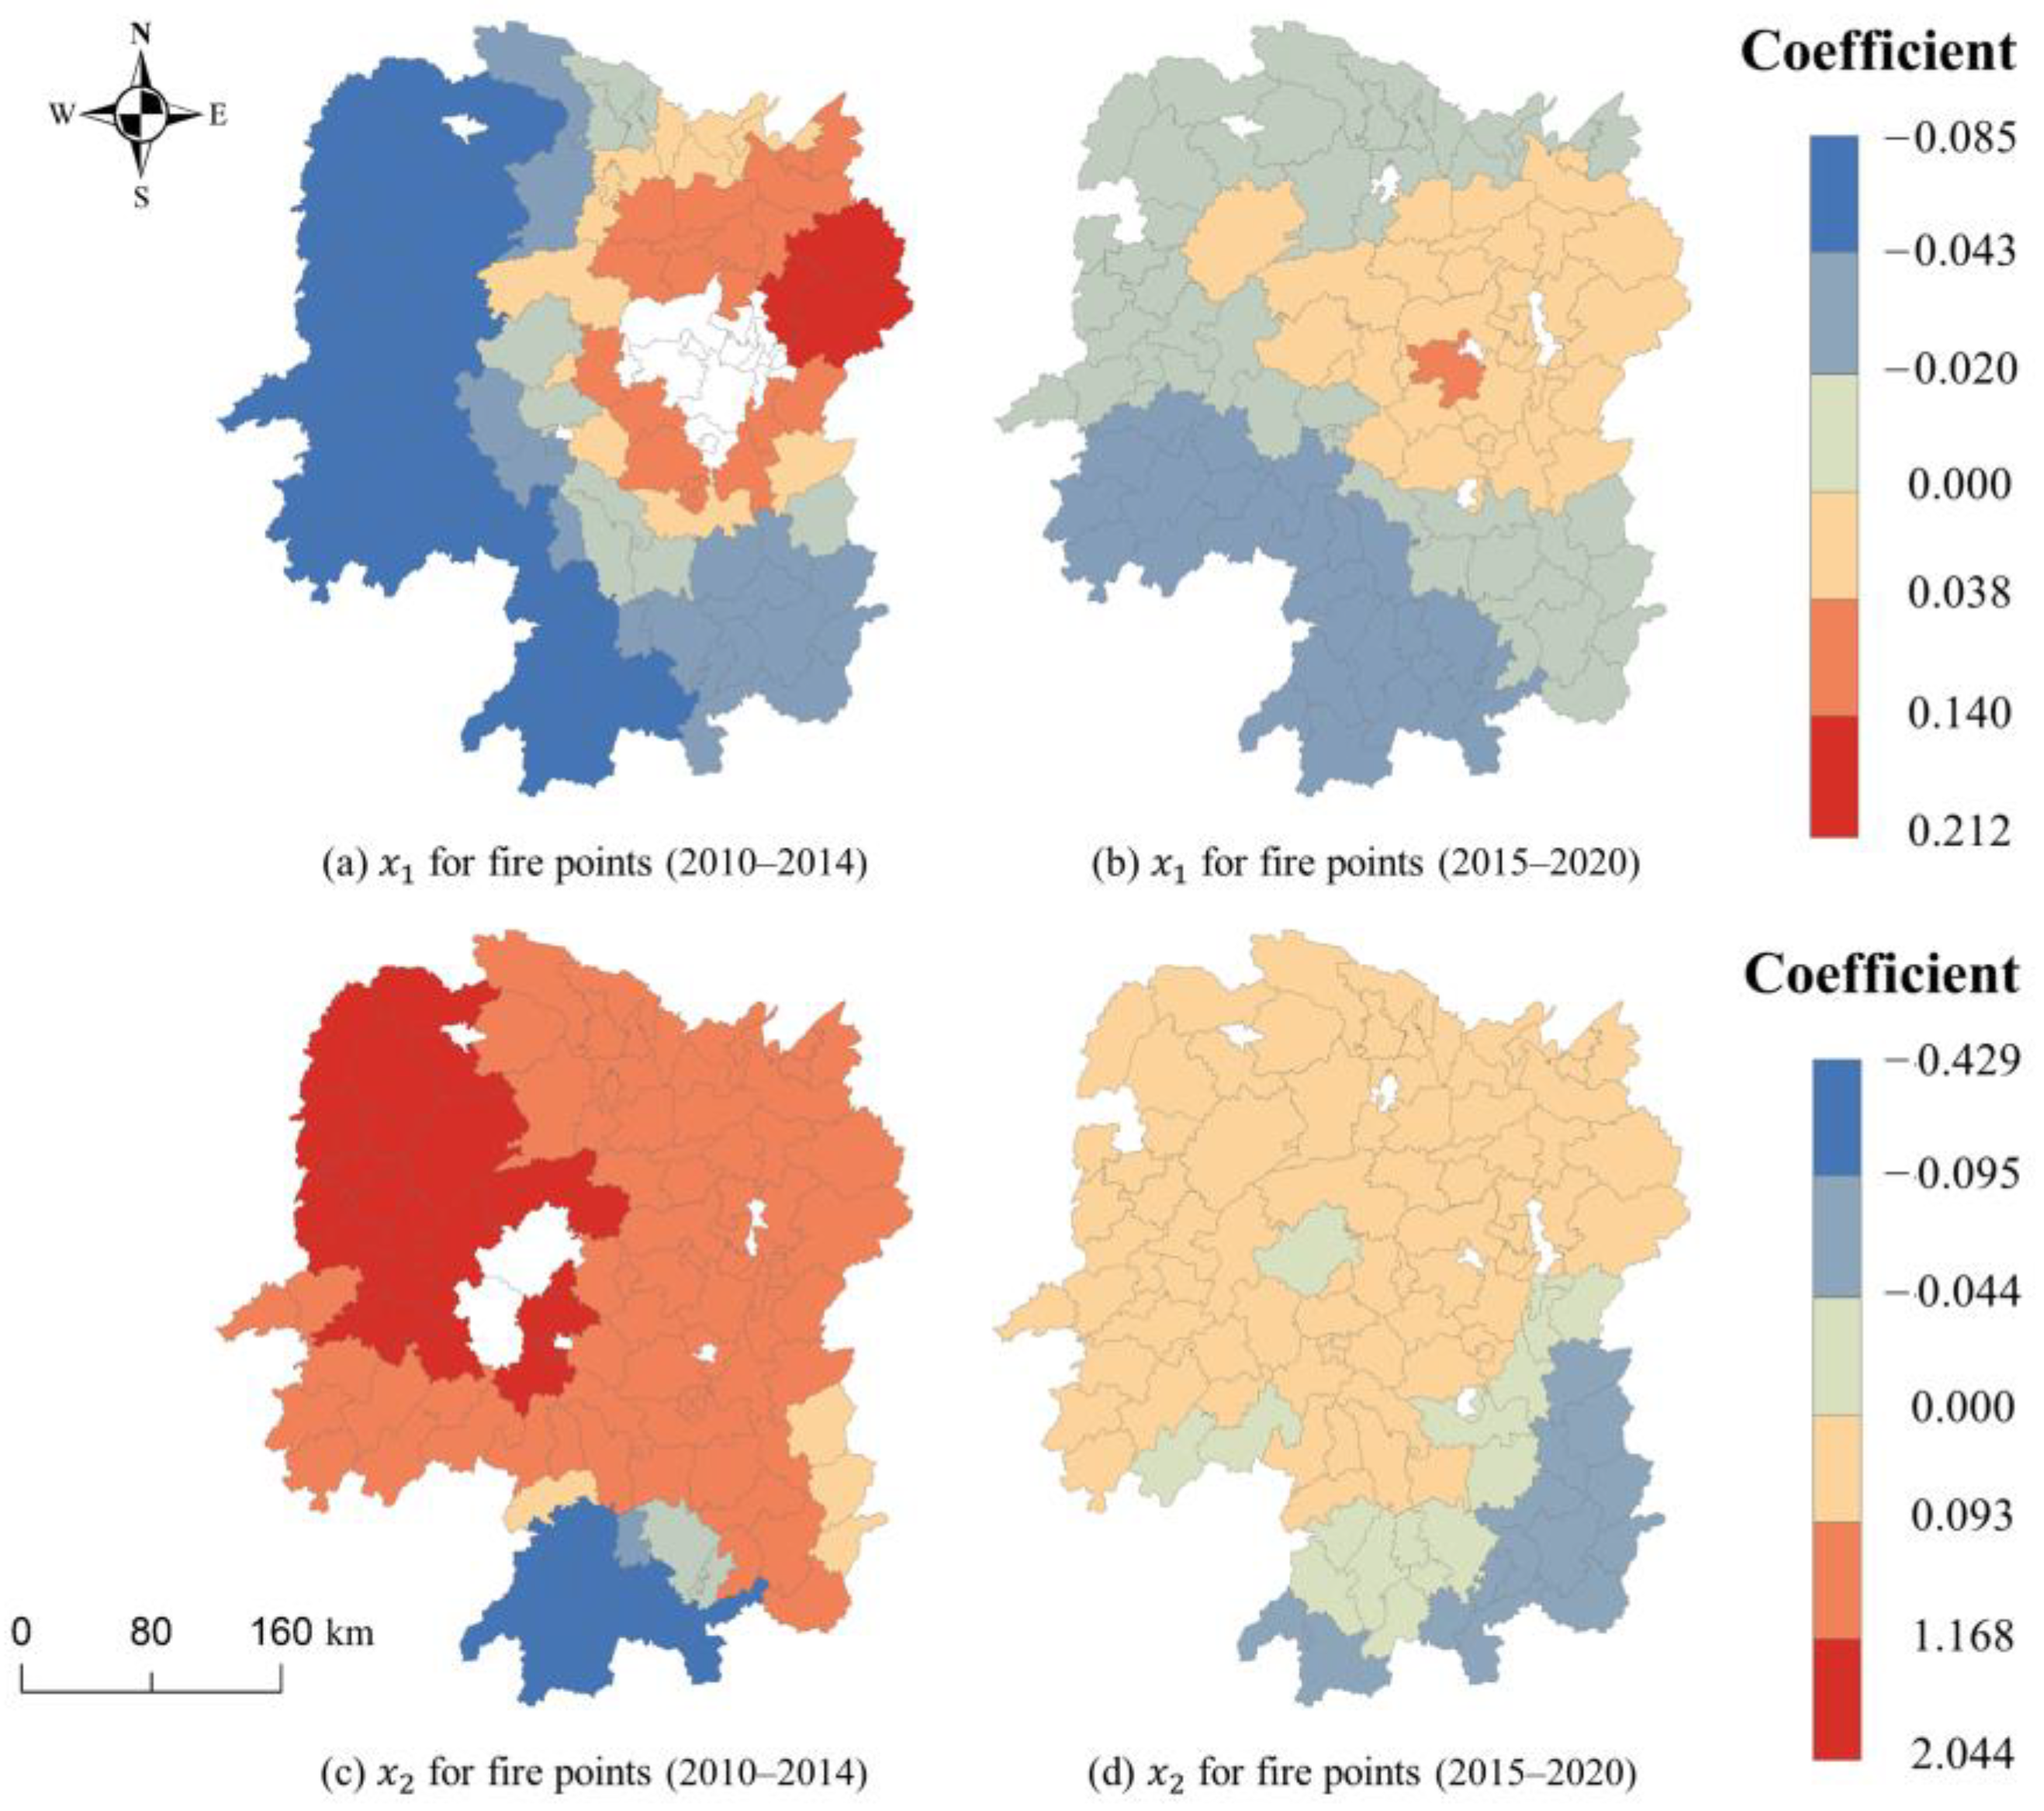
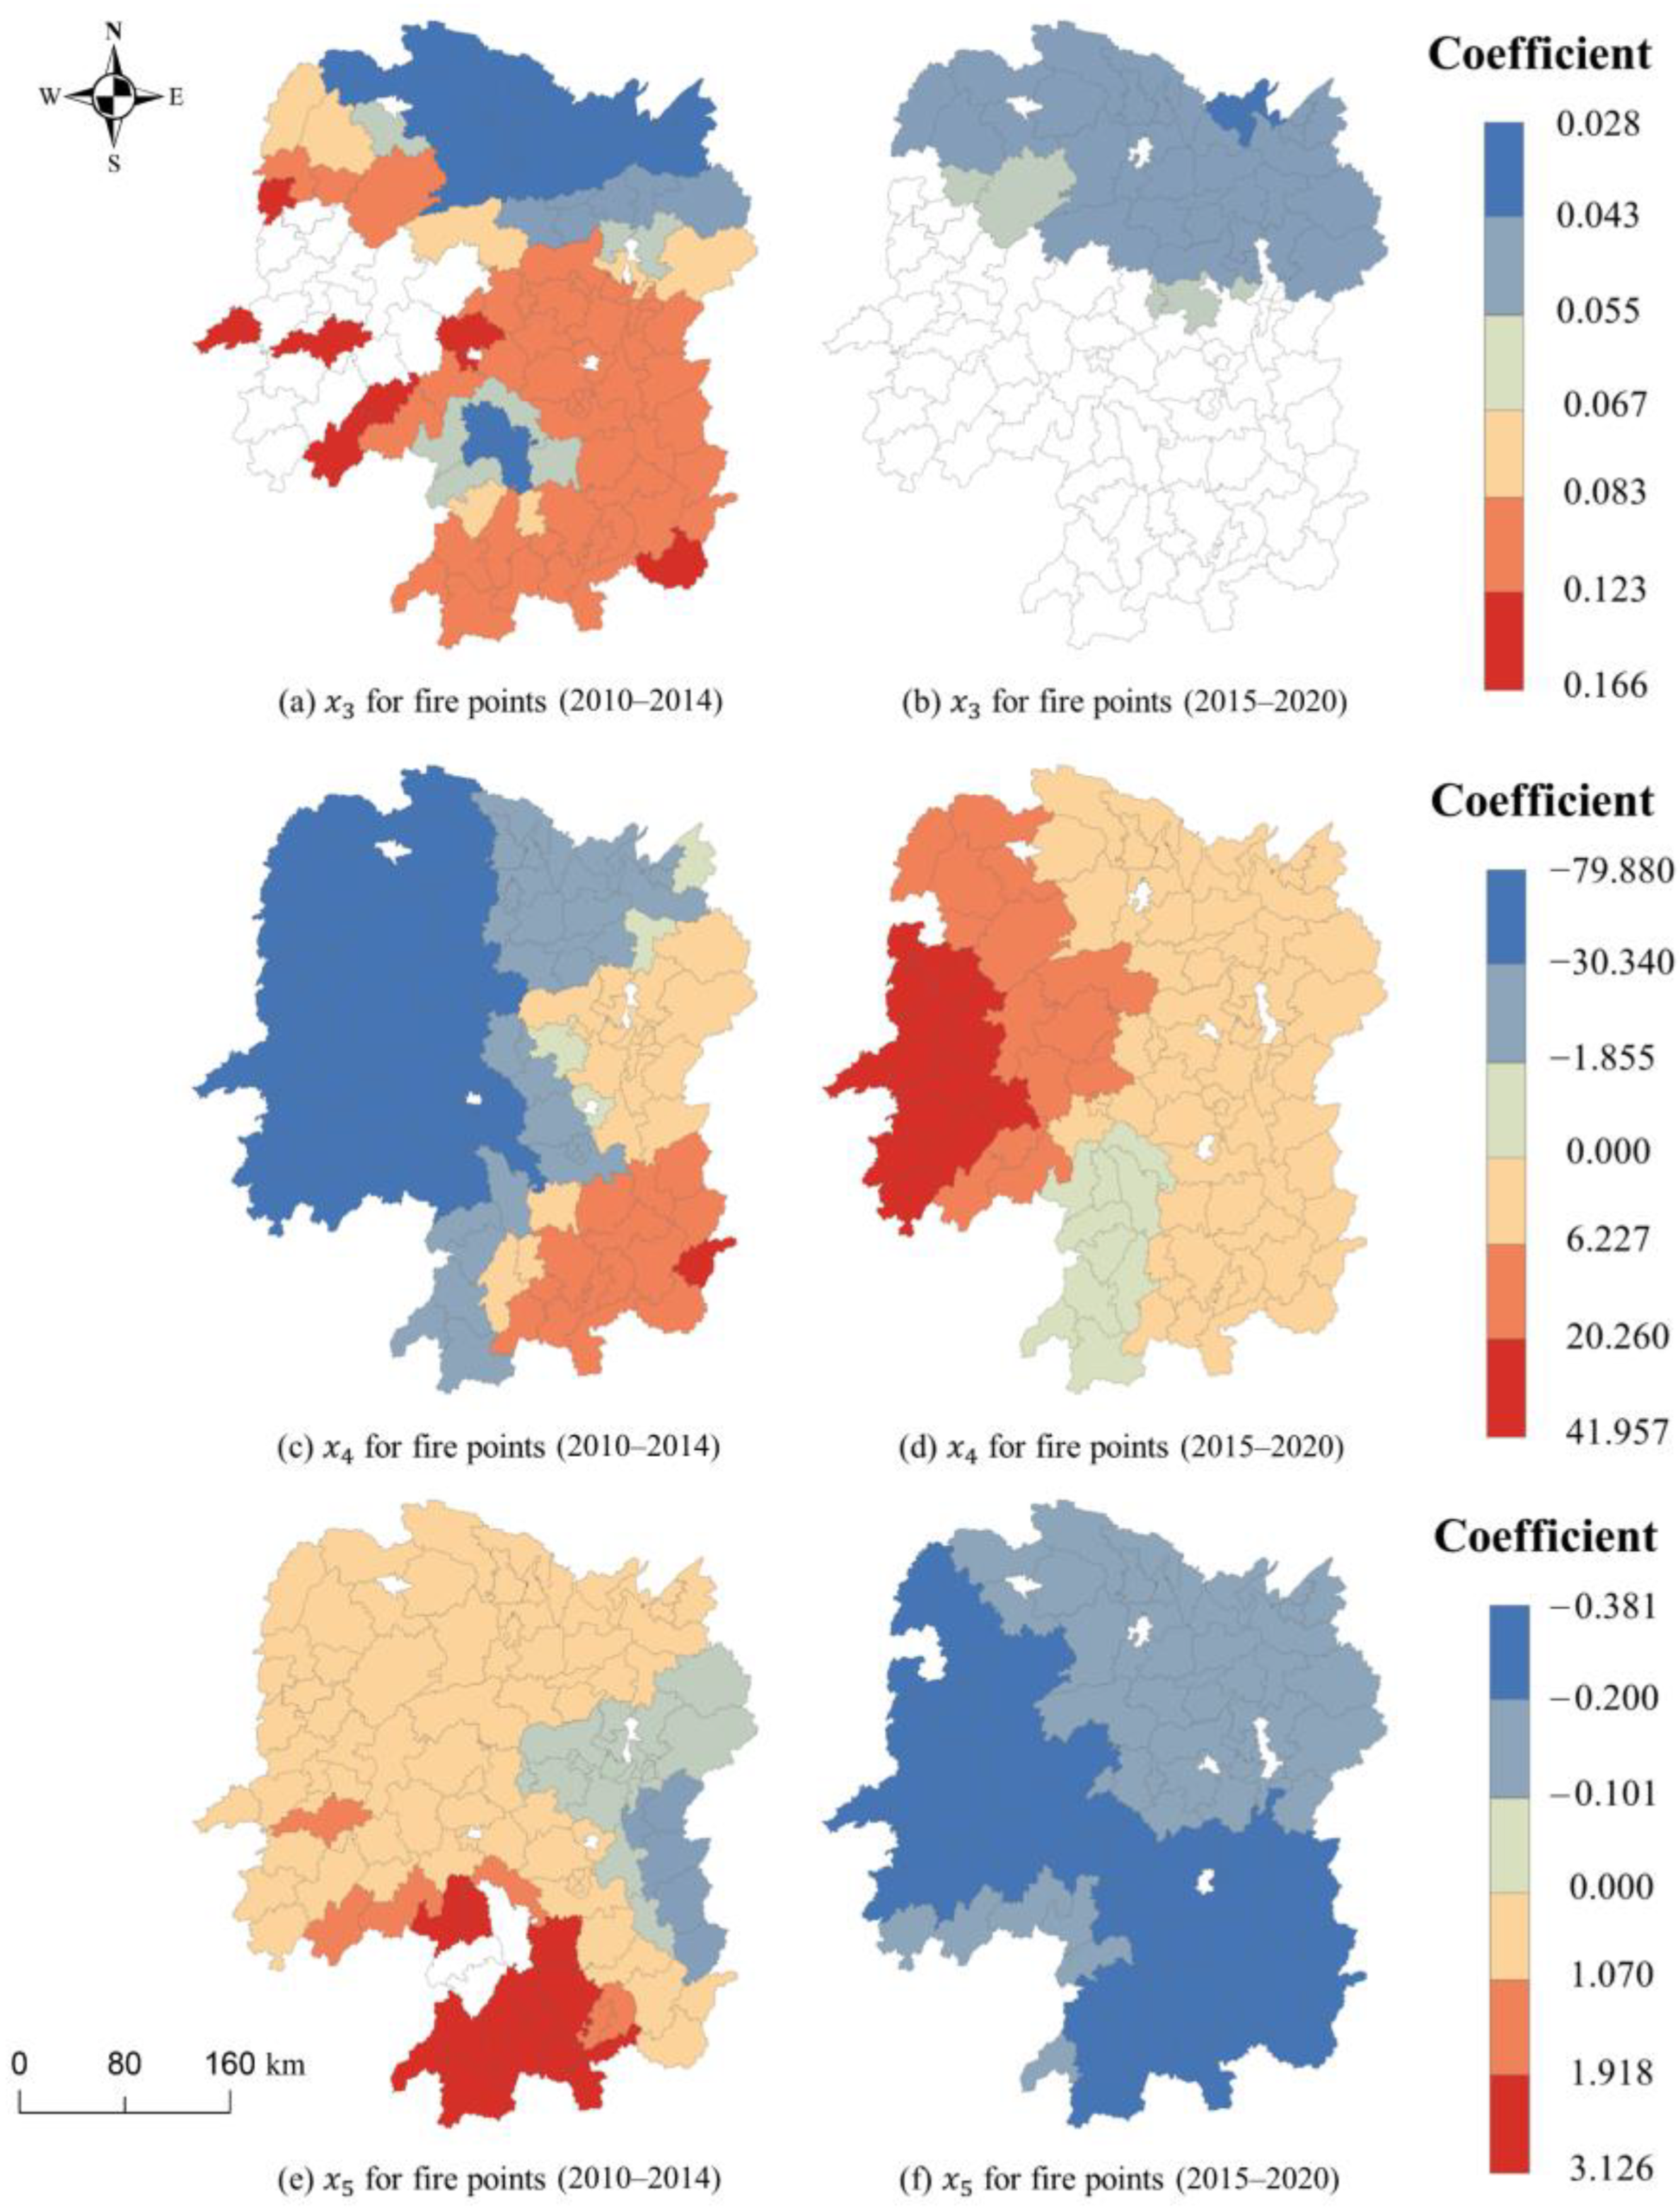
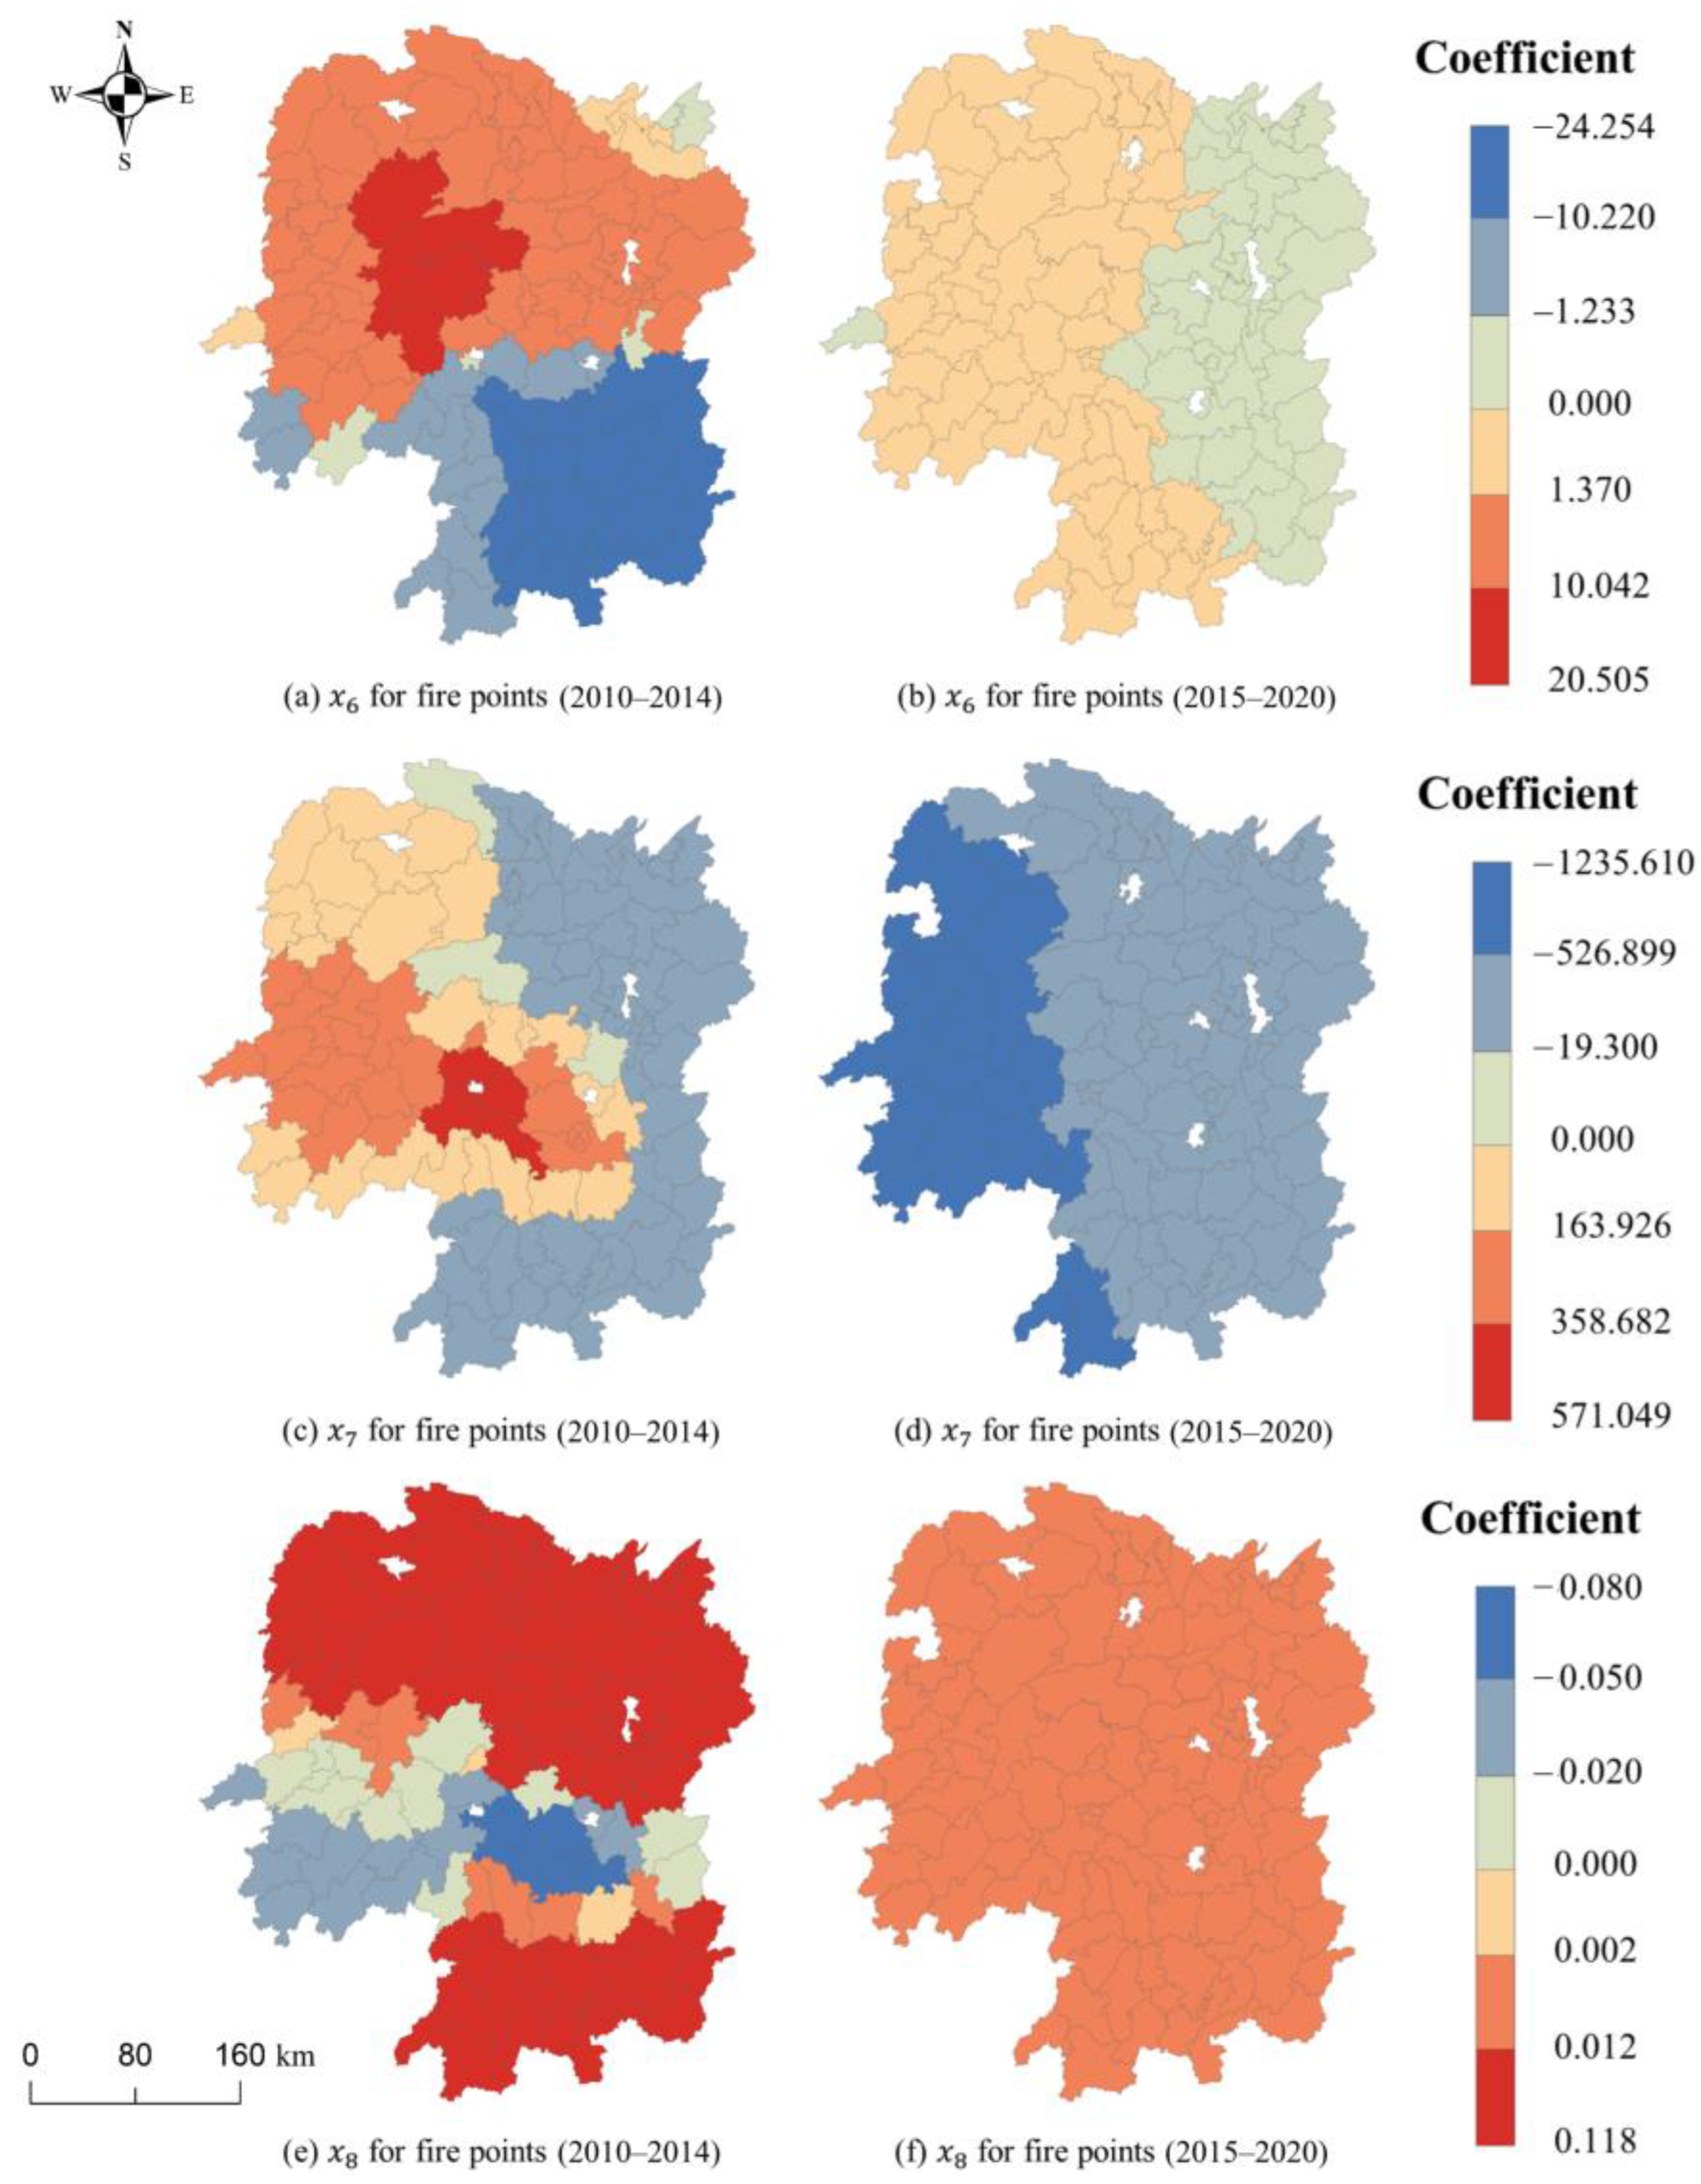
3.3.3. Spatially Heterogeneous Effects Analysis

Table 5 displays the estimated coefficients of the GWR models. The GWR models can explore the spatially non-stationary effects of associated factors, and as a result, the coefficients of these factors are spatially different. The results suggest that the effects of these factors may be spatially inconsistent, and they are highly sensitive to the underlying spatial context [37].
Figure 6 shows the spatial distribution of the coefficients associated with elevation and aspect. The results show that the estimated coefficients of elevation were positive for districts in northeastern Hunan Province from 2010 to 2020. Additionally, the increase in elevation is associated with an increase in the number of fire points. The coefficient is negative for districts in southwestern Hunan Province. Higher elevation is not favorable for straw burning, which has a negative effect on the number of fire points in the western and southern regions of Hunan Province, where the elevation is higher. However, it has a positive effect in the northern and central regions of Hunan, where the elevation is lower. In the 2010–2014 and 2015–2020 periods, the impact of slope on fire points in Hunan Province remained relatively stable. The overall topography of Hunan Province slopes from south to north and is surrounded by mountains to the east, south, and west. The Dongting Lake Plain is in the north, while the hills and basins are in the center. Agricultural land in Hunan Province is primarily concentrated in the plains, basins, and hills. As a result, the fire points are also concentrated in the northern and central regions of Hunan Province.
Figure 7 shows that the impact of socioeconomic factors on fire points changed significantly between the 2010–2014 and 2015–2020 periods. Crop yield consistently exhibits a positive correlation in both periods. An increase in crop yield will lead to a certain extent of increase in the number of straw fire points. In the 2010 to 2014 period, the population density in the western part of Hunan Province increased, which resulted in a decrease in the number of fire points. However, between 2015 and 2020, the increase in population density in these areas resulted in a higher number of fire points. Similarly, the impact of GDP also changed significantly. Between 2015 and 2020, the increase in GDP resulted in a decrease in fire points across all regions, particularly in the western and southeastern regions. During the 2010–2014 period, the impact of GDP in these regions was significantly positive. This positive effect can be attributed to the increase in policy subsidies and investments in science and technology, which were made possible by improvements in the economy. These factors greatly contributed to the utilization of straw resources.
A similar pattern was observed in the coefficients related to human activities. Figure 8 shows the distribution of the effects of human activity factors. An increase in road density leads to an increase in fire points in the northern region of Hunan Province and a decrease in the southern region of Hunan Province. However, from 2010 to 2020, this effect shifted from inconsistency between the south and north to inconsistency between the east and west. The increase in road density in the west caused an increase in fire points, while the opposite is true in the east. Over time, the impact of settlement density in western Hunan Province changes from positive to negative, while the impact of distance from the road in central Hunan Province changes from negative to positive. However, it is important to note that this correlation weakens. In terms of settlement density, the coefficient is negative overall. Specifically, between 2015 and 2020, the negative effect of settlement density was more pronounced. This indicates that fire points are primarily located in areas with low population density and more open space. Regarding distance from the road, the estimated coefficients are mainly positive, particularly in northern and western Hunan. The impact of fire points on distance from the road varies from negative to positive, which aligns with the findings presented in Figure 5. The density of fire points tends to increase from the center of the region to the edge of the region. In the peripheral regions, the utilization of technology and management is relatively weak, which consequently affects the spatial distribution of straw burning to some extent.
To a certain extent, the reduction of straw burning is closely linked to the level of economic development in the region. In relatively developed regions, people pay more attention to the ecological environment and its protection, resulting in stronger environmental awareness. However, in other regions, people’s awareness of environmental protection is not strong. In these regions, the practice of straw burning will be common and frequent. In developed regions, the potential for straw industrialization and the utilization of subsidies for straw will be higher. In addition, with the increasing efforts of local governments to ban straw burning and promote the comprehensive use of straw, farmers will be more motivated to return straw to the field. This will lead to a reduction in the willingness of farmers to burn straw.

4. Discussion

This study begins with a spatial and temporal analysis of straw burning in Hunan Province from 2010 to 2020. In terms of time-varying characteristics, the number of straw fire points in 2015 decreased by 73.61% compared to 2014. This may be attributed to the ineffectiveness of the early Hunan provincial government’s advocacy for a complete ban on straw burning, despite their active promotion of the implementation of the Air Pollution Prevention and Control Action Plan in 2013. In 2015, the provincial agricultural commission issued regulations specifically for a straw burning ban, titled “Notice on Further Accelerating the Comprehensive Utilization of Crop Straw and Implementing a Burning Ban”. This notice states that by 2020, the number of straw burning fire points should be reduced by 5% compared to 2016. The number of fire points decreased by 59.67% in 2020 compared to 2016, and by 55.83% compared to the previous year. Due to the implementation of stricter management and regulations regarding the use of straws and the prohibition of burning in cities and districts, there have been improvements in overall management and notable outcomes.
In terms of seasonal distribution, Hunan Province is characterized by a predominant occurrence of straw burning during the autumn and winter seasons [38,39,40]. This type of straw burning mainly occurs from September to March, with two periods of high fire points, January–February and October [23,38,41,42]. This difference may be due to the timing of rice planting in Hunan. The province is characterized by hilly terrain and follows a biannual cultivation system. Rice is planted in the spring and harvested in the summer, then planted again in the summer and harvested in the autumn. There are two periods of straw burning as a result. However, in recent years, industrialization and urbanization have led to the non-agriculturalization of the rural labor force. This has resulted in other factors influencing the transition from double-season rice cultivation to single-season rice cultivation in Hunan Province. The time from sowing to harvesting was approximately between May and October, and the harvested straw could be burned. To enhance soil fertility, particularly in the first quarter of the upcoming year, there will be a relatively concentrated practice of straw burning, which may increase fires between January and March [43].
Among the 14 cities, Yongzhou city has the highest number of hotspots, accounting for 17.72% of the total. Chenzhou and Hengyang cities follow closely behind, accounting for 14.65% and 14.63%, respectively. These three cities collectively account for 47% of the total number of fire points in the province. Although the number of straw burning fire points in these areas decreased significantly between 2015 and 2020, the overall count still remains high. This may be attributed to the fact that straw utilization in this area is still in its early and rudimentary stage, with limitations in the technical recycling system, farmers’ awareness, and insufficient regulatory power [10,44]. Straw burning in this region has a significant impact on the local air quality [16,44,45]. Therefore, it is crucial to focus on improving the level of straw resource utilization and strengthening control measures in order to reduce the amount of straw burning [46]. This indicates that there may be a lack of supervision and management in the region. Moreover, there were several reasons for this spatial difference, which were not solely attributed to variations in social and economic development [44,47]. Factors such as the natural geographical environment, the scope of human activities, and the scale of crop planting also played a significant role. Grasping its internal driving mechanism has strong practical significance for effectively curbing the occurrence of fires and improving the quality of the regional atmospheric environment [48,49,50,51].
Because of the significant spatial differences and diverse causes of straw burning in Hunan Province, it is necessary to further analyze the driving mechanisms in order to effectively understand the causes and make reasonable suggestions. Therefore, the GWR model is used to analyze the influence of each factor at the geospatial level, including natural factors, socioeconomic factors, and human activity factors in Hunan. From a natural perspective, the estimated coefficients associated with this aspect exhibit high variability. They show a positive impact in regions with concentrated farmland and a negative impact in regions with dispersed farmland. From a socioeconomic perspective, crop yields, which serve as the raw material for straw combustion, generally have a positive impact on the occurrence of fire points. Furthermore, the spatial heterogeneity of this effect decreases over time. This result indirectly proves the effectiveness of promoting the comprehensive utilization of straw in recent years [52]. Population, as an important influencing factor of straw burning, can continuously affect the number and timing of fire points [53]. The estimated coefficients associated with population density in the eastern Hunan region show minimal changes, while those in the western Hunan region exhibit significant changes. This difference may be attributed to the practice of straw return to fields in western Hunan from 2015 to 2020.
From the estimated coefficients related to GDP in the two time periods, it can be observed that the difference in estimated coefficients between adjacent cities is small. This may be attributed to the fact that GDP is a crucial indicator of the level of economic development, displaying significant spatial dependence characteristics. In addition, there is generally a positive relationship between GDP and the number of fire points in Hunan Province from 2010 to 2014 in most regions. However, from 2015 to 2020, this impact became negative in all regions of Hunan Province. This situation aligns with the theory of the Environmental Kuznets Curve [54]. When the economic level of a region is low, the degree of environmental pollution is also low. As the economy gradually develops, the degree of pollution increases. However, when economic development reaches a certain inflection point, the degree of pollution starts to decrease. This phenomenon can be represented by an inverted “U” curve, which indicates the relationship between economic development and environmental pollution [55,56]. At this stage, the peak of the curve in Hunan Province has been surpassed, and the increasing GDP will discourage the burning of straw. From the perspective of human activities, cities are the primary areas that require technical support and policy implementation. There may be two reasons for this. Before implementing any policies, it is important to consider the close relationship between agricultural productivity and straw burning, as well as its impact. The increase in agricultural productivity results in more crop straw and a higher carbon density per unit of production (CDP). Due to insufficient management, more crop straw is likely to be burned, resulting in consistently high emissions. The volume of emissions from straw burning during straw return increases rapidly. Secondly, there is widespread advocacy for the prohibition of straw burning during straw return and the promotion of commercial energy. After policy implementation, strict prohibition policies and measures against straw burning during straw return are gradually changing burning habits in rural areas [57]. The increase in CDP also signifies the effective utilization of corn straw resources and commercial energy under new economic policies [29]. Thus, the distribution of straw burning tends to become denser as one moves away from city roads. It should be noted that the burning patterns of straw in different regions are closely related to cropping schedules, types of crops, and geographical characteristics. In managing straw burning, it is important to consider the local population density, economic development, and topography [27,58,59,60]. This includes strengthening the formulation of management rules and regulations, reinforcing supervision at regional intersections, encouraging technological research and development, promoting the comprehensive utilization of straw, and continuously enhancing public awareness of environmental protection and legal compliance. These measures will help reduce administrative costs and improve administrative efficiency [61,62]. From the implementation of the straw burning ban policy, increases in GDP and settlement density will have a dampening effect on straw burning in a region. Straw burning locations may shift towards regions with relatively slow economic development.

5. Conclusions

The air pollution from straw burning cannot be ignored. Our study has used the MODIS satellite data to explore the space-time changes and driving factors of straw burning in Hunan Province, China, providing a theoretical reference for scientifically regulating crop straw burning behavior and improving the efficiency of administrative supervision. The specific conclusions are as follows: (1) From 2010 to 2020, the number of fire points in Hunan Province decreased overall, but exhibited periodic changes. Specifically, the period from 2010 to 2014 was a stage of rapid increase, while the period from 2015 to 2020 was a fluctuating decrease stage. (2) Spatially, the areas with a high number of fire points are primarily located in the border regions between Chenzhou, Yongzhou, Hengyang, and Shaoyang cities. (3) The effects of variables, except for crop yield, vary from negative to positive across the provincial regions. The comparative results for 2010 to 2014 and 2015 to 2020 reveal significant changes in the impacts of socioeconomic and human activity factors, particularly GDP and distance from roads.
This study analyzes the spatial and temporal patterns of straw burning in Hunan Province from 2010 to 2020. The number of straw fire points decreased significantly in 2015 compared to 2014, attributed to the implementation of regulations banning straw burning. Stricter management and regulations have led to improvements in overall management and notable outcomes. Straw burning mainly occurs during the autumn and winter seasons, with two periods of high fire points in January–February and October. Industrialization and urbanization have influenced the transition from double-season rice cultivation to single-season rice cultivation, resulting in concentrated straw burning between January and March. Some cities, such as Yongzhou, Chenzhou, and Hengyang, have a high number of straw burning hotspots due to limitations in the technical recycling system, farmers’ awareness, and insufficient regulatory power. It is crucial to focus on improving straw resource utilization and strengthening control measures to reduce straw burning.
The driving mechanisms of straw burning in Hunan Province are analyzed using the Geographically Weighted Regression (GWR) model. Natural factors, socioeconomic factors, and human activity factors are found to influence the occurrence of straw burning. Farmland concentration and crop yields have a positive impact, while population density and GDP show varying effects. Population, as an important factor influencing straw burning, can continuously influence the number and timing of fire points. The results of this study show that the estimated coefficients associated with population density in the eastern Hunan region remained positive, while those in the western Hunan region shifted from negative to positive. Additionally, there is a stronger positive correlation between population density and straw burning in western Hunan than in eastern Hunan. These results may be attributed to the impact of regional differences in regulatory efforts. The western part of Hunan Province is characterized by mountainous hills, and government oversight of straw burning was relatively lenient before 2015. Following the 2015 ban on straw burning, the government imposed stricter penalties in western Hunan for this practice than ever before and encouraged farmers to adopt alternative treatment methods, such as returning straw to the fields. This policy adjustment resulted in a stronger correlation between population density and straw burning fires in the western region. As the eastern part of Hunan is more advanced in terms of economic development compared to the western part of the country, agricultural production in this region may be more inclined to use modern agricultural machinery and technology, such as mechanized harvesting and straw utilization equipment. In contrast, the western region may have a lower level of economic development, more traditional agricultural production methods, and a greater reliance on burning for straw treatment. This speculation is consistent with the assumption that an increase in GDP will discourage straw burning. GDP initially has a positive relationship with the number of fire points but becomes negative after a certain inflection point, in line with the Environmental Kuznets Curve theory. From the implementation of the straw burning ban policy, increases in GDP and settlement density will have a dampening effect on straw burning in a region. The density of straw burning tends to increase as urban roads move away from the area. Straw-burning sites may shift towards regions with relatively slow economic development. Therefore, it should be noted that straw burning patterns in different regions are closely related to cropping patterns, crop types, and geographical characteristics. When managing straw burning, it is important to take into account local population density, economic development, and topography. Strengthening management rules and regulations, reinforcing supervision, promoting technological research and development, and enhancing public awareness of environmental protection and legal compliance are recommended measures to reduce straw burning. There is spatial heterogeneity in the effects of factors on straw burning in urban areas. This implies that managing straw combustion in the Hunan Province requires innovation in regional cooperation and governance. The operation cannot be isolated in different cities; instead, there is a need to establish a division of labor and cooperation among various functional cities. This will help maximize resources and reduce straw burning. In addition, it is necessary to optimize the allocation of resources. Neighboring cities should also strengthen coordination and interaction in development planning, infrastructure, environmental protection, and resource management to avoid wasting resources.
In addition, there are limitations in the data collection of this study, which leads to uncertainties in the results of the study. This study is limited by the availability of data and was conducted solely at the county level in Hunan Province from 2010 to 2020. For example, the influence of cloud coverage would cause uncertainties in the MODIS-detected fire points, and the uncertainties in the land-use data from remote sensing would cause uncertainties in the extraction of straw burning fire points. Furthermore, the selection of factors in this study is not enough; straw burning obviously has a certain seasonality, and the related factors of seasonality need further investigation and research. In the future, studies at finer scales will be conducted based on long time series of harmonized standard data as the accumulation of information continues. We will focus on extracting straw burning fire points with more accurate image data and consider additional factors to obtain reasonable analysis results.

Author Contributions

Y.Z.: data acquisition, methodology, software, processing, writing—original draft. S.L.: conceptualization, supervision, methodology, funding. S.H.: data acquisition, drawing. W.G.: data analysis, tabulation. H.L.: data auditing, drawing, writing. S.D.P.: data auditing, writing. All authors have read and agreed to the published version of the manuscript.

Funding

This work was supported by research grants from the National Natural Science Foundation of China (U20A2089 and 41971152), Research Foundation of the Department of Natural Resources of Hunan Province (20230138ST) to S.L., and Key Research and Development Foundation of Hunan Province (2023SK2062) to S.L., China.

Data Availability Statement

The raw data supporting the conclusions of this article will be made available by the authors on request.

Acknowledgments

We thank the anonymous reviewers for their constructive suggestions and comments that helped to improve the manuscript.

Conflicts of Interest

The authors declare that they have no known competing financial interests or personal relationships that could have appeared to influence the work reported in this paper.

Appendix A

Figure A1. Distribution of straw burning fire points.
Remotesensing 16 01438 g0a1
Figure A2. The change rate of population.
Remotesensing 16 01438 g0a2
Figure A3. The change rate of GDP.
Remotesensing 16 01438 g0a3
Figure A4. The change rate of crop-sown areas.
Remotesensing 16 01438 g0a4
Figure A5. The change rate of crop yield.
Remotesensing 16 01438 g0a5
Table A1. Variable list with VIF values.
VariableModel 1
(2010–2014)
Model 2
(2015–2020)
Natural factors
Elevation7.4886.118
Slope12.81910.902
Aspect1.3131.314
Socioeconomic factors
Crop yield7.0008.412
Crop-sown area13.56619.009
Population density3.9472.961
GDP1.6211.924
Human activity factors
Road density2.9572.442
Settlement density2.0152.947
Distance from road1.6561.274

References

  1. Rohde, R.A.; Muller, R.A. Air pollution in China: Mapping of concentrations and sources. PLoS ONE 2015, 10, e0135749. [Google Scholar] [CrossRef]
  2. Yang, G.; Wang, Y.; Zeng, Y.; Gao, G.F.; Liang, X.; Zhou, M.; Wan, X.; Yu, S.; Jiang, Y.; Naghavi, M. Rapid health transition in China, 1990–2010: Findings from the Global Burden of Disease Study 2010. Lancet 2013, 381, 1987–2015. [Google Scholar] [CrossRef]
  3. Li, H.; Wang, Q.G.; Yang, M.; Li, F.; Wang, J.; Sun, Y.; Wang, C.; Wu, H.; Qian, X. Chemical characterization and source apportionment of PM2. 5 aerosols in a megacity of Southeast China. Atmos. Res. 2016, 181, 288–299. [Google Scholar] [CrossRef]
  4. Tao, J.; Zhang, L.; Ho, K.; Zhang, R.; Lin, Z.; Zhang, Z.; Lin, M.; Cao, J.; Liu, S.; Wang, G. Impact of PM2. 5 chemical compositions on aerosol light scattering in Guangzhou—The largest megacity in South China. Atmos. Res. 2014, 135, 48–58. [Google Scholar] [CrossRef]
  5. Tao, J.; Gao, J.; Zhang, L.; Wang, H.; Qiu, X.; Zhang, Z.; Wu, Y.; Chai, F.; Wang, S. Chemical and optical characteristics of atmospheric aerosols in Beijing during the Asia-Pacific Economic Cooperation China 2014. Atmos. Environ. 2016, 144, 8–16. [Google Scholar] [CrossRef]
  6. Zhao, H.; Yang, G.; Tong, D.Q.; Zhang, X.; Xiu, A.; Zhang, S. Interannual and seasonal variability of greenhouse gases and aerosol emissions from biomass burning in Northeastern China constrained by satellite observations. Remote Sens. 2021, 13, 1005. [Google Scholar] [CrossRef]
  7. Jenkins, B.; Turn, S.; Williams, R. Atmospheric emissions from agricultural burning in California: Determination of burn fractions, distribution factors, and crop-specific contributions. Agric. Ecosyst. Environ. 1992, 38, 313–330. [Google Scholar] [CrossRef]
  8. Tao, J.; Zhang, L.; Cao, J.; Zhang, R. A review of current knowledge concerning PM 2. 5 chemical composition, aerosol optical properties and their relationships across China. Atmos. Chem. Phys. 2017, 17, 9485–9518. [Google Scholar] [CrossRef]
  9. Zhang, T.; Claeys, M.; Cachier, H.; Dong, S.; Wang, W.; Maenhaut, W.; Liu, X. Identification and estimation of the biomass burning contribution to Beijing aerosol using levoglucosan as a molecular marker. Atmos. Environ. 2008, 42, 7013–7021. [Google Scholar] [CrossRef]
  10. Mehmood, K.; Chang, S.; Yu, S.; Wang, L.; Li, P.; Li, Z.; Liu, W.; Rosenfeld, D.; Seinfeld, J.H. Spatial and temporal distributions of air pollutant emissions from open crop straw and biomass burnings in China from 2002 to 2016. Environ. Chem. Lett. 2018, 16, 301–309. [Google Scholar] [CrossRef]
  11. Oanh, N.T.K.; Permadi, D.A.; Hopke, P.K.; Smith, K.R.; Dong, N.P.; Dang, A.N. Annual emissions of air toxics emitted from crop residue open burning in Southeast Asia over the period of 2010–2015. Atmos. Environ. 2018, 187, 163–173. [Google Scholar] [CrossRef]
  12. De Zárate, I.O.; Ezcurra, A.; Lacaux, J.; Van Dinh, P. Emission factor estimates of cereal waste burning in Spain. Atmos. Environ. 2000, 34, 3183–3193. [Google Scholar] [CrossRef]
  13. Shen, Y.; Jiang, C.; Chan, K.L.; Hu, C.; Yao, L. Estimation of field-level NOx emissions from crop residue burning using remote sensing data: A case study in Hubei, China. Remote Sens. 2021, 13, 404. [Google Scholar] [CrossRef]
  14. Li, R.; He, X.; Wang, H.; Wang, Y.; Zhang, M.; Mei, X.; Zhang, F.; Chen, L. Estimating Emissions from Crop Residue Open Burning in Central China from 2012 to 2020 Using Statistical Models Combined with Satellite Observations. Remote Sens. 2022, 14, 3682. [Google Scholar] [CrossRef]
  15. Zhang, Y.; Shao, M.; Lin, Y.; Luan, S.; Mao, N.; Chen, W.; Wang, M. Emission inventory of carbonaceous pollutants from biomass burning in the Pearl River Delta Region, China. Atmos. Environ. 2013, 76, 189–199. [Google Scholar] [CrossRef]
  16. Zhang, Y.; Liu, T.; Li, B.; Cheng, Y.; Wang, L.; Guo, Y.; Wu, X.; He, J. Monitoring of autumn crop straw burning fire points in Henan province based on MODIS data. J. Henan Agric. Sci. 2016, 45, 149–154. [Google Scholar]
  17. Mao, H.; Zhang, L.; Li, Q.; Zhang, L.; Zhang, Y.; Chen, H.; Weng, G. Study on open burning of crop residues and its emissions of PM2.5 in northeast China based on satellite remote sensing. Chin. J. Agric. Resour. Reg. Plan. 2018, 39, 59–66. [Google Scholar]
  18. McCarty, J.L.; Korontzi, S.; Justice, C.O.; Loboda, T. The spatial and temporal distribution of crop residue burning in the contiguous United States. Sci. Total Environ. 2009, 407, 5701–5712. [Google Scholar] [CrossRef] [PubMed]
  19. Li, J.; Li, S.; Duan, P.; Zhang, C. Remote sensing monitoring and analysis of straw burning in Henan Province based on MODIS. Eng. Surv. Mapp. 2018, 27, 42–46. [Google Scholar]
  20. Zhuang, Y.; Li, R.; Yang, H.; Chen, D.; Chen, Z.; Gao, B.; He, B. Understanding temporal and spatial distribution of crop residue burning in China from 2003 to 2017 using MODIS data. Remote Sens. 2018, 10, 390. [Google Scholar] [CrossRef]
  21. Fu, J.; Song, S.; Guo, L.; Chen, W.; Wang, P.; Duanmu, L.; Shang, Y.; Shi, B.; He, L. Interprovincial joint prevention and control of open straw burning in Northeast China: Implications for atmospheric environment management. Remote Sens. 2022, 14, 2528. [Google Scholar] [CrossRef]
  22. Verma, S.; Dar, J.A.; Malasiya, D.; Khare, P.K.; Dayanandan, S.; Khan, M.L. A MODIS-based spatiotemporal assessment of agricultural residue burning in Madhya Pradesh, India. Ecol. Indic. 2019, 105, 496–504. [Google Scholar] [CrossRef]
  23. Zhang, J.; Yang, X.; Tu, X.; Ning, K.; Luan, X. Spatio-temporal change of straw burning fire points in field of China from 2014 to 2018. Trans. Chin. Soc. Agric. Eng. 2019, 35, 191–199. [Google Scholar]
  24. Lian, C.; Xiao, C.; Feng, Z. Spatiotemporal Characteristics and Regional Variations of Active Fires in China since 2001. Remote Sens. 2022, 15, 54. [Google Scholar] [CrossRef]
  25. Peng, L.; Zhang, Q.; He, K. Emissions inventory of atmospheric pollutants from open burning of crop residues in China based on a national questionnaire. Res. Environ. Sci. 2016, 29, 1109–1118. [Google Scholar]
  26. Xu, Y.; Huang, Z.; Jia, G.; Fan, M.; Cheng, L.; Chen, L.; Shao, M.; Zheng, J. Regional discrepancies in spatiotemporal variations and driving forces of open crop residue burning emissions in China. Sci. Total Environ. 2019, 671, 536–547. [Google Scholar] [CrossRef] [PubMed]
  27. Cui, S.; Song, Z.; Zhang, L.; Shen, Z.; Hough, R.; Zhang, Z.; An, L.; Fu, Q.; Zhao, Y.; Jia, Z. Spatial and temporal variations of open straw burning based on fire spots in northeast China from 2013 to 2017. Atmos. Environ. 2021, 244, 117962. [Google Scholar] [CrossRef]
  28. Wang, J.; Wang, X. A triumph of reducing carbon emission by banning open straw burning. Sci. Bull. 2023, 68, 18–20. [Google Scholar] [CrossRef] [PubMed]
  29. Wu, J.; Kong, S.; Wu, F.; Cheng, Y.; Zheng, S.; Qin, S.; Liu, X.; Yan, Q.; Zheng, H.; Zheng, M. The moving of high emission for biomass burning in China: View from multi-year emission estimation and human-driven forces. Environ. Int. 2020, 142, 105812. [Google Scholar] [CrossRef] [PubMed]
  30. Parzen, E. On estimation of a probability density function and mode. Ann. Math. Stat. 1962, 33, 1065–1076. [Google Scholar] [CrossRef]
  31. Oliveira, S.; Oehler, F.; San-Miguel-Ayanz, J.; Camia, A.; Pereira, J.M. Modeling spatial patterns of fire occurrence in Mediterranean Europe using Multiple Regression and Random Forest. For. Ecol. Manag. 2012, 275, 117–129. [Google Scholar] [CrossRef]
  32. Chang, Y.; Zhu, Z.; Bu, R.; Chen, H.; Feng, Y.; Li, Y.; Hu, Y.; Wang, Z. Predicting fire occurrence patterns with logistic regression in Heilongjiang Province, China. Landsc. Ecol. 2013, 28, 1989–2004. [Google Scholar] [CrossRef]
  33. Brunsdon, C.; Fotheringham, A.S.; Charlton, M.E. Geographically weighted regression: A method for exploring spatial nonstationarity. Geogr. Anal. 1996, 28, 281–298. [Google Scholar] [CrossRef]
  34. Tang, J.; Gao, F.; Han, C.; Cen, X.; Li, Z. Uncovering the spatially heterogeneous effects of shared mobility on public transit and taxi. J. Transp. Geogr. 2021, 95, 103134. [Google Scholar] [CrossRef]
  35. Nakaya, T.; Fotheringham, S.; Charlton, M.; Brunsdon, C. Semiparametric Geographically Weighted Generalised Linear Modelling in GWR 4.0; University of Leeds: Leeds, UK, 2009. [Google Scholar]
  36. Sheather, S. A Modern Approach to Regression with R; Springer Science & Business Media: Berlin, Germany, 2009. [Google Scholar]
  37. Tu, W.; Cao, R.; Yue, Y.; Zhou, B.; Li, Q.; Li, Q. Spatial variations in urban public ridership derived from GPS trajectories and smart card data. J. Transp. Geogr. 2018, 69, 45–57. [Google Scholar] [CrossRef]
  38. Cao, G.; Zhang, X.; Gong, S.; Zheng, F. Investigation on emission factors of particulate matter and gaseous pollutants from crop residue burning. J. Environ. Sci. 2008, 20, 50–55. [Google Scholar] [CrossRef] [PubMed]
  39. Li, J.; Hu, R.; Song, Y.; Shi, J.; Bhattacharya, S.C.; Bhattacharya, S.C. Assessment of sustainable energy potential of non-plantation biomass resources in China. Biomass Bioenergy 2005, 29, 167–177. [Google Scholar]
  40. Li, X.; Wang, S.; Duan, L.; Hao, J.; Li, C.; Chen, Y.; Yang, L. Particulate and trace gas emissions from open burning of wheat straw and corn stover in China. Environ. Sci. Technol. 2007, 41, 6052–6058. [Google Scholar] [CrossRef] [PubMed]
  41. Zhang, H.; Hu, J.; Qi, Y.; Li, C.; Chen, J.; Wang, X.; He, J.; Wang, S.; Hao, J.; Zhang, L. Emission characterization, environmental impact, and control measure of PM2. 5 emitted from agricultural crop residue burning in China. J. Clean. Prod. 2017, 149, 629–635. [Google Scholar] [CrossRef]
  42. Zhou, Y.; Xing, X.; Lang, J.; Chen, D.; Cheng, S.; Wei, L.; Wei, X.; Liu, C. A comprehensive biomass burning emission inventory with high spatial and temporal resolution in China. Atmos. Chem. Phys. 2017, 17, 2839–2864. [Google Scholar] [CrossRef]
  43. Tang, X.-B.; Huang, C.; Lou, S.-R.; Qiao, L.-P.; Wang, H.-L.; Zhou, M.; Chen, M.; Chen, C.-H.; Wang, Q.; Li, G.-L. Emission factors and PM chemical composition study of biomass burning in the Yangtze River Delta region. Huan Jing Ke Xue Huanjing Kexue 2014, 35, 1623–1632. [Google Scholar]
  44. Chen, J.; Li, C.; Ristovski, Z.; Milic, A.; Gu, Y.; Islam, M.S.; Wang, S.; Hao, J.; Zhang, H.; He, C. A review of biomass burning: Emissions and impacts on air quality, health and climate in China. Sci. Total Environ. 2017, 579, 1000–1034. [Google Scholar] [CrossRef] [PubMed]
  45. Deng, J.; Wang, T.; Jiang, Z.; Xie, M.; Zhang, R.; Huang, X.; Zhu, J. Characterization of visibility and its affecting factors over Nanjing, China. Atmos. Res. 2011, 101, 681–691. [Google Scholar] [CrossRef]
  46. Wang, Q.; Huang, X.; Chen, Z.; Tan, D.; Chuai, X. Movement of the gravity of carbon emissions per capita and analysis of causes. J. Nat. Resour. 2009, 24, 833–841. [Google Scholar]
  47. Zhang, Y.; Tang, L.; Wang, Z.; Yu, H.; Sun, Y.; Liu, D.; Qin, W.; Canonaco, F.; Prévôt, A.S.; Zhang, H. Insights into characteristics, sources, and evolution of submicron aerosols during harvest seasons in the Yangtze River delta region, China. Atmos. Chem. Phys. 2015, 15, 1331–1349. [Google Scholar] [CrossRef]
  48. Li, R.; Cui, L.; Li, J.; Zhao, A.; Fu, H.; Wu, Y.; Zhang, L.; Kong, L.; Chen, J. Spatial and temporal variation of particulate matter and gaseous pollutants in China during 2014–2016. Atmos. Environ. 2017, 161, 235–246. [Google Scholar] [CrossRef]
  49. Streets, D.; Yarber, K.; Woo, J.H.; Carmichael, G. Biomass burning in Asia: Annual and seasonal estimates and atmospheric emissions. Glob. Biogeochem. Cycles 2003, 17. [Google Scholar] [CrossRef]
  50. Wang, M.; Shao, M.; Chen, W.; Yuan, B.; Lu, S.; Zhang, Q.; Zeng, L.; Wang, Q. A temporally and spatially resolved validation of emission inventories by measurements of ambient volatile organic compounds in Beijing, China. Atmos. Chem. Phys. 2014, 14, 5871–5891. [Google Scholar] [CrossRef]
  51. Zhao, S.; Yu, Y.; Yin, D.; He, J.; Liu, N.; Qu, J.; Xiao, J. Annual and diurnal variations of gaseous and particulate pollutants in 31 provincial capital cities based on in situ air quality monitoring data from China National Environmental Monitoring Center. Environ. Int. 2016, 86, 92–106. [Google Scholar] [CrossRef] [PubMed]
  52. Ren, J.; Yu, P.; Xu, X. Straw utilization in China—Status and recommendations. Sustainability 2019, 11, 1762. [Google Scholar] [CrossRef]
  53. Lu, H.; Hu, L.; Zheng, W.; Yao, S.; Qian, L. Impact of household land endowment and environmental cognition on the willingness to implement straw incorporation in China. J. Clean. Prod. 2020, 262, 121479. [Google Scholar] [CrossRef]
  54. Harbaugh, W.T.; Levinson, A.; Wilson, D.M. Reexamining the empirical evidence for an environmental Kuznets curve. Rev. Econ. Stat. 2002, 84, 541–551. [Google Scholar] [CrossRef]
  55. Flores, C.A.; Flores-Lagunes, A.; Kapetanakis, D. Lessons from quantile panel estimation of the environmental Kuznets curve. Econom. Rev. 2014, 33, 815–853. [Google Scholar] [CrossRef]
  56. Onafowora, O.A.; Owoye, O. Bounds testing approach to analysis of the environment Kuznets curve hypothesis. Energy Econ. 2014, 44, 47–62. [Google Scholar] [CrossRef]
  57. Wu, J.; Kong, S.; Wu, F.; Cheng, Y.; Zheng, S.; Yan, Q.; Zheng, H.; Yang, G.; Zheng, M.; Liu, D. Estimating the open biomass burning emissions in central and eastern China from 2003 to 2015 based on satellite observation. Atmos. Chem. Phys. 2018, 18, 11623–11646. [Google Scholar] [CrossRef]
  58. Meng, F.; Dungait, J.A.; Xu, X.; Bol, R.; Zhang, X.; Wu, W. Coupled incorporation of maize (Zea mays L.) straw with nitrogen fertilizer increased soil organic carbon in Fluvic Cambisol. Geoderma 2017, 304, 19–27. [Google Scholar] [CrossRef]
  59. Han, X.; Xu, C.; Dungait, J.A.; Bol, R.; Wang, X.; Wu, W.; Meng, F. Straw incorporation increases crop yield and soil organic carbon sequestration but varies under different natural conditions and farming practices in China: A system analysis. Biogeosciences 2018, 15, 1933–1946. [Google Scholar] [CrossRef]
  60. Xu, J.; Jiang, H.; Mei, Z. Policies for straw stalks comprehensive use and long-term management recommendations. China Biogas 2019, 37, 87–90. [Google Scholar]
  61. Diehlmann, F.; Zimmer, T.; Glöser-Chahoud, S.; Wiens, M.; Schultmann, F. Techno-economic assessment of utilization pathways for rice straw: A simulation-optimization approach. J. Clean. Prod. 2019, 230, 1329–1343. [Google Scholar] [CrossRef]
  62. Sun, J.; Shen, Z.; Cao, J.; Zhang, L.; Wu, T.; Zhang, Q.; Yin, X.; Lei, Y.; Huang, Y.; Huang, R. Particulate matters emitted from maize straw burning for winter heating in rural areas in Guanzhong Plain, China: Current emission and future reduction. Atmos. Res. 2017, 184, 66–76. [Google Scholar] [CrossRef]
Figure 1. Geographical location of the study area.
Remotesensing 16 01438 g001
Figure 2. Data preparation and analysis.
Remotesensing 16 01438 g002
Figure 3. (a) Annual, (b) monthly, and (c) seasonal distribution of fire points in Hunan Province from 2010 to 2020. Q1 represents Spring from January to March. Q2 represents Summer from April to June. Q3 represents Autumn from July to September. Q4 represents Winter from October to December.
Remotesensing 16 01438 g003
Figure 4. Distribution of fire points in 14 cities in Hunan Province from 2010 to 2020.
Remotesensing 16 01438 g004
Figure 5. Kernel density of fire points in Hunan Province from 2010 to 2020.
Remotesensing 16 01438 g005
Figure 6. Spatial distribution of the significant coefficients (at the 95% confidence level) of geographic factors, including elevation ( x 1 ) and aspect ( x 2 ).
Remotesensing 16 01438 g006
Figure 7. Spatial distribution of the significant coefficients (at the 95% confidence level) of socioeconomic factors, including crop yield ( x 3 ), population density ( x 4 ), and GDP ( x 5 ).
Remotesensing 16 01438 g007
Figure 8. Spatial distribution of the significant coefficients (at the 95% confidence level) of human activity factors, including road density (( x 6 ), settlement density ( x 7 ), and distance from road ( x 8 ).
Remotesensing 16 01438 g008
Table 1. Description of the data used in this study.
Data TypeSourceDescriptionUsageResolution
MODISNASA LAADS DAAC
(https://www.earthdata.nasa.gov/eosdis/daacs/laads) (accessed on 1 April 2023)
MOD14
(Terra)/MYD14 (Aqua)
Extracting the number of fire points1 km × 1 km
Land-use and administrative areaResource and Environmental Science and Data Center, Chinese Academy of Sciences
(https://www.resdc.cn/) (accessed on 1 April 2023)
Land-use data in 2010, 2014, and 2020Extracting the number of fire points1 km raster data
30 km × 30 km
Digital Elevation Model (DEM)Geospatial Data Cloud
(http://www.gscloud.cn/search) (accessed on 1 April 2023)
SRTM DEMExtracting natural factors, including elevation, slope, and aspect90 m
Crop informationHunan Statistical Yearbook (2010–2020)Annual crop yield and crop-sown area of various districts or counties in Hunan ProvinceExtracting Socioeconomic factors, including crop yield and crop-sown area/
GDP and population densityHunan Statistical Yearbook (2010–2020)Annual GDP and population of various districts or counties in Hunan ProvinceExtracting Socioeconomic factors, including GDP and population density/
Roads and settlementsNational Catalogue Service for Geographic Information (https://mulu.tianditu.gov.cn/main.do?method=index) (accessed on 1 April 2023)Public basic geographic information data in 2014 and 2019, respectivelyExtracting human activity factors, including road density, settlement density, and distance from road/
Table 2. Statistical description of variables.
VariableDescription2010–2014 (116 Districts)2015–2020 (111 Districts)
MeanSt. Dev.MeanSt. Dev.
Dependent variable
Fire pointsNumber of fire points54.759.731.729.4
Natural factors
ElevationElevation of administrative districts (m)383.4261.3396.3258.9
SlopeSlope of administrative districts2.51.72.61.7
AspectAspect of administrative districts (sine)−0.02−0.67−0.010.68
Socioeconomic factors
Crop yieldCrop yield in districts (kiloton)270.7204.0271.3188.5
Crop-sown areaCrop-sown area in districts (km2)78.154.875.448.6
Population densityNumber of populations divided by the areas of districts (thousands/km2)0.50.60.50.6
GDPGross Domestic Product of districts (billion)18.819.028.326.1
Human activity factors
Road densityTotal road length divided by the areas of districts (100 m/km2)7.81.78.02.3
Settlement densityNumber of settlements divided by the areas of districts (counts/km2)0.20.10.30.1
Distance from roadAverage distance from fire points to the nearest roads in districts (m)531.8283.41563.1709.7
Table 3. DIFF of Criterion for GWR models.
Model 1
(2010–2014)
Model 2
(2015–2020)
Elevation−109.65−0.673
Aspect−1.103−30.109
Crop yield−46.218−1.407
Population density−0.037−0.355
GDP−1.796−1.226
Road density−259.450−1.230
Settlement density−7.827−0.383
Distance from road−3.270−2.271
Table 4. Model comparison.
Model 1
(2010–2014)
Model 2
(2015–2020)
AICcR2AICcR2
OLS1276.2590.1841055.4060.223
GWR1247.3390.6321033.6960.505
Table 5. Estimation of the GWR models for fire points.
VariableModel 1
(2010–2014)
Model 2
(2015–2020)
MinMaxMeanSTDMinMaxMeanSTD
Intercept−493.60236.73−77.41177.30−10.1143.3411.8615.32
Geographic factors
Elevation   ( x 1 )−0.090.210.020.08−0.040.04−0.010.02
Aspect   ( x 2 )−0.432.040.590.56−0.090.090.010.04
Socioeconomic factors
Crop   yield   ( x 3 )0.030.170.090.040.040.080.070.01
Population   density   ( x 4 )−79.8820.26−19.2826.29−1.8541.968.179.77
GDP   ( x 5 )−0.203.130.640.90−0.38−0.10−0.220.08
Human activity factors
Road   density   ( x 6 )−24.2520.50−1.2010.19−1.231.370.090.74
Settlement   density   ( x 7 )−526.91571.0423.48197.92−1235.61−19.30−383.19321.35
Distance   from   road   ( x 8 )−0.080.120.020.050.000.010.010.00
Disclaimer/Publisher’s Note: The statements, opinions and data contained in all publications are solely those of the individual author(s) and contributor(s) and not of MDPI and/or the editor(s). MDPI and/or the editor(s) disclaim responsibility for any injury to people or property resulting from any ideas, methods, instructions or products referred to in the content.

