
Potential Modulation of Aerosol on Precipitation Efficiency in Southwest China


1
Chongqing Institute of Meteorological Sciences, Chongqing 401147, China
2
Plateau Atmosphere and Environment Key Laboratory of Sichuan Province, College of Atmospheric Science, Chengdu University of Information Technology, Chengdu 610225, China
3
Institute of Atmospheric Physics, Chinese Academy of Sciences, Beijing 100045, China
4
Department of Atmospheric and Oceanic Sciences, School of Physics, Peking University, Beijing 100871, China
5
Southwest United Graduate School, Kunming 650092, China
*
Author to whom correspondence should be addressed.
Remote Sens. 2024, 16(8), 1445; https://doi.org/10.3390/rs16081445
Submission received: 22 February 2024
/
Revised: 14 April 2024
/
Accepted: 17 April 2024
/
Published: 18 April 2024
(This article belongs to the Special Issue Application of Satellite Aerosol Remote Sensing in Air Quality)
Abstract
:The aerosol–cloud–precipitation correlation has been a significant scientific topic, primarily due to its remarkable uncertainty. However, the possible modulation of aerosol on the precipitation capacity of clouds has received limited attention. In this study, we utilized multi-source data on aerosol, cloud properties, precipitation, and meteorological factors to investigate the impact of aerosols on precipitation efficiency (PE) in the Sichuan Basin (SCB) and Yun-nan-Guizhou Plateau (YGP), where the differences between terrain and meteorological environment conditions were prominent. In the two study regions, there were significant negative correlations between the aerosol index (AI) and PE in spring, especially in the YGP, while the correlations between the AI and PE in other seasons were not as prominent as in spring. In spring, aerosol significantly inhibited both the liquid water path (LWP) and the ice water path (IWP) in the YGP, but negatively correlated with the IWP and had no significant relationship with the LWP in the SCB. Aerosol inhibited precipitation in the two regions mainly by reducing cloud droplet effective radius, indicating that warm clouds contributed more to precipitation in spring. The suppressive impact of aerosols on precipitation serving as the numerator of PE is greater than that of the cloud water path as the denominator of PE, resulting in a negative correlation between aerosol and PE. The AI–PE relationship is significantly dependent on meteorological conditions in the YGP, but not in the SCB, which may be related to the perennial cloud cover and stable atmosphere in the SCB. In the future, as air quality continues to improve, precipitation efficiency may increase due to the decrease in aerosol concentration, and of course, the spatio-temporal heterogeneity of the aerosol–cloud–precipitation relationship may become more significant.
1. Introduction
Clouds are pivotal in regulating the radiative balance, global/local water cycles, and other processes [1,2,3]. There is a significant correlation between precipitation and macro-microphysical properties of clouds [4,5,6], and under suitable thermodynamic and dynamic conditions, cloud microphysical processes play a direct role in the occurrence and evolution of precipitation [7,8,9,10].
Huang and Cui [11] simulated a heavy precipitation process in Sichuan and found that the development of precipitation processes is mainly related to two main cloud microphysical processes: the water vapor condensation and the graupel particle growth through collision-coalescence with frozen cloud water, followed by melting to form rainwater. Another process involves the condensation of water vapor into cloud water and the coalescence of cloud droplets to form rainwater. Huang et al. [12] found that as precipitation intensity increases, the cloud microphysical conversion processes directly or indirectly related to the production of rainwater become significantly enhanced. The distinctive dynamic and thermal effects of the Tibetan Plateau exert a significant influence on cloud and precipitation processes [13,14]. The southeastern Tibetan Plateau exhibits notably higher cloud water content and precipitation compared to the western part, along with a more pronounced precipitation efficiency [9,15,16]. Zhao et al. [9] found that precipitation in the eastern part of the Tibetan Plateau exhibits a similar declining trend to the cloud water path during the monsoon season, and precipitation is more dependent on ice clouds than on liquid water clouds. Precipitation efficiency serves as a crucial indicator when studying the transformation and distribution of cloud water resources. A profound comprehension of the interaction between clouds, precipitation, and precipitation efficiency holds significant importance in the study of natural precipitation or even artificial precipitation. Currently, there exist multiple precipitation efficiency definitions. Some studies define it as the ratio of surface precipitation to the amount of water vapor entering the cloud, while other studies use different quantities to indirectly represent precipitation efficiency [17]. Sui et al. [18] defined a more comprehensive precipitation efficiency based on the vertical integration budget of water vapor and total cloud content. Liu et al. [8] defined cloud precipitation efficiency as the ratio of the precipitation amount to the sum of the liquid water path (LWP) and the ice water path (IWP). Moreover, Zhao et al. [9] conducted a study on the Tibetan Plateau, examining the fundamental characteristics of precipitation efficiency and its influencing factors based on the definition proposed by Liu et al. [8].
As one of the areas in China with the most severe air pollution, the southwestern region is marked by significant anthropogenic emissions of air pollutants. Additionally, its distinct complex topography hinders the transport and diffusion of air pollutants [19,20,21,22]. High aerosol loading has already affected cloud microphysical and precipitation processes in the southwestern region [23]. On the one hand, the rise in anthropogenic aerosols contributes to a reduction in the cloud droplets’ effective radius through indirect effects, thereby inhibiting the formation of precipitation. On the other hand, the radiative impacts of aerosols can bolster atmospheric stability and diminish water vapor transport, ultimately leading to a reduction in precipitation in the southwestern region of China [24,25]. Previous studies [26,27] have indicated that aerosol in the Sichuan Basin strengthens atmospheric stability at daytime, and the accumulated unstable energy is released at night, leading to enhanced nocturnal precipitation. Zhao et al. [28] proposed that high aerosol loading strengthens atmospheric stability through radiative effects, resulting in a decrease in supercooled cloud water above the freezing layer and a reduction in ice particle formation. Zhu et al. [29] found that the impact of aerosols on warm clouds is influenced by various meteorological conditions in the Sichuan Basin. High atmospheric stability, strong updrafts, and humid atmospheric conditions tend to enhance cloud cover. In contrast, low atmospheric stability and humid atmospheric conditions favor the formation of thicker and more extensive cloud layers.
The above studies indicate that clouds are directly related to precipitation and aerosols have an impact on clouds and precipitation. The aerosol–cloud–precipitation relationship has received a lot of attention, with relatively less attention given to the possible links between aerosols and the precipitation potential of clouds. This study utilizes long-term observed data from multiple satellite products to investigate the potential modulation of aerosols on cloud precipitation efficiency in southwestern China with significant differences in terrain and meteorological environment.
2. Data and Methodology
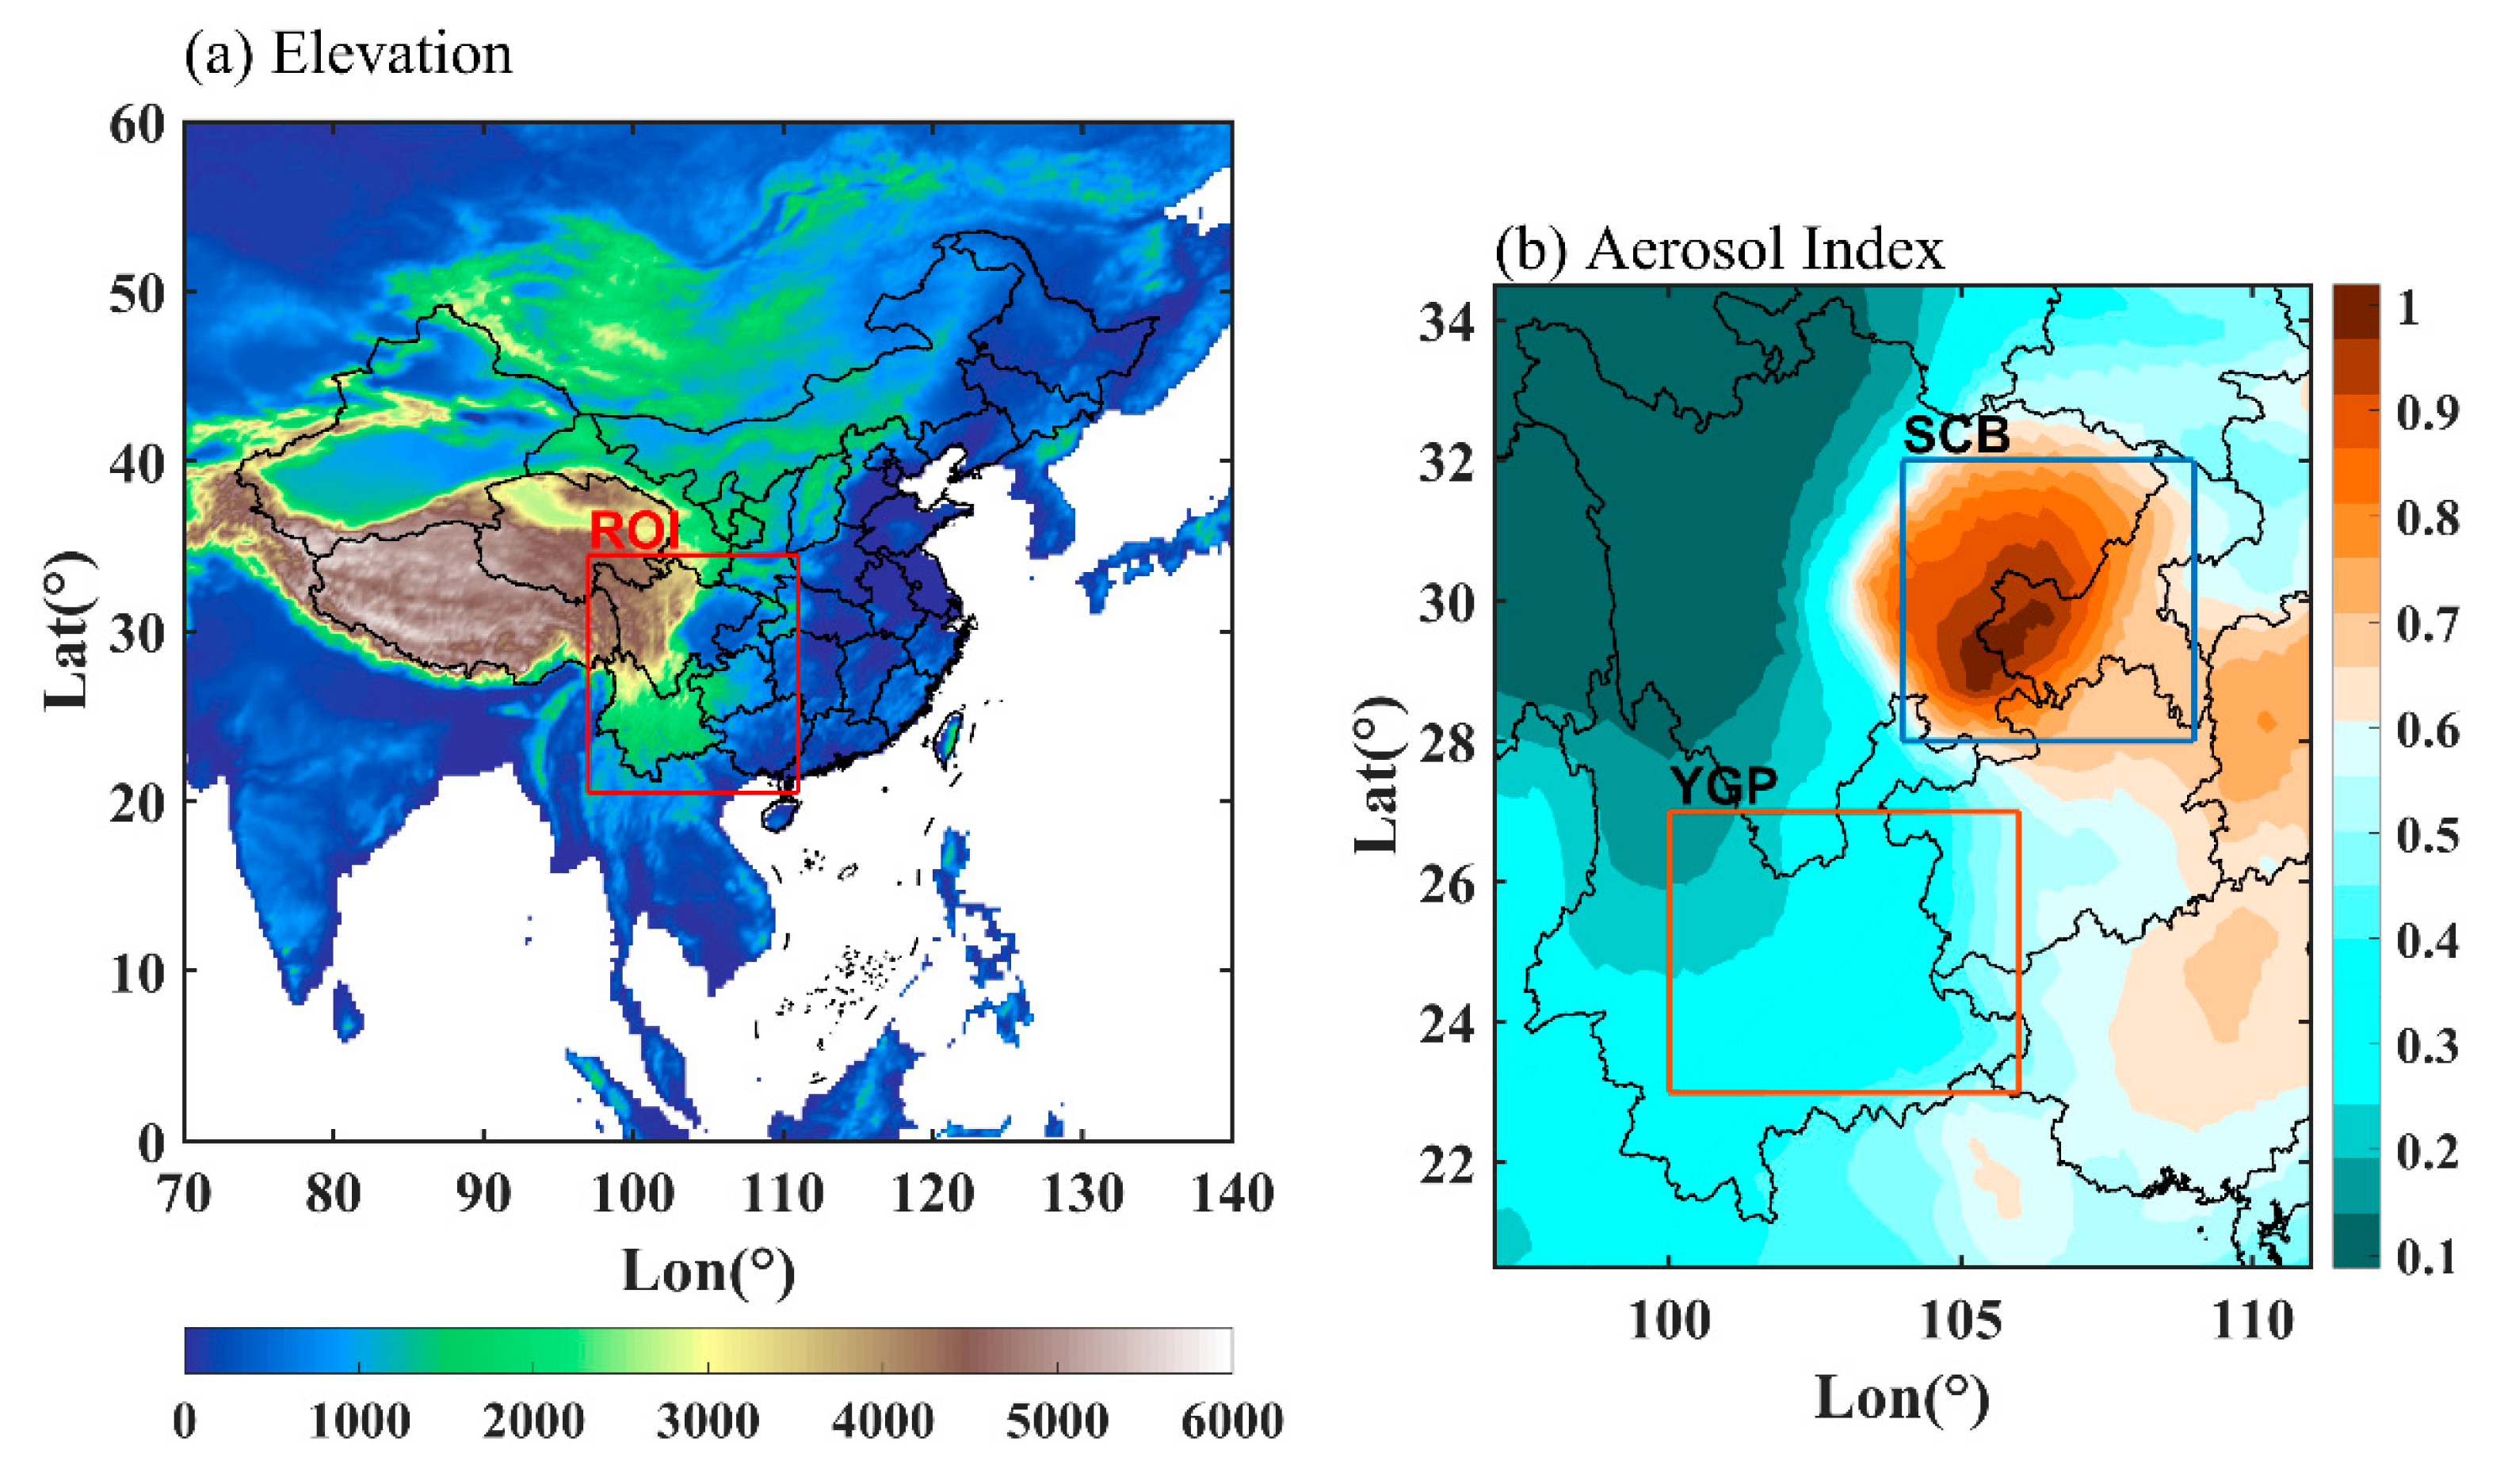
Southwest China has the most complicated terrain in China, including the Tibetan Plateau (TP), the Yunnan-Guizhou Plateau (YGP), and the Sichuan Basin (SCB). As the Asia Water Tower, the TP has a huge high-altitude terrain, and the clouds and precipitation in this region are generally discussed independently [9]. Southwest China, excluding the TP, is the region of interest (ROI) in this study (Figure 1a). The average altitude of the YGP is approximately 2000 m, and the average altitude of the SCB is approximately 600 m, while the aerosol concentration in the SCB is distinctly higher than that in the YGP, and the average aerosol index (AI) approximately is 0.8 and 0.2, respectively. Due to the significant difference in aerosol loading (Figure 1b) and altitude, the SCB and YGP are selected to discuss the potential modulation of aerosol on the potential cloud precipitation capacity in Southwest China.
In this study, precipitation efficiency (PE) is used to represent the potential precipitation capacity of clouds. PE is defined as precipitation divided by the cloud water path [8,9,30], as shown in Equation (1), Pre in the equation represents precipitation,
In Equation (1), Pre is the precipitation, LWP represents the liquid water path, and IWP represents the ice water path. LWP and IWP refer to the column content of liquid water and ice phase water above the unit area of the surface obtained based on satellite observation and retrieval, respectively. The monthly mean precipitation from 1998 to 2015 was obtained from the TRMM-3B43 dataset [31]. TRMM-3B43 is the monthly mean version of the TRMM-3B42 data, and the precipitation data merges high-quality infrared data, microwave data, and rain gauge data at the global scale. A previous study [32] used precipitation data from 756 ground stations in China to compare with the TRMM3B43 precipitation product, suggesting that the two datasets have a good consistency. The monthly LWP and IWP from 1998 to 2015 were obtained from the CLARA-A2 dataset with a spatial resolution of 0.25° × 0.25° [33]. A range of cloud properties products of CLARA_A2 datasets are derived from the AVHRR sensor onboard polar orbiting NOAA and METOP satellites. All cloud products were calibrated based on MODIS data prior to retrieval, and the cloud screening was effectively improved by utilizing CALIPSO-CALIOP data.
The aerosol index (AI) is defined as the product of the aerosol optical depth (AOD) and the Ångström exponent (AE), as shown in Equation (2). The AI is a dimensionless parameter. Previous studies [34,35] have suggested that the AI could better characterize aerosol concentration than the AOD,
The AOD and AE from 1998 to 2015 are derived from the MERRA-2 aerosol reanalysis product dataset, with an original resolution of 0.625° × 0.5° [36]. To match with other datasets, the AOD and AE were interpolated to a spatial resolution of 0.25° × 0.25°.
Previous studies [30,37,38,39] have demonstrated that atmospheric stability and relative humidity play a crucial role in the impact of aerosols on clouds and precipitation. These meteorological factors are key determinants of how aerosols behave in the atmosphere and how they affect the formation of clouds and precipitation. The convective available potential energy (CAPE) and the lower troposphere average relative humidity (RH) were selected to analyze the constraints of meteorological environmental factors on the potential modulation of aerosol on precipitation efficiency. Relative humidity (RH) is typically calculated as the average of the relative humidity at the surface and the relative humidity at an altitude of 3 km (height above ground level). This approach allows for a representation of the moisture conditions in the low-tropospheric atmosphere. The monthly CAPE and the relative humidity at pressure levels from 1998 to 2015 are provided by the ERA5 with a spatial resolution of 0.25° × 0.25° [40].
In this study, March, April, and May are defined as spring (MAM), June, July, and August as summer (JJA), September, October, and November as autumn (SON), and December, January, and February as winter (DJF). The AI–PE relationship on the monthly scale was analyzed from 1998 to 2015.
3. Results and Discussion
3.1. Aerosol, Cloud Water, Precipitation, and PE
The complex terrain and the difference in population density in Southwest China led to the obvious spatial difference in aerosol loading [41]. Figure 1b shows the distribution pattern of the annual mean AI in the SCB and YGP. The AI in the SCB is larger than that in the YGP, the AI in the SCB ranges from 0.6 to 1 and the AI in the YGP ranges from 0.2 to 0.5. The prominent anthropogenic emission of air pollution and the basin topography unfavorable to the diffusion of air pollution are the main reasons for the higher aerosol concentration in the SCB than in the YGP.
Figure 2 displays the distribution pattern of the annual mean monthly precipitation, the LWP, the IWP, and the PE. The annual average monthly precipitation of the SCB and YGP is close to each other. The annual mean LWP of the SCB is 150 g m−2 approximately and the high-value LWP area around the SCB is mainly caused by the uplift of the mountainous terrain. The annual mean LWP of the YGP is lower than that of the SCB, approximately 100 g m−2. The annual average IWP in the SCB and YGP is close, but the average IWP of the SCB is slightly higher. The annual mean PE of the YGP is higher than that of the SCB. The LWP and the IWP of the YGP are both lower than that of the SCB, while PE is lower than that of the YGP, which may be related to the perennial cloud cover in the SCB caused by the topographic effect [42,43,44].
Figure 3 displays the monthly precipitation, the monthly LWP, the monthly IWP, and the monthly PE in the YGP and SCB. In autumn, the precipitation in the SCB is higher than that in the YGP in September and November, and the precipitation in the YGP is higher in October. In winter, in December and January, the precipitation in the YGP is higher than that in the SCB, and in February, the precipitation in the Sichuan Basin is relatively higher. In spring, the precipitation in the SCB is larger than that in the YGP, while in summer, the precipitation in the SCB is lower than that in the YGP, which may be due to the South Asian monsoon transporting sufficient water vapor to the YGP [45,46,47]. Except that the LWP of the SCB and YGP is close in July and August, the LWP of the SCB is above 150 g m−2 in other months, which is significantly higher than that of the YGP. In the YGP, the monthly LWP in the warm season (May–October) is larger than that in the cold season (November–April), and the average value is more than 100 g m−2. For the IWP, the monthly distribution characteristics of the SCB and YGP are similar, except, in October, the IWP in the SCB is higher than that in the YGP. The IWP in the SCB is above 150 g m−2 from May to September, and above 100 g m−2 in other months. The IWP in the YGP is above 130 g m−2 in the warm season and below 100 g m−2 in winter. PE in the YGP is obviously larger than that in the SCB in all months, and PE in the YGP exceeds 80 g m−2 in the warm season and is between 40–80 g m−2 in the cold season. In the SCB, PE is the highest in summer, between 40–60 g m−2, the lowest in winter, below 10 g m−2, and between 15–40 g m−2 in spring and autumn.
In the SCB and YGP, there are obvious seasonal differences in the cloud water path, precipitation, and precipitation efficiency, which implies that there will be seasonal differences in the relationship between the AI and the PE, which may be opposite in different seasons, or the significance of the relationship may be different in different seasons. In summer, the active precipitation is mainly controlled by synoptic-scale systems. In winter, the precipitation in the two study regions is not significant. The relationship between aerosol-cloud precipitation in both seasons mentioned above may not be reflected. Therefore, the AI–PE relationship in spring and autumn may be relatively easy to identify.
3.2. Relation between the Cloud Water Path and Precipitation
Figure 4 illustrates the relation between the liquid water path (LWP) and precipitation in the SCB and YGP during different seasons. The positive correlation between the LWP and precipitation is most significant in the spring season. The correlation between precipitation and the LWP is more significant in the YGP, with a determination coefficient (R2) of 0.85, compared to that in the SCB (Figure 4a). The correlation between precipitation and the LWP is weakest in the summer season in the ROI (Figure 4b), which may be related to that summer precipitation is primarily influenced by synoptic systems. In the autumn and winter seasons, the LWP and precipitation are positively correlated in the YGP and SCB, although not as significantly as in the spring. Overall, the correlation between the LWP and precipitation is more significant in the YGP than in the SCB. This suggests that the response of precipitation to liquid clouds in the YGP is more sensitive than that in the SCB because the SCB is a special region with perennial clouds [42,44].
Figure 5 shows the correlations between the ice water path (IWP) and precipitation in different seasons in the study regions. Like the LWP, in both the YGP and the SCB, the contribution of ice water to precipitation is more pronounced in the spring. The determination coefficient for the positive correlation between precipitation and the IWP is 0.60 in the YGP, while it is 0.37 in the SCB. In the summer and autumn, IWPs show relatively significant positive correlations with precipitation in both the SCB and YGP, although the correlations are lower than those in spring. In the SCB, the determination coefficient between the IWP and precipitation in summer and autumn is 0.31 and 0.41, respectively. In the YGP, the determination coefficient between precipitation and the IWP in summer and autumn is 0.45 and 0.37, respectively. In the YGP, the positive correlation between the IWP and precipitation in winter is the most significant in the four seasons, with a determination coefficient of 0.64, while in the SCB, the correlation between the IWP and precipitation is not significant, with a determination coefficient of 0.08. In winter, the correlation between precipitation and the IWP in the SCB is very weak, suggesting that the response of precipitation to ice clouds is insensitive, which may be related to the extremely high frequency of mid-cloud occurrence in the SCB in winter [42], while in the YGP, the response of precipitation to the IWP and the LWP is near-equivalent (Figure 4d and Figure 5d).
3.3. Potential Modulation of Aerosol on PE
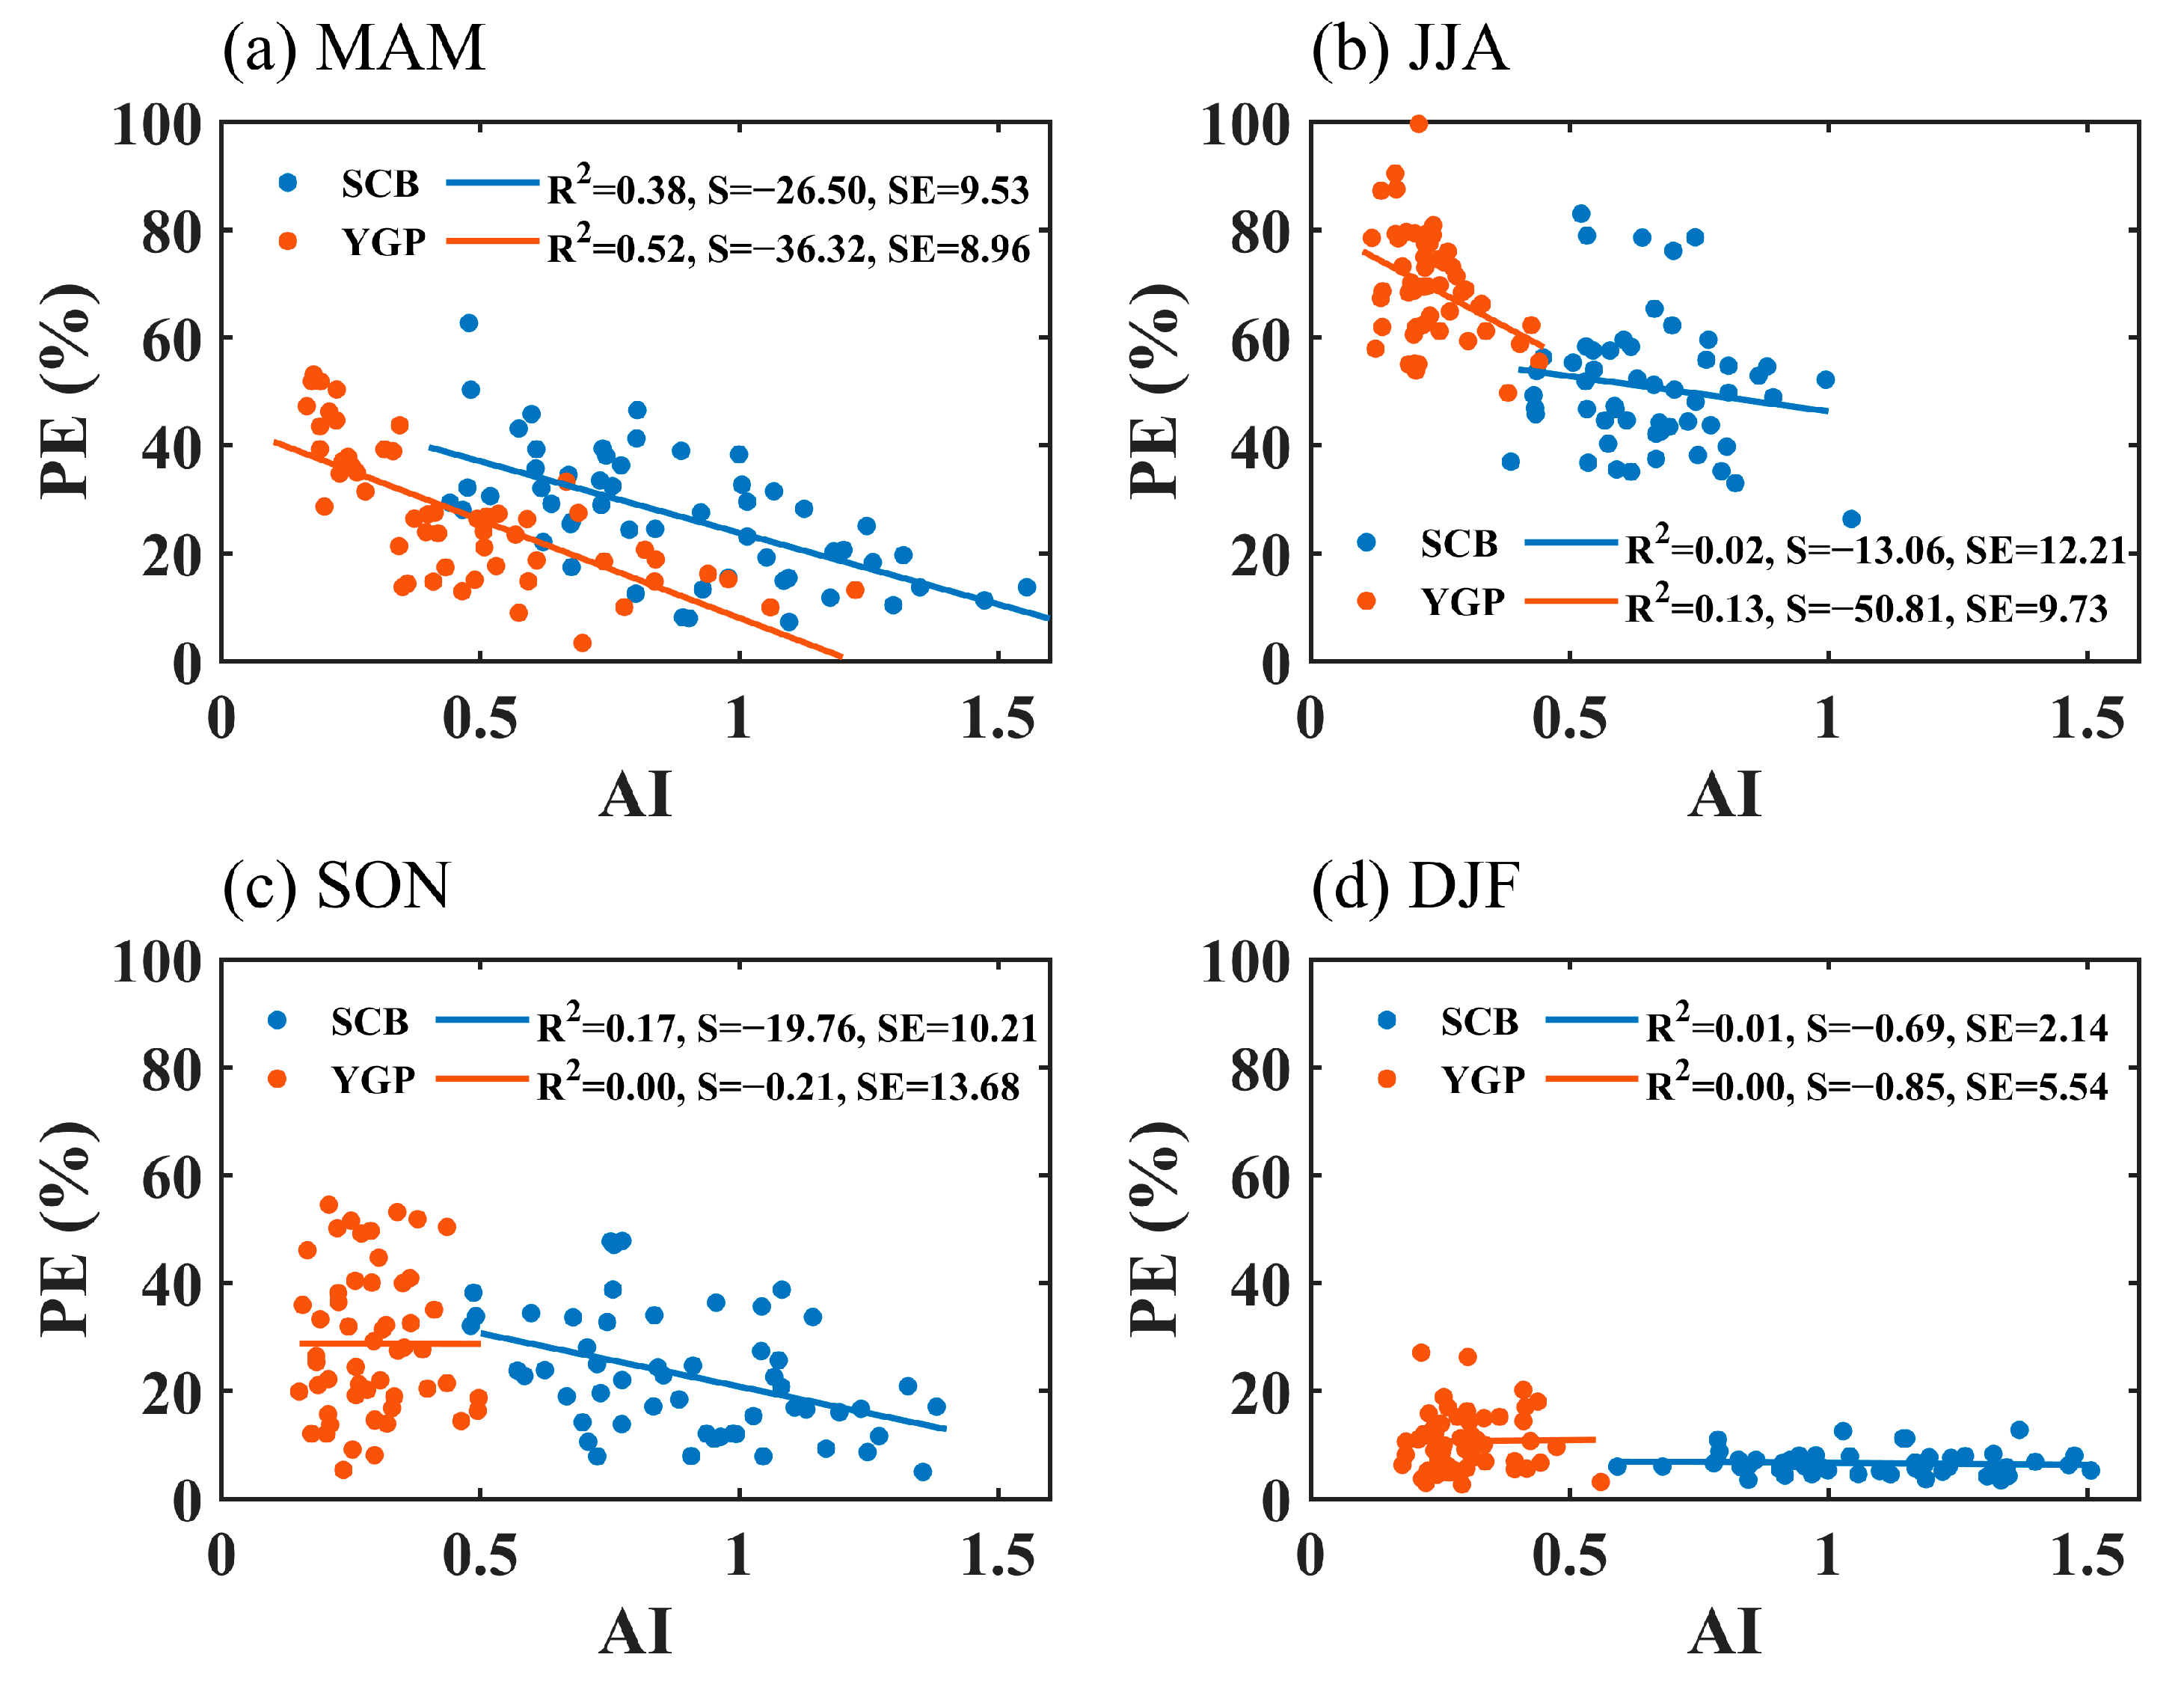
The direct and indirect effects of aerosol on clouds and precipitation have very prominent uncertainty, which is mainly restricted by aerosol type, cloud regimes, meteorological environment conditions, and so on [48,49,50]. Aerosols act as cloud condensation nuclei and ice nuclei, influencing cloud microphysical processes and subsequently impacting precipitation, which is the aerosol microphysical effect [51,52,53]. The direct effect of aerosols is that aerosols regulate weather and climate systems by affecting radiative balance processes [54,55,56].
Figure 6 shows the correlation between the AI and PE in the four seasons in the YGP and SCB. The relationship between aerosol and precipitation efficiency varies significantly in the four seasons, which is potentially related to the fact that clouds and precipitation are dominated by different local meteorological conditions and synoptic-scale systems in different seasons. The AI was significantly negatively correlated with PE in the SCB and YGP in spring, and the determination coefficient was 0.38 and 0.52, respectively. The influence of aerosol on precipitation efficiency in the YGP was more significant than that in the SCB. In the summer, there was a negative correlation between the AI and PE in the YGP with a determination coefficient of 0.13, while there was no significant correlation between the AI and PE in the SCB. In autumn, the AI was negatively correlated with PE in the SCB with a determination coefficient of 0.17, while there was no significant correlation in the YGP. In winter, the relationship between the AI and PE was not significant in the two study regions. The negative correlation between the AI and PE indicates the inhibition effect of aerosol on precipitation efficiency, which may be due to the increase of aerosol concentration leading to the formation of more and smaller cloud droplets in the cloud, and the lower collision–coalescence efficiency is not conducive to the growth of raindrops [57,58,59]. The correlation between aerosol and precipitation efficiency is the most significant in spring, while in summer and autumn, it is less significant, mainly because the clouds and precipitation in the SCB and YGP in these two seasons are controlled by a variety of synoptic scale systems, such as the East Asian monsoon, the South Asian monsoon, the autumn rain system in West China and the quasi-stationary front [60,61,62], so the impact of aerosol on cloud and precipitation is overwhelmed. In winter, there is no significant correlation between aerosol and precipitation efficiency, mainly because precipitation and precipitation efficiency are very low in the season of water vapor shortage, and the aerosol effect cannot be reflected in this period. This is not to definitively imply that aerosol has no influence on cloud and precipitation processes in summer, autumn, and winter in the study regions, but compared with thermodynamics and humidity conditions at different scales, the aerosol effect is not the dominant condition for the formation and development of cloud and precipitation, and the relationship between aerosol and precipitation is covered.
In the following, we focus on the potential modulation of aerosol on precipitation efficiency in spring and analyze the reasons why aerosol inhibits spring precipitation efficiency in the SCB and YGP from the perspective of the relationship between aerosol and cloud properties and the relationship between aerosol and precipitation.
The LWP adjustment by aerosol perturbation is an important reflection of aerosol influence on clouds in addition to the Twomey effect [63]. The LWP restricts the effect of aerosol on the effective radius of cloud droplets [64,65,66]. To reveal the influence of aerosol on precipitation efficiency, it is important to first analyze the adjustment of aerosol to the cloud water path (CWP, LWP plus IWP) before further exploring the impact of aerosol on precipitation.
Figure 7 shows the correlation between the AI and the LWP, the AI and the IWP, and the AI and the CWP in the two study regions in spring. In the YGP, the AI is significantly negatively correlated with the LWP, suggesting the inhibition effect of aerosol on the LWP, while in the SCB, there was no significant correlation between the LWP and AI. The AI is negatively correlated with the IWP in the two study regions, and the significance was more significant in the YGP. Since precipitation efficiency in this paper is calculated by the cloud water path as the denominator, the change in the total cloud water path directly affects precipitation efficiency. In the YGP, the CWP displayed an obvious decline trend with the increase of the AI, mainly because the LWP and the IWP both decreased significantly with the increase of the AI, especially the LWP; and in the SCB, although it also decreased with the increase of the AI, the decreasing trend was not as prominent as that in the YGP, mainly because the LWP did not change significantly with the increase of the AI in the SCB, and the variation of the CWP with the AI was mainly due to the contribution of the LWP. Previous studies [67,68,69] have suggested that the LWP shows a significant downward trend with the increase of aerosol loading, which is dependent on meteorological conditions.
PE declines with the increase of the AI (Figure 6a), and the CWP as the denominator of PE declines with the increase of the AI (Figure 7c), which indicates that the precipitation of PE as the numerator declines with the increase of the AI more prominent than that of the CWP.
To further analyze the adjustment of aerosol on precipitation, Figure 8 displays the relationships between the AI and precipitation, the AI and the effective radius of liquid cloud droplet (LREF), and the AI and the effective radius of ice cloud particle (IREF) in the YGP and SCB in spring. As can be seen from Figure 8a, the AI is significantly negatively correlated with precipitation in the two study regions, with determination coefficients of 0.46 and 0.43, respectively, indicating the inhibition effect of increasing aerosol on precipitation. Previous studies [57,58,59] have suggested that aerosol inhibits the warm precipitation process by reducing the radius of cloud droplets. Aerosols have a prominent excitation effect on convective precipitation, as they inhibit the warm rain process. This results in more and smaller cloud droplets being transported to the ice-phase region to participate in the formation of ice particles, which releases more latent heat and further stimulates convective precipitation [55,70,71]. However, in a relatively dry atmosphere condition, aerosol also has an inhibitory effect on convective precipitation [72,73]. In spring, convective precipitation is not frequent in the SCB and YGP, so the aerosol inhibition effect on precipitation in these two regions may be mainly caused by the inhibition effect of aerosol on the warm rain process. Aerosol significantly inhibited the LREF in the YGP and SCB in the spring (Figure 8b), and the determination coefficient was 0.44 and 0.15, respectively, indicating that the cloud droplet size decreased with the increase of aerosol loading in spring. The decrease of cloud droplet size with the enhancement of aerosol loading explains the mechanism of aerosol suppression on precipitation in spring. The decrease in cloud droplet size leads to a decrease in collision–coalescence efficiency, which is not conducive to the occurrence of warm cloud precipitation. Of course, this is mainly related to the prominent contribution of warm cloud precipitation in spring precipitation in the YGP and SCB (Figure 4). As demonstrated in Figure 8c, the AI and IREF showed a significant positive correlation in the YGP, with a determination coefficient of 0.23, indicating that the increase of aerosol loading is conducive to the growth of ice particles. Since aerosol inhibits the precipitation process of warm clouds, small cloud droplets that are not coalesced by the collision and form raindrops are transported by the updraft to the ice-phase region to participate in the formation of ice particles, promoting the growth of the radius of ice particles. However, the relationship between the AI and IREF in the SCB is not significant. In the YGP, aerosol has a significant effect on both liquid cloud droplets and ice particles, while in the SCB, aerosol has a certain effect on liquid cloud droplets, but it is not as prominent as in the YGP, while aerosol does not affect ice particles.
The difference between the impacts of aerosol on macro and micro properties of the cloud in the YGP and SCB may be related to the prominent stable atmospheric stratification in spring and the characteristics of perennial medium cloud coverage caused by the special topography of the SCB [42,43,44,74]. All these factors are not conducive to the coupling of boundary layer and cloud, and thus to the influence of aerosol on cloud. In this way, the microphysical response of aerosol cannot be reflected. For the YGP, the atmospheric thermodynamic conditions are conducive to the impacts of aerosol on warm and cold cloud microphysical processes, and then on precipitation. That is to say, the significant inhibition impact of aerosol on the potential capacity of clouds for precipitation over the YGP in spring is mainly related to the prominent effect of aerosol on microphysics, which in turn inhibits precipitation.
The aerosol–cloud–precipitation interaction is constrained by atmospheric environmental conditions, such as stability, humidity conditions, vertical wind shear, atmospheric precipitable water vapor, etc., especially stability and humidity conditions.
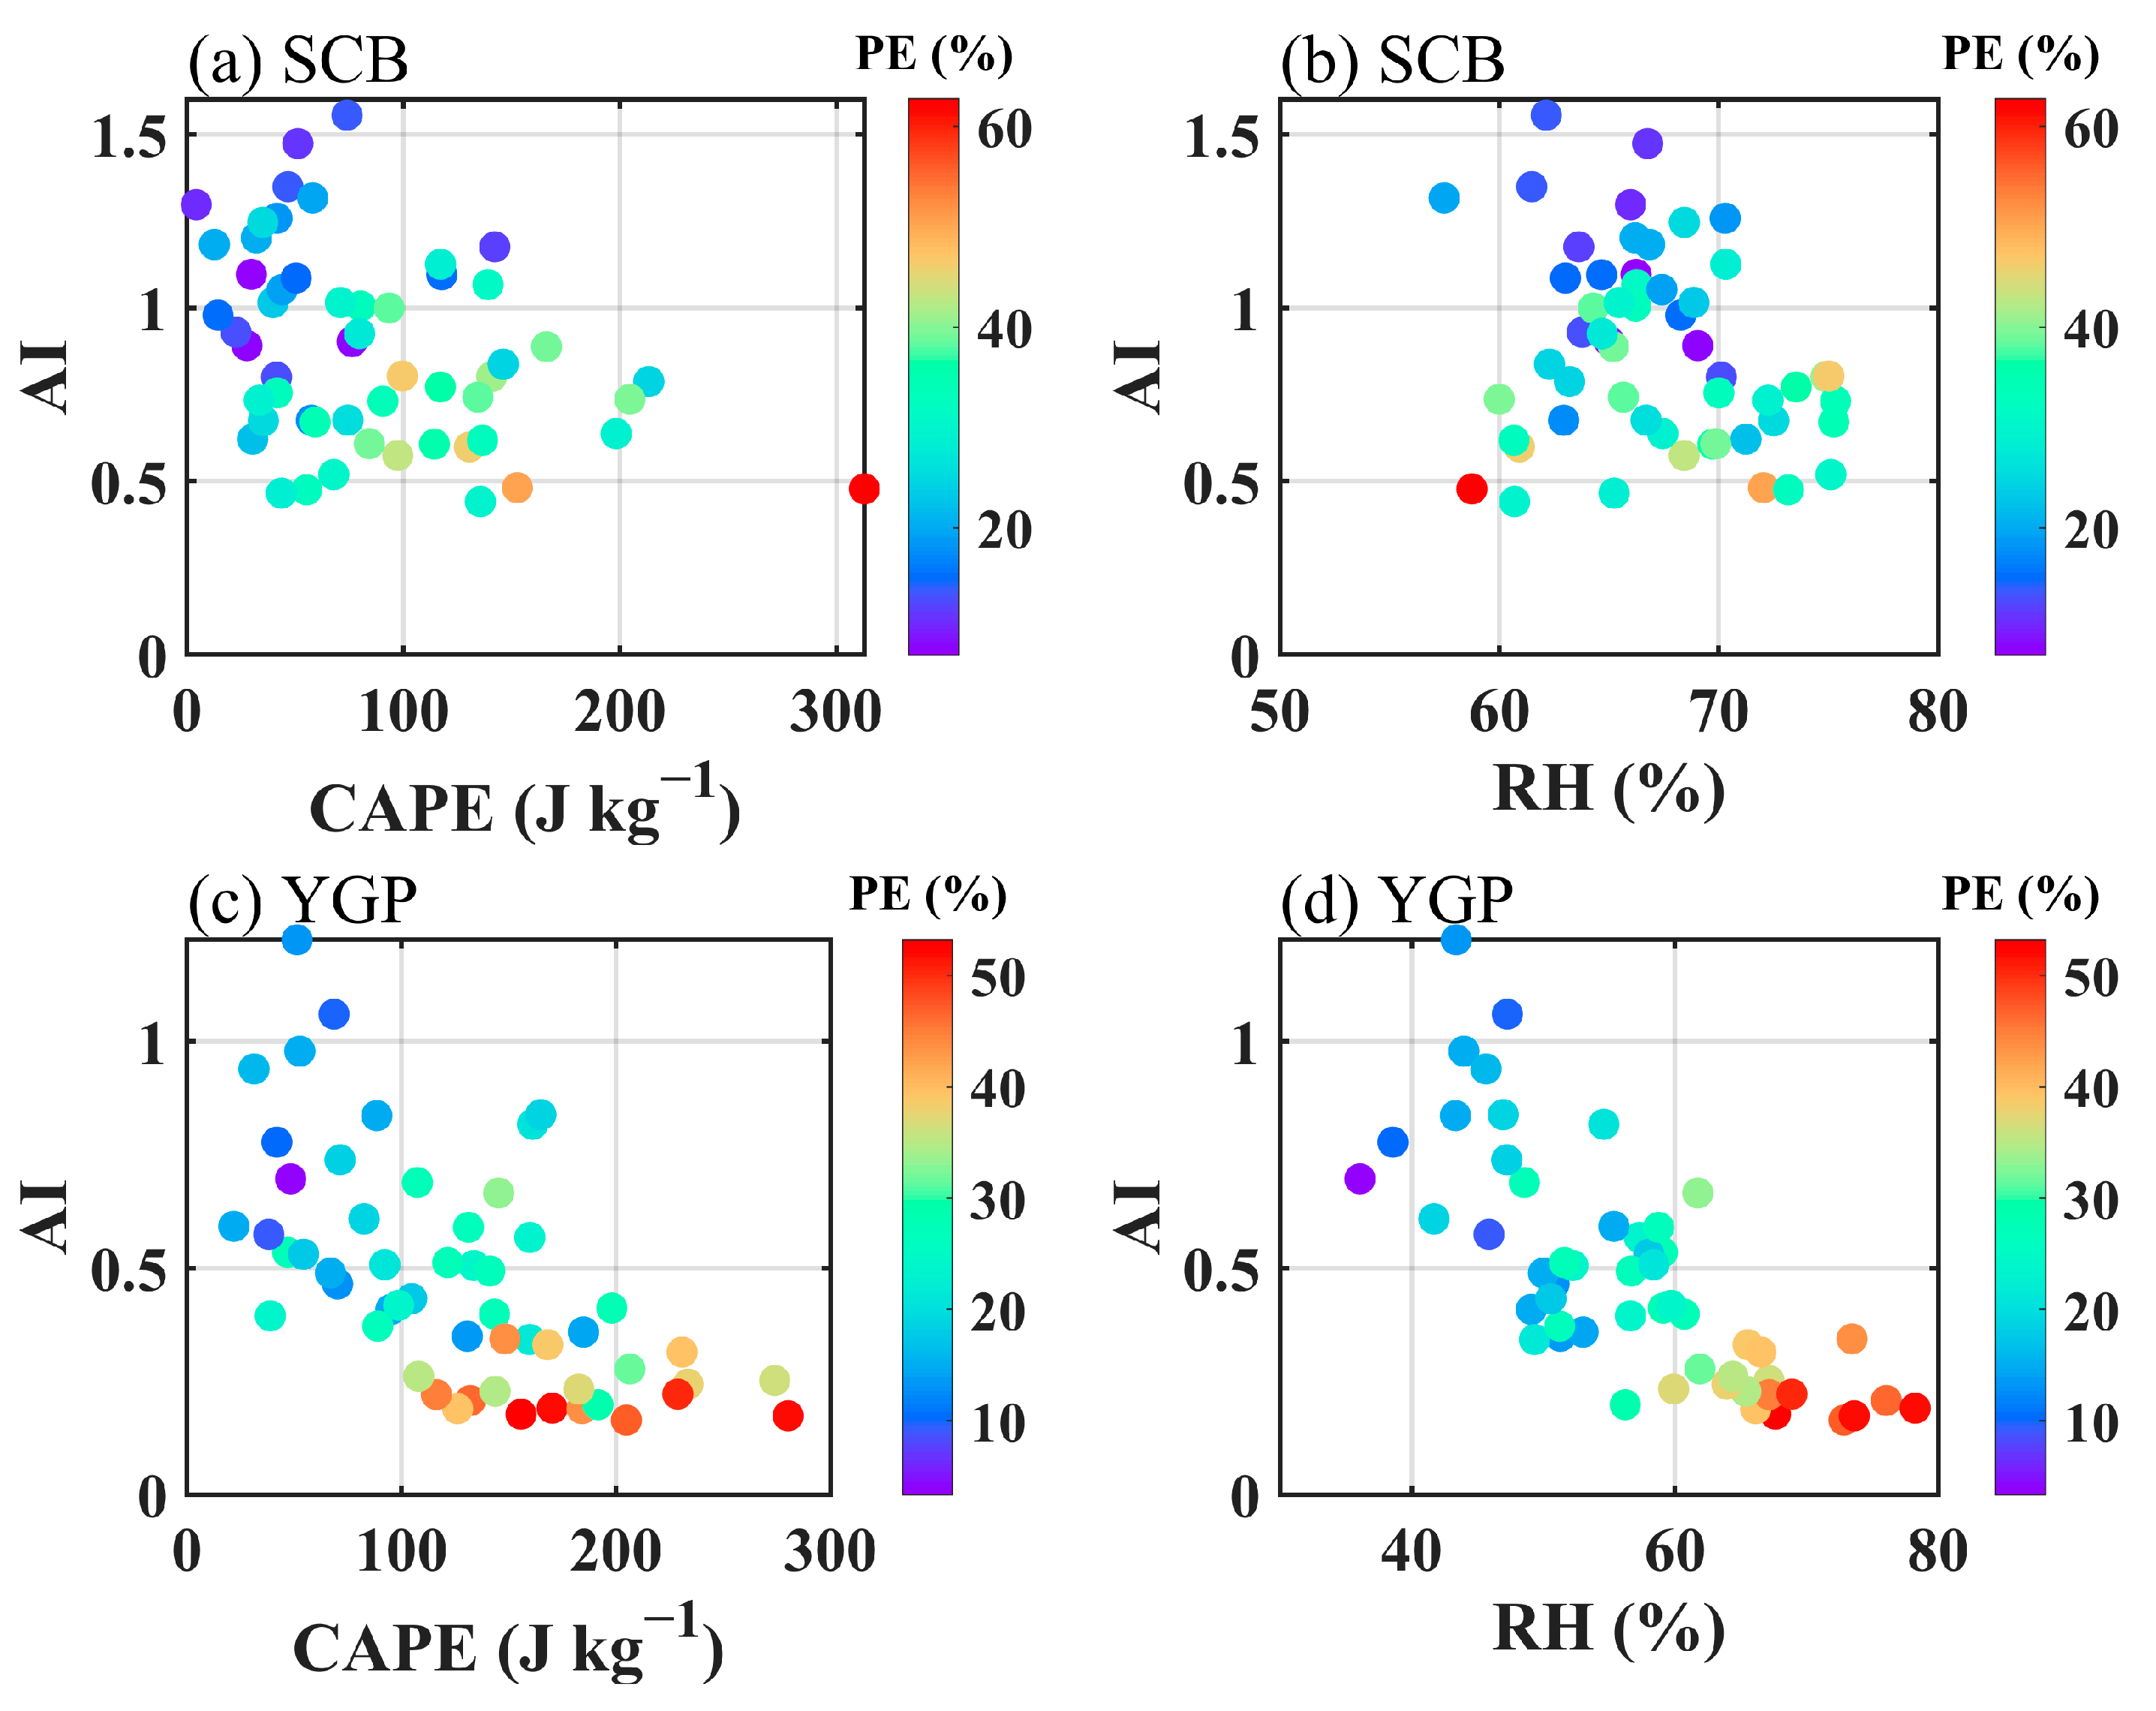
Figure 9 illustrates the constraints of the CAPE and the RH on the relationship between AI and PE in the YGP and SCB in spring. In the SCB, the CAPE has a certain constraint effect on the AI–PE relationship, when the CAPE is small, that is, under high atmospheric stability, precipitation efficiency decreases with the increase of aerosol (Figure 9a). However, the dependence of the relationship between AI and PE on the RH was not evident in the SCB (Figure 9b). It can be seen from Figure 9c,d that the CAPE and the RH have significant constraints on the AI–PE relationship in the YGP. Under the lower CAPE and the RH and larger AI conditions, PE is smaller. When the CAPE value is less than 105 J kg−1, the RH value is less than 60%, and the AI value is greater than 0.5, PE is less than 30%. In summary, in the YGP in spring, the increase of aerosol concentration decreases precipitation efficiency, and the stable atmosphere and drier lower troposphere result in the decline of cloud potential precipitation capacity. Previous studies [9,75] have suggested that stable and dry atmospheric conditions in Southwest China are not conducive to the production of precipitation within clouds, that is, these conditions will inhibit precipitation efficiency. According to our research, in the YGP, the increase of aerosol loading will inhibit precipitation efficiency by affecting microphysics. Of course, if the atmosphere is relatively stable and dry, this inhibition effect may be more prominent. While, in the SCB, compared with the YGP, the weaker inhibition effect of aerosol on PE may be related to the special topography, which is independent of stability and humidity conditions.
4. Conclusions
Based on CLARA-A2 cloud properties data, TRMM-3B43 precipitation data, MERRA-2 aerosol reanalysis products, and ERA5 meteorological environmental condition reanalysis data from 1998 to 2015, this study investigated the potential effect of aerosol on cloud PE over the SCB and the YGP in Southwest China.
Although the SCB and the YGP are close to each other geographically, there are very prominent differences in topography and meteorological environment, which lead to obvious differences in cloud properties, precipitation, and cloud potential precipitation capacity between the two regions. In spring, the precipitation of the YGP is lower than that of the SCB, while in summer, the precipitation of the SCB is lower than that of the YGP. The LWP and the IWP in the SCB were higher than those in the YGP in the four seasons. The potential precipitation capacity of clouds in the Yunnan-Guizhou Plateau is more prominent than that in the Sichuan Basin in all seasons. In the two study regions, the positive correlation between the liquid cloud process and precipitation in spring is the most prominent among the four seasons, suggesting that precipitation is more significantly dependent on warm cloud processes in spring. The dependence of precipitation on cold clouds is most significant in winter, with a coefficient of determination of 0.64, while the dependence of precipitation on cold clouds is most significant in autumn in the SCB, with a coefficient of determination of 0.37. This indicates that the dependence of precipitation on ice clouds is the most prominent in the YGP in winter, while that of precipitation in the SCB in autumn is the most prominent.
In spring, the negative PE–AI relationships were most prominent in the two study regions, especially in the YGP, indicating that aerosols inhibited cloud precipitation capacity in the two regions. However, in other seasons, the correlation between aerosol and precipitation efficiency was not prominent in the two study regions, especially in winter. The reason why the influence of aerosol on cloud precipitation capacity is more significant in spring may be that clouds and precipitation in the two study regions in summer and autumn are mainly dominated by synoptic-scale systems and the aerosol–cloud–precipitation interaction is overwhelmed, while in winter, the precipitation is very low, which does not reflect the aerosol effect. Zhang et al. [76,77] found that in spring in South China, the increase of anthropogenic aerosols inhibited precipitation associated with mesoscale convective systems, mainly due to that aerosol radiative effect reducing the radiation reaching the ground, and the microphysical effect of aerosol increases the cloud–body albedo, which in turn makes the lower tropospheric atmosphere more stable. Some recent studies [78,79,80,81,82] have also indicated that absorbing aerosols and hygroscopic aerosols could make the lower troposphere atmosphere more stable through their effects on radiative and cloud processes.
This study focuses on the AI–PE relationship in spring in the ROI to further analyze the possible physical mechanism of aerosol effect on cloud precipitation capacity. Since PE is calculated by dividing precipitation by the cloud water path, it is necessary to clarify the modulation of aerosol on precipitation and the cloud water path, and then the reason for the inhibition of aerosol on potential cloud precipitation capacity. In spring, the AI and CWP were significantly negatively correlated in the two study regions, and the negative correlation was more prominent in the YGP, and the AI was negatively correlated with the LWP, and between the AI and the IWP. In the SCB, the AI was negatively correlated with the IWP, while the relationship between the AI and the LWP was not significant. This indicates that the negative AI–CWP correlation in the SCB is mainly contributed by the negative correlation between the AI and the IWP, not the LWP, which may be related to the perennial middle cloud cover in the SCB. Previous studies [67,68,69] have suggested that the relationship between aerosol and the LWP has significant spatial variability, mainly depending on meteorological conditions, such as relative humidity, and this relationship is negative in most regions. Fons et al. [83] proposed a causal analysis method to quantify the LWP adjustments of aerosol perturbations. The LWP adjustment is first positive and then negative with time and depends on the meteorological regime. When the covariation of cloud droplet size and cloud depth is not considered, the negative LWP adjustment to aerosol might be overestimated. In the two study regions, the AI and precipitation, as well as the AI and LREF, showed a significant negative correlation, indicating that the increase of aerosol reduced cloud droplet size and the collision–coalescence efficiency, thus inhibiting precipitation. This is because the contribution of warm clouds to precipitation is more prominent in spring, and aerosol could affect warm clouds through its microphysical effects, and then affect precipitation. The significant AI–PE negative correlation is mainly because the AI is more negatively correlated with precipitation as the numerator of PE than with the CWP as the denominator of PE. The aerosol–cloud–precipitation interaction is dependent on meteorological conditions, especially relative humidity, and atmospheric stability [8,9,75]. In this study, the AI–PE relationship in the YGP has a prominent dependence on the RH and the CAPE, but it is not significant in the SCB.
In this study, the relationship between aerosol and precipitation efficiency in Southwest China from 1998 to 2015 was analyzed, and this period was a period of severe air pollution in China. China’s air quality has improved significantly since 2013 [41]. Under the background of the continuous decrease of aerosol concentration and climate change, the response of precipitation to aerosols may be more sensitive, especially the aerosol radiative effect [84]. Wang et al. [85] have suggested that the contribution of aerosols to extreme weather in the context of warmer climates may surpass that of greenhouse gases.
Author Contributions
Conceptualization, P.Z. and C.Z.; methodology, P.Z.; formal analysis, P.Z. and X.L.; investigation, P.Z.; resources, P.Z. and C.Z.; data curation, P.Z.; writing—original draft preparation, P.Z.; writing—review and editing, P.Z. and X.L.; visualization, P.Z.; supervision, C.Z. and X.L.; project administration, X.L. and C.Z.; funding acquisition, X.L. and C.Z. All authors have read and agreed to the published version of the manuscript.
Funding
This research was funded by Yunnan Southwest United Graduate School Science and Technology Special Project, grant number 202302AP370003; the Second Tibetan Plateau Scientific Expedition and Research (STEP) program, grant number 2019QZKK0104; and the Technological Innovation Capacity Enhancement Program of Chengdu University of Information Technology, grant number KYQN202301.
Data Availability Statement
MERRA-2 aerosol reanalysis products can be downloaded from https://disc.gsfc.nasa.gov/datasets, accessed on 14 December 2021, the ERA5 meteorological environment conditions reanalysis data can be downloaded from https://cds.climate.copernicus.eu/cdsapp#!/dataset, accessed on 5 April 2022, the CLARA-A2 cloud properties data can be downloaded from https://wui.cmsaf.eu/safira/action/viewDoiDetails?acronym=CLARA_AVHRR_V002, accessed on 26 June 2022, and the TRMM_3B43 precipitation data can be downloaded from https://disc.gsfc.nasa.gov/datasets/TRMM_3B43_7, accessed on 29 June 2022.
Acknowledgments
The authors acknowledge the support from the Chengdu Plain Urban Meteorology and Environment Observation and Research Station of Sichuan Province.
Conflicts of Interest
The authors declare no conflicts of interest.
References
- Ramanathan, V.; Cess, R.D.; Harrison, E.F.; Minnis, P.; Barkstrom, B.R.; Ahmad, E.; Hartmann, D. Cloud-Radiative Forcing and Climate: Results from the Earth Radiation Budget Experiment. Science 1989, 243, 57–63. [Google Scholar] [CrossRef]
- Rosenfeld, D.; Ulbrich, C.W. Cloud Microphysical Properties, Processes, and Rainfall Estimation Opportunities. Meteor. Monogr. 2003, 30, 237–258. [Google Scholar] [CrossRef]
- Soden, B.J.; Held, I.M. An assessment of climate feedbacks in coupled ocean-atmosphere models. J. Clim. 2006, 19, 3354–3360. [Google Scholar] [CrossRef]
- Rosenfeld, D.; Gutman, G. Retrieving microphysical properties near the tops of potential rain clouds by multispectral analysis of AVHRR data. Atmos. Res. 1994, 34, 259–283. [Google Scholar] [CrossRef]
- Rapp, A.D. Observational evidence linking precipitation and mesoscale cloud fraction in the southeast Pacific. Geophys. Res. Lett. 2016, 43, 7267–7273. [Google Scholar] [CrossRef]
- Murakami, Y.; Kummerow, C.D.; Van Den Heever, S.C. On the Relation among Satellite-Observed Liquid Water Path, Cloud Droplet Number Concentration and Cloud Base Rain Rate and Its Implication to the Auto-Conversion Parameterization in Stratocumulus Clouds. J. Clim. 2021, 34, 8165–8180. [Google Scholar] [CrossRef]
- Sun, J.; Shi, Z.; Chai, J.; Xu, G.; Niu, B. Effects of Mixed Phase Microphysical Process on Precipitation in a Simulated Convective Cloud. Atmosphere 2016, 7, 97. [Google Scholar] [CrossRef]
- Liu, Y.; Luo, R.; Zhu, Q.; Hua, S.; Wang, B. Cloud ability to produce precipitation over arid and semiarid regions of Central and East Asia. Int. J. Climatol. 2019, 40, 1824–1837. [Google Scholar] [CrossRef]
- Zhao, P.; Xiao, H.; Liu, J.; Zhou, Y. Precipitation efficiency of cloud and its influencing factors over the Tibetan plateau. Int. J. Climatol. 2022, 42, 416–434. [Google Scholar] [CrossRef]
- Tang, L.; Gao, W.; Xue, L.; Zhang, G.; Guo, J. Climatological Characteristics of Hydrometeors in Precipitating Clouds over Eastern China and Their Relationship with Precipitation Based on ERA5 Reanalysis. J. Appl. Meteor. Climatol. 2023, 62, 625–641. [Google Scholar] [CrossRef]
- Huang, Y.; Cui, X. Dominant Cloud Microphysical Processes of a Torrential Rainfall Event in Sichuan, China. Adv. Atmos. Sci. 2015, 32, 389–400. [Google Scholar] [CrossRef]
- Huang, Y.; Cui, X.; Wang, Y. Cloud microphysical differences with precipitation intensity in a torrential rainfall event in Sichuan, China. Atmos. Oceanic Sci. Lett. 2016, 9, 90–98. [Google Scholar] [CrossRef]
- Gao, W.; Liu, L.; Li, J.; Lu, C. The Microphysical Properties of Convective Precipitation Over the Tibetan Plateau by a Subkilometer Resolution Cloud-Resolving Simulation. J. Geophys. Res. Atmos. 2018, 123, 3212–3227. [Google Scholar] [CrossRef]
- Tang, J.; Guo, X.; Chang, Y. A Numerical Investigation on Microphysical Properties of Clouds and Precipitation over the Tibetan Plateau in Summer 2014. J. Meteorol. Res. 2019, 33, 463–477. [Google Scholar] [CrossRef]
- Wang, C.; Shi, H.; Hu, H.; Wang, Y.; Xi, B. Properties of cloud and precipitation over the Tibetan Plateau. Adv. Atmos. Sci. 2015, 32, 1504–1516. [Google Scholar] [CrossRef]
- Chen, B.; Zhang, W.; Yang, S.; Xu, X. Identifying and contrasting the sources of the water vapor reaching the subregions of the Tibetan Plateau during the wet season. Clim. Dyn. 2019, 53, 6891–6907. [Google Scholar] [CrossRef]
- Sui, C.H.; Satoh, M.; Suzuki, K. Precipitation efficiency and its role in cloud-radiative feedbacks to climate variability. J. Meteorol. Soc. Jpn. 2020, 98, 261–282. [Google Scholar] [CrossRef]
- Sui, C.H.; Li, X.; Yang, M.J. On the definition of precipitation efficiency. J. Atmos. Sci. 2007, 64, 4506–4513. [Google Scholar] [CrossRef]
- Liu, X.; Chen, Q.; Che, H.; Zhang, R.; Gui, K.; Zhang, H.; Zhao, T. Spatial distribution and temporal variation of aerosol optical depth in the Sichuan basin, China, the recent ten years. Atmos. Environ. 2016, 147, 434–445. [Google Scholar] [CrossRef]
- Liao, T.; Gui, K.; Li, Y.; Wang, X.; Sun, Y. Seasonal distribution and vertical structure of different types of aerosols in southwest China observed from CALIOP. Atmos. Environ. 2021, 246, 118145. [Google Scholar] [CrossRef]
- Zhang, K.; Zhao, C.; Fan, H.; Yang, Y.; Sun, Y. Toward understanding the differences of PM 2.5 characteristics among five China urban cities. Asia-Pac. J. Atmos. Sci. 2020, 56, 493–502. [Google Scholar] [CrossRef]
- Fan, H.; Zhao, C.; Yang, Y. A comprehensive analysis of the spatio-temporal variation of urban air pollution in China during 2014–2018. Atmos. Environ. 2020, 220, 117066. [Google Scholar] [CrossRef]
- Liu, J.; Zhao, C.; Lin, Y.; Zhang, Q.; Liu, H.; Xiao, Q.; Peng, Y. Potential impacts of aerosol on diurnal variation of precipitation in autumn over the Sichuan Basin, China. J. Geophys. Res. Atmos. 2022, 127, e2022JD036674. [Google Scholar] [CrossRef]
- Zhao, C.; Yang, Y.; Chi, Y.; Sun, Y.; Zhao, X.; Letu, H.; Xia, Y. Recent progress in cloud physics and associated radiative effects in China from 2016 to 2022. Atmos. Res. 2023, 293, 106899. [Google Scholar] [CrossRef]
- Huo, F.; Jiang, Z.; Ma, H.; Li, Z.; Li, Y. Reduction in autumn precipitation over Southwest China by anthropogenic aerosol emissions from eastern China. Atmos. Res. 2021, 257, 105627. [Google Scholar] [CrossRef]
- Fan, J.; Rosenfeld, D.; Yang, Y.; Zhao, C.; Leung, L.R.; Li, Z. Substantial contribution of anthropogenic air pollution to catastrophic floods in Southwest China. Geophys. Res. Lett. 2015, 42, 6066–6075. [Google Scholar] [CrossRef]
- Lu, H.; Xie, M.; Liu, B.; Liu, X.; Feng, J.; Yang, F.; Zhao, X.; You, T.; Wu, Z.; Gao, Y. Impact of atmospheric thermodynamic structures and aerosol radiation feedback on winter regional persistent heavy particulate pollution in the Sichuan-Chongqing region, China. Sci. Total Environ. 2022, 842, 156575. [Google Scholar] [CrossRef] [PubMed]
- Zhao, P.; Li, Z.; Xiao, H.; Wu, F.; Zheng, Y.; Cribb, M.C.; Jin, X.; Zhou, Y. Distinct aerosol effects on cloud-to-ground lightning in the plateau and basin regions of Sichuan, Southwest China. Atmos. Chem. Phys. 2020, 20, 13379–13397. [Google Scholar] [CrossRef]
- Zhu, S.; Xiao, Z.; Che, H.; Chen, Q. Impact of aerosols on warm clouds over the Sichuan Basin, China in winter based on the MERRA-2 reanalysis dataset. Atmos. Pollut. Res. 2022, 13, 101342. [Google Scholar] [CrossRef]
- Market, P.; Allen, S.; Scofield, R.; Kuligowski, R.; Gruber, A. Precipitation efficiency of warm-season Midwestern mesoscale convective systems. Weather Forecast. 2003, 18, 1273–1285. [Google Scholar] [CrossRef]
- TRMM (TMPA/3B43) Rainfall Estimate L3 1 Month 0.25 Degree × 0.25 Degree V7, Greenbelt, MD, Goddard Earth Sciences Data and Information Services Center (GES DISC). Available online: https://disc.gsfc.nasa.gov/datasets/TRMM_3B43_7/summary (accessed on 16 April 2024).
- Zhao, T.; Yatagai, A. Evaluation of TRMM 3B42 product using a new gauge-based analysis of daily precipitation over China. Int. J. Climatol. 2014, 34, 2749–2762. [Google Scholar] [CrossRef]
- Karlsson, K.G.; Anttila, K.; Trentmann, J.; Stengel, M.; Meirink, J.F.; Devasthale, A. CLARA-A2: The second edition of the CM SAF cloud and radiation data record from 34 years of global AVHRR data. Atmos. Chem. Phys. 2017, 17, 5809–5828. [Google Scholar] [CrossRef]
- Stier, P. Limitations of passive remote sensing to constrain global cloud condensation nuclei. Atmos. Chem. Phys. 2016, 16, 6595–6607. [Google Scholar] [CrossRef]
- Penner, J.E.; Xu, L.; Wang, M. Satellite methods underestimate indirect climate forcing by aerosols. Proc. Natl. Acad. Sci. USA 2011, 108, 13404–13408. [Google Scholar] [CrossRef] [PubMed]
- Randles, C.A.; Da Silva, A.M.; Buchard, V.; Colarco, P.R.; Darmenov, A.; Govindaraju, R.; Smirnov, A.; Holben, B.; Ferrare, R.; Hair, J.; et al. The MERRA-2 aerosol reanalysis, 1980 onward. Part I: System description and data assimilation evaluation. J. Clim. 2017, 30, 6823–6850. [Google Scholar] [CrossRef] [PubMed]
- Lutsko, N.J.; Cronin, T.W. Increase in precipitation efficiency with surface warming in radiative-convective equilibrium. J. Adv. Model. Earth Syst. 2018, 10, 2992–3010. [Google Scholar] [CrossRef]
- Narsey, S.; Jakob, C.N.; Singh, M.S.; Bergemann, M.; Louf, V.; Protat, A.; Williams, C. Convective precipitation efficiency observed in the tropics. Geophys. Res. Lett. 2019, 46, 13574–13583. [Google Scholar] [CrossRef]
- Anip, M.H.M.; Market, P.S. Dominant factors influencing precipitation efficiency in a continental mid-latitude location. Tellus A 2007, 59, 122–126. [Google Scholar] [CrossRef]
- Dee, D.P.; Uppala, S.M.; Simmons, A.J.; Berrisford, P.; Poli, P.; Kobayashi, S.; Andrae, U.; Balmaseda, M.A.; Balsamo, G.; Bauer, P.; et al. The ERA-Interim reanalysis: Configuration and performance of the data assimilation system. Q. J. R. Meteorol. Soc. 2011, 137, 553–597. [Google Scholar] [CrossRef]
- Song, C.; Wu, L.; Xie, Y.; He, J.; Chen, X.; Wang, T.; Lin, Y.; Jin, T.; Wang, A.; Liu, Y.; et al. Air pollution in China: Status and spatiotemporal variations. Environ. Pollut. 2017, 227, 334–347. [Google Scholar] [CrossRef]
- Jin, X.; Wu, T.; Li, L.; Shi, C. Cloudiness Characteristics over Southeast Asia from Satellite FY-2C and Their Comparison to Three Other Cloud Data Sets. J. Geophys. Res. Atmos. 2009, 114, D17207. [Google Scholar] [CrossRef]
- Xu, Z.; Tang, Y.; Connor, T.; Li, D.; Li, Y.; Liu, J. Climate variability and trends at a national scale. Sci. Rep. 2017, 7, 3258. [Google Scholar] [CrossRef] [PubMed]
- Wu, C.; Chou, M. Tibetan Plateau westerly forcing on the cloud amount over Sichuan Basin and the early Asian summer monsoon. J. Geophys. Res. Atmos. 2013, 118, 7558–7568. [Google Scholar] [CrossRef]
- Yao, S.; Huang, Q.; Zhang, Y.; Zhou, X. The simulation of water vapor transport in East Asia using a regional air–sea coupled model. J. Geophys. Res. Atmos. 2013, 118, 1585–1600. [Google Scholar] [CrossRef]
- James, R.; Bonazzola, M.; Legras, B.; Surbled, K.; Fueglistaler, S. Water vapor transport and dehydration above convective outflow during Asian monsoon. Geophys. Res. Lett. 2008, 35, L20810. [Google Scholar] [CrossRef]
- Jiang, W.; Yuan, P.; Chen, H.; Cai, J.; Li, Z.; Chao, N.; Sneeuw, N. Annual variations of monsoon and drought detected by GPS: A case study in Yunnan, China. Sci. Rep. 2017, 7, 5874. [Google Scholar] [CrossRef] [PubMed]
- Nandini, G.; Vinoj, V.; Pandey, S. Arabian Sea Aerosol-Indian Summer Monsoon Rainfall relationship and its modulation by El-Nino Southern Oscillation. Npj Clim. Atmos. Sci. 2022, 5, 25. [Google Scholar] [CrossRef]
- Kok, J.F.; Storelvmo, T.; Karydis, V.A.; Adebiyi, A.A.; Mahowald, N.M.; Evan, A.T.; He, C.; Leung, D.M. Mineral dust aerosol impacts on global climate and climate change. Nat. Rev. Earth. Environ. 2023, 4, 71–86. [Google Scholar] [CrossRef]
- Rosenfeld, D.; Kokhanovsky, A.; Goren, T.; Gryspeerdt, E.; Hasekamp, O.; Jia, H.; Lopatin, A.; Quaas, J.; Pan, Z.; Sourdeval, O. Frontiers in satellite-based estimates of cloud-mediated aerosol forcing. Rev. Geophys. 2023, 61, e2022RG000799. [Google Scholar] [CrossRef]
- Arola, A.; Lipponen, A.; Kolmonen, P.; Virtanen, T.H.; Bellouin, N.; Grosvenor, D.P.; Gryspeerdt, E.; Quaas, J.; Kokkola, H. Aerosol effects on clouds are concealed by natural cloud heterogeneity and satellite retrieval errors. Nat. Commun. 2022, 13, 7357. [Google Scholar] [CrossRef]
- Simpkins, G. Aerosol–Cloud interactions. Nat. Clim. Chang. 2018, 8, 457. [Google Scholar] [CrossRef]
- Wang, M.; Ghan, S.; Liu, X.; L’Ecuyer, T.S.; Zhang, K.; Morrison, H.; Ovchinnikov, M.; Easter, R.; Marchand, R.; Chand, D.; et al. Constraining cloud lifetime effects of aerosols using A-Train Satellite observations. Geophys. Res. Lett. 2012, 39, L15709. [Google Scholar] [CrossRef]
- Li, Z.; Niu, F.; Fan, J.; Liu, Y.; Rosenfeld, D.; Ding, Y. Long-term impacts of aerosols on the vertical development of clouds and precipitation. Nat. Geosci. 2011, 4, 888–894. [Google Scholar] [CrossRef]
- Fan, J.; Rosenfeld, D.; Zhang, Y.; Giangrande, S.E.; Li, Z.; Machado, L.A.T.; Martin, S.T.; Yang, Y.; Wang, J.; Artaxo, P.; et al. Substantial convection and precipitation enhancements by ultrafine aerosol particles. Science 2018, 359, 411–418. [Google Scholar] [CrossRef] [PubMed]
- Wei, J.; Lu, B.; Song, Y.; Chen, H.; Weng, Z. Anthropogenic aerosols weaken land–atmosphere coupling over North China. Geophys. Res. Lett. 2023, 50, e2023GL105685. [Google Scholar] [CrossRef]
- Stevens, B.; Feingold, G. Untangling aerosol effects on clouds and precipitation in a buffered system. Nature 2009, 461, 607–613. [Google Scholar] [CrossRef] [PubMed]
- Wang, F.; Guo, J.; Wu, Y.; Zhang, X.; Deng, M.; Li, X.; Zhang, J.; Zhao, J. Satellite observed aerosol-induced variability in warm cloud properties under different meteorological conditions over eastern China. Atmos. Environ. 2014, 84, 122–132. [Google Scholar] [CrossRef]
- L’Ecuyer, T.S.; Berg, W.; Haynes, J.; Lebsock, M.; Takemura, T. Global observations of aerosol impacts on precipitation occurrence in warm maritime clouds. J. Geophys. Res. 2009, 114, D09211. [Google Scholar] [CrossRef]
- Fu, S.; Mai, Z.; Sun, J.; Li, W.; Ding, Y.; Wang, Y. Impacts of convective activity over the Tibetan Plateau on plateau vortex, southwest vortex, and downstream precipitation. J. Atmos. Sci. 2019, 76, 3803–3830. [Google Scholar] [CrossRef]
- Li, X.; Zhou, W.; Li, C.; Song, J. Comparison of the annual cycles of moisture supply over southwest and southeast China. J. Clim. 2013, 26, 10139–10158. [Google Scholar] [CrossRef]
- Yuan, J.; Zhao, D.; Yang, R.; Yang, H. Predecessor rain events over China’s low-latitude highlands associated with Bay of Bengal tropical cyclones. Clim. Dynam. 2018, 50, 825–843. [Google Scholar] [CrossRef]
- Twomey, S.; Warner, J. Comparison of measurements of cloud droplets and cloud nuclei. J. Atmos. Sci. 1967, 24, 702–703. [Google Scholar] [CrossRef]
- Jia, H.; Ma, X.; Quaas, J.; Yin, Y.; Qiu, T. Is positive correlation between cloud droplet effective radius and aerosol optical depth over land due to retrieval artifacts or real physical processes? Atmos. Chem. Phys. 2019, 19, 8879–8896. [Google Scholar] [CrossRef]
- Kim, B.-G.; Schwartz, S.E.; Miller, M.A.; Min, Q. Effective radius of cloud droplets by ground-based remote sensing: Relationship to aerosol. J. Geophys. Res. 2003, 108, 4740. [Google Scholar] [CrossRef]
- Wang, Y.; Zhao, P.; Xiao, H.; Zhang, P. Aerosol effects on liquid cloud microphysical properties in south China: Land–ocean contrasts. Atmos. Pollut. Res. 2024, 15, 102032. [Google Scholar] [CrossRef]
- Toll, V.; Christensen, M.; Gassó, S.; Bellouin, N. Volcano and ship tracks indicate excessive aerosol-induced cloud water increases in a climate model. Geophys. Res. Lett. 2017, 44, 12492–12500. [Google Scholar] [CrossRef]
- Bender, F.A.-M.; Frey, L.; McCoy, D.T.; Grosvenor, D.P.; Mohrmann, J.K. Assessment of aerosol–cloud–radiation correlations in satellite observations, climate models and reanalysis. Clim. Dynam. 2019, 52, 4371–4392. [Google Scholar] [CrossRef]
- Gryspeerdt, E.; Goren, T.; Sourdeval, O.; Quaas, J.; Mülmenstädt, J.; Dipu, S.; Unglaub, C.; Gettelman, A.; Christensen, M. Constraining the aerosol influence on cloud liquid water path. Atmos. Chem. Phys. 2019, 19, 5331–5347. [Google Scholar] [CrossRef]
- Koren, I.; Dagan, G.; Altaratz, O. From aerosol-limited to invigoration of warm convective clouds. Science 2014, 344, 1143–1146. [Google Scholar] [CrossRef]
- Khain, A.P.; Phillips, V.; Benmoshe, N.; Pokrovsky, A. The role of small soluble aerosols in the microphysics of deep maritime clouds. J. Atmos. Sci. 2012, 69, 2787–2807. [Google Scholar] [CrossRef]
- Yang, X.; Li, Z.; Liu, L.; Zhou, L.; Cribb, M.; Zhang, F. Distinct weekly cycles of thunderstorms and a potential connection with aerosol type in China. Geophys. Res. Lett. 2016, 43, 8760–8768. [Google Scholar] [CrossRef]
- Tan, Y.; Peng, L.; Shi, Z.; Chen, H. Lightning flash density in relation to aerosol over Nanjing (China). Atmos. Res. 2016, 174–175, 1–8. [Google Scholar] [CrossRef]
- Jiang, X.; Li, Y.; Zhao, X.; Koike, T. Characteristics of the summertime boundary layer and atmospheric vertical structure over the Sichuan basin. J. Meteorol. Soc. Jpn. 2012, 90C, 33–54. [Google Scholar] [CrossRef]
- Mo, S.; Zhao, P.; Zhao, C.; Xiao, H.; Wang, Y.; Zhang, P.; Wen, X.; Qiu, S. Climatic precipitation efficiency and its dependence on environmental factors over the Sichuan Basin and adjacent regions, Southwest China. Theor. Appl. Climatol. 2024. [Google Scholar] [CrossRef]
- Zhang, L.; Fu, T.-M.; Tian, H.; Ma, Y.; Chen, J.; Tsai, T.-C.; Tsai, I.-C.; Meng, Z.; Yang, X. Anthropogenic aerosols significantly reduce mesoscale convective system occurrences and precipitation over Southern China in April. Geophys. Res. Lett. 2020, 47, e2019GL086204. [Google Scholar] [CrossRef]
- Zhang, L.; Fu, T.-M.; Hu, Z.; Liu, H.; Meng, Z.; Ma, L.; Dai, J.; Zhang, F. Springtime mesoscale convective systems over South China: A historic radar image-based analysis of climatological features, interannual variability, and potential connections with surface aerosol. Environ. Res. Lett. 2024, 19, 024026. [Google Scholar] [CrossRef]
- Spang, R.; Müller, R.; Rap, A. Radiative effect of thin cirrus clouds in the extratropical lowermost stratosphere and tropopause region. Atmos. Chem. Phys. 2024, 24, 1213–1230. [Google Scholar]
- Zhao, J.; Zhang, Y.; Bie, S.; Yang, G.; Bilsback, K.R.; Pierce, J.R.; Chen, Y. Improving Estimates of Dynamic Global Marine DMS and Implications for Aerosol Radiative Effect. J. Geophys. Res. Atmos. 2024, 129, 2. [Google Scholar] [CrossRef]
- Liu, M.; Shi, H.; Song, J.; Fu, D. Quantitation of the Surface Shortwave and Longwave Radiative Effect of Dust with an Integrated System: A Case Study at Xianghe. Sensors 2024, 24, 397. [Google Scholar] [CrossRef]
- Oh, S.S.; Lee, H.J.; Kim, M.S.; Park, M.S.; Kim, C.H. Aerosol-heat flux interactions in the boundary layer during the SIJAQ campaign. Atmos. Environ. 2024, 319, 120306. [Google Scholar] [CrossRef]
- Zhang, L.; Li, J.; Jiang, Z.; Dong, Y.; Ying, T.; Zhang, Z. Clear-Sky Direct Aerosol Radiative Forcing Uncertainty Associated with Aerosol Optical Properties Based on CMIP6 models. J. Clim. 2022, 35, 3007–3019. [Google Scholar] [CrossRef]
- Fons, E.; Runge, J.; Neubauer, D.; Lohmann, U. Stratocumulus adjustments to aerosol perturbations disentangled with a causal approach. npj Clim. Atmos. Sci. 2023, 6, 130. [Google Scholar] [CrossRef]
- Mülmenstädt, J.; Feingold, G. The Radiative Forcing of Aerosol-Cloud Interactions in Liquid Clouds: Wrestling and Embracing Uncertainty. Curr. Clim. Chang. Rep. 2018, 4, 23–40. [Google Scholar] [CrossRef]
- Wang, P.; Yang, Y.; Xue, D.; Ren, L.; Tang, J.; Leung, L.R.; Liao, H. Aerosols overtake greenhouse gases causing a warmer climate and more weather extremes toward carbon neutrality. Nat. Commun. 2023, 14, 7257. [Google Scholar] [CrossRef] [PubMed]
Figure 1.
Elevation (in m) of the region of interest (ROI) (a), annual mean aerosol index in the region of interest (b), the blue rectangular box and the orange rectangular box represent the SCB and the YGP, respectively.
Figure 1.
Elevation (in m) of the region of interest (ROI) (a), annual mean aerosol index in the region of interest (b), the blue rectangular box and the orange rectangular box represent the SCB and the YGP, respectively.

Figure 2.
The distribution pattern of annual mean monthly precipitation (a), annual mean monthly LWP (b), annual mean monthly IWP (c), and annual mean monthly PE (d) in ROI from 1998 to 2015.
Figure 2.
The distribution pattern of annual mean monthly precipitation (a), annual mean monthly LWP (b), annual mean monthly IWP (c), and annual mean monthly PE (d) in ROI from 1998 to 2015.

Figure 3.
The monthly mean precipitation (a), monthly mean LWP (b), monthly mean IWP (c), and monthly mean PE (d) in the SCB and YGP from 1998 to 2015.
Figure 3.
The monthly mean precipitation (a), monthly mean LWP (b), monthly mean IWP (c), and monthly mean PE (d) in the SCB and YGP from 1998 to 2015.
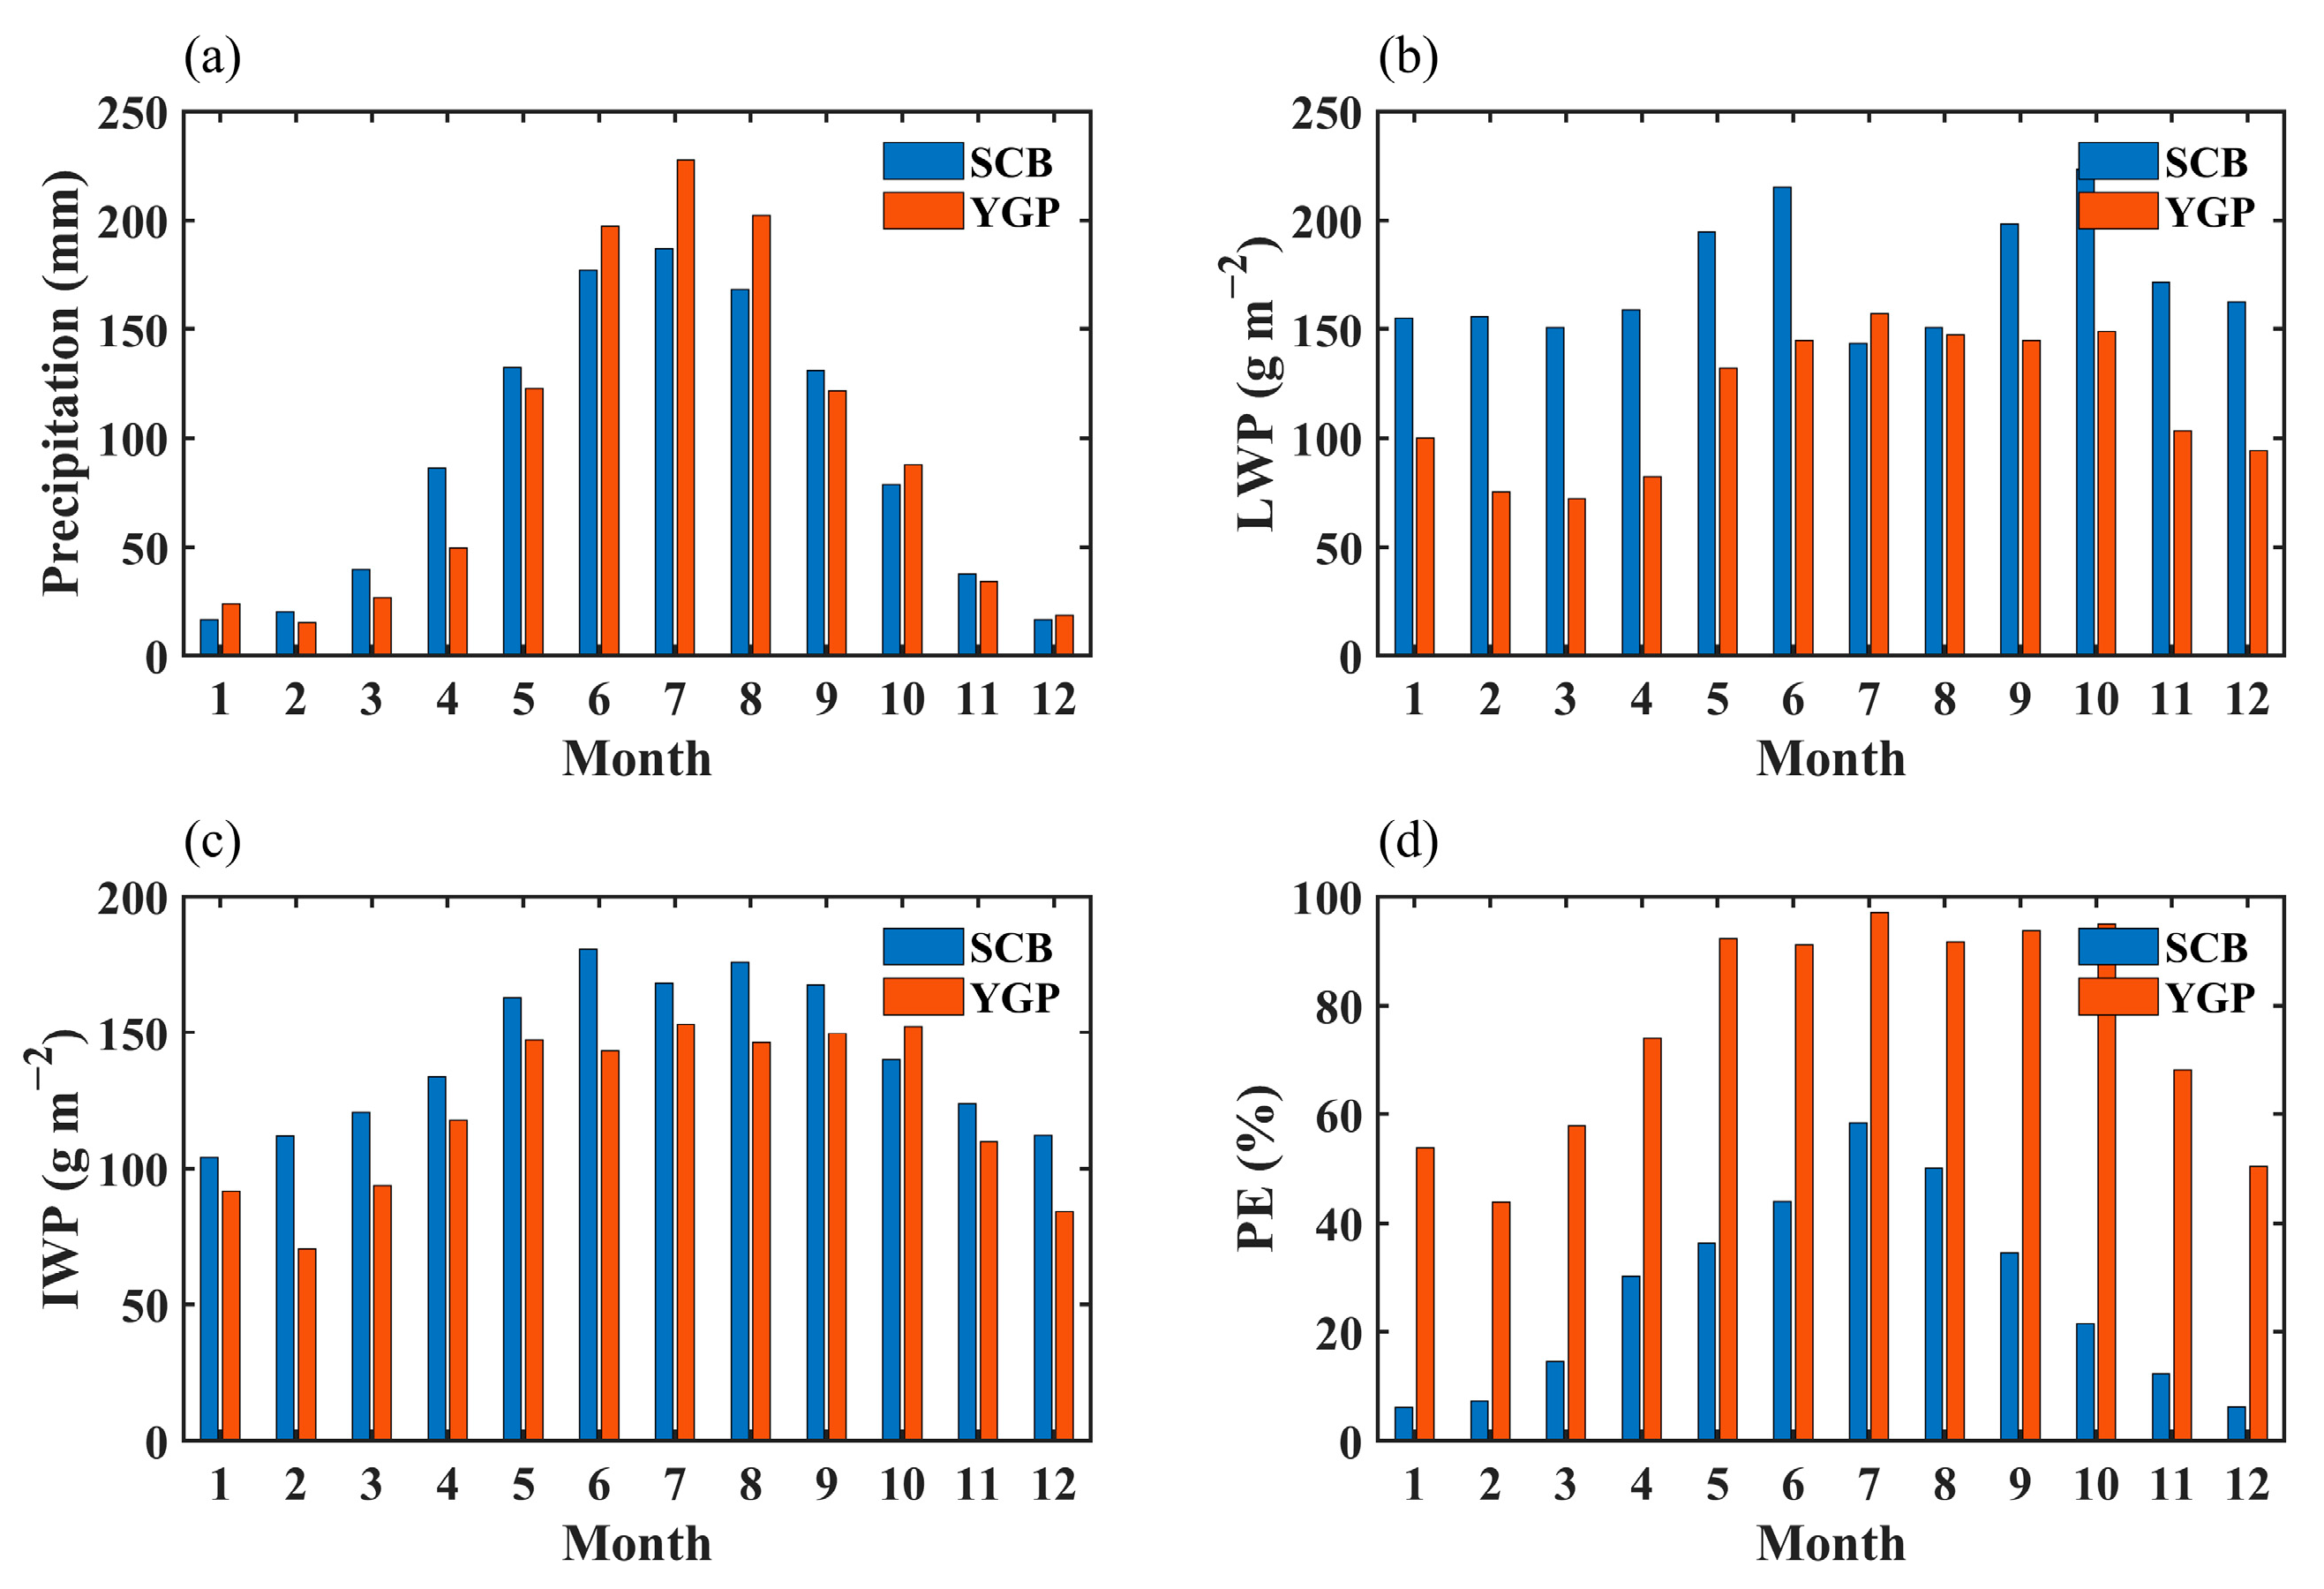
Figure 4.
Correlations between the LWP and precipitation in MAM (a), JJA (b), SON (c), and DJF (d) in the SCB and YGP. S = Slope, SE = Standard Error.
Figure 4.
Correlations between the LWP and precipitation in MAM (a), JJA (b), SON (c), and DJF (d) in the SCB and YGP. S = Slope, SE = Standard Error.
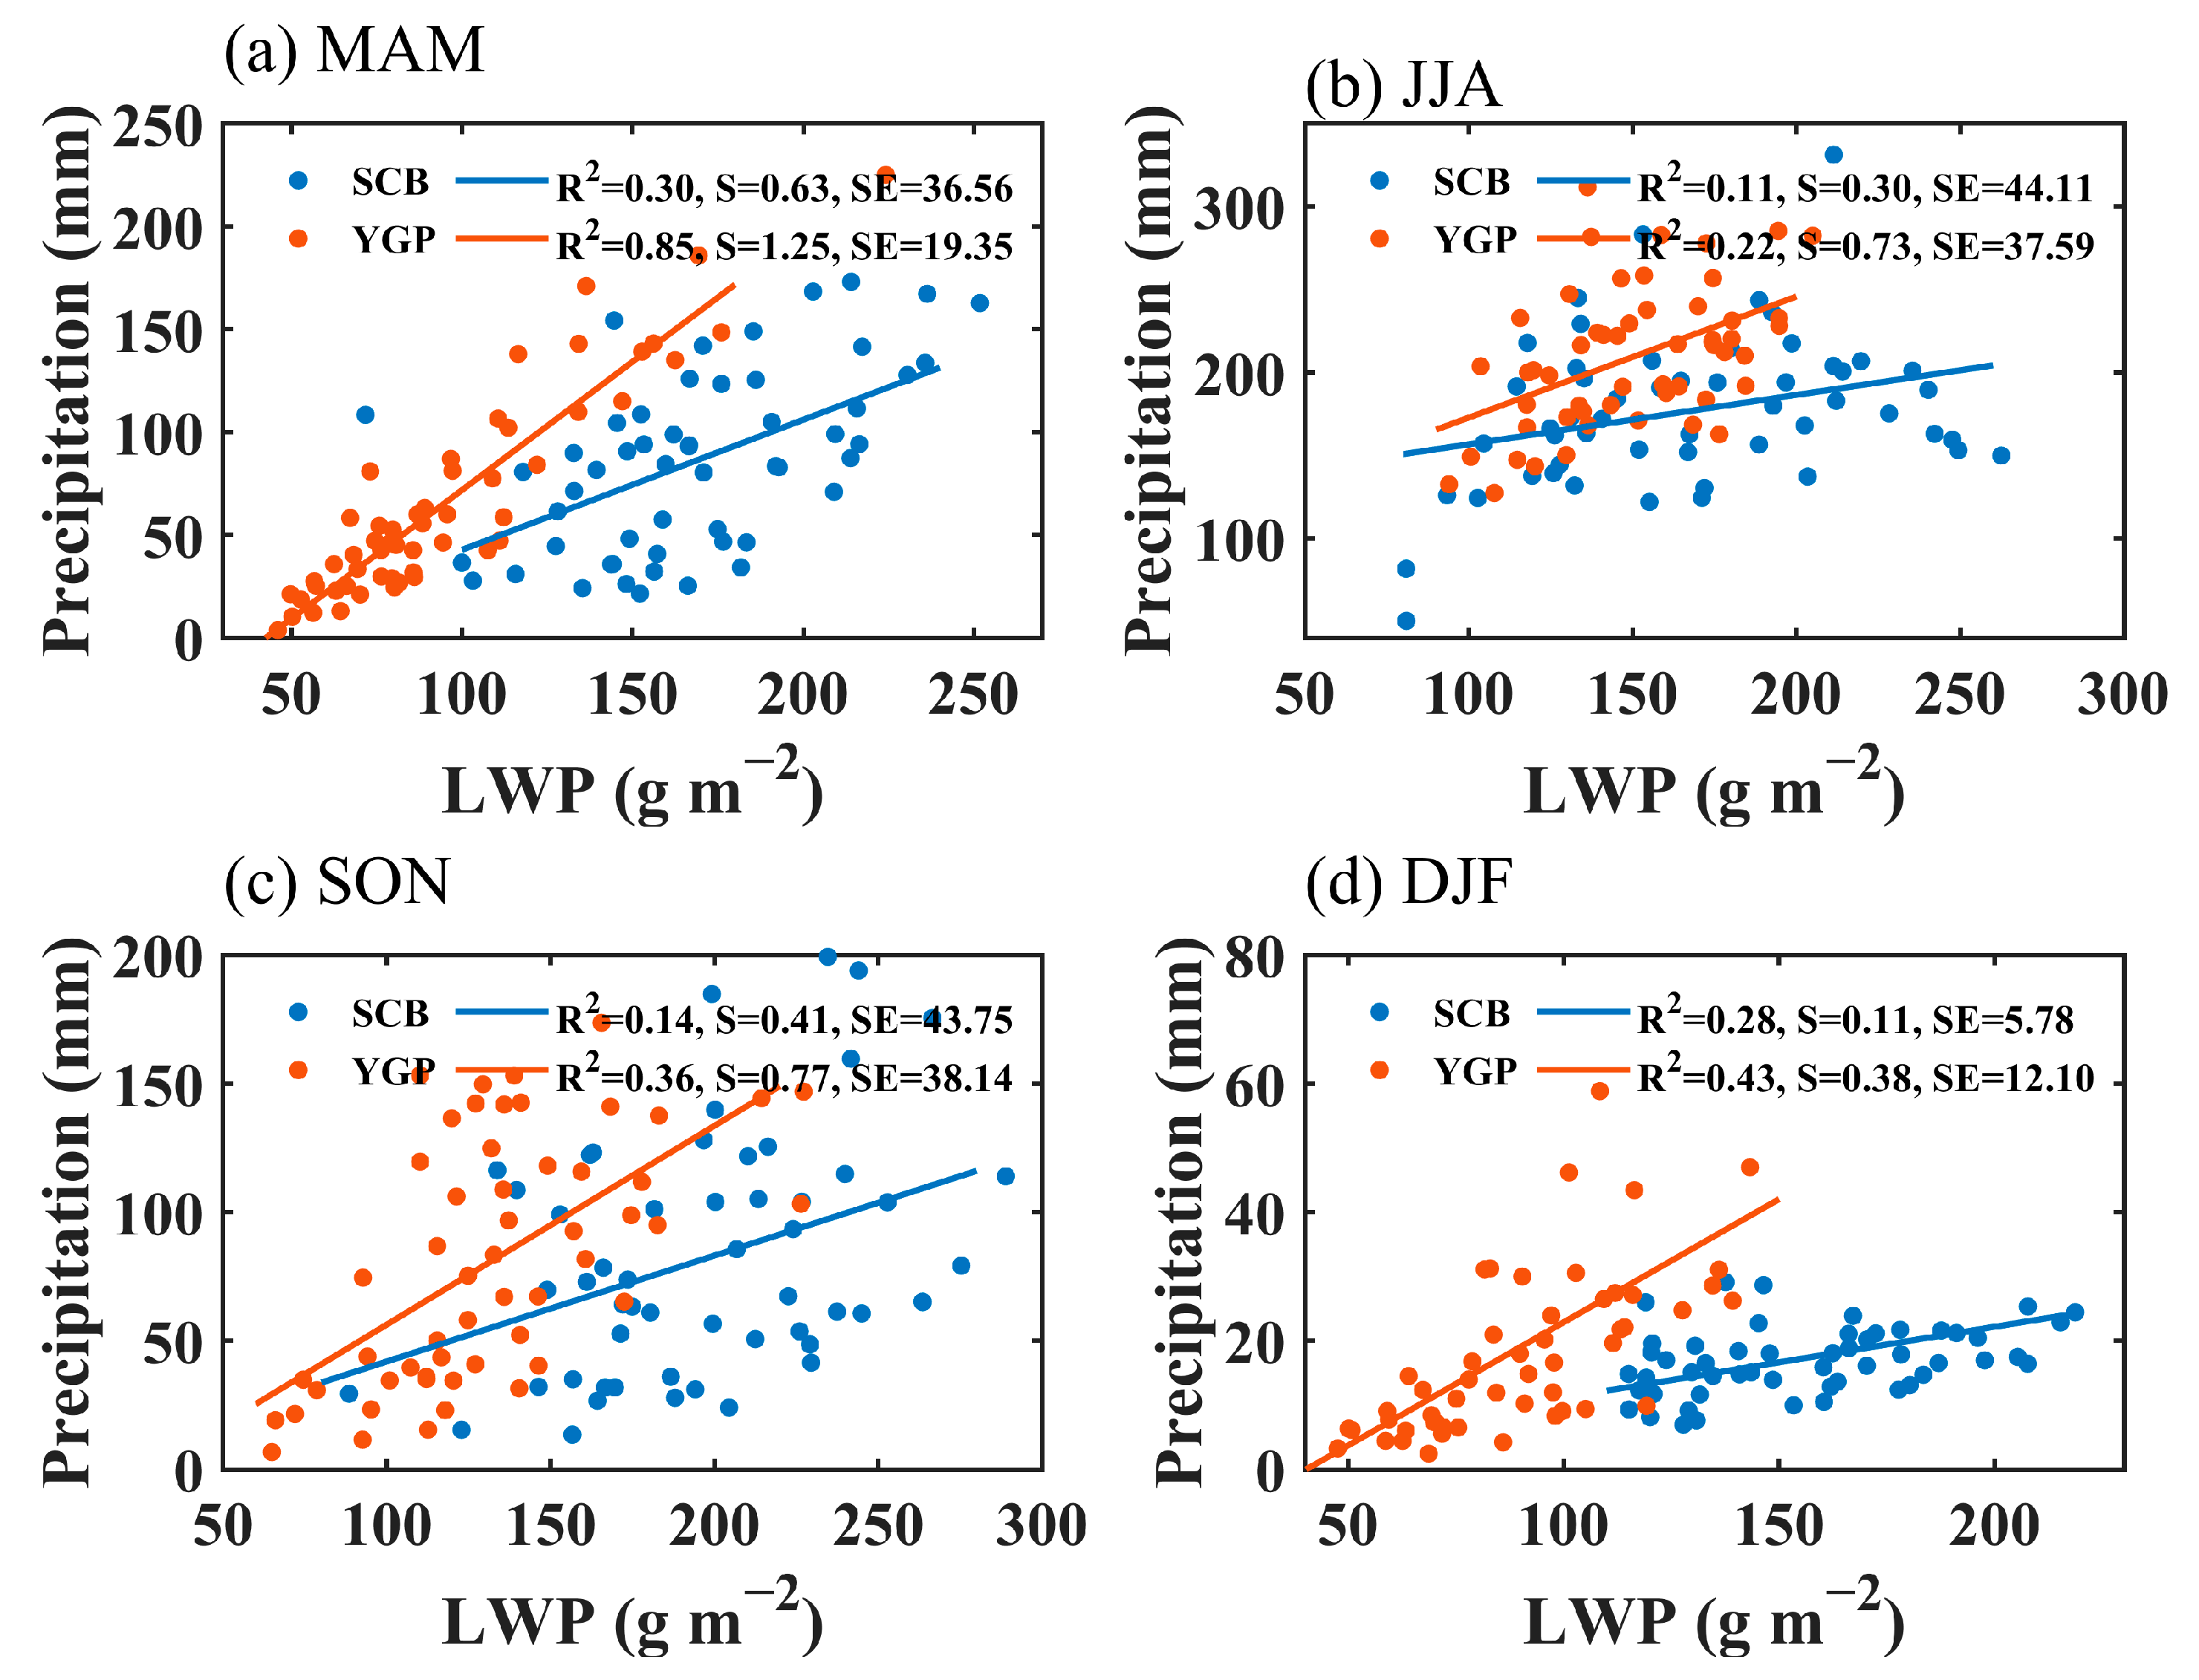
Figure 5.
Correlations between the IWP and precipitation in MAM (a), JJA (b), SON (c), and DJF (d) in the SCB and YGP. S = Slope, SE = Standard Error.
Figure 5.
Correlations between the IWP and precipitation in MAM (a), JJA (b), SON (c), and DJF (d) in the SCB and YGP. S = Slope, SE = Standard Error.
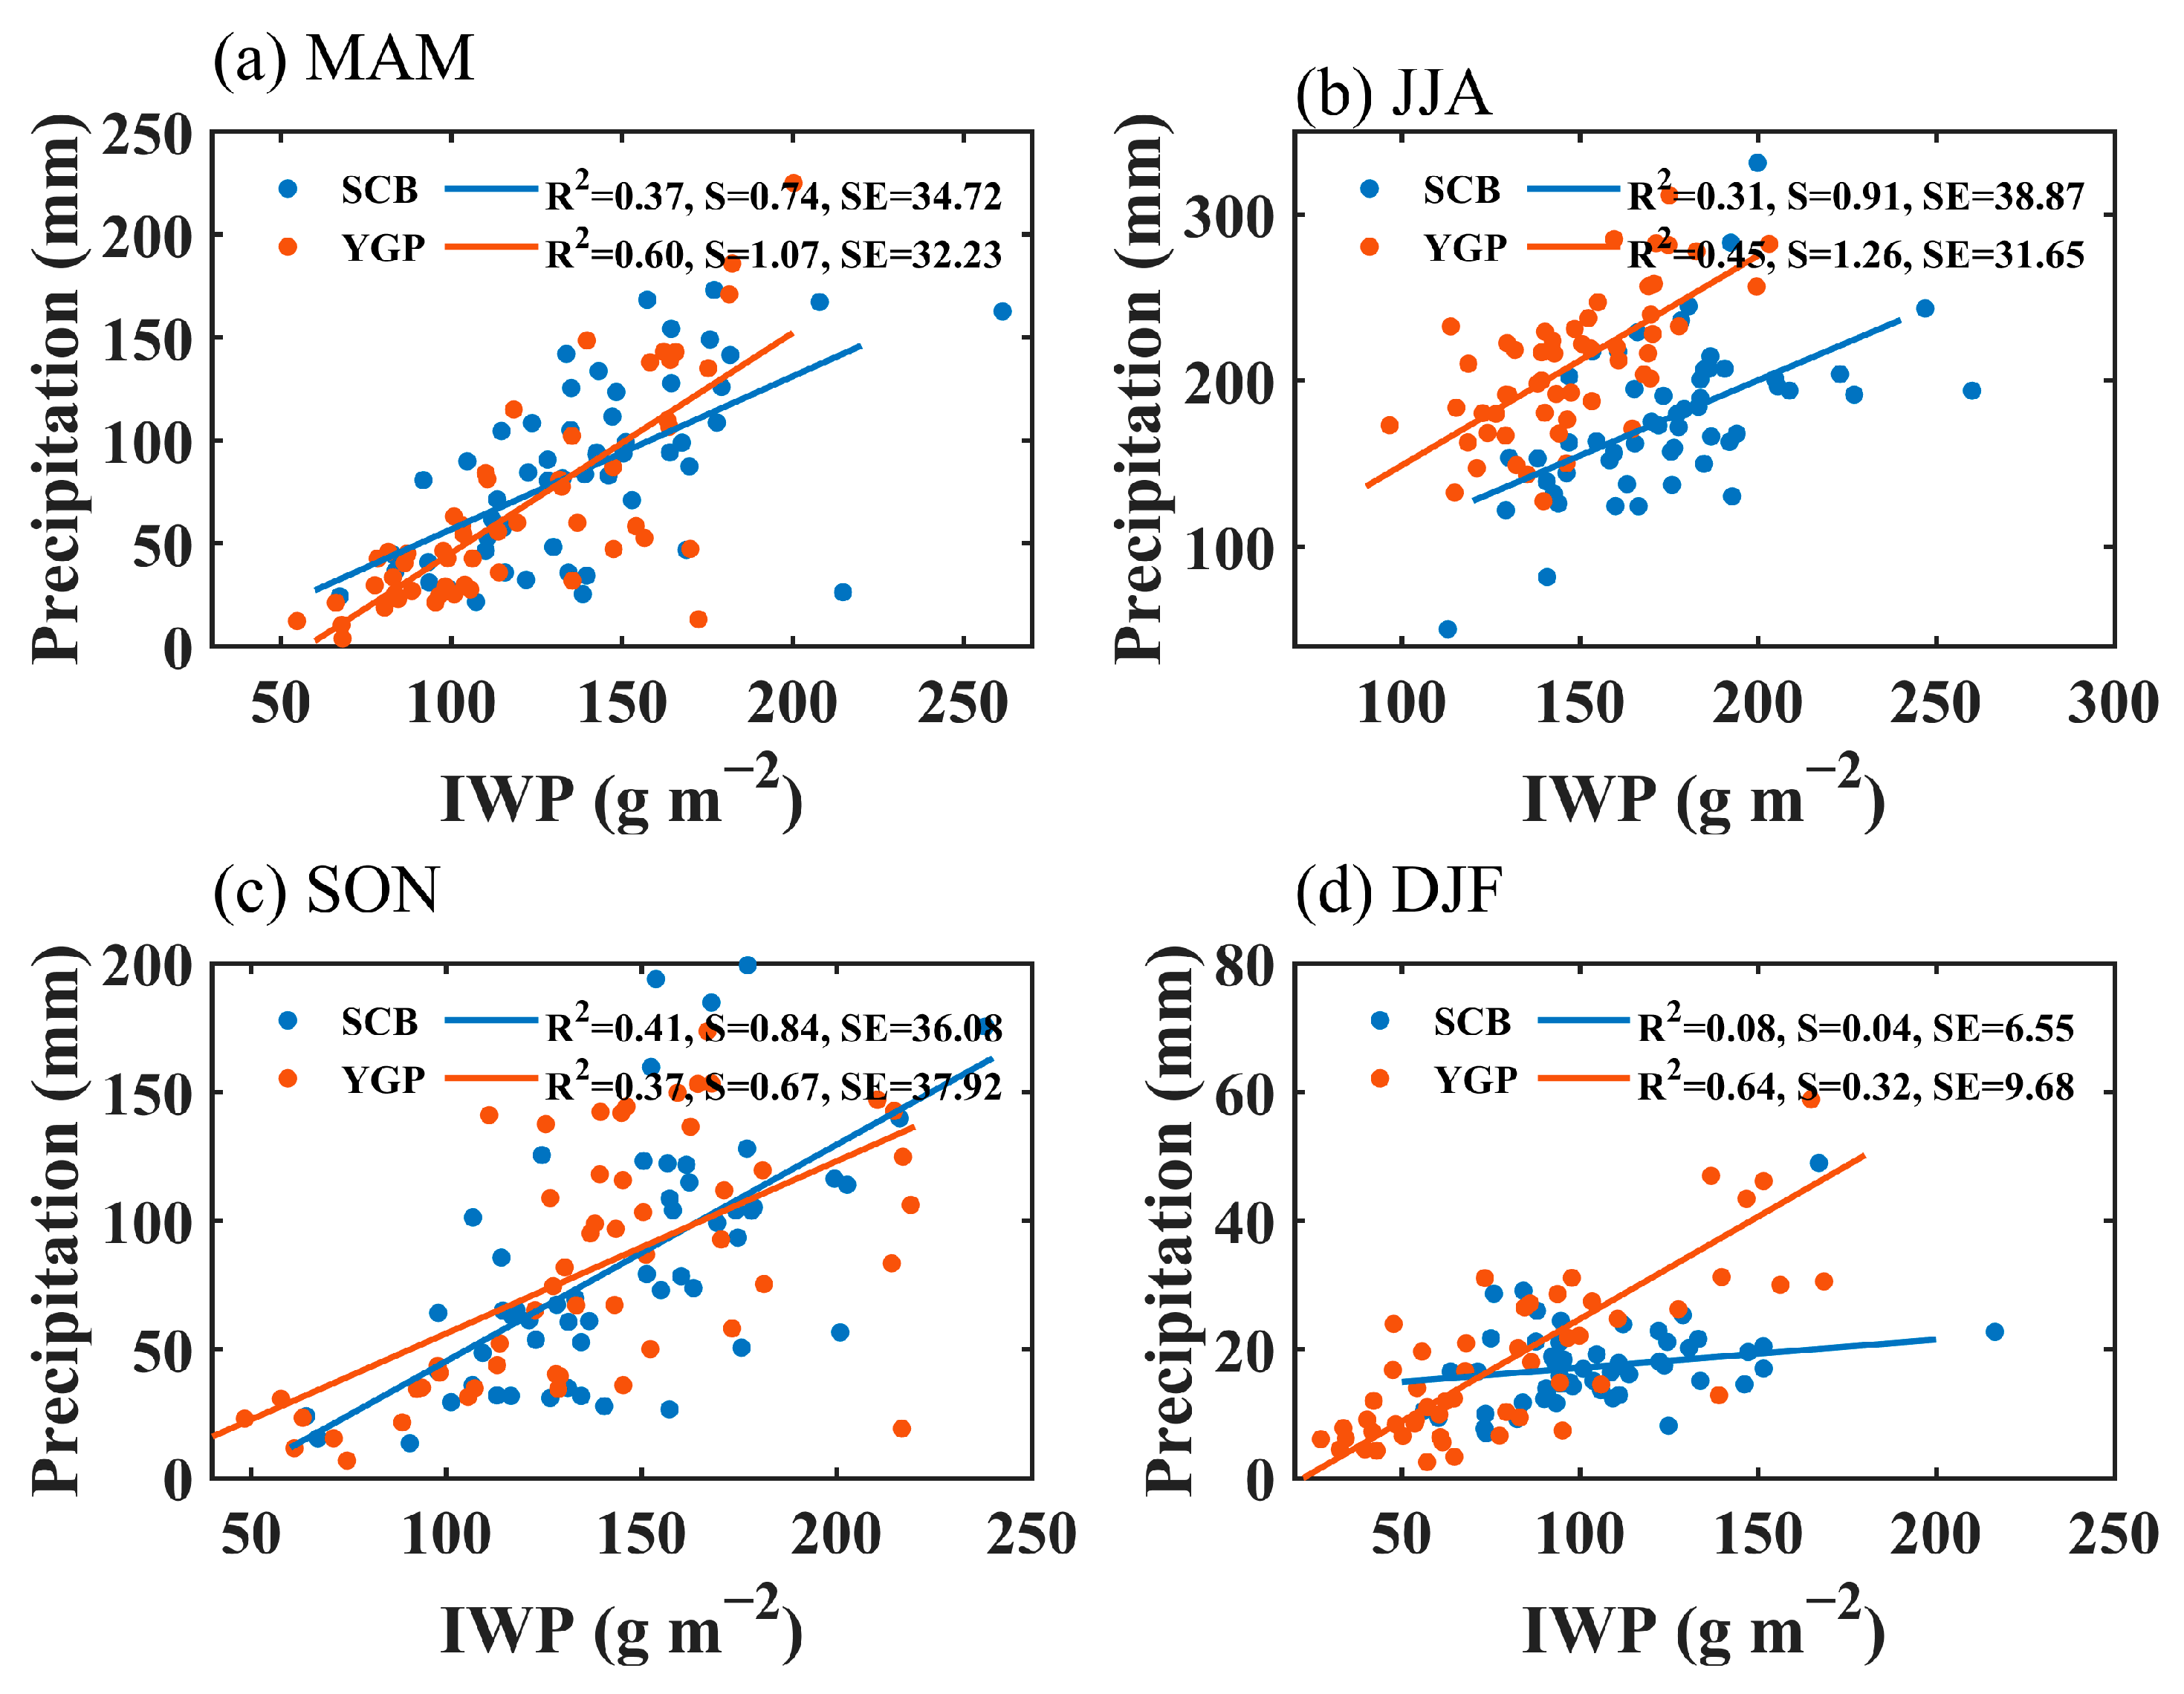
Figure 6.
Relationship between the AI and PE in MAM (a), JJA (b), SON (c), and DJF (d) in the two study regions. S = Slope, SE = Standard Error.
Figure 6.
Relationship between the AI and PE in MAM (a), JJA (b), SON (c), and DJF (d) in the two study regions. S = Slope, SE = Standard Error.

Figure 7.
Relationship between AI and the LWP (a), the AI and IWP (b), the AI and the CWP (c) in MAM in the SCB and YGP. S = Slope, SE = Standard Error.
Figure 7.
Relationship between AI and the LWP (a), the AI and IWP (b), the AI and the CWP (c) in MAM in the SCB and YGP. S = Slope, SE = Standard Error.

Figure 8.
Relationship between the AI and precipitation (a), the AI and LREF (b), the AI and IREF (c) in MAM in the SCB and YGP. S = Slope, SE = Standard Error.
Figure 8.
Relationship between the AI and precipitation (a), the AI and LREF (b), the AI and IREF (c) in MAM in the SCB and YGP. S = Slope, SE = Standard Error.
Figure 9.
Co-modulation of PE by the AI and meteorological conditions (CAPE and RH), the CAPE and the AI (a), the RH and the AI (b) in the SCB, and the CAPE and the AI (c), the RH and the AI (d) in the YGP, in spring.
Figure 9.
Co-modulation of PE by the AI and meteorological conditions (CAPE and RH), the CAPE and the AI (a), the RH and the AI (b) in the SCB, and the CAPE and the AI (c), the RH and the AI (d) in the YGP, in spring.
Disclaimer/Publisher’s Note: The statements, opinions and data contained in all publications are solely those of the individual author(s) and contributor(s) and not of MDPI and/or the editor(s). MDPI and/or the editor(s) disclaim responsibility for any injury to people or property resulting from any ideas, methods, instructions or products referred to in the content. |
© 2024 by the authors. Licensee MDPI, Basel, Switzerland. This article is an open access article distributed under the terms and conditions of the Creative Commons Attribution (CC BY) license (https://creativecommons.org/licenses/by/4.0/).
Share and Cite
MDPI and ACS Style
Zhao, P.; Liu, X.; Zhao, C. Potential Modulation of Aerosol on Precipitation Efficiency in Southwest China. Remote Sens. 2024, 16, 1445. https://doi.org/10.3390/rs16081445
AMA Style
Zhao P, Liu X, Zhao C. Potential Modulation of Aerosol on Precipitation Efficiency in Southwest China. Remote Sensing. 2024; 16(8):1445. https://doi.org/10.3390/rs16081445
Chicago/Turabian StyleZhao, Pengguo, Xiaoran Liu, and Chuanfeng Zhao. 2024. "Potential Modulation of Aerosol on Precipitation Efficiency in Southwest China" Remote Sensing 16, no. 8: 1445. https://doi.org/10.3390/rs16081445
Note that from the first issue of 2016, this journal uses article numbers instead of page numbers. See further details here.