
AIDER: Aircraft Icing Potential Area DEtection in Real-Time Using 3-Dimensional Radar and Atmospheric Variables

Weather Radar Center, Korea Meteorological Administration, Seoul 07062, Republic of Korea
*
Author to whom correspondence should be addressed.
Remote Sens. 2024, 16(8), 1468; https://doi.org/10.3390/rs16081468
Submission received: 11 March 2024
/
Revised: 18 April 2024
/
Accepted: 18 April 2024
/
Published: 21 April 2024
(This article belongs to the Special Issue Synergetic Remote Sensing of Clouds and Precipitation II)
Abstract
:Aircraft icing refers to the accumulation of ice on the surface and components of an aircraft when supercooled water droplets collide with the aircraft above freezing levels (at altitudes at which the temperature is below 0 °C), which requires vigilant monitoring to avert aviation accidents attributable to icing. In response to this imperative, the Weather Radar Center (WRC) of the Korea Meteorological Administration (KMA) has developed a real-time icing detection algorithm. We utilized 3D dual-polarimetric radar variables, 3D atmospheric variables, and aircraft icing data and statistically analyzed these variables within the icing areas determined by aircraft icing data from 2018–2022. An algorithm capable of detecting icing potential areas (icing potential) was formulated by applying these characteristics. Employing this detection algorithm enabled the classification of icing potential into three stages: precipitation, icing caution, and icing warning. The algorithm was validated, demonstrating a notable performance with a probability of detection value of 0.88. The algorithm was applied to three distinct icing cases under varying environmental conditions—frontal, stratiform, and cumuliform clouds—thereby offering real-time observable icing potential across the entire Korean Peninsula.
1. Introduction
Aircraft icing occurs when supercooled water droplets (SWDs) and cloud particles collide with an aircraft at freezing temperatures during flight through clouds. Icing is broadly divided into three types: induction system icing, instrument icing, and structural icing. The induction system and instrument icing are induced by engineering and operational challenges. However, the critical icing risk arises from structural icing, which is predominantly caused by meteorological conditions; this type of icing cannot be overcome by clever aircraft engineering and instrument design. Structural icing manifests in three forms: clear, rime, and mixed. Clear ice is hard, heavy, and tenacious, and it is formed by large droplets in rain or cumuliform clouds. Conversely, rime ice develops from smaller droplets typical of stratified clouds or light drizzle. Mixed icing, featuring characteristics of both clear and rime ice, occurs when the droplet sizes vary or when the liquid droplets mix with snow or ice particles.
The accumulation of ice on aircraft wings and body frames increases its weight and drag while diminishing lift and thrust, which can lead to grave aviation accidents. Historically, icing has been a factor in numerous accidents, yet advancements in anti-icing and de-icing technologies coupled with improved weather monitoring have markedly reduced such incidents. Specifically, light aircraft lacking de-icing or anti-icing mechanisms are susceptible to icing-related accidents. Moreover, commercial aircraft equipped with de-icing devices are not immune to accidents if icing affects part of the aircraft devoid of de-icing systems. In conditions conducive to icing, it is imperative to perform anti-icing measures prior to takeoff. Alternatively, circumventing regions where there is a risk of ice formation is advisable to avert accidents. Consequently, meteorological investigations into atmospheric conditions prone to icing are critical for preventing severe aircraft accidents.
Numerous studies have attempted to diagnose and predict aircraft icing. During the 1940s and 1950s, the Federal Aviation Administration (FAA) acquired and analyzed extensive data on aircraft icing to identify the environmental conditions conducive to icing. Thereafter, the FAA established guidelines for flight operations under such conditions [1,2]. The FAA stated two prerequisites for structural icing: aircraft passage through rain or cloud droplets and a temperature of 0 °C or colder at the point of moisture contact with the aircraft. Schultz and Politovich [3] assessed pilot reports (PIREPs) against model outputs to evaluate icing potential, and they examined the correlations between atmospheric variables such as the temperature (T), relative humidity (RH), and vertical profiles prevalent under icing conditions. Subsequent enhancements in algorithms for icing potential assessment were made by Forbes et al. [4] and Thompson et al. [5], who considered four meteorological conditions alongside the vertical thermodynamic structure.
The concern over icing from supercooled large droplets (SLDs) escalated after an icing incident in 1994. On 31 October 1994, ATR-72 Flight 4184 engaged in prolonged operation beyond the aircraft’s certification range in a freezing drizzle environment (encounters with freezing droplets of rain and drizzle). Consequently, ice was accreted aft the de-icing boots and upstream of the ailerons. This incident prompted research on the icing environments caused by large droplets and a campaign to acquire SLDs data [6,7,8,9,10,11,12,13]. Cober et al. [8] executed 38 flights to measure icing environments, including SLDs, using liquid water content (LWC; 99.9th-percentile value: 0.7 g m−3) and droplet concentration to characterize the severe icing conditions observed. Hauf and Schroder [10] identified mixed-phase clouds containing large amounts of liquid water and simultaneous SLDs, along with embedded convection, as primary icing contributors. The type of icing that can be formed by SLDs (diameters ≥ 50 μm) is clear icing, which can occur in environments with freezing rain or drizzle. According to Ikeda et al. [14], freezing drizzle (diameters 50–500 μm) can be detected by a polarization radar and freezing rain (diameters ≥ 500 μm) with particle sizes larger than freezing drizzle can be detected through radar. Although SLDs cannot cover all freezing scenarios, it can be used to predict and prevent aviation risks caused by SLDs.
Advancements in icing detection technologies, especially those utilizing remote sensing equipment, facilitate real-time monitoring with exceptional spatiotemporal resolution. Satellite data can be used to estimate icing potential using parameters such as cloud-top temperature and visible cloud reflectance (albedo) by distinguishing between cloudy and cloudless areas, identifying cloud tops harboring SWDs, and monitoring supercooled cloud extent changes [15,16]. Sim et al. [17] introduced a machine-learning-based icing detection model utilizing geostationary satellite data, highlighting the advantages of satellite systems in high-altitude, wide-area monitoring despite their larger observational errors and lower temporal resolution compared to ground observations. Conversely, weather radar-based icing detection technology leverages dual polarimetric variables to enable real-time surveillance of precipitable clouds through detailed hydrometer classification, thereby proving invaluable for icing detection in low-altitude areas inaccessible to satellites.
Recent research endeavors have focused on the detection and prediction of aircraft icing through the use of diverse data sets, including observations based on remote sensing. Notable among these efforts are the current icing potential (CIP), the advanced diagnosis and warning systems for aircraft icing environments (ADWICE), and radar icing algorithms (RadIA) (Table 1). The CIP algorithms integrate observational data, including radar, satellite, lightning, surface observations, and pilot reports, with model outputs to assess the potential for icing and the presence of SLDs [18]. ADWICE, developed by Tafferner et al. [19], combines the local model (LM) of Deutscher Wetterdienst (DWD) [20], European radar network, surface weather reports (SYNOP), routine weather reports for aviation (METAR), and satellite, radar, and station meteorological observations to identify atmospheric conditions hazardous to aircraft icing and provide icing information [21]. RadIA is an initiative of the National Center for Atmospheric Research (NCAR) that amalgamates numerical models, radar, and satellite data for icing detection [22]. It employs radar, sounding data, and numerical models, detecting icing by discerning three distinct conditions within the radar volume: freezing drizzle, supercooled liquid, and mixed-phase detection. However, the effectiveness of SLDs detection diminishes at higher radar tilt angles due to the reliance on radar volume data and the processing of such data from individual radars with high-resolution polar coordinate volumes demands substantial computational resources. To address these challenges, radar volume data in polar coordinates from fifteen radars across the Korean Peninsula were converted into singular high-resolution three-dimensional (3D) radar data in cartesian coordinates to enhance the detection capabilities for icing, even in upper atmospheric layers.
Verification of these icing detection products typically involves icing data sourced from PIREPs or in situ observations during field campaigns [4,5,17,18,19,22]. A variety of field studies on aircraft icing environments have been conducted, especially on freezing drizzle or SLDs [8,11,23,24]. Serke et al. [22] assessed the RadIA against microphysical measurements obtained during field campaigns using a research aircraft. Bernstein et al. [18] and Tafferner et al. [19] verified their aircraft icing findings using PIREP data.
Although the United States and Europe leverage diverse data sets for the diagnosis and prediction of aircraft icing, research in this domain within Korea has been comparatively limited. Lee and Kim [25] conducted analyses using several icing indices and icing forecast information derived from a numerical forecasting model (KAF-MM5), comparing these with PIREP data acquired by the Republic of Korea Air Force. Kim et al. [26,27] developed an icing index from the results of a regional forecast model (KMA weather research and forecast model; KWRF) and compared it with PIREP data to identify a suitable icing index.
However, no icing information is calculated in response to changes in the real-time atmospheric environment and, in particular, there is no high-resolution icing information that reflects the local conditions in real-time. Meanwhile, radar observes the Korean Peninsula in real-time and provides detailed changes in the atmospheric environment. However, no currently available technology can detect icing potential areas (icing potential) within the Korean Peninsula (air space) using radar data. Nevertheless, icing research using radar data can provide icing occurrence areas according to real-time changing atmospheric environments with very high spatiotemporal resolution.
In the present study, we introduce a real-time detection algorithm for icing potential, employing radar variables from high-resolution 3D radar data, atmospheric variables from model data, and aircraft observations. Radar variables from polarimetric weather radar can detect hydrometeors (e.g., ice or water droplets) and discriminate them within precipitable clouds. We utilize radar variables (reflectivity (ZH), differential reflectivity (ZDR), and hydrometeor classification (HC)) in icing research [18,19,22]. The other variables (T, RH, SLDs, and LWC) selected are based on prior research [28,29] identifying key factors influencing icing. From a meteorological perspective, aircraft icing is determined by the air temperature (<0 °C) and the number and size of water droplets. Mingione et al. [28] highlighted temperature, SLDs, and LWC as the crucial environmental factors affecting icing. Williams et al. [29] noted that cloud microphysics, particularly regarding the presence or absence of SLDs, could be ascertained through radar polarimetric variables. Aircraft-observed icing data reports are important indicators for finding the icing characteristics of radar variables and have been used for verification [19,22].
The methodology involving radar, model, and aircraft observations is detailed in Section 2. The statistical analysis and characteristics of the radar and atmospheric variables in Korean icing environments are elaborated in Section 3. The development of the detection algorithm and its results and verification are outlined in Section 4 and Section 5. Furthermore, case studies employing the delineated icing potential are discussed in Section 6. Finally, the key findings are summarized in Section 7.
2. Data
To develop a detection algorithm for icing potential, three types of data were utilized: 3D radar, 3D atmospheric, and aircraft observation data. The Weather Radar Center (WRC) generates comprehensive 3D radar data of the country through a network of 15 S-band dual-polarimetric radars (Figure 1). The radars operated by the Korea Meteorological Administration (KMA), shown in yellow, boast an observation range of 240 km, whereas those managed by the Ministry of Environment (ME), displayed in green, have a range of approximately 150 km. The composite map for the 3D gridded radar data is illustrated in Table 2, presenting a high resolution of 0.5 km horizontally and 50–200 m vertically and a temporal resolution of every 5 min. The radar variables employed include ZH, ZDR, HC, and LWC, which was derived from ZH (expressed as ZH [dBZ] = 10logZ) using Equation (1) provided by Greene and Clark [30]:
The 3D atmospheric data were produced through 3D objective analysis, incorporating diverse observational data (e.g., AWS and aerological observations) and analysis data from a numerical model. This 3D objective analysis yielded gridded T and RH at 5 min intervals, with a horizontal resolution of 4 km and a variable vertical resolution between 100 and 500 m (Table 3). The analysis data from the Korea local analysis and prediction system (KLAPS) numerical model were used to fill any empty grids lacking observational data. The KLAPS is a numerical forecasting system used to predict weather on the Korean Peninsula and it is mainly used for 3D analysis and the prediction of local-scale phenomena [31,32]. Choi et al. [33] and Jang et al. [34] stated that using KLAPS data is advantageous in improving the accuracy of meteorological phenomena.
Aircraft reports (AIREPs) and data from research aircraft were leveraged to analyze the radar and atmospheric variable characteristics within icing areas and to validate the detection algorithm. To ensure a comprehensive analysis and verification of icing characteristics across different environments, cases were selected based on a variety of factors including season, observation altitude, meteorological environment (e.g., cumuliform clouds, stratiform clouds, fronts, and typhoons), and regions encompassing the Korean Peninsula and adjacent sea or mountainous areas. Eighteen icing analysis cases (spring: five, summer: two, autumn: seven, winter: four) and ten icing verification cases (spring: four, summer: two, autumn: two, winter: two) were selected from the period of 2018 to 2022.
The AIREPs—issued by the Aviation Meteorological Office of the KMA—conform to the protocols established by the International Civil Aviation Convention. AIREPs report meteorological observations, such as temperature, wind direction, wind speed, turbulence, and icing, in specified formats upon encountering special weather conditions or upon request from the aviation meteorological department. In this study, AIREP data categorizing icing intensity as “light” were utilized.
Research aircraft data from the KMA/NIMS (National Institute of Meteorological Sciences) Atmospheric Research Aircraft (NARA) has been dedicated to missions focused on severe weather, environmental and climate monitoring, cloud physics, and weather modification experiments since 2018 [35].
The icing information was gathered using ice detectors on NARA, with additional data on location (latitude, longitude, and altitude) acquired from meteorological instruments (AIMMS-20) and a GPS. Figure 2 displays images of NARA and its ice detector. The ice detector operates at an initial frequency range of 39,999–40,000 Hz, which decreases upon ice formation [36,37]. A threshold frequency range (set at 38,970–39,900 Hz) triggers a heater to melt the accumulated ice, restoring the frequency to its initial value. Icing areas were identified where frequency fluctuations occurred within these thresholds, with the additional criterion of a precipitation echo (ZH > −10 dBZ) for correlating icing with radar observations. Since icing intensity information is not calculated from the icing detector attached to the research aircraft, the icing intensity of the identified icing areas could not be accurately known, unlike AIREP.
3. Characteristics of Radar and Atmospheric Variables in Icing Environments
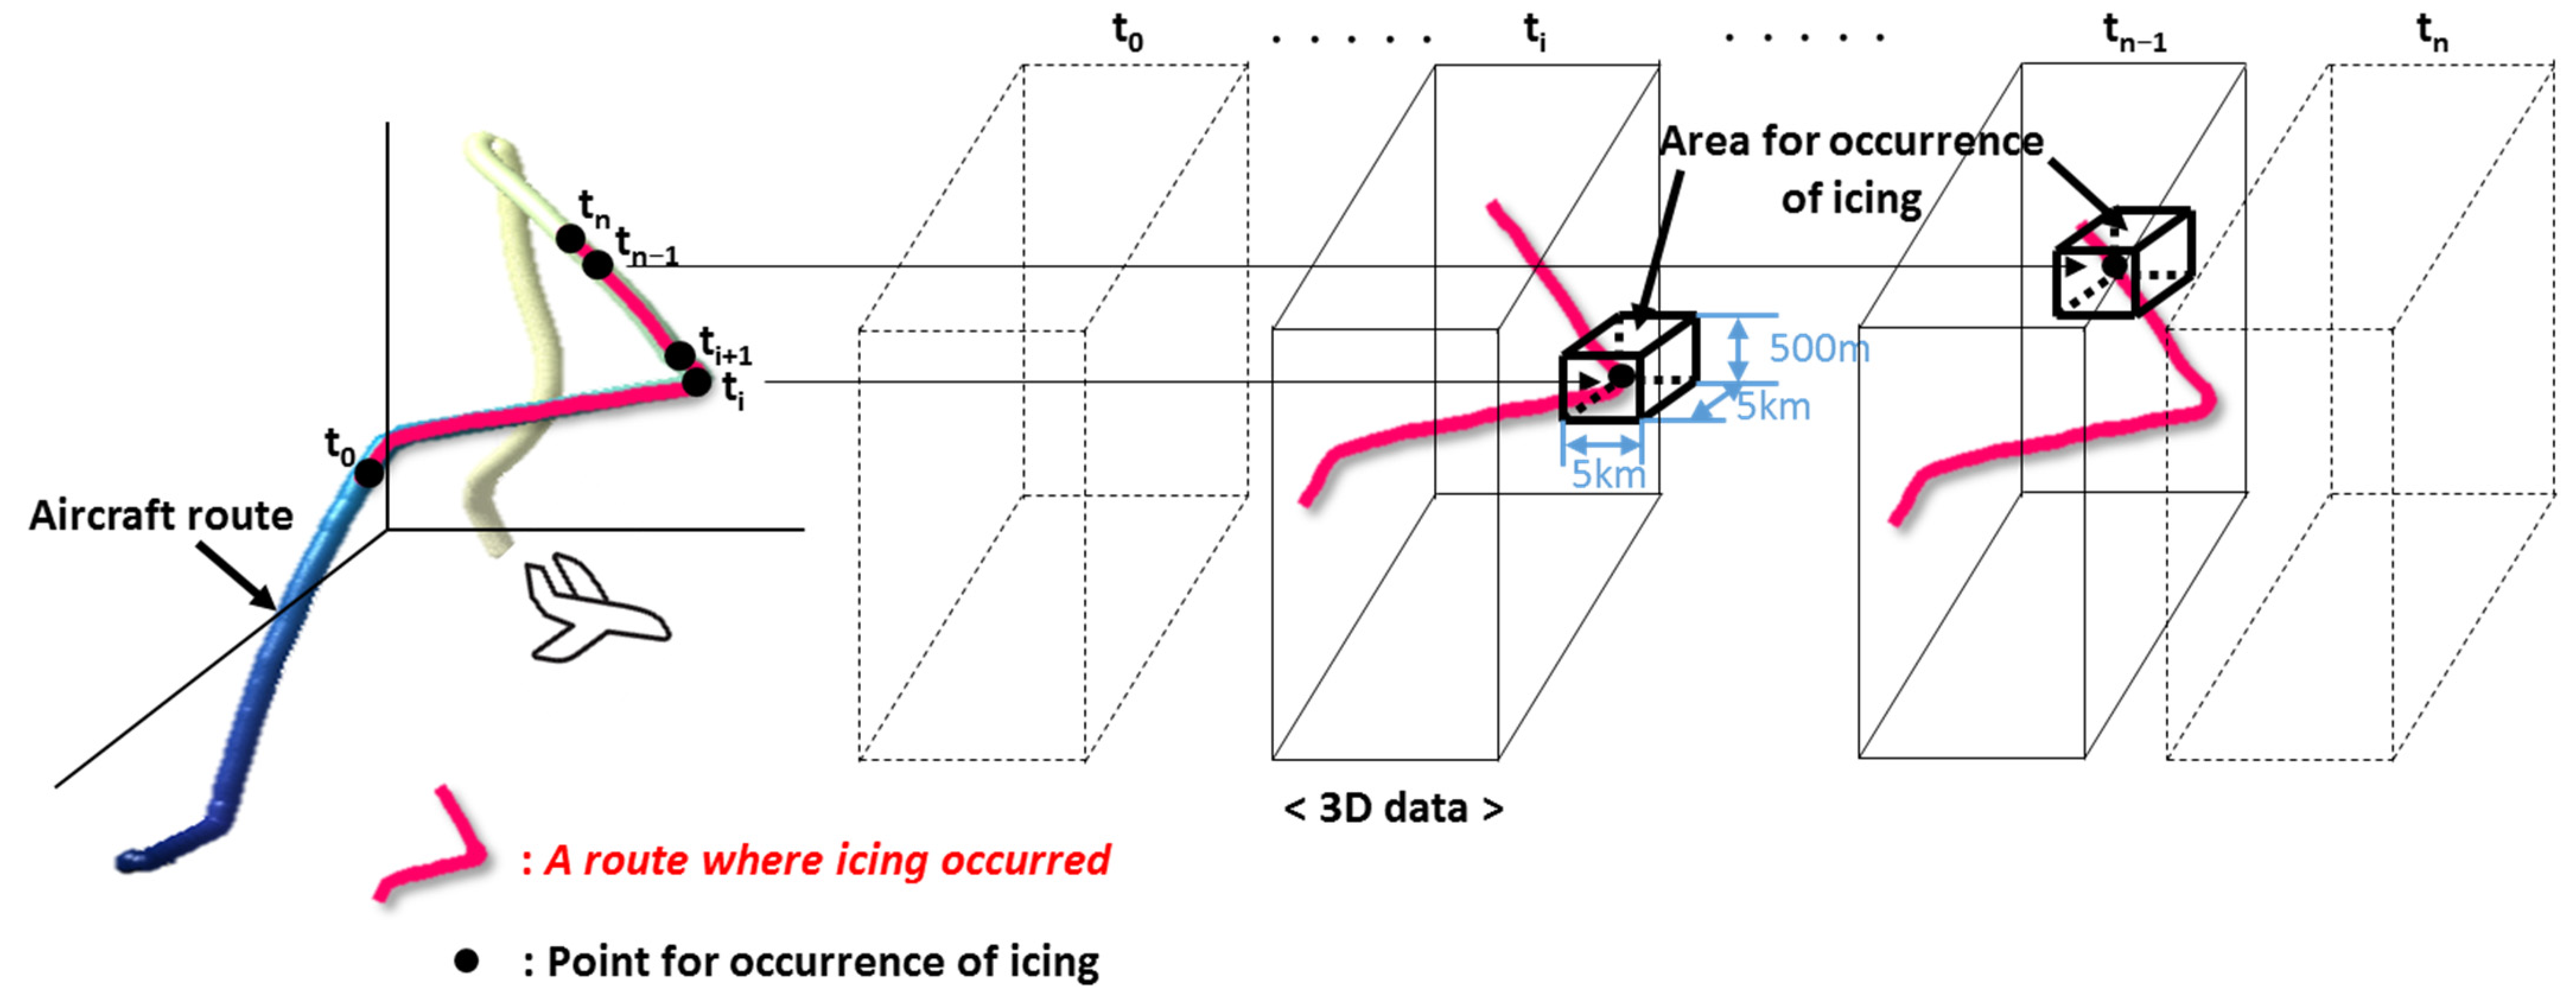
To develop an icing detection algorithm, a statistical analysis was performed for the 3D gridded data on ZH, ZDR, HC, LWC, T, and RH within identified icing areas. Figure 3 illustrates a conceptual diagram aligning the time and location of 3D gridded data with aircraft observations. The trajectory of an aircraft is marked by a transition from blue to yellow, with icing areas highlighted in red and black dots denoting icing detection points. The initiation and conclusion of icing observations are marked as t0 and tn, respectively. The nearest point in time, latitude, longitude, and altitude to an icing detection point was located within a specified volume (5 km × 5 km × 500 m) of the 3D gridded data. The statistical metrics (mean, standard deviation, and probability density function) for each radar and atmospheric variable were evaluated to establish the criteria for identifying icing potential.
Statistical analysis was conducted on radar and atmospheric variables within icing areas, examining the probability density functions (PDFs) of ZH, ZDR, T, and RH, as depicted in Figure 4. The distribution of ZH predominantly ranged between −1.7 dBZ and 28.1 dBZ, with a mean of 13.2 dBZ and a standard deviation of 7.5 dBZ. The ZDR values were principally distributed between −0.6 dB and 2.2 dB, averaging 0.8 dB with a standard deviation of 0.7 dB. The T values were primarily between −19.7 °C and 3.0 °C, while the RH values exceeded 69.4%.
The most probable ranges for each variable were established as the criteria for identifying icing potential (Table 4). For ZH and ZDR, the conditions were set as −2 dBZ < ZH < 28 dBZ and −0.6 dB < ZDR < 2.2 dB, respectively. Previous studies, such as the study by Williams et al. [29], defined the conditions for ZH and ZDR as 10 dBZ < ZH < 30 dBZ and 0 dB < ZDR < 3 dB, respectively. The criteria included lower ZH values (−2 dBZ < ZH < 10 dBZ) that were likely caused by smaller and nearly spherical hydrometeors.
The T and RH conditions were determined as −20 °C ≤ T ≤ 0 °C and RH ≥ 70%, respectively. Schultz and Politovich [3] identified that 87% of icing data fell within the range of −20 °C ≤ T ≤ 0 °C, a finding echoed by Ellis et al. [38], who noted that SLDs typically occur within the same temperature range. Wang et al. [39] and Bernstein et al. [40] observed that approximately 75% of aircraft icing cases occurred with an RH exceeding 70%, aligning with the established T and RH criteria.
Furthermore, the HC is composed of ice crystals, snow, graupel/rain, and drizzle without any distinct characteristics for specific icing-related hydrometeors. Focus was placed on SWDs and graupel as primary icing agents [41,42]. We specifically analyzed two hydrometeor types: SWDs and graupel/rain. LWC conditions, as outlined by Vukits [43], range from 0.04 to 2.9 g m−3. Jeck [44] reported that trace icing, which is the mildest intensity of icing, poses no significant risk in the absence of deicing/anti-icing equipment, provided it does not persist for more than 1 h. Therefore, we established an LWC criterion from 0.1 to 2.9 g m−3, omitting the range of LWC corresponding to trace icing.
4. Algorithm for Detecting of Icing Potential
The icing potential was determined based on the number of variables that satisfied the decision conditions. The comprehensive detection algorithm for icing potential, depicted in Figure 5, utilized both 3D radar variables (ZH, ZDR, HC, and LWC) and atmospheric variables (T and RH). This algorithm involved three stages. First, ZH indicated the presence or absence of precipitation and was segregated into precipitation and non-precipitation areas. Subsequently, if the specific criteria for T and RH were satisfied, the environment was classified as conducive to icing, proceeding to the next stage. Failure to meet either condition resulted in classification as a precipitation area. In the final stage, radar variables (ZH, ZDR, HC, and LWC) were evaluated within precipitation areas. An area was identified as having icing potential if two or more conditions were satisfied; otherwise, it was deemed a precipitation area. Ultimately, the icing potential was categorized into “icing caution” and “icing warning” based on the quantity of the fulfilled conditions, thereby classifying icing potential into two distinct categories (Table 5).
5. Results and Verification
For verification, ten cases detected on NARA from 2018 to 2022 were analyzed. The 3D icing potential (either caution or warning) was compared against the nearest icing detection points in time, latitude, longitude, and altitude as indicated by the icing detector signal (Figure 3).
Evaluation metrics, including hit (H), miss (M), false alarm (F), and correct rejection (C), were defined based on a contingency table (Table 6). A detected icing potential coinciding with an aircraft-observed icing point was classified as a hit, whereas its absence was deemed a miss. Conversely, an icing point not observed as icing potential by the aircraft was labeled as false (correct rejection). This verification method is similar to that of the other algorithms mentioned in the introduction (CIP, ADWICE, and RadIA).
Figure 6 illustrates the distribution of hits and misses across ten cases, along with the altitude distribution of these points. In total, 62 hit points (blue squares) and 8 miss points (red crosses) were recorded, yielding a probability of detection (POD) of 0.88 and a false alarm ratio (FAR) of 0.51. In analyzing cases where misses appeared, icing was not detected because the humidity conditions were not met. Hence, additional research on icing occurring at sea is warranted. The detection algorithm demonstrated superior performance within icing areas below an altitude of 4 km, with the highest number of false alarms occurring in light precipitation conditions of less than 0.5 mm h−1 between altitudes of 3 and 4.5 km.
6. Case Studies
6.1. Icing Associated with Low Pressure and Fronts
Approximately 85% of icing incidents occur near frontal systems [45], with the broadest horizontal extent of icing associated with warm fronts and the most severe icing linked to cold fronts. In the first case, a robust high-pressure system was located in the south of the Korean Peninsula. Warm and moist air from lower latitudes continued to flow into the peninsula and encountered the hot and dry air aloft, leading to the development of a low pressure that traversed the Korean Peninsula along the periphery of the high pressure. Cyclonic circulation in the West Sea induced an influx of water vapor into the Korean Peninsula, sustaining a strong radar echo over the southern sea and transporting moisture to the northern trough. Precipitation ensued from cloud formation due to convergence ahead of a thermal trough. On 13 March 2022, at 1325 KST, an aircraft icing detector identified icing conditions attributed to the cooling of SWDs below the freezing level amidst the unstable atmospheric conditions caused by active convection activity ahead of the fronts.
The icing area (red box) observed by the NARA aircraft is depicted in Figure 7, exhibiting conditions conducive to icing, such as a ZH below 28 dBZ, a ZDR below 1.5 dB, and an LWC below 0.27 g m−3. This region comprised ice crystals (regular ice crystals: yellow, irregular ice crystals: dark yellow) and snow (dry snow: pink, wet snow: cyan), as indicated by the HC.
Following the identification of icing potential, the outcomes were depicted in two-dimensional data as illustrated in Figure 7g, representing the most critical values per 3D gridded column in a bidimensional manner for swift and intuitive risk area monitoring.
Additionally, three-dimensional vertical distribution information pertinent to the proposed flight path was furnished, offering detailed insights into the vertical icing potential. The apex of the icing potential reached approximately 3.9 km (Figure 7h), with icing caution areas (light purple color), confined narrowly above the freezing layer (2.8 km) up to approximately 3.9 km in altitude (Figure 7i) within the ice crystal and wet snow sectors of the HC (Figure 7e). The icing warning areas (purple) were observed in limited areas within the wet snow regions, characterized by a ZH of 26 dBZ, a ZDR of 1 dB, and an LWC of 0.125 g m−3. Non-icing areas (holes) within the icing caution area of the thin layer were related to the exceptionally high ZDR and satisfied the atmospheric variables (T and RH). The area comprising irregular ice crystals (dark yellow) and wet snow (cyan) was shown in a low ZDR as an icing caution, while the area comprising regular ice crystals (yellow) was shown in a high ZDR as a non-icing caution [46,47].
6.2. Icing in Stratiform Clouds
The second case pertains to icing within stratiform clouds, where, as noted by Mingione et al. [28] and Vogel [48], such clouds typically consist of small water droplets, predisposing them to rime or mixed icing formations. Owing to their extensive horizontal spread, stratiform clouds heighten the icing risk for aircraft traversing them for prolonged periods. On 21 November 2018, icing was identified in the southeastern sector of a light precipitation system that was influenced by a trough approaching from the west of Korea, resulting in widespread cloudiness across the Korean Peninsula and the formation of stratiform clouds due to a convergence zone in the central region of the Korean Peninsula.
Figure 8a illustrates the icing area (red box) observed by the NARA aircraft, displaying radar variables indicative of icing conditions (ZH below 20 dBZ, ZDR below 1.5 dB, and LWC below 0.05 g m−3), with the area consisting of ice crystals and dry snow as per the HC. The algorithm identified broad icing potential (icing caution) extending from 1.2 to 7 km altitude (Figure 8g–i), with icing at 3 km altitude featuring irregular ice formations (blue dotted line in Figure 8e). In this case, when comparing the icing area (along transect A to B) and the surrounding area, the icing area was detected as a large region of icing caution and icing warnings were detected in some surrounding portions. The icing warning around the icing area shown in Figure 8g was detected as a very thin layer (about 200 m thickness) between altitudes of −10 °C and 0 °C and in the wet snow area and high relative humidity. The icing warning was detected because it was a wet snow area and primarily composed of supercooled water droplets; since the LWC was higher than the icing caution area, more riming occurred, increasing the potential for icing.
This scenario underscores the prolonged risk of icing across vast horizontal and vertical expanses, even within zones marked for icing caution. Mingione et al. [28] observed that ice in stratiform cloud mid-layers typically exhibits riming—a process where small SWDs instantaneously freeze upon contact, forming minute ice particles. Rime icing can distort the shape of the airfoil and diminish lift, increasing the risk of aircraft accidents.
6.3. Icing in Cumuliform Clouds
Rime or mixed icing freezes directly on the aircraft surfaces and commonly emerges in the upper strata of cumulus clouds. Conversely, the lower segments produce clear icing characterized by the gradual freezing of water droplets on the aircraft’s exterior. Clear icing, once firmly adhered, poses significant de-icing challenges. Cumuliform clouds, especially those with vigorous updrafts, can elevate SWDs to higher altitudes, potentially engendering severe icing across multiple layers [28,48,49].
The third icing case unfolded on 5 October 2018, as a continental high-pressure center shifted southward to central China, instigating warm air currents due to westerly winds. The northward migration of a typhoon induced cumuliform cloud formation ahead of its convergence zone.
In Figure 9a, the conditions within the icing area (red box) were characterized by a ZH below 28 dBZ, a ZDR below 1.5 dB, an LWC below 0.15 g m−3, and an HC comprising ice crystals (yellow), dry snow (pink), and wet snow (cyan). The delineation of icing potential is depicted in Figure 9g, with icing caution areas extensively identified from altitudes of 4 km (0 °C) to 8 km (−20 °C) and icing warning areas manifesting between 4 km and 5.5 km in the vertical cross section (Figure 9i). Given the occurrence of icing warnings within wet snow regions at temperatures ranging from −10 °C to 0 °C, clear icing was anticipated [50] (Figure 9e,i). In Figure 9i, icing warnings with a low ZH were detected as having a high probability of icing because the ZH, as well as other variables (ZDR, HC, LWC), met the threshold conditions of the algorithm. An icing caution with a high ZH does not meet the algorithm’s threshold; hence, the probability of icing is lower than that of an icing warning. The low and high icing probabilities do not equate to low and high icing intensity, respectively. Icing intensity is not discussed in this paper.
7. Conclusions
A radar-based detection algorithm for icing potential was developed through the analysis of 3D gridded radar and aircraft data, enabling the monitoring and issuance of real-time icing alerts. This process involved a statistical examination of radar (ZH, ZDR, HC, and LWC) and atmospheric (T and RH) variable characteristics within the identified icing areas to establish decision criteria for each variable. The specified icing area was determined by correlating the timing and positioning of the 3D grid with aircraft data (icing observations). The observed characteristics of each variable within the icing regions aligned with those reported in previous studies, although with minor variations.
T and RH, critical for identifying likely aircraft icing areas, were defined within the ranges of −20 °C ≤ T ≤ 0 °C and RH ≥ 70%. The specified ranges for ZH (−2 dBZ < ZH < 28 dBZ) and ZDR (−0.6 dB < ZDR < 2.2 dB) suggested the presence of small, nearly spherical water droplets. Icing potential was detected and categorized into three groups (precipitation, icing caution, and icing warning) based on the variables fulfilling the set conditions. Qualitative verification across ten cases from 2018 to 2022 yielded a POD of 0.88 and a FAR of 0.51, demonstrating the effectiveness of the icing detection algorithm. The basic design of our algorithm can be adopted by other meteorological services in different parts of the world. However, a procedure is needed to assess whether the threshold of radar and atmospheric variables are similar to the characteristics of the analysis region and make any necessary modifications.
The analysis of icing potential detection revealed variable patterns depending upon the type of precipitation system (front, stratiform, and cumuliform precipitation). In frontal regions, typically prone to most aircraft icing incidents, narrow icing potential was identified above the freezing level, with icing warnings emerging in areas of partially wet snow. For stratiform clouds, the icing potential (limited to icing caution) spanned horizontally and widely and wad predominantly due to ice crystals. In cumuliform clouds, icing potential (both caution and warning levels) was determined across a broad altitude spectrum, with clear icing warnings manifesting within certain wet snow regions. Typically, icing that occurs in stratiform clouds predominantly consists of small water droplets, while icing in convective clouds mainly consists of larger water droplets. The stratiform case exhibited a low ZH distribution, while the convective case showed a higher ZH distribution. There also appeared to be a higher LWC in convective clouds than in stratiform clouds. This is related to icing intensity, although this factor was not discussed in this study. According to the FAA [1], icing intensity is related to the LWC; the larger the LWC value, the stronger the icing intensity.
This study was limited by the lack of observations at high altitudes and the limited number of icing observation cases. The number of icing events observed on commercial aircraft was small and, for the cases that were observed, they were excluded from analysis if they were outside the radar observation. Additionally, due to COVID-19, flights were suspended for a period, contributing to the low numbers of icing cases. Moreover, the observations of the research aircraft were limited due to its inability to operate at high altitudes and avoid severe icing. Nevertheless, we attempted to ensure the reliability of this study by maximizing the use of data from −20 to 0 °C altitudes. Although our algorithm can provide accurate icing information for airplanes operating at low and mid altitudes, due to the lack of observations at high altitudes, the icing detection capability for higher altitudes is limited. We used limited radar data at high altitudes due to the observational range of ground-based radar and the beam broadening effect (Table 2).
Future research using other remote sensing observation data, such as satellites, will improve the application limitations of this study. The National Meteorological Satellite Center in Korea provides information on icing intensity, cloud temperature, and particle size and LWC in the cloud top. Hence, applying these variables with the current algorithm is predicted to improve the information regarding the upper atmosphere and reduce the false alarm rate [18,19]. The application of additional polarization variables, such as Φdp and ρhv [22], will also improve the outcomes. Positive KDP values are observed in melting snow or graupel and horizontally aligned ice crystals. ρHV values below 0.92 indicate the presence of solid particles coated with liquid water, tumbling solid particles, and mixed-phase conditions. Meanwhile, ρHV values above 0.95 are indicative of rain or ice. Incorporating the characteristics of these variables will improve our algorithm.
Ye and Kim [51] calculated a new Z–LWC relationship using aircraft observation data instead of the Z–LWC relationship based on ground observation data. The new Z–LWC relationship can better derive the LWC of icing in upper layers and contribute to improving our algorithm’s performance. Moreover, to prevent aircraft icing accidents, icing intensity must be provided with the icing potential. Ye and Kim [51] not only proposed a new Z–LWC relationship but also applied it to calculate the LWC from Z using and categorized icing intensity into Trace, Light, Moderate, Heavy, and Severe, according to FAA criteria [1].
This research is expected to significantly aid decision making in aviation operations by furnishing real-time data on icing potential across the entire Korean Peninsula that is accessible through radar observations. It is particularly expected to mitigate icing risks for low-altitude flights, such as those involving light aircraft and medical/firefighting helicopters, which are not equipped with icing removal devices.
8. Patents
Korean patent (Patent Number: 10-2465090) “Radar based aircraft icing area detection method, recording medium and apparatus for performing the same”.
Author Contributions
This work was supported by significant contributions from all authors. Conceptualization, Y.K., B.-Y.Y. and M.-K.S.; methodology, Y.K., B.-Y.Y. and M.-K.S.; software, Y.K.; formal analysis, Y.K.; investigation. Y.K., B.-Y.Y. and M.-K.S.; wrote the manuscript and prepared the original draft. Y.K. and B.-Y.Y.; writing, review, and editing, Y.K., B.-Y.Y. and M.-K.S.; visualization, Y.K.; supervision, Y.K.; funding acquisition, B.-Y.Y. All authors have read and agreed to the published version of the manuscript.
Funding
This research was supported by the “Development of Integrated Radar Analysis and Customized Radar Technology (KMA2021-03021)” of the “Development of Integrated Application Technology for Korea Weather Radar” Project funded by the Weather Radar Center, Korea Meteorological Administration and by the Korea Meteorological Administration Research and Development Program “Developing Application Technology using Atmospheric Research Aircraft” under Grants (KMA2018-00222).
Data Availability Statement
No new data were created or analyzed in this study. Data sharing is not applicable to this article.
Conflicts of Interest
The authors declare no conflicts of interest.
References
- Federal Aviation Administration (FAA). Part 25: Airworthiness Standards: Transport Category Airplanes: Appendix C. Title 14: Code of Federal Regulations; Office of the Federal Register, National Archives and Records Administration: Washington, DC, USA, 2009; Volume 74, pp. 38340–38341.
- Thompson, G.; Politovich, M.K.; Rasmussen, R.M. A numerical weather model’s ability to predict characteristics of aircraft icing environments. Weather Forecast. 2017, 32, 207–221. [Google Scholar] [CrossRef]
- Schultz, P.; Politovich, M.K. Toward the improvement of aircraft-icing forecasts for the continental United States. Weather Forecast. 1992, 7, 491–500. [Google Scholar] [CrossRef]
- Forbes, G.S.; Hu, Y.; Brown, B.G.; Bernstein, B.C.; Politovich, M.K. Examination of soundings in the proximity of pilot reports of aircraft icing during STORM-FEST. In Proceedings of the 5th International Conference on Aviation Weather Systems, Vienna, VA, USA, 2–6 August 1993; pp. 282–286. [Google Scholar]
- Thompson, G.; Bruintjes, R.T.; Brown, B.G.; Hage, F. Intercomparison of in-flight icing algorithms. Part I: WISP94 real-time icing prediction and evaluation program. Weather Forecast. 1997, 12, 878–889. [Google Scholar] [CrossRef]
- Cober, S.G.; Isaac, G.A.; Strapp, J.W. Aircraft icing measurements in East Coast winter storms. J. Appl. Meteorol. Climatol. 1995, 34, 88–100. [Google Scholar] [CrossRef]
- Cober, S.G.; Strapp, J.W.; Isaac, G.A. An example of supercooled drizzle droplets formed through a collision coalescence process. J. Appl. Meteorol. 1996, 35, 2250–2260. [Google Scholar] [CrossRef]
- Cober, S.G.; Strapp, J.W.; Isaac, G.A. Characterizations of aircraft icing environments that include supercooled large drops. J. Appl. Meteorol. 2001, 40, 1984–2002. [Google Scholar] [CrossRef]
- Cober, S.G.; Bernstein, B.; Jeck, R.; Hill, E.; Isaac, G.; Riley, J.; Shah, A. Data and Analysis for the Development of an Engineering Standard for Supercooled Large Drop Conditions. US Department of Transportation Final Report, DOT/FAA/AR-09/10. 2009, 77p. Available online: http://www.tc.faa.gov/its/worldpac/techrpt/ar0910.pdf (accessed on 1 March 2009).
- Hauf, T.; Schröder, F. Aircraft icing research flights in embedded convection. Meteorol. Atmos. Phys. 2006, 91, 247–265. [Google Scholar] [CrossRef]
- Cober, S.G.; Isaac, G.A. Characterization of aircraft icing environments with supercooled large drops for application to commercial aircraft certification. J. Clim. Appl. Meteorol. 2012, 51, 265–284. [Google Scholar] [CrossRef]
- Federal Aviation Administration. Parts 25 and 33: Airplane and Engine Certification Requirements in Supercooled Large Drop, Mixed Phase, and Ice Crystal Icing Conditions; Final Rule; Office of the Federal Register, National Archives and Records Administration: Washington, DC, USA, 2014; Volume 79, pp. 65508–65540. Available online: https://www.gpo.gov/fdsys/pkg/FR-2014-11-04/pdf/2014-25789.pdf (accessed on 4 November 2014).
- Augros, C.; Lecocq, M.; Riette, S.; Le Bot, C.; Gaussiat, N. Signatures of supercooled liquid water drops in dual-polarization observations measured by ground-based radars. In Proceedings of the WMO Aeronautical Meteorology Scientific Conference, Toulouse, France, 6–10 November 2017. [Google Scholar]
- Ikeda, K.; Rasmussen, R.M.; Brandes, E.; McDonough, F. Freezing drizzle detection with WSR-88D radars. J. Appl. Meterol. Climatol. 2009, 48, 41–60. [Google Scholar] [CrossRef]
- Rauber, R.; Tokay, A. An explanation for the existence of supercooled water at the top of cold clouds. J. Atmos. Sci. 1991, 48, 1005–1023. [Google Scholar] [CrossRef]
- Ellrod, G.P.; Bailey, A.A. Assessment of aircraft icing potential and maximum icing altitude from geostationary meteorological satellite data. Weather Forecast. 2007, 22, 160–174. [Google Scholar] [CrossRef]
- Sim, S.; Im, J.; Park, S.; Park, H.; Ahn, M.H.; Chan, P.W. Icing detection over East Asia from geostationary satellite data using machine learning approaches. Remote Sens. 2018, 10, 631. [Google Scholar] [CrossRef]
- Bernstein, B.C.; McDonough, F.; Politovich, M.K.; Brown, B.G.; Ratvasky, T.P.; Miller, D.R.; Wolff, C.A.; Cunning, G. Current icing potential: Algorithm description and comparison with aircraft observations. J. Appl. Meteorol. 2005, 44, 969–986. [Google Scholar] [CrossRef]
- Tafferner, A.; Hauf, T.; Leifeld, C.; Hafner, T.; Leykauf, H.; Voigt, U. ADWICE: Advanced diagnosis and warning system for aircraft icing environments. Weather Forecast. 2003, 18, 184–203. [Google Scholar] [CrossRef]
- Doms, G.; Schättler, U. The Nonhydrostatic Limited Area Model LM (Lokal Modell) of DWD. Part I: Scientific Documentation; LM_F90 1.35; Deutscher Wetterdienst: Offenbach, Germany, 1999; 172p. [Google Scholar]
- Kalinka, F.; Roloff, K.; Tendel, J.; Hauf, T. The In-flight icing warning system ADWICE for European airspace-Current structure, recent improvements and verification results. Meteorol. Z. 2017, 26, 441–455. [Google Scholar] [CrossRef]
- Serke, D.J.; Ellis, S.M.; Tessendorf, S.A.; Albo, D.E.; Hubbert, J.C.; Haggerty, J.A. Radar Icing Algorithm: Algorithm Description and Comparison with Aircraft Observations. J. Atmos. Ocean. Technol. 2022, 39, 91–109. [Google Scholar] [CrossRef]
- Isaac, G.A.; Cober, S.G.; Strapp, J.W.; Korolev, A.V.; Tremblay, A.; Marcotte, D.L. Recent Canadian research on aircraft in-flight icing. Can. Aeronaut. Space J. 2001, 47, 213–221. [Google Scholar]
- Stuart, R.A.; Isaac, G.A. Freezing precipitation in Canada. Atmos.-Ocean 1999, 37, 87–102. [Google Scholar] [CrossRef]
- Lee, S.-J.; Kim, Y.-C. A study on the occurrence and prediction of aircraft icing over South Korea. Asia-Pac. J. Atmos. Sci. 2005, 41, 615–624. [Google Scholar]
- Kim, Y.C. The Analysis of the characteristics of Korean peninsula Aircraft Icing Index using KWRF. J. Korean Soc. Aviat. Aeronaut. 2010, 18, 42–54. [Google Scholar]
- Kim, Y.C. A Verification of threshold of the Aircraft turbulence index and Icing Index Using PIREPs and KWRF on Korean Peninsula. J. Korean Soc. Aviat. Aeronaut. 2011, 19, 54–60. [Google Scholar] [CrossRef]
- Mingione, G.; Barocco, M.; Denti, E.; Bindi, F.G. Flight in Icing Conditions. Direction Générale de l′Aviation civile (DGAC) DGAC, Tech. Rep. 1997, pp. 188. Available online: https://www.ecologie.gouv.fr/sites/default/files/Icing_flight_manual.pdf (accessed on 17 April 2024).
- Williams, E.R.; Smalley, D.J.; Donovan, M.F.; Hallowell, R.G.; Hood, K.T.; Bennett, B.J.; Evaristo, R.; Stepanek, A.; Bals-Elsholz, T.M.; Cobb, J.; et al. Dual polarization radar winter storm studies supporting development of NEXRAD-based aviation hazard products. In Proceedings of the AMS 35th Conference on Radar Meteorology, Pittsburgh, PA, USA, 26–30 September 2011. [Google Scholar]
- Greene, D.R.; Clark, R.A. Vertically integrated liquid water—A new analysis tool. Mon. Weather Rev. 1972, 100, 548–552. [Google Scholar] [CrossRef]
- Kim, M.; Lee, K.; Lee, Y.H. Development of 10-minute interval analysis and prediction system in KMA. In Proceedings of the 22nd EGU General Assembly, Online, 4–8 May 2020. EGU2020-6451. [Google Scholar] [CrossRef]
- Shin, H.-C.; Ha, J.-H.; Ahn, K.D.; Lee, E.H.; Kim, C.H.; Lee, Y.H.; Clayton, A. An overview of KMA’s operational NWP data assimilation system. In Data Assimilation for Atmospheric, Oceanic and Hydrologic Applications; Springer: Cham, Switzerland, 2022; Volume IV. [Google Scholar]
- Choi, W.; Lee, J.G.; Kim, Y.-J. Sensitivities of WRF Simulations to the resolution of analysis data and to application of 3DVAR: A case study. Atmosphere 2012, 22, 387–400. [Google Scholar] [CrossRef]
- Jang, M.; You, C.H.; Jee, J.B.; Park, S.H.; Kim, S.I.; Choi, Y.J. Three-dimensional analysis of heavy rainfall using KLAPS re-analysis data. Atmosphere 2016, 26, 97–109. [Google Scholar] [CrossRef]
- Kim, J.-H.; Goo, T.-Y.; Jung, S.-P.; Kim, M.-S.; Lee, K.; Kang, M.; Lee, C.; Yang, J.; Hong, S.; Ko, H.; et al. Overview of the KMA/NIMS Atmospheric Research Aircraft (NARA) and its data archive: Annual airborne observations over the Korean peninsula. Geosci. Data J. 2022, 10, 447–460. [Google Scholar] [CrossRef]
- Baumgardner, D.; Rodi, A. Laboratory and Wind Tunnel Evaluations of the Rosemount Icing Detector. J. Atmos. Ocean. Technol. 1989, 6, 971–979. [Google Scholar] [CrossRef]
- Sova, G.L. Evaluation of the Performance of a Rosemount Icing Detector during Impacts 2020. Master’s Dissertation, The University of North Dakota, Grand Forks, ND, USA, 2021. [Google Scholar]
- Ellis, S.M.; Vivekanandan, J.; Goeke, S.; Brandes, E.A.; Stith, J.; Keeler, R.J. In-situ verification of remote aircraft icing detection using S-band polarization radar measurements. In Proceedings of the 30th International Conference on Radar Meteorology, Munich, Germany, 19–24 July 2001. [Google Scholar]
- Wang, J.; Xie, B.; Cai, J. The Distribution of Aircraft Icing Accretion in China—Preliminary Study. Atmosphere 2020, 11, 876. [Google Scholar] [CrossRef]
- Bernstein, B.C.; Wolff, C.A.; McDonough, F. An Inferred Climatology of Icing Conditions Aloft, Including Supercooled Large Drops. Part I: Canada and the Continental United States. J. Appl. Meteorol. Clim. 2007, 46, 1857–1878. [Google Scholar] [CrossRef]
- Politovich, M.K. Aircraft icing. In Encyclopedia of Atmospheric Sciences; Elsevier Science Ltd.: Amsterdam, Netherlands, 2003; Volume 358, pp. 68–75. [Google Scholar] [CrossRef]
- Hallowell, R.G.; Donovan, M.F.; Smalley, D.J.; Bennett, B.J. Icing hazard detection with NEXRAD IHL. In Proceedings of the 36th Conference on Radar Meteorology, Breckenridge, CO, USA, 16–20 September 2013. [Google Scholar]
- Vukits, T. Overview and risk assessment of icing for transport category aircraft and components. In Proceedings of the 40th AIAA Aerospace Sciences Meeting & Exhibit, Reno, NV, USA, 14–17 January 2002; p. 30. [Google Scholar]
- Jeck, R.K. A History and Interpretation of Aircraft Icing Intensity Definitions and FAA Rules for Operating in Icing Conditions. US Department of Transportation Final Report. DOT/FAA/AR-01/91. 2001, 43p. Available online: https://apps.dtic.mil/sti/pdfs/ADA398952.pdf (accessed on 1 November 2001).
- Tucker, W.B. Current Procedures for Forecasting Aviation Icing: A Review. 1983. Available online: https://erdc-library.erdc.dren.mil/jspui/handle/11681/12087 (accessed on 1 August 1983).
- Ryzhkov, A.V.; Reeves, H.D.; Schuur, T.J.; Kumjian, M.R.; Zrnic, D.S. Investigations of polarimetric radar signatures in winter storms and their relation to aircraft icing and freezing rain. In Proceedings of the 35th Conference on Radar Meteorology, Pittsburgh, PA, USA, 26–30 September 2011. [Google Scholar]
- Kalina, E.A.; Matrosov, S.Y.; Cione, J.J.; Marks, F.D.; Vivekanandan, J.; Black, R.A.; Hubbert, J.C.; Bell, M.M.; Kingsmill, D.E.; White, A.B. The ice water paths of small and large ice species in Hurricanes Arthur (2014) and Irene (2011). J. Appl. Meteorol. Climatol. 2017, 56, 1383–1404. [Google Scholar] [CrossRef]
- Vogel, G.N. Icing Considerations for HALE (High Altitude, Long Endurance) Aircraft; NEPRF-TR-88-11; Naval Environmental Prediction Research Facility: Monterey, CA, USA, 1988. [Google Scholar]
- Larabee, S. AIR WEATHER SERVICE SCOTT AFB IL. FYI, Icing. Number 38. 1997. Available online: https://apps.dtic.mil/sti/tr/pdf/ADA324098.pdf (accessed on 1 March 1997).
- Czernkovich, N. Understanding in-flight icing. In Proceedings of the Transport Canada Aviation Safety Seminar, Budapest, Hungary, 17 November 2004; pp. 1–21. [Google Scholar]
- Ye, B.-Y.; Kim, Y. Estimation of Aircraft Icing Intensity Using Z-LWC Relationship from Radar and Aircraft Data. In Proceedings of the EGU General Assembly 2024, Vienna, Austria, 14–19 April 2024. EGU24-7164. [Google Scholar] [CrossRef]
Figure 1.
Composite map of radar observations. Yellow circles indicate the observation areas of the Korea Meteorological Administration (KMA) radars and green circles indicate the observation areas of the Ministry of Environment (ME) radars. Yellow or green squares indicate the locations of KMA radars (10) or ME radars (5), respectively.
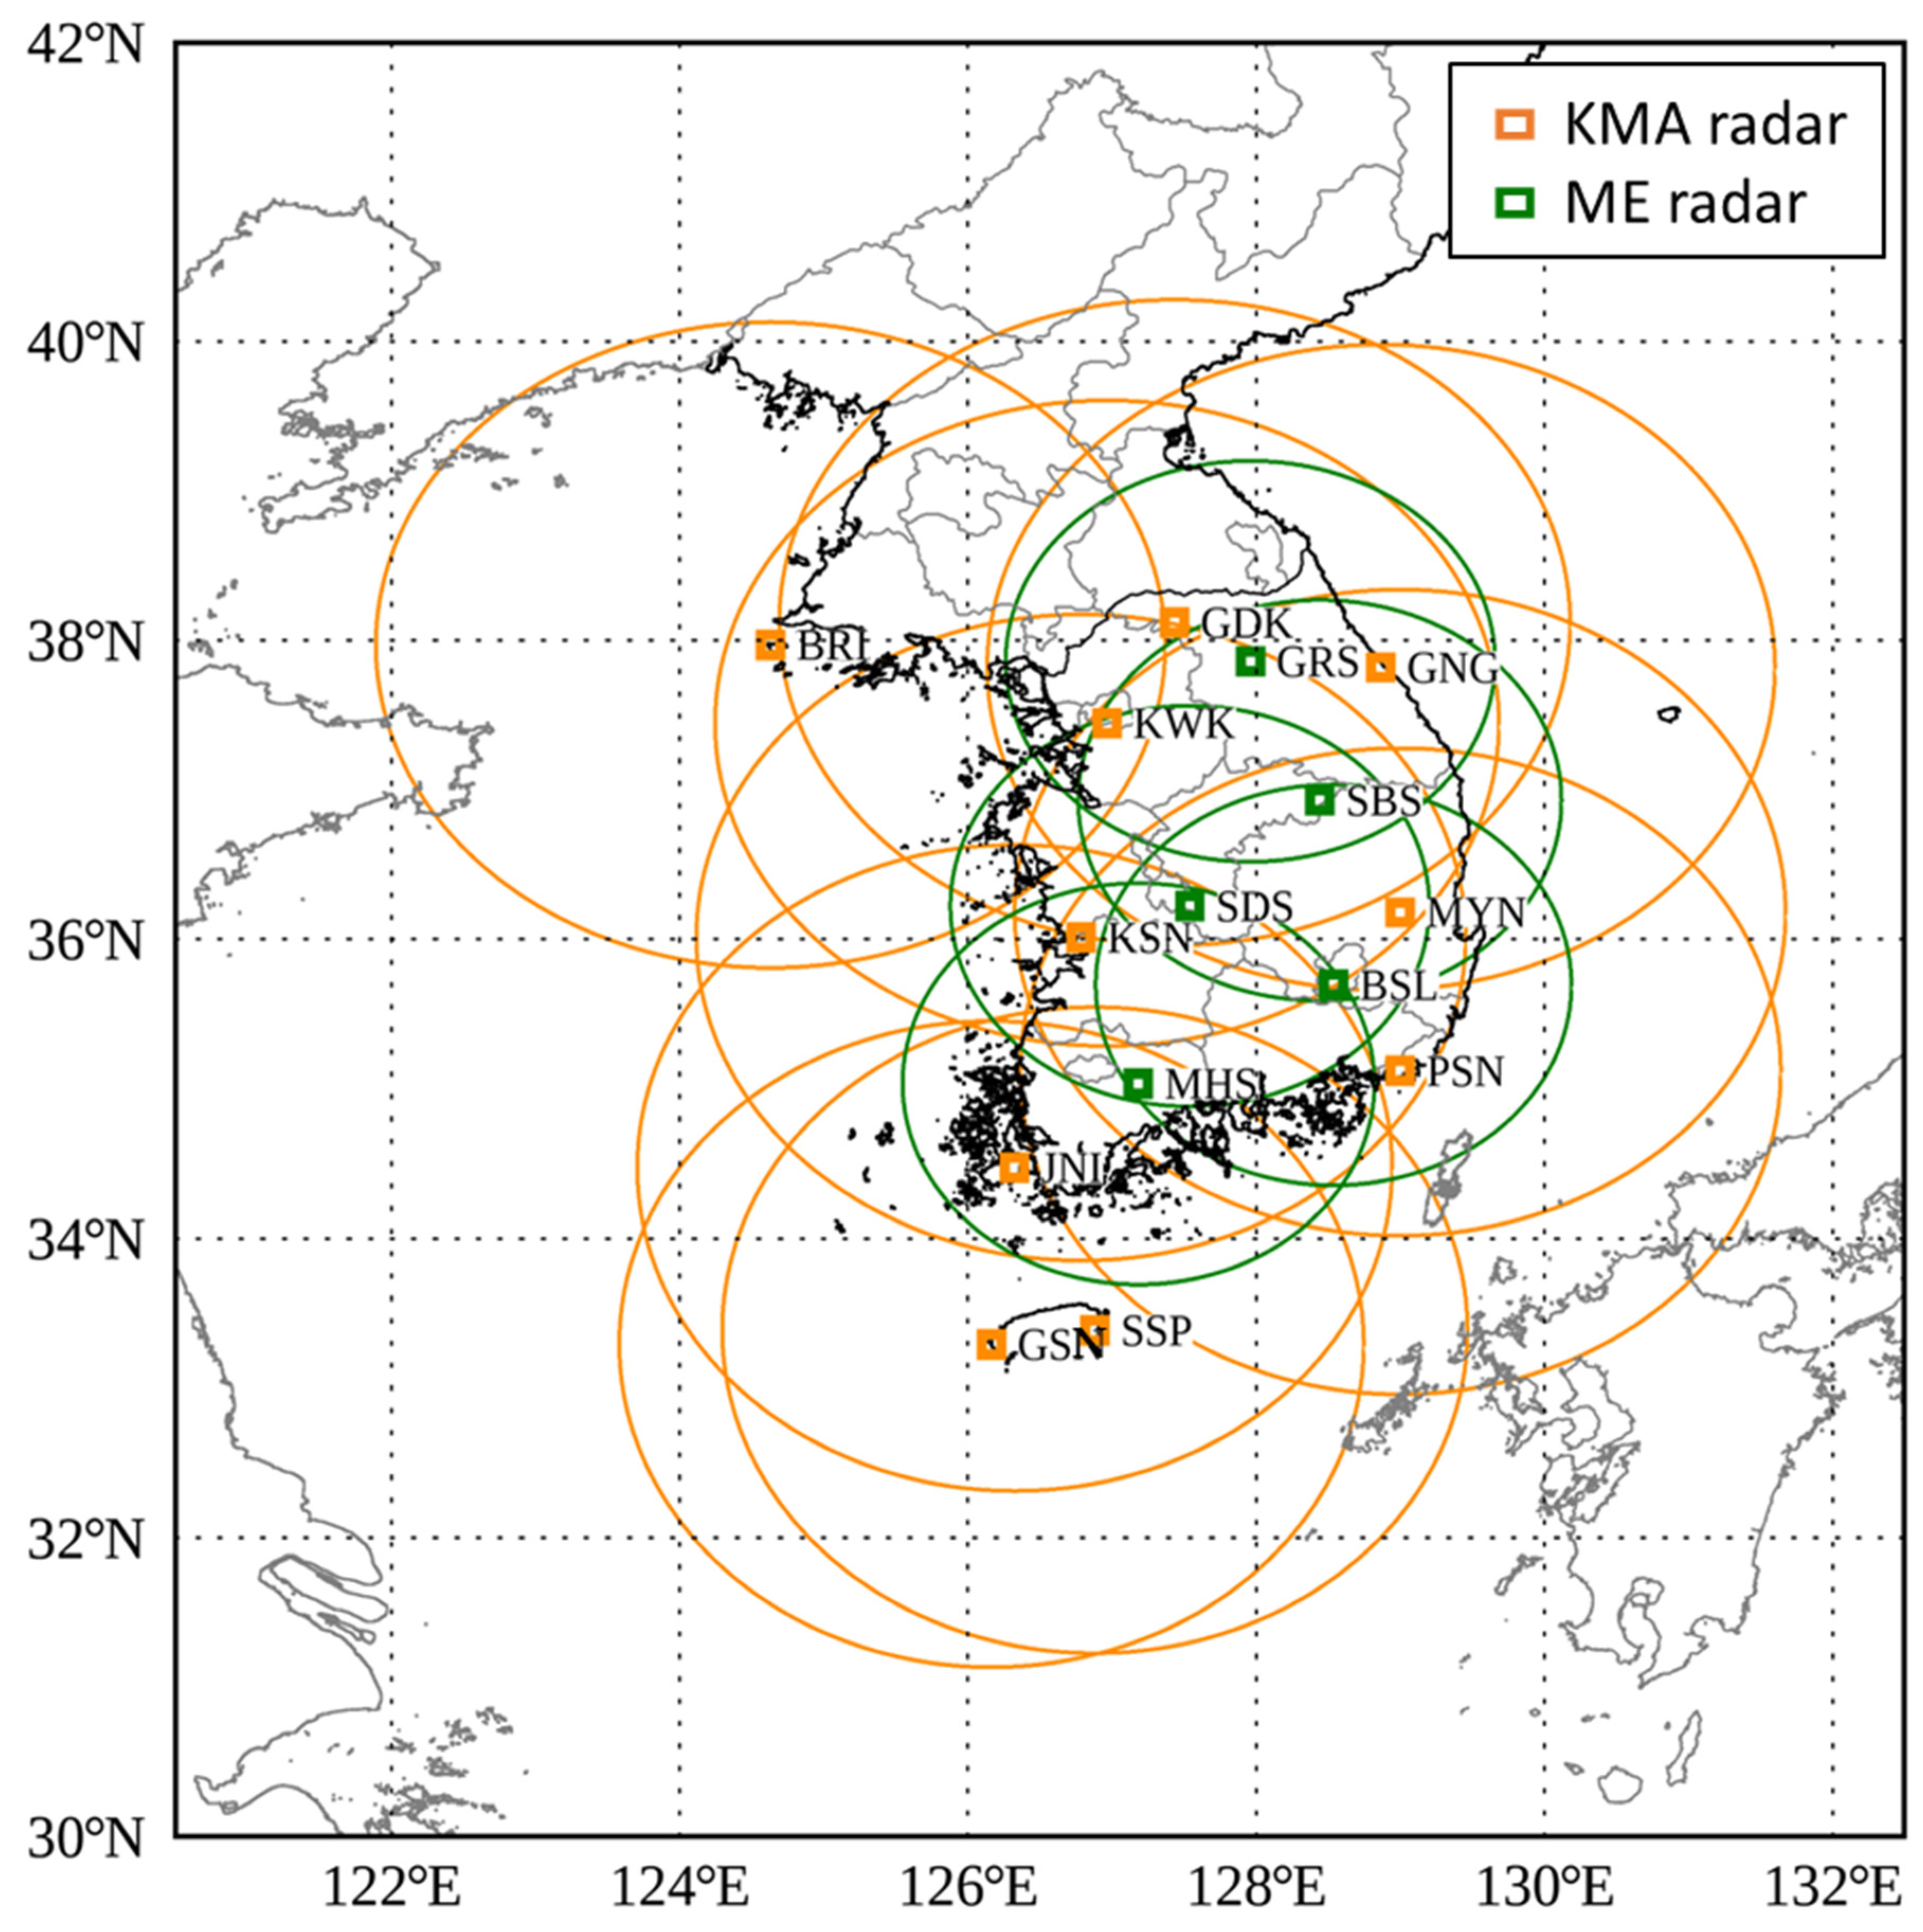
Figure 2.
Photograph of an atmospheric research aircraft (NARA). The red dotted circle indicates the icing detector, which is enlarged in the red square.
Figure 2.
Photograph of an atmospheric research aircraft (NARA). The red dotted circle indicates the icing detector, which is enlarged in the red square.

Figure 3.
Conceptual diagram for time and location matching between 3D gridded data and aircraft data. The line from blue to yellow indicates the aircraft route (where the flight departs and arrives); the red line indicates a route where icing occurred; black dots represent point for occurrence of icing; cuboids represent the 3D gridded data (radar and atmospheric variables).

Figure 4.
Histograms and probability density functions (black lines) of (a) ZH, (b) ZDR, (c) T, and (d) RH.
Figure 4.
Histograms and probability density functions (black lines) of (a) ZH, (b) ZDR, (c) T, and (d) RH.
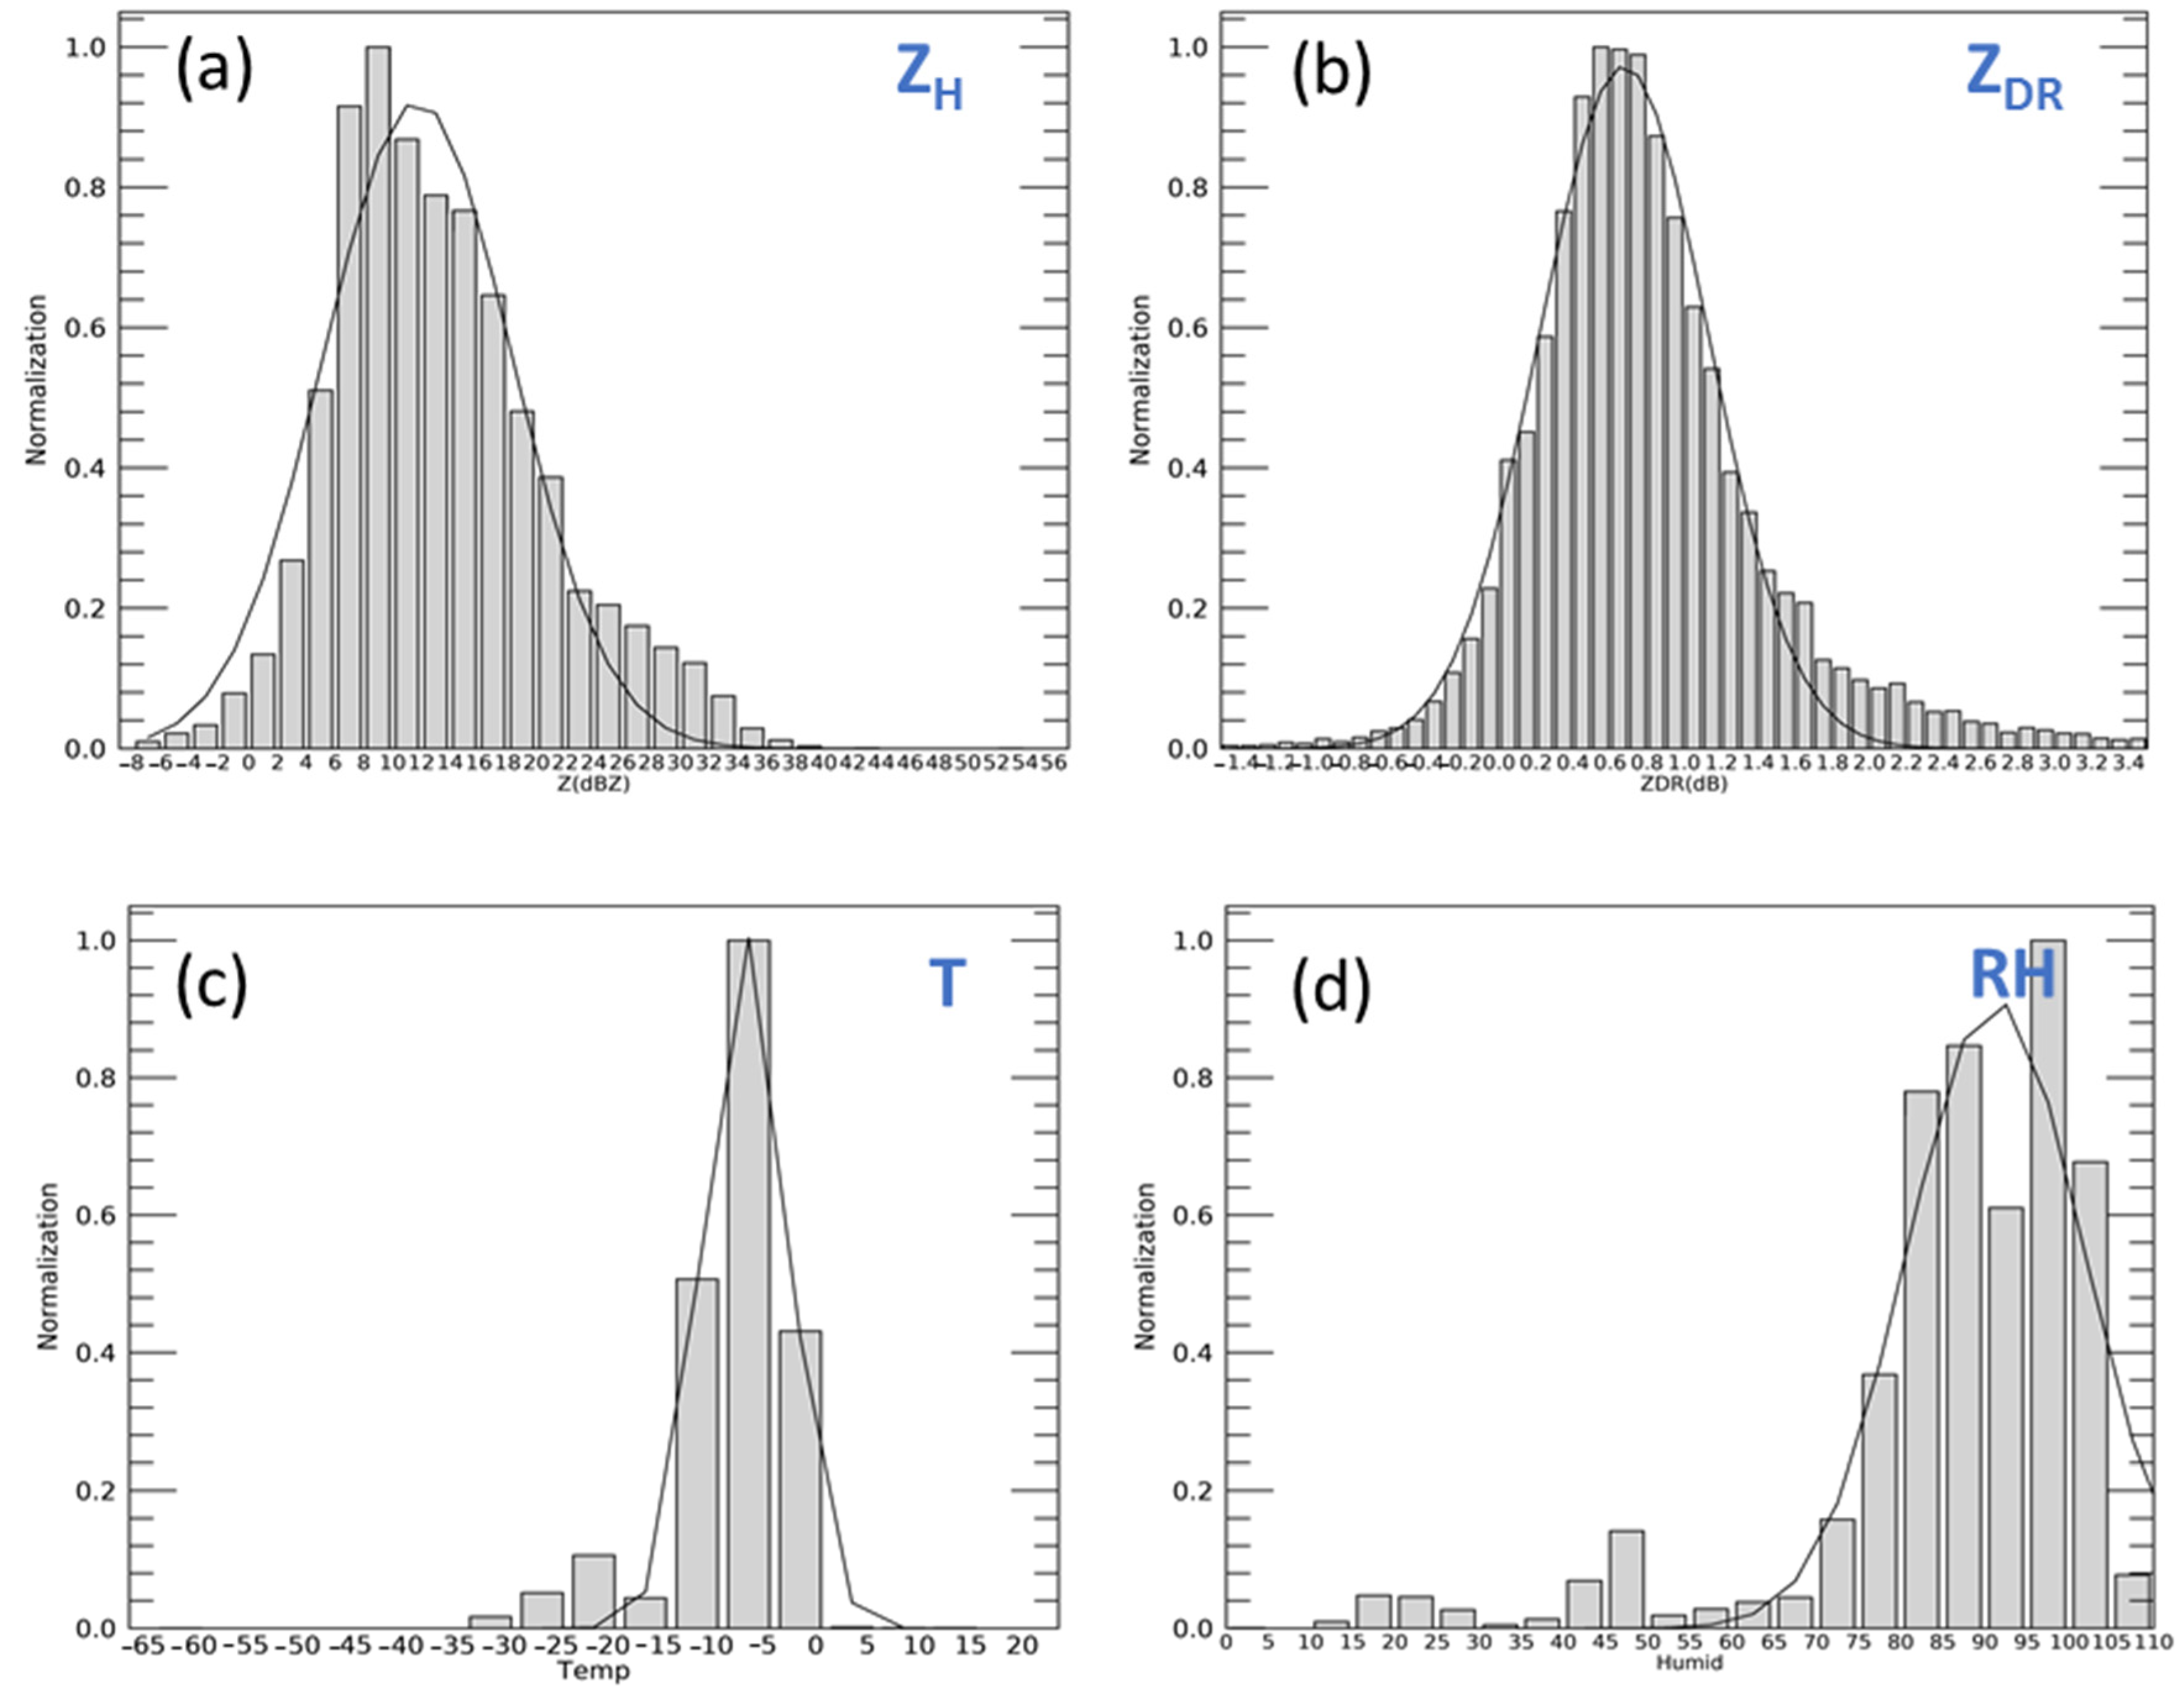
Figure 5.
Algorithm for detection of icing potential.

Figure 6.
Verification results for a total of ten cases. (a) Distribution of hit and miss locations; (b) height of hits and misses according to the longitude. Blue square: hit, red cross: miss.
Figure 6.
Verification results for a total of ten cases. (a) Distribution of hit and miss locations; (b) height of hits and misses according to the longitude. Blue square: hit, red cross: miss.
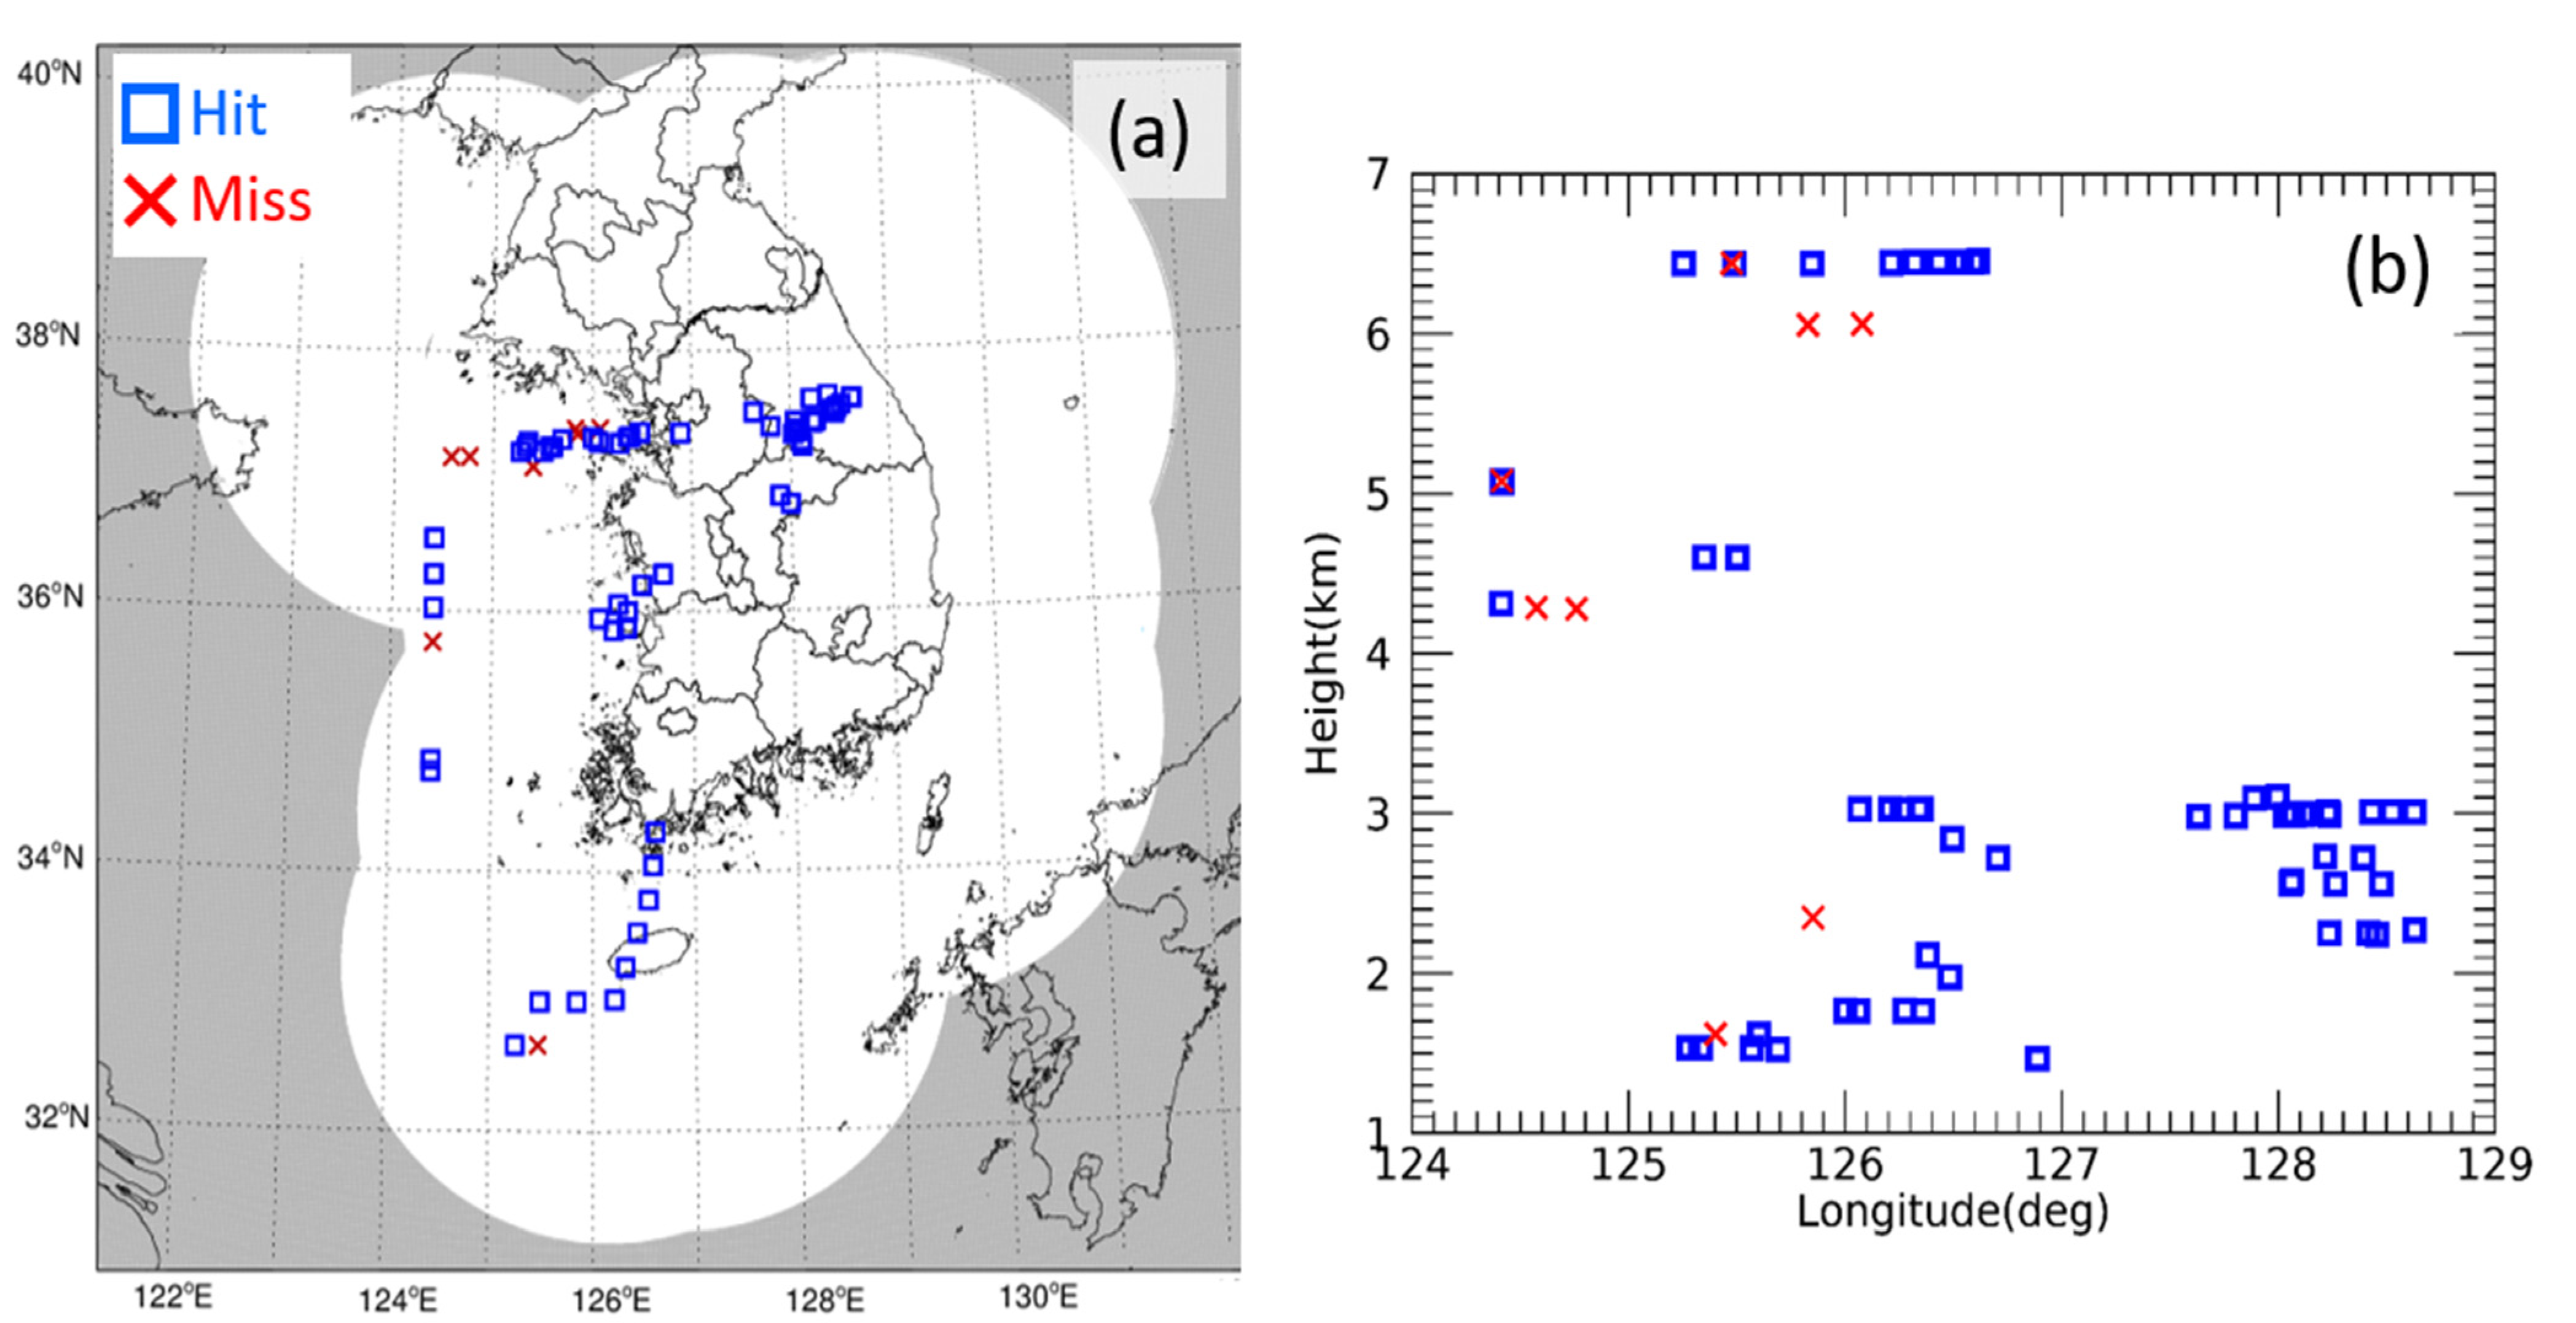
Figure 7.
Images of an icing case associated with low pressure and fronts at 1325 KST on 13 March 2022; (a) ZH, (b) ZDR, (c) HC, (f) LWC at 3 km height, vertical cross sections (pick line A–B) of (d) ZH and (e) HC, (g) icing potential (icing caution: light purple, icing warning: purple), (h) maximum height of icing potential, and (i) vertical cross section of icing potential. Red box: location of the air flight route where icing occurred.
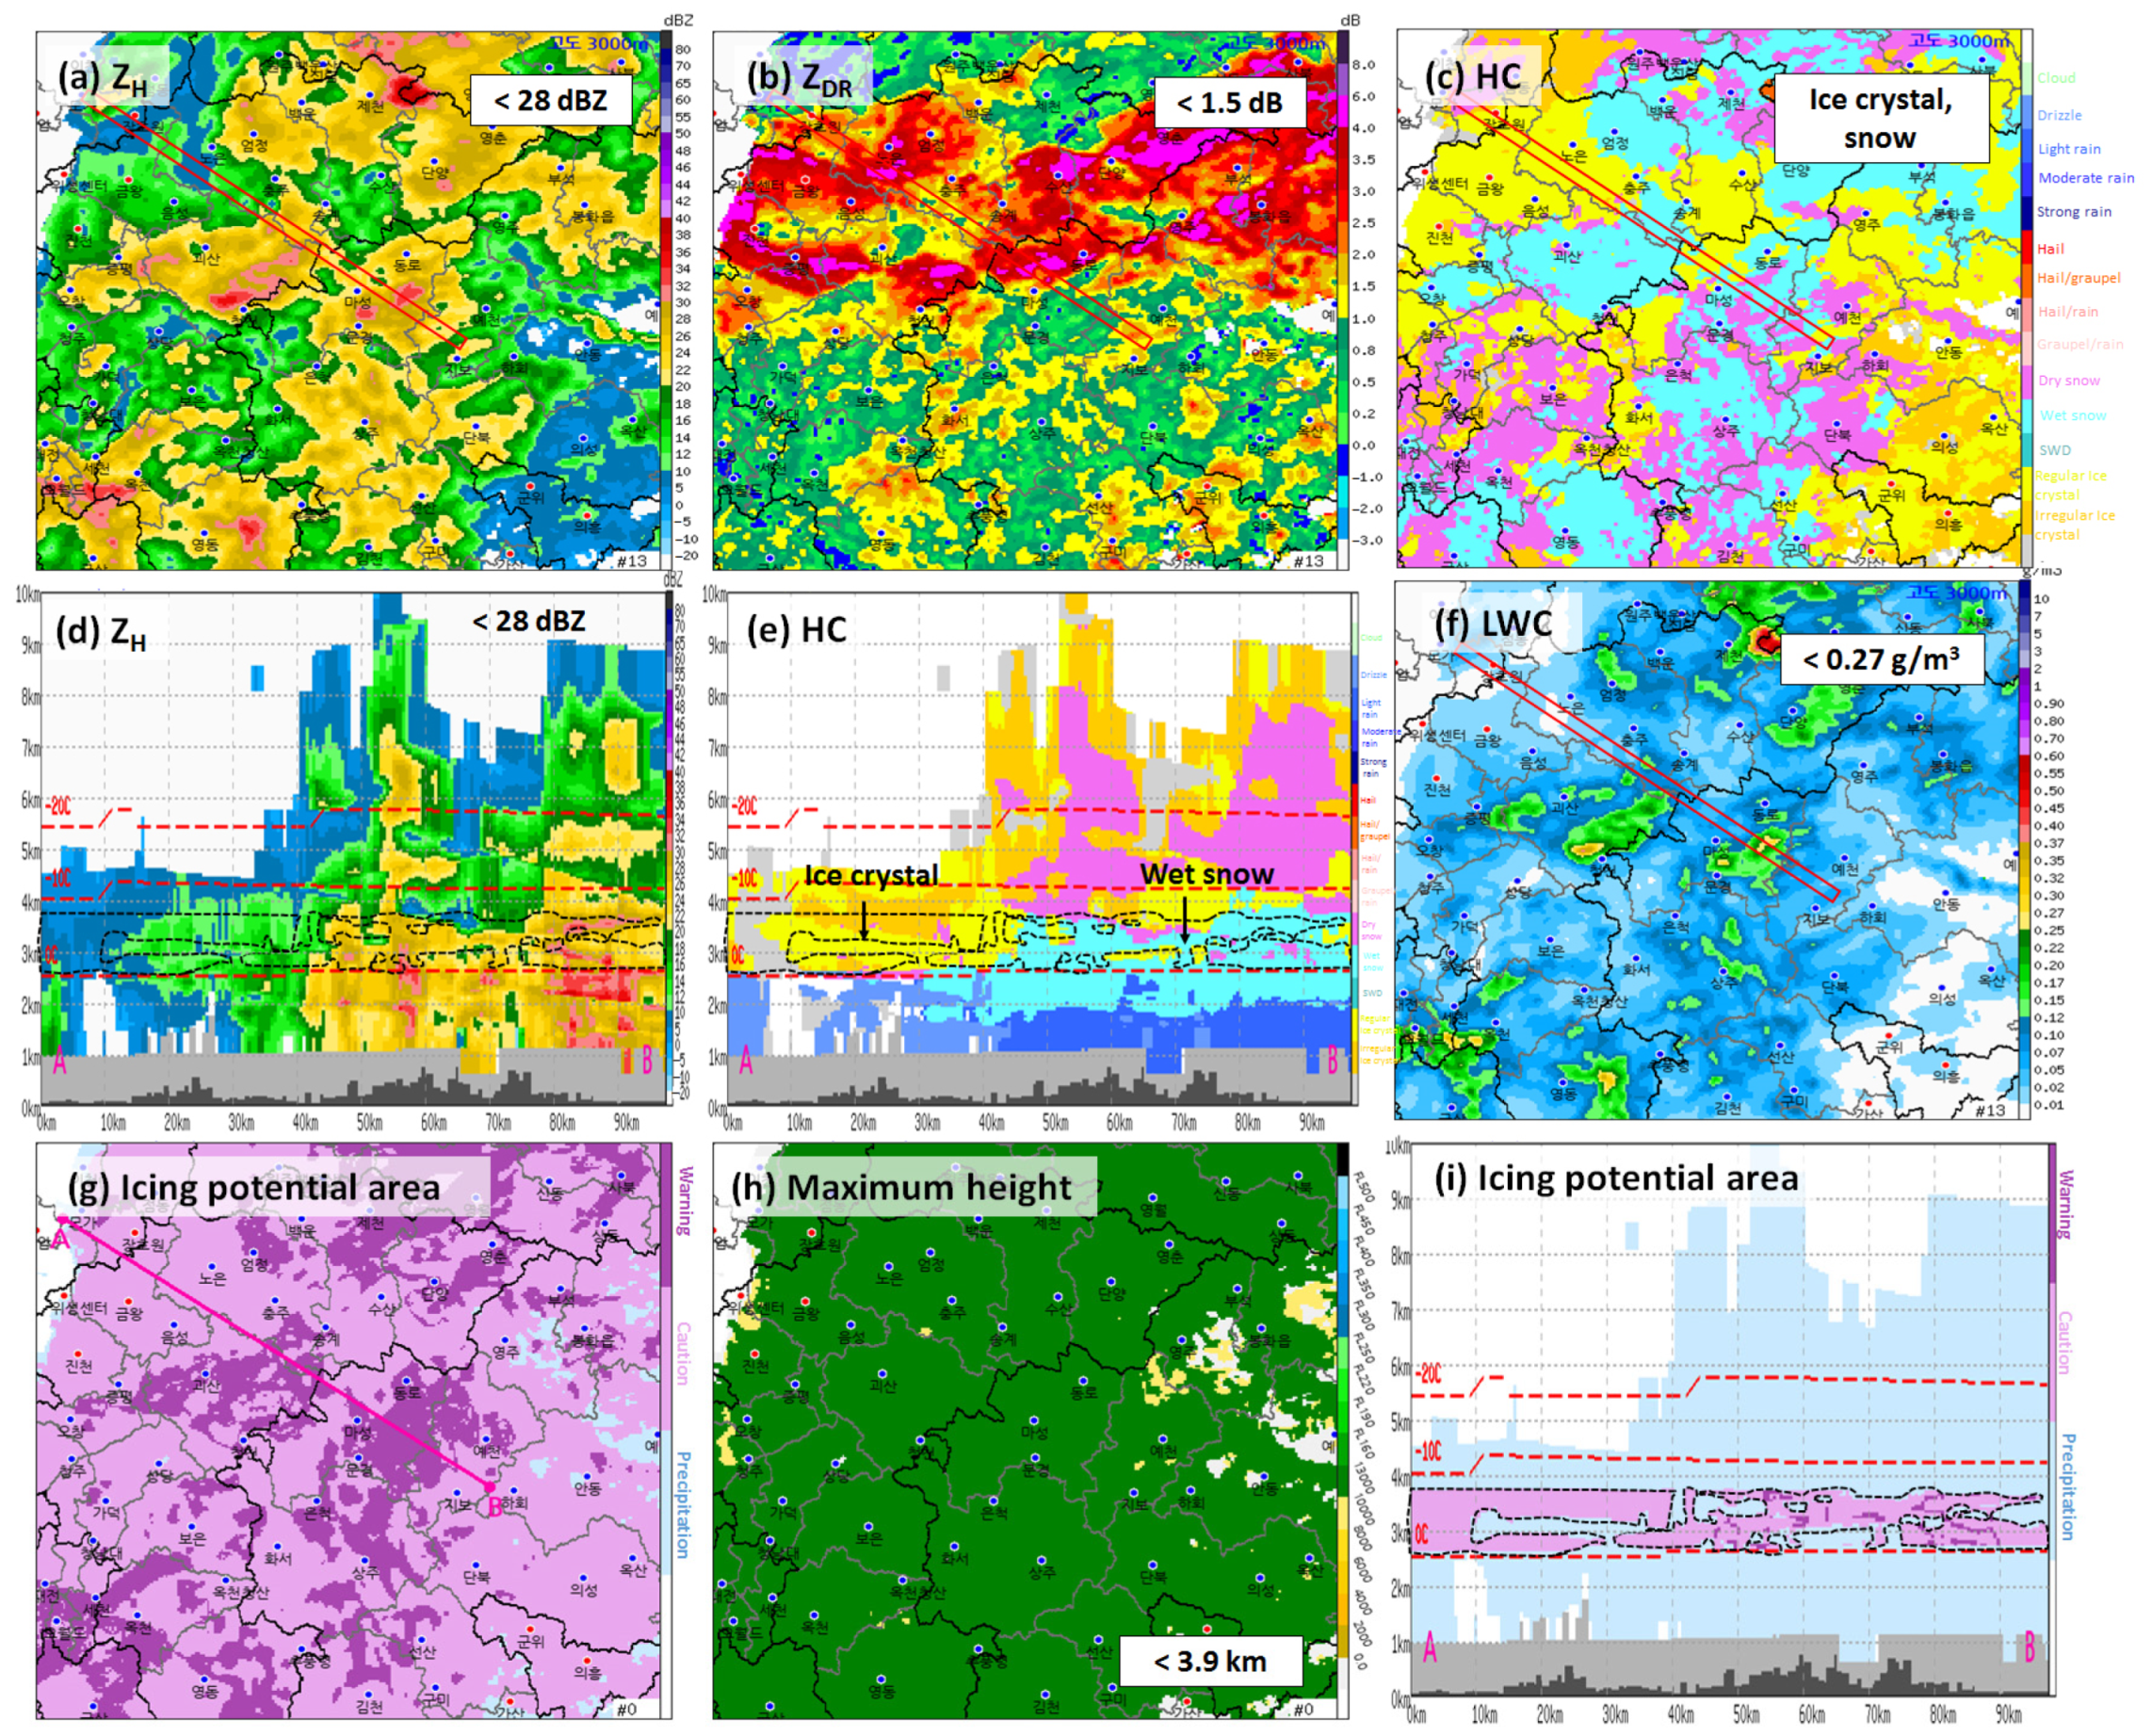
Figure 8.
Images of an icing case involving stratiform clouds at 1200 KST on 21 November 2018: (a) ZH, (b) ZDR, (c) HC, (f) LWC at 3 km height, vertical cross sections (pink line A–B) of (d) ZH and (e) HC, (g) icing potential, (h) maximum height of icing potential, and (i) vertical cross section of icing potential. Red box: location of the air flight route where icing occurred.
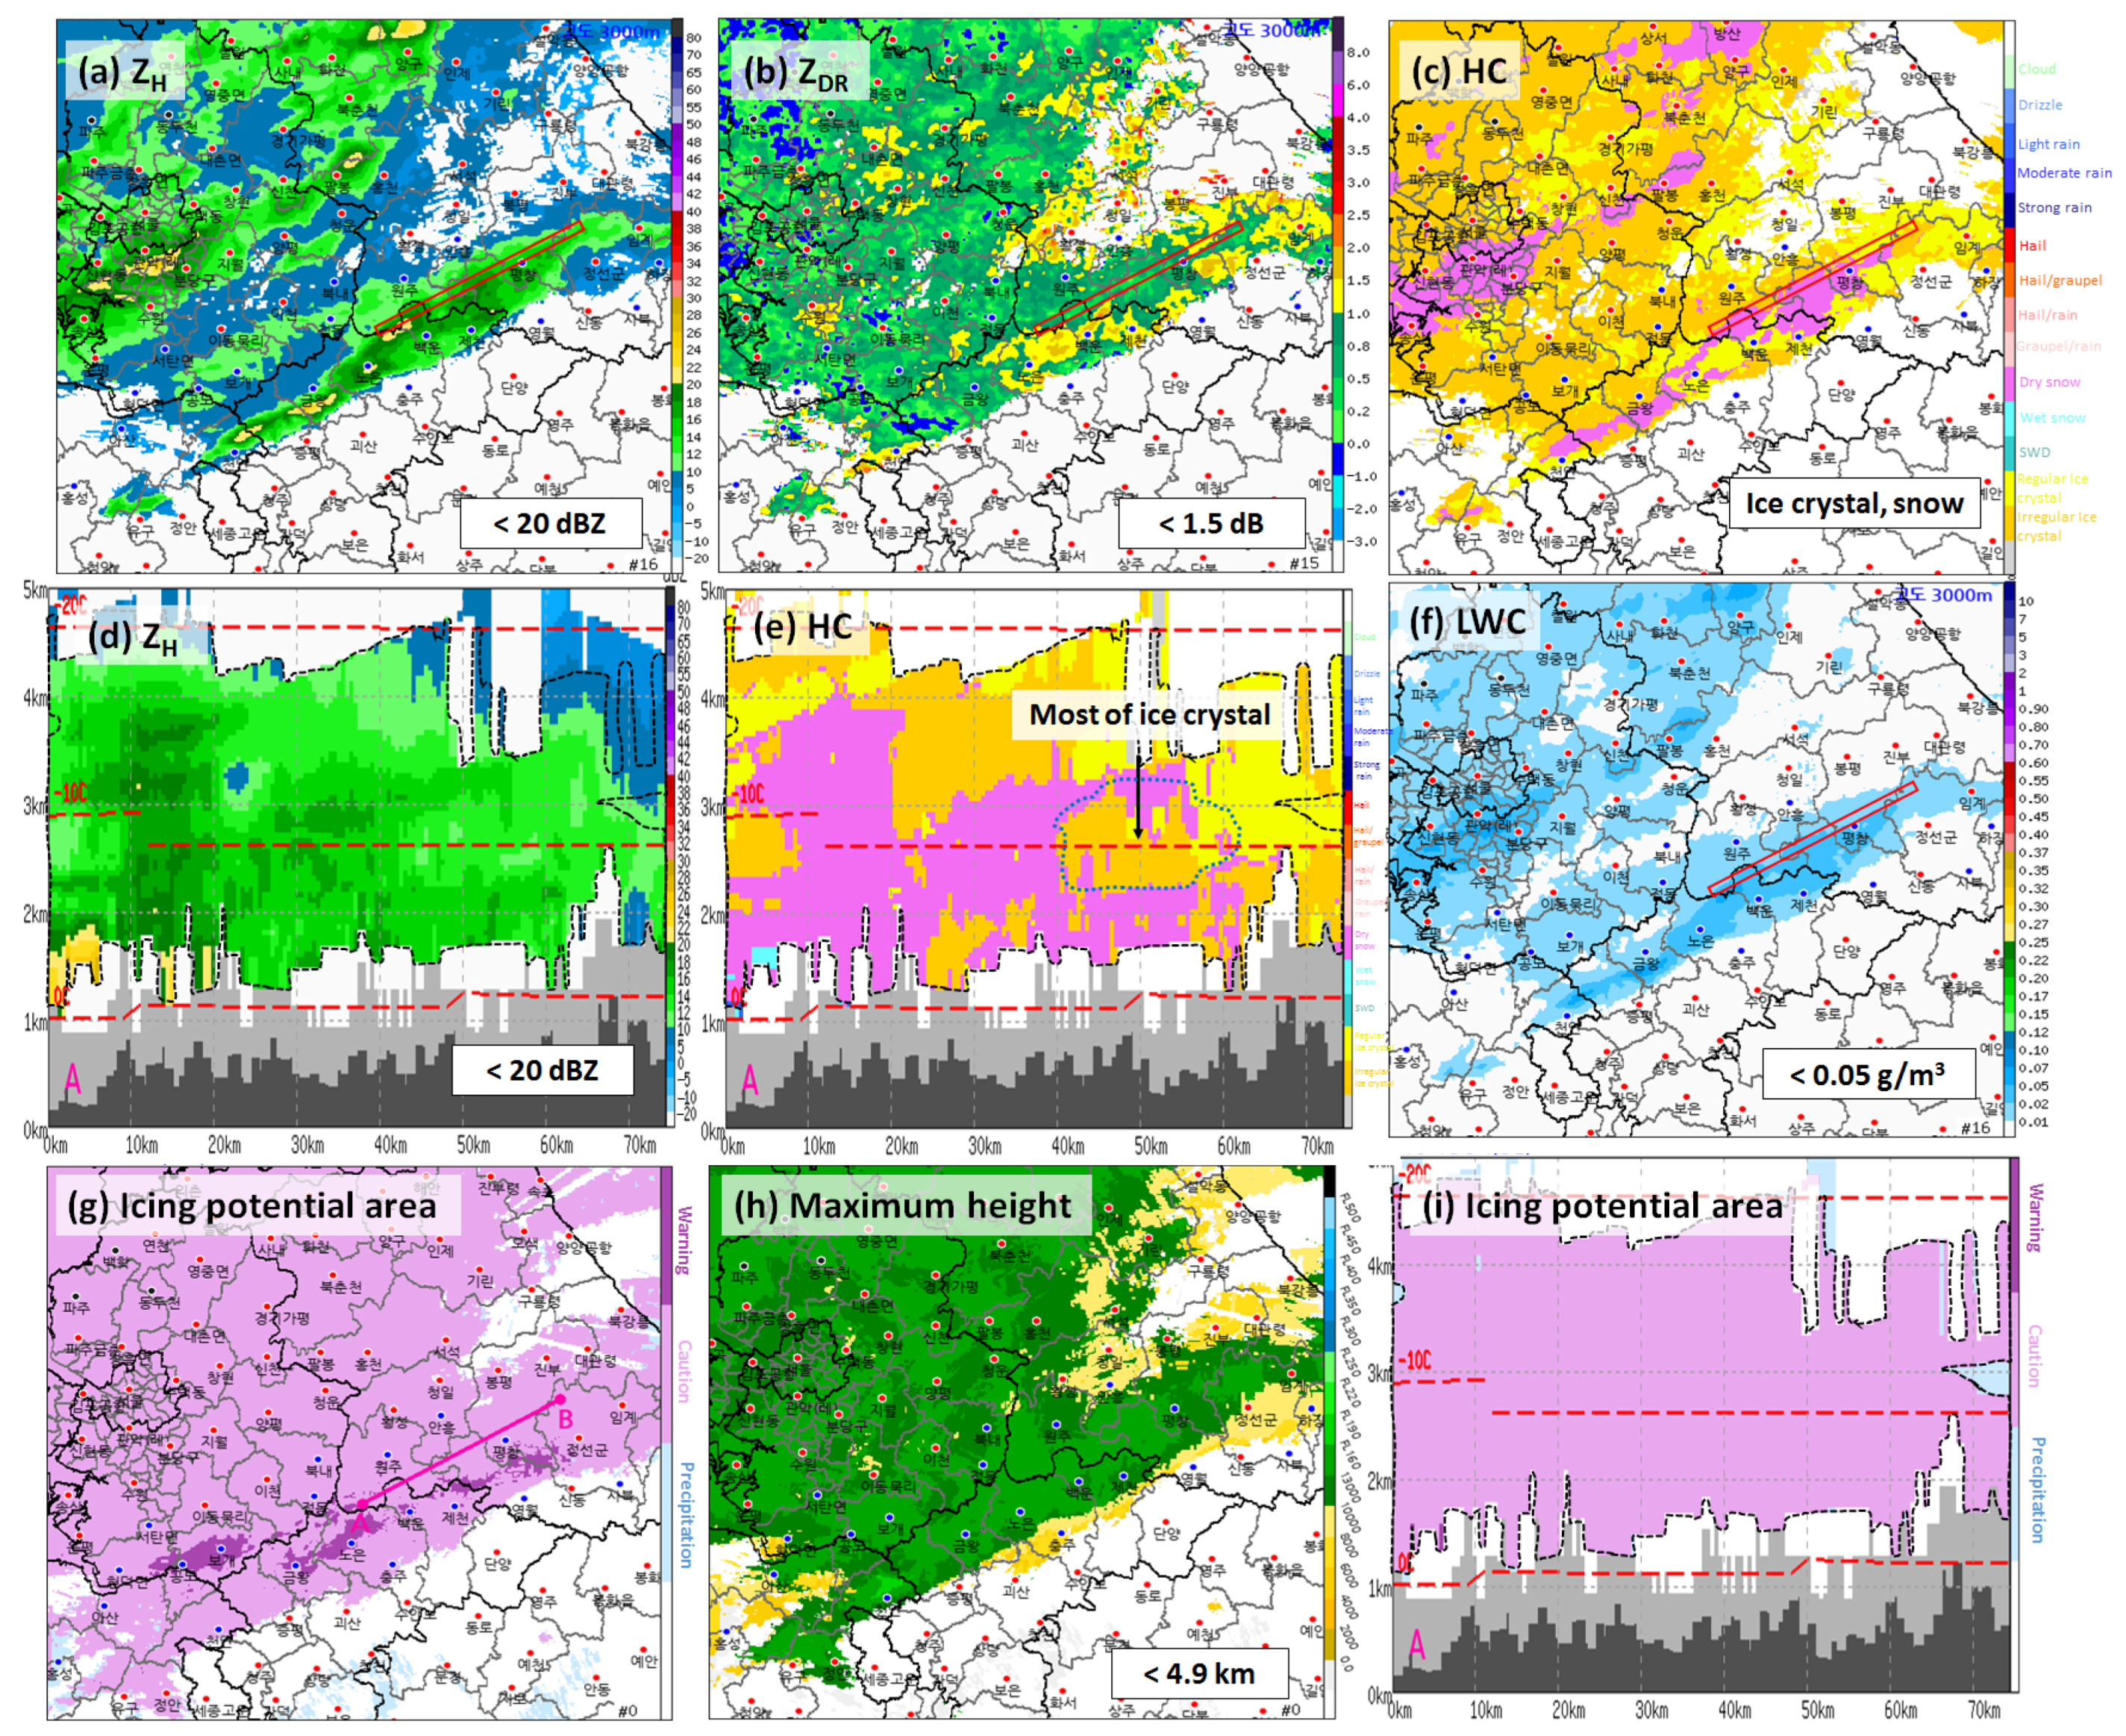
Figure 9.
Images of an icing case involving cumuliform clouds at 1210 KST on 5 October 2018: (a) ZH, (b) ZDR, (c) HC, (f) LWC at 4.5 km height, vertical cross sections (pink line A–B) of (d) ZH and (e) HC, (g) icing potential, (h) maximum height of icing potential, and (i) vertical cross section of icing potential. Red box: location of the air flight route where icing occurred.


Table 1.
Recent research based on remote sensing.
| Algorithm | Data | Output |
|---|---|---|
| Current Icing Potential (CIP) | Radar, satellite, lightning, surface observations, pilot report, numerical model | Potential for icing, SLDs |
| Advanced Diagnosis and Warning systems for aircraft Icing Environments (ADWICE) | Radar, satellite, SYNOP, METAR, local model, station meteorological observation | Aircraft icing |
| Radar Icing Algorithms (RadIA) | Radar, sounding, numerical model, satellite | Aircraft icing |
Table 2.
Information on the three-dimensional (3D) composite for radar variables.
| Time resolution | 5 min | ||
| Spatial resolution | Horizontal | 0.5 km | |
| Vertical | Altitude (m) | Resolution (m) | |
| 50–8000 | 50 | ||
| 8000–10,000 | 100 | ||
| 10,000–16,000 | 200 | ||
| Number of grid (z,y,x) | (210,2049,2049) | ||
Table 3.
Information on the 3D composite for atmospheric variables (T and RH).
| Time resolution | 5 min | ||
| Spatial resolution | Horizontal | 4 km | |
| Vertical | Altitude (m) | Resolution (m) | |
| 0–3000 | 100 | ||
| 3000–8000 | 200 | ||
| 8000–16,000 | 500 | ||
| Number of grid (z,y,x) | (72,257,257) | ||
Table 4.
Conditions of variables.
| Variables | Condition |
|---|---|
| T | −20 °C ≤ T ≤ 0 °C |
| RH | RH ≥ 70% |
| ZH | −2 dBZ < ZH < 28 dBZ |
| ZDR | −0.6 dB < ZDR < 2.2 dB |
| HC | SWDs, graupel/rain |
| LWC | 0.1 g m−3 < LWC < 2.9 g m−3 |
Table 5.
Criteria of icing potential.
| Criteria | Area Name | ||
|---|---|---|---|
| Icing Potential | |||
| Icing Caution | Icing Warning | ||
| Number of satisfied conditions | Atmospheric variables (T, RH) | 2 | 2 |
| Radar variables (ZH, ZDR, HC, LWC) | 2 | ≥3 | |
Table 6.
Contingency table for the verification.
| Icing Potential (Radar) | |||
|---|---|---|---|
| Yes | No | ||
| Aircraft icing observation(Aircraft) | Yes | Hit (H) | Miss (M) |
| No | False (F) | Correct rejection (C) | |
Disclaimer/Publisher’s Note: The statements, opinions and data contained in all publications are solely those of the individual author(s) and contributor(s) and not of MDPI and/or the editor(s). MDPI and/or the editor(s) disclaim responsibility for any injury to people or property resulting from any ideas, methods, instructions or products referred to in the content. |
© 2024 by the authors. Licensee MDPI, Basel, Switzerland. This article is an open access article distributed under the terms and conditions of the Creative Commons Attribution (CC BY) license (https://creativecommons.org/licenses/by/4.0/).
Share and Cite
MDPI and ACS Style
Kim, Y.; Ye, B.-Y.; Suk, M.-K. AIDER: Aircraft Icing Potential Area DEtection in Real-Time Using 3-Dimensional Radar and Atmospheric Variables. Remote Sens. 2024, 16, 1468. https://doi.org/10.3390/rs16081468
AMA Style
Kim Y, Ye B-Y, Suk M-K. AIDER: Aircraft Icing Potential Area DEtection in Real-Time Using 3-Dimensional Radar and Atmospheric Variables. Remote Sensing. 2024; 16(8):1468. https://doi.org/10.3390/rs16081468
Chicago/Turabian StyleKim, Yura, Bo-Young Ye, and Mi-Kyung Suk. 2024. "AIDER: Aircraft Icing Potential Area DEtection in Real-Time Using 3-Dimensional Radar and Atmospheric Variables" Remote Sensing 16, no. 8: 1468. https://doi.org/10.3390/rs16081468
Note that from the first issue of 2016, this journal uses article numbers instead of page numbers. See further details here.