
Concept of Spaceborne Ocean Microwave Dual-Function Integrated Sensor for Wind and Wave Measurement
by
 ,
,
Hang Li
1,2, 
Wenkang Liu
2,3,*,
Guangcai Sun
1,
Changhong Chen
1,
Mengdao Xing
1,3,
Zhenhua Zhang
4 and
Jie Zhang
5 1
The National Laboratory of Radar Signal Processing, Xidian University, Xi’an 710071, China
2
The Technology Innovation Center for Ocean Telemetry, Ministry of Natural Resources, Qingdao 266061, China
3
The Academy of Advanced Interdisciplinary Research, Xidian University, Xi’an 710071, China
4
The Ocean Telemetry Technology Innovation Center, Ministry of Natural Resources, Qingdao 266061, China
5
The First Institute of Oceanography, Ministry of Natural Resources, Qingdao 266061, China
*
Author to whom correspondence should be addressed.
Remote Sens. 2024, 16(8), 1472; https://doi.org/10.3390/rs16081472
Submission received: 27 February 2024
/
Revised: 16 April 2024
/
Accepted: 17 April 2024
/
Published: 21 April 2024
(This article belongs to the Special Issue Remote Sensing Applications in Ocean Observation II)
Abstract
:Dedicated to synchronously acquiring large-area, high-precision, and multi-scale ocean wind and wave information, a novel concept of a spaceborne ocean microwave dual-function integrated sensor is proposed in this paper. It integrates the functions of a scatterometer and SAR by sharing a single phased-array antenna. An overview of the scientific requirements and motivations for the sensor are outlined firstly. In order to fulfill the observation requirements of both the functions, the constraints on the system parameters such as frequency, antenna size, and incidence angle are analyzed. Then, the selection principles of these parameters are discussed within the limitations of antenna area, bandwidth, available time, and cost. Additionally, the constraints on the time sequence of transmitting and receiving pulses are derived to ensure that there is no conflict when the two functions operate simultaneously. Subsequently, a method for jointly designing the pulse repetition frequency (PRF) of both the functions is introduced, along with zebra maps to verify its effectiveness. At the end of the paper, the system and performance parameters of the sensor are given for further insight into it.
1. Introduction
1.1. Background and Challenge
Ocean wind and waves are crucial environmental dynamic elements that jointly affect marine meteorology, ocean-atmosphere interactions, as well as global economics and safety [1,2,3]. Large-coverage synchronous monitoring of ocean wind and waves is urgently needed to establish a more accurate ocean surface model, so as to better understand ocean dynamics [4,5,6]. Currently, the spaceborne microwave remote sensing systems, including the spaceborne microwave scatterometer and Synthetic Aperture Radar (SAR), are widely employed for ocean wind and wave observation thanks to their characteristics of large coverage and flexible temporal and spatial resolutions [7,8,9].
The spaceborne microwave scatterometer is a non-imaging instrument that retrieves global wind fields by exploiting the relationship between sea surface wind and its associated roughness [10]. It can simultaneously invert the wind direction and speed from backscattering coefficients measured in multiple directions [11]. However, as a real-aperture radar, its spatial resolution is limited by the size of the beam footprint, typically ranging from 12.5 to 50 km. The coarse resolution hinders its effectiveness in observing local areas, such as coastlines, nearshore zones, and islands [12,13]. Additionally, the sensitivity of the scatterometer diminishes and the signal saturates at high wind speeds (above 35 m/s), making it unsuitable for wind field inversion under such conditions.
SAR is an imaging instrument capable of acquiring high-resolution, two-dimensional (azimuth and range) images through the virtual synthetic aperture, wide frequency band, and sophisticated signal processing techniques [14]. SAR retrieves the wind fields by measuring the Normalized Radar Cross-Section (NRCS) variation of the sea surface, and it is the only satellite-based system that can offer wind information with a sub-kilometer spatial resolution (ranging from a few to a few hundred meters) [15]. However, as SAR operates at a single azimuth angle, external wind direction information is required to resolve the 180-degree ambiguity of the wind direction, which leads to the inversion precision being highly dependent on the accuracy of the auxiliary data [16,17,18]. Beyond wind field retrieval, SAR images can also be employed to estimate wave directional spectra based on the nonlinear mapping relationship between them. However, due to the nonlinear velocity bunching modulation, high wavenumbers in the azimuth direction are cut off, limiting the observable wavelength range. As a consequence, the shortest waves typically cannot be captured, with a lower limit of approximately 250 m [19]. In addition, the narrow swath and high energy consumption restrict its application to global observation.
1.2. Current Research
In short, scatterometers and SARs exhibit distinct strengths and weaknesses in ocean wind and wave observation. Unfortunately, the inherent limitations of these instruments restrict their ability to overcome certain observation challenges [20]. Consequently, the joint observation of multiple sensors has emerged as a promising approach to optimize observation performance. ERS-1/2 satellites are key microwave sensors for measuring global ocean parameters like wind and waves [21]. Their Active Microwave Instrument (AMI) comprises four antennas: one for SAR function and the others for scatterometer function to acquire backscatter data from multiple directions. However, due to a shared transceiver, they cannot acquire the strictly synchronized data in time and space [22]. Moreover, multiple antennas significantly increase satellite volume and weight [23]. HY-2 can simultaneously measure sea surface height, wind field, and wave height using multiple small payloads like scatterometers, radiometers, and altimeters [24]. However, these payloads are all real-aperture radars and cannot acquire high-resolution data [25]. CFOSAT realizes the wide-coverage, high-precision synchronous observation of ocean wind and waves through two payloads: a fan-beam scanning scatterometer and SWIM [26,27]. SWIM, a real-aperture wave scatterometer operating at near-nadir incidence angles, focuses on measuring directional ocean wave spectra without the limitations of SAR imaging mechanisms. However, its spatial resolution is significantly lower than SAR, reaching only a few tens of kilometers (approximately 90 km) [28,29]. Additionally, the independent operation of the two payloads results in large instrument volume and weight. Harmony, newly developed by DLR Laboratory, focuses on observing dynamic deformations of ice, solid Earth, and the ocean surface [30,31,32]. This novel multi-static SAR constellation consists of two passive spacecraft orbiting alongside the Sentinel-1 satellite. However, it still suffers from the limitation of power consumption, which makes it difficult to quickly achieve global observations. Furthermore, synchronization between distributed satellites poses a significant challenge and may affect observation accuracy.
1.3. Work and Arrangement of This Paper
Driven by the scientific demands of ocean wind and wave observation, this paper proposes a novel concept of the spaceborne ocean microwave dual-function integrated sensor. It employs a single phased-array antenna to cleverly integrate the functions of scatterometer and SAR. Phased-array antennas can not only quickly change the beam steering and shapes with high stability and flexibility [33], but also transmit or receive multiple beams at the same time [34], which provides the technical support for the integration and simultaneous realization of multiple radar functions [35]. This paper is devoted to providing a comprehensive overview of this innovative concept and the parameter design of this sensor for a deeper understanding. Since the two functions are mutually restricted in system parameters, the design principles and methods of system parameters such as frequency, antenna size, incidence angle, and the time sequence of transmitting and receiving pulses are thoroughly investigated to ensure successful integration.
This article is organized as follows. In Section 2, the scientific requirements and the motivations of the proposed concept are introduced. In Section 3, the constrains on frequency, antenna size, incidence angle, and pulse transmitting-and-receiving time sequence are derived. In Section 4, the selection principles of the system parameters are deeply discussed by corresponding simulations, and the joint design method of PRFs of two functions is proposed and verified by zebra maps. In Section 5, this article is concluded.
2. Overview of the Dual-Function Integrated Sensor
2.1. Scientific Requirements and Operating of the Instrument
In term of the scatterometer function, the main task is to quickly obtain the high precision information of the sea-surface wind field on a global scale. Therefore, the scientific requirements of the instrument for the realization of the scatterometer function mainly include the following:
- Beam steer is flexible to complete conical scanning.
- The SNR of the echoes is high enough or informative enough to achieve high-precision inversion.
In agreement with these scientific requirements, the phased-array antenna is employed. Different from the traditional mechanical scanning method of the parabolic antennas, the phased-array antenna does not need to rotate, but electronically steers the beam direction by adjusting the phase difference of the signals across its elements [35]. At present, there are two kinds of scatterometer structures that can obtain high-precision sea breeze information: fan beam and pen beam. Fan beam enables the covering of a large range of incidence angles because of the wide beamwidth in the range direction; thus, it can provide data with rich incidence angle information, but also result in a low signal-to-noise ratio (SNR) [11]. Combining two or more pencil beams can also obtain information in different directions, and the SNR is high because of the small beamwidth, but the incidence angle information is less than the fan beam [36]. Considering the simultaneous operation of the scatterometer and SAR functions, the length of the echo window of the scatterometer should be as short as possible to minimize its impact on the time sequence of the SAR function. Therefore, two pencil beams are selected by the scatterometer function of the proposed sensor. Figure 1 illustrates the operating principle of the scatterometer function. Orange and green ellipses represent the footprint of the inner and outer beams, respectively. is the angle between the projection of the beam’s sight line on the ground and the satellite’s flight direction, which is defined as the azimuth angle. The phased-array antenna alternately transmits the inner and outer beams with the same PRF. In order to quickly cover the globe without a blind area, the beams rotate around the height axis at a speed of to achieve the conical scan to the sea surface.
In terms of the SAR function, the swath and resolution are the two most crucial observation properties, but they often exhibit a trade-off relationship. To cater to diverse observation requirements regarding swath and resolution for ocean wind and wave observations, the SAR function can operate in the different modes. Fortunately, these scientific requirements can be easily implemented by the phased-array antenna.
The SAR function mainly includes the following four operating modes: (1) The antenna transmits pulses towards the specific observation position in the side-looking direction with a constant incidence angle. This mode offers high resolution but at the expense of a narrow swath. (2) The antenna transmits pulses to the observation region in the side-looking direction, but the incidence angle varies within a small range. This mode allows for some flexibility in coverage while maintaining moderate resolution. (3) Similar to the previous mode, the antenna transmits pulses to the side-looking region, but the incidence angle variations occur over a wider range. This mode offers wider coverage but sacrifices some resolution compared to the first and second modes. (4) Due to limitations in energy resources, the SAR function cannot continuously operate in the previous three modes. Borrowing from the wave modes of ERS-1/2 [20] and GF-3 [37], the SAR function can collect sub-images with a size of 5 km × 10 km (azimuth × range) every 150 km along the flight track. This mode provides global wave spectrum sampling and is suitable for measuring the wavelength and direction of ocean waves on a global scale. When no imaging command is received, the SAR function operates continuously in this mode.
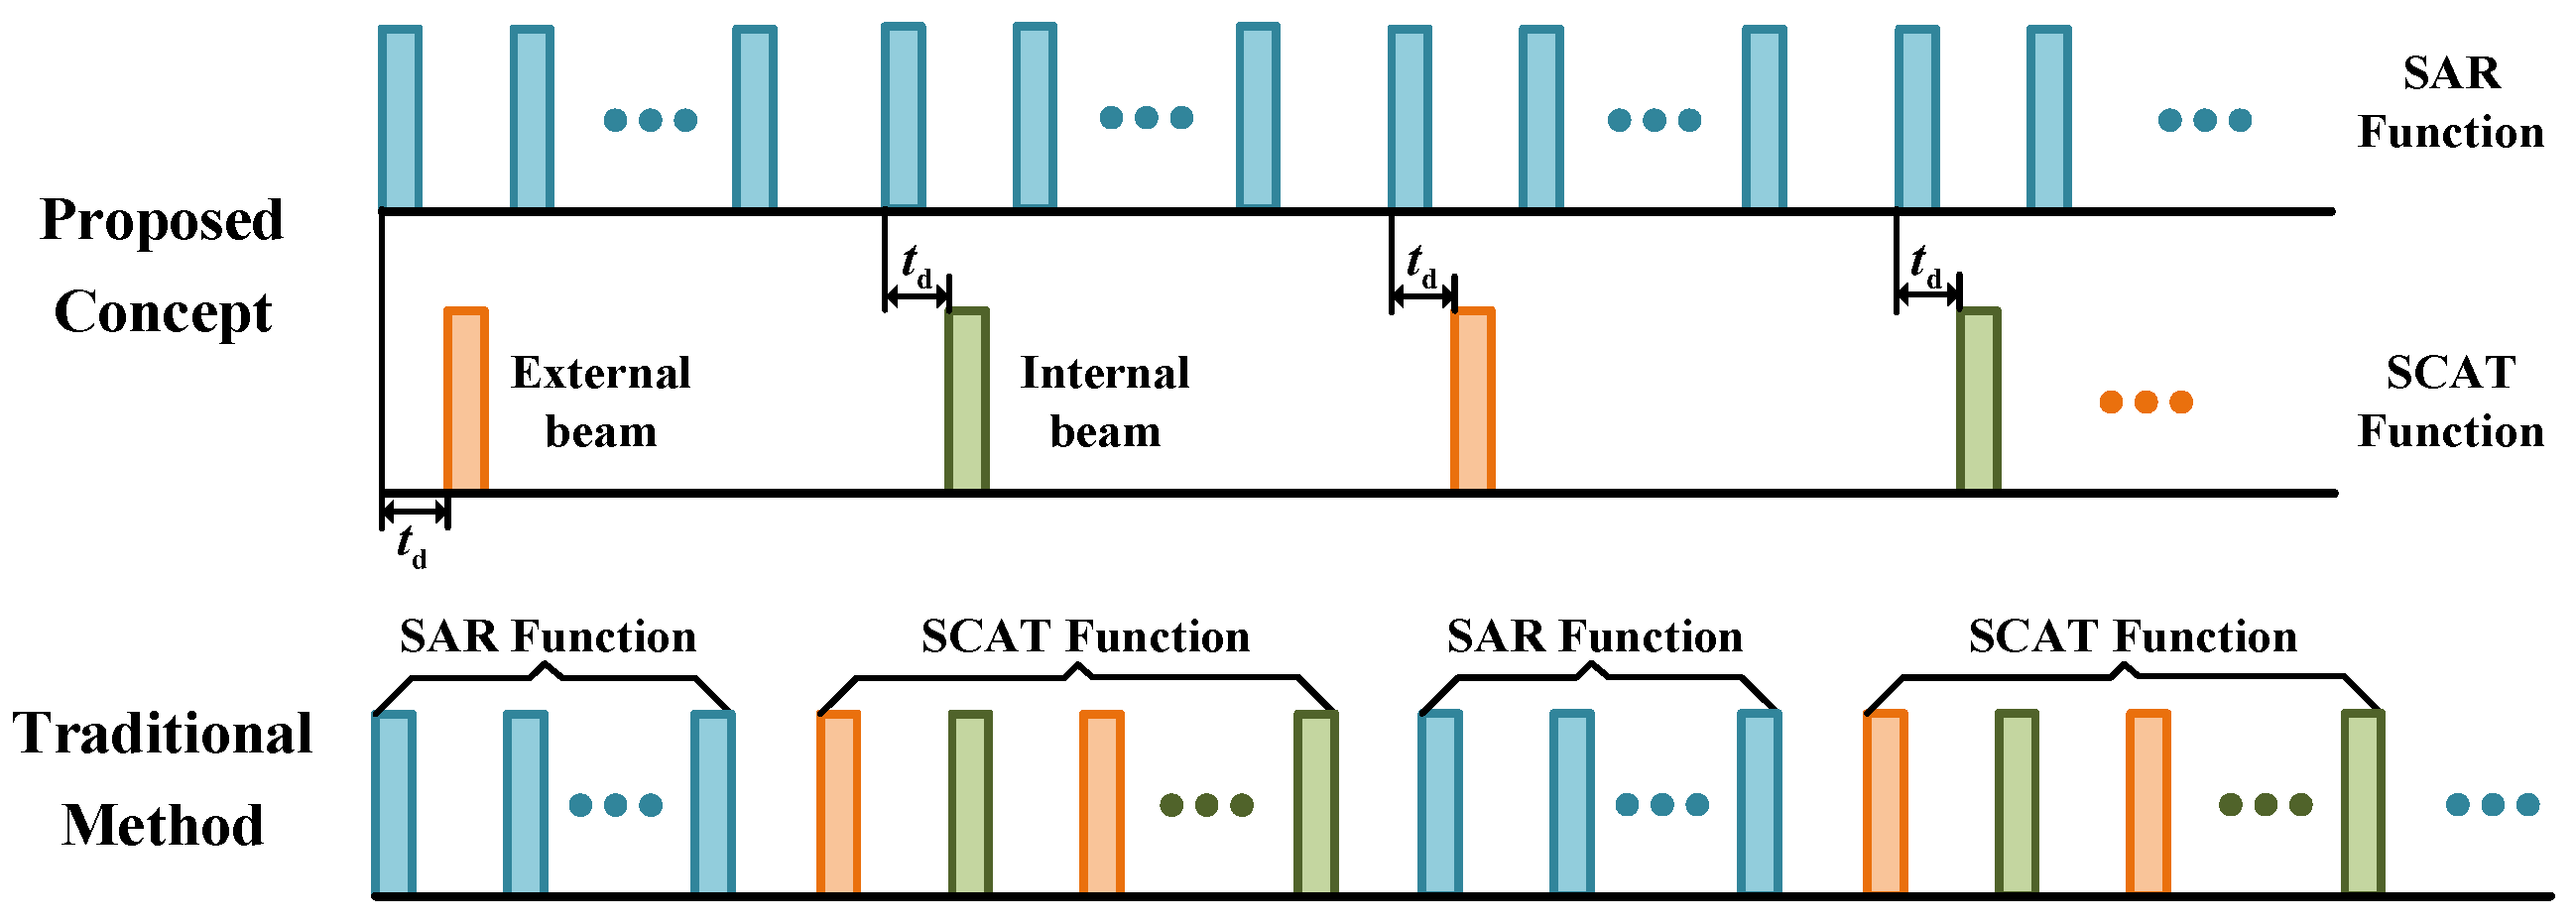
The two functions share a signal phased-array antenna and a set of transceiver systems. However, different from the traditional time division multiplexing method with a single antenna to realize multiple functions, the proposed concept realizes the two functions synchronously by alternately transmitting the pulses of the two functions. The difference between the proposed concept and the traditional concept is shown in Figure 2.
2.2. Observation Modes of the Concept
Combining the scientific requirements of the scatterometer and SAR functions described above, the new concept is designed with the four observation modes, and the schematic diagram of these observation modes is shown in Figure 3. The application scenarios and basic observation performance of the four modes are given below:
- Local Mode: This mode is utilized to retrieve the wind and wave fields at specific locations, such as a harbor or shallow banks. It provides high-resolution data for targeted areas.
- Regional Mode: This mode obtains wind and wave information for specific regions, such as coastlines. It offers a good balance between resolution and coverage.
- Global Mode1: This mode acquires high-resolution global wind and wave information, providing detailed insights into ocean dynamics across the planet.
- Global Mode2: This mode describes the global distribution of ocean winds and waves at a scale comparable to global climate models. Although it offers superior temporal resolution compared to Global Mode 1, the spatial resolution is coarser.
With reference to the existing scatterometer systems and SAR systems, such as SeaWinds [5], HY-2 [8], ERS-1\2 [22], and Sentinel-1A [29], the performance of the proposed concept must meet the needs of current ocean observation and should not be inferior to the existing system. Table 1 summarizes the resolution and swath requirements of the four observation modes. Notice that the ‘a × r’ represents ‘azimuth × range’, and the ‘I/O’ represents ‘inner beam/outer beam’.
2.3. Potentialities of the Proposed Concept
The potentialities of the proposed concept for ocean wind and wave observations is shown in Figure 4:
- High-precision, multi-resolution, and large-coverage ocean wind field:
- Complementarity of inversion results: The two functions provide complementary and corrective wind field information, ultimately leading to the retrieval of large-coverage, high-precision, and multi-scale wind fields.
- Enhanced inversion accuracy: The scatterometer function provides the necessary wind direction information when the SAR function retrieves high-resolution wind fields. This information is strictly synchronized with the SAR function in both time and space, offering a significant improvement over traditional external auxiliary data.
- Refined low-resolution wind fields: The low-resolution wind fields retrieved by the scatterometer function can be further refined by incorporating the high-resolution information obtained from the SAR function.
- High-precision, multi-resolution, and large-coverage ocean wave spectrum.
- Providing prior information: When theoretical algorithms are employed to retrieve wave direction spectrums from SAR images, the scatterometer function can provide essential prior information [38].
- Compensating for high wavenumber cutoff: the relationship between radar cross-section and wave parameters has been established in reference [39], which proved the ability of scatterometer to extract wave parameters. The scatterometer function can compensate for the loss of information caused by the high wavenumber cutoff that affects the SAR function [39].
- Evaluating and improving inversion accuracy: Comparing and verifying the wave parameters obtained from both functions allows for evaluation and improvement of the overall inversion accuracy.
3. Constraints of System Parameters
In order to facilitate the description, the subscripts 1, 2 are used to represent the SAR function and scatterometer function, respectively.
3.1. Frequency
The Ku band has been chosen as the operating frequency due to its favorable combination of engineering feasibility, overall electromagnetic compatibility, and suitability for ocean observation. Additionally, an isolation band must be established between the operating frequencies of the SAR and scatterometer functions to effectively separate their echoes. The relationship between the center frequencies of these functions can be expressed as
where denotes the center frequency, denotes the isolation band, and is the bandwidth, which is jointly determined by the incidence angle and the range resolution:
where is the light speed, is the range resolution, is the incidence angle of the near end of the beam.
3.2. Antenna Size
3.2.1. SAR Function
With regard to the SAR function, the antenna size is primarily limited by the following factors:
- Minimum antenna area: To avoid aliasing of echoes in both azimuth and range, a minimum antenna area is required [42].
- SNR: The larger the antenna size, the higher SNR of the echoes [43].
- Azimuth resolution: The azimuth resolution is inversely proportional to the antenna size. A smaller antenna size translates to finer details captured in the azimuth direction [43].
- Swath: As shown in the satellite observation geometry model in Figure 5, the swath of the SAR function is determined by the range beamwidth and incidence angle at a specific orbit altitude. A smaller range antenna size results in a wider range beam-width, leading to a wider swath. This relationship can be expressed as:where is the swath width, is the radius of the earth, and are the incidence angle of the far and near end of the beam, respectively, denotes the range beamwidth, and represent the elevation angle of the far and near end of the beam, respectively, , is the wavelength of electromagnetic wave, denotes the antenna size in range direction, and is the orbit height.
3.2.2. Scatterometer Function
With regard to the scatterometer function, the antenna size is primarily limited by the following factors:
- Spatial resolution: The spatial resolution is a key factor influencing the antenna size. The larger the antenna size, the smaller the beam footprint, resulting in higher spatial resolution [12].
- Coverage of the sea surface: Excessive increase of antenna size, that is, excessive reduction of footprint size, will affect the continuity of the coverage, and thus affect the inversion accuracy. Although increasing the PRF can ameliorate this problem, it also means a significant increase in power consumption, as well as increased sensitivity requirements for beam switching operations [42].
It is noticed that unlike the SAR function, the swath of the scatterometer function is not directly tied to the antenna size due to its conical scanning operation. Instead, it directly depends on the incidence angle.
3.3. Incidence Angle
In terms of the scatterometer function, as mentioned earlier, the desired swath is one of the factors that influent the incidence angle of the scatterometer function, as expressed by the formula
It can be seen that at a constant orbit altitude, the bigger the incidence angle, the wider the swath.
Additionally, the strength of the backscattering coefficient and its sensitivity to wind speed are also the main factors affecting the incidence angle of the scatterometer function. The scatterometer function retrieves sea surface wind speed based on the response of the backscattering coefficient to surface roughness under varying wind speeds. Figure 6 illustrates the changes of backscattering coefficient with different wind speeds and incidence angle. Obviously, the larger the incidence angle, the steeper the curve, indicating a higher sensitivity of the backscattering coefficient to wind speed variations. However, it is noteworthy that the sensitivity remains relatively constant when the incident angle is beyond 40 degrees. Conversely, the strength decreases with increasing incidence angle. Therefore, the incidence angle of the scatterometer function must be carefully selected to balance its impact on swath width, spatial distribution, and backscattering coefficient.
In terms of the SAR function, the incidence angle range falls between 20 and 50 degrees, satisfying the requirements for various oceanic applications. The specific value within this range can be dynamically chosen based on the location of the observation area and the selected observation mode.
3.4. Time Sequence
3.4.1. Constraints of the Working Principles
The SAR function requires that echoes have no ambiguity in both range and azimuth, which results in an upper and lower bound for the optional PRF. The scatterometer function demands a sufficiently large PRF to ensure that the footprint is continuous in the conical scanning direction, so as to achieve high-precision inversion of the wind field, but there is also a lower bound to avoid range ambiguity of the echo. In summary, the constraint of the working principles can be expressed as
where is the flight speed, is the size of the transmitting antenna in azimuth direction, is the PRF, denotes the slant distance, denotes the projection of the on the earth surface, denotes the azimuthal footprint size, represents the scanning speed of the beam in the conical scanning direction, that is, the rotational speed of the beam. affects the sampling density not only in the scanning direction, but also in the flight direction. In the flight direction, the beam footprint should also be continuous, generally overlapping half of the footprint. Therefore, should satisfy:
where is the footprint size at range direction.
Moreover, the ambiguity signal ratio is also the vital index used to evaluate the imaging quality of SAR function [42]. Usually, the range-ambiguity-signal ratio should be less than −20 dB, and the azimuth-ambiguity-signal ratio should be less than −18 dB, which is defined as the constraint .
3.4.2. Constraints of Transmitting Time
Despite sharing a common antenna, both functions can operate simultaneously through alternately transmitting pulses. In order to avoid the conflicts in transmitting time, the PRF of SAR function is designed as an integer multiple of scatterometer function, and there is a certain interval between the transmitting time of the initial pulses of the two functions. Figure 7 illustrates the diagram of the time sequence, and the constraint can be expressed as
where is the multiplier of the PRF of the SAR function with respect to which of the scatterometer function, and denote the minimum and maximum values of the optional PRFs, respectively, which can be obtained from constraints . is the delay, and the length cannot exceed the pulse repetition time (PRT) of the SAR function.
3.4.3. Constraints of Receiving Window
Both the transmitting and receiving signals are completed by the common antenna, resulting in the limitation that the radar cannot receive echoes during the period of pulse transmission. If the echo reaches the antenna during the period of pulse transmitting, the range blocking will occur, and this portion of the echo will be lost. Therefore, it is necessary to avoid the interferences shown in Figure 8, and the constraints can be deduced as
where , , represents the time length of the function from transmitting pulse to receiving echo, represents the echo window length, and represents the slant distance of the far and near end of the beam, respectively, , and represents rounding.
3.4.4. Constraints of Nadir Echo
Due to the radiation of the antenna sidelobe, a portion of the transmitted energy leaks towards the nadir region while illuminating the desired observation scene. Then, the specular reflection occurs because of the near-vertical incidence angle, which results in a strong nadir echo. Nadir echo appears as bright stripes on the radar images, can significantly impact the imaging results. Therefore, avoiding the nadir echo falling into the desired echo window is crucial. Then, the constraints of nadir echo can be expressed as
As shown in Figure 9, is the interval between the leading edge of the window of the expected echo and the emission time of the previous closest pulse, which can be expressed as , is the interval between the leading edge of the window of the nadir echo and the emission time of the previous adjacent pulse, which can be expressed as , where denotes the time the nadir echo reaches the antenna, denotes the window length of the nadir echo, .
3.4.5. Jointly Design Method of the PRFs
Figure 10 provides a flow chart for jointly designing the PRFs of two functions. The main steps are given below:
Step 1: Input system parameters such as antenna size, orbit height, incidence angles, eta., and initialize the to 1. is the index of PRF.
Step 2: Generate PRF vectors according to constraint , which can be expressed as , and the length of is denoted as .
Step 3: Determine the PRF of SAR function, .
Step 4: Determine the vector , which can be obtain from constraint , and update according to .
Step 5: Determine the PRF of the scatterometer function, .
Step 6: Judge whether the current PRFs of the two functions meet constraints , and . If not, add index by 1, and update . If yes, stop traversing , and the current and are the design results.
Step 7: Compare and . If , it means that the traversal of the vector is not finished, and return to step 5. If , return to the traversal of vector .
Step 8: Compare and . If , return to step 3. If , which indicates that there is no suitable PRF. At this point, the swath of the SAR function has to be shortened. Then, go back to the first step, and continue to find available PRF.
4. Discussion: Selection of the System Parameters
4.1. Frequency
With reference to the existing scatterometers [5], 13.4 GHz is selected as the carrier frequency of the scatterometer function in the Ku-band range, with a bandwidth of 0.5 MHz. As for the SAR function, according to formula 2, the bandwidth must be greater than 87.8 MHz to meet the requirement that the resolution of any beam position in strip-map mode is better than 5 m. Considering the redundancy, the bandwidth of SAR function is designed to be 90 MHz, and the carrier frequency of SAR function is 13.19 GHz. According to formula 1, it can be calculated that the frequency isolation band between the two functions is 164.75 MHz.
4.2. Antenna Size
Since the beam width of the range direction required by the two functions are close, the range antenna apertures of the two functions are determined to be equal, taking into account the simplicity of the system. However, SAR function requires a much larger azimuth antenna aperture than scatterometer function to achieve high resolution in azimuth. Thus, it is determined that the SAR function uses the entire large antenna to transmit and receive pulse, while the scatterometer function transmits pulses through a small sub-array, and receives echoes through the entire antenna, considering the SNR of the echoes.
Figure 11 illustrates the constraint curves for antenna size in the range direction under various orbital heights. The blue and orange lines represent the maximum allowable values for the SAR and scatterometer functions, respectively, while the yellow and green lines represent the minimum values. Point A indicates that when the orbital altitude is lower than 695 km, the two functions have conflicting requirements for antenna aperture, so an orbital height exceeding 695 km is necessitated. In addition, the antenna size should exceed the vertical coordinate corresponding to the broken line “ABC” and re-main below the vertical coordinate of line “AD”. Point B marks the lowest point on the broken line “ABC”, indicating the minimum range antenna size (0.82 m) achievable at an orbital altitude of 769 km.
4.3. Incidence Angle
Figure 12 shows the range of incidence angles of the inner and outer beams under different orbital heights. The red and blue dashed lines represent the maximum values of the outer and inner beams, respectively, which are derived from Equation (3), and the red and blue solid lines represent the minimum values of the outer and inner beams, respectively, which are obtained from Equation (4). Point E is relative to point A in Figure 8. It can be seen that the incident angles of both the inner and outer beams are all larger than 40 degrees, which means that the sensitivity of the backscattering coefficient to the change of wind speed is almost equal under the optional incidence angles. Therefore, taking into account the strength of the backscattering coefficients, the minimum values can be chosen as the incident angles for the outer beam.
The incidence angle of the inner beam should be significantly smaller than that of the outer beam for the following reasons: The scatterometer function uses two beams to scan the sea surface conically; thus, the scattering data from four directions can be obtained to invert the wind vector field. In order to reduce the ambiguity of wind direction inversion, it is preferable to choose the directions with large difference to increase the difference of echoes and thus improve the accuracy of wind direction inversion [36]. Of course, considering the swath, the difference in the incidence angles of inner and outer beams cannot be too large. Calculate the difference between the minimum incidence angles of the outer beam and the inner beam, and the value which is 7 degrees less than the incidence angle of the outer beam is selected as the incidence angle of the inner beam. Note that if these values are smaller than the minimum values for the inner beam in Figure 9, the minimum values are used instead. It can be seen that when the orbital altitude is 769 km, the incidence angles of the inner and outer beams are 48.3° and 55.3°, respectively.
4.4. Time Sequence
The PRFs of the scatterometer function and the SAR function in every observation mode are designed by using above method.
In order to show that the constraints on time sequence of the dual-function simultaneous operation is different from that of the single-function independent operation, the zebra map of single-function independent operation is first given, as shown in Figure 13. The blacked-out area indicates that the PRFs do not satisfy the constraints , and , and the white area indicates that the PRFs do. The horizontal coordinates of the yellow and blue lines represent the minimum PRF of scatterometer function and SAR function respectively, which can be obtained from constraint, and they are 123.1 Hz and 1407 Hz. It can be seen that there are many PRFs can be selected when the SAR function or the scatterometer function operates alone.
Figure 14 shows the design results of the Global Mode 2, the SAR function operates at the incident angle of 43 degrees. (a) and (b) are the zebra maps of the SAR function and the scatterometer function, respectively. Comparing with Figure 12, the black area increases obviously, which indicates that the number of available PRFs is severely reduced when both functions are operating simultaneously. The red and green short vertical lines represent the beam positions of SAR function and scatterometer function, respectively. They are all distributed in white area, which indicates that the design results meet all constraints. The PRF of SAR function is 11 times that of scatterometer function, and they are 1407 Hz and 127.9 Hz, respectively.
Figure 15 gives the design results of the Local Mode, the incident angle of the SAR function is 38 degrees. It can be seen that the PRFs of SAR function and scatterometer function are 1433 Hz and 130.3 Hz, respectively, and the former is 11 times of the latter. Comparing the locations marked by yellow boxes in Figure 14a and Figure 15a, and the locations in Figure 14b and Figure 15b, it can be seen that the constraints on time sequence are different when the beam positions are different.
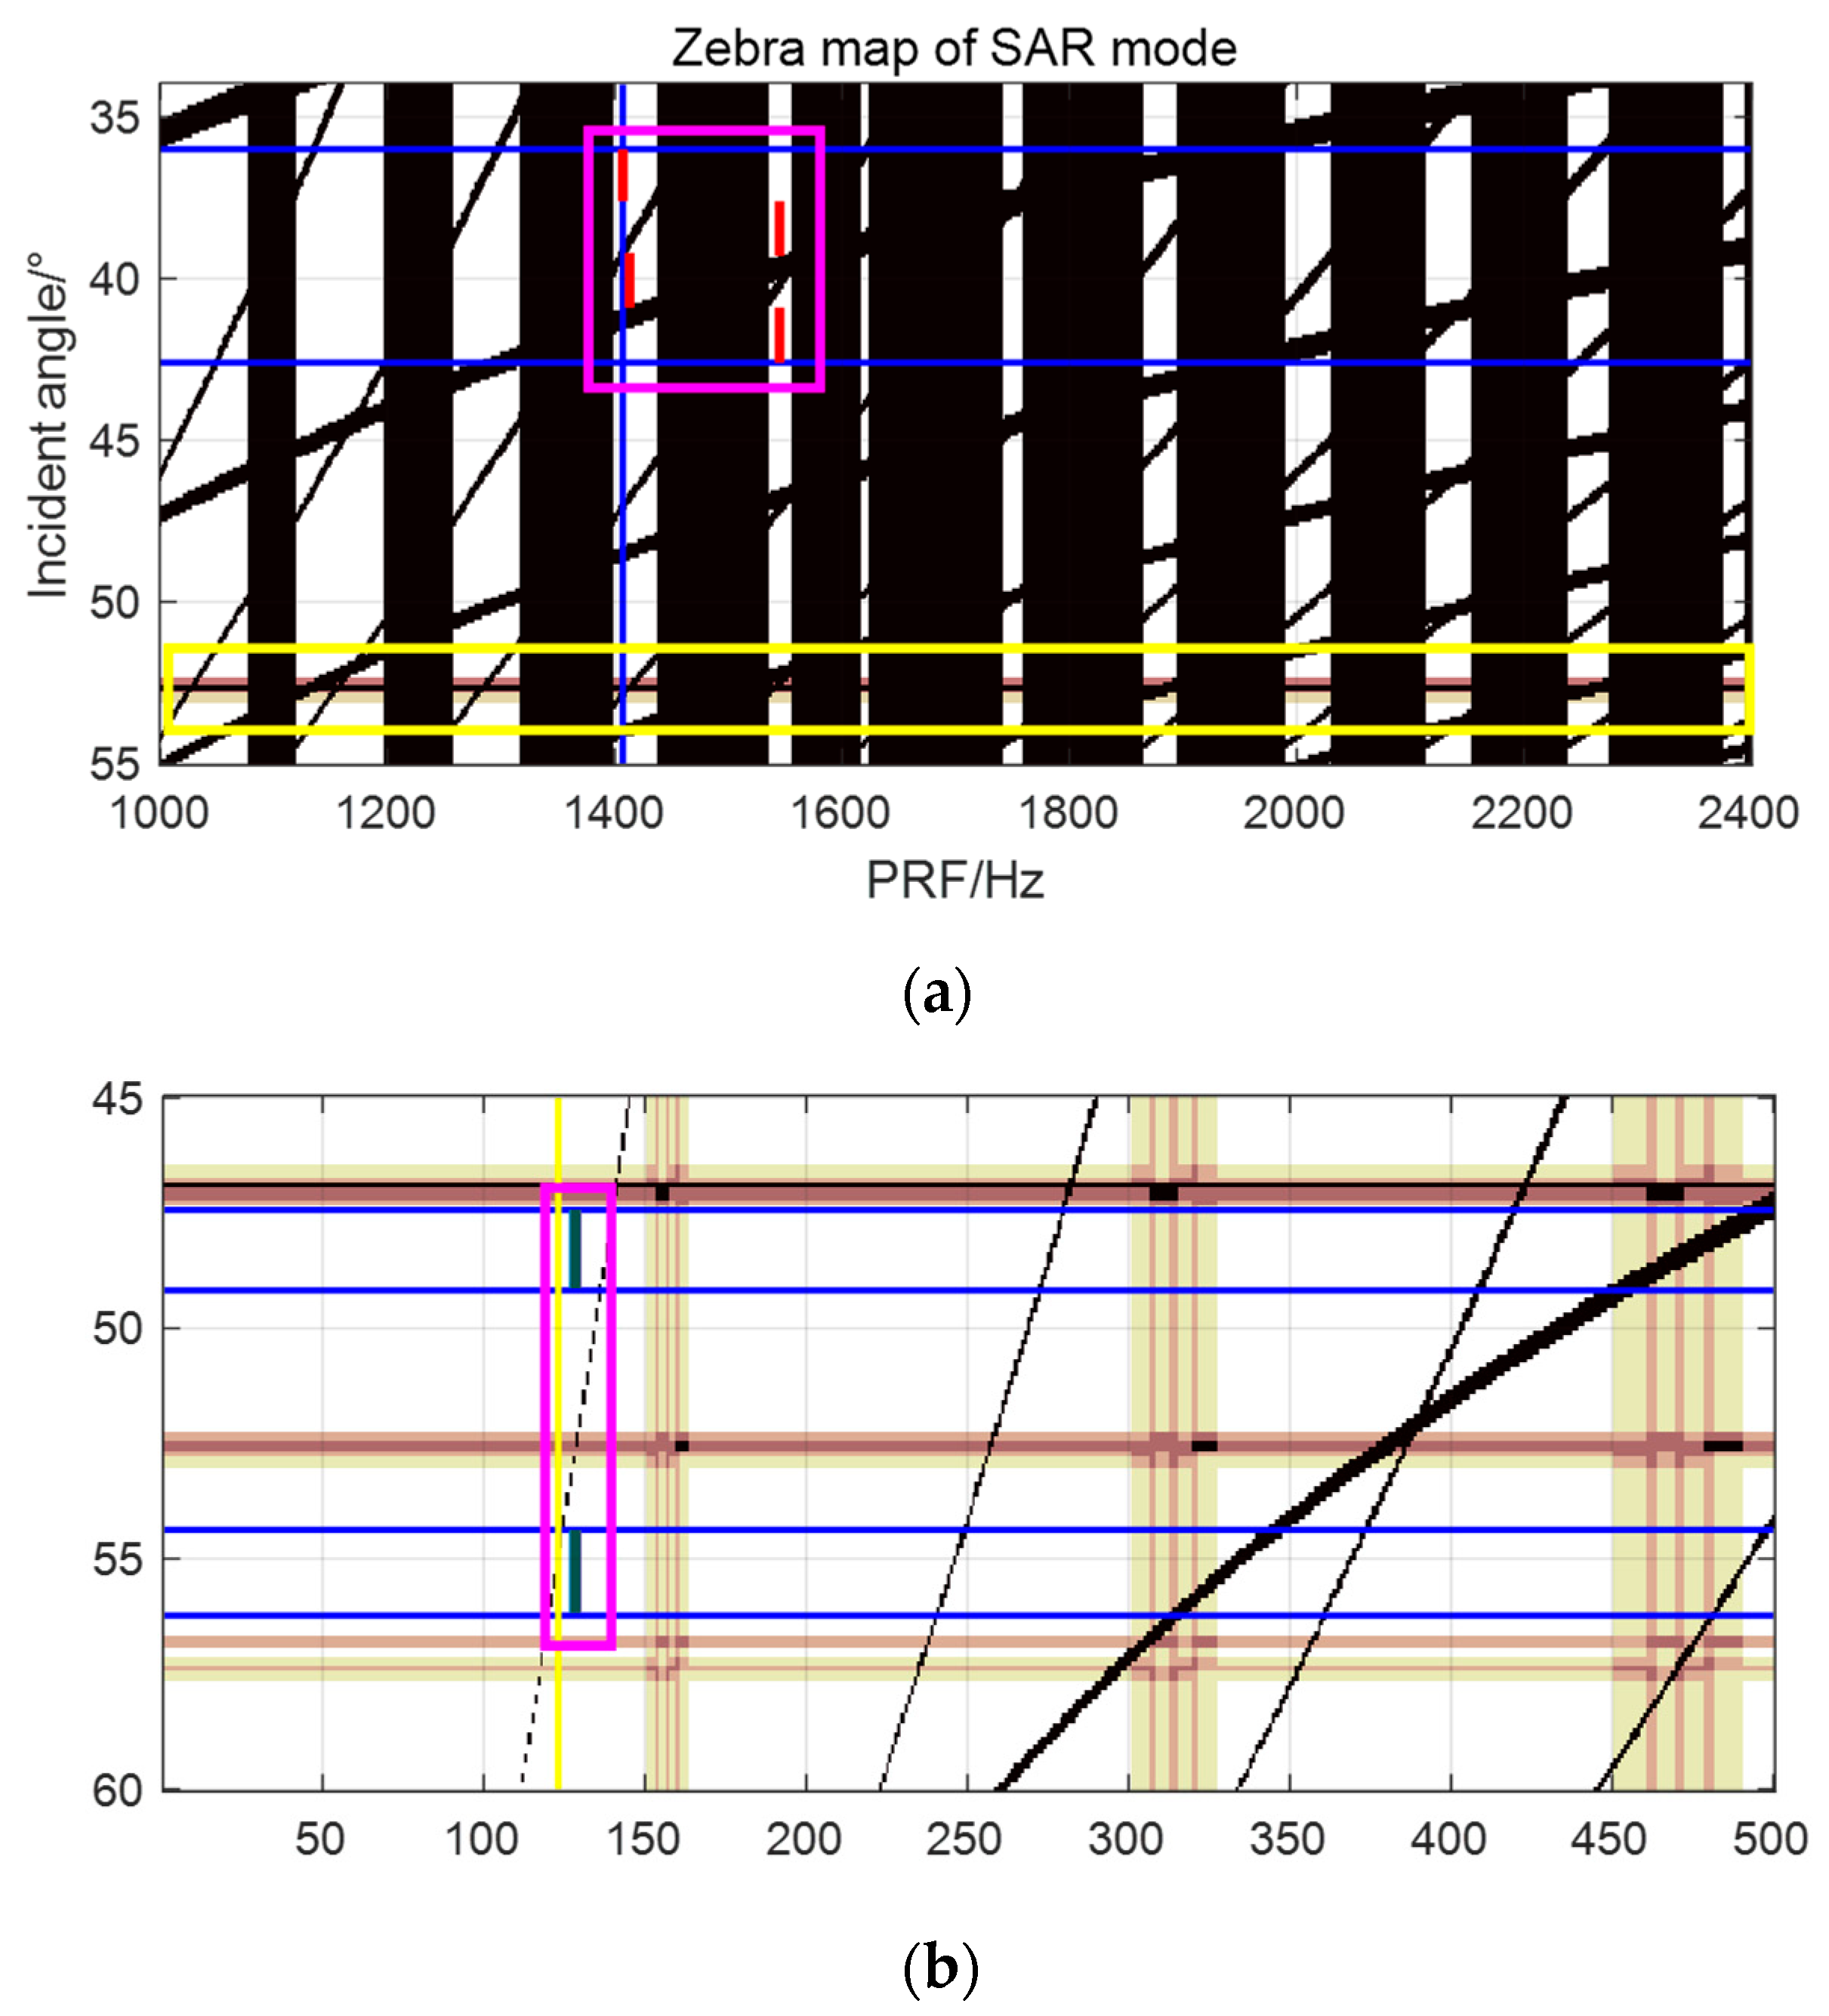
Figure 16 shows the design results of the Regional Mode, the incident angles of the SAR function range from 36 degrees to 42 degrees. (a) and (b) are the zebra maps of the SAR function and the scatterometer function, respectively. Different from the zebra maps in Figure 13 and Figure 14, except the black and white area, the brown area of different shades appears in the zebra maps. The reason for this difference is that the constraints on the time sequence are different under different beam positions, which is mentioned above. In order to reduce the length of the article, the zebra maps under all beam positions are no longer displayed one by one, but they are superimposed together to synthesize the new zebra maps. The brown area represents that at several beam positions, the PRFs are unusable, and the color depth depends on the number of beam positions. In Figure 16, the 4 red short vertical lines indicate that 4 beam positions are required to cover a range of incidence angles from 36 to 42 degrees. The PRFs of SAR function are 1407 Hz, 1545 Hz, 1413 Hz and 1545 Hz. The corresponding PRFs of scatterometer function are 127.9 Hz, 128.8 Hz, 128.5 Hz, and 128.8 Hz.
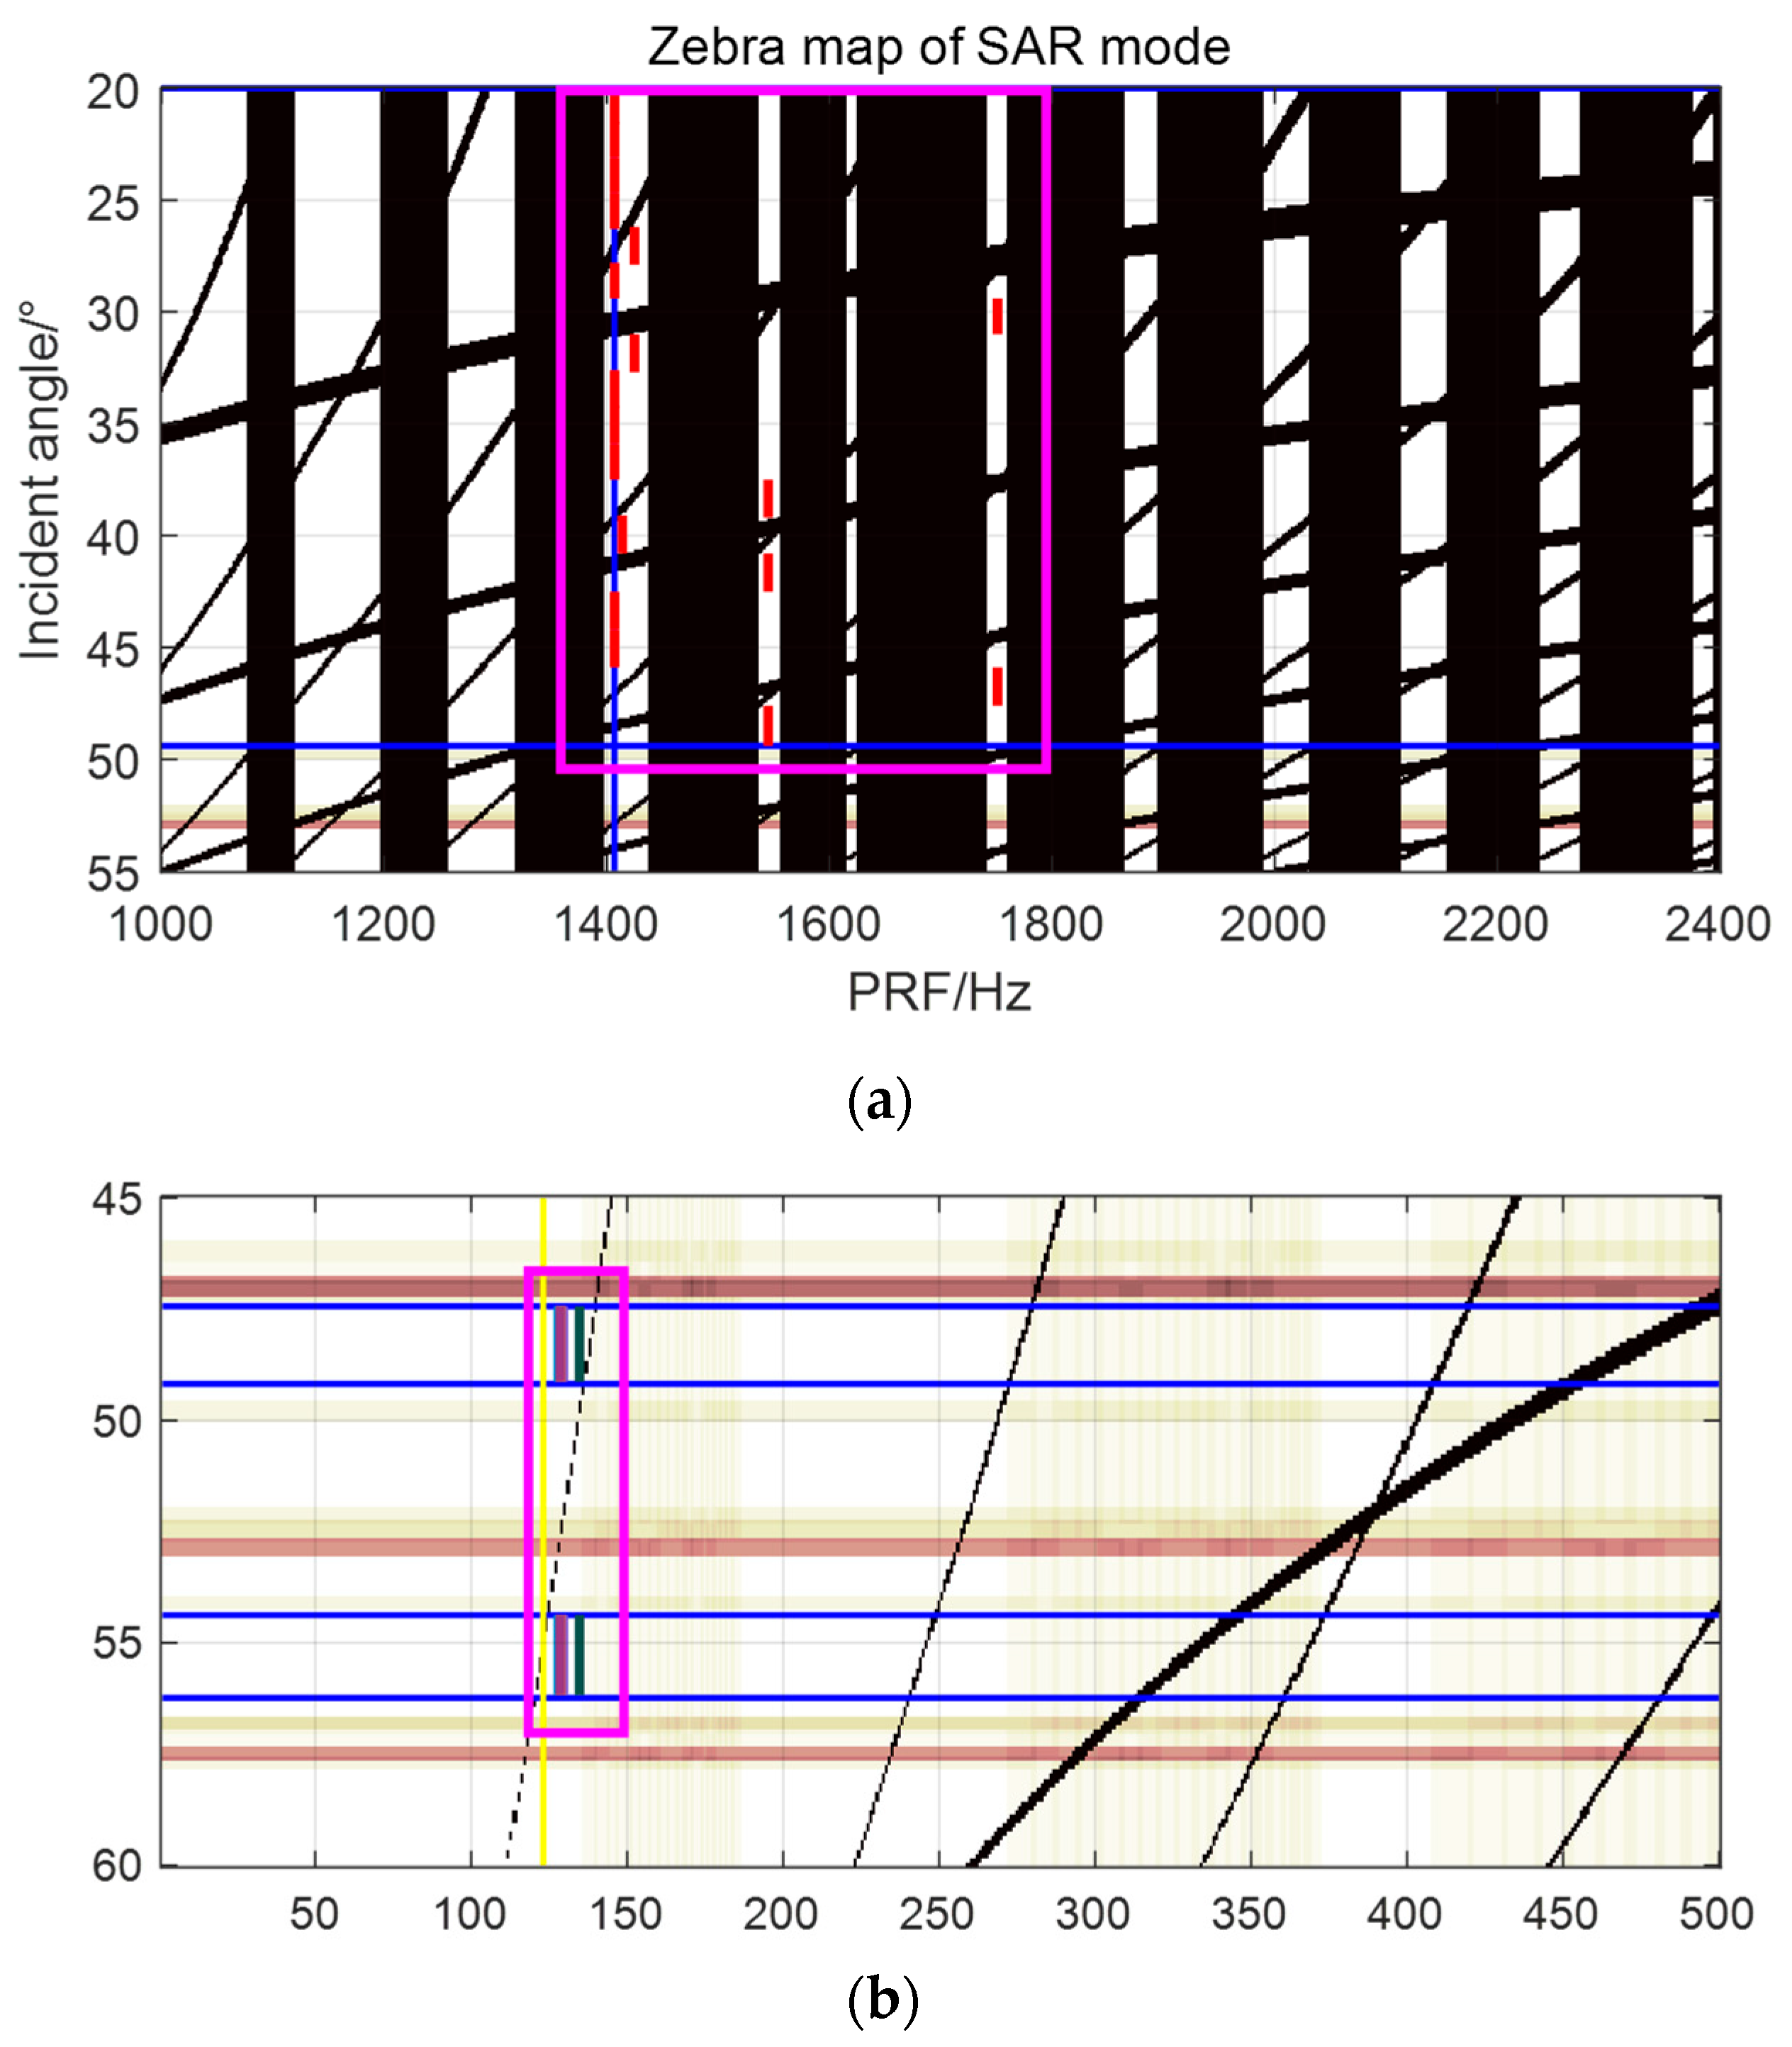
Figure 17 shows the results for the Global Mode1. The 18 beam positions are required to cover the wide swath (covers the incidence angles from 20 to 48 degrees). It is worth noting that the simulation parameters of the Figure 14, Figure 15, Figure 16 and Figure 17 are given in Table 2.
Table 2 shows the system parameters and observational performances of the proposed sensor. They are designed to achieve large-coverage, high-precision, and multi-resolution ocean wind and wave observation, combining the advantages and characteristics of typical satellites such as Seawinds, HY-2, CFOSAT, ERS, TerraSAR, and GF-3. Since the inversion accuracy needs to be obtained through data processing, and the required data cannot be obtained at present, the specific inversion accuracy is not given in Table 2 to ensure the authenticity and rigor of the work of the paper. However, there is no doubt that combining the data of multiple functions that are highly synchronized in time and space to invert ocean wind and wave, the inversion accuracy has obvious advantages compared with single-function sensors.
5. Conclusions
This paper has proposed a new concept for the observation of ocean winds and waves, namely, a spaceborne ocean microwave dual-function integrated sensor. It integrates the scatterometer and SAR into a sensor by sharing a phased-array antenna to realize the synchronous observation of ocean winds and waves with wide coverage, high precision and multiple scales. The selection principles of parameters such as frequency, antenna size and incidence angle have been analyzed. The constraints on the pulse transmitting-and-receiving time sequence are also deduced to achieve the two functions at the same time, and the design method of PRF has been verified through four simulations with different observation performance. The table of system parameters has been also showed to facilitate the readers to fully understand the new concept. It should be noted that since the proposed concept is a completely innovative technology, its actual observation performances, such as the inversion accuracy of ocean wind and wave, need to be verified by appropriate observation.
Author Contributions
H.L. had the research idea, and wrote the manuscript, conducted the theoretical analyses, and verify the proposed method. W.L. was involved in the research design, and contributed to revising the manuscript. G.S. and C.C. were involved in the improvement of the proposed method. M.X., Z.Z. and J.Z. contributed to revising and improving the research. All authors have read and agreed to the published version of the manuscript.
Funding
This research was funded by the State Key Program of National Natural Science China under the Grant 61931025, and in part by the Fund of Technology Innovation Center for Ocean Telemetry, Ministry of Natural Resources under the Grant NO.2023001, and in part by the National Natural Science Foundation of China under the Grant 62101404 & 62222113.
Data Availability Statement
No new data were created or analyzed in this study. Data sharing is not applicable to this article.
Conflicts of Interest
The authors declare no conflicts of interest.
References
- Ho, C.R.; Liu, A.K. Preface: Remote Sensing Applications in Ocean Observation. Remote Sens. 2023, 15, 415. [Google Scholar] [CrossRef]
- Li, X.F.; Zhang, B.; Yang, X. Remote Sensing of Sea-Surface Wind and Wave from Spaceborne Synthetic Aperture Radar. J. Radar 2020, 9, 425–443. [Google Scholar]
- Amani, M.; Moghimi, A.; Mirmazloumi, S.M.; Ranjgar, B.; Ghorbanian, A.; Ojaghi, S.; Ebrahimy, H.; Naboureh, A.; Nazari, M.E.; Mahdavi, S.; et al. Ocean remote sensing techniques and applications: A review. Water 2022, 14, 3400. [Google Scholar] [CrossRef]
- Ahmad, H. Applications of Remote Sensing in Oceanographic Research. Int. J. Oceanogr. Aquac. 2019, 3, 000159. [Google Scholar] [CrossRef]
- Spencer, M.W.; Wu, C.; Long, D.G. Improved Resolution Backscatter Measurements with the SeaWinds Pencil-beam Scatterometer. IEEE Trans. Geosci. Remote Sens. 2000, 38, 89–104. [Google Scholar] [CrossRef]
- Breivik, Ø.; Mogensen, K.; Bidlot, J.R.; Balmaseda, M.A.; Janssen, P.A. Surface Wave Effects in the NEMO Ocean Model: Forced and Coupled Experiments. J. Geophys. Res. Oceans 2015, 120, 2973–2992. [Google Scholar] [CrossRef]
- Schroeder, L.C.; Boggs, D.H.; Dome, G.; Halberstam, I.M.; Jones, W.L.; Pierson, W.J.; Wentz, F.J. The Relationship between Wind Vector and Normalized Radar Cross Section Used to Derive SEASAT-A Satellite Scatterometer Winds. J. Geophys. Res. Oceans 1982, 87, 3318–3336. [Google Scholar] [CrossRef]
- Wang, J. A Study of HY-2A Satellite Microwave Scatterometer Sea-Surface High-Wind Field Retrieval Model; Guangzhou University: Guangzhou, China, 2017; p. 1314. [Google Scholar]
- Liu, W.K.; Budillon, A.; Pascazio, V.; Schirinzi, G.; Xing, M.D. Performance Improvement for SAR Tomography based on Local Plane Model. IEEE J. Sel. Topics Appl. Earth Observ. Remote Sens. 2022, 15, 2298–2310. [Google Scholar] [CrossRef]
- Hersbach, H.; Stoffelen, A.; de Haan, S. An Improved C-band Scatterometer Ocean Geophysical Model Function: CMOD5. Geophys. Res. Oceans 2007, 112, C03006. [Google Scholar] [CrossRef]
- Wu, C.; Liu, Y.; Kellogg, K.H.; Pak, K.S.; Glenister, R.L. Design and Calibration of the SeaWinds Scatterometer. IEEE Trans. Aerosp. Electron. Syst. 2003, 39, 94–109. [Google Scholar]
- Grantham, W.; Bracalente, E.; Jones, W.; Johnson, J. The SEASAT-A satellite Scatterometer. IEEE J. Ocean. Eng. 1977, 2, 200–206. [Google Scholar] [CrossRef]
- Bao, Q.L.; Dong, X.L.; Zhu, D.; Xu, X.O. Ocean Surface Current Measurement Using Rotating Pencil-Beam Scatterometer. Acta Electron. Sin. 2015, 43, 1200–1204. [Google Scholar] [CrossRef]
- Wang, K.; Hong, J.; Zhang, W.; Zhang, Y.; Hui, Y.; Ming, F. Method of SAR Retrieving Ocean Surface Wind in Near Shore. J. Electron. Inf. Technol. 2013, 35, 1800–1805. [Google Scholar] [CrossRef]
- Liu, W.K.; Sun, G.-C.; Xing, M.D.; Pascazio, V.; Chen, Q.; Bao, Z. 2-D Beam Steering Method for Squinted High-Orbit SAR Imaging. IEEE Trans. Geosci. Remote Sens. 2021, 59, 4827–4840. [Google Scholar] [CrossRef]
- He, Y.; Shen, H.; Perrie, W. Remote Sensing of Ocean Waves by Polarimetric SAR. J. Atmos. Ocean. Technol. 2006, 23, 1768–1773. [Google Scholar] [CrossRef]
- Krieger, G.; Younis, M.; Huber, S.; Bordoni, F.; Patyuchenko, A.; Kim, J.; Laskowski, P.; Villano, M.; Rommel, T.; Lopez-Dekker, P.; et al. Digital Beamforming and MIMO SAR: Review and New Concepts. In Proceedings of the EUSAR 2012, Nuremberg, Germany, 23–26 April 2012; pp. 11–14. [Google Scholar]
- Gao, Y.; Wang, Y.; Wang, W. A New Approach for Ocean Surface Wind Speed Retrieval Using Sentinel-1 Dual-Polarized Imagery. Remote Sens. 2023, 15, 4267. [Google Scholar] [CrossRef]
- Hamze-Ziabari, S.M.; Foroughan, M.; Lemmin, U.; Barry, D.A. Monitoring Mesoscale to Submesoscale Processes in Large Lakes with Sentinel-1 SAR Imagery: The Case of Lake Geneva. Remote Sens. 2022, 14, 4967. [Google Scholar] [CrossRef]
- Klemas, V. Remote Sensing Techniques for Studying Coastal Ecosystems: An Overview. J. Coast. Res. 2011, 27, 2–17. [Google Scholar]
- Frison, P.L.; Mougin, E. Use of ERS-1 Wind Scatterometer Data Over Land Surfaces. IEEE Trans. Geosci. Remote Sens. 1996, 34, 550–560. [Google Scholar] [CrossRef]
- Stoffelen, A.; Anderson, D.L.T. Wind Retrieval and ERS-1 Scatterometer Radar Backscatter Measurements. Adv. Space Res. 1993, 13, 53–60. [Google Scholar] [CrossRef]
- Liu, W.K.; Sun, G.-C.; Xia, X.G.; Xing, M.D.; Fu, J.X.; Bao, Z. Focusing Challenges of Ships with Oscillatory Motions and Long Coherent Processing Interval. IEEE Trans. Geosci. Remote Sens. 2020, 59, 6562–6572. [Google Scholar] [CrossRef]
- Jiang, X.; Lin, M.; Liu, J.; Zhang, Y.; Xie, X.; Peng, H.; Zhou, W. The HY-2 Satellite and Its Preliminary Assessment. Int. J. Digit. Earth 2012, 5, 266–281. [Google Scholar] [CrossRef]
- Zhang, D.; Zhang, Y.; Hu, T.; Xie, B.; Xu, J. A Comparison of HY-2 and Quik-SCAT Vector Wind Products for Tropical Cyclone Track and Intensity Development Monitoring. IEEE Geosci. Remote Sens. Lett. 2014, 11, 1365–1369. [Google Scholar] [CrossRef]
- Hauser, D.; Soussi, E.; Thouvenot, E.; Rey, L. SWIMSAT: A Real-Aperture Radar to Measure Directional Spectra of Ocean Waves from Space-Main Characteristics and Performance Simulation. J. Atmos. Ocean. Technol. 2001, 18, 421–437. [Google Scholar] [CrossRef]
- Alpers, W.R.; Ross, D.B.; Rufenach, C.L. On the Detectability of Ocean Surface Waves by Real and Synthetic Aperture Radar. J. Geophys. Res. Oceans 1981, 86, 6481–6498. [Google Scholar] [CrossRef]
- Zhu, D.; Dong, X.; Yun, R.; Xu, X. Recent Advances in Developing the CFOSAT Scatterometer. In Proceedings of the IGARSS 2016, Beijing, China, 10–15 July 2016; pp. 5801–5803. [Google Scholar]
- Aouf, L.; Hauser, D.; Tison, C.; Mouche, A. Perspectives for Directional Spectra Assimilation: Results from A Study based on Joint Assimilation of CFOSAT Synthetic Wave Spectra and Observed SAR Spectra from Sentinel-1A. In Proceedings of the IGARSS 2016, Beijing, China, 10–15 July 2016; pp. 5820–5822. [Google Scholar]
- López-Dekker, P.; Rott, H.; Prats-Iraola, P.; Chapron, B.; Scipal, K.; De Witte, E. Harmony: An Earth explorer 10 mission candidate to observe land, ice, and ocean surface dynamics. In Proceedings of the IGARSS 2019 Symposium, Yokohama, Japan, 28 July–2 August 2019; pp. 8381–8384. [Google Scholar]
- Boccia, V.; De Witte, E.; Roselló, J.; Tossaint, M.; Donlon, C.J.; Scipal, K.; Bibby, D. StereoSAR: A multi-static SAR mission concept to enhance Sentinel-1 capabilities for measuring ocean dynamics. Sens. Syst. Next-Gener. Satell. 2017, 10423, 78–97. [Google Scholar]
- Lopez-Dekker, P.; Chapron, B.; Johnsen, H. Observations of Sea Surface Winds and Sea Surface Deformation with the Harmony Mission. In Proceedings of the EUSAR 2021, Online, 29 March–1 April 2021; pp. 1–4. [Google Scholar]
- Zhang, G.; Zhao, Y. Phased Array Radar Technology; Publishing House of Electronics Industry: Beijing, China, 2006; pp. 1–10. [Google Scholar]
- Qian, H.J.; Zhou, J.; Yang, B.; Luo, X. A 4-Element Digital Modulated Polar Phased-Array Transmitter with Phase Modulation Phase-Shifting. IEEE J. Solid-State Circuits 2021, 56, 3331–3347. [Google Scholar] [CrossRef]
- Dogan, D.; Gultepe, G. A Beamforming Method Enabling Easy Pack-Aging of Scalable Architecture Phased Arrays. In Proceedings of the PAST 2016, Waltham, MA, USA, 18–21 October 2016. [Google Scholar]
- Hauser, D.; Tourain, C.; Hermozo, L.; Alraddawi, D.; Aouf, L.; Chapron, B.; Tran, N. New Observations from the SWIM Radar On-Board CFOSAT: Instrument Validation and Ocean Wave Measurement Assessment. IEEE Trans. Geosci. Remote Sens. 2020, 59, 5–26. [Google Scholar] [CrossRef]
- Wang, T.; Li, X.; Zhang, G.; Lin, M.; Deng, M.; Cui, H.; Yuan, X. Large-scale orthorectification of GF-3 SAR images without ground control points for China’s land area. IEEE Trans. Geosci. Remote Sens. 2022, 60, 1–17. [Google Scholar] [CrossRef]
- Wan, Y.; Liu, Y. Research on Wind Field Joint Inversion Method Based on Microwave Multi-Load Complementary Advantages. J. Ocean. Technol. 2022, 41, 58–65. [Google Scholar]
- Wan, Y.; Zhang, X.; Fan, C.; Qu, R.; Ma, E. A Joint Method for Wave and Wind Field Parameter Inversion Combining SAR with Wave Spectrometer Data. Remote Sens. 2022, 14, 3601. [Google Scholar] [CrossRef]
- Wang, J. The Research of Retrieving Wave Information from GF-3 SAR Wave Mode Images; Zhejiang Ocean University: Zhoushan, China, 2019. [Google Scholar]
- Chen, Q.; Liu, W.K.; Sun, G.-C.; Chen, X.X.; Han, L.; Xing, M.D. A Fast Cartesian Back-Projection Algorithm Based on Ground Surface Grid for GEO SAR Focusing. IEEE Trans. Geosci. Remote Sens. 2022, 60, 1–14. [Google Scholar] [CrossRef]
- Zhang, Q.J. Satellite Polarization Microwave Remote Sensing Technology; Chinese Astronautics Industry in Beijing: Beijing, China, 2015; pp. 46–54. [Google Scholar]
- Xing, M.D.; Sun, G.-C.; Wang, T. Synthetic Aperture Radar Imaging Technology; Publish House of Electronics Industry: Beijing, China, 2024; pp. 99–100. [Google Scholar]
Figure 1.
Operation principle of the scatterometer. Orange and green ellipses respectively represent the footprint of the inner and outer beams.
Figure 1.
Operation principle of the scatterometer. Orange and green ellipses respectively represent the footprint of the inner and outer beams.
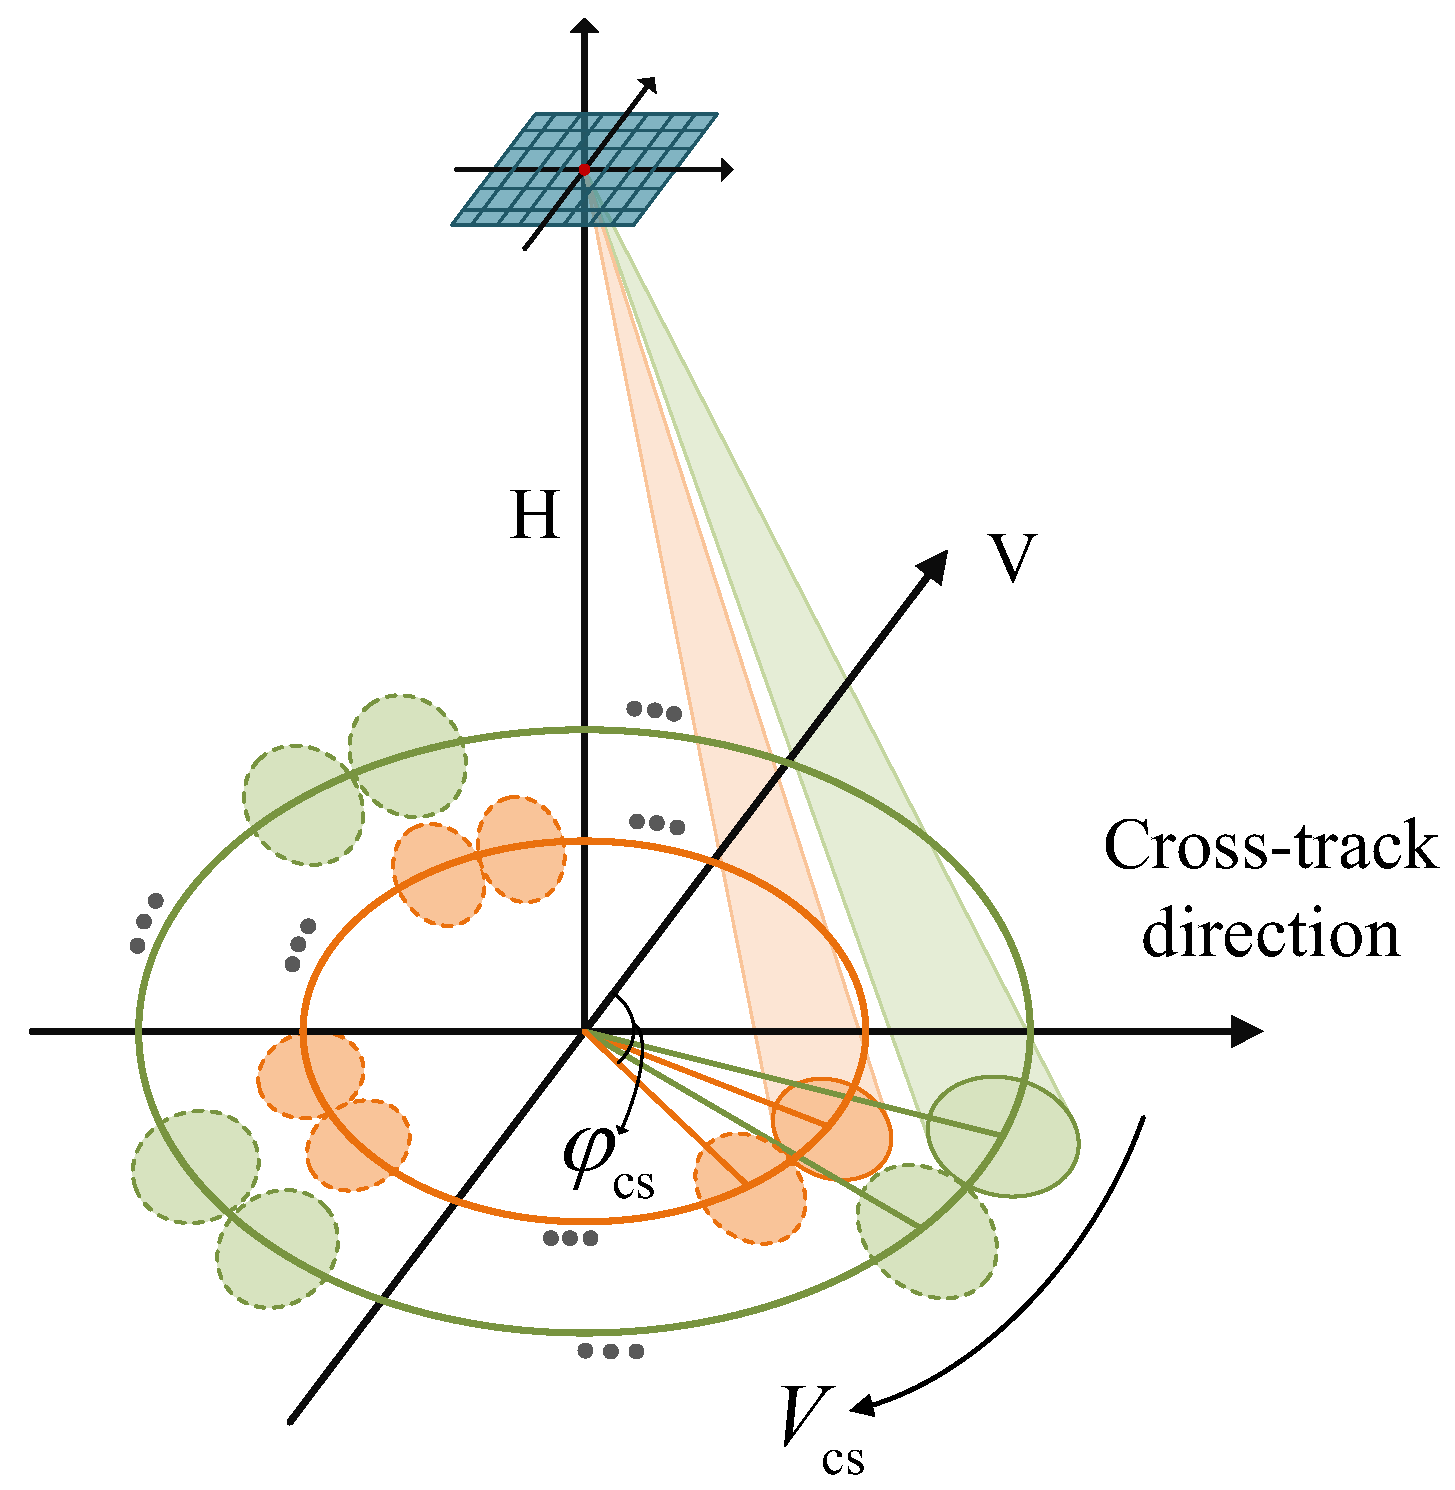
Figure 2.
Different operation principles between the proposed concept and the traditional concept.

Figure 3.
Observation modes of the spaceborne ocean microwave dual-function integrated sensor. The orange and green spirals respectively represent the scanning footprints of the scatterometer’s inner and outer beams. The yellow boxes represent the coverages of the SAR function.
Figure 3.
Observation modes of the spaceborne ocean microwave dual-function integrated sensor. The orange and green spirals respectively represent the scanning footprints of the scatterometer’s inner and outer beams. The yellow boxes represent the coverages of the SAR function.
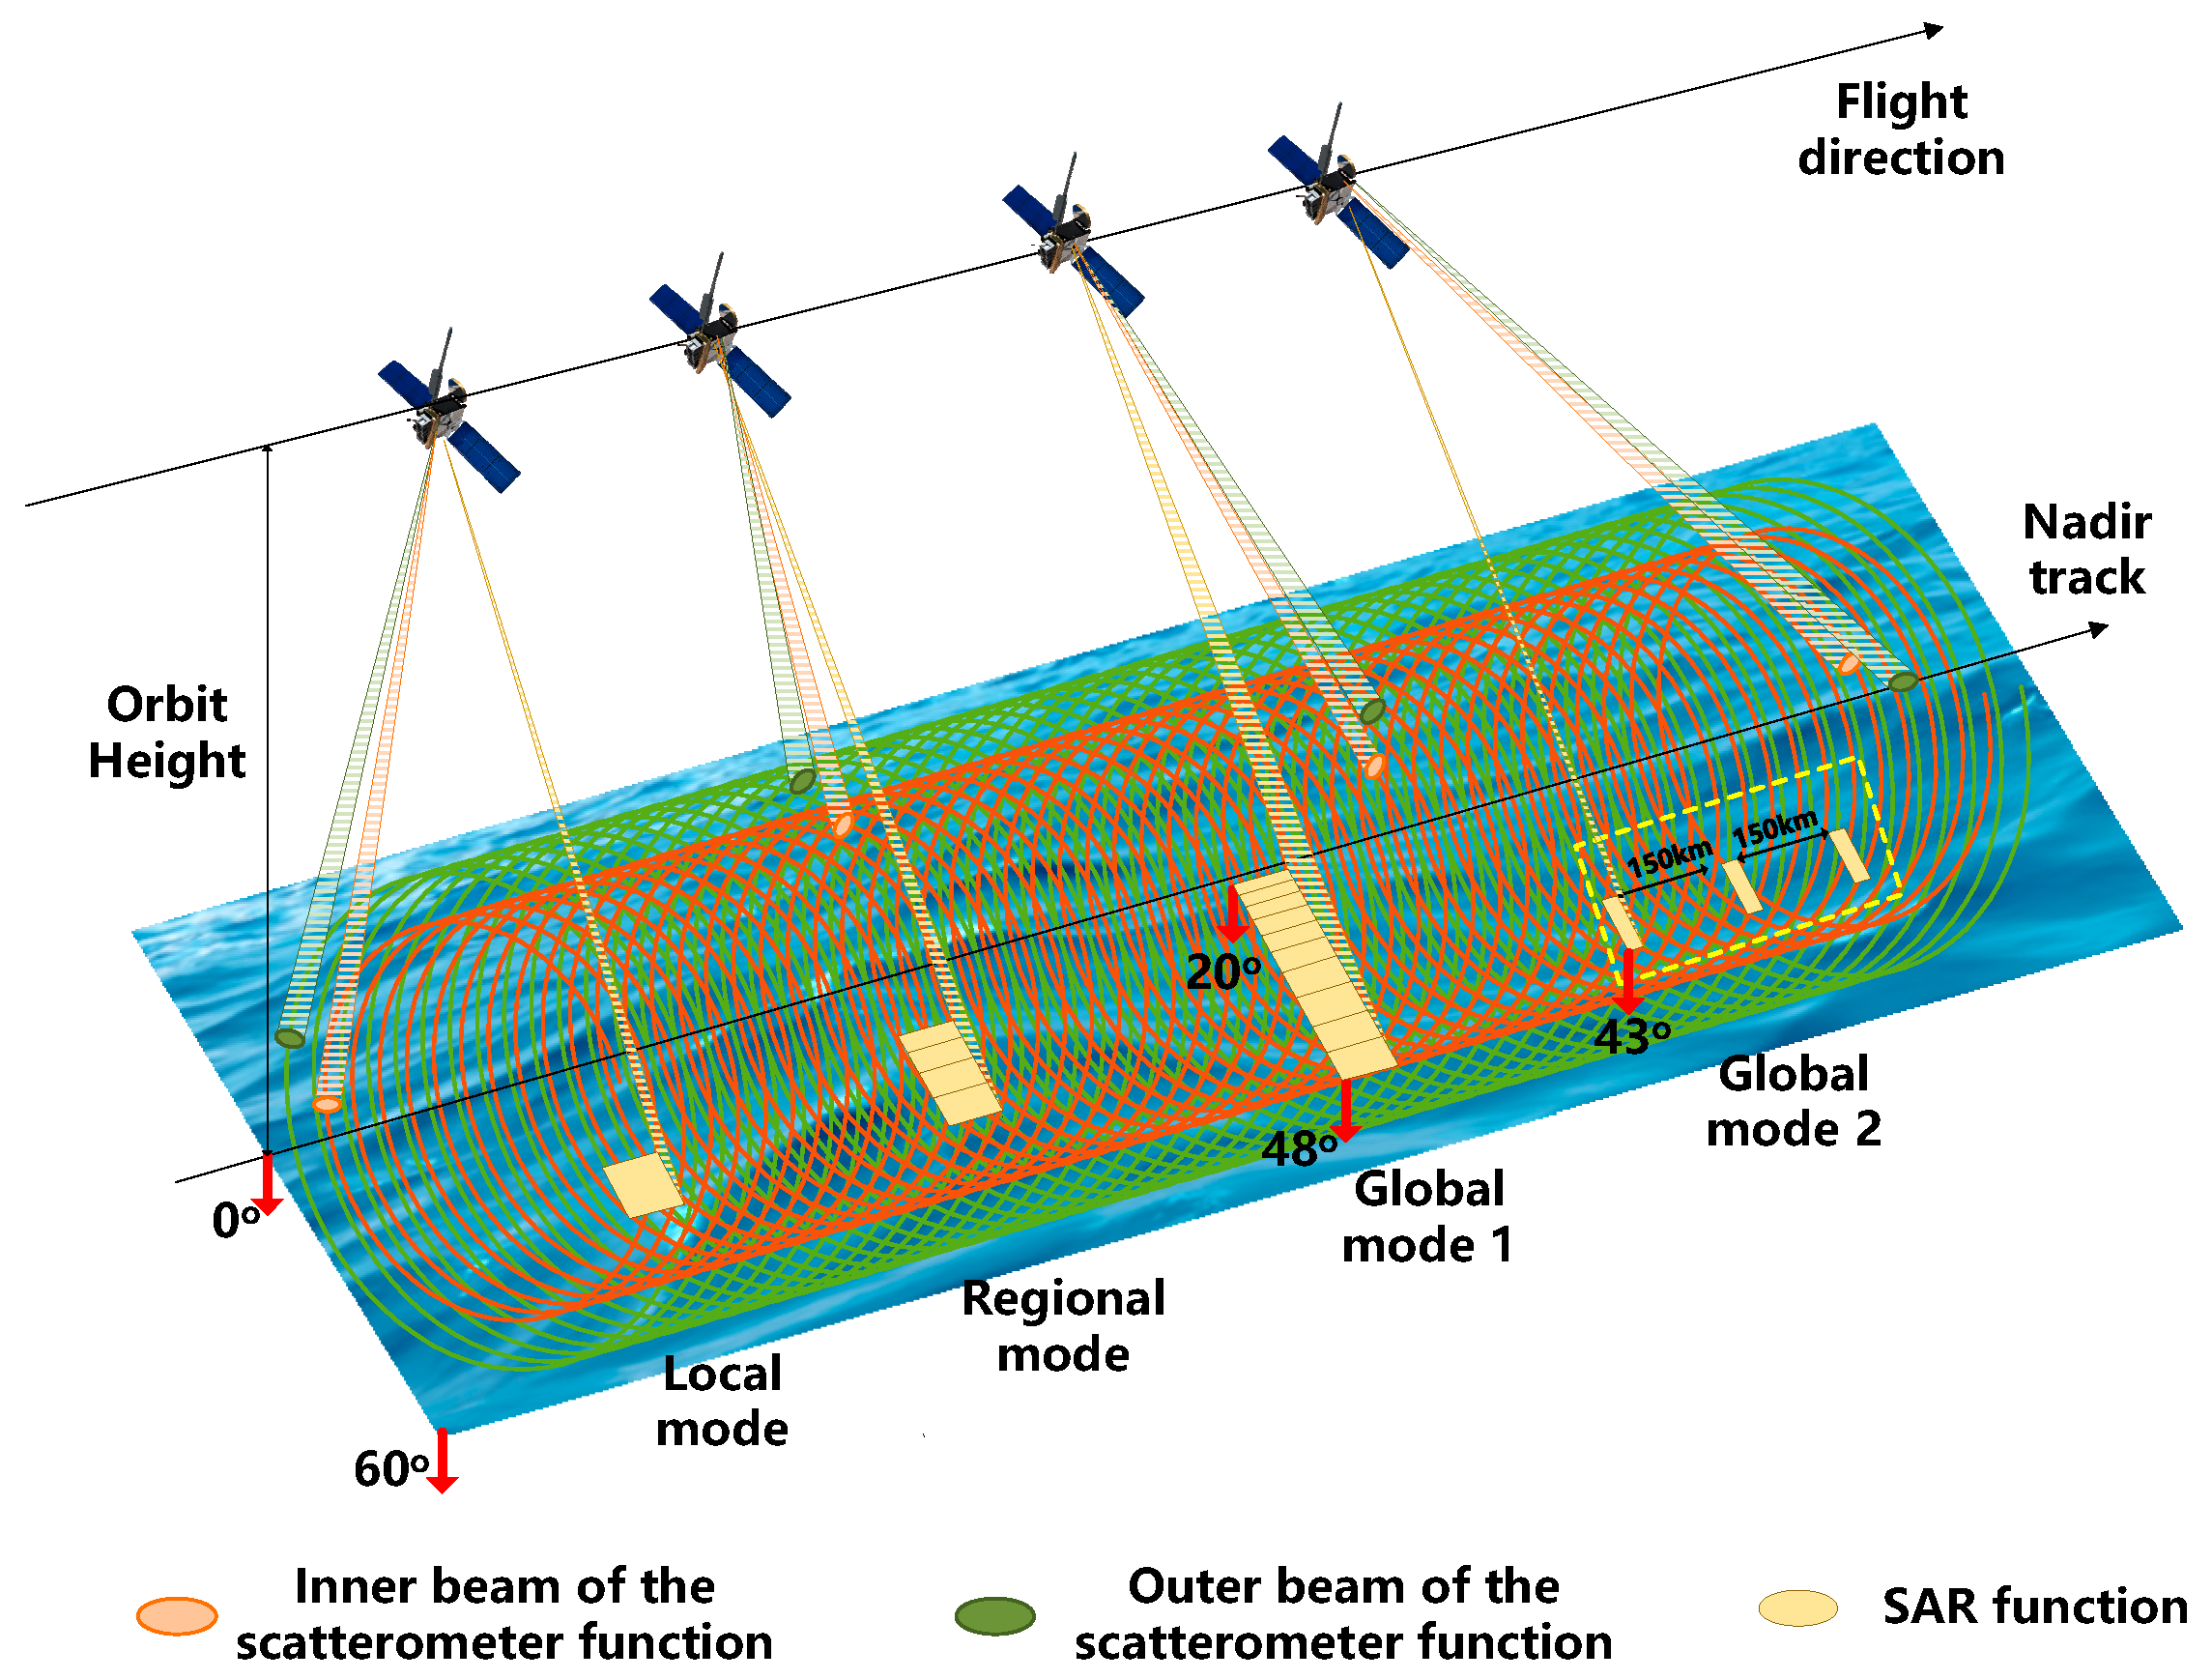
Figure 4.
Potentialities of the proposed sensor for ocean wind and wave observation. The dashed arrows represent operations related to the single function, and the solid arrows represent dual functions.
Figure 4.
Potentialities of the proposed sensor for ocean wind and wave observation. The dashed arrows represent operations related to the single function, and the solid arrows represent dual functions.

Figure 5.
Star-ground geometrical model.

Figure 6.
Changes of backscattering coefficient with different wind speeds and incidence angle.

Figure 7.
Diagram of the time sequence.
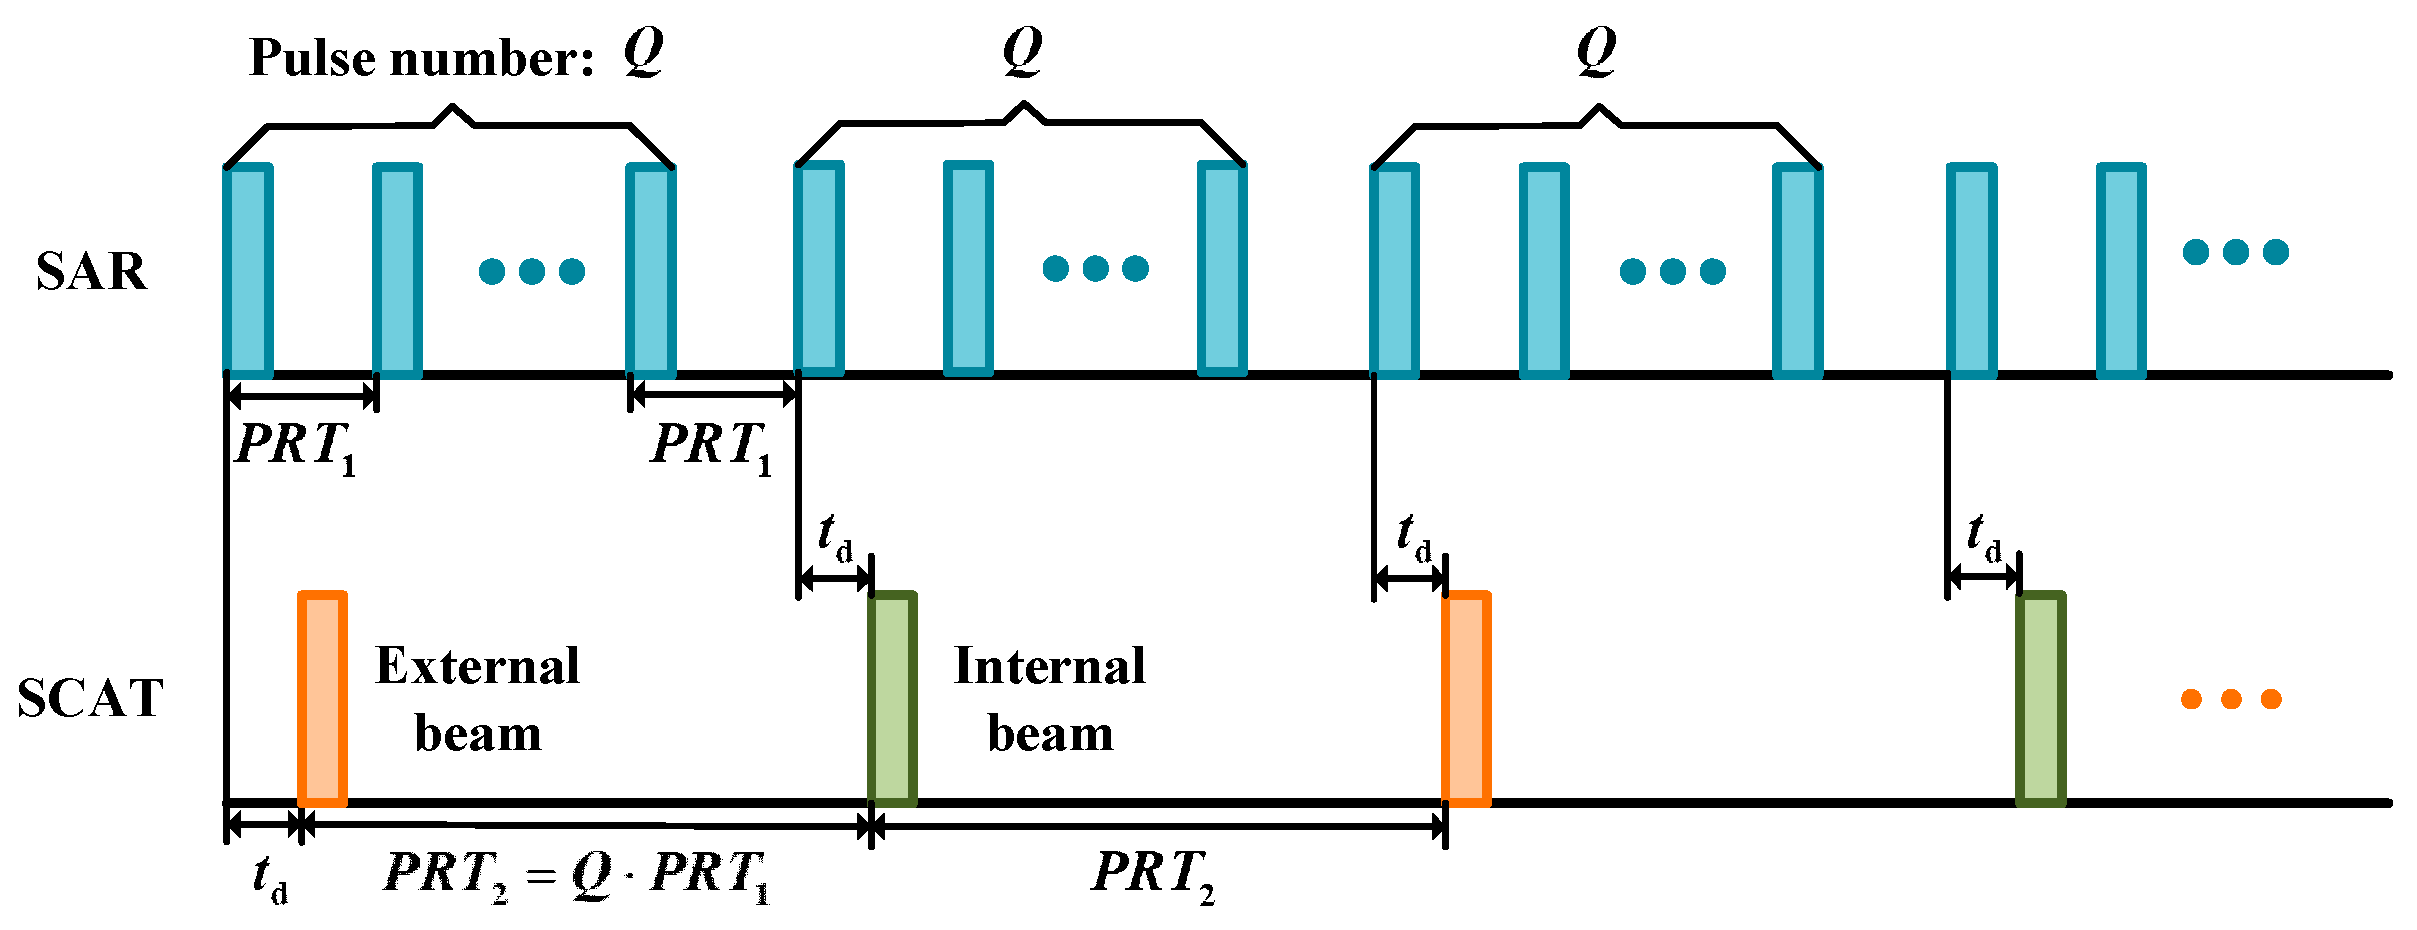
Figure 8.
Interferences of receiving window. (a) Condition 1. (b) Condition 2.
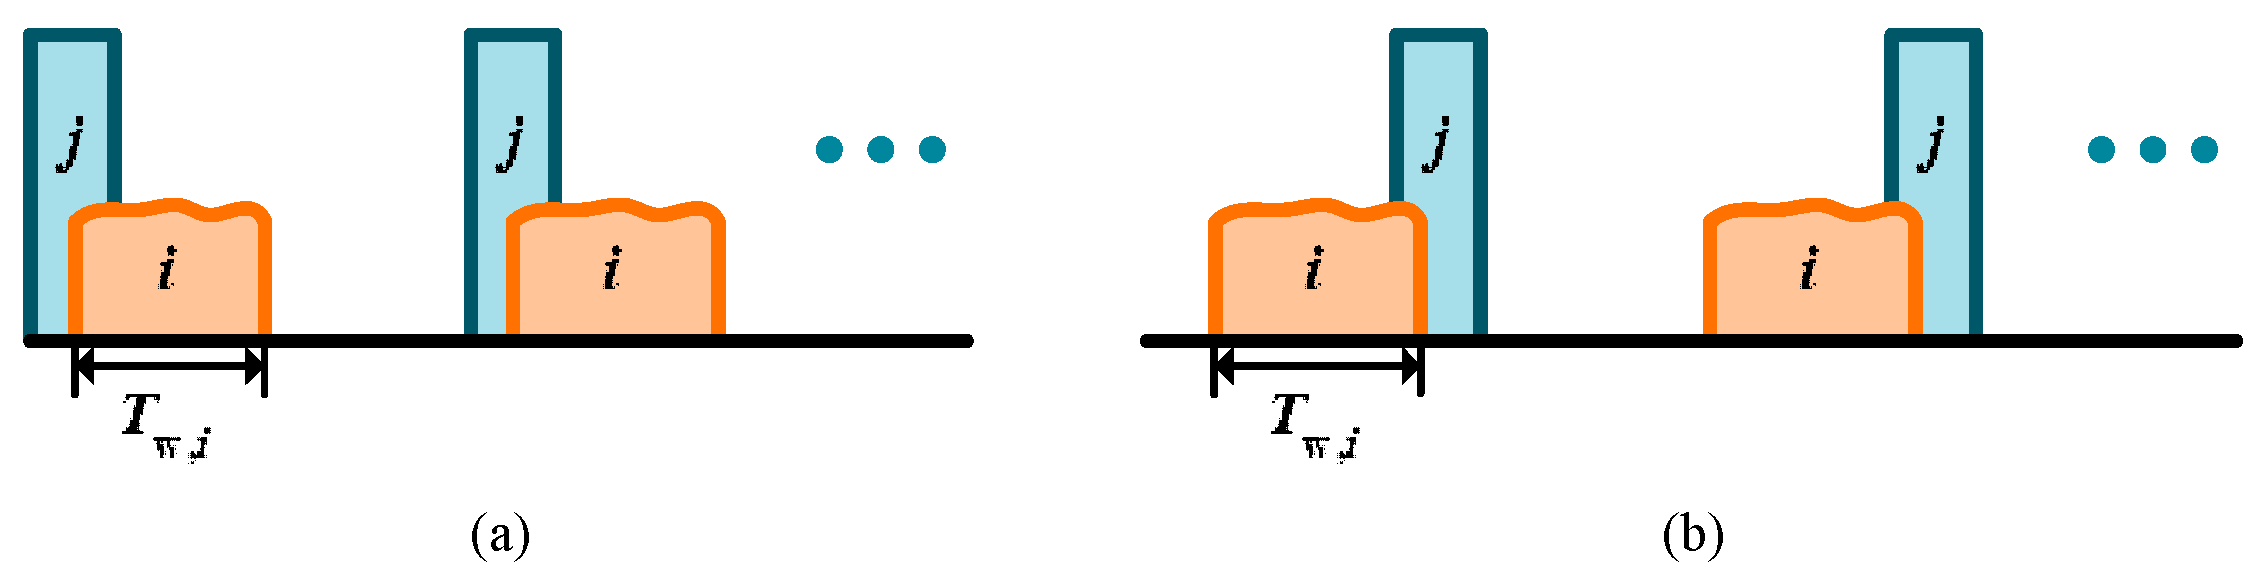
Figure 9.
Time sequence of the nadir echo. (a) Condition 1. (b) Condition 2.
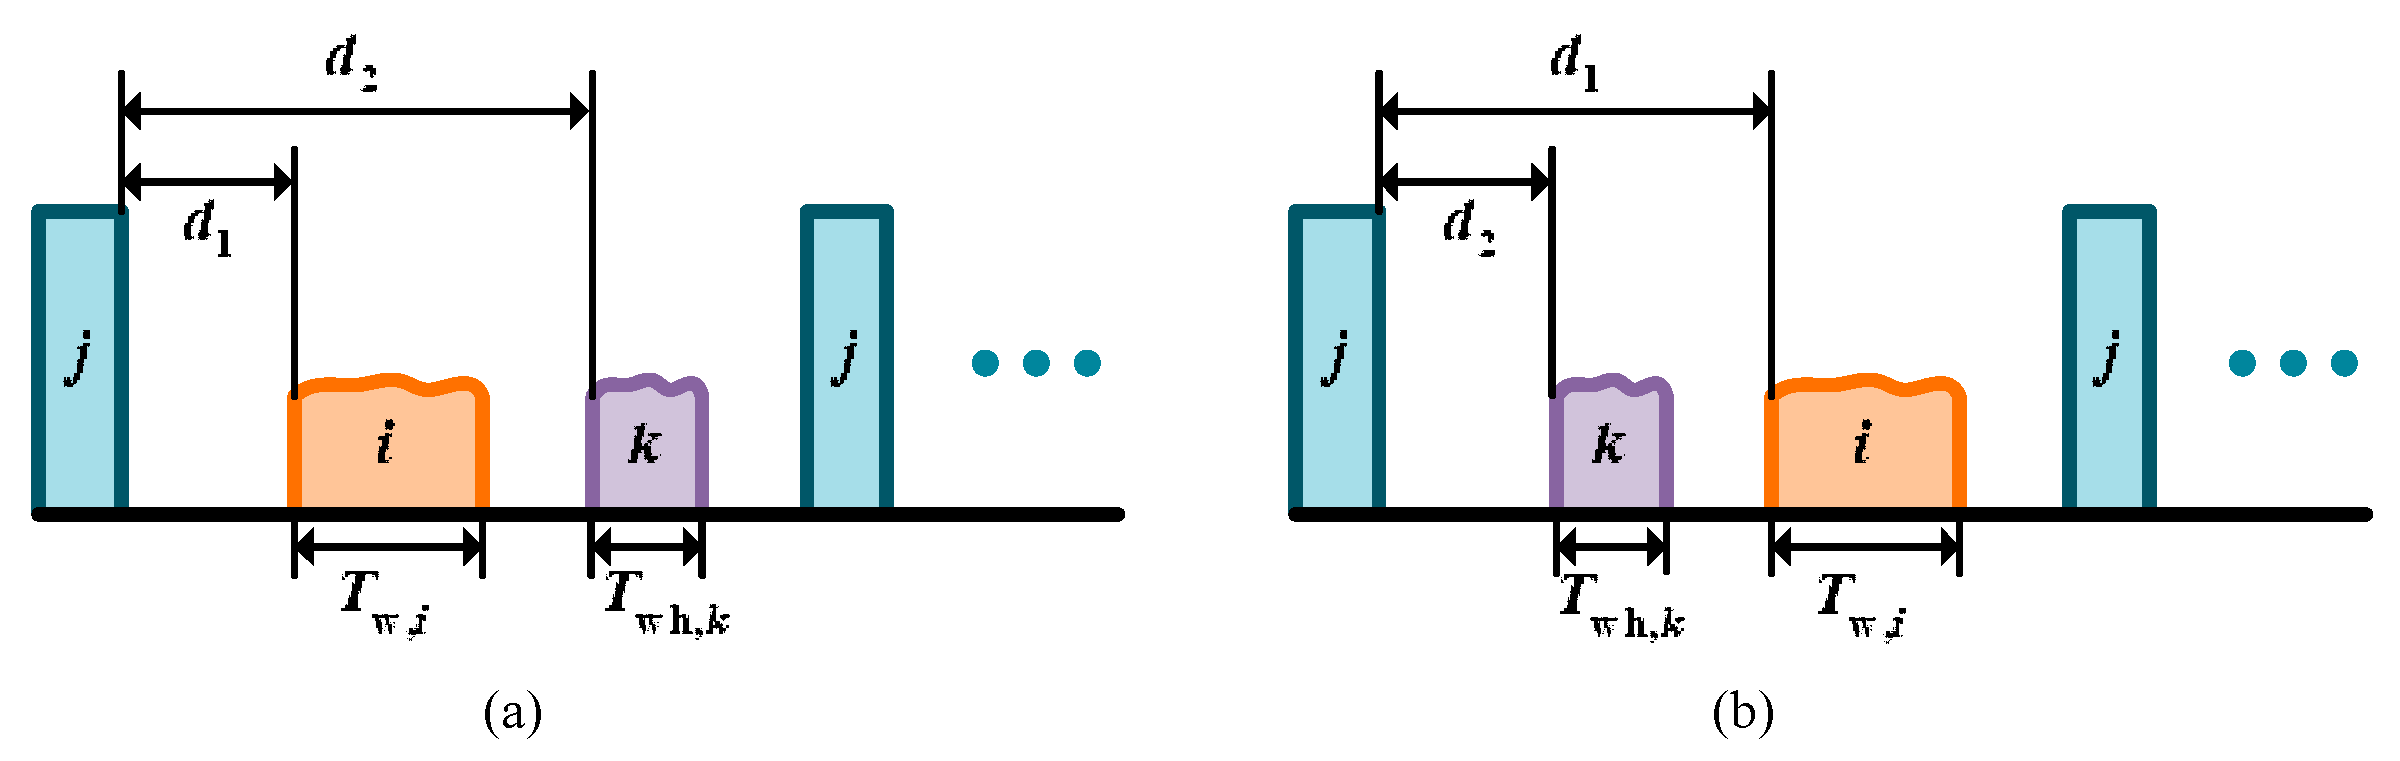
Figure 10.
Flow chart of PRF design.
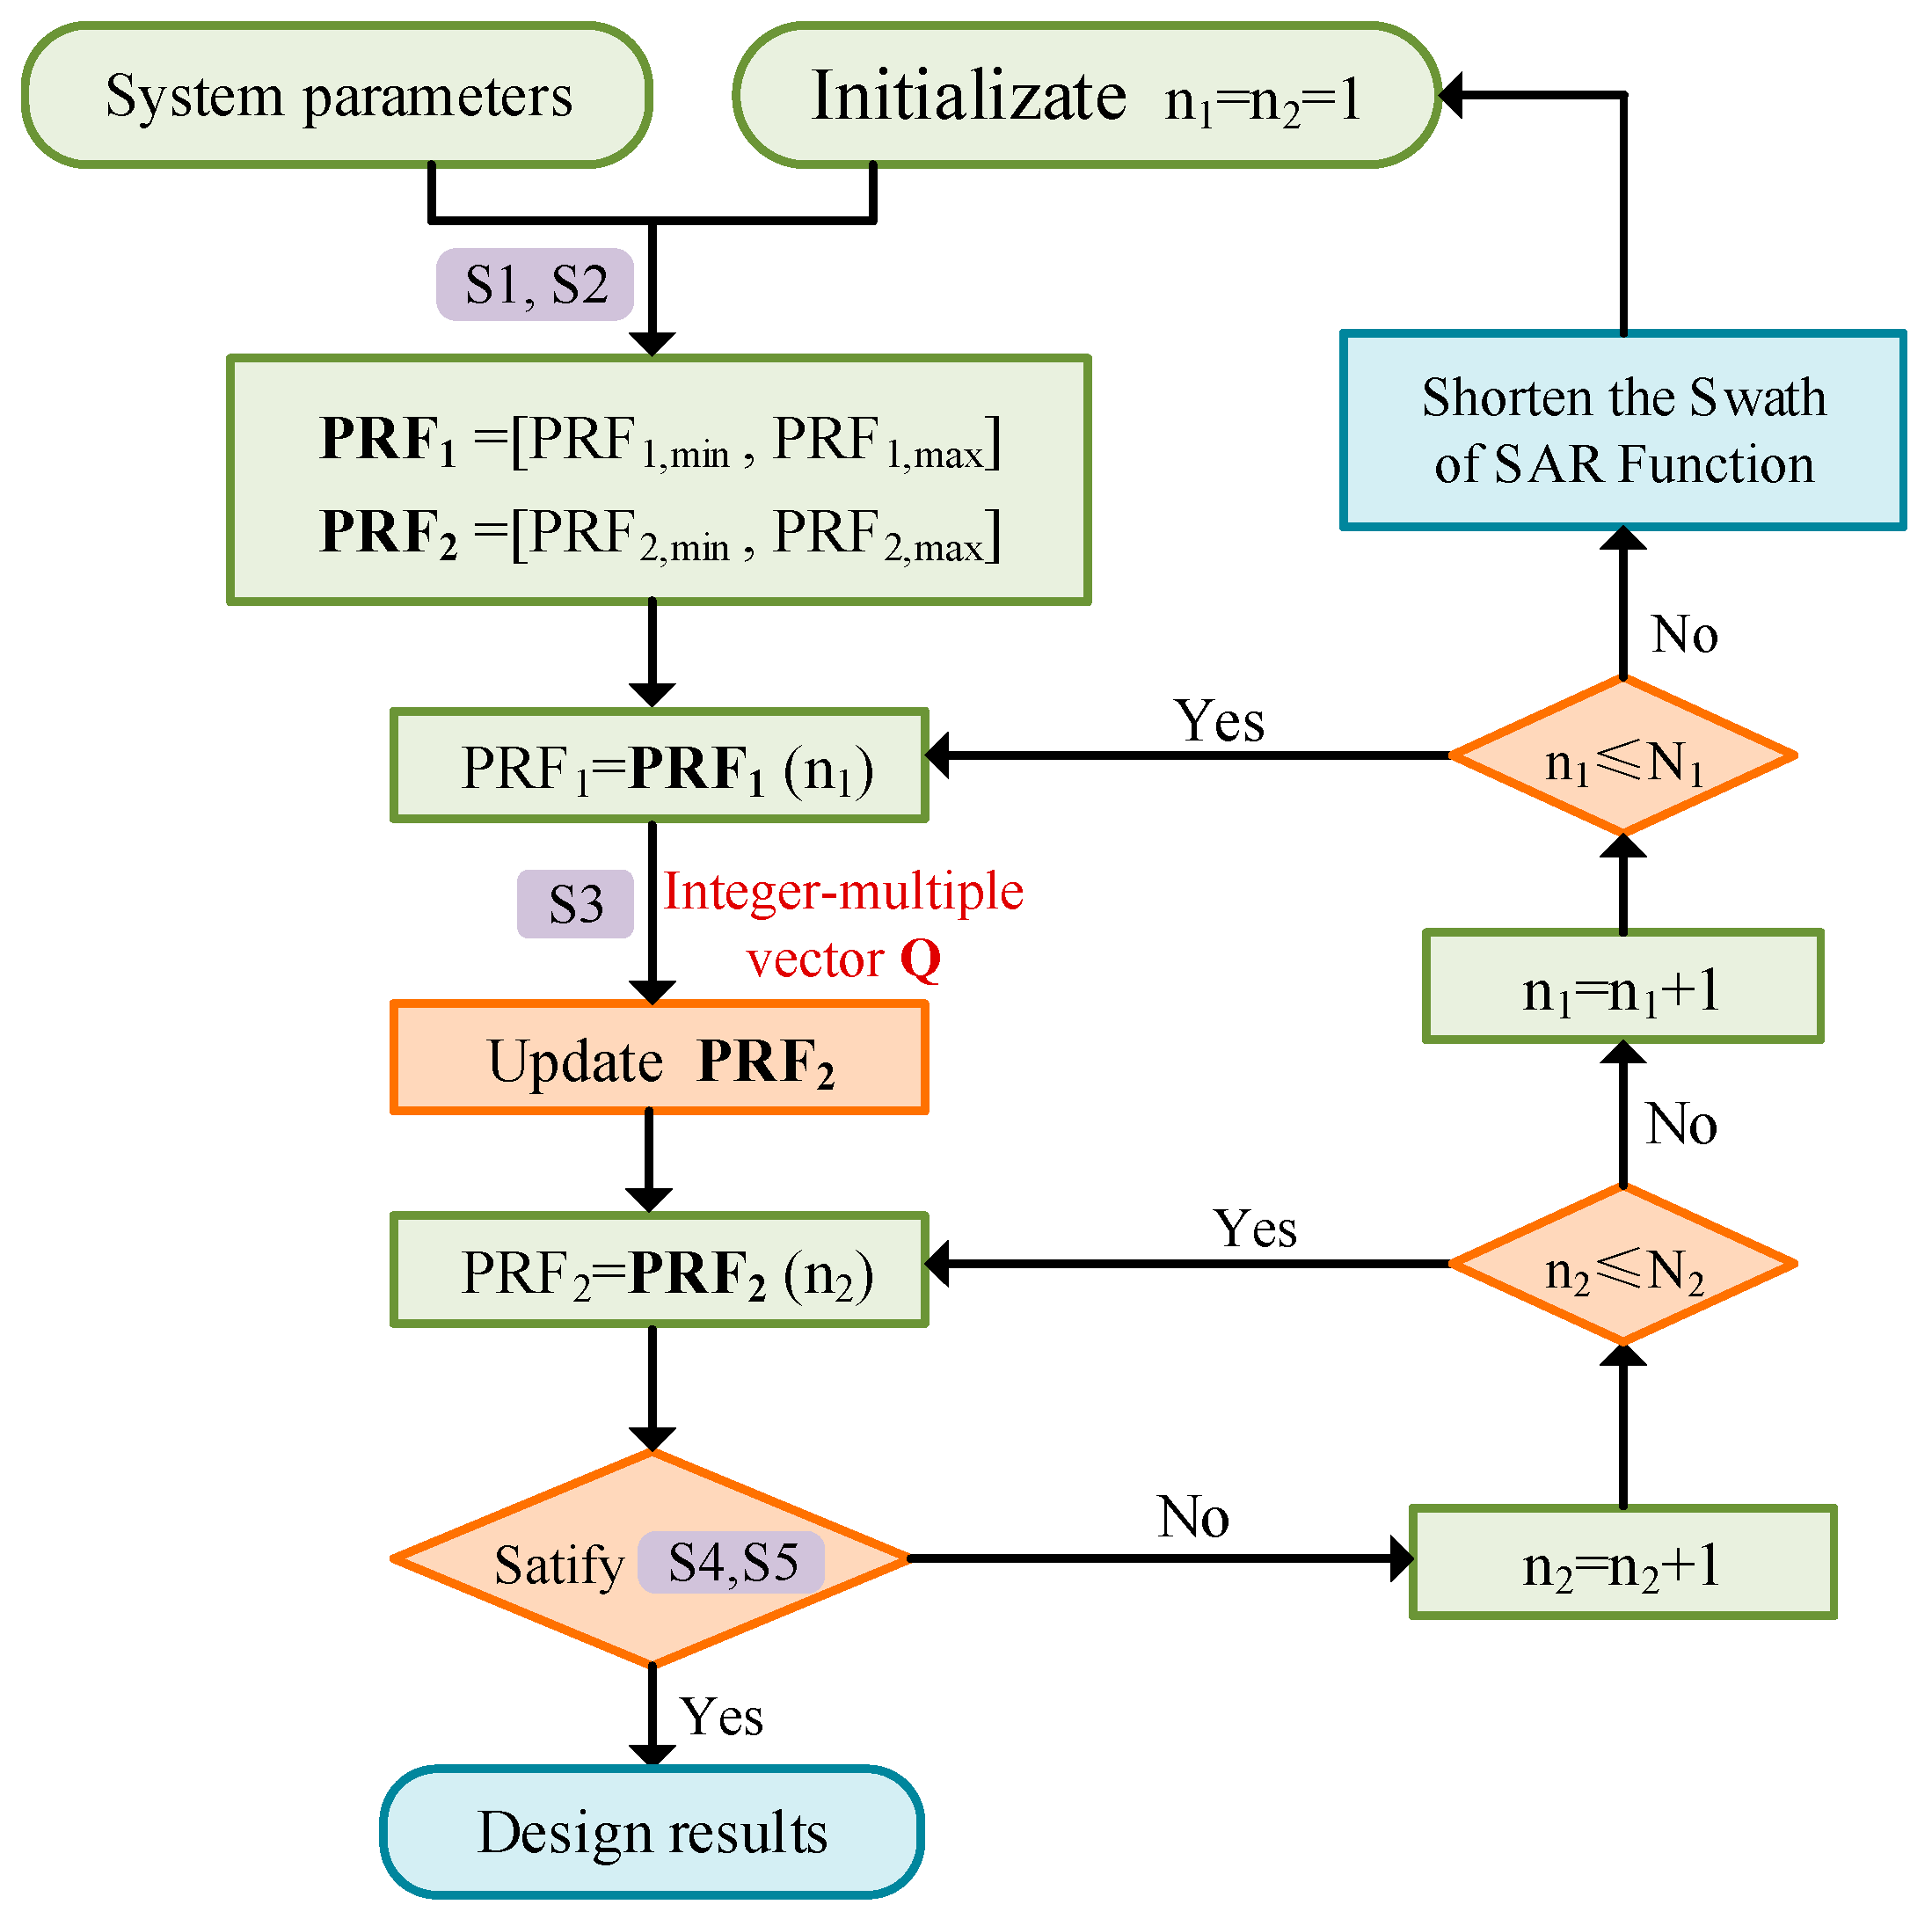
Figure 11.
Constraint curves of antenna size in range. Points A and B represent two conflicts about antenna size requirements of the two functions at 600–900 km orbital altitudes. Points C and D are the minimum and maximum antenna sizes for SAR functions at the orbital altitude of 900 km, respectively. The peak transmit power for scatterometer function and SAR function is 60 W and 5000 W, respectively. The SNR is 5 dB. The smaller the incidence angle, the smaller the maximum range antenna size to meet the swath requirement of SAR function. Therefore, the simulated incidence angle is set to a minimum value of 20°, so as to ensure that the swath of all beam positions in strip-mapping imaging function is larger than 20 km.

Figure 12.
Incidence angle range of the scatterometer function. Points E represent the conflict about Incident angle requirements of the two functions.
Figure 12.
Incidence angle range of the scatterometer function. Points E represent the conflict about Incident angle requirements of the two functions.
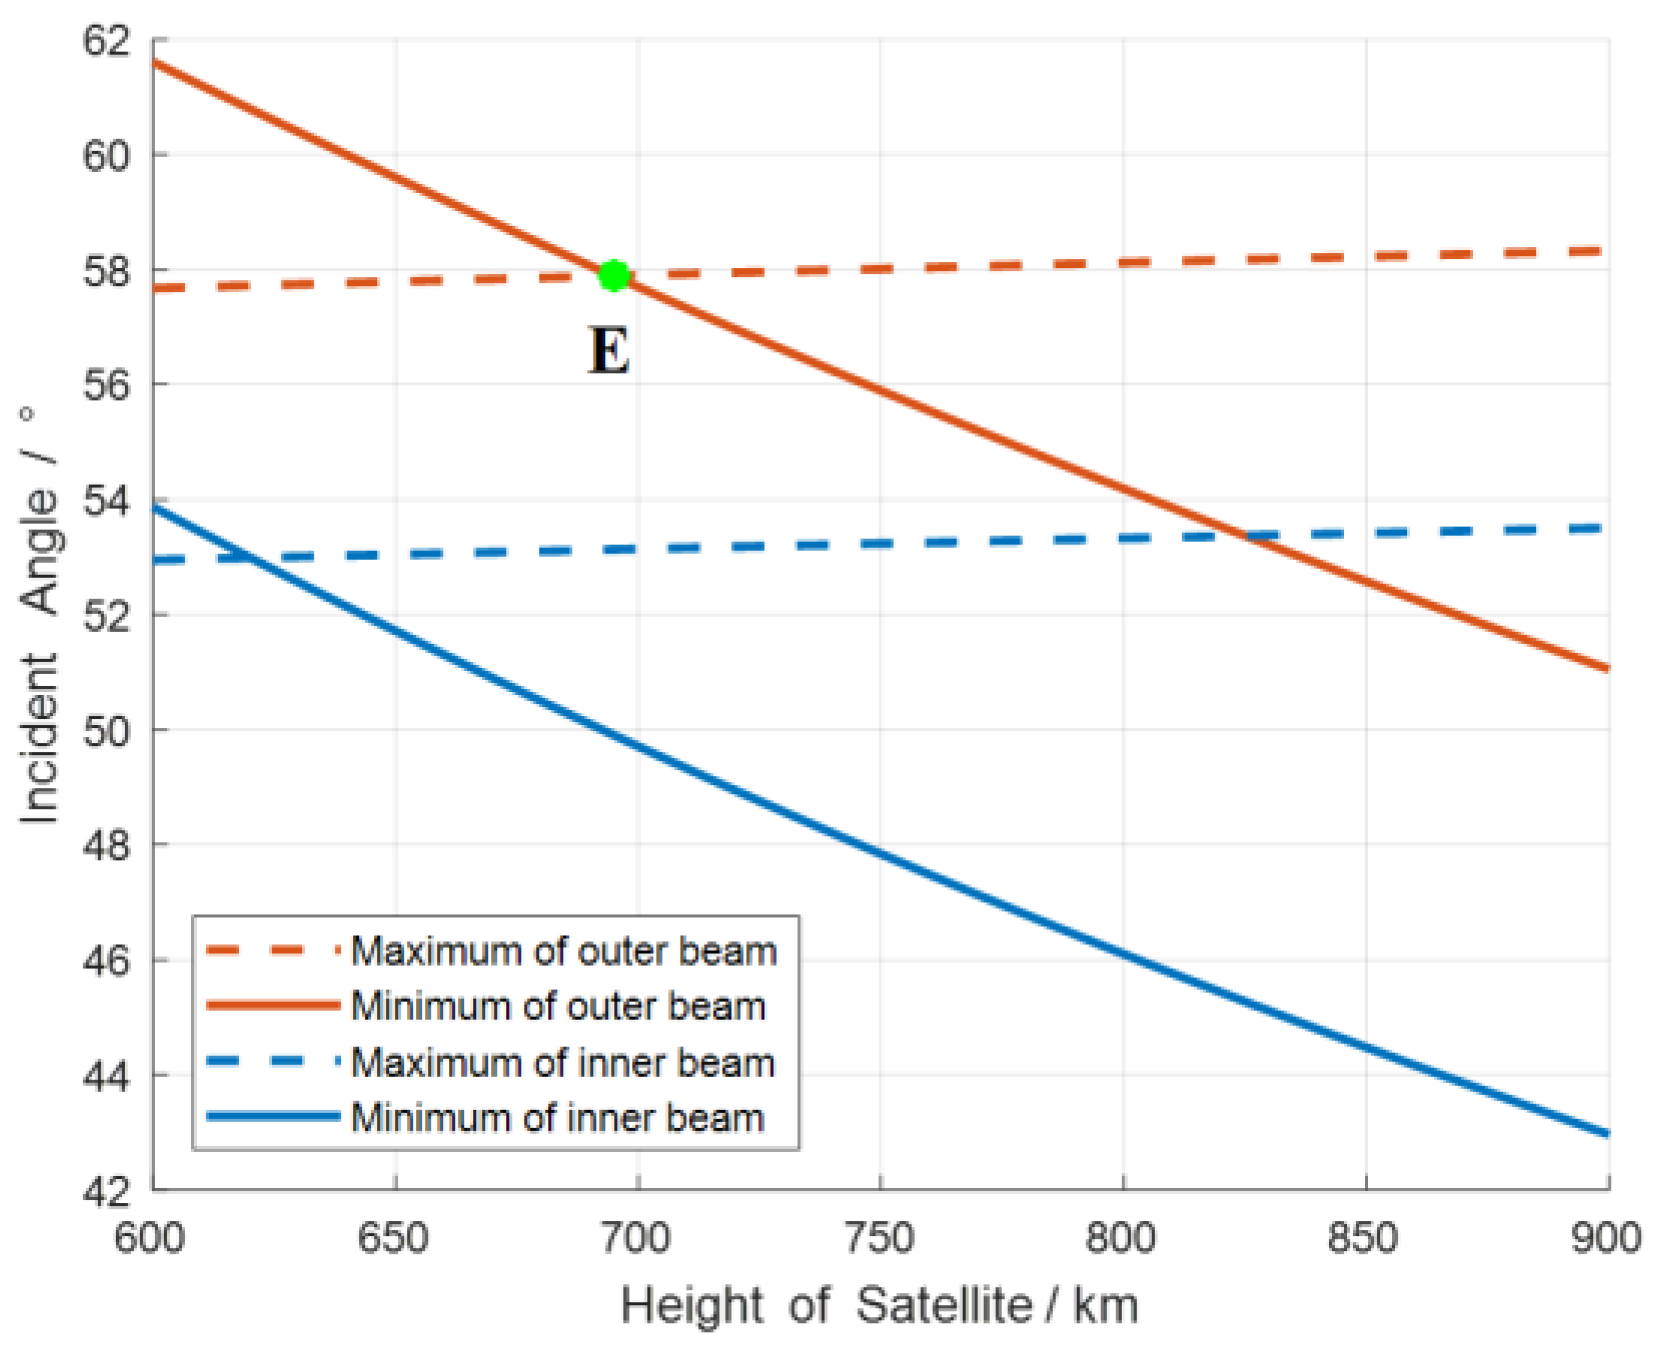
Figure 13.
Zebra map of the single-function independent operation. The blacked-out area indicates that the PRFs do not satisfy the all constraints, and the white area indicates that the PRFs do. The yellow and blue vertical lines represent the minimum PRF of scatterometer function and SAR function respectively. (The pulse width is 20 μs, the antenna size in azimuth direction is 10 m, the antenna size in range direction is 0.82 m).

Figure 14.
Results of the Global Mode2. (a) Zebra map of SAR function. (b) Zebra map of scatterometer function. The red and green short vertical lines represent the beam positions of SAR function and scatterometer function, respectively. The yellow and blue vertical lines represent the minimum PRF of scatterometer function and SAR function respectively. The blue horizontal lines show the incident angle from top to bottom. The rose boxes are used to highlight the selected PRFs. The yellow box is used to highlight the selected area for easy comparison with subsequent simulations.
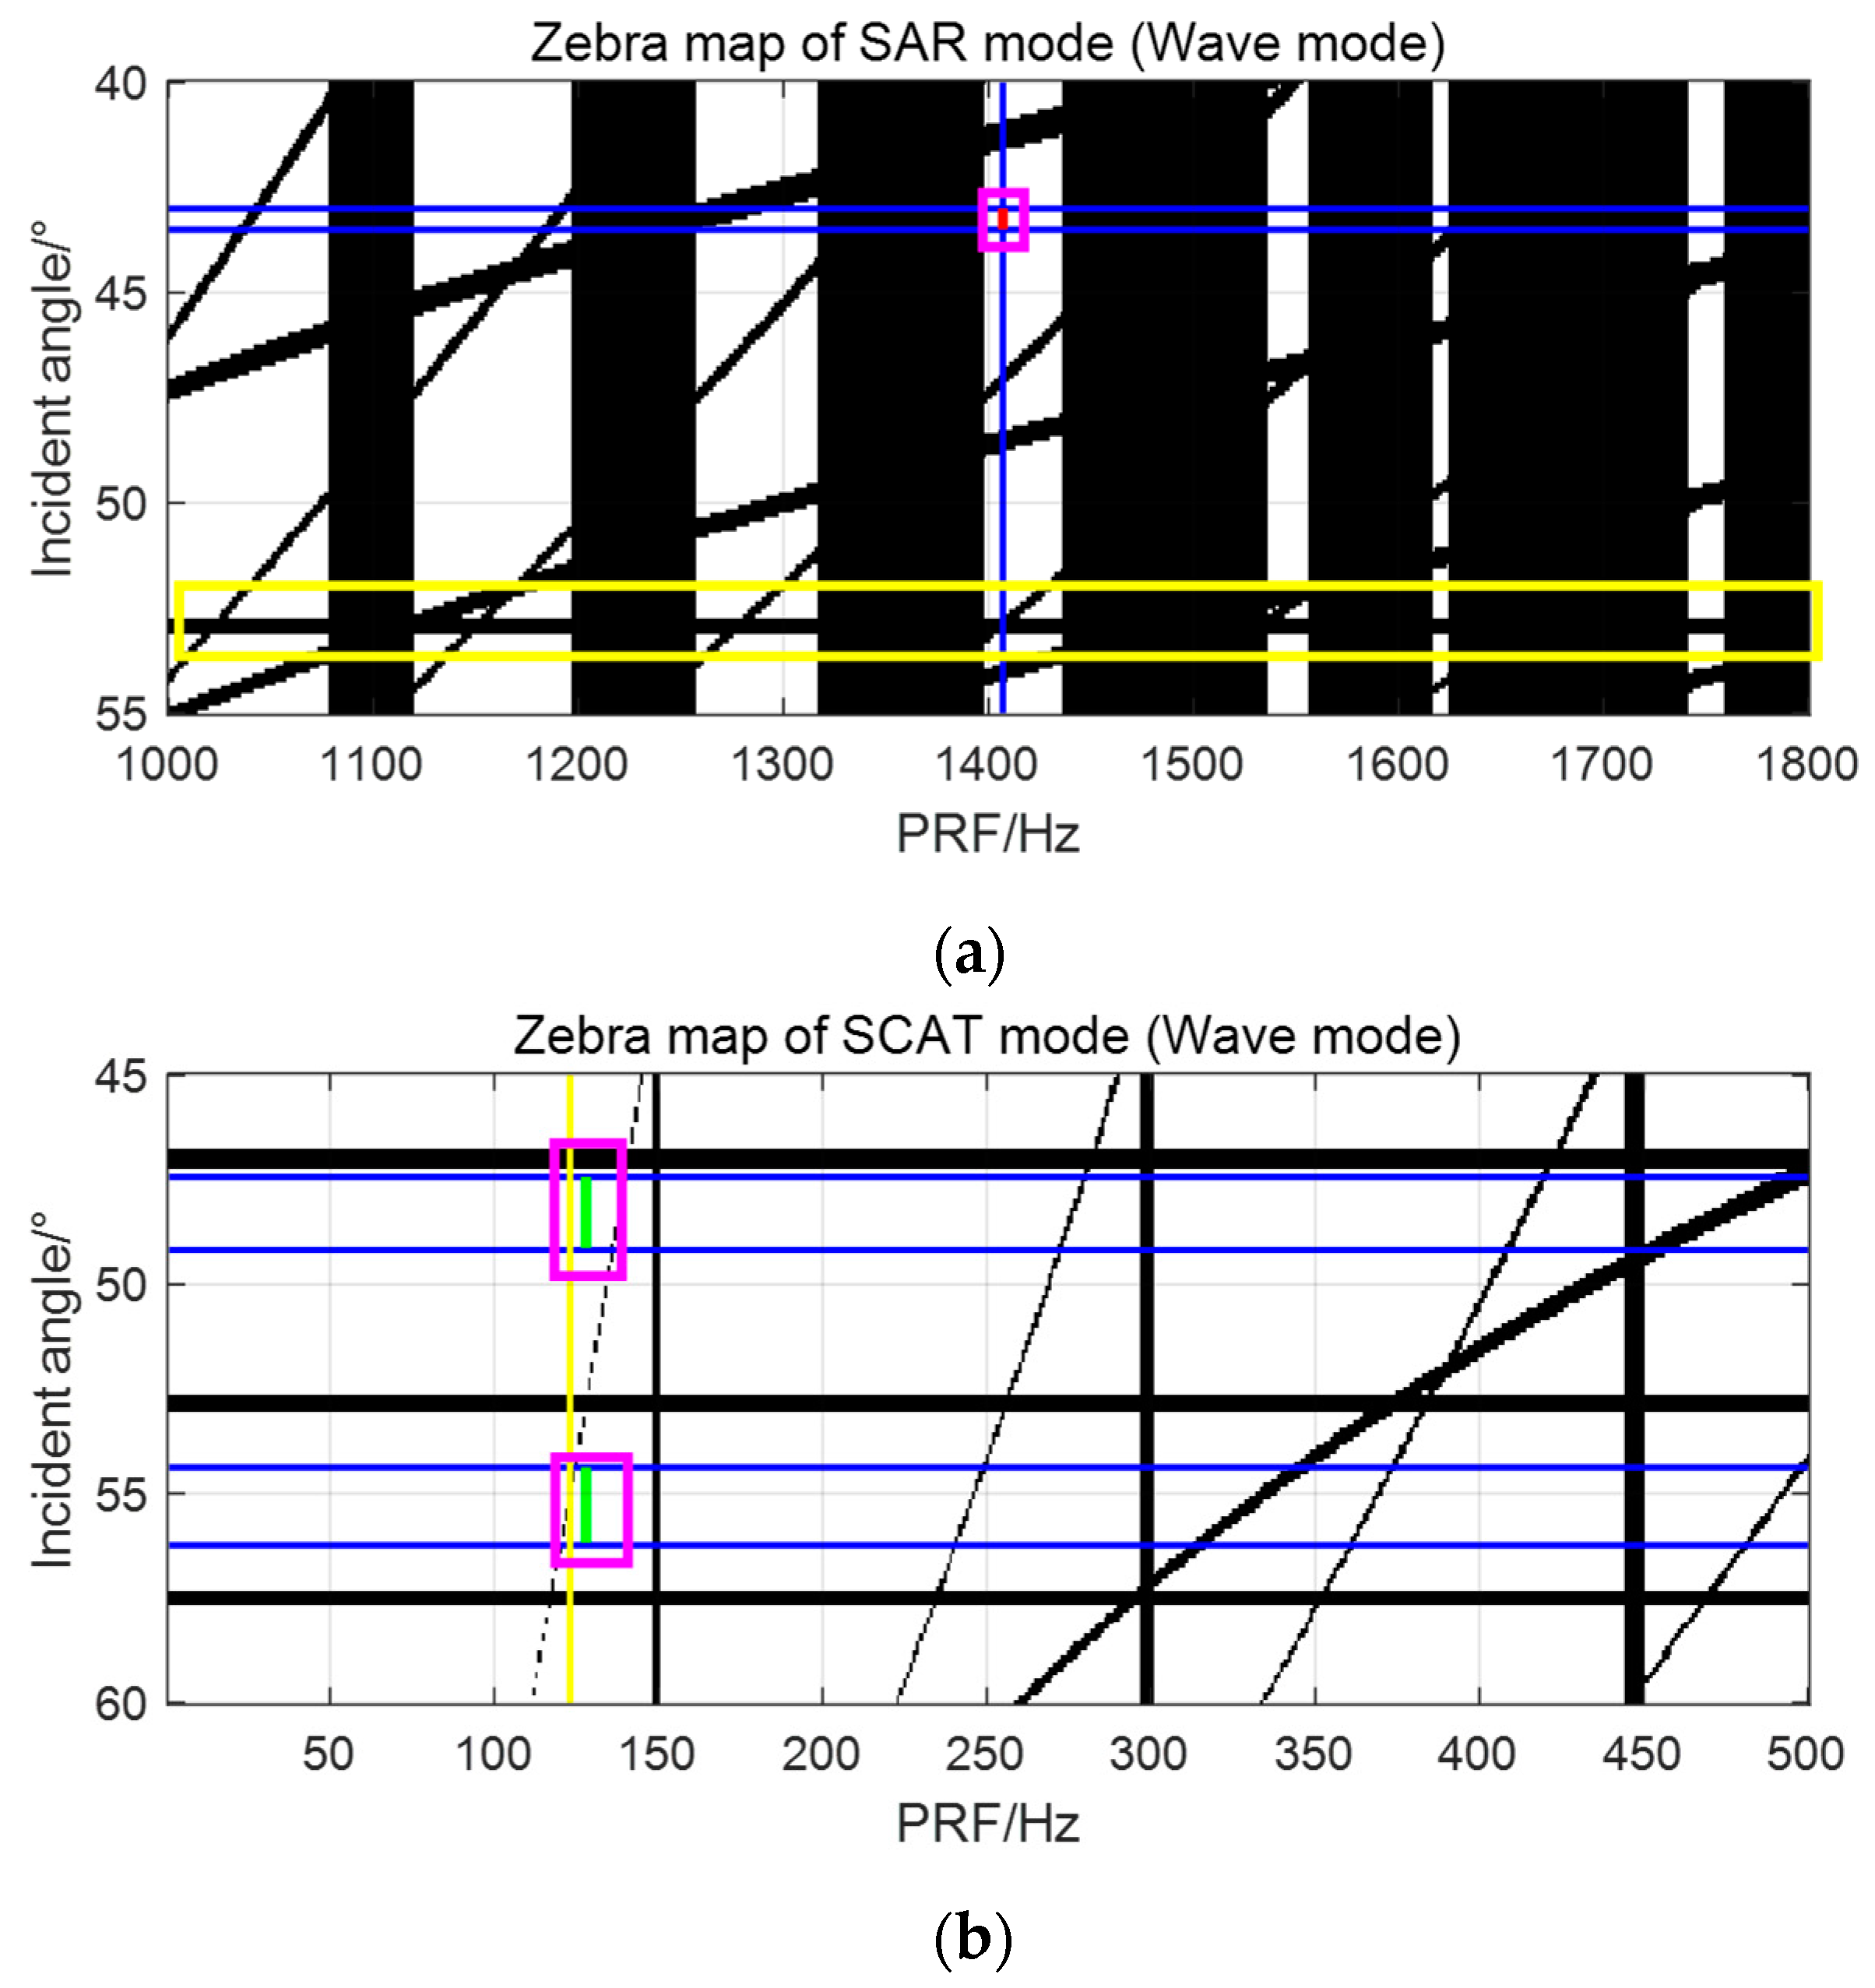
Figure 15.
Results of the Local Mode. (a) Zebra map of SAR function. (b) Zebra map of scatterometer function. The red and green short vertical lines represent the beam positions of SAR function and scatterometer function, respectively. The yellow and blue vertical lines represent the minimum PRF of scatterometer function and SAR function respectively. The blue horizontal lines show the incident angle from top to bottom. The rose boxes are used to highlight the selected PRFs. The yellow box is used to highlight the selected area for easy comparison with subsequent simulations.
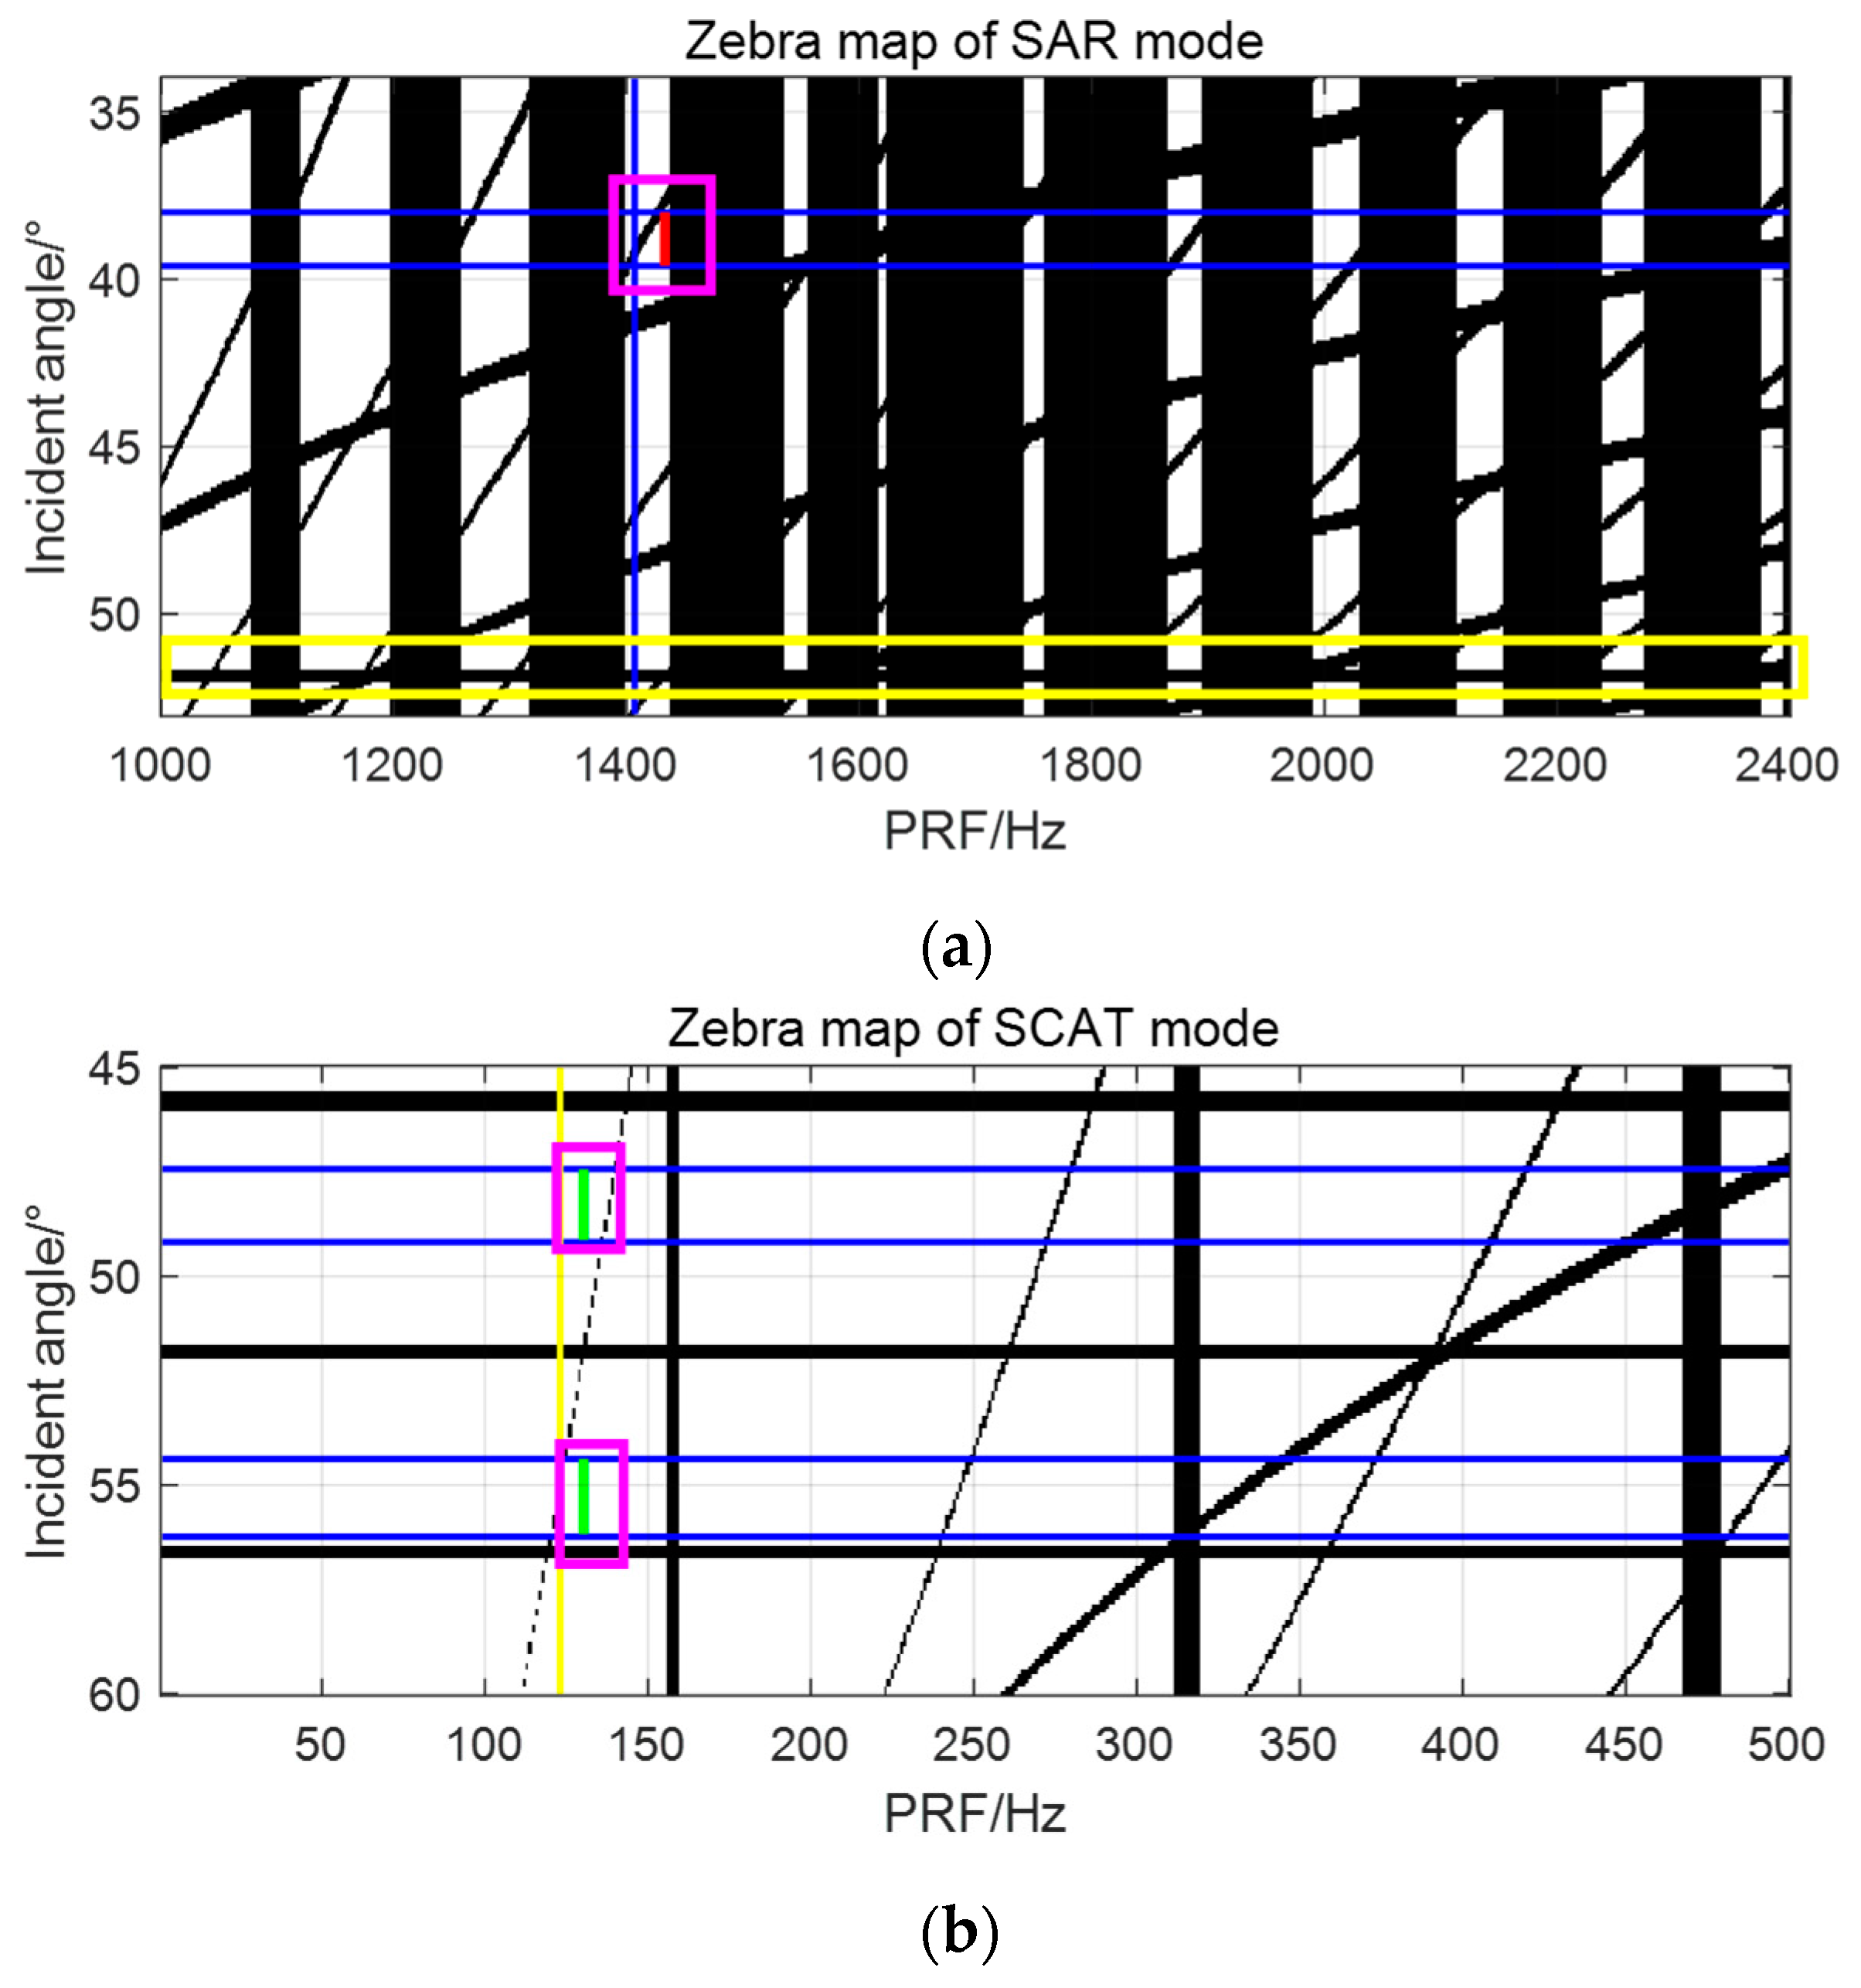
Figure 16.
Results of the Regional Mode. (a) Zebra map of SAR function. (b) Zebra map of scatterometer function. The brown areas of different shades represent the constraints on the time sequence are different under different beam positions. Multiple short vertical lines represent the beam positions of SAR function and scatterometer function, respectively. The yellow and blue vertical lines represent the minimum PRF of scatterometer function and SAR function respectively. The blue horizontal lines show the incident angle from top to bottom. The rose boxes are used to highlight the selected PRFs. The yellow box is used to highlight the selected area for easy comparison with subsequent simulations.

Figure 17.
Results of the Global Mode. (a) Zebra map of SAR function. (b) Zebra map of scatterometer function. The brown areas of different shades represent the constraints on the time sequence are different under different beam positions. Multiple short vertical lines represent the beam positions of SAR function and scatterometer function, respectively. The yellow and blue vertical lines represent the minimum PRF of scatterometer function and SAR function respectively. The blue horizontal lines show the incident angle from top to bottom. The rose boxes are used to highlight the selected PRFs. The yellow box is used to highlight the selected area for easy comparison with subsequent simulations.


Table 1.
Swath and resolution of four observation modes.
| Parameters | Values | ||
|---|---|---|---|
| SCAT Function | Swath (I/O) | ~1400 km/1800 km | |
| Range resolution (I/O) | <0.8/1.5 km | ||
| Azimuth resolution (I/O)) | <29/33 km | ||
| SAR Function | Local Mode Regional Mode Global Mode1 Global Mode2 (a × r) | Swath | ~20 km |
| ~100 km | |||
| ~500 km | |||
| ~5 km × 10 km | |||
| Resolution (a × r) | ~5 m × 5 m | ||
| ~30 m × 15 m | |||
| ~150 m × 60 m | |||
| ~10 m × 10 m | |||
Table 2.
Parameters of the proposed sensor.
| Parameters | Values | Parameters | Values | ||
|---|---|---|---|---|---|
| Common parameters | Height of Satellite | 769 km | Pulse width | 20 μs | |
| Azimuth antenna size | 10 m | Range antenna size | 0.82 m | ||
| SCAT Function | Carrier frequency | 13.4 GHz | Bandwidth | 0.5 MHz | |
| Peak power | 60 W | Incident angle (I/O) | 48.3/55.3° | ||
| PRF | 127.9–134.7 Hz | Rotation rate | 192.65°/s | ||
| Range footprint (I/O) | 39.7/52.3 km | Azimuth footprint (I/O) | 26.3/29.6 km | ||
| Swath (I/O) | 1490/1857 km | Resolution (a × r) | 12.5 × 12.5 km | ||
| SNR (I/O) | 6.7/9.2 dB | RASR | <−20 dB | ||
| SAR Function | Carrier frequency | 13.19 GHz | Bandwidth | 90 MHz | |
| Peak power | 5000 W | PRF | 1407–1751 Hz | ||
| SNR | 5.04–8.37 dB | AASR | <−18 dB | ||
| RASR | <−20 dB | ||||
| Local Mode Regional Mode Global Mode1 Global Mode2 | Incidence Angle | 20–48° (optional) | Swath | 21.8–38.1 km | |
| 36–42° (cover) | 120 km | ||||
| 20–48° (cover) | 502.7 km | ||||
| 43° | 10 km | ||||
| Resolution (a × r) | 5 × 5 m | ||||
| 30 × 10 m | |||||
| 90 × 30 m | |||||
| 5 × 5 m | |||||
Disclaimer/Publisher’s Note: The statements, opinions and data contained in all publications are solely those of the individual author(s) and contributor(s) and not of MDPI and/or the editor(s). MDPI and/or the editor(s) disclaim responsibility for any injury to people or property resulting from any ideas, methods, instructions or products referred to in the content. |
© 2024 by the authors. Licensee MDPI, Basel, Switzerland. This article is an open access article distributed under the terms and conditions of the Creative Commons Attribution (CC BY) license (https://creativecommons.org/licenses/by/4.0/).
Share and Cite
MDPI and ACS Style
Li, H.; Liu, W.; Sun, G.; Chen, C.; Xing, M.; Zhang, Z.; Zhang, J. Concept of Spaceborne Ocean Microwave Dual-Function Integrated Sensor for Wind and Wave Measurement. Remote Sens. 2024, 16, 1472. https://doi.org/10.3390/rs16081472
AMA Style
Li H, Liu W, Sun G, Chen C, Xing M, Zhang Z, Zhang J. Concept of Spaceborne Ocean Microwave Dual-Function Integrated Sensor for Wind and Wave Measurement. Remote Sensing. 2024; 16(8):1472. https://doi.org/10.3390/rs16081472
Chicago/Turabian StyleLi, Hang, Wenkang Liu, Guangcai Sun, Changhong Chen, Mengdao Xing, Zhenhua Zhang, and Jie Zhang. 2024. "Concept of Spaceborne Ocean Microwave Dual-Function Integrated Sensor for Wind and Wave Measurement" Remote Sensing 16, no. 8: 1472. https://doi.org/10.3390/rs16081472
Note that from the first issue of 2016, this journal uses article numbers instead of page numbers. See further details here.