
GeoKnowledgeFusion: A Platform for Multimodal Data Compilation from Geoscience Literature
by
 , ,
, ,
Zhixin Guo
1,
Chaoyang Wang
2,
Jianping Zhou
1,
Guanjie Zheng
1,*,
Xinbing Wang
1 and
Chenghu Zhou
1,3 1
School of Electronic, Information and Electrical Engineering, Shanghai Jiao Tong University, Shanghai 200240, China
2
Institute of Geology, Chinese Academy of Geological Sciences, Beijing 100037, China
3
Institute of Geographic Sciences and Natural Resources Research, Chinese Academy of Sciences, Beijing 100101, China
*
Author to whom correspondence should be addressed.
Remote Sens. 2024, 16(9), 1484; https://doi.org/10.3390/rs16091484
Submission received: 17 March 2024
/
Revised: 17 April 2024
/
Accepted: 21 April 2024
/
Published: 23 April 2024
(This article belongs to the Section Earth Observation Data)
Abstract
:With the advent of big data science, the field of geoscience has undergone a paradigm shift toward data-driven scientific discovery. However, the abundance of geoscience data distributed across multiple sources poses significant challenges to researchers in terms of data compilation, which includes data collection, collation, and database construction. To streamline the data compilation process, we present GeoKnowledgeFusion, a publicly accessible platform for the fusion of text, visual, and tabular knowledge extracted from the geoscience literature. GeoKnowledgeFusion leverages a powerful network of models that provide a joint multimodal understanding of text, image, and tabular data, enabling researchers to efficiently curate and continuously update their databases. To demonstrate the practical applications of GeoKnowledgeFusion, we present two scenarios: the compilation of Sm-Nd isotope data for constructing a domain-specific database and geographic analysis, and the data extraction process for debris flow disasters. The data compilation process for these use cases encompasses various tasks, including PDF pre-processing, target element recognition, human-in-the-loop annotation, and joint multimodal knowledge understanding. The findings consistently reveal patterns that align with manually compiled data, thus affirming the credibility and dependability of our automated data processing tool. To date, GeoKnowledgeFusion has supported forty geoscience research teams within the program by processing over 40,000 documents uploaded by geoscientists.
1. Introduction
Geoscience data hold a critical position within the scientific community due to their significant role in understanding Earth’s systems [1]. These data serve as invaluable snapshots of Earth’s diverse and irreplaceable characteristics, spanning both spatial and temporal dimensions. By using such data, researchers gain insights into past and present conditions of global systems and can make informed predictions about future states, rates, and processes [2,3]. The rapid advancement of big data-related technologies has amplified the importance of conducting big data-driven scientific research in geosciences. As a result, data compilation, including collecting and collating information from diverse sources, plays a vital role in the construction of customized scientific databases for geoscience studies [4].
The nature of geoscience data presents several challenging aspects, including non-repeatability, uncertainty, multi-dimensionality, computational complexity, and frequent updates, which pose significant obstacles in data collection and compilation [5]. As a result, real-time data collection, compilation, and updating have become essential for building geoscience databases for research purposes. Previous studies, such as AusGeochem [6], EarthChem [7], CZChemDB [8], and CGD [9], have proposed permanent repositories for geoscience database construction using open data sources. However, the collection and compilation of data from the geoscientific literature, which often consists of textual information, images, and structured tabular data, remains relatively unexplored. With the ever-increasing volume of data published in scientific articles, the manual collection and organization of such data have become increasingly challenging for researchers [10], necessitating alternative approaches for effective data management.
Geoscientific literature is commonly available in unstructured Portable Document Format (PDF), which preserves visual elements such as characters, lines, images, and more, in a format suitable for human presentation [11]. The detection and comprehension of different content elements within these PDF documents pose significant challenges for data collection and collation. Developing a data processing system for geoscience academic literature necessitates a focused approach in two distinct yet interconnected domains: multimodal data pattern recognition and system architecture design. The former encompasses a comprehensive suite of techniques aimed at accurately identifying and extracting key information embedded within diverse data formats—ranging from named entity recognition in textual content to target identification in imagery and the detection and interpretation of tabular data. The latter domain involves the meticulous construction of a robust system infrastructure capable of efficiently managing the complexities associated with the processing and integration of multimodal data.
Named Entity Recognition (NER) is a critical task in natural language processing that involves identifying specific entities, known as rigid designators within a text, categorized by predefined semantic types such as names, places, organizations, etc. [12]. Within the sphere of geoscience research, Geological Named Entity Recognition (GNER) is instrumental in extracting pertinent information, encompassing names, lithologies, geological ages, and geographic locations related to research subjects. These methodologies are principally divided into rule-based, machine-learning, and deep-learning approaches. Traditional rule-based methods utilize customized rules and domain-specific dictionaries to perform entity extraction through string-matching techniques [13,14,15,16]. This strategy is founded on the comprehensive development of feature engineering and the careful design of templates. In contrast, the machine learning paradigm explores a spectrum of algorithms, including but not limited to the Markov model [17], decision trees [18], and the maximum entropy model [19]. Despite the variety in these approaches, the precision of entity recognition they offer has frequently been insufficient for the requirements of practical applications. The emergence of deep learning has heralded a significant advancement in the field, with pre-trained language models (PLMs) exhibiting outstanding performance in entity recognition tasks [20,21,22,23]. This progression highlights a crucial shift towards harnessing deep learning models’ computational prowess and sophistication to fulfill the intricate demands of entity recognition within complex scenarios. In our research, we leverage the cutting-edge method, UIE [24], as the backbone model for NER and train it with over 20,000 annotated geoscientific instances.
Image recognition plays a crucial role in geoscientific literature, involving tasks such as image detection, image classification, and text extraction. These images in geoscience literature cover a wide range of content, including map images, biological fossil images, sample descriptions, and more. They contain valuable information such as latitude and longitude details, sample types, and age information. In previous studies, the recognition of visual elements in document images has relied primarily on standard object detectors originally designed for natural scene images. Approaches based on popular methods such as Faster R-CNN [25] and Mask R-CNN [26] have been explored for detecting image regions in documents. In addition, several researchers have demonstrated impressive performance in optical character recognition (OCR) [27,28], etc. Our work employed the YOLO v3 model [29] due to its lightweight and easy-to-deploy characteristics.
Table recognition presents notably more significant complexities than image recognition, attributed primarily to the sophisticated structures innate to tabular data and the significant topological divergence between tabular formats and natural language. Table recognition is bifurcated into two pivotal processes: table detection and the recognition of table structures. The advent and exploration of convolutional neural network (CNN) technologies have catalyzed the adoption of R-CNN (Region-based CNN)-based approaches for table detection [30,31,32,33], alongside experimental applications of Graph Neural Networks (GNN) [34] and Generative Adversarial Networks (GAN) [35] in this domain. Nevertheless, these methodologies typically necessitate extensive annotated datasets for training and impose considerable demands on computational resources. In our research, we have opted for the YOLOv3 [29] model for table detection, distinguished by its comparative lightweight and efficiency, addressing the challenges of resource intensity and dataset dependency inherent in previous approaches.
For table structure recognition algorithms, traditional computer vision algorithms restore table structures through graphic denoising and frame line recognition [36,37], in addition to structure-aware methods that reconstruct table structures by calculating the spatial relationships of cells [34,38]. These approaches tend to design specific structure recognition rules, resulting in limited generalization capabilities. With the exploration of deep learning methods, CNN-based algorithms for table structure reconstruction have also been widely investigated [39,40,41]. However, these methods rely heavily on extensive annotated data for training, necessitating significant human labor costs and training resources. In our work, we have designed a heuristic algorithm based on computer vision to identify table structures, which reconstructs the structure of tables by analyzing the range of tables recognized through table parsing. This significantly saves on training resources and the cost of model deployment while maintaining commendable capabilities in reconstructing table structures.
Due to the inherent characteristics of geoscience data, the relevant knowledge is often distributed across multimodal data. The challenge lies in the joint understanding of representations from textual information, images, and tabular data, particularly when extracting data from multimodal sources. Previous research has explored the field of joint image-text understanding in various vision-and-language (V + L) tasks [42,43], etc., where inputs from multiple modalities are processed simultaneously to achieve a comprehensive understanding of both visual and textual information. The advancements in pre-trained language models (PLMs) have led to the development of PLM-based approaches, such as ViLBERT [44], VisualBERT [45], LXMERT [46], Unicoder-VL [47], VL-BERT [48], etc., which have significantly improved the performance of vision-and-language understanding tasks. However, these end-to-end approaches may not be suitable for scientific data compilation, as they prioritize overall performance over data accuracy. In contrast, the GeoKnowledgeFusion platform employs a target element recognition network for multimodal knowledge fusion, as illustrated in Figure 1, along with a human-in-the-loop paradigm. This paradigm allows geoscientists to actively participate in the data compilation process and utilize human-annotated data to update the model parameters, ensuring a higher level of data accuracy and reliability.
Recently, there have been some pioneer works of geoscience data compilation services for open science research. Chronos [49], and GeoSciNet [50] designed the schema tools for enhancing the geoscience research and education process. However, the usability of these tools is hindered by poor graphical user interfaces (GUI) and limited user interaction systems, making it challenging to extract the desired data and meet the requirements of large-scale data compilation. With the remarkable development of natural language processing (NLP), GeoDeepDive [51], SciSpace [52], etc., introduced pre-trained language models (PLM) to analyze and retrieve information from the literature. However, due to the complete dependence on the end-to-end extraction method [53], insufficient data accuracy has resulted from the lack of labeled corpus, which makes it difficult to utilize such data directly in the research that requires accurate data [54]. GeoDeepShovel [55] which has introduced the human-in-the-loop paradigm allows experts to annotate the automatically extracted information and entitles their models to be updated through the annotated corpus agility. However, their approach is limited to processing single documents and only supports data extraction from one document. In addition, their method does not facilitate the joint extraction and fusion of multimodal data, which can lead to longer processing times compared to manual data extraction methods.
To improve the effectiveness of data fusion, we propose the GeoKnowledgeFusion platform. Figure 1 demonstrates an overview of the GeoKnowledgeFusion workflow. This platform overcomes the limitations associated with the lack of domain-specific knowledge and the need for a joint understanding of textual information, images, and tabular data. We employ a human-in-the-loop annotation process that allows experts to revise the automatically extracted information and update our model network based on the agility of the annotated corpus. To comprehensively evaluate the effectiveness of our platform, we conduct extensive experiments focusing on a downstream use case: the compilation of Sm-Nd isotope data. The results consistently show trends consistent with previously manually constructed databases, validating the reliability of our automated data collection tool. A demonstration of GeoKnowledgeFusion is available through our Web User Interface (UI) at: https://knowledgefusion.acemap.info, accessed on 1 June 2023.
The main contribution of this work is three-fold:
- We have developed a sophisticated pattern recognition model network to address the multifaceted challenges associated with processing multimodal data embedded in PDF documents. This network demonstrates proficiency in identifying essential data across various formats, including tables, images, and textual content. To further augment the data extraction precision, we have seamlessly integrated a Human-in-the-loop annotation strategy. This strategic incorporation enhances the model’s ability to discern and extract critical information accurately.
- Exploiting the capabilities of our developed pattern recognition model network, we established GeoKnowledgeFusion—a platform specifically engineered to aggregate multimodal data from geoscience literature. GeoKnowledgeFusion leverages this advanced model network to streamline the simultaneous extraction of diverse data types from geoscientific documents, including textual, tabular, and image data. This integration furnishes the geoscience community with a robust toolkit, significantly augmenting the efficiency of data collection and compilation processes.
- To assess the effectiveness of our platform, we conducted both automatic and manual evaluations. The results consistently reveal trends that align with those of previously manually collected data compilations, thereby validating the reliability of our automated data collection tool.
2. Materials and Methods
In our study, we have engineered an advanced target element detection framework, as illustrated in Figure 2, designed to enhance the identification and recognition of target data within heterogeneous datasets. This meticulously developed network empowers us to accurately and efficiently detect and categorize target elements, such as named entities, images, and tables, dispersed across a spectrum of data modalities. By deploying this network, we tackle the complexities arising from diverse data formats, thereby ensuring the precise detection and classification of relevant information from various data sources.
2.1. Named Entity Recognition
Named entities (NEs) are specific words or phrases that are identifiable by names or categories within a particular domain. Commonly, NER systems classify entities into four primary categories: person, location, organization, and a broadly defined miscellaneous (MIS) category. In our research, we have adopted a supervised learning approach for NER, treating it essentially as a classification task for each token within a dataset. This perspective aligns with the sequence labeling framework, wherein the algorithm is tasked with predicting labels for a contiguous sequence of tokens, typically within a sentence. This method effectively captures the interdependencies among tokens, enhancing the model’s ability to identify named entities accurately. Within this framework, a sentence is decomposed into a series of token variables , and the objective is to ascertain the most probable sequence of named entity labels . For instance, in the sentence “The Qinghai-Tibet Plateau, an inland plateau in Asia, is the largest plateau in China and the highest in the world.”, the phrases Qinghai-Tibet Plateau, Asia, and China exemplify typical NEs in the geoscience domain.
In this study, we utilized the widely recognized UIE method [24] for NER. The UIE model is specifically tailored to extract structured information from unstructured natural language texts, making it particularly effective for identifying pertinent geoscience entities. Within the sequence labeling framework, a sentence is represented as a sequence of token variables . Our methodology aims to determine the most probable sequence of named entity labels . We formulate this problem probabilistically, where the objective is to predict the label sequence by maximizing the conditional probability defined by Equation (1):
This probabilistic formulation allows us to systematically infer the most likely labels for the sequence of tokens, leveraging the inherent dependencies between tokens to enhance the accuracy of entity recognition.
To address the challenges posed by limited training samples in our research, we have established a collaborative framework with domain experts in geosciences to enhance the data annotation process. This collaborative effort involved 126 geoscience students from 12 premier Chinese universities and research institutes focusing specifically on debris flow and mountain hazards. Through this initiative, 14,665 data samples were rigorously annotated on our platform. In our structured approach, we annotated a dataset encompassing 17 distinct types of entities, including Nation, Region, Longitude, Latitude, Lithology, Age, Time, Disaster Type, Relevant Indicators, Damage Loss, Disaster Magnitude, Influence Factors, Prevention Measures, Reason of Disaster Formation, and Disaster Chain. This comprehensive annotation methodology aimed to capture a wide range of information pertinent to geoscience and disaster research. We ensured that each entity type was defined clearly and consistently throughout the dataset. These categories were selected to support an in-depth analysis of factors related to natural disasters and their subsequent impacts, thus significantly enhancing the dataset’s utility for both predictive modeling and scholarly research.
Given the constraints of costly human resources, our model primarily addresses general geoscience-related entities, including latitude, longitude, geological age, and conditions associated with debris flows. We have implemented a human-in-the-loop annotation system to enhance the model’s generalization capabilities. This system facilitates ongoing improvement by allowing geoscience researchers to compile NER-related data, which are then preserved for subsequent model training. This iterative process not only refines the accuracy of our model but also expands its applicability in the field of geoscience.
2.2. Image and Table Object Detection
In our research, we have applied supervised methods for image object and table detection, focusing on boundary identification. The prevalent strategy in object detection translates the challenge into a classification task. This involves identifying instances of a specific object class that may vary in position but maintain a consistent size within the image. Let W represent the reference window size that an instance of the object would occupy, and L denote a grid of potential locations within the image. Further, let signify the image features within a window (sub-image) whose top-left corner is located at . The object detection task can then be simplified to binary classification: for each location, , classify into two categories, windows containing an object and windows devoid of an object.
Given the well-established efficacy of object detection methods and the straightforward requirements of such tasks, we have chosen to employ the widely recognized YOLOv3 object detection model [29], renowned for its optimal balance between accuracy and efficiency. In our study, we utilized the standard YOLOv3 loss function, defined as follows in Equation (2):
where represents the bounding box regression loss, denotes the objectness loss and signifies the class prediction loss.
The bounding box regression loss is calculated using mean squared error when an object is detected, focusing on the x, y coordinates of the center, as well as the width and height of the bounding boxes. YOLOv3 adjusts offsets to predefined anchor boxes, applying the loss to these offsets defined in Equation (3):
Here, indicates the presence of an object in cell i, with and , , , being the actual and predicted box coordinates and dimensions, respectively.
The Objectness Loss penalizes incorrect object presence scores, defined in Equation (4):
where C represents the confidence score, and is a weighting factor that balances the detection of objects and non-objects.
As shown in Equation (5), the Class Prediction Loss , using a cross-entropy loss is aimed at accurately classifying detected objects:
where denotes the probability of the class c being present in the box and is the predicted probability.
This comprehensive formulation of the loss function ensures that YOLOv3 effectively localizes and classifies objects, reinforcing its suitability for real-time object detection tasks.
2.3. Table Structure Recognition
Table structure recognition is an essential task that seeks to delineate the row and column architecture within tables, particularly within non-digital document formats, such as scanned images. Analogous to target detection in broader object recognition contexts, table structure recognition can be conceptualized as a specialized form of target detection, focusing on the identification of individual table cells. This nuanced approach to table structure recognition involves discerning the spatial arrangement and relational dynamics of table cells, thereby enabling the accurate reconstruction of the table’s foundational grid structure.
Table recognition presents a formidable challenge due to the diverse array of structural configurations encountered in document analysis. In our research, we adopt a traditional computer vision approach, enhanced by the integration of a heuristic algorithm, to process images for table structure recognition. To effectively address the complexity of table structures, we categorize tables into two distinct types: those with outer borders and those without.
As shown in Algorithm 1, for tables with outer borders, our methodology involves leveraging precise boundary detection techniques to delineate the table perimeter, which facilitates the accurate identification of internal cells and their relationships. Conversely, for tables lacking distinct outer borders, we employ a more nuanced strategy that relies on advanced pattern recognition and spatial analysis to infer the boundaries and layout of the table. This dual strategy allows us to tailor our approach to the specific characteristics of each table type, ensuring robust and accurate table recognition across a broad spectrum of documents. This refined approach not only enhances the precision of table detection but also significantly improves the reliability of extracting and interpreting tabular data from complex document layouts. In our method, we set the threshold as 0.7.
| Algorithm 1 Table Structure Recognition |
|
2.4. Joint Multimodal Knowledge Understanding
Due to the diverse and multilingual nature of data sources, the knowledge extracted in the process often appears vague and heterogeneous. This variability manifests as multiple names or references for the same entity and other related inconsistencies. Such challenges underscore the need for a robust methodology to manage and disambiguate these data effectively. To address these issues, the extracted entities are parsed into a series of token variables . The primary objective is to determine the most probable sequence of named entity labels . This approach facilitates the systematic disambiguation and correct categorization of entities, which is crucial for maintaining the integrity and utility of the extracted knowledge.
We implement a data integration method once the target elements have been detected and recognized. We systematically gather and organize all potential entity names, linking them to a standardized dictionary to facilitate name disambiguation. To enhance the schema customization process, we utilize BERT (Bidirectional Encoder Representations from Transformers) [56], encoding each entity name into a high-dimensional vector to produce a dense representation. We normalize user preferences for knowledge fusion by calculating the similarity between the user’s preference vector and the standardized entity names. This process ensures a refined integration of user-specific requirements with the overarching data framework, enabling more precise and contextually relevant data retrieval and analysis.
3. Result
To evaluate the efficacy of our proposed network model, we conducted a performance assessment using a curated dataset of 100 geoscience documents. These documents were meticulously annotated to facilitate the detection of named entities, images, and tables. This approach allows for a comprehensive analysis of the model’s capabilities in accurately identifying and classifying various data types embedded within complex academic texts. The selection of geoscience literature specifically aims to test the model’s effectiveness across diverse content and intricate data presentations typical of this scientific field.
We compared the NER performance between the original UIE model and our fine-tuned UIE model, as detailed in Table 1. The results demonstrate that the fine-tuned UIE model significantly improved over the baseline model, which was trained on open, generic data. This enhancement underscores the importance of incorporating domain-specific knowledge into the training process. NER robustness typically necessitates substantial investment in human resources for annotation.
As part of our ongoing commitment to enhancing our platform, we will continuously improve the generalization capabilities of our system’s NER by engaging with geoscientists from diverse specializations. By integrating their expert annotations of domain-specific data modifications into our model iterations, we aim to refine our system’s performance progressively. This approach not only bolsters the accuracy of our NER system but also adapts it more effectively to the nuanced requirements of geoscience research.
For image detection, we employ the widely adopted YOLOv3 object detection model [29], chosen for its exceptional balance between accuracy and efficiency. To ensure optimal performance, we have fine-tuned YOLOv3 using a dataset of 422 images, each meticulously annotated by domain experts. The dataset was partitioned into training and testing sets at a 9:1 ratio, a strategy designed to rigorously evaluate the model under varied conditions. Table 2 provides a comprehensive overview of our network’s image recognition performance, detailing enhancements and outcomes from the fine-tuning process. This methodological approach ensures that our system not only achieves high accuracy but also maintains efficiency across real-world applications.
Table recognition presents a significant challenge due to the diversity of structures encountered. To enhance the accuracy of table detection, we fine-tuned the YOLOv3 model using the Tablebank dataset [43]. Combined with our specially designed table structure recognition algorithm (referenced in Algorithm 1), we conducted a comprehensive evaluation across 100 articles resulting in the recognition and detection of 423 tables. The performance outcomes of these tables are systematically documented and presented in Table 3. This approach not only validates the effectiveness of our model adjustments but also underscores the robustness of our algorithm in accurately identifying diverse table structures in academic texts.
To rigorously evaluate the effectiveness of our data fusion approach, we manually annotated and organized data from 100 scientific articles, which contain 2650 data points. This meticulous annotation served as a baseline for assessing the efficiency of our multi-modal target data recognition system. We compared the data fill rates achieved through the recognition of different modal data types, demonstrating the enhanced efficiency of our system after integrating these modalities. The specific results, which illustrate the performance improvements and efficacy of our designed system, are detailed in Table 4. This empirical assessment validates the robustness and practical utility of our data fusion methodology in handling complex datasets.
4. Discussion
This chapter focuses on delineating the fundamental components requisite for the establishment of the GeoKnowledgeFusion system, supplemented by the elucidation of two pertinent employment scenarios: Sm-Nd Data Extraction and Debris Flow Data Extraction. A comprehensive depiction of the GeoKnowledgeFusion workflow is provided in Figure 1, encapsulating four principal components: (1) PDF pre-processing, (2) target element recognition, (3) human-in-the-loop annotation, and (4) joint multimodal knowledge understanding.
4.1. PDF Pre-Processing Pipeline
To augment the efficiency of the data retrieval operations, our methodology integrates a preliminary stage that entails the pre-processing of all PDF documents. This initial phase involves the extraction and subsequent analytical evaluation of relevant metadata from each document. Upon completing this phase, we proceed with a data-wrangling operation to verify the extracted metadata’s accuracy and pertinence. The refined data are then systematically organized within a relational database, supporting structured storage and facilitating efficient retrieval. Following the organization phase, we develop an index for each document based on the curated metadata, serving as a foundational element. Employing keyword filtering techniques on these metadata enables our system to discerningly segregate the requisite PDF documents from a comprehensive document corpus. As shown in Figure 3, the pipeline of our PDF pre-processing is succinctly segmented into three core components: metadata extraction, data wrangling, and keyword filtering. This methodical and structured approach not only simplifies the retrieval process but also markedly enhances the accuracy and velocity of accessing pertinent data, underscoring the effectiveness of our data management strategy.
4.1.1. Metadata Extraction
To enhance the organization and structuring of literature within GeoKnowledgeFusion, we implement Grobid [57] for the automatic parsing of documents. GROBID utilizes an advanced cascade of sequence labeling models designed to optimize document parsing. This modular approach enables precise adaptation to the varied hierarchical structures of documents, ensuring data, features, and textual representations are aptly adjusted. Each model in this framework is equipped with a specific set of labels, facilitating a system where the collective application of these models produces detailed and structured outcomes. Notably, the segmentation model is critical in delineating primary document sections, such as the title page, header, body, headnotes, footnotes, and bibliographical sections. Through the processing capabilities of GROBID, textual areas within PDF documents are methodically classified and labeled. A thorough parsing of the content follows this initial step. Subsequently, by integrating the content with the structured labels generated from the model cascade, it is transformed into an Extensible Markup Language (XML) document, organized according to the specific labels obtained.
This intricate process highlights GROBID’s efficacy in converting unstructured data into well-structured and accessible digital formats. As depicted in Figure 4, this methodology ensures the accurate extraction and conversion of critical metadata—such as titles, abstracts, author details, publication information, and paragraph content—into XML documents. Moreover, for each PDF document, a relational data table is constructed, housing all pre-processed and parsed metadata, thereby enhancing the accessibility and management of document metadata within GeoKnowledgeFusion. This structured approach to metadata extraction underpins the efficient organization and retrieval of literature in our system.
4.1.2. Data Wrangling
The Data Wrangling phase entails a meticulous process to normalize the metadata extracted from PDF documents and subsequently store these refined data within a MySQL [58] database, adhering to a meticulously predefined schema. This phase involves adopting a sequence of preprocessing measures influenced by the methodologies suggested in [59]. These measures include a series of transformations aimed at enhancing the uniformity and clarity of the data. Such transformations encompass the conversion of all textual tokens to lowercase, the substitution of non-alphanumeric characters with spaces, the elimination of stop words (for example, “the”, “a”), and the elucidation of common abbreviations (e.g., substituting “Lat.” with “Latitude”). The primary objective of these preprocessing activities is to achieve the standardization and normalization of entity names, thus facilitating a heightened level of consistency and comparability for future search endeavors.
Moreover, regarding PDF documents subjected to the Metadata Extraction process, should the parsing operation be unsuccessful (manifested by the return of null values in PDF metadata), such data entries will be excluded from further consideration. In instances where null values are encountered in specific critical fields, these instances will be systematically addressed by populating the fields with “NaN” (Not a Number), thereby maintaining the integrity and continuity of the dataset.
Subsequent to these preparatory actions, we establish a relational database schema tailored specifically for the organization of academic papers, as delineated in Figure 5. The sanitized metadata are methodically cataloged within this structured framework in the MySQL database. Drawing upon the cleaned metadata, we meticulously construct four interrelated tables that revolve around the central entity of paper. These tables—Paper, Journal, Author, and Affiliation—serve as repositories for information pertinent to their respective domains, arranged according to the schema showcased in the figure. This strategic organization optimizes data retrieval and manipulation and lays a solid foundation for subsequent analytical tasks, exemplifying a coherent and scholarly approach to data management within academic research contexts. To date, our database has successfully processed and extracted metadata for 1,161,959 documents, which are now cataloged within the Paper table. This cumulative figure is subject to continuous growth as our efforts to process further PDF documents proceed. This ongoing database expansion underscores the dynamic and evolving nature of our data collection and management efforts.
4.1.3. Keyword Filtering
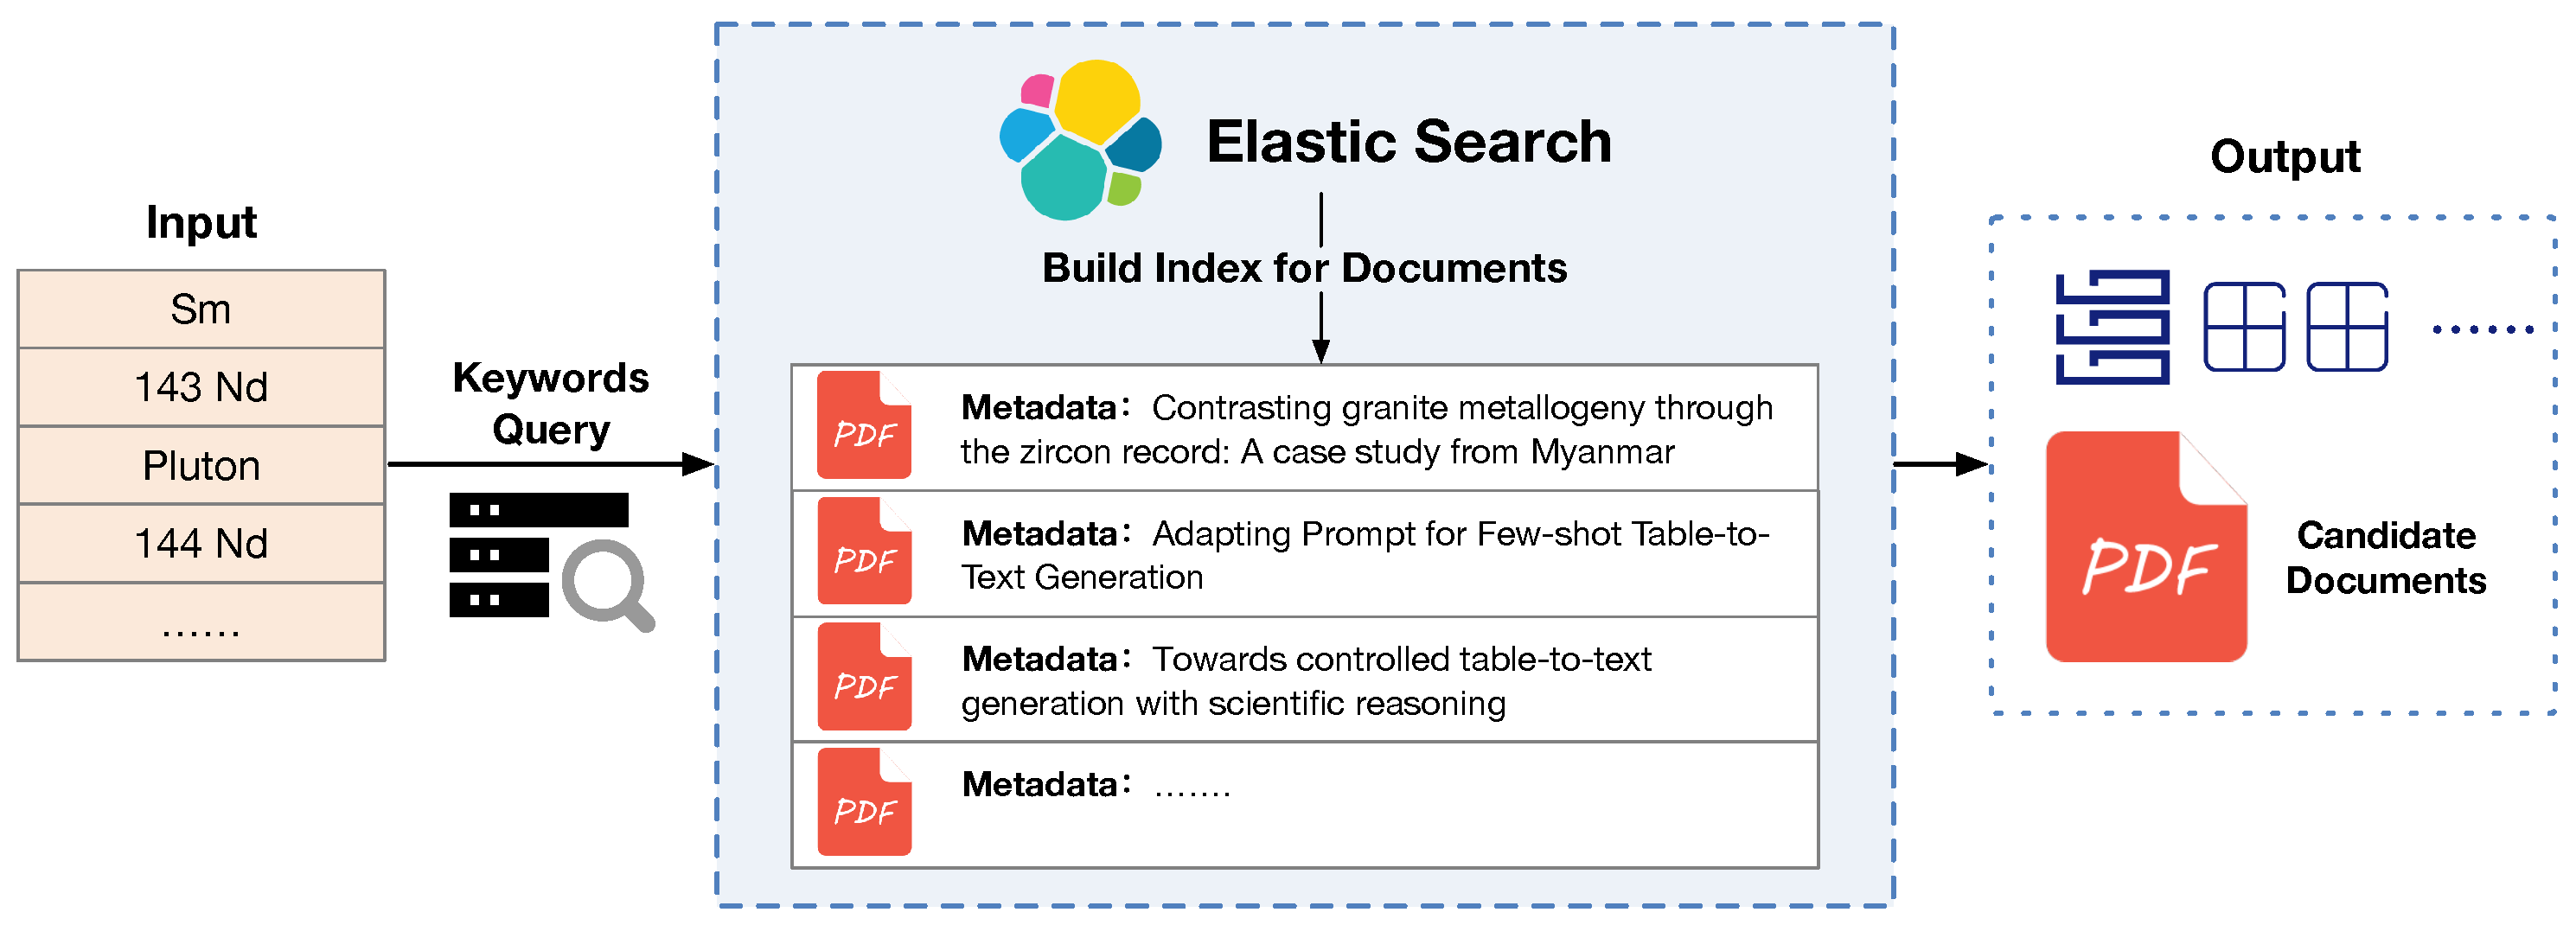
As shown in Figure 6, to systematically organize and facilitate the retrieval of documents, we construct an index for each document derived from its extracted metadata, encompassing the title, authors, abstract, publication venue, and year of publication. For this purpose, we employ Elasticsearch [60], a text search engine library renowned for its superior performance and wide acclaim. Elasticsearch provides an extensive suite of query capabilities, such as keyword, fuzzy, phrase, and aggregate searches, accommodating a broad spectrum of information retrieval needs.
In order to realize word-level search capabilities, we meticulously index the entirety of the data contained within the metadata database on a granular, word-by-word basis. This indexing strategy is complemented by adopting a predefined list of keywords curated by domain experts to steer the data retrieval process. When a keyword is detected within the title or abstract of a document, it is flagged as a candidate, significantly refining the scope of document selection. This precision in keyword-based filtering enables experts to efficiently sift through a large repository of potential candidates, isolating documents that warrant further examination. By leveraging this method, experts are empowered to pinpoint relevant documents with a high degree of efficacy, streamlining the research and analysis process in academic and professional contexts.
4.2. Target Element Recognition
To effectively integrate our designed models and algorithms into the system, we encapsulated them using Fast API and deployed them on a server. Specifically, the text recognition model along with the image and table detection models were deployed on a server equipped with an NVIDIA GeForce RTX 3090 GPU to facilitate real-time data inference. This strategic deployment not only leverages the computational power of advanced hardware but also ensures efficient and rapid processing capabilities critical for delivering immediate results in real-time applications.
4.3. Human-in-the-Loop Annotation
To address the accuracy limitations inherent in end-to-end model recognition, we have integrated a robust human-in-the-loop annotation process into our workflow. This process capitalizes on the expertise of human researchers to validate and enhance the precision and accuracy of all data collected and organized by our system. During the detailed manual verification phase, human annotators refine various components of the data, including image and table entity region detection, table structure identification, table content recognition, and the fusion of visual and tabular data. These essential modifications provide critical feedback that informs iterative updates to our model parameters, thus driving continuous enhancements in the performance and efficacy of the extraction process.
Specifically, for NER our system enables users to directly modify or remove identified entities or to highlight new ones within the text. For image and table detection, users can add, remove, or adjust the bounding boxes of detected objects. Regarding table structure recognition, the system allows users to add or delete rows or columns, merge table cells, and compile table contents. These interactive capabilities ensure that our data extraction methodologies remain dynamic and responsive to user input, significantly improving the reliability and applicability of the extracted data in various research contexts.
4.4. Sm-Nd Data Extraction
The existence of significant crustal growth during the Phanerozoic Eon has remained a challenging question within the field of Earth science. Previous studies have proposed various models to explain crustal growth, yet substantial discrepancies in the estimates have arisen due to variations in the chosen study objects and methodologies, leading to divergent outcomes. Earlier research often relied on limited isotopic data or statistical analyses of zircon age peaks, resulting in varying interpretations due to dissimilarities in the spatial and temporal distribution of data samples. Consequently, to accurately determine the nature and rate of continental crustal growth, particularly the variations in material composition and crustal growth across major orogenic belts since the Phanerozoic, it is crucial to gather a comprehensive set of sample data that represent crustal growth in these belts and reflect the extent of crustal accretion.
The utilization of Sm-Nd isotope data compilation and isotope mapping presents a valuable approach to address the limitations encountered in previous studies that relied on a restricted number of isotopes. This method allows for a more effective determination of crustal volume and growth rates. Therefore, it is crucial to collect and establish a comprehensive global isotope database with spatiotemporal information. The accomplishment of this study requires the extraction of relevant data tables and image data from a vast body of literature. It also requires the identification and extraction of long-tail data, as well as the prompt collection, organization, and assembly of relevant data by integrating information derived from the literature. The discovery and integration of Sm-Nd data encounter significant challenges due to the wide range of document types and significant variations in data formats. These obstacles impede the efficiency of data extraction, leading to a substantial portion of available data remaining untapped, which exemplifies the occurrence of the long-tail data phenomenon. To advance research in this area, geoscientists are employing GeoKnowledgeFusion, a tool capable of compiling Sm-Nd isotope data from an extensive collection of 1,015,498 geoscientific references.
A panel of experts provided 25 carefully selected keywords, including terms such as Sm, 143 Nd/144 Nd, and Pluton/Formation, to facilitate the filtering process. Using the provided keywords, we applied a keyword filtering mechanism that resulted in the selection of over 20,000 articles uploaded by area scientists for Sm-Nd data compilation. Subsequently, using a careful PDF document parsing procedure, we identified 3959 literature documents characterized by well-structured content and containing valuable Sm-Nd information tables. Within this subset of documents, a total of 9138 individual tables and more than 15,000 images were discovered, each encapsulating pertinent Sm-Nd data. By integrating and consolidating the extracted information, we successfully generated a comprehensive dataset containing 10,624 entries of relevant Sm-Nd data. This dataset serves as a valuable resource for further research and analysis in the field.
To assess the effectiveness of our platform, we performed a quantitative analysis of time consumption and data fill rate. As a baseline, we used a manually collected and curated set of 9000 Sm-Nd-related records using the same keywords. The time consumption provides insight into the time efficiency of our automated data process, while the data fill rate serves as a measure of the effectiveness of the data extraction process.
Figure 7 illustrates a comparison between human compilation and automatic compilation using the GeoKnowledgeFusion model network in terms of data fill rate and time consumption. As shown in Figure 7a, the automated processing workflow is able to accurately extract and merge the majority of fields, especially for metadata such as titles and other relevant information. However, when dealing with knowledge that requires joint multimodal data understanding, such as latitude, longitude, and age information, the current model network faces significant challenges due to the limited availability of domain-specific training data. As a result, it remains difficult to achieve satisfactory results in these cases. This observation underscores the importance of human involvement in the data collection process.
In contrast to the traditional manual approach of searching for the required data within PDF files, manually copying or entering the data cell by cell into a master spreadsheet, and then verifying its accuracy, Figure 7b demonstrates the significant improvement in processing efficiency that our automated workflow provides. The automated process achieves a significant increase in speed, approximately 27 times faster or more. Using our platform for batch data processing has the potential to significantly improve the effectiveness of data collection, organization, and validation, thereby reducing reliance on human resources.
4.5. Debris Flow Data Extraction
In the field of geoscience, the extraction of pertinent data from the literature for geological disaster monitoring and early warning services is increasingly recognized as critical. Our approach involves creating a comprehensive spatio-temporal knowledge graph based on project construction, which integrates diverse data sources including scientific literature related to geological disaster monitoring, spatial data, IoT sensing, and crowd-sourced intelligence. This integration is facilitated by a spatio-temporal knowledge graph construction management system, which is utilized to validate and refine techniques for geological disaster monitoring and early warning. This process includes the analysis of patterns, etiological diagnosis, forecasting, and the development of strategies for emergency response.
In practical application, we have utilized the GeoKnowledgeFusion system to process 16,185 academic articles from 136 journals uploaded by area scientists that pertain to debris flow disasters. Through this system, we have successfully extracted 14,665 data entries, specifically targeting nine categories of disaster-related keywords and 18 indicators of debris flow disasters. This targeted extraction process focuses on textual content, contrasting with the broader distribution of Sm-Nd data across the literature. Such a focused approach significantly enhances the specificity and relevance of the data extracted, thereby improving the efficiency and efficacy of our geological disaster knowledge services. This methodology not only streamlines the data processing workflow but also ensures that the information is directly applicable to enhancing disaster response and preparedness strategies.
Compared to traditional manual methods of compiling debris flow disaster-related data, the data collected through our system demonstrates a significant enhancement, exhibiting more than a 20% increase in completeness. Furthermore, our approach significantly optimizes efficiency, reducing the time required for data compilation by over 80%. This substantial improvement not only underscores the effectiveness of our system in data aggregation but also highlights its capability to streamline processes and reduce operational burdens in disaster data management.
5. Conclusions
This paper presents GeoKnowledgeFusion, an online platform for the extraction of visual and tabular data from the scientific literature. By extracting detailed data from tables and images within PDF documents, the resulting database achieves more comprehensive coverage across multiple dimensions, facilitating subsequent data analysis and modeling processes. Our platform offers significant advantages over manual data compilation, significantly increasing the efficiency of data collection while reducing the required investment in human resources. Leveraging the human-in-the-loop annotation paradigm, we strive to maximize the completion rate and ensure the accuracy of the extracted data.
While our automated processing workflow demonstrates robust performance in numerous scenarios, it is crucial to acknowledge the presence of certain technical limitations.
- The processing of documents that have been scanned and saved as images in PDF format still poses challenges. The effectiveness of text extraction heavily relies on the resolution of the scanned images, which makes it challenging to accurately recognize specific formulas and special characters.
- The current methods are constrained by the limitations of the training corpus. As a result, achieving satisfactory performance in comprehending complex visual and tabular data that have not been encountered before remains an ongoing challenge.
- Our current approach encounters difficulties in extracting knowledge from diverse data types, including text and equations. This particular challenge necessitates access to expensive and high-quality labeled corpora for training purposes.
We have successfully implemented two application cases: the extraction of elements related to mountain disasters and global orogenic zones. As a sustainable geoscience data processing platform, our objective is to create a one-stop, flexible, and universally applicable multi-modal data processing platform that dismantles the barriers between images, tables, and text. As shown in Figure 8, by developing customizable keyword lists we enhance the adaptability and breadth of our data processing capabilities. The continuous preservation of annotated data facilitates iterative updates to our backend models, progressively augmenting the efficiency and capabilities of our data processing operations. This strategy is designed to cater to geoscience experts across a spectrum of fields, empowering them to fully exploit our platform for a wide array of research needs. This structured approach is part of our commitment to delivering a comprehensive and robust toolkit that meets the intricate requirements of geoscience data analysis and integration.
Author Contributions
Z.G.: Conceptualization (equal); methodology (equal); software (equal); validation (lead); writing—original draft (lead). C.W.: Conceptualization (equal); data validation (equal). J.Z.: Software (equal); writing—review and editing (equal). G.Z.: Conceptualization (equal); formal analysis (equal); methodology (equal); project administration (equal); supervision (lead); writing—review and editing (equal). X.W.: Project administration (equal); supervision (equal). C.Z.: Project administration (equal). All authors have read and agreed to the published version of the manuscript.
Funding
This work was partially supported by NSF China (No. 42050105, 62272301, 62020106005, 62061146002, 61960206002), National Key R&D Program of China (No. 2022YFB3904204).
Data Availability Statement
The source codes are available for download at the link: https://github.com/sjtugzx/GeoKnowledgeFusion, accessed on 1 June 2023.
Conflicts of Interest
The authors declare no conflicts of interest.
References
- Cajal, S. Reglas y Consejos Sobre Investigación Científica: Los Tónicos de la Voluntad (1897); Translated from Spanish to English by Swanson, N.; Swanson, L.W.; Advice for a Young Investigator; Espasa Calpe: Madrid, Spain, 1999. [Google Scholar]
- Nativi, S.; Mazzetti, P.; Santoro, M.; Papeschi, F.; Craglia, M.; Ochiai, O. Big data challenges in building the global earth observation system of systems. Environ. Model. Softw. 2015, 68, 1–26. [Google Scholar] [CrossRef]
- Kinkade, D.; Shepherd, A. Geoscience data publication: Practices and perspectives on enabling the FAIR guiding principles. Geosci. Data J. 2022, 9, 177–186. [Google Scholar] [CrossRef]
- Hoeppe, G. Encoding Collective Knowledge, Instructing Data Reusers: The Collaborative Fixation of a Digital Scientific Data Set. Comput. Support. Coop. Work (CSCW) 2021, 30, 463–505. [Google Scholar] [CrossRef] [PubMed]
- Sudmanns, M.; Tiede, D.; Lang, S.; Bergstedt, H.; Trost, G.; Augustin, H.; Baraldi, A.; Blaschke, T. Big Earth data: Disruptive changes in Earth observation data management and analysis? Int. J. Digit. Earth 2020, 13, 832–850. [Google Scholar] [CrossRef] [PubMed]
- Boone, S.C.; Dalton, H.; Prent, A.; Kohlmann, F.; Theile, M.; Gréau, Y.; Florin, G.; Noble, W.; Hodgekiss, S.A.; Ware, B.; et al. AusGeochem: An Open Platform for Geochemical Data Preservation, Dissemination and Synthesis. Geostand. Geoanal. Res. 2022, 46, 245–259. [Google Scholar] [CrossRef]
- Walker, J.; Lehnert, K.; Hofmann, A.; Sarbas, B.; Carlson, R. EarthChem: International collaboration for solid earth geochemistry in geoinformatics. In Proceedings of the AGU Fall Meeting Abstracts, Austin, TX, USA, 17–21 October 2005; Volume 2005, p. IN44A-03. [Google Scholar]
- Niu, X. An ontology driven relational geochemical database for the Earth’s Critical Zone: CZchemDB. J. Environ. Inform. 2014, 23, 10–23. [Google Scholar] [CrossRef]
- Rodriguez-Corcho, A.F.; Rojas-Agramonte, Y.; Barrera-Gonzalez, J.A.; Marroquin-Gomez, M.P.; Bonilla-Correa, S.; Izquierdo-Camacho, D.; Delgado-Balaguera, S.M.; Cartwright-Buitrago, D.; Munoz-Granados, M.D.; Caranton-Mateus, W.G.; et al. The Colombian geochronological database (CGD). Int. Geol. Rev. 2022, 64, 1635–1669. [Google Scholar] [CrossRef]
- Wang, X.; Kang, H.; Fu, L.; Yao, L.; Ding, J.; Wang, J.; Gan, X.; Zhou, C.; Hopcroft, J.E. Quantifying knowledge from the perspective of information structurization. PLoS ONE 2023, 18, e0279314. [Google Scholar] [CrossRef]
- Jimeno Yepes, A.; Zhong, P.; Burdick, D. ICDAR 2021 competition on scientific literature parsing. In Lecture Notes in Computer Science, Proceedings of the Document Analysis and Recognition–ICDAR 2021: 16th International Conference, Lausanne, Switzerland, 5–10 September 2021; Proceedings, Part IV 16; Springer: Cham, Switzerland, 2021; pp. 605–617. [Google Scholar]
- Li, J.; Sun, A.; Han, J.; Li, C. A survey on deep learning for named entity recognition. IEEE Trans. Knowl. Data Eng. 2020, 34, 50–70. [Google Scholar] [CrossRef]
- Gao, H.; Huang, D.; Yang, Y. Word-level Chinese named entity recognition based on segmentation digraph. In Proceedings of the 2005 International Conference on Natural Language Processing and Knowledge Engineering, Wuhan, China, 30 October–1 November 2005; pp. 380–383. [Google Scholar]
- Bhasuran, B.; Murugesan, G.; Abdulkadhar, S.; Natarajan, J. Stacked ensemble combined with fuzzy matching for biomedical named entity recognition of diseases. J. Biomed. Inform. 2016, 64, 1–9. [Google Scholar] [CrossRef] [PubMed]
- Zhang, S.; Qin, Y.; Hou, W.J.; Wang, X. Word segmentation and named entity recognition for sighan bakeoff3. In Proceedings of the Fifth SIGHAN Workshop on Chinese Language Processing, Sydney, Australia, 22–23 July 2006; pp. 158–161. [Google Scholar]
- Li, L.; Zhou, R.; Huang, D. Two-phase biomedical named entity recognition using CRFs. Comput. Biol. Chem. 2009, 33, 334–338. [Google Scholar] [CrossRef] [PubMed]
- Morwal, S.; Jahan, N.; Chopra, D. Named entity recognition using hidden Markov model (HMM). Int. J. Nat. Lang. Comput. (IJNLC) 2012, 1. [Google Scholar] [CrossRef]
- Szarvas, G.; Farkas, R.; Kocsor, A. A multilingual named entity recognition system using boosting and c4. 5 decision tree learning algorithms. In Lecture Notes in Computer Science, Proceedings of the Discovery Science: 9th International Conference, DS 2006, Barcelona, Spain, 7–10 October 2006; Proceedings 9; Springer: Berlin/Heidelberg, Germany, 2006; pp. 267–278. [Google Scholar]
- Chieu, H.L.; Ng, H.T. Named entity recognition with a maximum entropy approach. In Proceedings of the Seventh Conference on Natural Language Learning at HLT-NAACL 2003, Edmonton, AB, Canada, 31 May–1 June 2003; pp. 160–163. [Google Scholar]
- Chen, H.; Lin, Z.; Ding, G.; Lou, J.; Zhang, Y.; Karlsson, B. GRN: Gated relation network to enhance convolutional neural network for named entity recognition. In Proceedings of the AAAI Conference on Artificial Intelligence, Honolulu, HI, USA, 27 January–1 February 2019; Volume 33, pp. 6236–6243. [Google Scholar]
- Liu, Z.; Yang, M.; Wang, X.; Chen, Q.; Tang, B.; Wang, Z.; Xu, H. Entity recognition from clinical texts via recurrent neural network. BMC Med. Inform. Decis. Mak. 2017, 17, 53–61. [Google Scholar] [CrossRef] [PubMed]
- Li, P.H.; Dong, R.P.; Wang, Y.S.; Chou, J.C.; Ma, W.Y. Leveraging linguistic structures for named entity recognition with bidirectional recursive neural networks. In Proceedings of the 2017 Conference on Empirical Methods in Natural Language Processing, Copenhagen, Denmark, 7–11 September 2017; pp. 2664–2669. [Google Scholar]
- Fang, Z.; Cao, Y.; Li, Q.; Zhang, D.; Zhang, Z.; Liu, Y. Joint entity linking with deep reinforcement learning. In Proceedings of the World Wide Web Conference, Auckland, New Zealand, 26–30 October 2019; pp. 438–447. [Google Scholar]
- Lu, Y.; Liu, Q.; Dai, D.; Xiao, X.; Lin, H.; Han, X.; Sun, L.; Wu, H. Unified Structure Generation for Universal Information Extraction. In Proceedings of the 60th Annual Meeting of the Association for Computational Linguistics (Volume 1: Long Papers), Dublin, Ireland, 22–27 May 2022; pp. 5755–5772. [Google Scholar]
- Ren, S.; He, K.; Girshick, R.; Sun, J. Faster R-CNN: Towards real-time object detection with region proposal networks. IEEE Trans. Pattern Anal. Mach. Intell. 2016, 39, 1137–1149. [Google Scholar] [CrossRef] [PubMed]
- He, K.; Gkioxari, G.; Dollár, P.; Girshick, R. Mask r-cnn. In Proceedings of the IEEE International Conference on Computer Vision, Venice, Italy, 22–29 October 2017; pp. 2961–2969. [Google Scholar]
- Memon, J.; Sami, M.; Khan, R.A.; Uddin, M. Handwritten optical character recognition (OCR): A comprehensive systematic literature review (SLR). IEEE Access 2020, 8, 142642–142668. [Google Scholar] [CrossRef]
- Wang, J.; Tang, J.; Yang, M.; Bai, X.; Luo, J. Improving OCR-based image captioning by incorporating geometrical relationship. In Proceedings of the IEEE/CVF Conference on Computer Vision and Pattern Recognition, Nashville, TN, USA, 20–25 June 2021; pp. 1306–1315. [Google Scholar]
- Redmon, J.; Farhadi, A. Yolov3: An incremental improvement. arXiv 2018, arXiv:1804.02767. [Google Scholar]
- Gilani, A.; Qasim, S.R.; Malik, I.; Shafait, F. Table detection using deep learning. In Proceedings of the 2017 14th IAPR International Conference on Document Analysis and Recognition (ICDAR), Kyoto, Japan, 9–15 November 2017; Volume 1, pp. 771–776. [Google Scholar]
- Schreiber, S.; Agne, S.; Wolf, I.; Dengel, A.; Ahmed, S. Deepdesrt: Deep learning for detection and structure recognition of tables in document images. In Proceedings of the 2017 14th IAPR International Conference on Document Analysis and Recognition (ICDAR), Kyoto, Japan, 9–15 November 2017; Volume 1, pp. 1162–1167. [Google Scholar]
- Sun, N.; Zhu, Y.; Hu, X. Faster R-CNN based table detection combining corner locating. In Proceedings of the 2019 International Conference on Document Analysis and Recognition (ICDAR), Sydney, NSW, Australia, 20–25 September 2019; pp. 1314–1319. [Google Scholar]
- Zheng, X.; Burdick, D.; Popa, L.; Zhong, X.; Wang, N.X.R. Global table extractor (gte): A framework for joint table identification and cell structure recognition using visual context. In Proceedings of the IEEE/CVF Winter Conference on Applications of Computer Vision, Virtual, 5–9 January 2021; pp. 697–706. [Google Scholar]
- Riba, P.; Dutta, A.; Goldmann, L.; Fornés, A.; Ramos, O.; Lladós, J. Table detection in invoice documents by graph neural networks. In Proceedings of the 2019 International Conference on Document Analysis and Recognition (ICDAR), Sydney, NSW, Australia, 20–25 September 2019; pp. 122–127. [Google Scholar]
- Li, Y.; Gao, L.; Tang, Z.; Yan, Q.; Huang, Y. A GAN-based feature generator for table detection. In Proceedings of the 2019 International Conference on Document Analysis and Recognition (ICDAR), Sydney, NSW, Australia, 20–25 September 2019; pp. 763–768. [Google Scholar]
- Zucker, A.; Belkada, Y.; Vu, H.; Nguyen, V.N. ClusTi: Clustering method for table structure recognition in scanned images. Mob. Netw. Appl. 2021, 26, 1765–1776. [Google Scholar] [CrossRef]
- Koci, E.; Thiele, M.; Lehner, W.; Romero, O. Table recognition in spreadsheets via a graph representation. In Proceedings of the 2018 13th IAPR International Workshop on Document Analysis Systems (DAS), Vienna, Austria, 24–27 April 2018; pp. 139–144. [Google Scholar]
- Raja, S.; Mondal, A.; Jawahar, C. Table structure recognition using top-down and bottom-up cues. In Lecture Notes in Computer Science, Proceedings of the Computer Vision–ECCV 2020: 16th European Conference, Glasgow, UK, 23–28 August 2020; Proceedings, Part XXVIII 16; Springer: Cham, Switzerland, 2020; pp. 70–86. [Google Scholar]
- Paliwal, S.S.; Vishwanath, D.; Rahul, R.; Sharma, M.; Vig, L. Tablenet: Deep learning model for end-to-end table detection and tabular data extraction from scanned document images. In Proceedings of the 2019 International Conference on Document Analysis and Recognition (ICDAR), Sydney, NSW, Australia, 20–25 September 2019; pp. 128–133. [Google Scholar]
- Siddiqui, S.A.; Khan, P.I.; Dengel, A.; Ahmed, S. Rethinking semantic segmentation for table structure recognition in documents. In Proceedings of the 2019 International Conference on Document Analysis and Recognition (ICDAR), Sydney, NSW, Australia, 20–25 September 2019; pp. 1397–1402. [Google Scholar]
- Khan, S.A.; Khalid, S.M.D.; Shahzad, M.A.; Shafait, F. Table structure extraction with bi-directional gated recurrent unit networks. In Proceedings of the 2019 International Conference on Document Analysis and Recognition (ICDAR), Sydney, NSW, Australia, 20–25 September 2019; pp. 1366–1371. [Google Scholar]
- Gao, L.; Huang, Y.; Déjean, H.; Meunier, J.L.; Yan, Q.; Fang, Y.; Kleber, F.; Lang, E. ICDAR 2019 competition on table detection and recognition (cTDaR). In Proceedings of the 2019 International Conference on Document Analysis and Recognition (ICDAR), Sydney, NSW, Australia, 20–25 September 2019; pp. 1510–1515. [Google Scholar]
- Li, M.; Cui, L.; Huang, S.; Wei, F.; Zhou, M.; Li, Z. Tablebank: Table benchmark for image-based table detection and recognition. In Proceedings of the Twelfth Language Resources and Evaluation Conference, Marseille, France, 11–16 May 2020; pp. 1918–1925. [Google Scholar]
- Lu, J.; Batra, D.; Parikh, D.; Lee, S. ViLBERT: Pretraining task-agnostic visiolinguistic representations for vision-and-language tasks. In Proceedings of the 33rd International Conference on Neural Information Processing Systems, Vancouver, BC, Canada, 8 December 2019; pp. 13–23. [Google Scholar]
- Li, L.H.; Yatskar, M.; Yin, D.; Hsieh, C.J.; Chang, K.W. Visualbert: A simple and performant baseline for vision and language. arXiv 2019, arXiv:1908.03557. [Google Scholar]
- Tan, H.; Bansal, M. Lxmert: Learning cross-modality encoder representations from transformers. arXiv 2019, arXiv:1908.07490. [Google Scholar]
- Li, G.; Duan, N.; Fang, Y.; Gong, M.; Jiang, D. Unicoder-vl: A universal encoder for vision and language by cross-modal pre-training. In Proceedings of the AAAI Conference on Artificial Intelligence, New York, NY, USA, 7–12 February 2020; Volume 34, pp. 11336–11344. [Google Scholar]
- Su, W.; Zhu, X.; Cao, Y.; Li, B.; Lu, L.; Wei, F.; Dai, J. Vl-bert: Pre-training of generic visual-linguistic representations. arXiv 2019, arXiv:1908.08530. [Google Scholar]
- Cervato, C.; Bohling, G.; Loepp, C.; Taylor, T.; Snyder, W.; Diver, P.; Reed, J.; Fils, D.; Greer, D.; Tang, X. The CHRONOS System: Geoinformatics for sedimentary geology and paleobiology. In Proceedings of the 2005 IEEE International Symposium on Mass Storage Systems and Technology, Sardinia, Italy, 20–24 June 2005; pp. 182–186. [Google Scholar]
- Snyder, W.; Lehnert, K.; Ito, E.; Harms, U.; Klump, J. GeosciNET: Building a Global Geoinformatics Partnership. In Proceedings of the AGU Fall Meeting Abstracts, San Francisco, CA, USA, 15–19 December 2008; Volume 2008, p. IN31D-03. [Google Scholar]
- Zhang, C.; Govindaraju, V.; Borchardt, J.; Foltz, T.; Ré, C.; Peters, S. GeoDeepDive: Statistical inference using familiar data-processing languages. In Proceedings of the 2013 ACM SIGMOD International Conference on Management of Data, New York, NY, USA, 22–27 June 2013; pp. 993–996. [Google Scholar]
- Khan, A.; Kim, T.; Byun, H.; Kim, Y. SciSpace: A scientific collaboration workspace for geo-distributed HPC data centers. Future Gener. Comput. Syst. 2019, 101, 398–409. [Google Scholar] [CrossRef]
- Govindaraju, V.; Zhang, C.; Ré, C. Understanding tables in context using standard NLP toolkits. In Proceedings of the 51st Annual Meeting of the Association for Computational Linguistics (Volume 2: Short Papers), Sofia, Bulgaria, 4–9 August 2013; pp. 658–664. [Google Scholar]
- Sun, Z.; Sandoval, L.; Crystal-Ornelas, R.; Mousavi, S.M.; Wang, J.; Lin, C.; Cristea, N.; Tong, D.; Carande, W.H.; Ma, X.; et al. A review of earth artificial intelligence. Comput. Geosci. 2022, 159, 105034. [Google Scholar] [CrossRef]
- Zhang, S.; Xu, H.; Jia, Y.; Wen, Y.; Wang, D.; Fu, L.; Wang, X.; Zhou, C. GeoDeepShovel: A platform for building scientific database from geoscience literature with AI assistance. Geosci. Data J. 2022, 10, 519–537. [Google Scholar] [CrossRef]
- Devlin, J.; Chang, M.W.; Lee, K.; Toutanova, K. Bert: Pre-training of deep bidirectional transformers for language understanding. arXiv 2018, arXiv:1810.04805. [Google Scholar]
- Romary, L.; Lopez, P. Grobid-information extraction from scientific publications. ERCIM News 2015, 100. [Google Scholar]
- Christudas, B.; Christudas, B. MySQL; Springer: Berlin/Heidelberg, Germany, 2019. [Google Scholar]
- Croft, W.B.; Metzler, D.; Strohman, T. Search Engines: Information Retrieval in Practice; Addison-Wesley: Reading, MA, USA, 2010; Volume 520. [Google Scholar]
- Elasticsearch, B. Elasticsearch. Softw. Version 2018, 6. [Google Scholar]
- Wang, T.; Xiao, W.; Collins, W.J.; Tong, Y.; Hou, Z.; Huang, H.; Han, B. Quantitative characterization of orogens through isotopic mapping. Commun. Earth Environ. 2023, 4, 110. [Google Scholar] [CrossRef]
Figure 1.
An overview of the GeoKnowledgeFusion workflow, which consists of four main components: (a) PDF pre-processing, (b) target element recognition, (c) human-in-the-loop annotation, and (d) joint multimodal knowledge understanding.
Figure 1.
An overview of the GeoKnowledgeFusion workflow, which consists of four main components: (a) PDF pre-processing, (b) target element recognition, (c) human-in-the-loop annotation, and (d) joint multimodal knowledge understanding.

Figure 2.
An overview of the model network for target element recognition, including named entity, image, and table.
Figure 2.
An overview of the model network for target element recognition, including named entity, image, and table.

Figure 3.
PDF prep-process pipeline.

Figure 4.
An overview of the metadata extraction process.

Figure 5.
The schema of the metadata database.

Figure 6.
An overview of the Keyword filtering process.

Figure 7.
Comparison of data fill rate and time consumption between human compilation and automatic compilation via the GeoKnowledgeFusion model network. The left part of the figure illustrates the data fill rate of human compilation and automatic compilation, while the right part presents a comparison of the time consumption between human compilation and automatic compilation.

Figure 8.
An overview of our future work for GeoKnowledgeFusion system. The related Sm-Nd dataset construction has been used to support the research of [61].
Figure 8.
An overview of our future work for GeoKnowledgeFusion system. The related Sm-Nd dataset construction has been used to support the research of [61].


Table 1.
NER recall result.
| Position | Method | Entity Name | Time | Disaster Type | Damage Loss | Disaster Magnitude | Influence Factors | Prevention Measures | Reason of Disaster Formation | Disaster Chain | |
|---|---|---|---|---|---|---|---|---|---|---|---|
| UIE | 64.67% | 62.54% | 13.43% | 88.98% | 40.94% | 34.41% | 24.00% | 42.01% | 15.53% | 13.19% | 16.00% |
| Finetuned UIE | 83.36% | 70.95% | 94.32% | 92.64% | 75.59% | 73.98% | 78.65% | 67.46% | 61.15% | 32.52% | 44.83% |
Table 2.
Precision results of image detection of geoscientific literature. IoU denotes the intersection of the union of the labeled and predicted bounding boxes.
Table 2.
Precision results of image detection of geoscientific literature. IoU denotes the intersection of the union of the labeled and predicted bounding boxes.
| IoU | 0.5 | 0.75 | 0.9 |
| Precision | 95.4% | 72.9% | 7% |
Table 3.
Table region detection, structure recognition, and content recognition precision.
| Region Detection (IoU = 0.5) | Structure Recognition | Content Recognition |
|---|---|---|
| 93.5% | 91.7% | 91.9% |
Table 4.
Knowledge Fusion Rate.
| Table Recognition | Finetuned UIE | Multimodal Model Network | Human Annotation | |
|---|---|---|---|---|
| Filling Rate (%) | 58.7 | 12.3 | 71.0 | 85.6 |
Disclaimer/Publisher’s Note: The statements, opinions and data contained in all publications are solely those of the individual author(s) and contributor(s) and not of MDPI and/or the editor(s). MDPI and/or the editor(s) disclaim responsibility for any injury to people or property resulting from any ideas, methods, instructions or products referred to in the content. |
© 2024 by the authors. Licensee MDPI, Basel, Switzerland. This article is an open access article distributed under the terms and conditions of the Creative Commons Attribution (CC BY) license (https://creativecommons.org/licenses/by/4.0/).
Share and Cite
MDPI and ACS Style
Guo, Z.; Wang, C.; Zhou, J.; Zheng, G.; Wang, X.; Zhou, C. GeoKnowledgeFusion: A Platform for Multimodal Data Compilation from Geoscience Literature. Remote Sens. 2024, 16, 1484. https://doi.org/10.3390/rs16091484
AMA Style
Guo Z, Wang C, Zhou J, Zheng G, Wang X, Zhou C. GeoKnowledgeFusion: A Platform for Multimodal Data Compilation from Geoscience Literature. Remote Sensing. 2024; 16(9):1484. https://doi.org/10.3390/rs16091484
Chicago/Turabian StyleGuo, Zhixin, Chaoyang Wang, Jianping Zhou, Guanjie Zheng, Xinbing Wang, and Chenghu Zhou. 2024. "GeoKnowledgeFusion: A Platform for Multimodal Data Compilation from Geoscience Literature" Remote Sensing 16, no. 9: 1484. https://doi.org/10.3390/rs16091484
Note that from the first issue of 2016, this journal uses article numbers instead of page numbers. See further details here.