Article

Revealing Subtle Active Tectonic Deformation: Integrating Lidar, Photogrammetry, Field Mapping, and Geophysical Surveys to Assess the Late Quaternary Activity of the Sava Fault (Southern Alps, Slovenia)

1
Geological Survey of Slovenia, Dimičeva ul. 14, 1000 Ljubljana, Slovenia
2
Department of Archeology, Faculty of Arts, University of Ljubljana, Aškerčeva c. 2, 1000 Ljubljana, Slovenia
3
Gearh d.o.o., Radvanjska cesta 13, 2000 Maribor, Slovenia
4
Institute of Geosciences, Friedrich-Schiller-Universität Jena, Burgweg 11, 07749 Jena, Germany
5
Leibniz Institute for Applied Geophysics LIAG Hannover, Stilleweg 2, 30655 Hannover, Germany
6
Department of Geosciences, University of Tübingen, Schnarrenbergstr. 94–96, 72076 Tübingen, Germany
7
Department of Geology, Faculty of Natural Sciences and Engineering, University of Ljubljana, Aškerčeva c. 12, 1000 Ljubljana, Slovenia
*
Author to whom correspondence should be addressed.
Remote Sens. 2024, 16(9), 1490; https://doi.org/10.3390/rs16091490
Submission received: 20 February 2024 / Revised: 11 April 2024 / Accepted: 12 April 2024 / Published: 23 April 2024

Abstract

:
We applied an interdisciplinary approach to analyze the late Quaternary activity of the Sava Fault in the Slovenian Southern Alps. The Sava Fault is an active strike-slip fault, and part of the Periadriatic Fault System that accommodated the convergence of Adria and Europe. It is one of the longest faults in the Southern Alps. Using high-resolution digital elevation models from lidar and photogrammetric surveys, we were able to overcome the challenges of assessing fault activity in a region with intense surface processes, dense vegetation, and relatively low fault slip rates. By integrating remote sensing analysis, geomorphological mapping, structural geological investigations, and near-surface geophysics (electrical resistivity tomography and ground penetrating radar), we were able to find subtle geomorphological indicators, detect near-surface deformation, and show distributed surface deformation and a complex fault pattern. Using optically stimulated luminescence dating, we tentatively estimated a slip rate of 1.8 ± 0.4 mm/a for the last 27 ka, which exceeds previous estimates and suggests temporal variability in fault behavior. Our study highlights the importance of modern high-resolution remote sensing techniques and interdisciplinary approaches in detecting tectonic deformation in relatively low-strain rate environments with intense surface processes. We show that slip rates can vary significantly depending on the studied time window. This is a critical piece of information since slip rates are a key input parameter for seismic hazard studies.

1. Introduction

High-resolution digital elevation models (DEMs) acquired using lidar and photogrammetric surveys have become a valuable part of studies estimating the rate of fault activity (e.g., [1]). They are even more useful in high-relief areas with high precipitation and erosion rates, dense vegetation, and low fault slip rates, where geomorphic indicators of fault activity tend to disappear rapidly or are reshaped by non-tectonic processes [2]. Using high-resolution DEMs in such an environment can help to recognize small-scaled geomorphic indicators for fault activity, enabling us to infer fault slip rates (e.g., [3,4,5,6,7]) and locate paleoseismic trenches to study past seismicity (e.g., [8,9,10,11]). In addition to investigating surface deformation, shallow subsurface investigations, including geophysical techniques with a range of tens of meters, can confirm the presence of young tectonic deformation along faults, help to precisely constrain their location, and understand the shallow geometry of the deformation structure [8,12,13,14,15].
According to the European database of seismogenic faults (EFSM20; [16,17]), the Sava Fault, in the Southern Alps of Slovenia, is possibly one of the most active and longest faults in the entire European Alps. However, many aspects of the structure are still unknown or debated, for example, its total offset, earthquake history, and slip rate. Here we present new data on the late Quaternary activity of the fault that we obtained with an interdisciplinary approach using high-resolution geomorphological mapping, remote sensing analyses, near-surface geophysics (<50 m), and one optically stimulated luminescence age of offset markers. Our data provide the foundation for planning future paleoseismological research on the fault to complement our findings. These findings shed new light on the deformation partitioning across the Adria–Europe contact zone and contribute to the understanding of fault dynamics in the region.

2. Sava Fault

The Sava Fault is an approximately 150 km long (Fella and Sava faults together approximately 200 km), dextral transpressive fault, belonging to the Periadriatic Fault System (PAFS) [18,19] in the compressive to transpressive contact zone between the Adria Microplate and the European Plate [20]. From a geological and structural point of view, it represents the southernmost fault of the PAFS in the southeastern Alps (Figure 1A) and is possibly one of the most active faults in the area [21,22]. It has been active at least in the last 6 Ma as a dextral transpressive structure and has had a significant impact on the geology and topography of the area [23,24].
The fault can be divided into several sections with distinct characteristics. The westernmost fault section runs along the Upper Sava Valley, which was affected by the last glaciation during MIS 2 [25,26,27,28,29,30] and intensive postglacial to recent slope processes, hiding possible evidence for fault activity in this section (Figure 1B). Between Jesenice and Godič, the fault runs along the northern boundary of the Ljubljana Basin, where its surficial traces are more evident. Further east, the fault runs between the Kamnik-Savinja Alps and the Sava Folds, where its geomorphic expression is less clear. In its central part, along the Ljubljana Basin, the surface trace of the fault is composed of several segments ranging from 3.5 to 15.5 km in length, with stepovers up to 1 km wide [23]. Between Jesenice and Preddvor, the NW-SE segments have dextral kinematics, while in the restraining band between Preddvor and Godič, they are dextral to reverse and approximately E-W oriented. The restraining band comprises four reverse fault segments, with the southernmost one, the Cerklje segment, traversing and deforming a Quaternary alluvial fan, producing a 3.5 km long and up to 5 m high fault scarp [23].
Figure 1. (A)—Seismotectonic setting in the Southern Alps of Slovenia; faults are summarized from [22,31], instrumental and historical earthquakes are from ESHM20 database [16], focal mechanisms Mw ≥ 5 [32,33,34,35], 1348 earthquake epicenter marked with yellow star is from the latest study of archive data [36], evidence for coseismic environmental effects associated to historical earthquakes are slope failures in Dobrač (1) and Veliki vrh (2), and archaeoseismological evidence from Celeia (3), basemap is from Copernicus DEM 1.1, inset map with location of the study area using ESRI World Terrain Base. (B)—Sava Fault traces between the Upper Sava Valley and Sava Folds; extent of glaciers in the last glacial maximum (modified from [37]), basemap is from Copernicus DEM 1.1. (C)—3D view on the study area between Golnik and Preddvor; shaded relief of lidar data [38].
Remotesensing 16 01490 g001
Quaternary activity of the Sava Fault has previously been estimated from displaced geomorphological indicators in the central part of the fault [21,23]. A slip rate of 0.5–0.9 mm/a in the last 2 Ma was estimated on the strike-slip segments, based on the offset Tržiška Bistrica terrace and Kokra alluvial fan apexes. An uplift rate of 0.1 mm/year in the last 50 ka was estimated on the reverse Cerklje segment based on the height of a scarp in Late Pleistocene alluvial fan [23]. The long-term impact on topography is also most visible in the central part of the fault (Figure 1B,C). Major rivers are dextrally deviated by several kilometers along the fault, with two sets of displacement observed, 1–2 km and 4–5 km, whereas smaller streams exhibit about 400 m of dextral deviation [21,23]. Additionally, vertical movements influence the rivers, which change from incisional to depositional regimes as they cross the fault in a downstream direction.
To estimate the average slip rate over longer periods of time, 20–30 km separation of presumably displaced Oligocene units was used ([21] and references therein). However, larger separation estimates of up to 70 km were also proposed [39]. This displacement represents the entire right-lateral slip along the Sava Fault since its inception. Depending on the assumed total offset and time of inception, the fault’s geologically determined slip rate is estimated to be 1–5 mm/year in the last 20–6 Ma.
GNSS data in the 1996–2002 period suggest dextral movement at a rate of about 1.2 mm/a [40], which roughly fits the Quaternary slip rate estimates based on geomorphological indicators. Therefore, the geomorphological, geological, and GNSS-estimated slip rates at least partially agree. Conversely, the modeled recent rates are one to two orders of magnitude lower (0.05–0.15 mm/a) [41,42]. Considering all data and their uncertainties, we assume that a reliable slip rate along the Sava Fault in the last 2 Ma could be 0.5–1.5 mm/a [22,23]. As this range of estimates derives from highly heterogenous data, it therefore needs to be refined. With new high-resolution DEMs we could obtain new Quaternary archives of the fault activity to check the Quaternary slip rate estimations and compare them with other estimations.
The Sava Fault is considered to be one of the most significant seismic sources included in the seismic hazard model of Slovenia [43,44]. On the basis of fault length and area, it could generate earthquakes with magnitudes up to 6.8 on individual sections, and of maximum magnitude 7.3 in the less likely event of a rupture involving the entire western part of the fault [22,43]. The fault, especially its western part (also known as the Fella-Sava Fault on Italian territory [45,46]; Figure 1A), is also a possible source of the 1348 Villach earthquake [36,47,48]. The latest study on this event estimates the maximum intensity to be Imax = IX-X and a moment magnitude (Mw) of 6.6 [36]. Large slope failures occurred at the Dobrač (German spelling: Dobratsch) mountain in Carinthia, with 150 million m3 of material [49], and most likely also in Veliki Vrh in Slovenia (20–100 million m3 of material; [49,50,51]; Figure 1A). Archeological evidence for damage that could be associated with an older severe earthquake occurred before 350 CE was found in the town of Celje (Roman name is Celeia) near the easternmost part of the Sava Fault, for which this fault is considered to be one of the possible sources [52]. However, up to now, no moderate to strong earthquakes could be reliably tied to this fault (Figure 1), and instrumental seismicity is not increased in its proximity [53,54].
Based on the published focal mechanisms, most seismic activity in the region occurs on the NW-SE dextral strike-slip faults and dextral transpressive movements on NW-SE to W-E striking faults are also common, while reverse movements on approximately W-E striking faults are only present in some parts [55]. The wider region experienced several historical earthquakes with Mw ≥ 6 (Figure 1A). Besides the 1348 Mw 6.6 earthquake, these were the 1511 Mw 6.4 Idrija earthquake (also known as the Friuli-Slovenia earthquake), the 1690 Mw 6.3 Villach earthquake, the 1721 Mw 6.4 Rijeka earthquake, the 1928 Mw 6.0 Tolmezzo earthquake, and the 1976 Mw 6.5 Friuli earthquake [16,56]. According to the latest earthquake catalogues in the wider region [16,56], no Mw ≥ 6 earthquake is known to have occurred in Slovenia; however, the Slovenian national catalogue [48] includes two events, the 1511 Mw 6.8 Idrija earthquake and the 1895 Mw 6.1 Ljubljana earthquake (included as a Mw 5.9 event in the ESHM20 database [16]). The discrepancies between the historical earthquake catalogues reflect the challenges of reconciling magnitude estimations and epicenter positions across different archives. Note, however, that the historical seismicity in the territory of Slovenia is only known for the last ~500 years [16,48]. It is therefore crucial to understand the level of fault activity, the fault’s seismic history, and its seismogenic potential.

3. Materials and Methods

To better constrain the activity of the Sava Fault, we selected the area between Golnik and Preddvor (Figure 1C), which exhibits the most prominent surface expression of the fault and where well-preserved Quaternary fluvial landforms cross the fault zone. Our workflow included processing of lidar data, obtaining photogrammetric-derived DEMs, geomorphological and structural geological mapping, electrical resistivity tomography (ERT) and ground-penetrating radar (GPR) surveys, and optically stimulated luminescence (OSL) and radiocarbon dating (14C).

3.1. Lidar Data and UAV Photogrammetry

Estimates of fault slip rates from tectonic geomorphology in Slovenia, which were previously relying on the 5 m resolution DEM and 1:5000 scale topographic maps [21,23], can now benefit from more detailed digital elevation models obtained through aerial lidar [38] and photogrammetric aerial surveys using unmanned aerial vehicles (UAVs). The lidar data of Slovenia [38], delivered as a point cloud of classified ground points in LAS file format were processed using the Global Mapper software v22.0 to generate a digital terrain model with a cell size of 0.5 × 0.5 m. We additionally used the DJI Phantom 4 RTK UAV (SZ DJI Technology Co Ltd, Shenzen, China) to acquire high-resolution topography at two key field localities, Povlje and Laško (see Figure 1C for location). Accurate georeferencing was achieved using direct georeferencing with the post-processed kinematic (PPK) method (e.g., [57,58]), using the recorded UAV flight paths and our own GNSS base station RINEX observations, augmented with ground control points surveyed with RTK GNSS. A pair of dual-frequency geodetic-grade GNSS receivers Sokkia GRX2 was used in the surveys.
UAV flight missions were flown at 75 m altitude above the terrain, providing a nominal ground sampling distance of 2 cm per pixel. Missions were flown along an inclined plane, approximating the dip of the terrain surface. Survey photographs were obtained with two look angles: in nadir (vertical) orientation, and in oblique orientation perpendicular to the surveying plane. Frontal and side overlap were set to 70% and 90%, respectively. We acquired 832 photographs at the Laško site and 3989 photographs at the Povlje site. We employed 3 ground control points at the Laško site and 4 at the Povlje site.
We processed the UAV imagery with the Agisoft Metashape Professional v1.7.1 structure-from-motion photogrammetric software to produce point clouds and to generate orthophoto mosaics and DEMs with 0.1 × 0.1 m resolution. In the forested areas of Povlje, a combined relief model was created in Global Mapper v22.0 by merging the aerial photography and lidar data DEMs, resulting in a model with a cell size of 0.1 × 0.1 m in vegetation-free areas and 0.5 × 0.5 m in areas with dense vegetation. The quality of the UAV-derived DEMs was assessed by comparison with the DEM derived from the national lidar dataset. This was performed using the “Combine/Compare Terrain Layers” tool in Global Mapper v22.0. At both locations the DEMs were horizontally aligned. The vertical difference was up to 0.5 m in meadows and areas with low vegetation; larger discrepancies exceeding 0.5 m were observed in forested areas, areas with higher vegetation, and in anthropogenically-modified areas. Different visual representations of the relief models were generated using QGIS Desktop 3.28.8 and the Relief Visualization Toolbox plugin [59,60], including shaded relief, multidirectional shaded relief, slope map, aspect map, and sky-view factor display (Supplementary Materials, Section S1: Figures S1–S14). The various representations were combined into composite base layers to facilitate geomorphological observations. The combination of lidar data and photogrammetry techniques provided detailed and accurate models and representations for analyzing the geomorphological characteristics of the surveyed areas.

3.2. Geomorphological Mapping

While detection of active faults in the area using quantitative geomorphic indices failed to provide usable results [61], classic desktop geomorphological mapping yielded valuable results in the past [3,4,21,62]. We therefore performed geomorphological mapping using the high-resolution DEMs to detect possible active fault traces and Quaternary landforms recording deformation in our study area. We identified lineaments including scarps, offset river channels, surface elevation anomalies, displaced ridges, and terraces, aligned karst features, and other features potentially related to seismic landscapes [63,64]. These geomorphological indicators are commonly used to infer fault activity, although lineaments could also be associated with erosional or depositional processes, lithological boundaries, or inactive tectonic features [65]. Further interpretation required the integration of geological data and validation through field investigations. The mapping process involved field geomorphological examinations and structural geological mapping to support desktop-geomorphological mapping in GIS environment. Additionally, indicators of tectonic displacements beyond lineaments and Quaternary sedimentary features were documented, including abandoned stream channels and other erosional forms.

3.3. Structural Geological Mapping

Detailed structural geological mapping was conducted over an area of approximately 9 km2 between Zalog and Mače near Preddvor at a scale of 1:5000. The detailed map resized to fit A3 format is available in Supplementary Materials (Section S2: Figure S15). Mapping methods varied based on outcrop visibility, vegetation cover, and slope steepness: by recording all outcrops, through profiling, tracing of geological boundaries or faults, and remote observation for impassable steep and friable walls.
The lithostratigraphic classification of geological units relied primarily on data from the Basic Geological Map of Slovenia [66,67]. Alongside conventional lithostratigraphic mapping, which documented sediment and rock composition and texture (grain size, sorting, structural maturity, cementation, bedding, lamination, porosity), particular emphasis was placed on precise documentation of structural relationships between geological units and internal tectonic elements. Measurements included dips of bedding, cleavage, faults, and major fractures or fracture systems. Fault slip directions and minor fold axes were also recorded. All linear structures identified as potential tectonic structures in the GIS-based tectonic geomorphological mapping were verified in the field.

3.4. Electrical Resistivity Tomography (ERT)

ERT is well established and is one of the most frequently used non-destructive shallow subsurface investigation methods in various research fields (e.g., [68]). It has been successfully used in numerous structural geology studies to determine various lithology and discontinuities associated with (active) faults [12,14,69,70,71,72,73,74,75,76,77,78]. Its use is recommended to determine a suitable paleoseismological trench location and its depth, with an electrode spacing of 5 m generally suitable to reveal the broader resistivity distribution, while shorter (≤1 m) electrode spacing should be used to determine a more accurate trench location [79].
We conducted 2D ERT surveys in Povlje and Laško, which were identified as the most promising sites according to all previous criteria (geomorphological data, geomorphological markers, and structural geological data). Longer 2D ERT profiles (Povlje 1 and Laško 1) were acquired with an electrode spacing of 5 m, with a total (surface) length of 235 m at each site. After evaluation, we selected shorter 2D ERT sections with an electrode spacing of 1 m for detailed study (Povlje 2: at 70–165 m of distance from Povlje 1, and Laško 2: at 60–139 m of distance from Laško 1). All 2D ERT pseudosections were obtained using a dipole–dipole electrode array (DD), which is a suitable choice among conventional electrode arrays for detecting vertical and dipping structures [80]. After integrating the topography data, the pseudosections were processed with the Res2DInv inversion software RES2DINVx64 ver. 4.06.06 [81], using the smoothness-constrained Gauss–Newton least-squares optimization method with the l1 norm, also known as the blocky inversion method [82]. The uninterpreted versions of ERT profiles are available in Supplementary Materials (Section S3: Figures S33 and S34).

3.5. Ground-Penetrating Radar (GPR)

The non-invasive GPR method has been increasingly used in different types of geological studies, such as investigating active tectonics [83], exploring karst features [84], studying landslides [85], mapping sedimentary deposits [86], determining the groundwater table depth [87], and reconstruction of the subsurface 3D fault model [88]. Globally, GPR has already proven to be an extremely successful method in the research field of active tectonics, where it is used to determine major structures such as normal faults [83,88,89,90], reverse faults [90,91], strike-slip faults [90,92,93], and active folding [94]. In several studies, GPR has assisted in paleoseismological research (e.g., [89,90,92,95,96]). GPR investigations can help to determine the most suitable location for a research trench [97,98] to study past earthquakes.
In this study, the shallowest subsurface was investigated with a 50 MHz antenna that allowed imaging the subsurface in the upper 10 m. A total of 14 GPR profiles were recorded at locations Povlje and Laško; 5 profiles were recorded approximately perpendicular to the Sava Fault and 9 parallel with the fault. Uninterpreted profiles and maps with profile locations are available in Supplementary Materials (Section S4: Figures S35–S42). Four fault-perpendicular profiles match with locations of ERT profiles across the Sava Fault. In Laško, it was impossible to record one continuous profile along the ERT line, because the profile crossed a fence twice. Therefore, this section is covered with three shorter GPR lines (Laško 1–3) and there is about 7 m of uncovered space between them. One additional fault-perpendicular profile was performed across a morphologically more expressed fault branch in the eastern side of the investigated surface (Laško S). The fault-parallel profiles were conducted to investigate whether any geological markers such as channels could be determined, which would allow to constrain the horizontal offset along the fault.

3.6. Optically Stimulated Luminescence (OSL) and Radiocarbon Dating (14C)
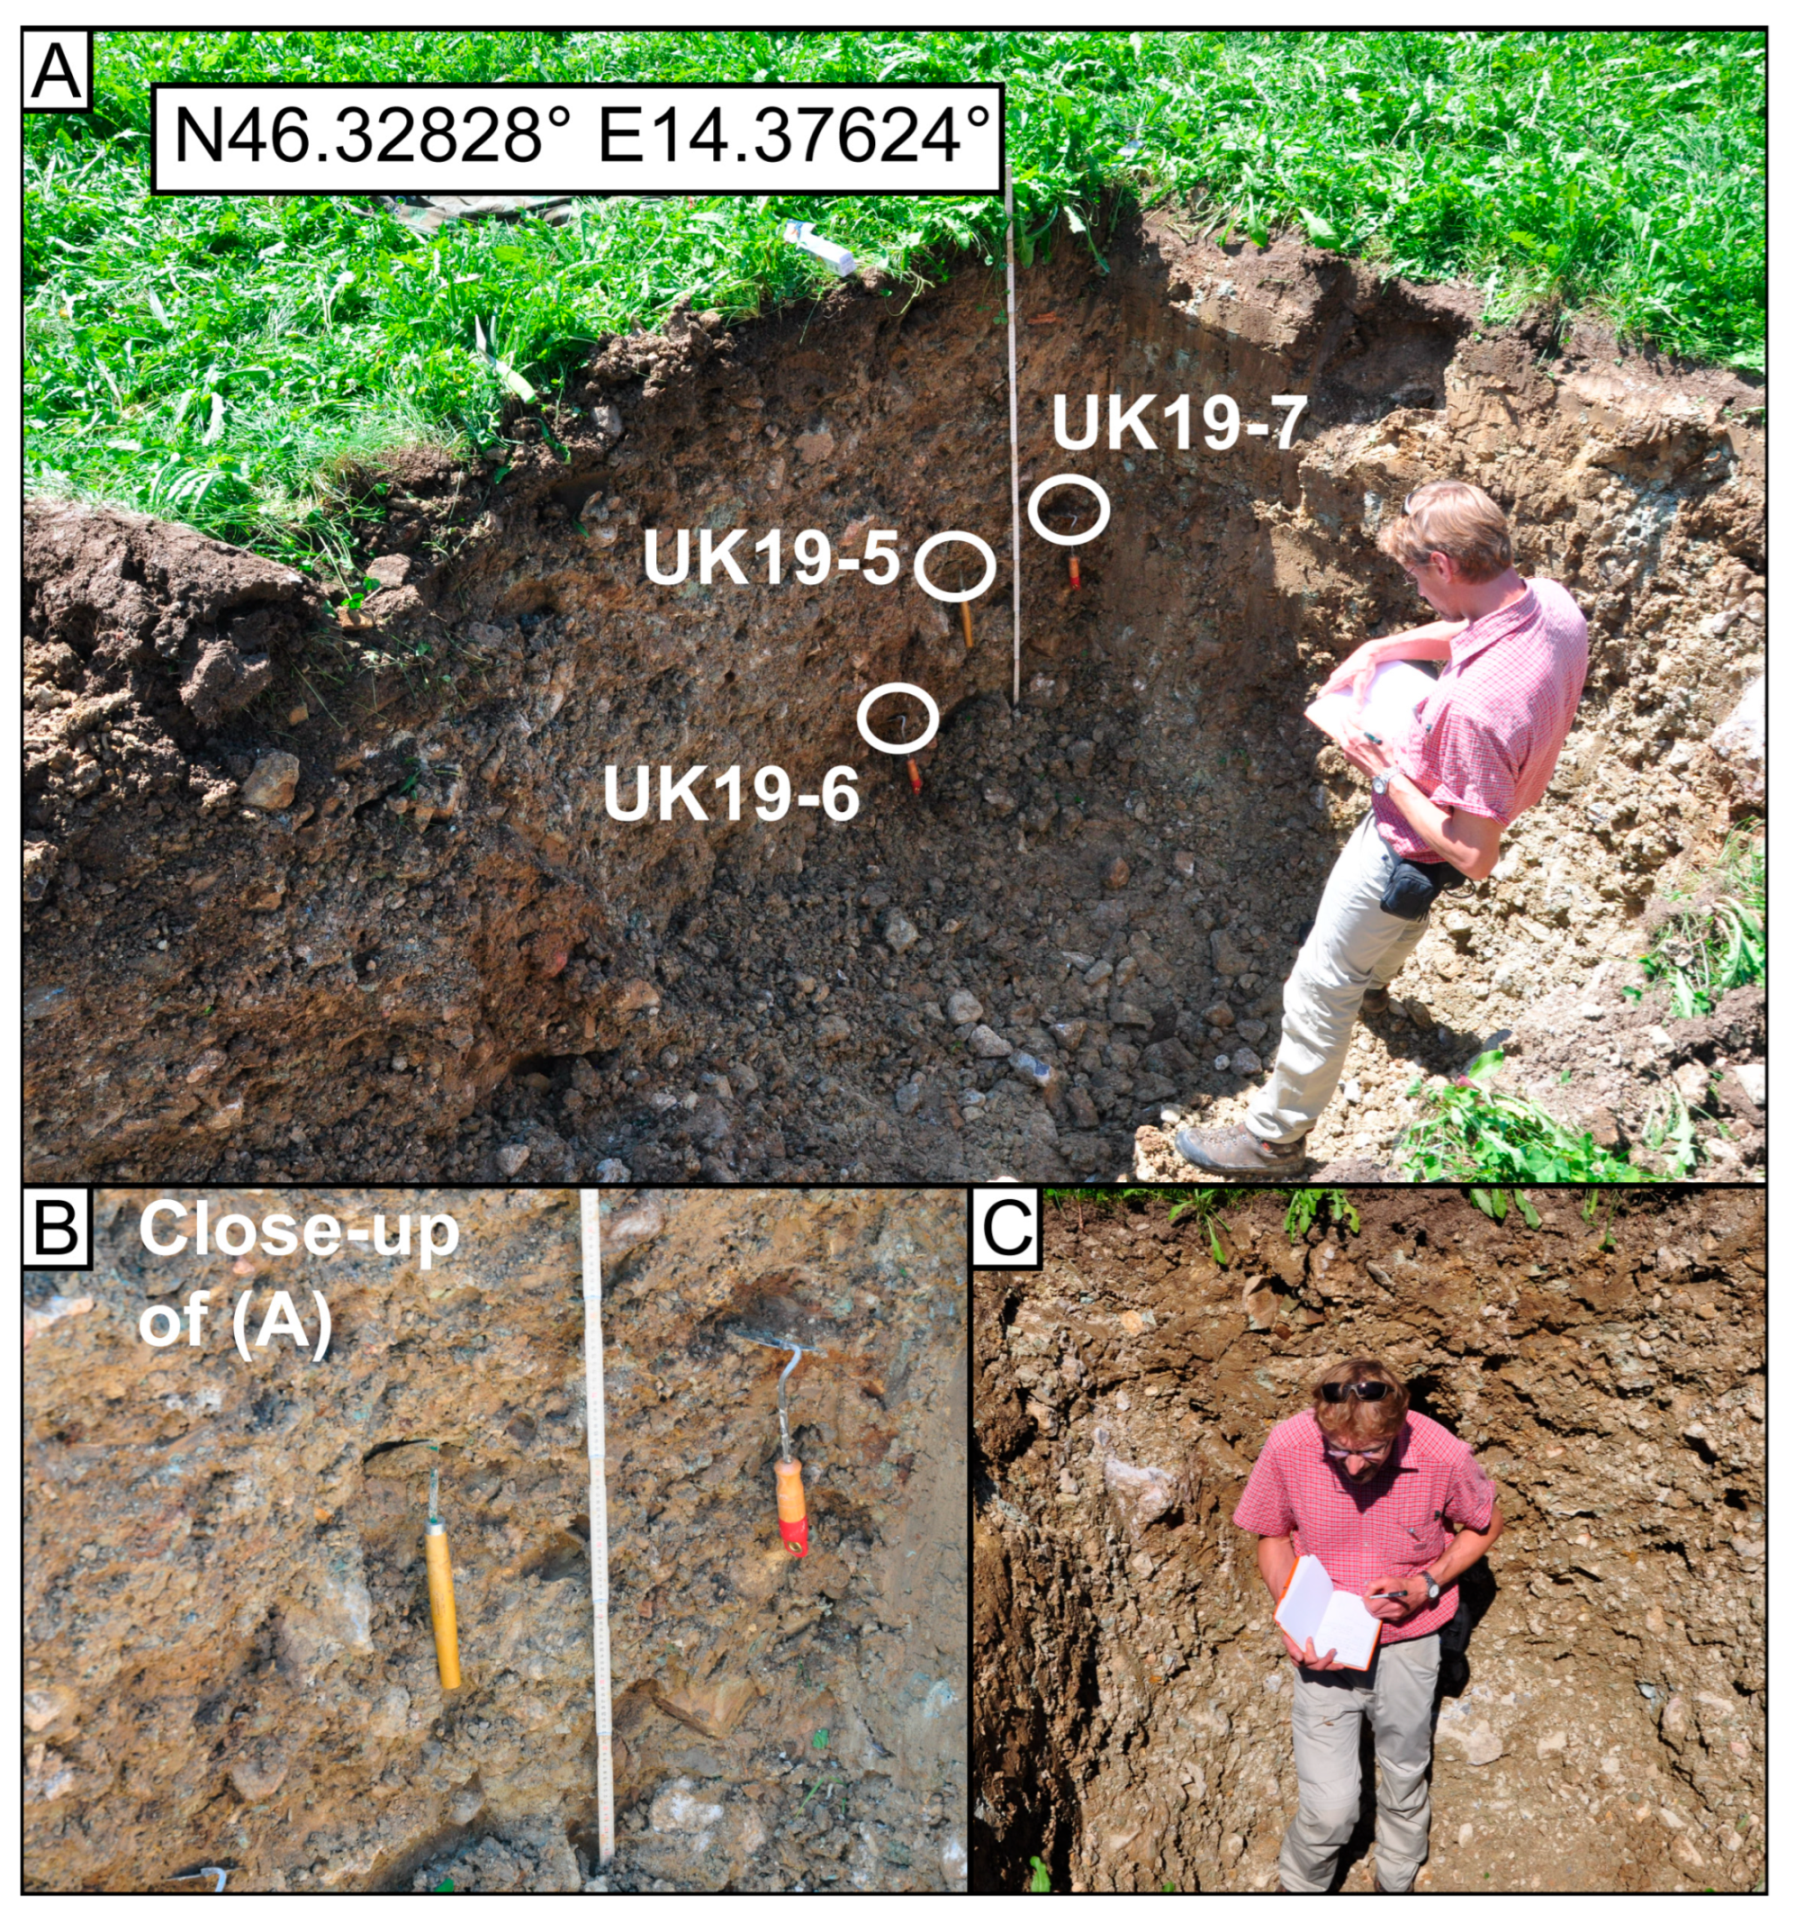
3.6.1. Sampling

We excavated a 2 × 2 × 2 m pit into the Povlje fan to date the activity of the Sava Fault. We took two bulk clay samples from depths of 1 m (UK19-5) and 1.45 m (UK19-6), respectively, for 14C dating. We collected one luminescence sample (UK19-7) from a depth of 1.05 m below surface. Since the coarse gravel made it impossible to use steel tubes for sampling, we used a tarp to shield the trench wall from sunlight, then removed the first 5 cm of the surface of the trench wall, and we sampled fine-grained material into a black bag.

3.6.2. 14C Dating

Bulk 14C dating has been used to determine the age of organic material in sediment samples. This method is often used in situations where the organic material is not well preserved, when no charcoal or similar organic fragments are available, or when the sample consists of a mixture of different organic components [99,100,101]. This approach can provide information about the age of the entire organic fraction in a sample, even if individual components cannot be separated or identified. Because the age of the entire sample is averaged, bulk dating may have limited precision compared to dating individual organic components separately (e.g., [101]). This reduced precision can affect the reliability of age estimates, especially for samples with complex or poorly understood histories. For example, young carbonate from the recent soil washed into deeper layers by meteoric water may lead to too young ages.
Samples were sent to the Curt-Engelhorn-Centre of Archaeometry (Mannheim, Germany) where full analysis was carried out. The obtained results were calibrated with IntCal20 [102].

3.6.3. Luminescence Dating

The luminescence sample (UK19-7) was prepared and measured at the Leibniz Institute for Applied Geophysics, Hannover, Germany. Since the sediment was poorly sorted, both fine-grained (4–11 μm) and coarse-grained (100–250 μm) materials were prepared for luminescence measurements. Luminescence signals were measured with a Risø TL/OSL-20 automated reader with a calibrated 90Sr/90Y beta source for artificial irradiations. Further details about the sample preparation and measurements [103,104,105,106,107,108,109] can be found in Supplementary Materials (Section S5).

4. Results and Interpretations

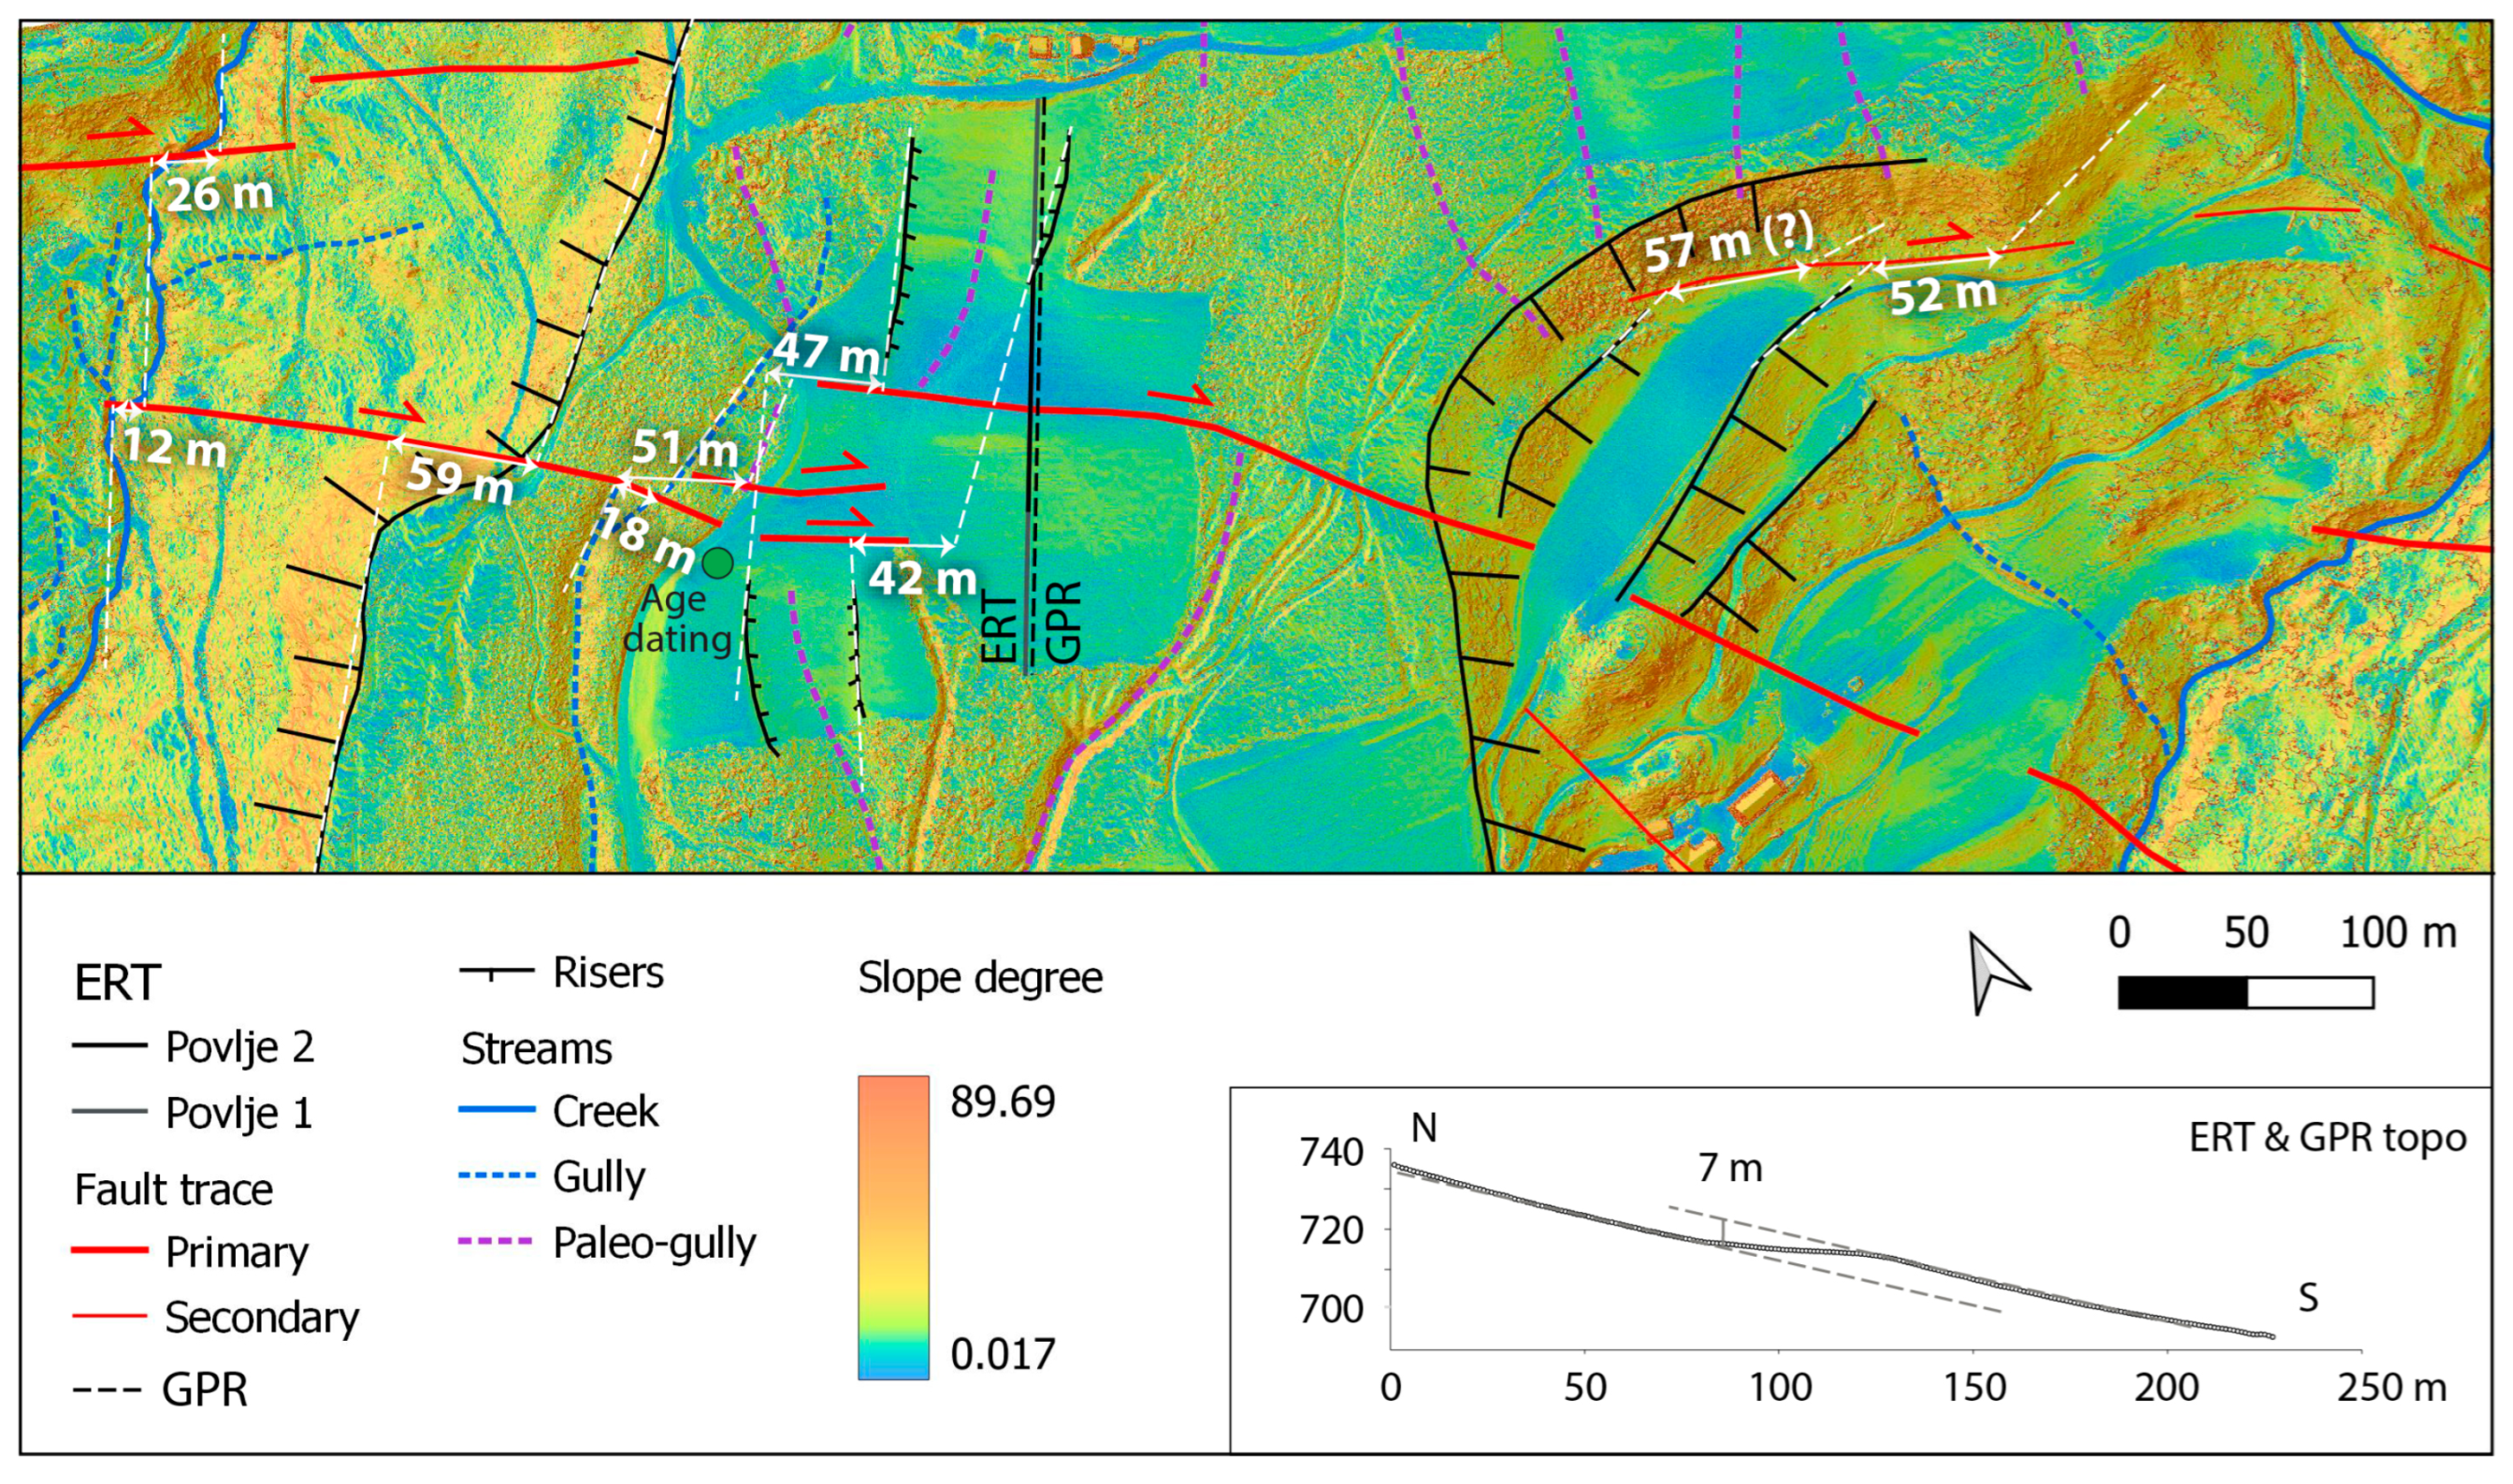
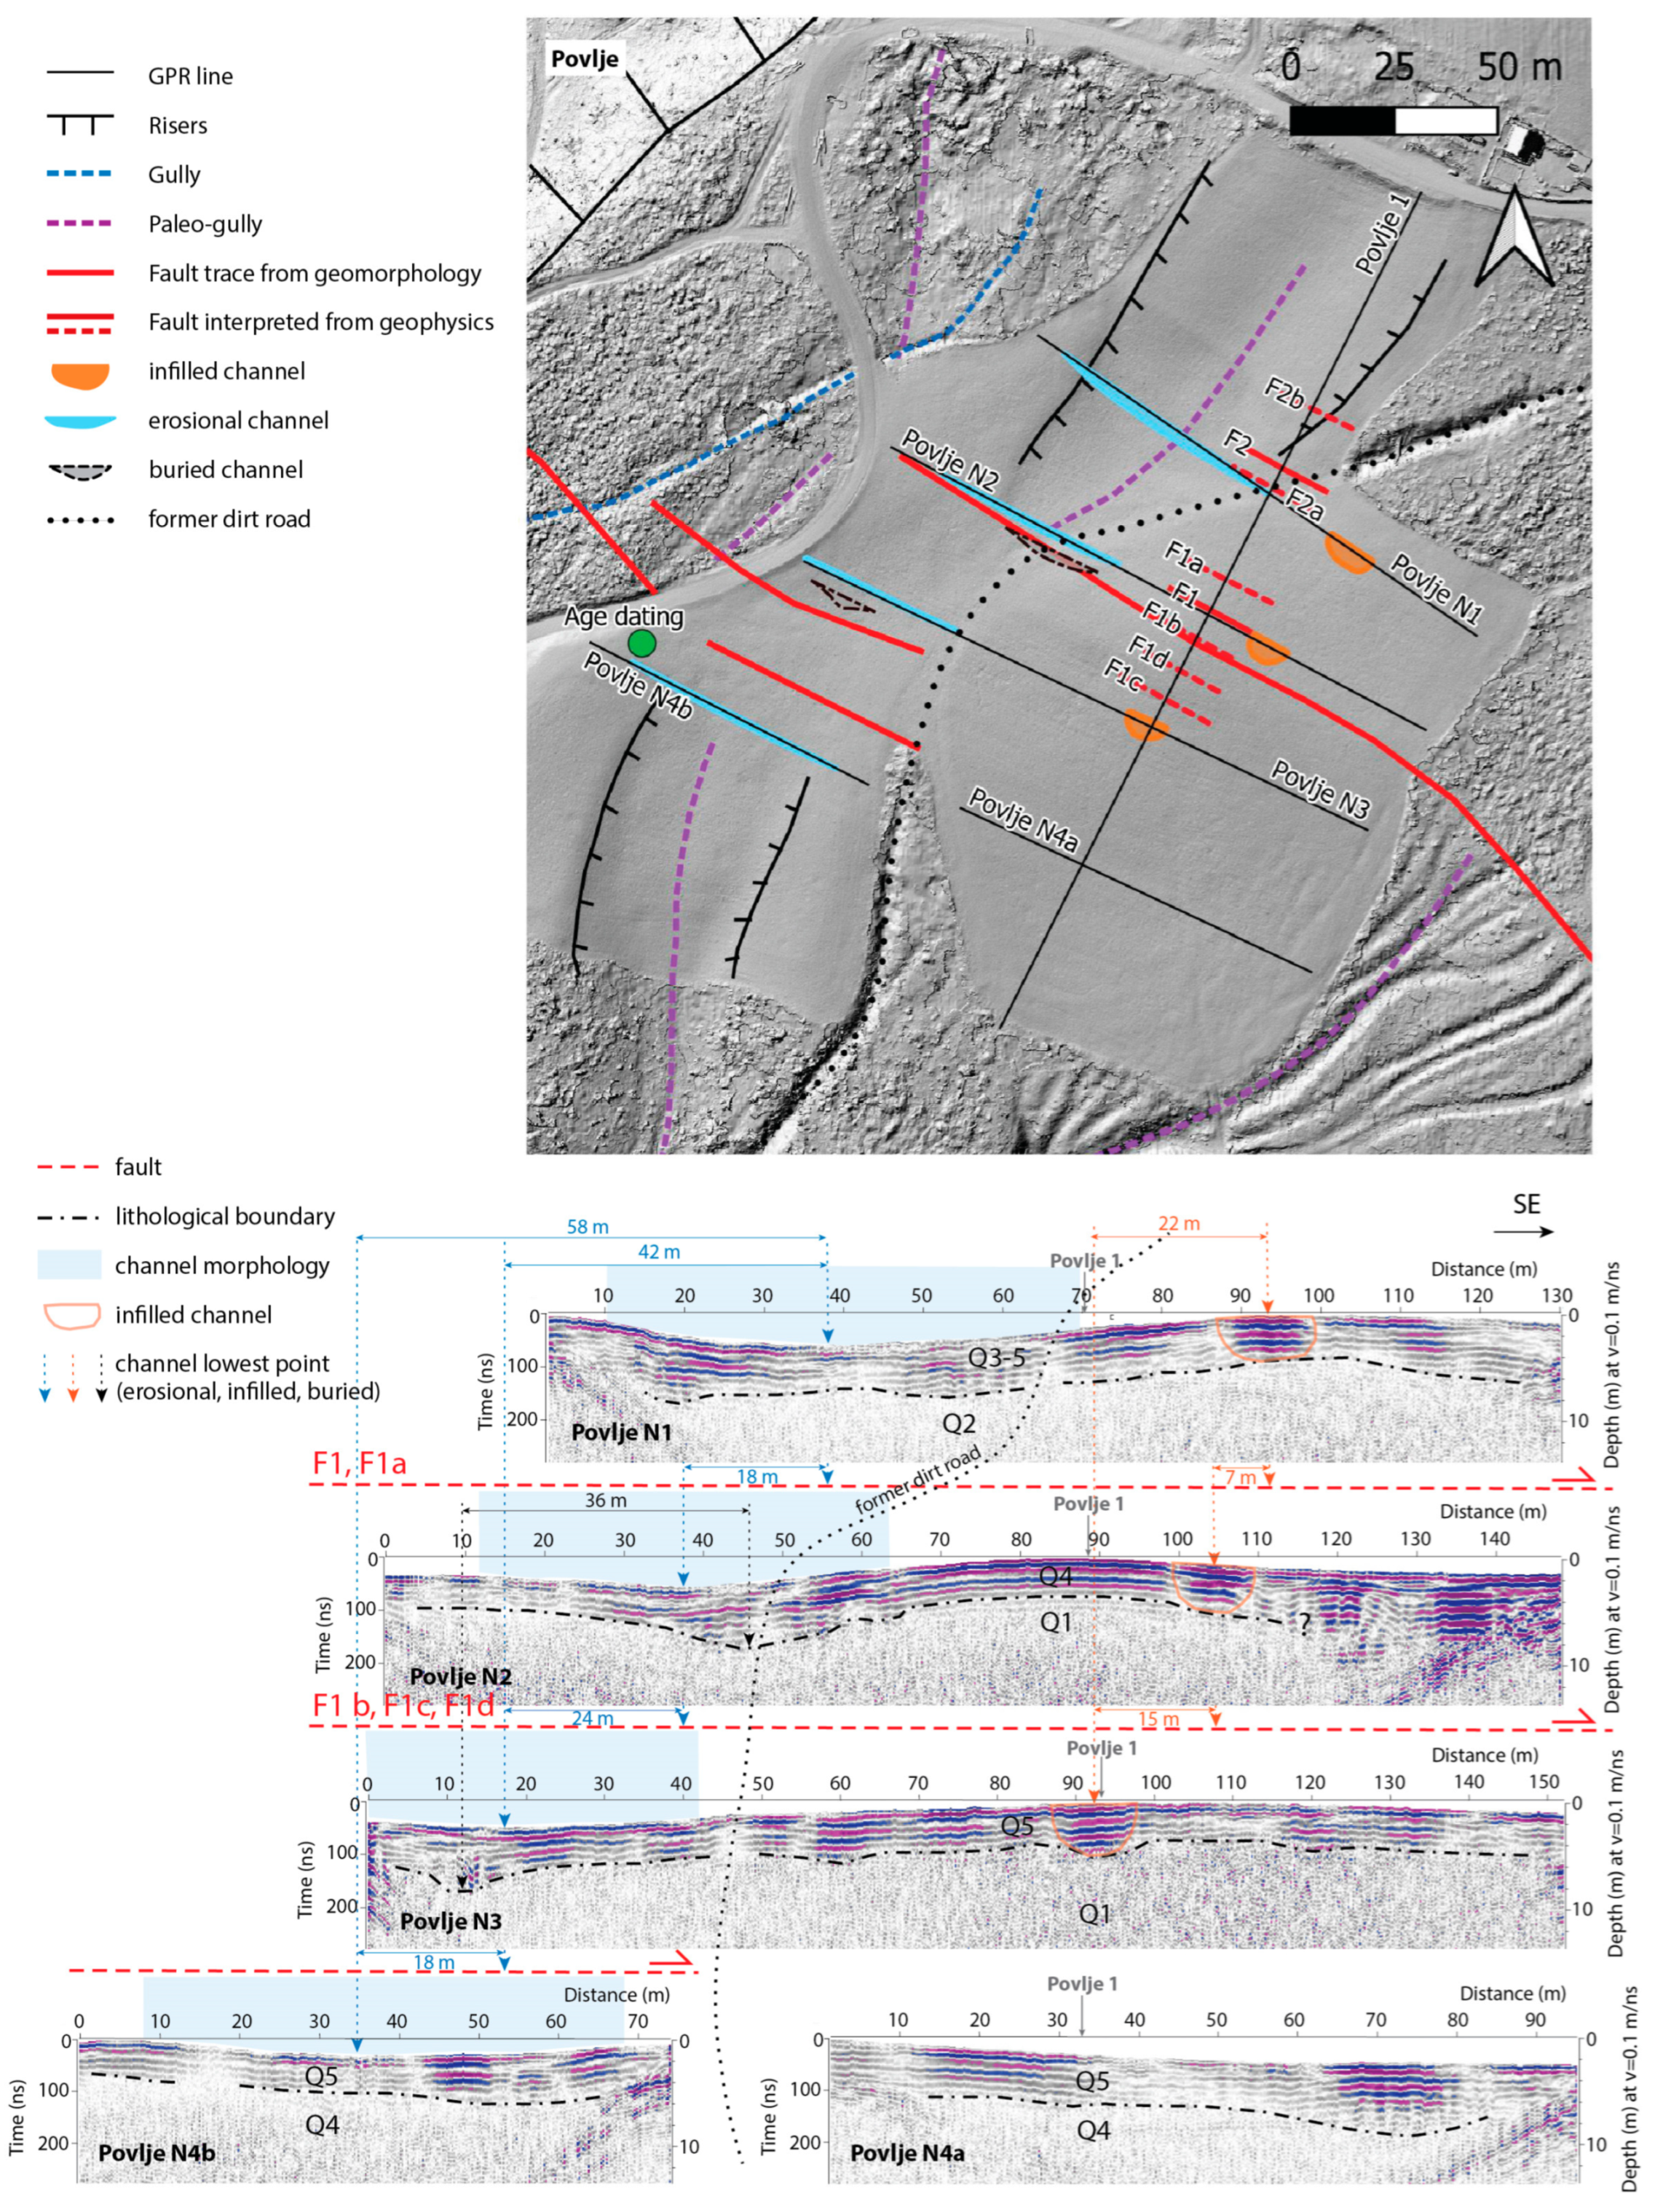
4.1. Geomorphological Map

Between Golnik and Preddvor, the Sava Fault separates the Kamnik-Savinja Alps from the Ljubljana Basin (Figure 2). The fault trace is mostly covered by Quaternary slope sediments such as scree and debris flow sediments, and alluvial fans.
Our mapping revealed a series of fluvial landforms, including remnants of terraces, alluvial fans, and floodplains, the relative ages of which were estimated based on landform preservation and topographic correlation. The age of the terraces increases with their elevation, the degree of degradation, and the soil profile development, as has been shown for the Ljubljana Basin [110,111,112] and other intramontane basins of eastern Slovenia [113,114]. Via morphostratigraphic comparison we thus tentatively inferred that (a) strongly eroded remnants of terraces present at the highest elevations are presumably Pliocene to Middle Pleistocene, (b) lower-lying and less-eroded terraces and fans are presumably Middle to Late Pleistocene, (c) well-preserved fans at the lowermost elevations are presumably Late Pleistocene to Holocene, and (d) floodplains are presumably Holocene.
Note that the oldest dated terrace in the Ljubljana Basin is the 1.86 ± 0.19 Ma old Tržiška Bistrica terrace near our study area, which exhibits highly degraded morphology, including karstification of carbonate conglomerates [115]. The Pliocene has not been mapped in the Ljubljana Basin [66,67], and there is probably a stratigraphic hiatus between the Oligocene and Quaternary in the northern part of the Ljubljana Basin. In the intramontane basins of Eastern Slovenia, however, fluvial sedimentation probably began in the latest Pliocene [113,114,116,117], which is why we tentatively allow the possibility that the beginning of fluvial sedimentation in the Ljubljana Basin could also be in the latest Pliocene. We therefore assume a Pliocene to Middle Pleistocene age for the oldest units we have mapped. Numerical age dating is crucial to constrain the ages of the mapped units.
Lineament mapping was conducted to trace the Sava Fault and its primary and secondary strands. The lineaments primarily trend in NW-SE direction, with secondary lineaments branching off in a E-W orientation. Lineaments are discontinuous and mostly shorter than 500 m. The primary lineaments correspond to two previously mapped fault sections [23]: one between Golnik and Povlje and the other between Povlje and Preddvor. These two sections are separated by a right-lateral overstep.
Lineaments cross Quaternary depositional landforms in only a few cases. Only two locations, Povlje and Laško, were found suitable for further investigations of fault activity. There, a detailed survey of geomorphic indicators for tectonic displacement was performed on photogrammetric DEMs.

4.1.1. Povlje Location

Detailed investigations were carried out at the Povlje location, where the Sava Fault crosses a supposed Middle to Late Pleistocene alluvial fan (Figure 3 and Figure 4A–C). The western edge of the Povlje alluvial fan appears to be right-laterally displaced along the fault, whereas the eastern edge was shaped by deflection of the nearby stream, likely produced by the fault activity. The erosional history of the streams on both sides of the Povlje alluvial fan was probably different and hence the preservation of the offset was likely different. A series of planar surfaces is present below the eastern edge of the Povlje alluvial fan. The origin of these surfaces is not clear, as they could form as fluvial terraces, or could represent a series of landslide cut offs with levelled surfaces in between. Top surfaces are not tilted counter hill as in the case of landslides. They are sloping downstream as in the case of fluvial terraces. We therefore assume the interpretation of terraces as being more likely.
The top surface of Povlje alluvial fan is affected by linear erosional features, including torrential channels and abandoned channels. These erosional features exhibit right-lateral displacements along the fault trace (Figure 5). Vertical steps in the terrain were also observed, suggesting both horizontal and vertical displacements. The displacements of erosional features on the surface of the alluvial fan are consistent with the displacements of the western edge of the fan and of the stream channel W of the fan. The thickness of the fan is estimated to be up to a maximum of 20 m based on field mapping of the sediments on the slope. The fan consists of diamict with angular to semi-rounded clasts, with blocks reaching the size of 1 m or more, and a fine-grained sandy to clayey matrix (Figure 4D,E). The composition of sediment points to debris flows sediment, although partially sorted alluvial sediments may also be present.

4.1.2. Laško Location

At Laško, the fault crosses an erosional remnant of presumably Pliocene to Middle Pleistocene surfaces (Figure 3 and Figure 4F,G). The fault trace splays into several sub-parallel branches across this surface, resulting in distinct geomorphological expressions. However, clear horizontal displacements were not observed in this location, which may be attributed to intense erosion on the edge of the surface.
The surface at Laško is covered by diamicts with block sizes of up to several meters (Figure 4H,I). These diamicts could be either glacial sediments or debris flow sediments. The extent of older glaciations in the area is not known and the detailed morphological mapping of the surface suggests sedimentation with debris flows is more probable. Namely, the photogrammetric DEM revealed vertical steps of irregular shapes and small-scale scarplets in arcuate arrays (Figure 6), resembling sedimentary landforms associated with debris flows.

4.2. Displacements of Geomorphological Indicators

Detailed geomorphological maps provide indicators to quantitatively constrain the displacements at locations Povlje and Laško.

4.2.1. Povlje Location

At Povlje, right-lateral displacements of geomorphological indicators were identified. These indicators include the channel W of the fan, the riser on the western edge of the fan, gullies of intermittent and paleo streams on the fan itself, and the risers of the terraces on the eastern edge of the fan (Figure 5). The displacements are systematic and in the same order of magnitude, allowing for relatively reliable estimations.
We measured right-lateral displacements of 12–59 m: the channel W of the fan (12 m and 26 m), the riser at the western edge of the fan (59 m), the gully on the fan (18 m), the western and eastern risers of the wider paleo-gully incision on the fan (47 m and 42 m), and the risers of the terraces E of the fan (57 m and 52 m). The 57 m displacement on the latter is tentatively estimated, because the top of the correlated riser on N is very faint and unreliable. In the case of the 52 m offset on E, we tentatively compared the tiny area indicated on the riser on the northern side, with the terrace to the S with a matching altitude. We correlated two presently different features only in one case where we assume they were once the same channel: the paleo-gully N of the fault, which ends on the fault, and the beheaded gully S of the fault (51 m). This beheaded gully is thus correlated once with the paleo-gully that ends on the fault (51 m), and once with the gully that deviates across the fault (18 m). Furthermore, vertical displacements of up to 7 m were observed, with the northern block seemingly downthrown relative to the southern block (Figure 5).

4.2.2. Laško Location

In contrast to the Povlje location, clear horizontal displacements were not observed at Laško. Visible vertical steps were detected, which are likely the result of lithological changes where carbonate bedrock outcrops on the surface against Pleistocene sediments. A potential horizontal displacement was observed at the eastern edge of the surface with an apparent right-lateral displacement of 54–64 m (Figure 6). However, this apparent displacement could also be a consequence of differential erosion of rocks in the substrate, as it coincides with the mapped lithological contact (see the following section). Therefore, the assessment of horizontal displacements of geomorphological indicators at Laško is unreliable and does not provide conclusive evidence of fault activity.

4.3. Structural Geological Map

The detailed geological map of the Sava Fault between Zalog and Mače near Preddvor is provided in Supplementary Materials (Figure S15). To facilitate a better analysis of the structure, a separate structural map has been prepared based on the geological map. The structural map highlights the tectonic structures without the Quaternary sediment cover (Figure 7).

4.3.1. Lithology

Steep hills are composed of Triassic rocks, including the Werfen Formation (Lower Triassic (T1)), the Anisian Beds (lower part of Middle Triassic (T21)), and the Schlern Formation (Middle and Upper Triassic (T2,3)). The Werfen Formation begins with rhythmic sedimentation of dolomite, marlstone, siltstone, and quartz sandstone, with lenses of calcarenites and ooid limestones, in a sequence typical for the Southern Alps and Dinarides (e.g., [118]). The upper part of the formation continues with limestone, transitioning into sandy dolomite, slaty marlstone, and marly limestone with marlstones. Anisian Beds lie with a normal geological boundary on the Werfen Formation. They are predominantly represented by dolomite, with occasional occurrences of limestone, dolomitized limestone, and dolomitic breccia. The Schlern Formation, represented by dolomite, is in tectonic contact with older Triassic units. Both the Anisian Beds and Schlern Formation are heavily fractured throughout most of the area.
Oligocene rocks (Ol) form the more gently inclined lower parts of the slopes and include alternations of marlstones and mudstones, and andesitic tuff. They are in tectonic contact with Triassic rocks. Oligocene marlstones and mudstones are heavily fractured and cleaved, indicating significant tectonic deformation.
Quaternary sediments are deposited on the slopes and in the valleys at the transition from Triassic to Oligocene rocks, effectively covering the fault contact. The following Quaternary units were distinguished: diamict (Pleistocene (Q1-d)), gravel and sand (Holocene (Q2-pp)), diamict (Holocene (Q2-d)), and anthropogenic landfill (recent (a)).
For the full description of each lithostratigraphic unit see Supplementary Materials (Section S2).

4.3.2. Structure

The Sava Fault Zone, characterized by a NW-SE orientation, separates Triassic rocks from Oligocene rocks in the study area. The fault zone is denoted as “I” on the structural map (Figure 7), with sub-branches labeled from “Ia” to “Ig” representing individual fault sections. Although the fault itself is covered, its intersection with the topography suggests a steep northward dip. A northward dip in a transpressive fault zone means that the northern block (the hanging wall) is relatively uplifted. This fits the overall topographic gradient.
The fault geometry in the study area forms a transpressive zone along the Sava Fault, with faults gradually diverging towards the SE (II–VI) with increasing distance from the main active branch (I). While right-lateral transpressive kinematics are observed for faults I-IV, SW-NE striking faults (V, VI) likely display left-lateral transpressive kinematics. Sigmoidal left-lateral connecting faults are present between the main faults. From the fault pattern we infer that the transpressive tectonic lenses, bound by connecting faults, undergo counterclockwise rotation. The transpressive structure, with tectonic lenses of the Werfen Formation, indicates the geometry of a positive flower structure. For detailed description of the structure see Supplementary Materials (Section S2).
The mapped portion of the transpressive zone represents a segment of the larger transpressive zone of the Sava Fault. Detailed structural geological mapping of the compressional bend of the Sava Fault was conducted in the Preddvor-Stahovica area [24]. Considering the broader structural framework, the emergence of such a transpressive structure between Povlje and Mače in the studied area can be attributed to gradual curving of the Sava Fault from NW-SE to E-W direction. With the growth of the fault zone, the tectonic lenses experienced counterclockwise rotations, consistent with the kinematic interpretation by [18].
Due to the concealed nature of the main active branch of the Sava Fault (I), direct observations of the fault were not possible, and only a limited amount of structural data is available for this specific segment. The precise geometry of fault branches beneath the Quaternary sediments remains unknown. However, the Povlje and Laško locations offer a relatively well-known geometry from electrical tomography data, which has been incorporated and depicted on the maps.

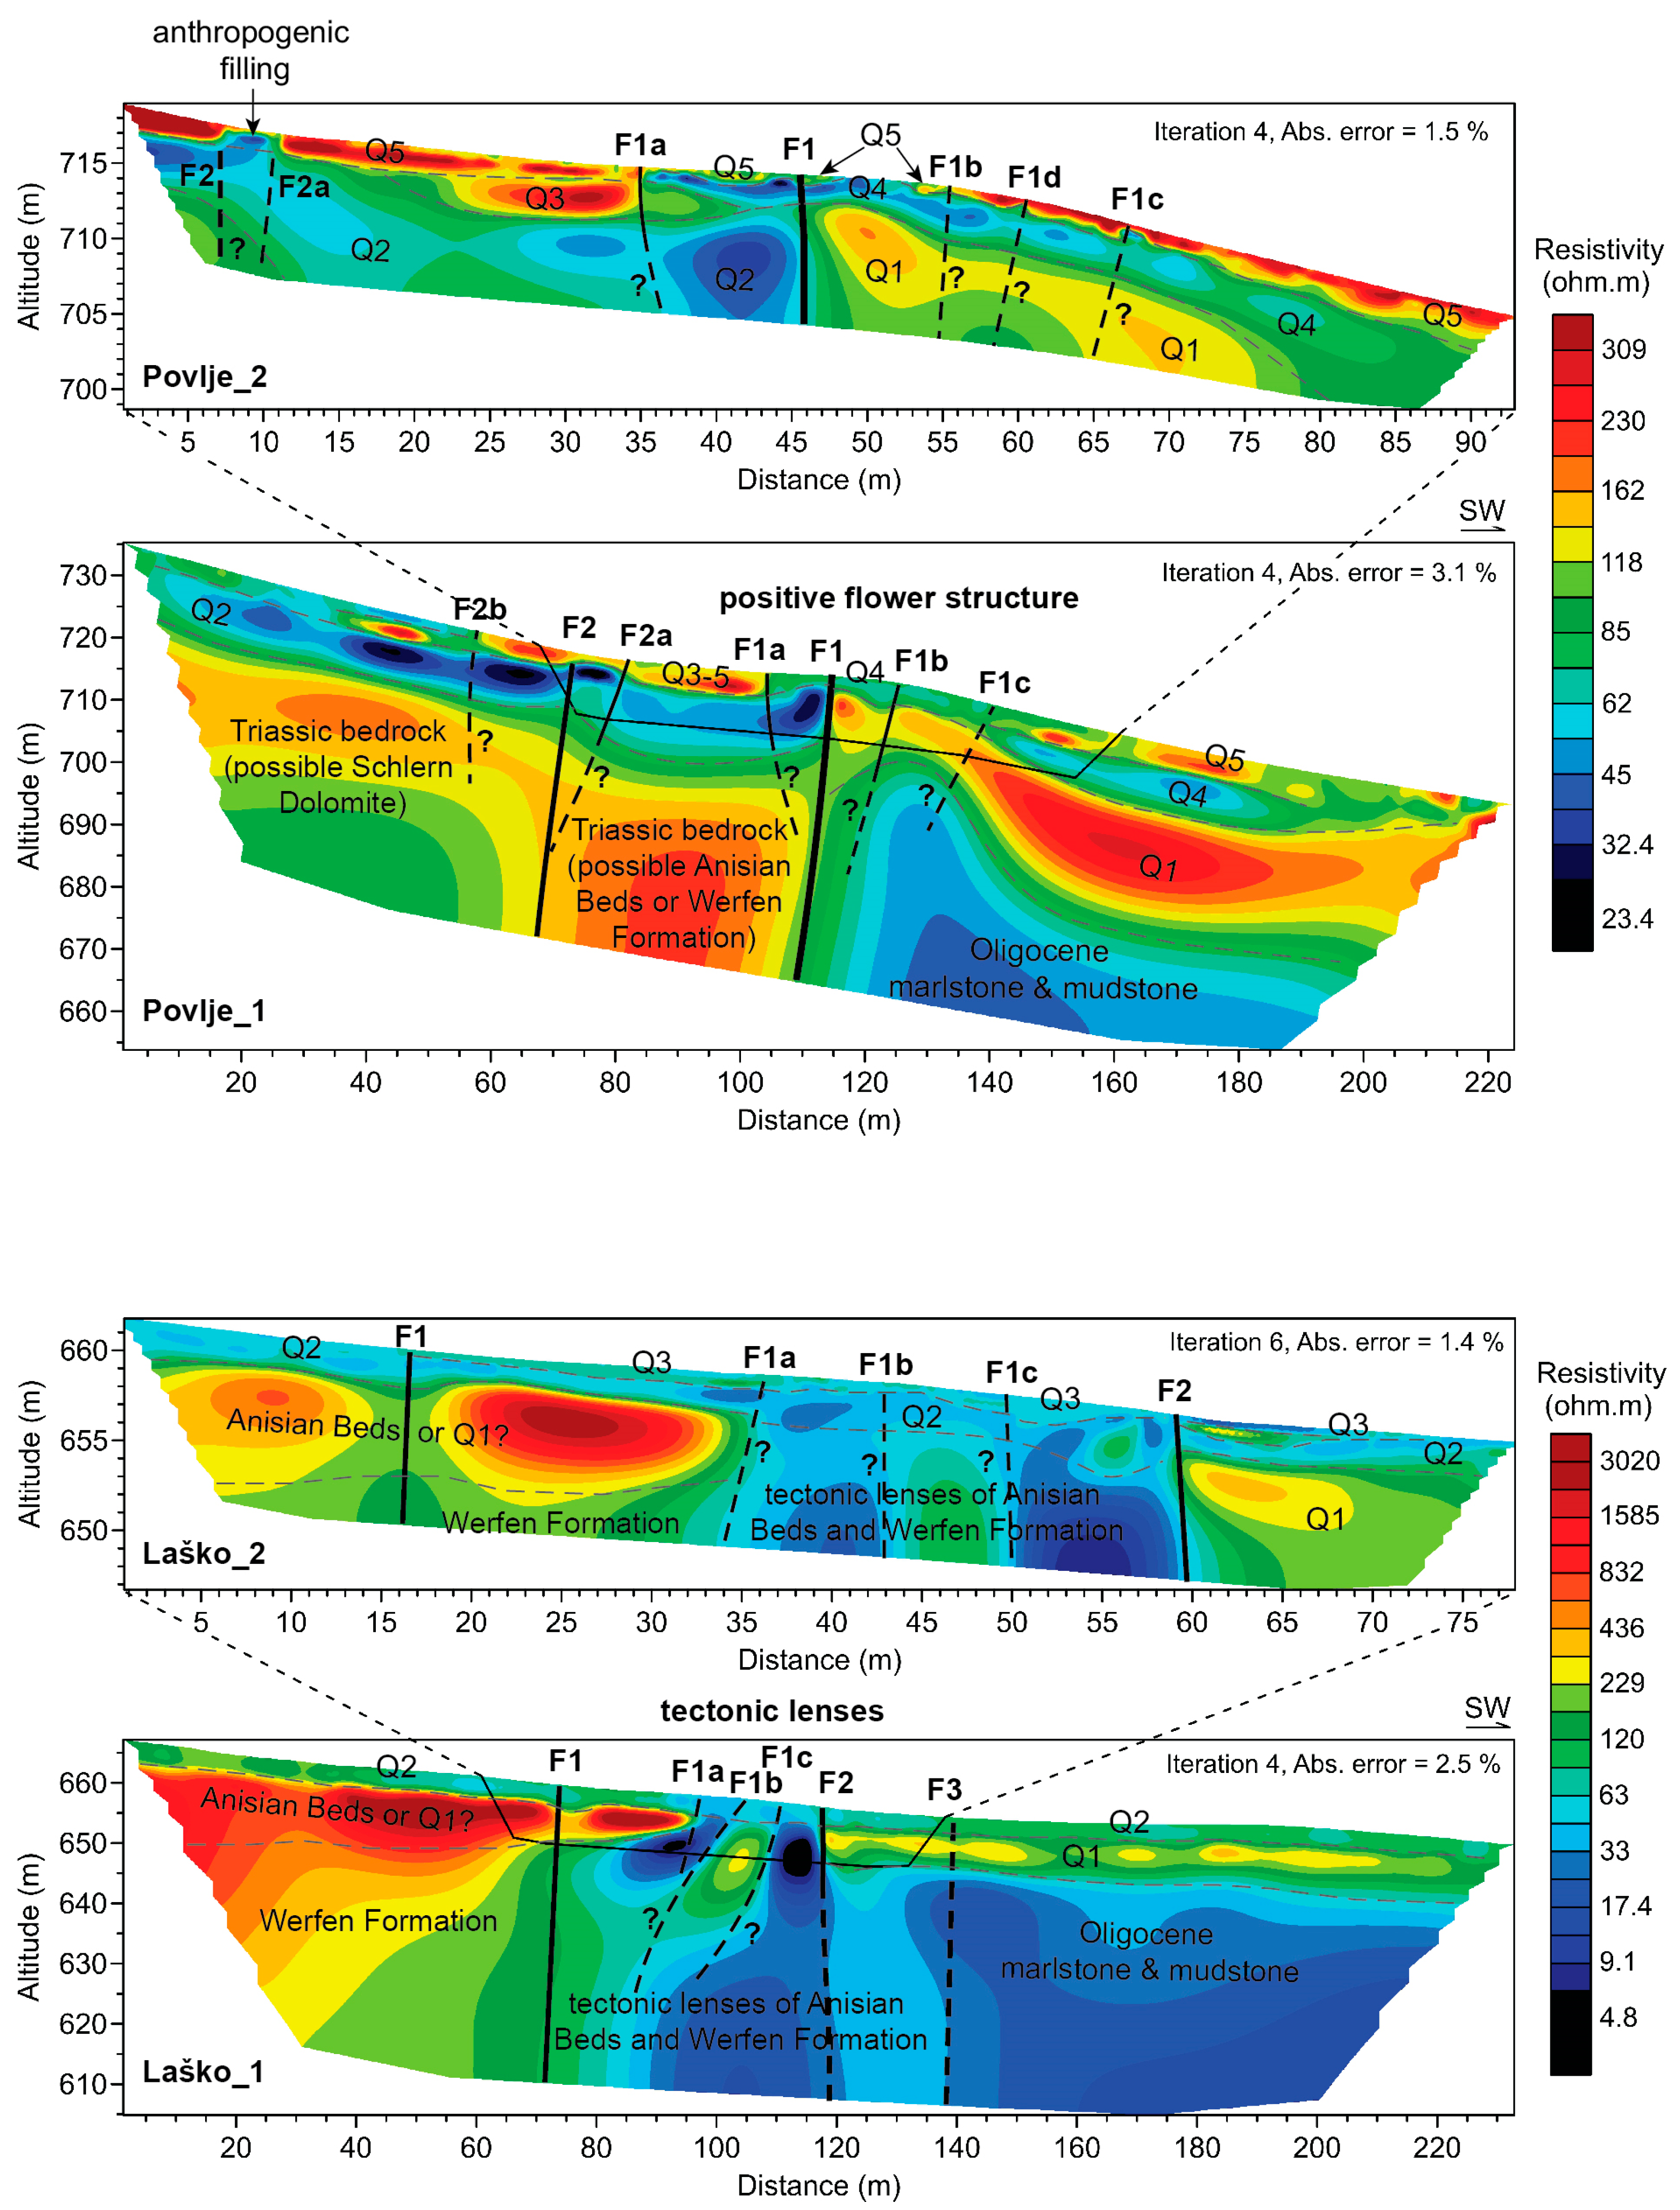
4.4. Electrical Resistivity Tomography (ERT)

4.4.1. Povlje Location

ERT profiles on Povlje alluvial fan show a contrast of resistivity occurring in several layers (Figure 8). In the lower part of the Povlje 1 profile, at depths larger than 15 m and at a distance of around 110 m, a sharp contrast is visible between the relatively higher resistivities (85–230 Ωm) in the NE part and low resistivities (40–85 Ωm) in the SE part. From detailed structural geological mapping, this subvertical lateral contrast (F1) is interpreted as a sharp tectonic contact between Triassic carbonates in the NE and Oligocene marlstones and mudstones in the SW (fault branch Ia on Figure 7). Tentatively, the higher resistivity unit in the lower parts consists of two blocks, where the northern block seems to consist of two resistivity zones and the middle one appears massive. These two blocks can be explained as two tectonic blocks consisting of different bedrock lithologies, as present W and E of the Povlje alluvial fan, namely Schlern Dolomite in the northern block separated by F2 from Anisian Beds or alternatively Werfen Formation (carbonate lithologies) in the middle block.
Above the bedrock, alternating higher and lower resistivity layers suggests the presence of Quaternary deposits with a total thickness of 10–30 m (Q1–Q5), which matches the estimated alluvial fan thickness of 20 m from field geomorphological mapping (Section 4.1.1). Zone Q1 has resistivities similar to the Triassic bedrock, however, due to its position on top of Oligocene strata, it can only represent Quaternary strata as the regional geological setting exhibits a stratigraphic hiatus between the Oligocene and the Quaternary. Q1 may thus represent slope deposits originating from Triassic rocks outcropping on higher slopes; its wedge-like geometry may support such an interpretation.
A sharp contrast between the resistivity zones in the Quaternary cover occurs at F1. SW of F1 the Quaternary cover seems to consist of three resistivity zones: lower Q1 (100–300 Ωm), middle Q4 (30–100 Ωm), and upper Q5 (100–350 Ωm). The high-resolution profile Povlje 2 suggests that Q4 and Q5 may be extending on both sides of F1. NE of F1 the Quaternary cover seems to consist of 2–4 resistivity zones: lower Q2 (23–85 Ωm), middle Q3 (85–300 Ωm), and perhaps Q4 and Q5, which are also present SW of F1. Anthropogenic filling is present in the upper 2 m in the northeasternmost part of profile Povlje 2, as testified by the landowner.
The lithology of the Quaternary units can be interpreted from a comparison with the outcrops present at the edge of the Povlje alluvial fan (Figure 4D,E) and from the pit excavated for age dating (see Section 4.7). Based on their relatively thin and long geometry, subparallel to the surface of the alluvial fan, these units can be interpreted as mass flow and alluvial deposits. Outcrops revealed massive diamicts with blocks reaching the size of 1 m or more and a fine-grained sandy to clayey matrix, suggesting these are debris flow sediments. Higher resistivity units Q1, Q3, and Q5 can contain larger clasts and a coarser matrix (high-energy debris-flow events), whereas low-resistivity units Q2 and Q4 probably consist of smaller clasts with abundant clayey matrix (possibly mud-flow events or distal parts of debris flows).
Steep, subvertical lateral contrasts of resistivities occur in several places. The most notable are F1 and F2, extending through the whole profile. We interpret those as two main fault branches. Fault F1 is the principal fault, juxtaposing Triassic with Oligocene bedrock and possibly displacing laterally Quaternary units Q1 and Q2. We interpret that units Q1 and Q2 are laterally displaced due to the general right-lateral character of the fault (e.g., [19]) and because these two different units have no equivalent on the other side of the fault. F1a appears to affect the uppermost units Q3 and Q5. SW of F1 up to three minor vertical discontinuities may be present—F1a, F1b, and F1c. Q1 appears dissected and bent SW of F1, Q4 and Q5 could be also affected. F2 is characterized by a minor vertical contrast of resistivities in the bedrock and possibly in Q2 and Q3–5. Two additional minor vertical discontinuities may be present, F2a and F2b, that may be affecting Q2 and Q5. Lateral displacements with bending of Q1 are typical for strike-slip faulting and suggest a local positive flower structure.

4.4.2. Laško Location

ERT profiles in Laško exhibit large resistivity contrasts between the NE and the SW side (Figure 8). At depths of more than 10 m and at a distance of 0–80 m the resistivities are moderate (120–850 Ωm) and between 140–220 m they are low (<33 Ωm). In between, at distances from 80–140 m, several subvertical changes in resistivity occur. A high-resistivity zone (850–3000 Ωm) is present in the first 100 m of the profile distance at depths of 3–10 m.
According to the structural geological mapping the bedrock structure here is a combination of tectonic and normal stratigraphical contacts (Figure 7). 150 m W of the ERT profiles, a shallow, N dipping stratigraphic contact between Anisian Beds and the underlying Werfen Formation was mapped. It could correspond with the transition from high-resistivity layers in the first 100 m at depth of 3–10 m to the underlying moderate-resistivity zone (Figure 8). In this case, however, the resistivities of the possible Anisian Beds are higher than in the unit interpreted as possible Anisian Beds in Povlje. There may be several reasons for this discrepancy, the most important of which are moisture content and porosity. In Povlje, the unit interpreted as possible Anisian Beds or Werfen Formation lies between two faults, and it is very likely that the rock is highly fractured and has higher porosity and moisture content and thus lower resistivity. Alternatively, the high-resistivity unit in the first 100 m at Laško could be interpreted as Quaternary diamicts including large carbonate blocks as found on the S edge of the Laško surface.
A tectonic contact between Triassic and Oligocene rocks was mapped on the E edge of the Laško surface with several tectonic lenses of Anisian Beds and Werfen Formation. Therefore, we interpret the low-resistivity zone at distances between 140–230 m and at depths larger than 10 m as Oligocene marlstones and mudstones. The subvertical changes in resistivities at 80–140 m distance could be tectonic lenses of Anisian Beds and Werfen Formation, where the Anisian Beds are carbonates with moderate resistivities, and the Werfen Formation consists of marlstones and mudstones with low resistivities. This interpretation is based on the detailed geological mapping of the E edge of the Laško surface and assumes that Werfen and Oligocene marlstones and mudstones have similar resistivities. Alternatively, judging from ERT alone, the contact between Werfen and Oligocene strata could be already in the zone at distances of 80–120 m.
A moderate-resistivity layer of 80–400 Ωm at depths of 3–10 m is present at a profile distance of 120–230 m (Q1). Considering its thin and long geometry, its surface-parallel slope, and the local geological setting and stratigraphical hiatus between Oligocene and Quaternary, this unit could represent the oldest Pliocene to Middle Pleistocene unit in the Laško site. Based on the outcrops located on the S edge of the planar surface this unit may consist of diamicts with block sizes of up to several meters, likely deposited by debris flows. The resistivity of the Q1 on the southern side, however, does not match the possible Q1 on the northern side. If the interpretation of Q1 on N is correct, this could indicate the lateral displacements that brought two different Quaternary units to the same level.
The uppermost 2–3 m of the ERT profiles are characterized by a unit with resistivities of 20–250 Ωm. Higher-resolution profile Laško 2 suggests the presence of two units: Q2 at depths of 0–3 m, and the locally ca. 1 m thick unit Q3 with slightly higher resistivities at the uppermost part. Units Q2 and Q3 could represent diamicts with smaller clasts and a finer matrix than Q1 (distal parts of debris flows) or younger alluvial sedimentation (mud and sand) on top of Q1 diamicts.
Subvertical changes in resistivities of the bedrock are interpreted as faults based on the local geological setting. The most prominent is F1, separating a supposedly massive bedrock block on the NE from a possible zone of tectonic lenses, where three minor vertical discontinuities seem to be present—F1a, F1b, and F1c. F3 could be separating the Triassic from Oligocene bedrock and could therefore be the primary fault. F2 juxtaposes supposedly Triassic bedrock with the Quaternary unit Q1, and thus seems to be the most important branch in terms of fault activity. Vertical changes in resistivities of Q2 and Q3 could also be present at F1, F1a-c, and F2, with potentially the strongest change at F2 in the uppermost 2–3 m.

4.5. Ground-Penetrating Radar (GPR)

Distinct parts of the GPR profiles display varying signal characteristics (Figure 9 and Figure 10). Strong reflections are associated with more compact and coarse-grained sediment, exhibiting continuous linear reflections that can be associated with bedding. These areas also have superior depth penetration compared to areas with weaker signals. Conversely, high signal attenuation areas exhibit weak or no signal reflections, indicating either fine-grained materials or exceedingly homogeneous sediments. By analyzing the truncations and diverse angles of linear reflections, we identified vertical disruptions within the profiles, associated with lithological and/or tectonic contacts.
By comparing the GPR with the ERT profiles and using the knowledge gained from the geomorphological and structural geological field mapping, we first interpreted the fault perpendicular profiles (Figure 9). The lithological units and faults identified in ERT were identified also on GPR profiles, which enabled us to interpret the lithology and the structure with greater confidence. The names of the lithological units and faults match the names used in ERT profiles. In Povlje, a series of subvertical faults seems to disrupt the shallowest Quaternary layers. The most distinct fault is F1, which seems to cut units Q1 to Q5. Similarly, in Laško, subvertical faults seem to displace the shallowest units Q2 and Q3. The most distinct is F1a that seems to cut Q2–3 and separates two different bedrock lithologies, as well as F3 on Laško S that separates outcropping bedrock from Q2–3 diamicts.
The fault-parallel GPR profiles were interpreted with less confidence since they are not covered with matching ERT lines. Nevertheless, the lithological interpretation was adjusted where they cross the fault-perpendicular GPR and ERT lines. The major lithological units could be identified based on the radargram patterns associated with each lithology (Figure 10 for Povlje and Figure S42 for Laško). Additionally, an about 10 m wide and 5 m deep channel was interpreted in profiles Povlje N1, N2, and N3 (orange arrows on Figure 10). It exhibits strong linear reflectors inside the channel and is bounded by weak signals at its edges. This channel is likely filled with coarse-grained material. We did not recognize the same feature in Povlje N4a,b profiles and it might be that it continues in the area not covered between the profiles a and b. Several areas display deeper contacts between the upper and lower Quaternary units, such as at distance 45 m on Povlje N2, at 12 m on Povlje N3, and at 70 m on Povlje N4a (black arrows on Figure 10). We interpret these as buried channels. An erosional channel is also visible at the surface in the western part of profiles Povlje N1–N4 (blue arrows on Figure 10). The faults drawn between the fault-parallel profiles are based on the fault-perpendicular profiles and our geomorphic mapping. We also interpret one fault visible in profile Laško N2: F1a cutting the Anisian Beds from the Q2–3 diamicts.

4.6. Displacements of Channels Identified with GPR

In Laško, we did not identify any marker that would allow us to constrain the horizontal displacement. In Povlje, however, there are several elements that can be compared between the profiles: an erosional channel visible at the surface (marked with blue arrows on Figure 10), a buried channel (black arrows), and an infilled channel (orange arrows). The erosional channel at the surface is visible in all four profiles, the buried channel only on profiles Laško N2 and N3, and the infilled channel on profiles Laško N1–N3. Since the boundaries of the channels are diffuse, we use the lowest point of the channels to estimate the lateral offsets. In the case of the erosional channel at the surface, a total right-lateral offset of 58 m was measured; the offset between individual GPR profiles ranged between 18–24 m. The offset of the buried channel was measured to be 36 m. The total offset of the infilled channel was measured to be 22 m, with 7 m and 15 m offsets along individual fault branches.
We assume that all differences in the lateral position of the channel are due to the displacement and not to the flow direction of the streams. This assumption is justified by the geometry of other channels visible on the surface, all of which indicate right-lateral displacement across the fault and a similar magnitude of displacement inferred from geomorphology and GPR.

4.7. Dating the Povlje Fan

A pit was excavated at N46.32828° E14.37624° near the fault zone and directly W of the wider incision of the paleo-gully on the Povlje alluvial fan (Figure 5 and Figure 10). We avoided the incision to determine the depositional age of the alluvial fan rather than the possibly younger deposits of the paleo-gullies. With this approach, we targeted the maximum age of the cumulative displacements that we inferred in Povlje.
In the excavation pit, below a 0.2 m thick modern soil, we encountered only one stratigraphic unit (Figure 11). This unit consisted of poorly rounded fine to medium gravels (composed of litharenites, argillites, and limestones) with some larger blocks in a clayey-sandy matrix with high water content. We observed no sorting, no layering, and no preferred orientation of the clasts. Thus, the sediment is interpreted as a diamict transported over short distances by debris flows.
We sampled the clay matrix in the hope that it contains bulk organic matter that would date paleosoil formation processes. Sample UK19-5 returned a 14C age of ca. 2.53 ± 0.17 ka cal BP; sample UK19-6 gave a 14C age of 2.15 ± 0.15 ka cal BP (Table 1). These ages are very young given the geomorphological settings of the sampled site and amount of surface deformation seen in the fan. The Povlje fan is incised on its edges for about 50 m hence it was deposited much earlier to allow such significant incision and related climatic changes to occur. Presence of additional channels on the Povlje fan indicates that erosion and perhaps limited sedimentation continued after fan formation, but since the pit was positioned away from the paleochannel it is not likely that the sampled material was from later processes. If the 14C ages would indicate the time of Povlje fan sediment deposition, all the surface deformation (42–59 m of right lateral displacement and about 7 m of apparent vertical displacement) would have occurred in the last ca. 2.5 ka, which is unrealistic for this region. Additionally, results showed that the samples contained extremely low carbon content (0.7% and 0.6%; Table 1), which excludes the possibility of them being from soil. For bulk ages, the organic content should be more than 5% [119]. Therefore, we interpret the clays to not have formed in situ by pedogenic processes. Instead, the clay-sized fraction that was dated is probably a mixture of solved carbonate from the limestone gravels and carbonate washed out from the recent soil by meteoric water, bringing young carbon into the system. Another possible source of young carbon in the sediment could be bioturbation. Due to these reasons, we consider the 14C dating results to not reflect the age of the Povlje fan.
Depositional ages can be derived from luminescence dating, which measures when the sample has last been exposed to sunlight. This approach assumes that the samples have been at the surface at least briefly during the last transport, and that sediment transport did not exclusively happen at night. Table 2 and Table 3 summarize the result of dose rate and ages, respectively. OSL on fine-grained quartz (sample UK19-7) resulted in a mean OSL age of 27.4 ± 1.6 ka (Table 3). The post-IR IRSL signal at 150 °C on K-feldspar resulted in a fading uncorrected age of 25.5 ± 4.5 ka using the minimum age model, which is consistent with the quartz OSL age. After correcting for anomalous fading (g2days value of 4.5 ± 0.3%/decade), the age became 39.3 ka ± 8.0 ka (Table 3). The agreement between the quartz OSL age and fading uncorrected K-feldspar post-IR IRSL age means that the quartz OSL signal was probably well bleached before deposition [120], because the bleaching of the post-IR IRSL signal is more than one order of magnitude slower than quartz OSL signal (e.g., [121]), and therefore the depositional age of the sediment is 27.4 ± 1.6 ka. The dose recovery ratio (recovered to given dose ratio) was satisfactory for both quartz OSL and K-feldspar post-IR IRSL signal, with the ratio of 0.96 ± 0.02 and 1.04 ± 0.03, respectively.

5. Discussion

Our interdisciplinary approach using high-resolution remote sensing methods to image the surface and shallow subsurface (<50 m) complemented with field surveys provided indications of Quaternary deformation along the Sava Fault. Small-scale geomorphic indicators were discovered, enabling us to measure the possible displacements that occurred since the end of Late Pleistocene. High-resolution datasets were previously successfully employed in this region to study small-scale geomorphological features to understand landslide and alluvial fan activity [122,123,124] as well as to derive the age of alluvial surfaces [112].
The integration of different datasets was essential for overcoming the challenges posed by the dense vegetation, intense surface processes, and low fault slip rates in the study area. The advantage of using lidar derived 0.5 m resolution DEM lies in the availability and coverage of the entire study area, which provides ground surface information without vegetation. This aspect is particularly critical in forested areas. Although photogrammetry offered higher resolution DEMs at 0.1 m resolution, its limitation concerning the vegetation necessitated a combined approach with lidar data in the Povlje case to obtain an optimal DEM. Geomorphological mapping based on high-resolution data has proven to be effective in identifying subtle geomorphologic indicators of active tectonic displacements. However, we emphasize the importance of validating these results with other methods such as field geological mapping and geophysical surveys. Structural geological mapping is essential for understanding lithology and structure and supports geomorphologic and geophysical interpretations. Geophysical surveys have provided valuable insights into near-surface deformation, strengthening the geomorphological findings. ERT enabled us to image the fault up to a depth of 50 m, while GPR offered indications of faulting in shallower parts (up to 10 m). The ERT and GPR results were consistent in delineating the main faults. As each dataset provides specific information, the interdisciplinary approach employed in our study was necessary, especially in an area where evidence of active tectonic deformation can be quickly obscured or destroyed. The combination of methods and datasets allowed for a joint interpretation, which increased the reliability of the interpretations and led to a more comprehensive understanding of surface and near-surface deformation.

5.1. Comparison of Displacements

The displacements of the Quaternary deposits along the Sava Fault were determined using geomorphological analyses, ERT and GPR. Based on geomorphological observations, two groups of possible horizontal displacements were measured in Povlje: 12–18 m and 42–59 m. The tentatively estimated displacement of 54–64 m in Laško could correspond to the second group in Povlje. The bimodal distribution indicates that the displaced landforms refer to two different periods, where the oldest landforms accommodated a larger fraction of the cumulative (or total) displacement along the Sava Fault.
The ERT and GPR profiles perpendicular to the fault do not allow estimations of horizontal displacements. On the other hand, the fault-parallel GPR profiles in Povlje revealed possible horizontal displacements similar to the displacements of geomorphological markers (7–58 m). There, the displacements were estimated on three different channels and different groups of fault branches in between fault-parallel GPR profiles (Figure 5 and Figure 10). Displacements in between neighboring GPR profiles Povlje N1, N2, and N3 are smallest for the infilled channel (7–15 m), become larger for the erosional channel at the surface (18–24 m), and are largest for the buried channel (36 m). Similarly, the cumulative displacements in between GPR profiles Povlje N1 and N3 are smaller for the infilled channel (22 m) and larger for the erosional channel at the surface (42 m). Since the amount of displacement generally increases with the age of the marker units, we conclude that the infilled channel is likely the youngest and the buried channel is the oldest, while the erosional channel at the surface could be older than the infilled channel. This can be explained by the scenario in which the erosional channel was active over a longer period, during which the younger infilled channel was formed as an erosional channel and then filled.
In addition to the increase in displacement with the age of the channel, an increase in displacement with the number of fault branches crossing the channel was also observed. In the case of the erosional channel, the displacement over a group of two to three branches (comparison between neighboring GPR profiles Povlje N1, N2, and N3) is 18–24 m, over a group of five branches 42 m (comparison between Povlje N1 and N3) and the total displacement over seven branches is 58 m (comparison between Povlje N1 and N4b). Vertical displacements were observed in the geomorphology and in the fault-perpendicular ERT and GPR profiles, with the northern block appearing to be downthrown compared to the southern block in both Povlje and Laško. In Povlje, the vertical displacement was measured at 7 m based on the topographic profile (Figure 5). As there are no comparable units on either side of the fault, the vertical throw could not be quantitatively estimated from the ERT and GPR profiles. The apparent vertical displacement is inconsistent with the general morphology of the Sava Fault, but variable directions of uplift and subsidence are to be expected in a transpressive fault zone. However, it is more likely that the apparently inconsistent vertical displacement can be attributed to horizontal displacement, which can locally cause apparent vertical displacement in case the marker surface is undulating.

5.2. Slip Rate

To define the fault slip rate it is crucial to use the total displacement across the fault, because partial capture of deformation would give an underestimate of deformation rates. On the other hand, it is important to understand the distribution of deformation in the fault zone (e.g., [1,125,126]). The age of the top surface of the Povlje alluvial fan was estimated at 27.4 ± 1.6 ka based on one OSL date. The displacement of the western edge of the fan is 59 m and corresponds to the 58 m total displacement of the erosional channel on its surface. This displacement occurred after the deposition of the Povlje fan. We assume that the displacements of 42–59 m estimated from the geomorphology and the 42–58 m displacements of the erosional channel visible in the GPR profiles occurred during approximately the same time. Assuming our OSL age as representative for the age of the Povlje alluvial fan and using the estimated displacements of geomorphological indicators, we tentatively estimate the slip rate along the fault to be 1.8 ± 0.4 mm/a for the last 27 ka. Landforms with smaller displacements (12–18 m geomorphic displacements, 22 m displacement of the infilled channel visible on the GPR profiles) are younger than 27 ka (likely Holocene), and the buried channel with 36 m offset across the group of two branches is older.
The estimated slip rate for the last 27 ka is higher than the previously estimated long-term geomorphic slip rate of 0.7 ± 0.2 mm/a [23]. The lower boundary of our estimate roughly fits GNSS measurements of recent fault activity of 1.2 mm/a [40]. The comparison of the fault slip rate estimates obtained in this study with previous estimates is shown in Figure 12. Overall, slip rate estimates overlap within their uncertainties, except for the much lower modeled recent slip rates of 0.05–0.15 mm/a [41,42]. The variability of the estimates could be a consequence of the uncertainties associated with each method [127] and the temporal variability of the fault slip rates [128,129,130] and the earthquake cycle [131]. Estimates based on geology have large uncertainties both in estimated displacement and time for its accumulation [21]. The uncertainty of the long-term geomorphologic estimate comes from the low-resolution topographic data used to constrain the displacement and the age of the displaced unit estimated by correlation with terraces in the area [23]. The uncertainties in the slip-rate estimated in this study are in the interpretation of the geomorphological indicators for displacement and the representability of a single OSL date to the age of the Povlje alluvial fan. While the displacements inferred from geomorphology and GPR exhibit a systematic nature and consistent sizes across various channels, they may, in part, result from the sinuous flow patterns of the channels. These uncertainties were not quantitatively evaluated.
Our slip rate estimate is also higher than the estimates for other large strike-slip faults in the region with slip rates of about 1.0–1.5 mm/a, namely the Idrija, Predjama, and Raša faults in the Dinaric Fault System [4,22]. Note however that some of the estimates on those faults reached higher values of 2–4 mm/a during the same time interval of the last ca. 30 ka [4]. It is therefore possible that deformation rates in the region increased during this period. Due to insufficient data, we cannot speculate at this time whether this could be due to an increase in plate motion velocity or an interaction with other faults of the two fault systems (i.e., the Periadriatic and the Dinaric fault systems). Further investigations are needed to better constrain the slip rate and its variability on the Sava Fault and in the region.

5.3. Implications for Seismic Hazard

Our results show distributed deformation along the fault, with the youngest traces of fault activity occurring in an up to 100 m wide zone, also affecting Quaternary deposits. The ERT data suggest a positive flower structure in Povlje and tectonic lenses in Laško, with the fault branches dipping steeply to the N. The high-resolution data enabled detailed mapping of the fault traces, which can be used in the future to establish respect zones from active fault traces in populated areas to avoid the risk of surface deformation during an earthquake [132].
The indications collected since the end of the Late Pleistocene suggest that the Sava Fault is an active and capable fault, as hypothesized in previous studies [21,22]. Although additional estimates are required to investigate the question of temporal variation in fault slip rate, our estimated slip rate of 1.8 ± 0.4 mm/a suggests that deformation rates likely vary over time, have increased in the last 30 ka and are again lower in the last decades. Our higher slip rate should also be considered when updating the seismic source model as part of the seismic hazard assessment. The current seismic source model includes a slip rate of 0.05–1.5 mm/a, with the best estimate being 1 mm/a [43,44].
As the seismic history of this fault is still totally unknown, while its seismogenic potential is estimated to have a maximum magnitude of 7.3 [22,43,44], future research should fill this gap. The results of this study make it possible to narrow down the sites for paleoseismic studies to investigate the seismic history of the fault. Both Povlje and Laško are suitable for such studies, but the structural geological mapping shows that Povlje is located on the main fault branch, while Laško is located on the secondary branch.

6. Conclusions

Using a well-established interdisciplinary approach, we investigated a short section of the Sava Fault, which is part of the Periadriatic Fault System in the Slovenian Southern Alps, with the aim of shedding light on its late Quaternary activity and understanding its behavior. Using high-resolution digital elevation models generated through lidar and photogrammetric surveys, we overcame the challenges of assessing fault activity in a region characterized by intense surface processes, dense vegetation, and low fault slip rates. By integrating remote sensing analysis, geomorphological mapping, structural geological mapping, and near-surface geophysics, including ERT and GPR, we identified faint geomorphological indicators and near-surface deformation along the fault. The results underline the activity of the Sava Fault, showing distributed surface deformation and the complexity of the fault. Using one OSL date, which we tentatively interpreted as representative for the displaced unit, we estimated a fault slip rate of 1.8 ± 0.4 mm/a for the last 27 ka. This rate exceeds previous long-term geomorphological and recent GNSS measurements, suggesting temporal variability in fault behavior. A similar increase in fault slip rates over the same period was previously indicated in the Dinaric Fault System in the northwestern Dinarides of Slovenia [4]. Our results thus provide new insights into deformation partitioning in the Adria–Europe contact zone and further our understanding of fault dynamics in this region.
This study emphasizes the need to use modern high-resolution remote sensing techniques and interdisciplinary research approaches in low-strain environments with intense surface processes to reveal subtle active tectonic deformation. Further research and more extensive datasets are essential to better understand the variability of slip rates and to refine our understanding of the behavior of the Sava Fault and seismic hazard. Our study provides a foundation for future paleoseismological research on the fault to fill critical gaps in our understanding of seismic history of the fault.

Supplementary Materials

The following supporting information can be downloaded at: https://www.mdpi.com/article/10.3390/rs16091490/s1, Section S1: Digital Elevation Models (Figures S1–S14); Section S2: Geological map with description of lithostratigraphic units and field photos (Figures S15–S32); Section S3: Electrical Resistivity Tomography profiles (Figures S33–S34); Section S4: Ground Penetrating Radar profiles (Figures S35–S42); Section S5: Luminescence Dating (Table S1).

Author Contributions

Conceptualization, P.J.R. and J.A.; methodology, P.J.R., J.A., B.H., M.Z., C.G., S.T., M.N., A.N. and M.V.; formal analysis, P.J.R., B.H., M.Z. and S.T.; investigation, P.J.R., J.A., B.H., B.M. (Branko Mušič), M.Z., C.G., K.U., S.T., M.N., B.M. (Blaž Milanič), A.M., K.I., A.N., J.J. and M.Ž.; resources, B.H., B.M. (Branko Mušič), M.Z., C.G., S.T., A.N. and M.V.; data curation, P.J.R., A.N., B.M. (Blaž Milanič), M.V., B.H., M.Z. and S.T.; writing—original draft preparation, P.J.R., C.G., S.T., B.H. and M.Z.; writing—review and editing, P.J.R., J.A., B.H., M.Z., C.G., K.U., S.T., M.N., K.I., A.N., J.J., M.Ž., M.B. and M.V.; visualization, P.J.R., B.M. (Blaž Milanič), B.H., M.Z. and C.G.; supervision, P.J.R., M.B. and M.V.; project administration, P.J.R.; and funding acquisition, P.J.R., J.A., B.M. (Branko Mušič), C.G. and K.U. All authors have read and agreed to the published version of the manuscript.

Funding

This study and preparation of the paper was funded by the Slovenian Research and Innovation Agency (ARIS), through the program groups Dynamic Earth (P1-0419), Regional Geology (P1-0011), and Geoenvironment and Geomaterials (P1-0195) and project Karst3Dge (Z1-3195). Geomorphological and structural geological part of the study was funded by the Slovenian Environment Agency (ARSO). Geophysical investigation was co-funded by GEARH d.o.o. Age dating was funded by DFG projects 365171455 and 442570483, which were part of the “SPP2017-Mountain Building Processes in 4D”.

Data Availability Statement

Publicly available lidar datasets were analyzed in this study. This data can be found here: http://gis.arso.gov.si/evode/profile.aspx?id=atlas_voda_Lidar@Arso (accessed on 1 March 2021). The structural and geophysical data presented in this study are available in Supplementary Materials. All other data presented in this study are included in the article, further inquiries can be directed to the corresponding author.

Acknowledgments

This study was initiated by discussions with Andrej Gosar and Polona Zupančič (Slovenian Environment Agency), whom we thank for their support of our activities. We would like to thank the guest editor Daniele Cirillo and reviewers Paolo Galli and the four other anonymous reviewers for their valuable time and constructive feedback, which contributed significantly to the improvement of our work. This paper is dedicated to the memory of Bogomir Celarc (1971-2021), structural geologist and head of the Department of Regional Geology at the Geological Survey of Slovenia, who supported the research efforts of his team that led to this paper.

Conflicts of Interest

The authors declare no conflicts of interest.

References

  1. McCalpin, J.; Ferrario, F.; Figueiredo, P.; Livio, F.; Grützner, C.; Pisarska-Jamroży, M.; Quigley, M.; Reicherter, K.; Rockwell, T.; Štěpančíková, P.; et al. New Developments in Onshore Paleoseismic Methods, and Their Impact on Quaternary Tectonic Studies. Quat. Int. 2023, 664, 59–76. [Google Scholar] [CrossRef]
  2. Cunningham, D.; Grebby, S.; Tansey, K.; Gosar, A.; Kastelic, V. Application of Airborne LiDAR to Mapping Seismogenic Faults in Forested Mountainous Terrain, Southeastern Alps, Slovenia. Geophys. Res. Lett. 2006, 33, L20308. [Google Scholar] [CrossRef]
  3. Moulin, A.; Benedetti, L.; Gosar, A.; Jamšek Rupnik, P.; Rizza, M.; Bourlès, D.; Ritz, J.F. Determining the Present-Day Kinematics of the Idrija Fault (Slovenia) from Airborne LiDAR Topography. Tectonophysics 2014, 628, 188–205. [Google Scholar] [CrossRef]
  4. Moulin, A.; Benedetti, L.; Rizza, M.; Jamšek Rupnik, P.; Gosar, A.; Bourlès, D.; Keddadouche, K.; Aumaître, G.; Arnold, M.; Guillou, V.; et al. The Dinaric Fault System: Large-Scale Structure, Rates of Slip, and Plio-Pleistocene Evolution of the Transpressive Northeastern Boundary of the Adria Microplate. Tectonics 2016, 35, 2258–2292. [Google Scholar] [CrossRef]
  5. Liu, J.; Ren, Z.; Min, W.; Ha, G.; Lei, J. The Advance in Obtaining Fault Slip Rate of Strike Slip Fault—A Review. Earthq. Res. Adv. 2021, 1, 100032. [Google Scholar] [CrossRef]
  6. Liu, X.; Gao, Z.; Shao, Y.; Yao, Y. Late Pleistocene Slip Rates on an Active Normal Fault in the Northwestern Ordos Block, China. Front. Earth Sci. 2022, 10, 916905. [Google Scholar] [CrossRef]
  7. Ferrater, M.; Arrowsmith, R.; Masana, E.; Abellan, A.; Derron, M.-H.; Jaboyedoff, M.; Lu, Z.; Thenkabail, P.S. Lateral Offset Quality Rating along Low Slip Rate Faults: Application to the Alhama de Murcia Fault (SE Iberian Peninsula). Remote Sens. 2015, 7, 14827–14852. [Google Scholar] [CrossRef]
  8. Grützner, C.; Aschenbrenner, S.; Jamšek Rupnik, P.; Reicherter, K.; Saifelislam, N.; Vičič, B.; Vrabec, M.; Welte, J.; Ustaszewski, K. Holocene Surface-Rupturing Earthquakes on the Dinaric Fault System, Western Slovenia. Solid Earth 2021, 12, 2211–2234. [Google Scholar] [CrossRef]
  9. Ha, S.; Son, M.; Seong, Y.B. Active Fault Trace Identification Using a LiDAR High-Resolution DEM: A Case Study of the Central Yangsan Fault, Korea. Remote Sens. 2022, 14, 4838. [Google Scholar] [CrossRef]
  10. Falcucci, E.; Poli, M.E.; Galadini, F.; Scardia, G.; Paiero, G.; Paiero, G.; Zanferrari, A. First Evidence of Active Transpressive Surface Faulting at the Front of the Eastern Southern Alps, Northeastern Italy: Insight on the 1511 Earthquake Seismotectonics. Solid Earth 2018, 9, 1–12. [Google Scholar] [CrossRef]
  11. Poli, M.E.; Falcucci, E.; Gori, S.; Monegato, G.; Zanferrari, A.; Affatato, A.; Baradello, L.; Böhm, G.; Bo, I.D.; Del Pin, E.; et al. Paleoseismological Evidence for Historical Ruptures along the Meduno Thrust (Eastern Southern Alps, NE Italy). Tectonophysics 2021, 818, 229071. [Google Scholar] [CrossRef]
  12. Štěpančíková, P.; Rockwell, T.K.; Stemberk, J.; Rhodes, E.J.; Hartvich, F.; Luttrell, K.; Myers, M.; Tábořík, P.; Rood, D.H.; Wechsler, N.; et al. Acceleration of Late Pleistocene Activity of a Central European Fault Driven by Ice Loading. Earth Planet Sci. Lett. 2022, 591, 117596. [Google Scholar] [CrossRef]
  13. Jamšek Rupnik, P.; Žebre, M.; Jež, J.; Zajc, M.; Preusser, F.; Monegato, G. Deciphering the Deformation Mechanism in Quaternary Deposits along the Idrija Fault in the Formerly Glaciated Soča Valley, Southeast European Alps. Eng. Geol. 2022, 297, 106515. [Google Scholar] [CrossRef]
  14. Naik, S.P.; Gwon, O.; Park, K.; Bae, S.Y.; Shin, H.-C.; Choi, J.-H.; Kim, Y.-S. Localization and Characterization of the Southern Ulsan Fault (UF) Using Geo-Electrical Imaging: Implication for Seismic Hazard Assessment in an Urbanized Area. J. Geodyn. 2022, 151, 101919. [Google Scholar] [CrossRef]
  15. Galli, P.A.C.; Giocoli, A.; Peronace, E.; Piscitelli, S.; Quadrio, B.; Bellanova, J. Integrated near Surface Geophysics across the Active Mount Marzano Fault System (Southern Italy): Seismogenic Hints. Int. J. Earth Sci. 2014, 103, 315–325. [Google Scholar] [CrossRef]
  16. Danciu, L.; Nandan, S.; Reyes, C.; Basili, R.; Weatherill, G.; Beauval, C.; Rovida, A.; Vilanova, S.; Sesetyan, K.; Bard, P.-Y.; et al. The 2020 Update of the European Seismic Hazard Model-ESHM20: Model Overview; EFEHR Technical Report 001, v1.0.0.; ETH: Zurich, Switzerland, 2021. [Google Scholar] [CrossRef]
  17. Basili, R.; Danciu, L.; Beauval, C.; Sesetyan, K.; Pires, S.; Carafa, M.M.C.; Cushing, E.M.; Custudio, S.; Demircioglu Tumsa, M.B.; Duarte, J.; et al. The European Fault-Source Model 2020 (EFSM20): Geologic Input Data for the European Seismic Hazard Model 2020. Nat. Hazards Earth Syst. Sci.—Discuss 2023. [Google Scholar] [CrossRef]
  18. Fodor, L.; Jelen, B.; Márton, E.; Márton, E.; Skaberne, D.; Čar, J.; Vrabec, M. Miocene-Pliocene Tectonic Evolution of the Slovenian Periadriatic Fault: Implications for Alpine-Carpathian Extrusion Models. Tectonics 1998, 17, 690–709. [Google Scholar] [CrossRef]
  19. Vrabec, M.; Fodor, L. Late Cenozoic Tectonics of Slovenia: Structural Styles at the Northeastern Corner of the Adriatic Microplate. In The Adria Microplate: GPS Geodesy, Tectonics and Hazards (NATO Science Series IV, Earth and Environmental Sciences 61); Pinter, N., Gyula, G., Weber, J., Stein, S., Medak, D., Eds.; Springer: Dordrecht, The Netherlands, 2006; pp. 151–168. [Google Scholar]
  20. Anderson, H.; Jackson, J. Active Tectonics of the Adriatic Region. Geophys. J. Int. 1987, 91, 937–983. [Google Scholar] [CrossRef]
  21. Jamšek Rupnik, P.; Benedetti, L.; Bavec, M.; Vrabec, M. Geomorphic Indicators of Quaternary Activity of the Sava Fault between Golnik and Preddvor. RMZ—Mater. Geoenvironment 2012, 59, 299–314. [Google Scholar]
  22. Atanackov, J.; Jamšek Rupnik, P.; Jež, J.; Celarc, B.; Novak, M.; Milanič, B.; Markelj, A.; Bavec, M.; Kastelic, V. Database of Active Faults in Slovenia: Compiling a New Active Fault Database at the Junction Between the Alps, the Dinarides and the Pannonian Basin Tectonic Domains. Front. Earth Sci. 2021, 9, 604388. [Google Scholar] [CrossRef]
  23. Jamšek Rupnik, P. Geomorphological Evidence of Active Tectonics in the Ljubljana Basin. Ph.D. Dissertation, University of Ljubljana, Ljubljana, Slovenia, 2013. [Google Scholar]
  24. Vrabec, M. Strukturna Analiza Cone Savskega Preloma Med Trstenikom in Stahovico. Ph.D. Thesis, University of Ljubljana, Faculty of Natural Sciences and Engineering, Ljubljana, Slovenia, 2001. [Google Scholar]
  25. Bohinec, V. K Morfologiji in Glaciologiji Rateške Pokrajine. Geogr. Vestn. 1935, 11, 100–132. [Google Scholar]
  26. Kuščer, D. Prispevek h glacialni geologiji radovljiške kotline. Geologija 1955, 3, 136–150. [Google Scholar]
  27. Melik, A. Nekaj Glacioloških Opažanj Iz Zgornje Doline. Geogr. Zb. 1955, 3, 299–318. [Google Scholar]
  28. Melik, A. Vitranc, Zelenci in Bovško: Geomorfološke Študije Iz Zahodnih Julijskih Alp. Geogr. Zb. 1961, 6, 287–332. [Google Scholar]
  29. Gams, I. Prispevek k Mladokvartarni Geomorfologiji v Zgornjesavski Dolini = A Contribution to the Young Quaternary Geomorphology in the Upper Sava Valley. Geogr. Zb. 1992, 32, 5–49. [Google Scholar]
  30. Bavec, M.; Verbič, T. Glacial History of Slovenia. Dev. Quat. Sci. 2011, 15, 385–392. [Google Scholar] [CrossRef]
  31. Poli, M.E.; Zanferrari, A. The Seismogenic Sources of the 1976 Friuli Earthquakes: A New Seismotectonic Model for the Friuli Area. Boll. Di Geofis. Teor. Ed Appl. 2018, 59, 463–480. [Google Scholar]
  32. Bajc, J.; Aoudia, A.; Saraò, A.; Suhadolc, P. The 1998 Bovec-Krn Mountain (Slovenia) Earthquake Sequence. Geophys. Res. Lett. 2001, 28, 1839–1842. [Google Scholar] [CrossRef]
  33. Pondrelli, S.; Pondrelli, S.; Ekström, G.; Morelli, A. Seismotectonic Re-Evaluation of the 1976 Friuli, Italy, Seismic Sequence. J. Seismol. 2001, 5, 73–83. [Google Scholar] [CrossRef]
  34. Kastelic, V.; Vrabec, M.; Cunningham, D.; Gosar, A.; Gosar, A. Neo-Alpine Structural Evolution and Present-Day Tectonic Activity of the Eastern Southern Alps: The Case of the Ravne Fault, NW Slovenia. J. Struct. Geol. 2008, 30, 963–975. [Google Scholar] [CrossRef]
  35. Herak, M.; Herak, D.; Orlić, N. Properties of the Zagreb 22 March 2020 Earthquake Sequence—Analyses of the Full Year of Aftershock Recording. Geofizika 2021, 38, 93–116. [Google Scholar] [CrossRef]
  36. Caracciolo, C.H.; Slejko, D.; Camassi, R.; Castelli, V. The Eastern Alps Earthquake of 25 January 1348: New Insights from Old Sources. Bull. Geophys. Oceanogr. 2021, 63, 335–364. [Google Scholar] [CrossRef]
  37. Ehlers, J.; Gibbard, P.L.; Hughes, P.D. Supplementary Data to Quaternary Glaciations—Extent and Chronology, a Closer Look; Dev. Quaternary Sci.; Elsevier: Amsterdam, The Netherlands, 2011; Volume 15. [Google Scholar]
  38. Slovenian Environment Agency LIDAR. Available online: http://gis.arso.gov.si/evode/profile.aspx?id=atlas_voda_Lidar@Arso (accessed on 1 March 2020).
  39. Placer, L. Displacement along the Sava Fault. Geologija 1996, 39, 283–287. [Google Scholar] [CrossRef]
  40. Vrabec, M.; Prešeren Pavlovčič, P.; Stopar, B. GPS Study (1996–2002) of Active Deformation along the Periadriatic Fault System in Northeastern Slovenia: Tectonic Model. Geol. Carpathica 2006, 57, 57–65. [Google Scholar]
  41. Kastelic, V.; Carafa, M.M.C. Fault Slip Rates for the Active External Dinarides Thrust-and-Fold Belt. Tectonics 2012, 31, TC3019. [Google Scholar] [CrossRef]
  42. Basili, R.; Basilic, R.; Kastelic, V.; Demircioglu, M.B.; Moreno, D.G.; Moreno, D.G.; Nemser, E.; Petricca, P.; Sboras, S.; Besana-Ostman, G.M.; et al. The European Database of Seismogenic Faults (EDSF) Compiled in the Framework of the Project SHARE; INGV: Roma, Italy, 2013. [Google Scholar] [CrossRef]
  43. Šket Motnikar, B.; Zupančič, P.; Živčić, M.; Atanackov, J.; Jamšek Rupnik, P.; Čarman, M.; Danciu, L.; Gosar, A. The 2021 Seismic Hazard Model for Slovenia (SHMS21): Overview and Results. Bull. Earthq. Eng. 2022, 20, 4865–4894. [Google Scholar] [CrossRef]
  44. Atanackov, J.; Jamšek Rupnik, P.; Zupančič, P.; Šket Motnikar, B.; Živčić, M.; Čarman, M.; Milanič, B.; Kastelic, V.; Rajh, G.; Gosar, A. Seismogenic Fault and Area Sources for Probabilistic Seismic Hazard Model in Slovenia. Pangaea 2022. [Google Scholar] [CrossRef]
  45. Asserato, R.; Desio, A.; Colberttaldo, D.D.; Passeri, L.D. Note Illustrative Della Carta Geologica d’Italia Alla Scala 1:100 000, Foglio 14 “Tarvisio”; Min. Industria, Commercio e Artigianato, Dir. Generale delle Miniere, Servizio Geologico d’Italia: Ercolano (Napoli), Italy, 1968; pp. 1–70. [Google Scholar]
  46. Carulli, G.B.; Bella Vedova, B.; Podda, F.; Slejko, D.; Zanolla, C. Note Illustrative Della Carta Geologica Del Friuli Venezia Giulia, Scala 1: 150 000; Regione Autonoma Friuli Venezia Giulia, Direzione Centrale Ambiente e Lavori Pubblici, Servizio Geologico Regionale: Trieste, Italy, 2006. [Google Scholar]
  47. Hammerl, C.; Albini, P.; Moroni, A. The Earthquake of January 25th, 1348: Discussion of Sources. Hist. Investig. Eur. Earthq. 1994, 2, 225–240. [Google Scholar]
  48. Živčić, M. Catalog of Earthquakes in Slovenia; Excel Spreadsheet. Internal Documentation; Ministry of Agriculture and Environment, Slovenian Environment Agency, Seismology and Geology Office: Ljubljana, Slovenia, 2009.
  49. Zorn, M. Podori na Dobraču. Geografski vestnik 2002, 74, 9–20. [Google Scholar]
  50. Mrak, I.; Merchel, S.; Benedetti, L.; Braucher, R.; Bourles, D.; Finkel, R.C.; Reitner, J.M. Uporaba Metode Datiranja Površinske Izpostavljenosti Na Primeru Podora Veliki Vrh. In Proceedings of the Naravne Nesreče v Sloveniji: Zbornik Povzetkov. 1. Trienalni Znanstveni Posvet, Ig, Ljubljana, Slovenia, 12 December 2008; Zorn, M., Komac, B., Pavšek, M., Pagon, P., Eds.; Geografski inštitut Antona Melika ZRC SAZU: Ljubljana, Slovenia, 2010; pp. 105–111. [Google Scholar]
  51. Merchel, S.; Mrak, I.; Braucher, R.; Benedetti, L.; Repe, B.; Bourlès, D.L.; Reitner, J.M. Surface Exposure Dating of the Veliki Vrh Rock Avalanche in Slovenia Associated with the 1348 Earthquake. Quat. Geochronol. 2014, 22, 33–42. [Google Scholar] [CrossRef]
  52. Kázmér, M.; Jamšek Rupnik, P.; Gaidzik, K. Seismic Activity in the Celje Basin (Slovenia) in Roman Times—Archaeoseismological Evidence from Celeia. Quaternary 2023, 6, 10. [Google Scholar] [CrossRef]
  53. Bagagli, M.; Molinari, I.; Diehl, T.; Kissling, E.; Giardini, D.; Clinton, J.; Scarabello, L.; Käestli, P.; Racine, R.; Massin, F.; et al. The AlpArray Research Seismicity-Catalogue. Geophys. J. Int. 2022, 231, 921–943. [Google Scholar] [CrossRef]
  54. Hofman, L.J.; Kummerow, J.; Cesca, S. A New Seismicity Catalogue of the Eastern Alps Using the Temporary Swath-D Network. Solid Earth 2023, 14, 1053–1066. [Google Scholar] [CrossRef]
  55. Jamšek Rupnik, P.; Živčić, M.; Atanackov, J.; Celarc, B.; Jež, J.; Novak, M.; Milanič, B.; Jesenko, T.; Ložar Stopar, M.; Bavec, M. Seismotectonic Map. In Geological atlas of Slovenia; Novak, M., Rman, N., Eds.; Geological Survey of Slovenia: Ljubljana, Slovenia, 2016; pp. 96–97. [Google Scholar]
  56. Rovida, A.; Antonucci, A.; Locati, M. The European Preinstrumental Earthquake Catalogue EPICA, the 1000–1899 Catalogue for the European Seismic Hazard Model 2020. Earth Syst. Sci. Data 2022, 14, 5213–5231. [Google Scholar] [CrossRef]
  57. Zhang, H.; Aldana-Jague, E.; Clapuyt, F.; Wilken, F.; Vanacker, V.; Van Oost, K. Evaluating the Potential of Post-Processing Kinematic (PPK) Georeferencing for UAV-Based Structure-from-Motion (SfM) Photogrammetry and Surface Change Detection. Earth Surf. Dyn. 2019, 7, 807–827. [Google Scholar] [CrossRef]
  58. Cirillo, D.; Cerritelli, F.; Agostini, S.; Bello, S.; Lavecchia, G.; Brozzetti, F. Integrating Post-Processing Kinematic (PPK)–Structure-from-Motion (SfM) with Unmanned Aerial Vehicle (UAV) Photogrammetry and Digital Field Mapping for Structural Geological Analysis. ISPRS Int. J. Geoinf. 2022, 11, 437. [Google Scholar] [CrossRef]
  59. Zakšek, K.; Oštir, K.; Kokalj, Ž. Sky-View Factor as a Relief Visualization Technique. Remote Sens. 2011, 3, 398–415. [Google Scholar] [CrossRef]
  60. Kokalj, Ž.; Somrak, M. Why Not a Single Image? Combining Visualizations to Facilitate Fieldwork and On-Screen Mapping. Remote Sens. 2019, 11, 747. [Google Scholar] [CrossRef]
  61. Diercks, M.-L.; Grützner, C.; Welte, J.; Ustaszewski, K. Challenges of Geomorphologic Analysis of Active Tectonics in a Slowly Deforming Karst Landscape (W Slovenia and NE Italy). Geomorphology 2023, 440, 108894. [Google Scholar] [CrossRef]
  62. Jamšek Rupnik, P.; Benedetti, L.; Preusser, F.; Bavec, M.; Vrabec, M. Geomorphic Evidence of Recent Activity along the Vodice Thrust Fault in the Ljubljana Basin (Slovenia)—A Preliminary Study. Ann. Geophys. 2013, 56, S0680. [Google Scholar] [CrossRef]
  63. Bull, W. Tectonic Geomorphology of Mountains: A New Approach to Paleoseismology; Blackwell Publishing: Malden, MA, USA; Oxford, UK, 2007. [Google Scholar]
  64. Burbank, D.W.; Anderson, R.S. Tectonic Geomorphology; Blackwell Science: Malden, MA, USA, 2001. [Google Scholar]
  65. McCalpin, J. Paleoseismology. In International Geophysics; Academic Press; Elsevier: Burlington, MA, USA, 2009; Volume 95, pp. 1–615. [Google Scholar]
  66. Grad, K.; Ferjančič, L. Osnovna Geološka Karta SFRJ, List Kranj, 1:100.000. Basic Geological Map of SFR Yugoslavia, Sheet Kranj; Zvezni Geološki Zavod: Beograd, Serbia, 1974. [Google Scholar]
  67. Buser, S.; Cajhen, J. Osnovna Geološka Karta SFRJ, List Celovec (Klagenfurt), 1:100.000. Basic Geological Map of SFR Yugoslavia, Sheet Celovec (Klagenfurt); Zvezni Geološki Zavod: Beograd, Serbia, 1978. [Google Scholar]
  68. Loke, M.H.; Chambers, J.E.; Rucker, D.F.; Kuras, O.; Wilkinson, P.B. Recent Developments in the Direct-Current Geoelectrical Imaging Method. J. Appl. Geophy. 2013, 95, 135–156. [Google Scholar] [CrossRef]
  69. Suzuki, K.; Toda, S.; Kusunoki, K.; Fujimitsu, Y.; Mogi, T.; Jomori, A. Case Studies of Electrical and Electromagnetic Methods Applied to Mapping Active Faults beneath the Thick Quaternary. Dev. Geotech. Eng. 2000, 84, 29–45. [Google Scholar] [CrossRef]
  70. Caputo, R.; Piscitelli, S.; Oliveto, A.; Rizzo, E.; Lepenna, V. The Use of Electrical Resistivity Tomographies in Active Tectonics: Examples from the Tyrnavos Basin, Greece. J. Geodyn. 2003, 36, 19–35. [Google Scholar] [CrossRef]
  71. Rizzo, E.; Colella, A.; Lapenna, V.; Piscitelli, S. High-Resolution Images of the Fault-Controlled High Agri Valley Basin (Southern Italy) with Deep and Shallow Electrical Resistivity Tomographies. Phys. Chem. Earth 2004, 29, 321–327. [Google Scholar] [CrossRef]
  72. Chwatal, W.; Decker, K.; Roch, K.-H. Mapping of Active Capable Faults by High-Resolution Geo- Physical Methods: Examples from the Central Vienna Basin. Austrian J. Earth Sci. 2005, 97, 52–59. [Google Scholar]
  73. Gélis, C.; Revil, A.; Cushing, M.E.; Jougnot, D.; Lemeille, F.; Cabrera, J.; de Hoyos, A.; Rocher, M. Potential of Electrical Resistivity Tomography to Detect Fault Zones in Limestone and Argillaceous Formations in the Experimental Platform of Tournemire, France. Pure Appl. Geophys. 2010, 167, 1405–1418. [Google Scholar] [CrossRef]
  74. Drahor, M.G.; Berge, M.A. Integrated Geophysical Investigations in a Fault Zone Located on Southwestern Part of İzmir City, Western Anatolia, Turkey. J. Appl. Geophy. 2017, 136, 114–133. [Google Scholar] [CrossRef]
  75. Mojica, A.; Pérez, T.; Toral, J.; Miranda, R.; Franceschi, P.; Calderón, C.; Vergara, F. Shallow Electrical Resistivity Imaging of the Limón Fault, Chagres River Watershed, Panama Canal. J. Appl. Geophy. 2017, 138, 135–142. [Google Scholar] [CrossRef]
  76. Woźniak, T.; Bania, G. Analysis of the Tectonic and Sedimentary Features of the Southern Margin of the Krzeszowice Graben in Southern Poland Based on an Integrated Geoelectrical and Geological Studies. J. Appl. Geophy. 2019, 165, 60–76. [Google Scholar] [CrossRef]
  77. Meng, F.; Zhang, G.; Qi, Y.; Zhou, Y.; Zhao, X.; Ge, K. Application of Combined Electrical Resistivity Tomography and Seismic Reflection Method to Explore Hidden Active Faults in Pingwu, Sichuan, China. Open Geosci. 2020, 12, 174–189. [Google Scholar] [CrossRef]
  78. Henaish, A.; Attwa, M.; Zamzam, S. Integrated Structural, Geophysical and Remote Sensing Data for Characterizing Extensional Linked Fault Systems and Related Land Deformation Hazards at Cairo-Suez District, Egypt. Eng. Geol. 2023, 314, 106999. [Google Scholar] [CrossRef]
  79. Berge, M.A. Electrical Resistivity Tomography Investigations on a Paleoseismological Trenching Study. J. Appl. Geophy. 2014, 109, 162–174. [Google Scholar] [CrossRef]
  80. Dahlin, T.; Zhou, B. A Numerical Comparison of 2D Resistivity Imaging with 10 Electrode Arrays. Geophys. Prospect. 2004, 52, 379–398. [Google Scholar] [CrossRef]
  81. Loke, M.H. RES2DINVx64 Ver. 4.04 with Multi-Core And 64-Bit Support, Rapid 2-D Resistivity & IP Inversion Using the Least-Squares Method. Geotomo Softw. Malays. 2017, 137. Available online: https://landviser.com/wp-content/uploads/2018/02/Res2dinvx64.pdf (accessed on 19 February 2024).
  82. Loke, M.H.; Acworth, I.; Dahlin, T. A Comparison of Smooth and Blocky Inversion Methods in 2D Electrical Imaging Surveys. Explor. Geophys. 2003, 34, 182–187. [Google Scholar] [CrossRef]
  83. Pauselli, C.; Federico, C.; Frigeri, A.; Orosei, R.; Barchi, M.R.; Basile, G. Ground Penetrating Radar Investigations to Study Active Faults in the Norcia Basin (Central Italy). J. Appl. Geophy. 2010, 72, 39–45. [Google Scholar] [CrossRef]
  84. Bermejo, L.; Ortega, A.I.; Parés, J.M.; Campaña, I.; Bermúdez de Castro, J.M.; Carbonell, E.; Conyers, L.B. Karst Features Interpretation Using Ground-Penetrating Radar: A Case Study from the Sierra de Atapuerca, Spain. Geomorphology 2020, 367, 107311. [Google Scholar] [CrossRef]
  85. Lissak, C.; Maquaire, O.; Malet, J.-P.; Lavigne, F.; Virmoux, C.; Gomez, C.; Davidson, R. Ground-Penetrating Radar Observations for Estimating the Vertical Displacement of Rotational Landslides. Nat. Hazards Earth Syst. Sci. 2015, 15, 1399–1406. [Google Scholar] [CrossRef]
  86. Neal, A. Ground-Penetrating Radar and Its Use in Sedimentology: Principles, Problems and Progress. Earth Sci. Rev. 2004, 66, 261–330. [Google Scholar] [CrossRef]
  87. Mahmoudzadeh, M.R.; Francés, A.P.; Lubczynski, M.; Lambot, S. Using Ground Penetrating Radar to Investigate the Water Table Depth in Weathered Granites—Sardon Case Study, Spain. J. Appl. Geophy. 2012, 79, 17–26. [Google Scholar] [CrossRef]
  88. Ercoli, M.; Cirillo, D.; Pauselli, C.; Jol, H.M.; Brozzetti, F. Ground-Penetrating Radar Signature of Quaternary Faulting: A Study from the Mt. Pollino Region, Southern Apennines, Italy. Solid Earth 2021, 12, 2573–2596. [Google Scholar] [CrossRef]
  89. McClymont, A.F.; Villamor, P.; Green, A.G. Fault Displacement Accumulation and Slip Rate Variability within the Taupo Rift (New Zealand) Based on Trench and 3-D Ground-Penetrating Radar Data. Tectonics 2009, 28, TC4005. [Google Scholar] [CrossRef]
  90. McClymont, A.F.; Green, A.G.; Villamor, P.; Horstmeyer, H.; Grass, C.; Nobes, D.C. Characterization of the Shallow Structures of Active Fault Zones Using 3-D Ground-Penetrating Radar Data. J. Geophys. Res. Solid Earth 2008, 113, B10315. [Google Scholar] [CrossRef]
  91. Amos, C.B.; Burbank, D.W.; Nobes, D.C.; Read, S.A.L. Geomorphic Constraints on Listric Thrust Faulting: Implications for Active Deformation in the Mackenzie Basin, South Island, New Zealand. J. Geophys. Res. Solid Earth 2007, 112, B03S11. [Google Scholar] [CrossRef]
  92. Gross, R.; Green, A.G.; Horstmeyer, H.; Begg, J.H. Location and Geometry of the Wellington Fault (New Zealand) Defined by Detailed Three-Dimensional Georadar Data. J. Geophys. Res. Solid Earth 2004, 109, 5401. [Google Scholar] [CrossRef]
  93. Patria, A.; Kimura, H.; Kitade, Y.; Tsutsumi, H. Right-Lateral Offset Associated with the Most Recent Earthquake on the Ikeda Fault of the Median Tectonic Line, Southwest Japan, Revealed by Ground-Penetrating Radar Profiling. Prog. Earth Planet Sci. 2022, 9, 8. [Google Scholar] [CrossRef]
  94. Ishiyama, T.; Mueller, K.; Sato, H.; Togo, M. Coseismic Fault-Related Fold Model, Growth Structure, and the Historic Multisegment Blind Thrust Earthquake on the Basement-Involved Yoro Thrust, Central Japan. J. Geophys. Res. Solid Earth 2007, 112, B03S07. [Google Scholar] [CrossRef]
  95. Beidinger, A.; Decker, K.; Roch, K.H. The Lassee Segment of the Vienna Basin Fault System as a Potential Source of the Earthquake of Carnuntum in the Fourth Century a.d. Int. J. Earth Sci. 2011, 100, 1315–1329. [Google Scholar] [CrossRef]
  96. Dentith, M.; O’Neill, A.; Clark, D. Ground Penetrating Radar as a Means of Studying Palaeofault Scarps in a Deeply Weathered Terrain, Southwestern Western Australia. J. Appl. Geophy. 2010, 72, 92–101. [Google Scholar] [CrossRef]
  97. Salvi, S.; Cinti, F.R.; Colini, L.; D’Addezio, G.; Doumaz, F.; Pettinelli, E. Investigation of the Active Celano-L’Aquila Fault System, Abruzzi (Central Apennines, Italy) with Combined Ground-Penetrating Radar and Palaeoseismic Trenching. Geophys. J. Int. 2003, 155, 805–818. [Google Scholar] [CrossRef]
  98. Malik, J.N.; Sahoo, A.K.; Shah, A.A.; Shinde, D.P.; Juyal, N.; Singhvi, A.K. Paleoseismic Evidence from Trench Investigation along Hajipur Fault, Himalayan Frontal Thrust, NW Himalaya: Implications of the Faulting Pattern on Landscape Evolution and Seismic Hazard. J. Struct. Geol. 2010, 32, 350–361. [Google Scholar] [CrossRef]
  99. McGeehin, J.; Burr, G.S.; Juli, A.J.T.; Reines, D.; Gosse, J.; Davis, P.T.; Muhs, D.; Southon, J.R. Stepped-Combustion 14C Dating of Sediment: A Comparison with Established Techniques. Radiocarbon 2001, 43, 255–261. [Google Scholar] [CrossRef]
  100. Strunk, A.; Olsen, J.; Sanei, H.; Rudra, A.; Larsen, N.K. Improving the Reliability of Bulk Sediment Radiocarbon Dating. Quat. Sci. Rev. 2020, 242, 106442. [Google Scholar] [CrossRef]
  101. Olsen, L.; Van Der Borg, K.; Bergstrøm, B.; Sveian, H.; Lauritzen, S.-E.; Hansen, G. AMS Radiocarbon Dating of Glacigenic Sediments with Low Organic Carbon Content—An important Tool for Reconstructing the History of Glacial Variations in Norway. Nor. Geol. Tidsskr. 2001, 81, 59–92. [Google Scholar]
  102. Reimer, P.J.; Austin, W.E.N.; Bard, E.; Bayliss, A.; Blackwell, P.G.; Bronk Ramsey, C.; Butzin, M.; Cheng, H.; Edwards, R.L.; Friedrich, M.; et al. The IntCal20 Northern Hemisphere Radiocarbon Age Calibration Curve (0–55 Cal KBP). Radiocarbon 2020, 62, 725–757. [Google Scholar] [CrossRef]
  103. Aitken, M.J. An Introduction to Optical Dating: The Dating of Quaternary Sediments by the Use of Photon-Stimulated Luminescence; Oxford University Press: Oxford, UK, 1998; ISBN 0198540922. [Google Scholar]
  104. Murray, A.S.; Wintle, A.G. Luminescence Dating of Quartz Using an Improved Single-Aliquot Regenerative-Dose Protocol. Radiat. Meas. 2000, 32, 57–73. [Google Scholar] [CrossRef]
  105. Reimann, T.; Tsukamoto, S. Dating the Recent Past (<500 Years) by Post-IR IRSL Feldspar—Examples from the North Sea and Baltic Sea Coast. Quat. Geochronol. 2012, 10, 180–187. [Google Scholar] [CrossRef]
  106. Murray, A.S.; Wintle, A.G. The Single Aliquot Regenerative Dose Protocol: Potential for Improvements in Reliability. Radiat. Meas. 2003, 37, 377–381. [Google Scholar] [CrossRef]
  107. Auclair, M.; Lamothe, M.; Huot, S. Measurement of Anomalous Fading for Feldspar IRSL Using SAR. Radiat. Meas. 2003, 37, 487–492. [Google Scholar] [CrossRef]
  108. Huntley, D.J.; Lamothe, M. Ubiquity of Anomalous Fading in K-Feldspars and the Measurement and Correction for It in Optical Dating. Can. J. Earth Sci. 2001, 38, 1093–1106. [Google Scholar] [CrossRef]
  109. Liritzis, I.; Stamoulis, K.; Papachristodoulou, C.; Ioannides, K. A Re-Evaluation of Radiation Dose-Rate Conversion Factors. Mediterr. Archaeol. Archaeom. 2013, 13, 1–15. [Google Scholar]
  110. Pavich, M.J.; Vidic, N.J. Application of Paleomagnetic and 10Be Analyses to Chronostratigraphy of Alpine Glacio-Fluvial Terraces, Sava River Valley, Slovenia. In Climate Change in Continental Isotopic Records (Geophysical Monograph); AGU: Washington, DC, USA, 1993; Volume 78, pp. 263–275. [Google Scholar]
  111. Vidic, N.J.; Lobnik, F. Rates of Soil Development of the Chronosequence in the Ljubljana Basin, Slovenia. Geoderma 1997, 76, 35–64. [Google Scholar] [CrossRef]
  112. Čeru, T.; Šegina, E.; Gosar, A. Geomorphological Dating of Pleistocene Conglomerates in Central Slovenia Based on Spatial Analyses of Dolines Using LiDAR and Ground Penetrating Radar. Remote Sens. 2017, 9, 1213. [Google Scholar] [CrossRef]
  113. Mencin Gale, E.; Jamšek Rupnik, P.; Trajanova, M.; Bavec, M.; Anselmetti, F.S.; Šmuc, A. Morphostratigraphy and Provenance of Plio-Pleistocene Terraces in the South-Eastern Alpine Foreland: The Mislinja and Upper Savinja Valleys, Northern Slovenia. J. Quat. Sci. 2019, 34, 633–649. [Google Scholar] [CrossRef]
  114. Mencin Gale, E.; Jamšek Rupnik, P.; Trajanova, M.; Gale, L.; Bavec, M.; Anselmetti, F.S.; Šmuc, A. Provenance and Morphostratigraphy of the Pliocene-Quaternary Sediments in the Celje and Drava-Ptuj Basins (Eastern Slovenia). Geologija 2019, 62, 189–218. [Google Scholar] [CrossRef]
  115. Mihevc, A.; Bavec, M.; Häuselmann, P.; Fiebig, M. Dating of the Udin Boršt Conglomerate Terrace and Implication for Tectonic Uplift in the Northern Part of the Ljubljana Basin (Slovenia). Acta Carsologica 2015, 44, 169–176. [Google Scholar] [CrossRef]
  116. Verbič, T. Quaternary Stratigraphy and Neotectonics of the Eastern Krško Basin. Part 1: Stratigraphy. Razpr. Diss. 2004, 45, 171–225. [Google Scholar]
  117. Mencin Gale, E.; Jamšek Rupnik, P.; Akçar, N.; Christl, M.; Vockenhuber, C.; Anselmetti, F.S.; Šmuc, A. The Onset of Plio-Early Pleistocene Fluvial Aggradation in the Southeastern Alpine Foreland (Velenje Basin, Slovenia) and Its Paleoenvironmental Implications. Preprint 2023. [Google Scholar] [CrossRef]
  118. Broglio Loriga, C.; Masetti, D.C.; Neri, C. La Formazione Di Werfen (Scitico) Delle Dolomite Occidentali: Sedimentologia e Biostratigrafia. Riv. Ital. Paleontol. Stratigr. 1983, 88, 501–598. [Google Scholar]
  119. Davies, B.J. Dating Glacial Landforms II: Radiometric Techniques. In Treatise in Geomorphology, 2nd ed.; Cryospheric Geomorphology; Haritashya, U., Ed.; Elsevier: Amsterdam, The Netherlands, 2021; pp. 249–280. [Google Scholar]
  120. Murray, A.S.; Thomsen, K.J.; Masuda, N.; Buylaert, J.P.; Jain, M. Identifying Well-Bleached Quartz Using the Different Bleaching Rates of Quartz and Feldspar Luminescence Signals. Radiat. Meas. 2012, 47, 688–695. [Google Scholar] [CrossRef]
  121. Colarossi, D.; Duller, G.A.T.; Roberts, H.M.; Tooth, S.; Lyons, R. Comparison of Paired Quartz OSL and Feldspar Post-IR IRSL Dose Distributions in Poorly Bleached Fluvial Sediments from South Africa. Quat. Geochronol. 2015, 30, 233–238. [Google Scholar] [CrossRef]
  122. Popit, T.; Rožič, B.; Šmuc, A.; Novak, A.; Verbovšek, T. Using a Lidar-Based Height Variability Method for Recognizing and Analyzing Fault Displacement and Related Fossil Mass Movement in the Vipava Valley, SW Slovenia. Remote Sens. 2022, 14, 2016. [Google Scholar] [CrossRef]
  123. Novak, A.; Oštir, K. Towards Better Visualisation of Alpine Quaternary Landform Features on High-Resolution Digital Elevation Models. Remote Sens. 2021, 13, 4211. [Google Scholar] [CrossRef]
  124. Peternel, T.; Janža, M.; Šegina, E.; Bezak, N.; Maček, M. Recognition of Landslide Triggering Mechanisms and Dynamics Using GNSS, UAV Photogrammetry and In Situ Monitoring Data. Remote Sens. 2022, 14, 3277. [Google Scholar] [CrossRef]
  125. Nurminen, F.; Boncio, P.; Visini, F.; Pace, B.; Valentini, A.; Baize, S.; Scotti, O. Probability of Occurrence and Displacement Regression of Distributed Surface Rupturing for Reverse Earthquakes. Front. Earth Sci. 2020, 8, 581605. [Google Scholar] [CrossRef]
  126. Ferrario, M.F.; Livio, F. Characterizing the Distributed Faulting During the 30 October 2016, Central Italy Earthquake: A Reference for Fault Displacement Hazard Assessment. Tectonics 2018, 37, 1256–1273. [Google Scholar] [CrossRef]
  127. Zechar, J.D.; Frankel, K.L. Incorporating and Reporting Uncertainties in Fault Slip Rates. J. Geophys. Res. Solid Earth 2009, 114, 12407. [Google Scholar] [CrossRef]
  128. Friedrich, A.M.; Wernicke, B.P.; Niemi, N.A.; Bennett, R.A.; Davis, J.L. Comparison of Geodetic and Geologic Data from the Wasatch Region, Utah, and Implications for the Spectral Character of Earth Deformation at Periods of 10 to 10 Million Years. J. Geophys. Re.s Solid Earth 2003, 108, 2199. [Google Scholar] [CrossRef]
  129. Mouslopoulou, V.; Walsh, J.J.; Nicol, A. Fault Displacement Rates on a Range of Timescales. Earth Planet Sci. Lett. 2009, 278, 186–197. [Google Scholar] [CrossRef]
  130. Cowie, P.A.; Roberts, G.P.; Bull, J.M.; Visini, F. Relationships between Fault Geometry, Slip Rate Variability and Earthquake Recurrence in Extensional Settings. Geophys. J. Int. 2012, 189, 143–160. [Google Scholar] [CrossRef]
  131. Styron, R. The Impact of Earthquake Cycle Variability on Neotectonic and Paleoseismic Slip Rate Estimates. Solid Earth 2019, 10, 15–25. [Google Scholar] [CrossRef]
  132. Petersen, M.D.; Dawson, T.E.; Chen, R.; Cao, T.; Wills, C.J.; Schwartz, D.P.; Frankel, A.D. Fault Displacement Hazard for Strike-Slip Faults. Bull. Seismol. Soc. Am. 2011, 101, 805–825. [Google Scholar] [CrossRef]
Figure 2. Geomorphological map along the Sava Fault between Golnik and Preddvor. Earthquake epicenters are from [48], shaded relief from lidar-derived DEM [38].
Remotesensing 16 01490 g002
Figure 3. Detail of the geomorphological map in the area of Povlje and Laško with topographic profiles A–D (red line indicates position of the fault); shaded relief from lidar-derived DEM [38].
Remotesensing 16 01490 g003
Figure 4. Landforms and their deposits in Povlje and Laško locations with traces of the Sava Fault indicated (red arrows). (A)—Aerial view on the transition from Ljubljana Basin to Kamnik—Savinja Alps with locations Povlje and Laško; view towards NNE. (B)—Aerial view on the Povlje alluvial fan and major slope breaks associated with the Sava Fault zone; view towards SE. (C)—Field photo of the slope break on the Povlje alluvial fan; view towards SE. (D)—Diamict, and (E)—Fine deposits, building the Povlje alluvial fan. (F)—Aerial view on the Laško terrace and major slope breaks associated with the Sava Fault zone; view towards E. (G)—Field photo of the slope breaks on the Laško terrace; view towards E. (H)—Diamicts building the Laško terrace above the Oligocene marlstones. (I)—Larger blocks of the diamicts in Laško laying at the surface. For locations of the photo B see Figure 2, the rest are noted on Figure 3.
Remotesensing 16 01490 g004
Figure 5. Displaced geomorphic markers at Povlje. Basemap is slope degree map derived from combined photogrammetric and lidar DEM.
Remotesensing 16 01490 g005
Figure 6. Displaced geomorphic markers at Laško. Basemap is slope degree map derived from photogrammetric DEM.
Remotesensing 16 01490 g006
Figure 7. Structural geological map along the Sava Fault between Zalog and Mače near Preddvor without the Quaternary cover. Faults (or segments thereof) referred to in the main text as well as in the supplement are labelled by Roman numerals (I–VII). Basemap is hillshade derived from the lidar DEM.
Remotesensing 16 01490 g007
Figure 8. ERT profiles across the Sava Fault at locations Povlje and Laško. See Figure 5 and Figure 6 for location of the profiles. Interpretation is based on resistivity characteristics and the results of tectonic geomorphological and structural geological field mapping. See Supplementary Materials (Figures S33 and S34) for an uninterpreted version with homogenous color scale for all profiles.
Remotesensing 16 01490 g008
Figure 9. GPR profiles across the Sava Fault at locations Povlje and Laško. The GPR lines match with the ERT lines—see Figure 5 and Figure 6 for location of the profiles. Interpretation is based on radargram characteristics and results of ERT survey, tectonic geomorphological and structural geological field mapping. This figure in higher resolution is available in Supplementary Materials (Figure S36).
Remotesensing 16 01490 g009
Figure 10. GPR profiles parallel to the Sava Fault at location Povlje. Interpretation is based on radargram characteristics, comparison with fault perpendicular GPR and ERT profiles, tectonic geomorphological, and structural field mapping. See the text for explanation of the measured displacements (blue, orange, and black arrows). This figure in higher resolution is available in Supplementary Materials (Figure S40).
Remotesensing 16 01490 g010
Figure 11. Sampling site on the Povlje fan. (A) Locations of radiocarbon samples UK19-5 and UK19-6 as well as luminescence sample UK19-7. (B) Close up of the sample locations, note the unsorted gravels in the clay matrix. (C) Trench wall behind K. Ustaszewski; note the large clasts.
Remotesensing 16 01490 g011
Figure 12. Sava Fault slip rate estimates from GNSS [40], short-term geomorphology and GPR (this study), long-term geomorphology [23], and long-term geology [21]. Note the logarithmic scale of the x-axis.
Remotesensing 16 01490 g012
Table 1. Results of the 14C dating of the Povlje fan. All samples were analyzed by the Curt-Engelhorn-Centre of Archaeometry and calibrated with IntCal20 [102].
Lab Code Sample ID 14C Age
[yr BP]
± δ13C AMS
[‰]
Calibrated 14C Age [cal yr BP] ± Carbon Content [%] Material
44643 UK19-5 2438 25 −23.6 25281710.7 Bulk sediment
44644 UK19-6 2136 24 −27.0 21491470.6 Bulk sediment
Table 2. Environmental dose rate for the OSL sample.
Lab CodeSample IDMaterialU [ppm]± [ppm]Th [ppm]± [ppm]K [%]± [%]Cosmic Dose Rate [Gy/ka]± [Gy/ka]Total Dose Rate [Gy/ka]± [Gy/ka]
4160UK19-7Fine-grained quartz3.010.1515.390.772.790.140.210.024.740.24
4160UK19-7Coarse-grained K-feldspar3.010.1515.390.772.790.140.210.024.860.36
Table 3. Results of the luminescence dating.
Lab CodeSample IDMean De [Gy]± [Gy]MAM De [Gy]± [Gy]Mean Age [ka]± [ka]MAM Age± [ka]Fading Corrected MAM Age [ka]± [ka]
4160UK19-71304 27.41.6
4160UK19-7307311242263.17.925.54.939.38.0
Disclaimer/Publisher’s Note: The statements, opinions and data contained in all publications are solely those of the individual author(s) and contributor(s) and not of MDPI and/or the editor(s). MDPI and/or the editor(s) disclaim responsibility for any injury to people or property resulting from any ideas, methods, instructions or products referred to in the content.

