2. Underfly Participants
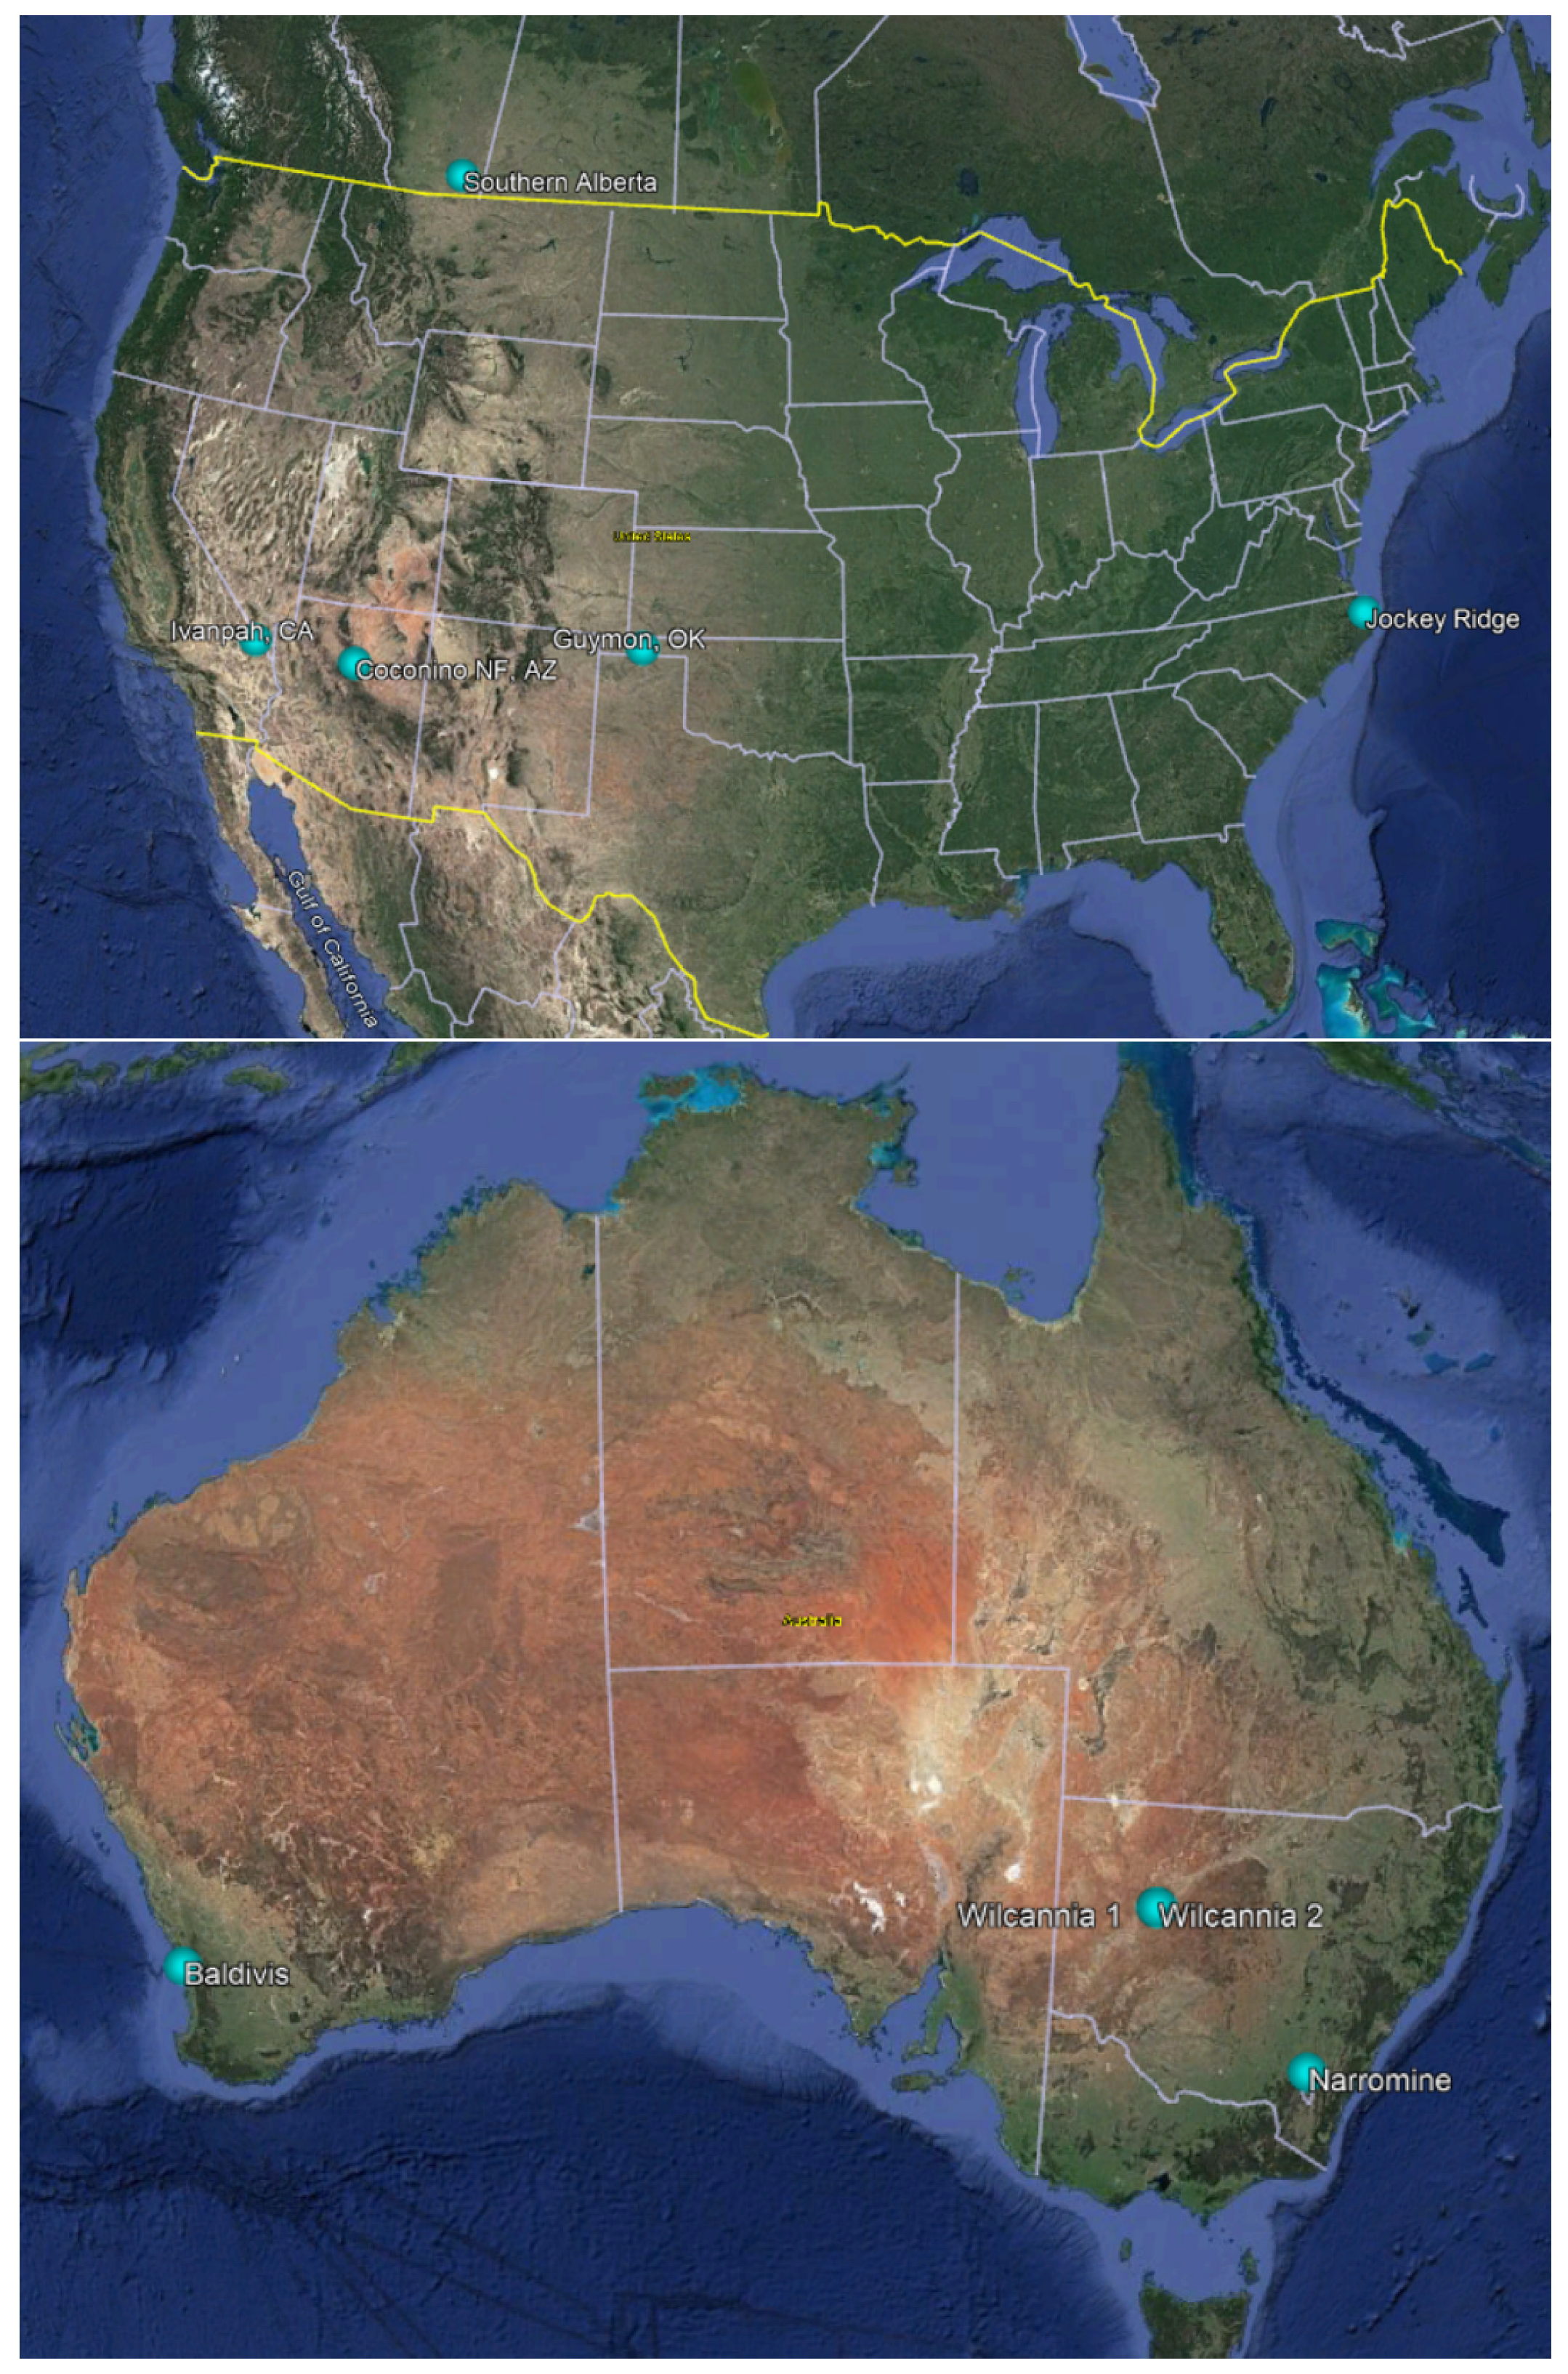
Months before launch, the approval for the underfly was confirmed, but the dates were uncertain as they were dictated by the launch date of Landsat 9. Surface validation field teams throughout the world began discussions on the collection opportunities made available by the underfly. Unfortunately, the uncertainty of the underfly paths and dates made it difficult for some teams to identify a field site for collection. In addition, the event was confirmed only a few months notice prior to the underfly which limited some agencies’ ability to obtain the instrumentation needed for the fieldwork. The global COVID-19 pandemic created additional complexity to travel, site access, and equipment access for many groups. Finally, weather conditions over the field sites were limiting factors for some groups. Five agencies and universities were able to participate in field measurements with little interference from clouds throughout the underfly period. These five groups included USGS ECCOE, University of Arizona, Rochester Institute of Technology (Rochester, NY, USA), Geoscience Australia, and University of Lethbridge (Lethbridge, AB, Canada). Field collection was performed at nine different field sites within the U.S., Canada, and Australia, shown in
Figure 1.
2.1. EROS Calibration and Validation Center of Excellence (ECCOE)
The ECCOE field team focused their potential field sites in the South and Southwestern areas of the United States. These areas were chosen to provide the highest likelihood of cloud-free field collection opportunities. Guymon, Oklahoma, USA, and Coconino National Forest, Arizona, USA, were the final sites chosen on the underfly paths for surface reflectance validation. The two field sites were approximately 1125 km (700 miles) apart and data were collected by the field team on 14 November and 15 November, respectively.
The Guymon field site was located on Oklahoma state-leased land, composed of thick grasses and cacti. The grasses were approximately 20 cm in height, shown in the middle photo of
Figure 2. The site measured 200 m by 200 m with increasing elevation on the north end of the site. The cloud cover increased significantly throughout the field collection period as cirrocumulus clouds developed, as seen in
Figure 2, impacting measurements.
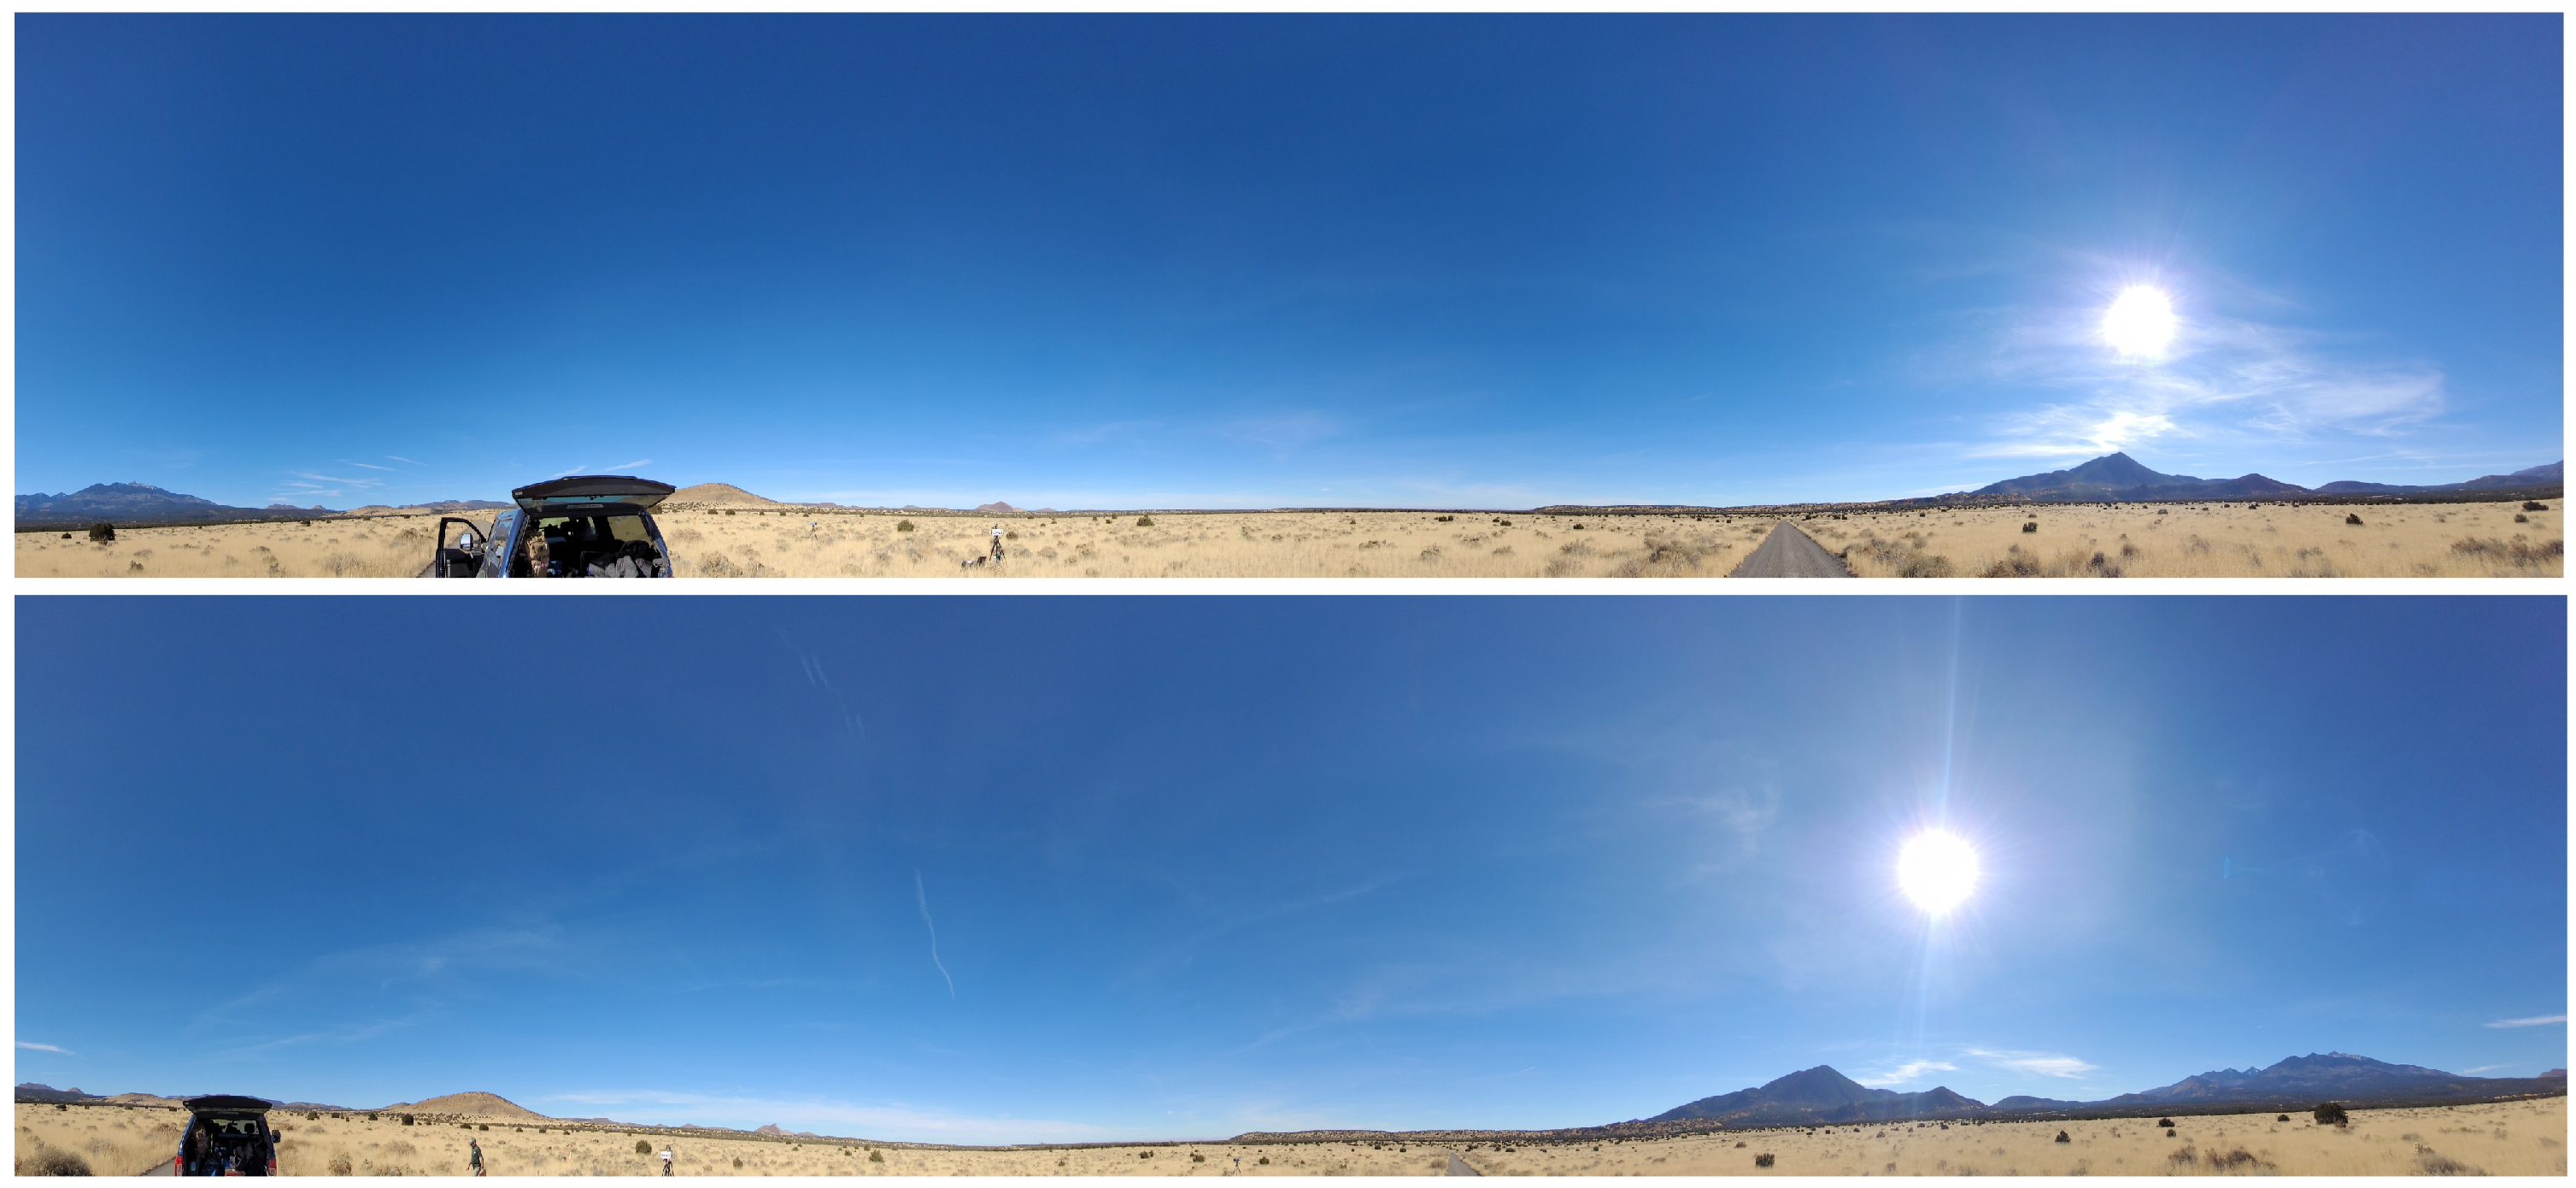
The Coconino National Forest field site was located approximately 29 km (18 miles) north of Flagstaff, AZ, composed of dry grass and cacti, visible in
Figure 3. The site measured 200 m by 200 m and remained at a consistent elevation. Thin cirrus clouds were present at the beginning of the field collection, spreading across the sky throughout the field collection period as can be seen in
Figure 3.
ECCOE utilized their recently developed dual spectroradiometer approach [
6] at both field sites. Their methodology included two ASD FieldSpec 4 spectroradiometers. The ASD FieldSpec 4 is a full spectrum spectroradiometer measuring 350–2500 nm. An 8° foreoptic was used on the ASD and 30 cm (12 inch) 99% reflectance white panels were used as a calibration source for surface reflectance measurements. The dual system methodology consisted of having one ASD taking reflectance panel measurements every 2–3 s throughout the entire field collection period. A second ASD was carried by a team member, taking measurements as the team member walked along each transect. More information about the dual-ASD system methodology used by ECCOE can be found in Shrestha et al. 2023 [
6].
2.2. Rochester Institute of Technology
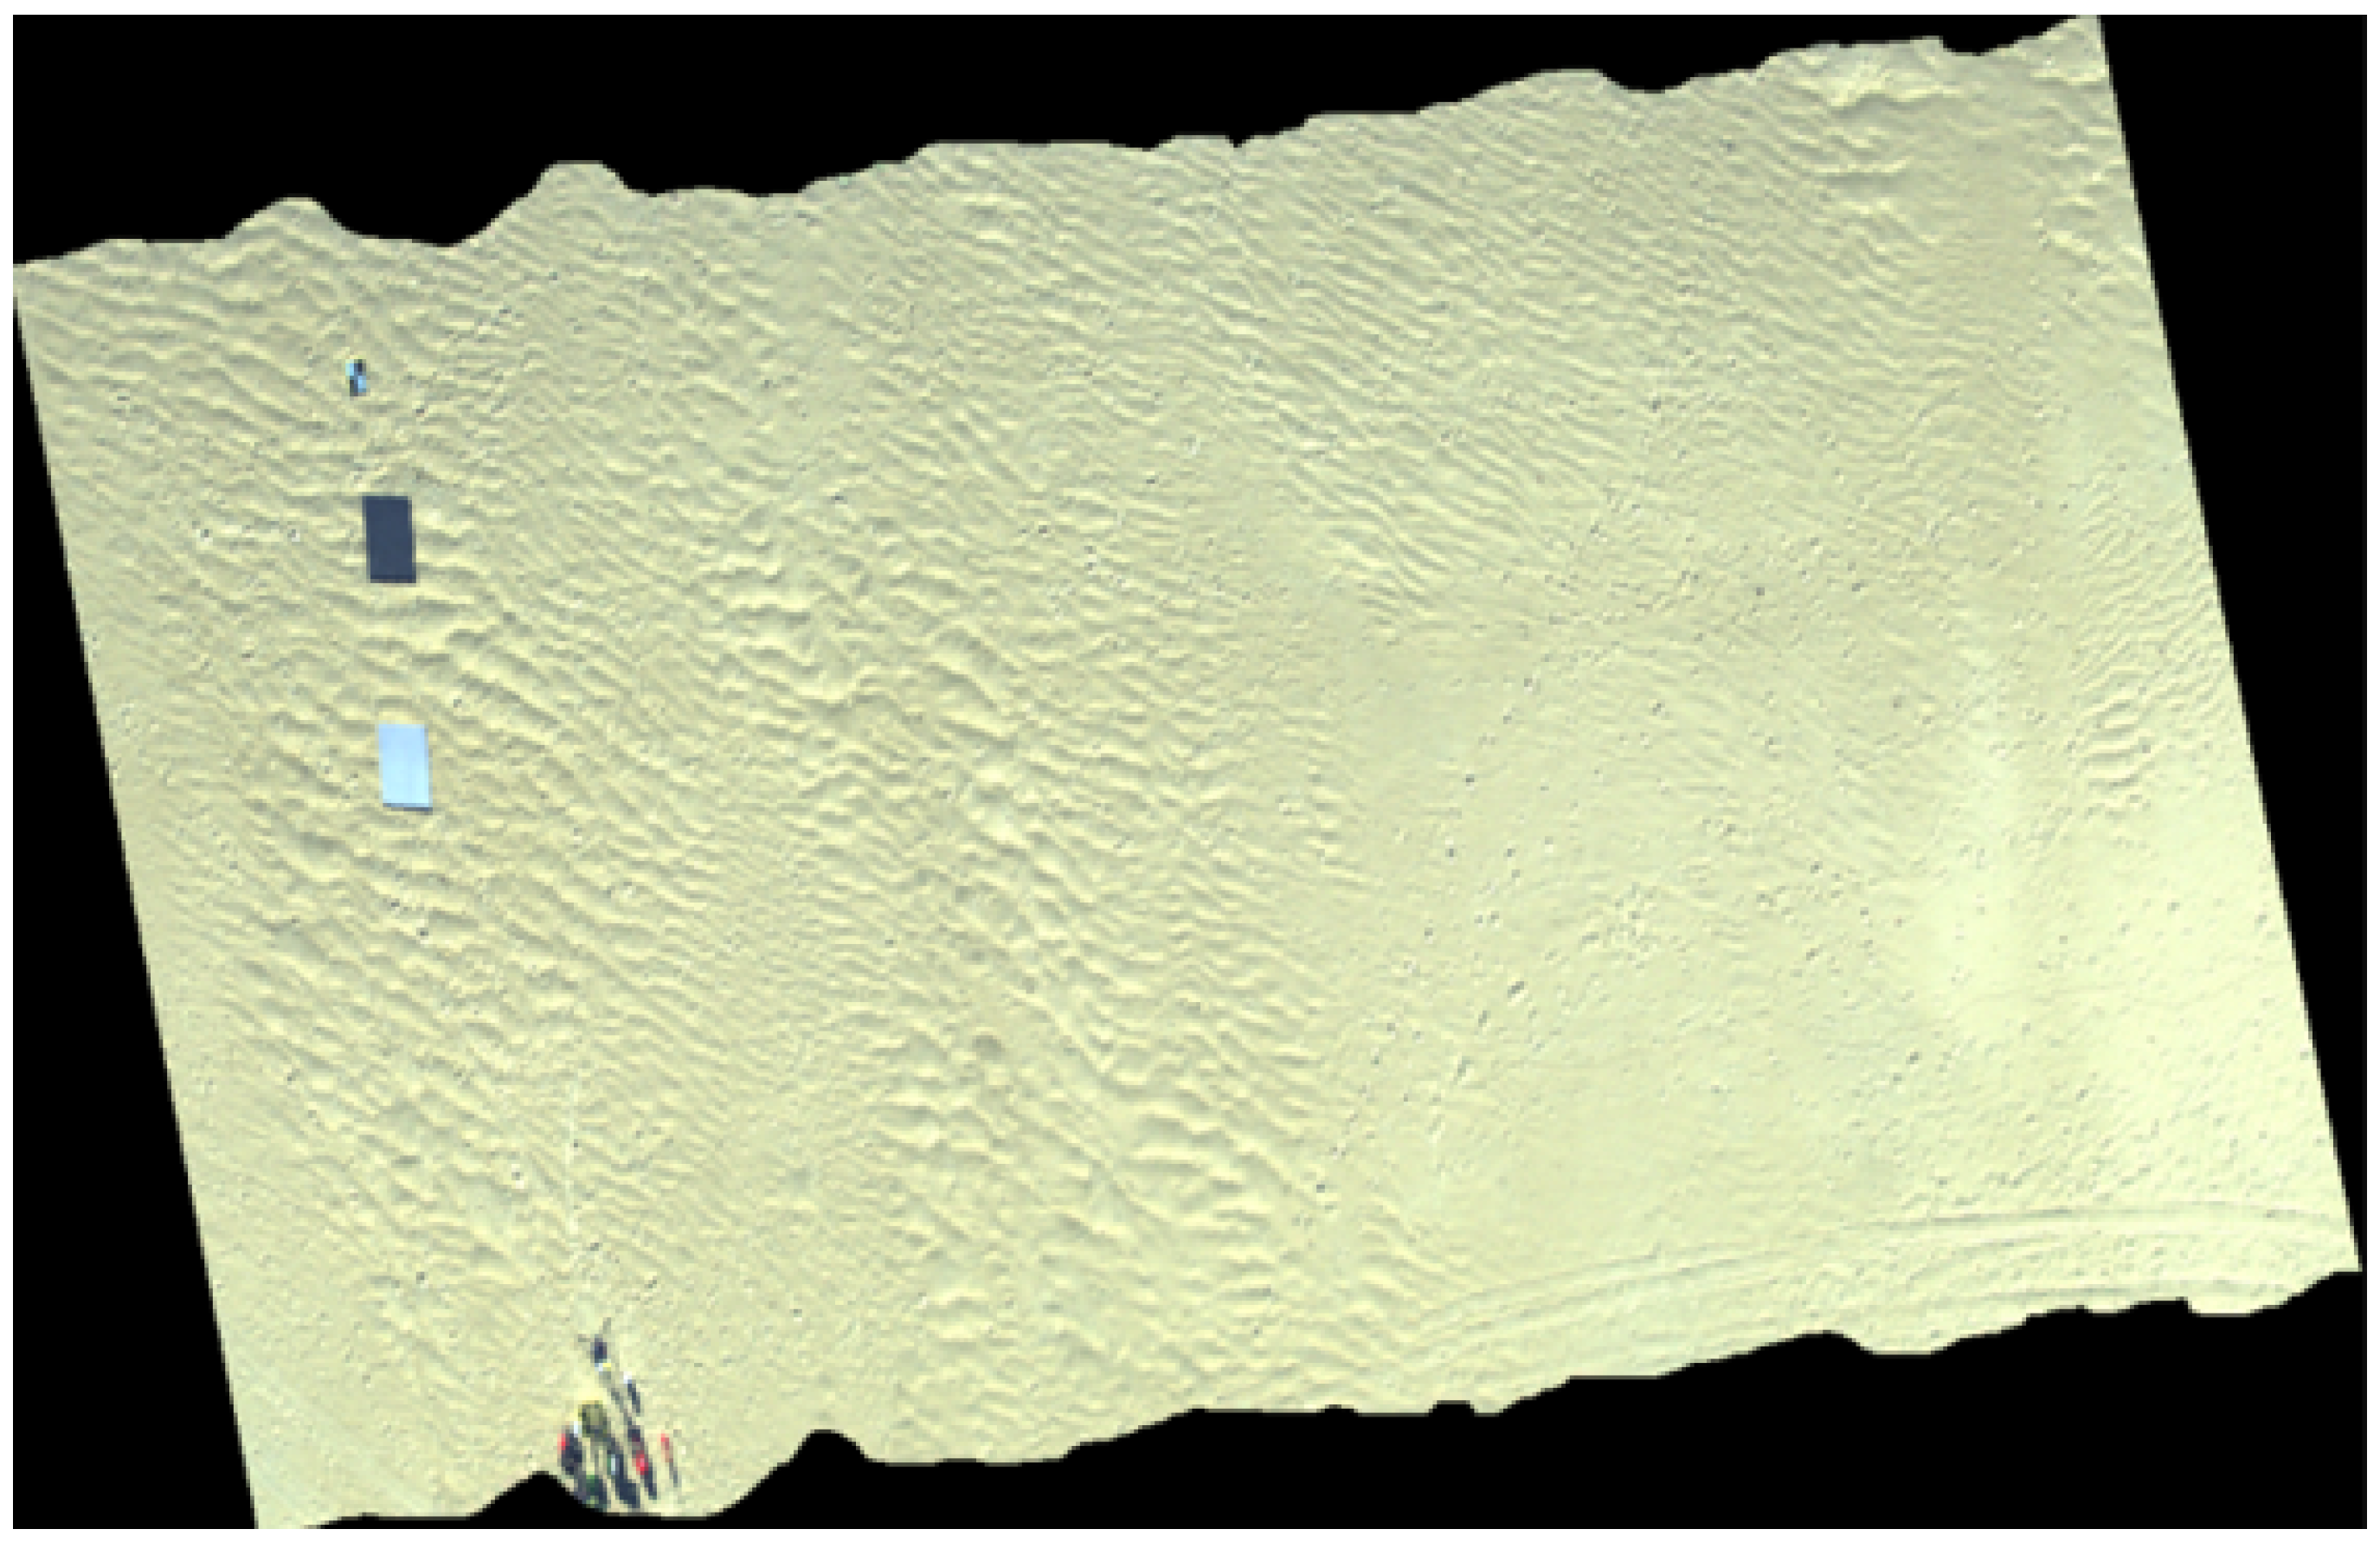
The RIT collected surface reflectance measurements at Jockey’s Ridge State Park, North Carolina, USA. Jockey’s Ridge is the location of the “tallest living sand dune on the Atlantic coast” [
7], providing a thermally stable, large, homogeneous area for observations, shown in
Figure 4. RIT completed collection of both surface reflectance and surface temperature; although, only surface reflectance is discussed in this paper. Additional information on their surface temperature validation work can be found in Eon et al. 2023 [
8].
RIT utilized a UAV-based instrumentation approach. Surface reflectance measurements were made by two Headwall sensors—the Headwall Nano and Headwall SWIR M384. Together, they cover 400–2500 nm in 2.2 nm and 10 nm increments, respectively [
9]. Image and GPS/IMU data were collected by the MX-1 payload which was used to georectify the data. A high spatial resolution RGB camera was flown on a DJI Mavic to produce a basemap of the field site.
2.3. University of Arizona
The UArizona field team travelled to the Ivanpah Playa on the California–Nevada border, USA, a CEOS LandNet site [
10,
11] shown in
Figure 5. The field site was a large, homogeneous dry lake-bed within the Mohave Desert. This site is well suited and frequently used for calibration across several remote sensing optical missions [
12,
13,
14]. Conditions remained cloud-free throughout the field collection period. UArizona used a single ASD FieldSpec 4, as discussed in
Section 2.1, throughout their field collection, including an 8° foreoptic, and a 30 cm (12 inch) 99% reflectance white panel was used as a reference.
2.4. Geoscience Australia
Geoscience Australia worked in collaboration with Environment NSW, University of Western Australia, Frontier SI, CSIRO Oceans and Atmosphere, Queensland Department of Environment and Science, and University of Queensland. The collaborative group, referred to here as Geoscience Australia, identified several sites throughout Australia during the entire underfly period to maximize the opportunities for successful collection. Four of the surface reflectance field collects from Geoscience Australia are discussed here—Baldivis, Wilcannia 1, Wilcannia 2, and Narromine. In addition to multiple contributors, Landsat data used within the Geoscience Australia analysis were BRDF corrected [
15,
16,
17].
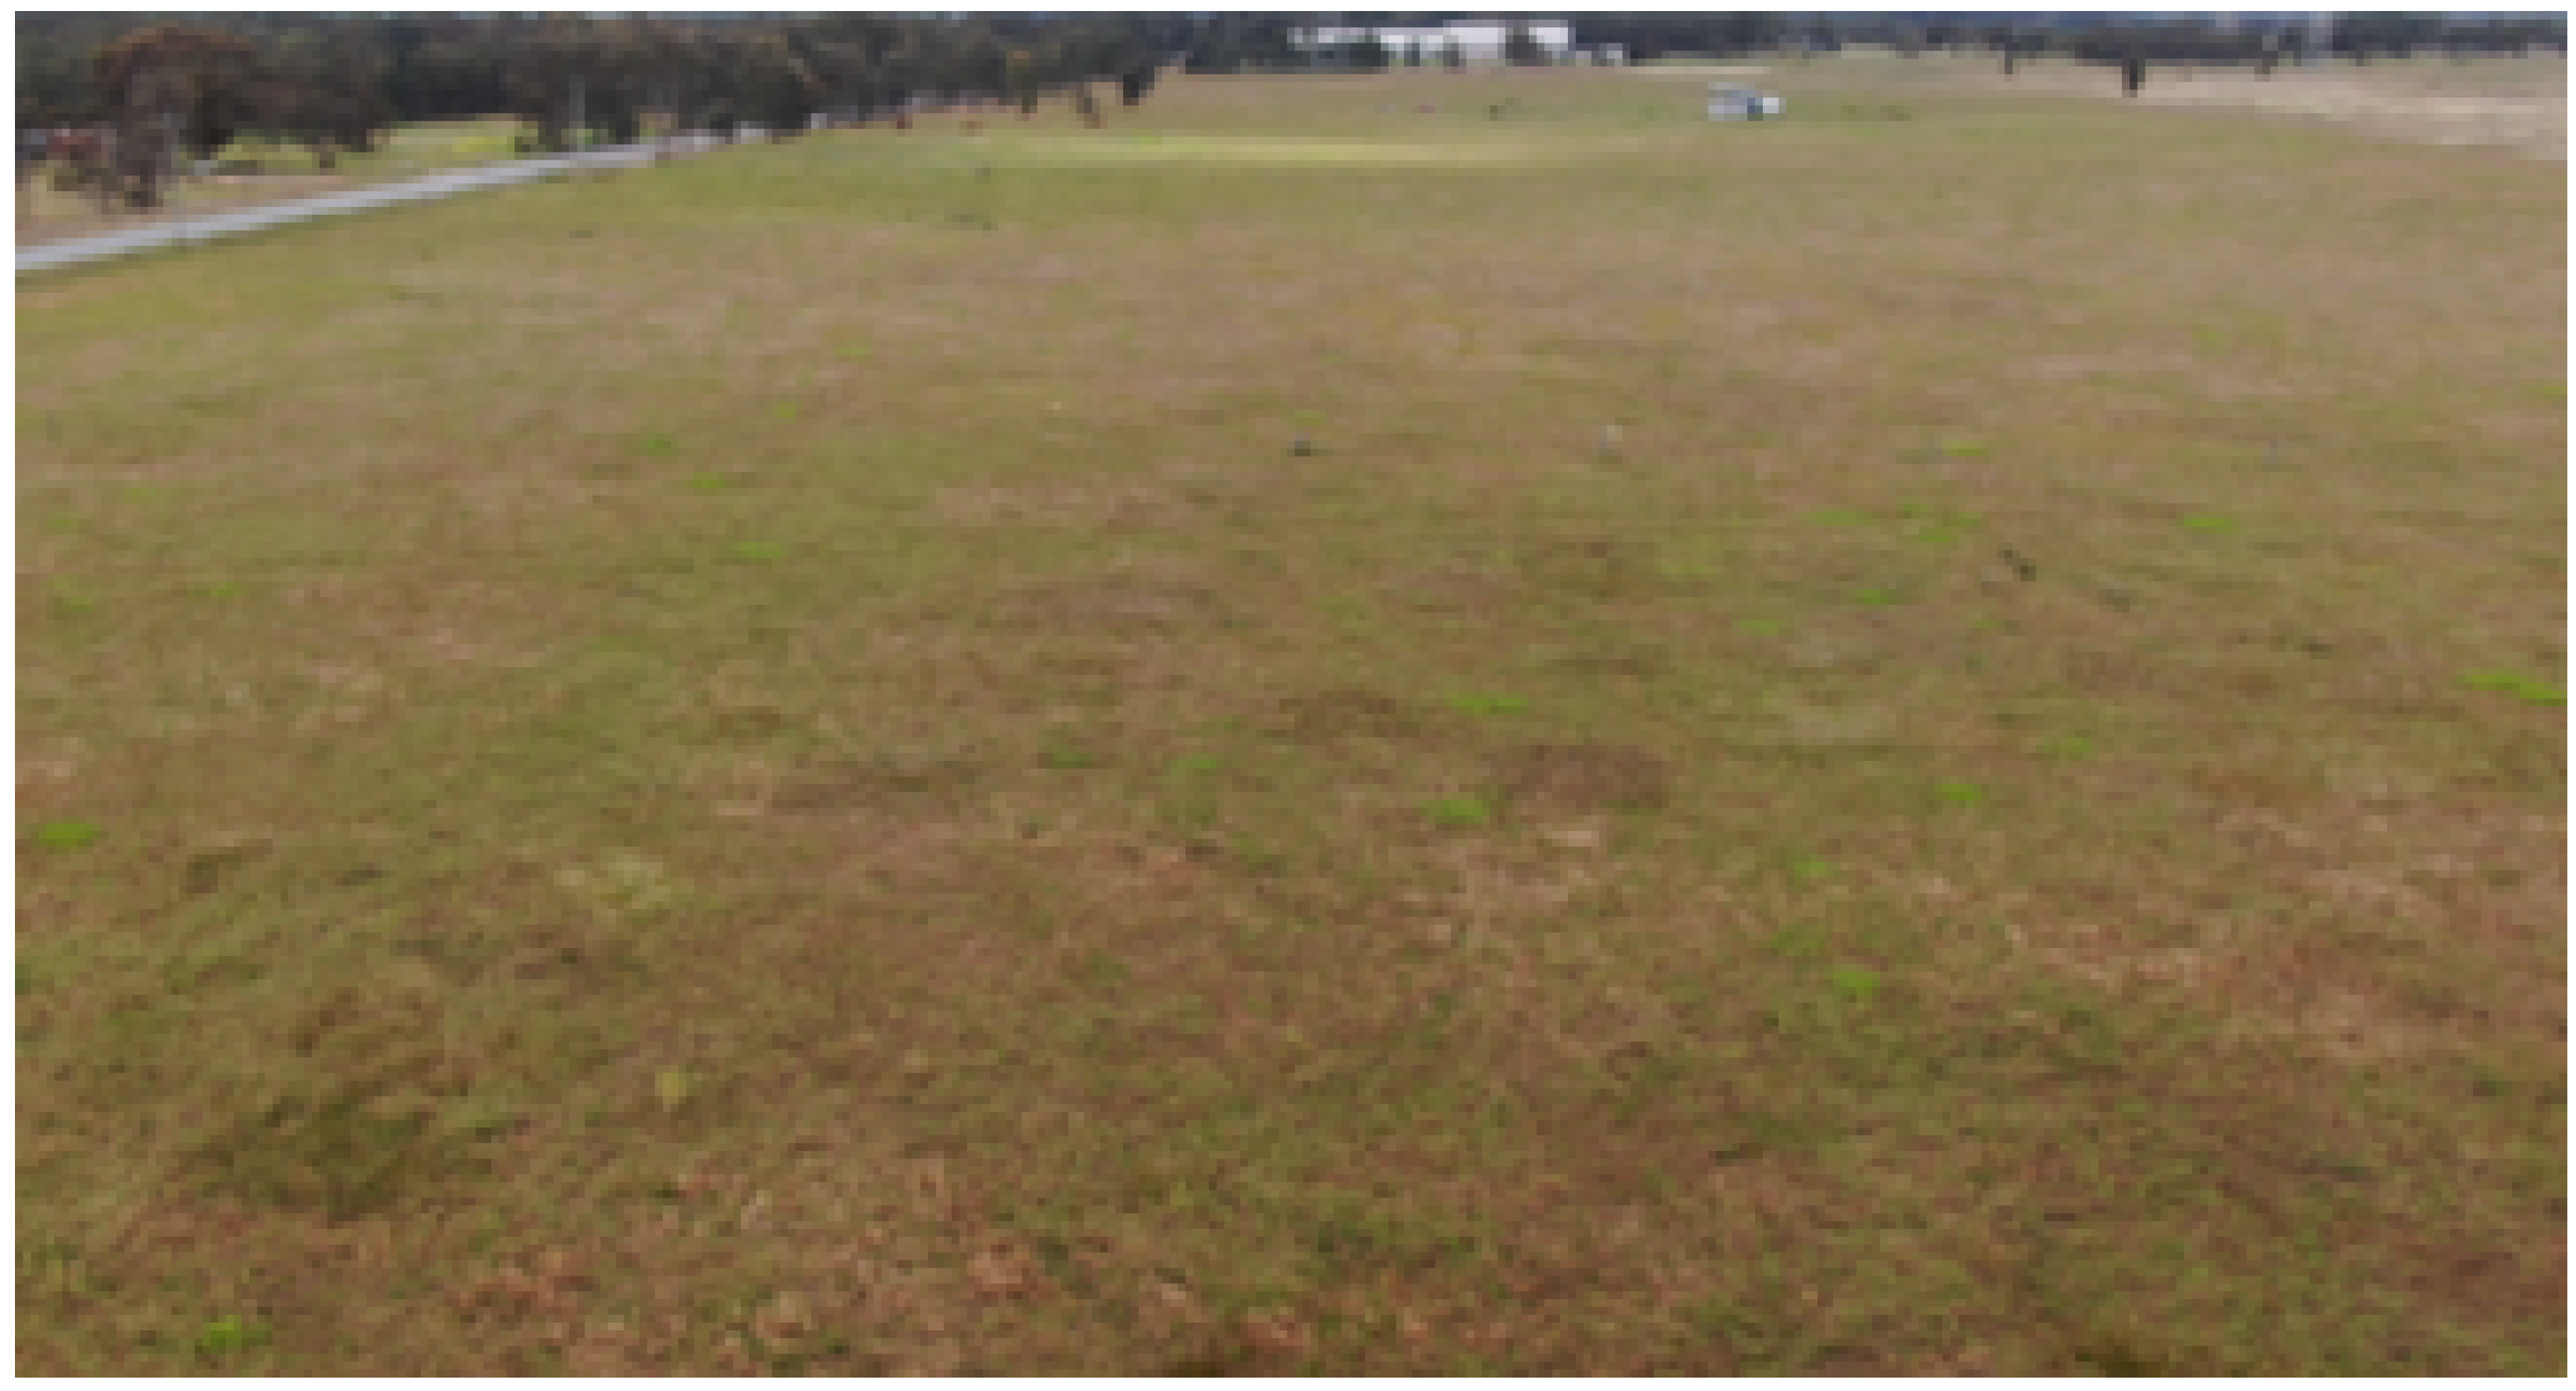
Baldivis, located in Western Australia, was a flat, grassy site in a rural area Northeast of the town of Baldivis, shown in
Figure 6. The field site was approximately 90 m by 90 m. Field collection was conduced on 13 November 2021 with ∼15% overlap between Landsat 8 and 9. A single ASD, as described in
Section 2.1, was used for field collection.
Field collection on 15 November 2021 was conducted over two field sites east of Wilcannia, New South Wales. The first field site, denoted here as Wilcannia 1 shown in
Figure 7, was composed of patchy vegetation and bare ground, measuring approximately 100 m by 100 m. Field measurements at Wilcannia 1 were focused on manual collection using an ASD. The second field site, denoted here as Wilcannia 2, was also composed of patchy vegetation and bare ground similar to what is shown in
Figure 8. Measurement methodologies were focused on both manual and UAV platforms. Manual collection, using a SR3500, was conducted over an area of approximately 100 m by 100 m. The SR3500 is a portable full range spectroradiometer manufactured by Spectral Evolution in Haverhill, MA that measures 350–2500 nm. For the UAV collection, the FLAME instrument, a miniature spectroradiometer measuring 190–1100 nm, was used over an area of 150 m by 125 m. A majority of the collection areas within Wilcannia 2 were overlapping. Although clouds were initially forecast for the Landsat overpass times, skies remained clear for field collection.
Lastly, Narromine, located in New South Wales, was a flat area with patchy vegetation near the end of a runway at the Narromine Airport. The collection area was approximately 115 m by 115 m, collected on 17 November 2021. Both an ASD and SR3500 were used for surface reflectance validation. Narromine is the only field site observed during the off nadir period of the underfly, 17 November, which was completed to increase the overlap between Landsat 8 and 9.
2.5. University of Lethbridge, Canada
The University of Lethbridge collected at one field site in Southern Alberta. The field site was 200 m by 200 m, composed of dry grazed native grassland, shown in
Figure 9. Sky conditions remained free of clouds over the field site throughout the approximately 45 min collection period. University of Lethbridge instrumentation included an ASD FieldSpec 3 High Resolution spectroradiometer, a full range spectroradiometer measuring 350–2500 nm, using an 8° foreoptic. A standard 30 cm (12 inch) square Spectralon panel was used as the white reference panel. White panel measurements were taken at the eastern edge of each transect walked.
2.6. Additional Interested Agencies
ECCOE validation field team members met with international agencies once the underfly was approved for planning. Many Landsat International Cooperators were interested in the field collection opportunity; however, most were unable to participate. Due to the short period of time for planning after the final underfly paths were announced and weather impacts during the underfly period, some field collection activities were unable to be completed. NRSC/ISRO had planned to collect at Shadnagar, Telengana, India, but were unable to complete the collection due to weather. Similarly, LAPAN had planned to collect at Punjullharjo-Rembang, Central Java, Indonesia, but weather conditions interfered with measurements. Several other Landsat International Cooperators expressed interest, including SANSA, KSAT, AGEOS, and AIR. In addition, DEMMIN also participated in underfly field collection discussions.
3. Results
Field collection surface reflectance results at nine field sites are compared to Landsat 8 and Landsat 9 derived surface reflectance values. Field collection data are spatially positioned using their GPS measurements, stacked by spectra, then averaged throughout the field site. The reflectance values are adjusted to the Landsat bands by using the L8 and L9 relative spectral responses. Next, the Landsat pixels that fell within each site’s region of interest were identified, and the pixel values were averaged together and compared to the averaged field collection reflectance data.
The Guymon field collection brings forward the impact of clouds within surface reflectance validation. In a traditional field collection setting, field teams typically do not go out to collect measurements if clouds are likely to form throughout the collection period. However, during an underfly, field teams have little choice to collect if clouds may be a possibility throughout the collection period. Throughout the field collection period, cirrocumulus clouds developed over the field site, as can be seen in
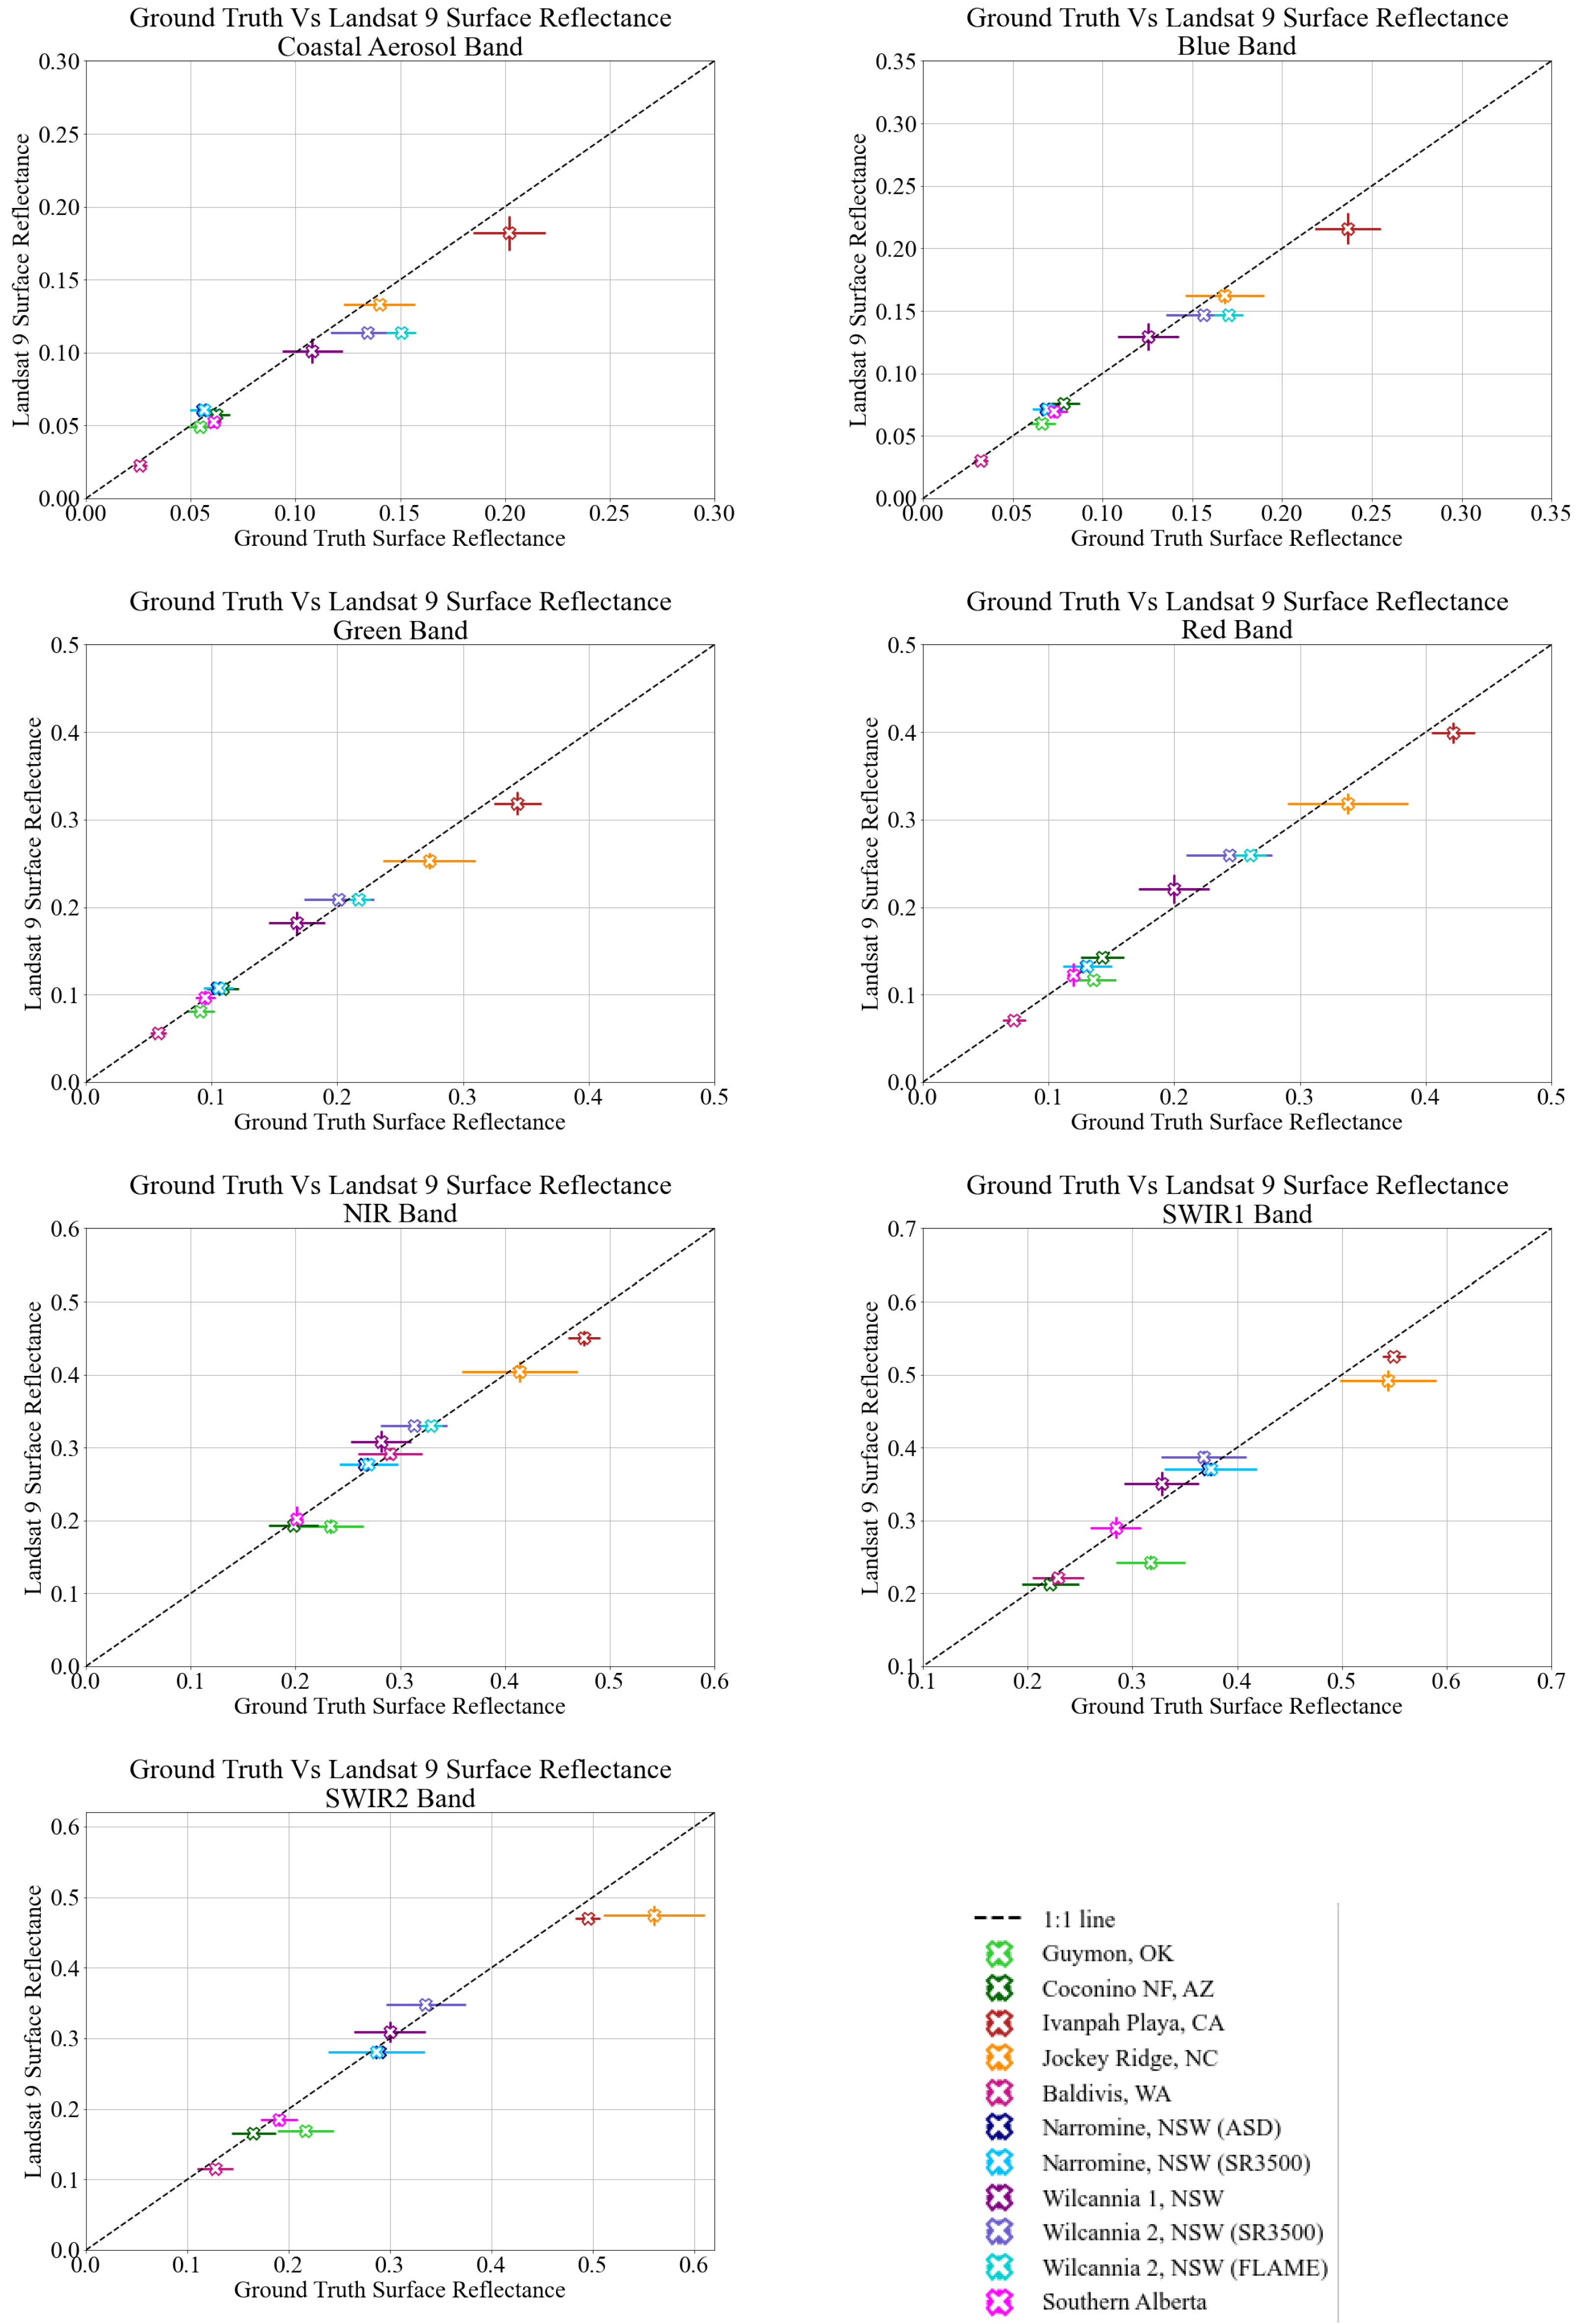
Figure 2. Given the short time frame in which the clouds developed, the clouds at the Landsat overpass times are not necessarily representative of the average cloud cover observed throughout the entire field collection period. While the clouds impact all bands, the SWIR1 band shows the least unity as the ratios of Landsat 8 to ground truth and Landsat 9 to ground truth were 0.768 and 0.764, respectively. The ratios of the SWIR1 band are some of the furthest from unity throughout all field collection observations during the underfly. As can be seen by the lime green markers in
Figure 10 and
Figure 11, the offset between the ground truth and each satellite become more defined throughout the longer wavelengths. The absolute difference of Landsat 8 and 9 to ground truth is 0.045 and 0.047 r.u., accordingly reflectance units. However, Landsat 8 and 9 were consistent in their observations as the absolute differences of the Landsat surface reflectance products ranged from 0.000 to 0.002 reflectance units, building confidence in the Landsat measurements.
Coconino National Forest field collection conditions included some light cirrus clouds that spread out throughout the collection period, as can be seen in
Figure 3. Ratios of Landsat 8 to ground truth range from 0.928 to 0.975. Shown by the forest green markers in
Figure 10 and
Figure 11, as well as the ratios being less than 1.0 in
Table 1, the results indicate Landsat 8 is underestimating the surface reflectance throughout the field site. Absolute differences of Landsat 8 and ground truth range from 0.003 to 0.011 reflectance units. Similarly, the ratio of Landsat 9 to ground truth that furthest from unity is 0.928 in the Coastal Aerosol band. However, it is important to note the ratio in the SWIR2 band is at unity. Absolute differences between Landsat 9 and ground truth were slightly lower than those with Landsat 8, ranging from 0.000 to 0.009 reflectance units. Again, the ratios seen indicate Landsat 9 is underestimating the surface reflectance in most bands. Lastly, the Landsat 8 and 9 absolute differences are within the expected range of the Landsat product, with differences ranging from 0.000 to 0.004 reflectance units.
Ivanpah Playa is the brightest target observed throughout the underfly field collections, shown in the red markers in
Figure 10 and
Figure 11. Similarly to Guymon and Coconino, the results indicate that Landsat 8 and 9 are underestimating the surface reflectance in all bands. Looking first at Landsat 8, the SWIR1 band is closest to unity with a ratio of 0.955, and the Coastal Aerosol is furthest from unity with a ratio of 0.911. Differences between the Landsat 8 surface reflectance product and the ground truth range from 0.017 to 0.028 reflectance units, with the SWIR1 band having an absolute difference of 0.011 as expected by the ratio. The ratios of Landsat 9 to ground truth are further from unity when compared to the Landsat 8 ratios, excluding the SWIR bands where the ratio of the SWIR1 band is also 0.955. As expected, differences between Landsat 9 and the ground truth are greater than those seen with Landsat 8 as absolute differences ranged from 0.020 to 0.026. With that said, the Landsat 8 and 9 surface reflectance values are comparable with absolute differences of 0.000 to 0.004 reflectance units.
Jockey’s Ridge is the other bright target observed throughout the underfly. As seen with Guymon, Coconino National Forest, and Ivanpah Playa, the ratios of both Landsat 8 and Landsat 9 to ground truth indicate that the Landsat surface reflectance product is underestimating the surface reflectance. Ratios of Landsat 8 to ground truth range from 0.841 to 0.981. The disagreement between Landsat 8 and the ground truth is most apparent in the SWIR bands with the ratio of SWIR1 being 0.908, and the ratio of SWIR2 being 0.841. The NIR band is closest to unity with a ratio of 0.981. Absolute differences between Landsat 8 and the ground truth are greater than typically expected, ranging from 0.006 to 0.089 reflectance units. As expected with the Landsat product, similar results are seen with Landsat 9. Ratios of Landsat 9 to ground truth range from 0.846 to 0.976, again with the SWIR2 band being furthest from unity and the NIR band closest to unity. Absolute differences between Landsat 9 and ground truth are also similar, varying from 0.006 to 0.086 reflectance units, greater than anticipated with the Landsat surface reflectance products. However, the absolute differences between Landsat 8 and 9 are only 0.000 to 0.003 reflectance units, falling within the expected range of the Landsat product.
The Baldivis field site, composed of patchy green and dry grass, differs from previous results with Landsat 8 as the ratios of Landsat 8 to ground truth are greater than 1 in all bands except for the SWIR2 band, indicating Landsat 8 is overestimating the surface reflectance at the site. Of note is the ratio of the Coastal Aerosol band, 1.221, with the greatest overestimation of Landsat 8 surface reflectance to ground truth throughout all field sites in the underfly. Absolute differences between Landsat 8 and the ground truth range from 0.006 to 0.018 reflectance units. The ratio of Landsat 9 to the ground truth indicates the Landsat product is underestimating the surface reflectance as is seen with other sites in nearly all bands. Again, shown in
Table 1, the Coastal Aerosol band has the Landsat 9 to ground truth ratio furthest from unity at 0.867. Absolute differences between Landsat 9 and ground truth range from 0.001 to 0.012. The absolute differences between Landsat 8 and 9 are greater than previous sites as the differences were 0.007 to 0.010.
Handheld spectrometers are very commonly used in manual field collection, with the ASD FieldSpec most frequently used. Data collected by Geoscience Australia during the underfly not only allow an assessment of Landsat data, they allow for a brief look at the similarities and differences of the two handheld spectrometers used—ASD and SR3500. Although, it is important to note that there are not sufficient data within this exercise to conclude the general results observed with each instrument. Given the proximity of Wilcannia 1 and 2, ∼2.8 km, the land cover and atmospheric composition differences are reduced, allowing insight into the two instruments. The ASD and SR3500 results both show an underestimation of Landsat 8 surface reflectance in the Coastal Aerosol and Blue bands, and an overestimation of surface reflectance in the Green through SWIR1 bands. The absolute differences between Landsat 8 and the ASD at Wilcannia 1 range from 0.000 to 0.015 reflectance units, while the differences between Landsat 8 and the SR3500 at Wilcannia 2 range from 0.007 to 0.022 reflectance units. The FLAME instrument onboard a UAV is also used at Wilcannia 2. The ratio of Landsat 8 to the FLAME ground truth is further from unity than expected with a ratio of 0.747 and an absolute difference of 0.038 reflectance units. However, the ground truth in the NIR band is nearly at unity with a ratio of 0.999 and an absolute difference of 0.000 reflectance units. Wilcannia 1 Landsat 9 results largely show an overestimation of Landsat 9 surface reflectance in all bands except the Coastal Aerosol band. The greatest absolute difference between Landsat 9 and ground truth is 0.027 reflectance units in the NIR band, while the lowest absolute difference of 0.004 reflectance units in the Blue band. A similar story is seen again with the SR3500 at Wilcannia 2—ratios show an underestimation of the Landsat 9 surface reflectance product in the Coastal Aerosol and Blue bands, and an overestimation in surface reflectance in all other bands. The Landsat 9 to ground truth ratio furthest from unity is the Coastal Aerosol band, where an absolute difference of 0.022 reflectance units is present. The FLAME results for Landsat 9 are very similar to Landsat 8, where again the NIR band is nearly at unity with a ratio of 1.001. The differences between Landsat 8 and 9 at each location vary more than anticipated given their proximity to one another and similar land cover type. Absolute differences of Landsat 8 and 9 at Wilcannia 1 are 0.006 to 0.012, whereas the differences at Wilcannia 2 only range from 0.000 to 0.003 reflectance units.
Narromine also includes data from two instrument sources—an ASD and SR3500. The ratios of Landsat 8 to the ground truth once again are consistently below 1, where the Landsat surface reflectance product is underestimating the surface reflectance of the field site. Ratios of the ASD range from 0.813 to 0.963, with the Coastal Aerosol band being furthest from unity. Similarly, the Coastal Aerosol band is one of the bands furthest from unity when looking at the SR3500, with a ratio of 0.847. Absolute differences between Landsat 8 and the ASD ground truth range from 0.010 to 0.027 reflectance units. The ranges of absolute difference between Landsat 8 and the SR3500 ground truth are similar, but slightly greater, going from 0.011 to 0.030 reflectance units. Landsat 9 results show that, for the Coastal Aerosol through NIR bands, the Landsat surface reflectance product is overestimating the surface reflectance of the field site. Ratios of Landsat 9 to ASD ground truth range from 0.968 in the SWIR2 band, to 1.088 in the Coastal Aerosol band. Ratios of Landsat 9 to SR3500 ground truth range from 0.979 to 1.070 reflectance units. The absolute differences between Landsat 9 and the ASD ground truth range from 0.002 to 0.009 reflectance units, and the difference between Landsat 9 and the SR3500 ground truth range from 0.002 to 0.008 reflectance units. Lastly, the absolute difference between Landsat 8 and 9 is greater than expected from the product. Differences range from 0.013 in the Blue and Green bands to 0.025 in the SWIR1 band.
As can be seen in
Table 1, ground truth results are greater than the Landsat derived surface reflectance in the Coastal Aerosol, Blue, and SWIR2 bands, similar to the ASD and SR3500 results at Wilcannia 1 and 2. The ratio of Landsat 8 to ground truth ranges from 0.858 in the Coastal Aerosol band to 1.041 in the Red band, and the absolute differences range from 0.001 to 0.009 reflectance units. Landsat 9 provides similar results with the ratio of Landsat 9 to ground truth ranging from 0.855 in the Coastal Aerosol band to 1.027 in the Red band. Absolute differences between Landsat 9 and ground truth have a larger, but still acceptable, range of 0.001 to 0.009 reflectance units. Finally, as is seen with previous field sites, the differences between Landsat 8 and 9 range from 0.000 to 0.004, as expected.
4. Conclusions
The Landsat 8 and 9 underfly provided a once in a mission lifetime opportunity for surface reflectance validation, utilizing near-simultaneous satellite acquisitions. To the best of the authors’ knowledge, a large scale manual validation effort has not been conducted with previous underfly opportunities, making it a rare and important campaign to understand Landsat 8 and 9 surface reflectance data quality. Five agencies completed field collection throughout the underfly period—ECCOE, RIT, UArizona, Geoscience Australia (composed of seven agencies and universities), and University of Lethbridge. Many challenges were encountered throughout the preparation period of the underfly as interest in field collection grew. While there were several agencies interested in collecting data, the uncertainty of the paths and limited time between the launch of Landsat 9 (and therefore the path identification) and the underfly period was limiting. In addition, agencies that were new to field collection did not have enough time to acquire the needed instrumentation for field collection. Lastly, weather impacted agencies prepared for field collection—NRSC/ISRO and LAPAN.
Field collection was conducted over nine different field sites throughout North America and Australia, providing measurements for a variety of land cover including dry grass, patchy green and dry grass, patchy green vegetation and bare Earth, desert, and loose sand. Both manual and airborne instrumentation were used throughout the field collection sites. ASDs were used at Guymon, Coconino National Forest, Ivanpah Playa, Baldivis, Wilcannia 1, Narromine, and Southern Alberta. A SR3500 was used at Wilcannia 2 and Narromine. Finally, UAV platforms were used at Jockey Ridge and Wilcannia 2, with Jockey Ridge measuring with a Headwall Nano and SWIR M384 and Wilcannia 2 measuring with a FLAME spectrometer.
The Landsat 8 Coastal Aerosol and Blue bands showed an underestimation of Landsat surface reflectance; Baldivis was the only outlier. In addition, the Landsat 8 SWIR2 band underestimated the Landsat surface reflectance at all locations and instrumentation excluding Wilcannia 2 SR3500. Similar results were seen within the Landsat 9 results where the Coastal Aerosol, Blue, and SWIR2 surface reflectance was underestimated at a majority of sites. The ratio of Landsat 9 to the Coconino National Forest ground truth in SWIR2 was the only field observation that reached unity with a Landsat satellite. Results from the Wilcannia 2 airborne observations using FLAME were nearly at unity with the ratio of Landsat 8 to ground truth at 0.0009, and the ratio of Landsat 9 to ground truth at 1.001.
Throughout standard field collection operations, collecting in the presence of clouds is not typically conducted. However, the underfly opportunity was extremely rare, therefore pushing the field team at Guymon to collect despite cirrocumulus cloud development throughout the collection period. As anticipated, the results were not very close to unity, particularly in the SWIR bands. With that said, it is important to note that one factor from that day was the rapid development of the cirrocumulus clouds. Given field collection could take 40–60 min depending on the field site, the cloud cover at the time of the Landsat overpasses may not have been indicative of the average cloud cover observed throughout the entire field collection period.
While the number of acquisitions was limited during the underfly, the field collection efforts made throughout North America and Australia provided irreplaceable data for such a unique opportunity. Surface reflectance validation has been an area of consistent growth throughout the past decade as more field teams have begun manually taking measurements. The ability to manually take measurements was a critical factor in successful field collection throughout the underfly as the number of paths acquired were limited and could not be guaranteed to acquire data over automated instrumentation sites. Through the underfly process, the importance of planning and communication was a necessity. Organizing field collection locations was challenging in the months leading up to the Landsat 9 launch as the paths of the underfly were dictated by the Landsat 9 launch date, as well as ensuring all field teams were able to travel to their field collection sites. Given the number of variables that impacted each team’s ability to collect field data, the collaborative effort of collecting surface reflectance validation was a success and provides insight into future underfly opportunities with Landsat launches moving forward.

 ,
, 


