
Evolution and Built-Up Age Dependency of Urban Thermal Environment
by
Yuanyuan Li
1,2,
Shuguang Liu
1,2,*,
Maochou Liu
1,2,
Rui Guo
1,2,
Yi Shi
1,2,
Xi Peng
1,2 and
Shuailong Feng
1,2 1
National Engineering Laboratory for Applied Technology of Forestry & Ecology in South China, Central South University of Forestry and Technology (CSUFT), Changsha 410004, China
2
College of Life Science and Technology, Central South University of Forestry and Technology, Changsha 410004, China
*
Author to whom correspondence should be addressed.
Remote Sens. 2024, 16(9), 1495; https://doi.org/10.3390/rs16091495
Submission received: 2 January 2024
/
Revised: 18 April 2024
/
Accepted: 22 April 2024
/
Published: 24 April 2024
Abstract
:The urban heat island (UHI) represents an anthropogenic modification to the earth’s surface, and its relationship with urban development, built-up age dependency in particular, is poorly understood. We integrated global artificial impervious areas to analyze the impacts of built-up age and urban development intensity (UDI) on land surface temperatures (LSTs) in Hefei, the capital of Anhui Province of China, from 2000 to 2019. A key finding was that the built-up areas with different built-up ages were strongly associated with LST, and this relationship does not change significantly over time, suggesting temporal stability of spatial patterns of LSTs. This finding puts forward a challenge to the application of the classic concept of space-for-time in LST studies because the premise of space-for-time is that spatial and temporal variation are equivalent. This result reveals the vital importance of annual development activities on the urban thermal environment. Another highlighted result was LST sensitivity to UDI, an effective measure of the impact of urbanization on LST, which increased significantly from 0.255 °C per 10% UDI to 0.818 °C per 10% UDI. The more than doubling of LST sensitivity to UDI should be a major concern for city administration. These findings have crucial theoretical and practical significance for the regulation of LSTs and UHI.
1. Introduction
The urban heat island (UHI) is a common phenomenon in which land surface temperatures (LSTs) are higher than in surrounding rural areas [1,2]. UHI can not only alter urban environment conditions such as climate [3,4], air quality [5], water environment [6], and biodiversity [7], but also adversely affect human health and comfort [8,9]. The key factors affecting UHI are urban population [10,11,12], impervious surface [13,14], and other factors brought about by urban development [15,16,17]. The UHI effect has been a major research focus of urban ecology [15,16,17], with many studies analyzing the spatial-temporal heterogeneity of UHI [18,19,20] and influencing factors such as architectural characteristics [21,22], human activities [23,24], seasonal variability [25,26], and green landscape features [27,28,29,30]. Several studies have also focused on the impact of urban form [31] and land use patterns in built-up areas [32,33,34] on UHI. However, few studies have examined the continuous temporal evolution of UHI patterns among different built-up areas and sensitivity over the course of urban development. A city is not built at once but typically expands over a time period that can span decades or even longer [35]. It is expected that the UHI and its controlling factors would change as cities evolve [36,37], and a thorough understanding of the temporal evolution of UHI can provide valuable information to support future urban thermal environment mitigation and human adaptive strategies.
The impacts of urban evolution on UHI remain elusive [38,39,40]. Previous studies have rarely examined the relationship between UHI and built-up age directly, but rather have investigated the UHI differences of the new and old urban areas to infer the impacts of urban evolution via space-for-time substitution [41,42]. Some studies have shown significantly higher UHI in new urban areas compared to old urban areas [31,43], which has been explained by the greater presence of many large industrial agglomerations (major anthropogenic heat sources) in new urban areas [44,45,46]. On the other hand, some other studies have shown the opposite, with higher UHI intensity in old urban areas [41,47], since old urban areas, being the center of commercial and human activities [48,49], have a higher density of impervious surfaces and lower vegetation coverage [35,50,51]. Apparently, one major weakness of these studies is the vague and nonstandard use of new vs. old urban areas, which can greatly affect the results [31,52]. As a result, there is a need to use a physically based metric such as built-up age to measure urban evolution and then to investigate the impacts of urban development on temporal changes of UHI directly using time series analysis rather than using space-for-time substitution, the validity of which has not been examined for UHI.
Urban development intensity (UDI) is the proportion of impervious surface per unit pixel, ranging from 0% to 100%. The relationship between UDI and UHI, which is a strong indicator of the impact of UDI on UHI and therefore important to UHI management, has been investigated extensively in and across different cities [13,15,53]. Current studies have shown that the impact of UDI on UHI is regulated by a variety of factors, including surface albedo [54,55] and climate and vegetation conditions [17,56]. It is therefore expected that the impact of UDI on UHI would change over time as cities evolve since these regulating factors would change along with urbanization [57,58]. However, a relatively limited number of studies have focused on spatial trends [56,59], a systematic evaluation of the temporal change of the effect of UDI on UHI is still lacking, and whether the UHI-UDI relationship would evolve over time as urbanization intensifies still needs further exploration [60,61].
To address the temporal changes of the UHI-UDI relationship, we used Hefei as a case to investigate the evolution of the relationship between built-up age, UDI, and UHI from 2000 to 2019. Hefei, one of the typical fast-growing cities in China and the capital city of Anhui province, has experienced rapid urban growth in recent decades [62,63]. It is one of the star cities in central China and known as one of China’s ten representative cities suffering from a pronounced summertime UHI effect (China Meteorological Administration (CMA) (https://www.cma.gov.cn/en/) (accessed on 15 February 2024). Therefore, it is an ideal place to conduct such a study. The overarching goal of this study was to understand the spatial patterns and temporal evolution of UHI characteristics as cities expand. Specifically, the objectives of this study were to: (1) explore the impact of built-up age on UHI and the evolution of UHI among various aged built-ups over time; (2) investigate the temporal change of UDI impact on LST. Our research hypotheses were: (1) UHI is independent of built-up age, and therefore no temporal change could be detected on UHI as built-ups get older; (2) the impact of UDI on UHI does not change over time; (3) LST, along a chronosequence of built-up age cohorts, does not show a clear tendency toward change. In addition, we also explored whether there is temporal stability in the LST patterns along the chronosequence (i.e., high or low LST would be signatures of some fixed built-ups) across years. Even without a clear tendency toward change in LST along the chronosequence, a temporal stability of LST patterns would suggest strong location-based physical controls of LST that might not change over time.
2. Materials and Methods
2.1. Study Area
Hefei is the capital of Anhui Province and the sub-center of the Yangtze River Delta Urban Agglomerations. It is located in the east of China, between 30°57′–32°32′N and 116°41′–117°58′E (Figure 1), with a total area of 11,445.1 km2. Hefei has a typical subtropical monsoon climate, with an average annual temperature of 15.7 °C, average annual precipitation of about 1000 mm, and average relative humidity of 77%. Hefei is a typical fast-growing city in China with impressive economic growth and rapid urban expansion, and the urbanization rate (ratio of urban population to total population) increased from 32.64% in 2000 to 74.97% in 2018 (Hefei Statistical Bureau, 2019). Hefei topped the list of extreme hot days during 2000–2019 among provincial capitals with 210 days of high temperature (>35 °C) and humidity (>50%) according to an inventory conducted by Weather China (China weather news, http://www.weather.com.cn/) (accessed on 25 March 2020). This suggests that Hefei is an ideal place to conduct UHI research.
2.2. Data
Major data layers used in this study are shown in Table 1. Aqua MODIS 8-day composite products (version 5) of land surface temperature (LST) from 2000–2019 with a spatial resolution of 1 km were collected from United States Geological Survey (USGS: https://lpdaacsvc.cr.usgs.gov/appeears/) (accessed on 15 March 2020). Global Artificial Impervious Area data [64] with a spatial resolution of 30m (http://data.ess.tsinghua.edu.cn/) (accessed on 15 March 2020) were used to calculate built-up age, urban expansion rate, and urban development intensity. A land use and land cover map from Tsinghua (http://data.ess.tsinghua.edu.cn/) (accessed on 15 March 2020) was used to define the main urban area and calculate landscape indices. Night light data DMSP/OLS (https://www.ngdc.noaa.gov/eog/dmsp/) (accessed on 10 May 2020) and VIIRS (https://www.ngdc.noaa.gov/eog/viirs/) (accessed on 10 May 2020) and albedo (https://eos.com/find-satellite/modis-mcd43a4/) (accessed on 1 June 2020) were used to perform attribution analysis on the relationship between LST and built-up age. Landsat Thematic Mapper (TM) and Enhanced Thematic Mapper Plus (ETM+) images were downloaded from USGS (https://earthexplorer.usgs.gov/) (accessed on 15 March 2020) to calculate NDVI and landscape metrics. All data were acquired around 2018 to match the newly updated maps of GAIA in 2018 and minimize the temporal mismatch.
2.3. Land Surface Temperature (LST), Urban Expansion Rate, and Urban Development Intensity
We analyzed the spatial and temporal changes of annual maximum LST from 2000 to 2019. To derive the annual maximum LST maps, 160 daytime MODIS MOD11A2 images from June to August were superimposed and maximum values were calculated for each pixel using the Maximum Value Composite (MVC) approach [65] by Python 3.8.5. This approach effectively eliminates the effect of cloud cover and surface dynamics on image quality [66,67,68] and also can effectively capture extreme high-temperature features.
The annual urban expansion rate (AER) and urban development intensity (UDI) were respectively calculated using the annual maps of the global artificial impervious area (GAIA). UDI is defined as the proportion of built-up area within a 1 km × 1 km grid and was calculated using Fragstats 4.2 [5,56]. The annual urban expansion rate, represented by the expansion of impervious surface, was calculated as follows [69]:
where Ustart is the urban area at the initial time, Uend is the urban area at the end time, and d is the time span of the period in years.
2.4. Built-Up Age and Its Relationship with LST
The built-up age of a pixel is defined as the length of time (in years) since a pixel was converted from natural to impervious surface. The annual built-up age maps were calculated from the maps of GAIA [64,70]. The age values in the maps ranged from 0 to 34 years, with 0 being natural pixels and values from 1 to 34 indicating natural surfaces that were converted into built-up in years from 2018 to 1985, respectively. For convenience and subsequent built-up age chronosequence analysis, we used the concept of built-up cohorts and defined a built-up age cohort as the assembly of all pixels converted to a built-up in a given year. Effectively, a total of 34 built-up cohorts were identified using the time series data available in this study. Thiessen polygons derived from built-up age cohorts, effective in indicating the agglomeration and dispersion of spatial points [71], were used to analyze the spatial characteristics of some built-up age cohorts with obvious features.
To test the first research hypothesis (i.e., UHI is independent of built-up age), the following procedures were performed. First, the interannual variability and change in the observed LST in the urban areas that were not related to urbanization were removed. This was accomplished using LST data from reference areas where the LST fields were mainly affected by natural climatic variation and change, not by urbanization. In this study, Dafangying Reservoir and Dashu Mountain Forest Park were selected as reference areas (Figure A1) because of their large sizes, nearby locations, and almost uniform coverage of water and vegetation that make them ideal to represent the temporal change of LST under natural conditions [52]. The background climate signal was removed using the ratio approach [72] by dividing the annual average temperature of each age cohort by the corresponding annual average temperatures of the two reference areas, respectively, from 2000–2019. Finally, the relationship between LST and built-up age was analyzed using linear regression analysis, and the first hypothesis was rejected if the slope of the regression was significantly different from 0 (α = 0.05). The regression analysis was only performed on built-up age cohorts older than 20 years to ensure enough data points for regression. In addition, bootstrapping was used to sample the LST ratios 500 times for each age cohort to increase the reliability of the regression analysis [73].
To test the second hypothesis (i.e., the impact of UDI on LST does not change temporally), we examined the significance of the temporal change of LST sensitivity to UDI. As LST has a strong linear relationship with UDI [56], LST sensitivity to UDI can be represented by the slope of the regression between these two variables. The second hypothesis was therefore rejected if the slope of the regression between the sensitivity and time (in year) was significantly different from 0 (α = 0.05).
Our third research hypothesis was that the LST along a chronosequence of built-up age cohorts does not have a clear tendency toward change. To test this hypothesis, the annual LST anomalies were first calculated as the differences between the annual average LSTs of each built-up age cohort and the long-term average of the annual LSTs of all cohorts from 2000 to 2019. To examine the LST tendency along the chronosequence, the regression slope between annual LST anomalies and built-up cohort age was assessed and tested to see if it is significantly different from 0 (α = 0.05). In addition, the temporal stability in the LST patterns along the chronosequence was assessed by examining the consistency of LST anomaly ranking orders among all cohorts from 2000 to 2019 using the 95% confidence interval of the mean rank of each cohort [74]. To understand the implicit factors of the LST tendency or fixed LST pattern along the chronosequence, we selected human impact indicators (night light), physical indicators (albedo, building density, floor area ratio) and landscape indicators (NDVI, Aggregation Index (AI), mean area of patches (area mean), Landscape Shape Index (LSI), Number of Patches (NP), Patch Density (PD)) for attribution analysis and standardized LST anomalies and indicators in order to unify the scale of these variables before attribution analysis (Figure 2).
3. Results
3.1. Urban Expansion and Built-Up Age
The overall trends of urban expansion can be broadly characterized into slow growth, rapid growth, turbulent change, and rapid decline from 1986 to 2018 for both the main urban area and the administrative region (Figure 3). For the main urban area, the annual newly added built-up area increased from 0.588 km2 to 4.319 km2 during the slow initial growth period from 1986 to 2003, rapidly increased to 17.906 km2 from 2003 to 2010, then fluctuated turbulently from 2010 to 2015, and finally declined rapidly from 25.233 km2 in 2015 to 9.828 km2 in 2018. In the administrative regions, a turbulent change in the annual newly added built-up area appeared from 7.366 km2 in 1986 to 12.929 km2 in 2003, and then urban expansion increased significantly to 78.826 km2 until 2013 but rapidly declined from 78.976 km2 in 2016 to 20.257 km2 in 2018.
The urban expansion rates of different years also show a similar pattern of change with those of expanded areas (Figure 3). It is worth noting that the urban expansion rates of the main urban area were obviously higher than those of the administrative regions, but the increase in annual newly added built-up areas was smaller than that of the administrative regions. Compared with the growth of built-up areas, the urban expansion rate of the main urban area was much higher than that of the administrative area for most of the time due to its much smaller total area. The expansion rates of the main urban area and the administrative region were similar and relatively low before 1992. The development of the main urban area started earlier in 1992, while the development of the administrative regions lagged behind and were not started until 2004.
Urban expansion processes left distinct time stamps on the map since all new built-ups developed in a given year have left a fixed year stamp (Figure 1c). The annual changes of the expanded urban areas described above also effectively depict the frequency distribution of built-up age cohorts (Figure 3). It can be seen that the most dominant age cohorts were from 3 to 9 years old, accounting for 38.69% of the newly developed urban areas since 1985; age cohorts from 21 to 30 accounted for just a small proportion of 7.70%; the built-ups whose age could not be tracked with the available data (i.e., developed before 1985) accounted for 27.99%. Spatially, built-ups in the city demonstrated distinct spatial agglomerations by age (Figure 1c). Old age cohorts were mainly concentrated in the urban core area but also spread to the outside along traffic lines, while young built-up cohorts were mainly distributed on the periphery of the main urban area and in suburban and rural areas.
3.2. LST Changes along the Chronosequence of Built-Up Age Cohorts
Three major observations can be made from the LST changes along the chronosequence of built-up age cohorts (Figure 4). First, LST anomalies of different built-up age cohorts varied greatly in a given year. Overall, the mean LST anomalies varied between 2.92 °C (the highest at age cohort 22) and −2.80 °C (the lowest at age cohort 28) during the study period. Second, LST did not denote a generally upward or downward trend along the built-up age chronosequence, suggesting the nonexistence of a tendency toward LST change along the chronosequence; therefore, we failed to reject Hypothesis (3). Third, a temporal stability in the LST patterns along the chronosequence (i.e., consistently high or low LST for some fixed built-ups) was present. This was manifested by the relatively stable ranking orders of the LST anomalies of the age cohorts across years and the small interannual variation of the ranks for each cohort (Table A1). Age cohort 22 ranked first consistently through all the years of the LST anomaly, followed by age cohorts 34 and 21. At the bottom of the ranking order were age cohorts 28 and 29. Ambiguity existed in the order of a few age cohorts (e.g., between cohorts 24 and 26, among cohorts 19, 27, and 33) due to small LST differences among them. Nevertheless, the ambiguity was local as the largest 95% confidence intervals of the ranks for the cohorts were ±1, which facilitates the capacity to confuse orders with the ranked neighboring age cohorts but is not enough to change the strong presence of the overall stability in the LST patterns observed along the chronosequence.
3.3. LST Change with Built-Up Age
Results for the dependence of LST on age are shown in Table A2. Among the 20 built-up age cohorts analyzed, only 25% of cohorts showed a significant dependence of LST on age (p < 0.05) when the Dafang Ying reservoir was used as the reference, and the number of cohorts showing significant age dependence reduced to 5% when the Dashushan reservoir was used as the reference. The results indicate that the temporal change in most cohorts did not show significant age dependence.
3.4. Relationships between LST Change and Driving Factors
At the cohort level, landscape factors (i.e., NDVI, AI, area mean, LSI, NP, PD) and human impact indicators (i.e., night light) were significantly correlated with LST anomalies (p < 0.05), while there was no correlation with physical factors (i.e., albedo, building density, floor area ratio) (p > 0.05) (Figure 5). Coefficients of linear regression were used to indicate the impact of the variables on LST anomalies. These factors that had a significant positive impact included Area mean_is (1), PD_green (0.838), NP_green (0.838), Night light (0.804), LSI_green (0.787), and AI_is (0.768). NDVI (−1.049), AI_green (−0.981), LSI_is (−0.967), NP-is (−0.965), PD_is (−0.965), and Area mean_green (−0.659) had a significant negative impact individually.
3.5. Urban Development Intensity (UDI) and the Sensitivity of LST to UDI
The LST increased significantly (p < 0.01) with rising UDI in every year from 2000 to 2019, and the increasing rate, representing LST sensitivity to UDI, varied significantly from 0.255 °C per 0.1 UDI to 0.818 °C per 0.1 UDI (Figure A2). Surprisingly, the LST sensitivity to UDI showed a trend of undulating upward from 2000 to 2019 (Figure 6a), which rejects Hypothesis (2), which states that the impact of UDI on LST did not change over time. This indicates that LST was increasingly more sensitive to UDI over time.
4. Discussion
4.1. Temporal Stability of the Spatial Pattern of LST
A few studies have attempted to investigate the impact of urban age on LST by studying the LST difference between new and old urban areas [75,76,77], but none, to our knowledge, have used the chronosequence approach demonstrated in this study. Our chronosequence analysis yielded several important results. One of the main findings was that the patterns of annual LST anomalies along a chronosequence of built-up age cohorts remained stable across years. This phenomenon can also be interpreted as the temporal stability of the spatial pattern of LST since there is a unique age–location relationship for built-up age cohorts.
The temporal stability of the spatial pattern of LST may be related to human activities, the spatial distribution of different built-up age cohorts, ground features, and the shape or size of the landscape patches in different construction periods. First, human activities could lead to land use transitions [78] and have varying warming effects on different built-up areas. Night light is an effective indicator of human activities [36], and the pattern of its anomaly along the built-up age cohorts chronosequence was very similar to that of the LST anomaly (Figure A3), probably suggesting a strong influence of human activities on the LST anomaly. This finding is consistent with the results of some previous studies on the relationship between nighttime lighting and UHI [79,80,81]. In addition, the built-up areas of some age cohorts with high LST were dominated by parks, highways, and industrial and residential areas. Other studies have also suggested that areas with dense population [8], human activities [49], and commercial activities [44] would entail high LST.
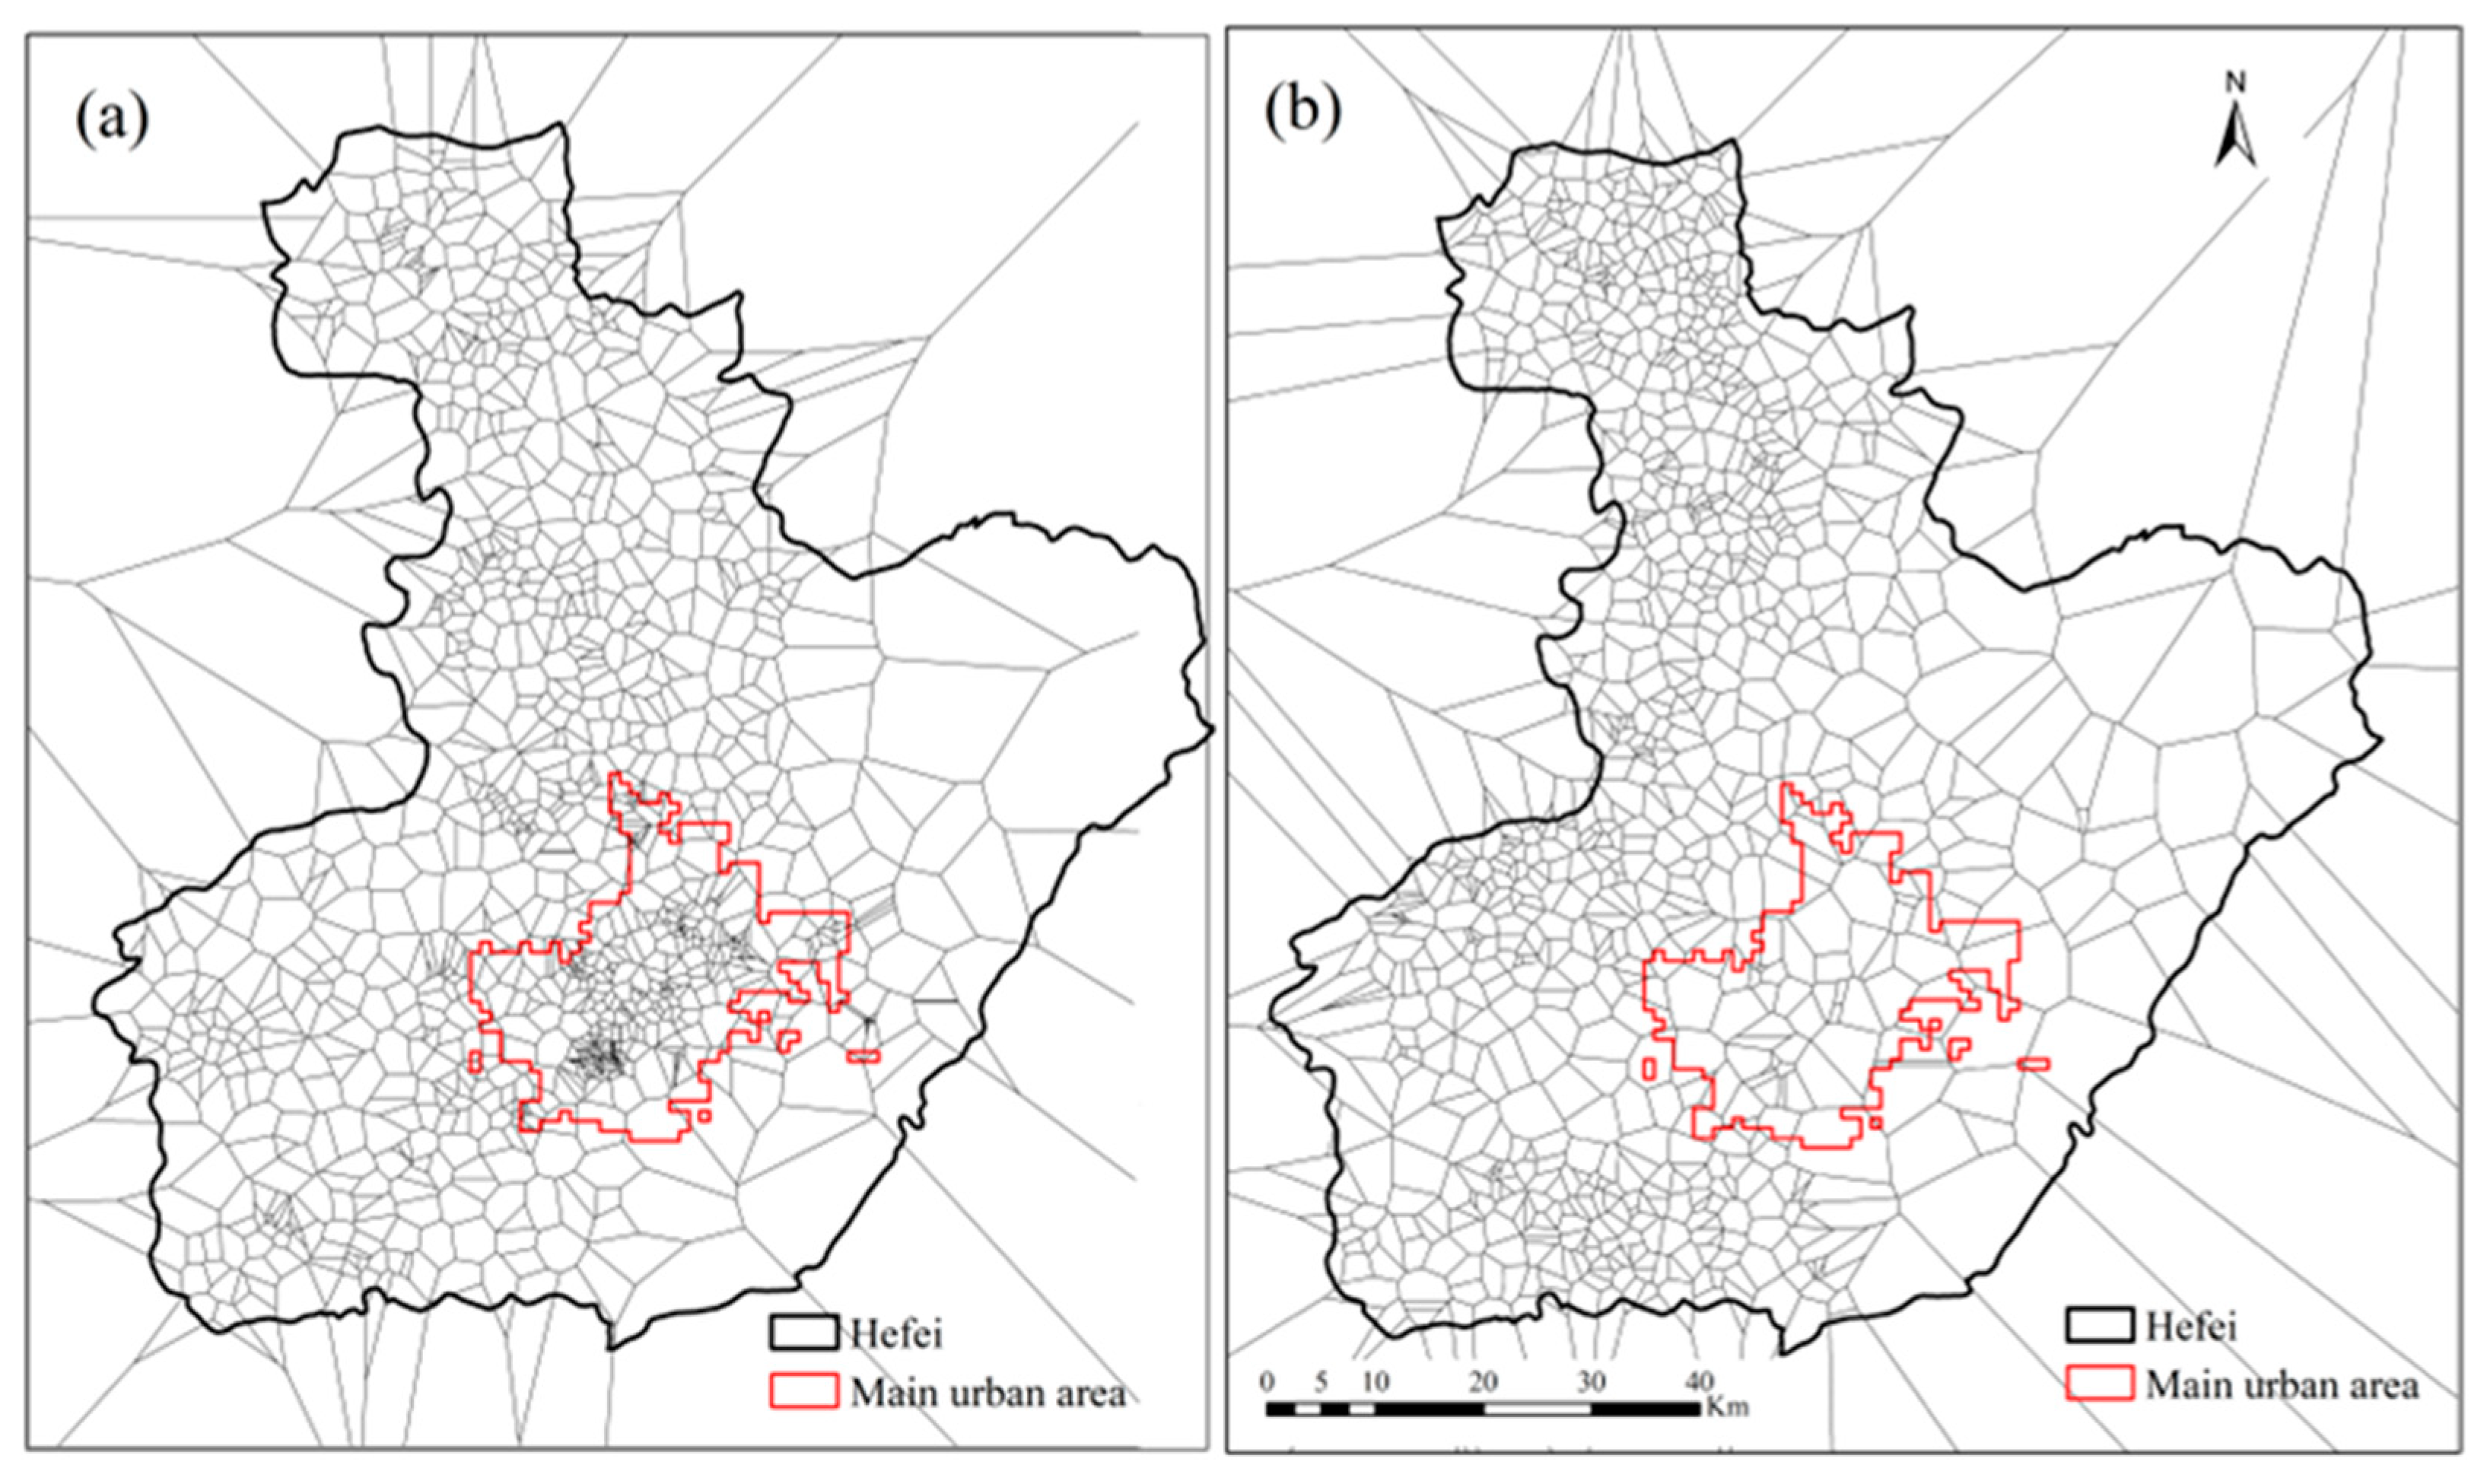
Second, location exerts a strong impact on LST. Built-up age cohorts with the highest (age cohort 22) and lowest (age cohort 28) LST anomalies may offer good opportunities to discern the influence of location. Thiessen polygon analysis shows that age cohort 22 is mainly concentrated in the main urban area, while age cohort 28 is mainly concentrated in suburban and rural areas (Figure A4). In addition, the areas of age cohort 22 are mainly distributed along the traffic lines, while the areas of age cohort 28 are mostly distributed in the fringe areas of the city. These results imply that transportation density [82,83] and urban structure [32,84] are influential factors in the spatial pattern of LST.
Third, the shape and size of built-up areas and surrounding green patches also have impacts on the LST of different built-up age cohorts. Urban areas exhibit a variable LST pattern that can be linked to albedo variations [85,86,87]; the increase in building density and floor area ratio will also cause LST to rise with urban construction [61,88,89,90]. In contrast to previous studies, our results show that landscape plays a leading role in determining the LST pattern among built-up age cohorts (Figure 5). For example, the larger the patch area of the impervious surface, the higher the degree of aggregation, and the more obvious the warming effect. Similarly, the larger the patch area of vegetation and the higher the degree of aggregation, the more significant the cooling effect, and all are in agreement with the general observation that patch characteristics have a certain mitigation effect on LST [27,91,92].
4.2. Space-for-Time Substitution Inadequate for Urbanization Study
Space-for-time substitution theory is widely used in a wide range of studies, including the growth of trees [93], the evolution of community ecological processes [94], and the impact of climate change on biodiversity [95]. It assumes that spatial and temporal relationships between ecological phenomena and age are equivalent and is used to evaluate the effects of man-made environmental changes on a variety of ecological processes [93,94,96]. However, there is no research on applying this theory to study the evolution of LST along urbanization chronosequences. Our chronosequence analysis suggests that LST anomalies along the age chronosequence did not show any upward or downward trend, which is different from the significant temporal tendency found in the LST anomalies from a small fraction of age cohorts. This difference demonstrates that the concept of “space-for-time substitution” is not applicable to studying the relationship between LST and built-up age. Future research should pay attention to the inadequacy of space-for-time substitution in urbanization studies, and we call for more research to verify our results.
4.3. Temporal Change of Sensitivity of LST to UDI
Existing studies have mainly focused on the linear relationship between UDI and LST [56] without exploring the temporal dynamics of the sensitivity of LST to UDI (measured by the slope). Our study is the first to address this issue using the proposed concept of LST sensitivity to UDI. We found that the sensitivity more than tripled, increasing from 0.255 to 0.818 °C per 10% UDI during the study period. The result is unexpected and alarming as it indicates the temperature increase caused by the same amount of urbanization has escalated more than three times in the past two years. Many factors affect the magnitude of LST change, including albedo and NDVI [51,55,87,97]. According to our results, the sensitivity of albedo to UDI did not show an increasing or decreasing trend (Figure 6c), suggesting that albedo might not be a major causative factor for the increased LST sensitivity to UDI. On the other hand, the sensitivity of NDVI to UDI showed a significant downtrend over time (Figure 6b), inversely mimicking the trend of LST sensitivity to UDI. These mirror images may suggest that NDVI sensitivity change is the key driver of LST sensitivity change over time. Many studies also indicate that urbanization poses negative effects on the overall vegetation conditions, and NDVI has been reduced with rising UDI for most cities in China [5]. Since there is a strong negative correlation between NDVI and LST [98,99], the reduction of vegetation will weaken the cooling effect and cause an increase in LST [97,100].
4.4. Limitations and Future Research
There are still some limitations in this study. The first is the study area, as we only selected Hefei as a representative city, which is flawed in terms of the generalizability of the study. However, the research methodology and analytical approach of this study are generalizable, and the datasets used are representative and accurate enough to be replicated in studies of other regions. Hefei, as a rapidly expanding city, is very similar to cities like Shenzhen, Hangzhou, and Nanjing. Therefore, future researchers could choose some cities with high urban development rates as the study area to verify our findings or expand the study area to typical cities in China as well as select cities overseas for comparative studies. Extending the time interval of studies could also enhance the timeliness of the research.
As for the limitation in the spatial resolution of data, in the summer when the urban heat island effect is most obvious and there are a lot of clouds and rain, which affects the image quality of Landsat, the continuous time series study cannot be carried out. Therefore, the MOD11A2 product was adopted in this study, but the resolution of the MOD11A2 image was 1 km × 1 km, and the image precision was not enough to conduct more detailed research. This may result in the inability to capture micro-scale heat island effects within cities, as the MOD11A2 product may smooth temperature variations within urban areas. Future studies could combine the MODIS product with higher-resolution satellite data or other remote sensing data to capture micro-scale heat island effects within urban areas more accurately. This can be achieved through the use of additional sensors or data fusion techniques.
5. Conclusions
To our knowledge, our research represents the first effort to study the evolution of the relationships among built-up age, urbanization intensity, and LST. Major findings and conclusions are as follows. First, LST in most urban areas does not change with age as built-ups get older. A significant temporal tendency of LST was detected only in a small fraction of urban areas. Second, no upward or downward trend was detected in LST along a chronosequence of built-up age cohorts. However, strong temporal stability was found in the LST pattern along the chronosequence, which indicates the presence of strong temporal stability in the spatial pattern of LST. The temporal stability is likely related to human activities, as implied by night light information. Third, unexpectedly and alarmingly, LST sensitivity to UDI increased more than three times from 2000 to 2019, which might be related to the increased NDVI sensitivity (absolute value) to UDI during the same period. Lastly, the results of A and B challenge the applicability of space-for-time substitution theory in urbanization studies.
Author Contributions
S.L. designed the research. S.L. and Y.L. performed the research. M.L., R.G., Y.S., X.P. and S.F. contributed to the writing of the paper. All authors have read and agreed to the published version of the manuscript.
Funding
This work was supported by research grants from the National Natural Science Foundation of China (U20A2089 and 41971152) and Hunan Innovative Talent Program (2019RS1062) to S.L.
Data Availability Statement
Data are contained within the article.
Conflicts of Interest
The authors declare no conflicts of interest.
Appendix A
Figure A1.
The locations of the two reference areas, Dafangying Reservoir and Dashu Mountain Forest Park, as shown by the red rectangles.
Figure A1.
The locations of the two reference areas, Dafangying Reservoir and Dashu Mountain Forest Park, as shown by the red rectangles.


Table A1.
The ranking orders and SD of the LST anomalies of 16 age cohorts in each year.
| Age | 2000 | 2001 | 2002 | 2003 | 2004 | 2005 | 2006 | 2007 | 2008 | 2009 | 2010 | 2011 | 2012 | 2013 | 2014 | 2015 | 2016 | 2017 | 2018 | 2019 | Mode | SE | 95% CI |
|---|---|---|---|---|---|---|---|---|---|---|---|---|---|---|---|---|---|---|---|---|---|---|---|
| 22 | 1 | 1 | 1 | 1 | 1 | 1 | 1 | 1 | 1 | 1 | 1 | 1 | 1 | 1 | 1 | 1 | 1 | 1 | 1 | 1 | 1 | 0.00 | 0 |
| 34 | 3 | 2 | 3 | 2 | 2 | 3 | 3 | 2 | 2 | 2 | 2 | 2 | 2 | 2 | 2 | 2 | 2 | 2 | 2 | 2 | 2 | 0.09 | 0 |
| 21 | 2 | 4 | 2 | 3 | 3 | 2 | 4 | 3 | 3 | 3 | 3 | 3 | 3 | 3 | 3 | 3 | 5 | 3 | 3 | 3 | 3 | 0.15 | 0 |
| 25 | 4 | 5 | 15 | 5 | 4 | 5 | 2 | 4 | 4 | 4 | 4 | 4 | 4 | 4 | 4 | 4 | 3 | 4 | 4 | 5 | 4 | 0.57 | 1 |
| 26 | 5 | 6 | 10 | 8 | 6 | 6 | 6 | 9 | 7 | 6 | 8 | 7 | 5 | 5 | 5 | 5 | 4 | 5 | 6 | 4 | 5 | 0.36 | 1 |
| 24 | 9 | 8 | 4 | 4 | 5 | 4 | 5 | 5 | 5 | 5 | 6 | 11 | 6 | 6 | 6 | 7 | 6 | 6 | 5 | 6 | 6 | 0.39 | 1 |
| 20 | 8 | 3 | 5 | 6 | 7 | 8 | 7 | 8 | 9 | 10 | 7 | 5 | 7 | 8 | 9 | 8 | 11 | 7 | 11 | 7 | 7 | 0.44 | 1 |
| 23 | 11 | 7 | 9 | 7 | 9 | 7 | 8 | 6 | 8 | 8 | 9 | 8 | 8 | 7 | 8 | 10 | 9 | 10 | 10 | 13 | 8 | 0.37 | 1 |
| 19 | 7 | 11 | 12 | 11 | 8 | 12 | 9 | 12 | 10 | 12 | 11 | 9 | 9 | 10 | 10 | 6 | 7 | 9 | 7 | 9 | 9 | 0.42 | 1 |
| 27 | 10 | 10 | 6 | 9 | 10 | 11 | 11 | 10 | 11 | 9 | 10 | 6 | 11 | 11 | 7 | 11 | 10 | 8 | 9 | 10 | 10 | 0.36 | 1 |
| 33 | 6 | 9 | 7 | 12 | 13 | 10 | 10 | 7 | 6 | 7 | 5 | 10 | 10 | 9 | 11 | 12 | 8 | 11 | 8 | 8 | 10 | 0.50 | 1 |
| 30 | 12 | 16 | 11 | 10 | 14 | 9 | 16 | 15 | 15 | 14 | 12 | 14 | 15 | 12 | 13 | 9 | 12 | 13 | 13 | 14 | 12 | 0.47 | 1 |
| 31 | 13 | 15 | 13 | 14 | 12 | 13 | 12 | 11 | 14 | 13 | 15 | 15 | 12 | 14 | 12 | 13 | 13 | 12 | 12 | 15 | 13 | 0.27 | 1 |
| 32 | 14 | 14 | 8 | 13 | 11 | 16 | 15 | 14 | 16 | 11 | 13 | 16 | 13 | 13 | 14 | 14 | 15 | 14 | 14 | 11 | 14 | 0.44 | 1 |
| 28 | 15 | 13 | 14 | 15 | 16 | 14 | 13 | 13 | 13 | 15 | 16 | 12 | 16 | 16 | 16 | 16 | 14 | 16 | 16 | 12 | 16 | 0.33 | 1 |
| 29 | 16 | 12 | 16 | 16 | 15 | 15 | 14 | 16 | 12 | 16 | 14 | 13 | 14 | 15 | 15 | 15 | 16 | 15 | 15 | 16 | 16 | 0.29 | 1 |
Table A2.
Trend analysis of annual mean temperature, in reference to those of Dafangying and Dashu Mountain Forest Park, respectively. Slope, R2, and p-value were derived from linear regression between LST and built-up age.
Table A2.
Trend analysis of annual mean temperature, in reference to those of Dafangying and Dashu Mountain Forest Park, respectively. Slope, R2, and p-value were derived from linear regression between LST and built-up age.
| Dafangying | Dashu Mountain Forest Park | |||||
|---|---|---|---|---|---|---|
| Built-Up Age | Slope | p | R2 | Slope | p | R2 |
| 15 | 0.002 | 0.150 | 0.142 | 0.003 | 0.058 | 0.233 |
| 16 | 0.003 | 0.050 | 0.232 | 0.001 | 0.348 | 0.059 |
| 17 | 0.002 | 0.133 | 0.135 | 0.000 | 0.963 | 0.000 |
| 18 | 0.001 | 0.285 | 0.067 | 0.000 | 0.674 | 0.011 |
| 19 | 0.003 | 0.001 | 0.477 | 0.001 | 0.229 | 0.084 |
| 20 | 0.015 | 0.086 | 0.155 | −0.001 | 0.325 | 0.054 |
| 21 | 0.017 | 0.071 | 0.170 | 0.000 | 0.684 | 0.009 |
| 22 | 0.020 | 0.044 | 0.206 | 0.002 | 0.225 | 0.081 |
| 23 | 0.015 | 0.093 | 0.149 | −0.001 | 0.165 | 0.104 |
| 24 | 0.016 | 0.078 | 0.162 | 0.000 | 0.647 | 0.012 |
| 25 | 0.018 | 0.049 | 0.198 | 0.001 | 0.230 | 0.079 |
| 26 | 0.018 | 0.042 | 0.210 | 0.001 | 0.176 | 0.99 |
| 27 | 0.016 | 0.069 | 0.172 | 0.000 | 0.735 | 0.007 |
| 28 | 0.015 | 0.090 | 0.151 | −0.001 | 0.303 | 0.059 |
| 29 | 0.015 | 0.083 | 0.158 | −0.001 | 0.427 | 0.035 |
| 30 | 0.016 | 0.058 | 0.185 | 0.000 | 0.955 | 0.000 |
| 31 | 0.015 | 0.078 | 0.163 | −0.001 | 0.407 | 0.038 |
| 32 | 0.015 | 0.075 | 0.165 | −0.001 | 0.461 | 0.031 |
| 33 | 0.016 | 0.074 | 0.166 | −0.001 | 0.418 | 0.037 |
| 34 | 0.020 | 0.038 | 0.219 | 0.002 | 0.017 | 0.279 |
Figure A2.
Trends of LST with UDI for Hefei over 2000–2019.

Figure A3.
Night light anomaly changes along a chronosequence of built-up age cohorts. The red line and blue line show that age cohorts 22 and 28, respectively, had the highest and lowest LST anomalies consistently over all years, demonstrating strong temporal stability.
Figure A3.
Night light anomaly changes along a chronosequence of built-up age cohorts. The red line and blue line show that age cohorts 22 and 28, respectively, had the highest and lowest LST anomalies consistently over all years, demonstrating strong temporal stability.
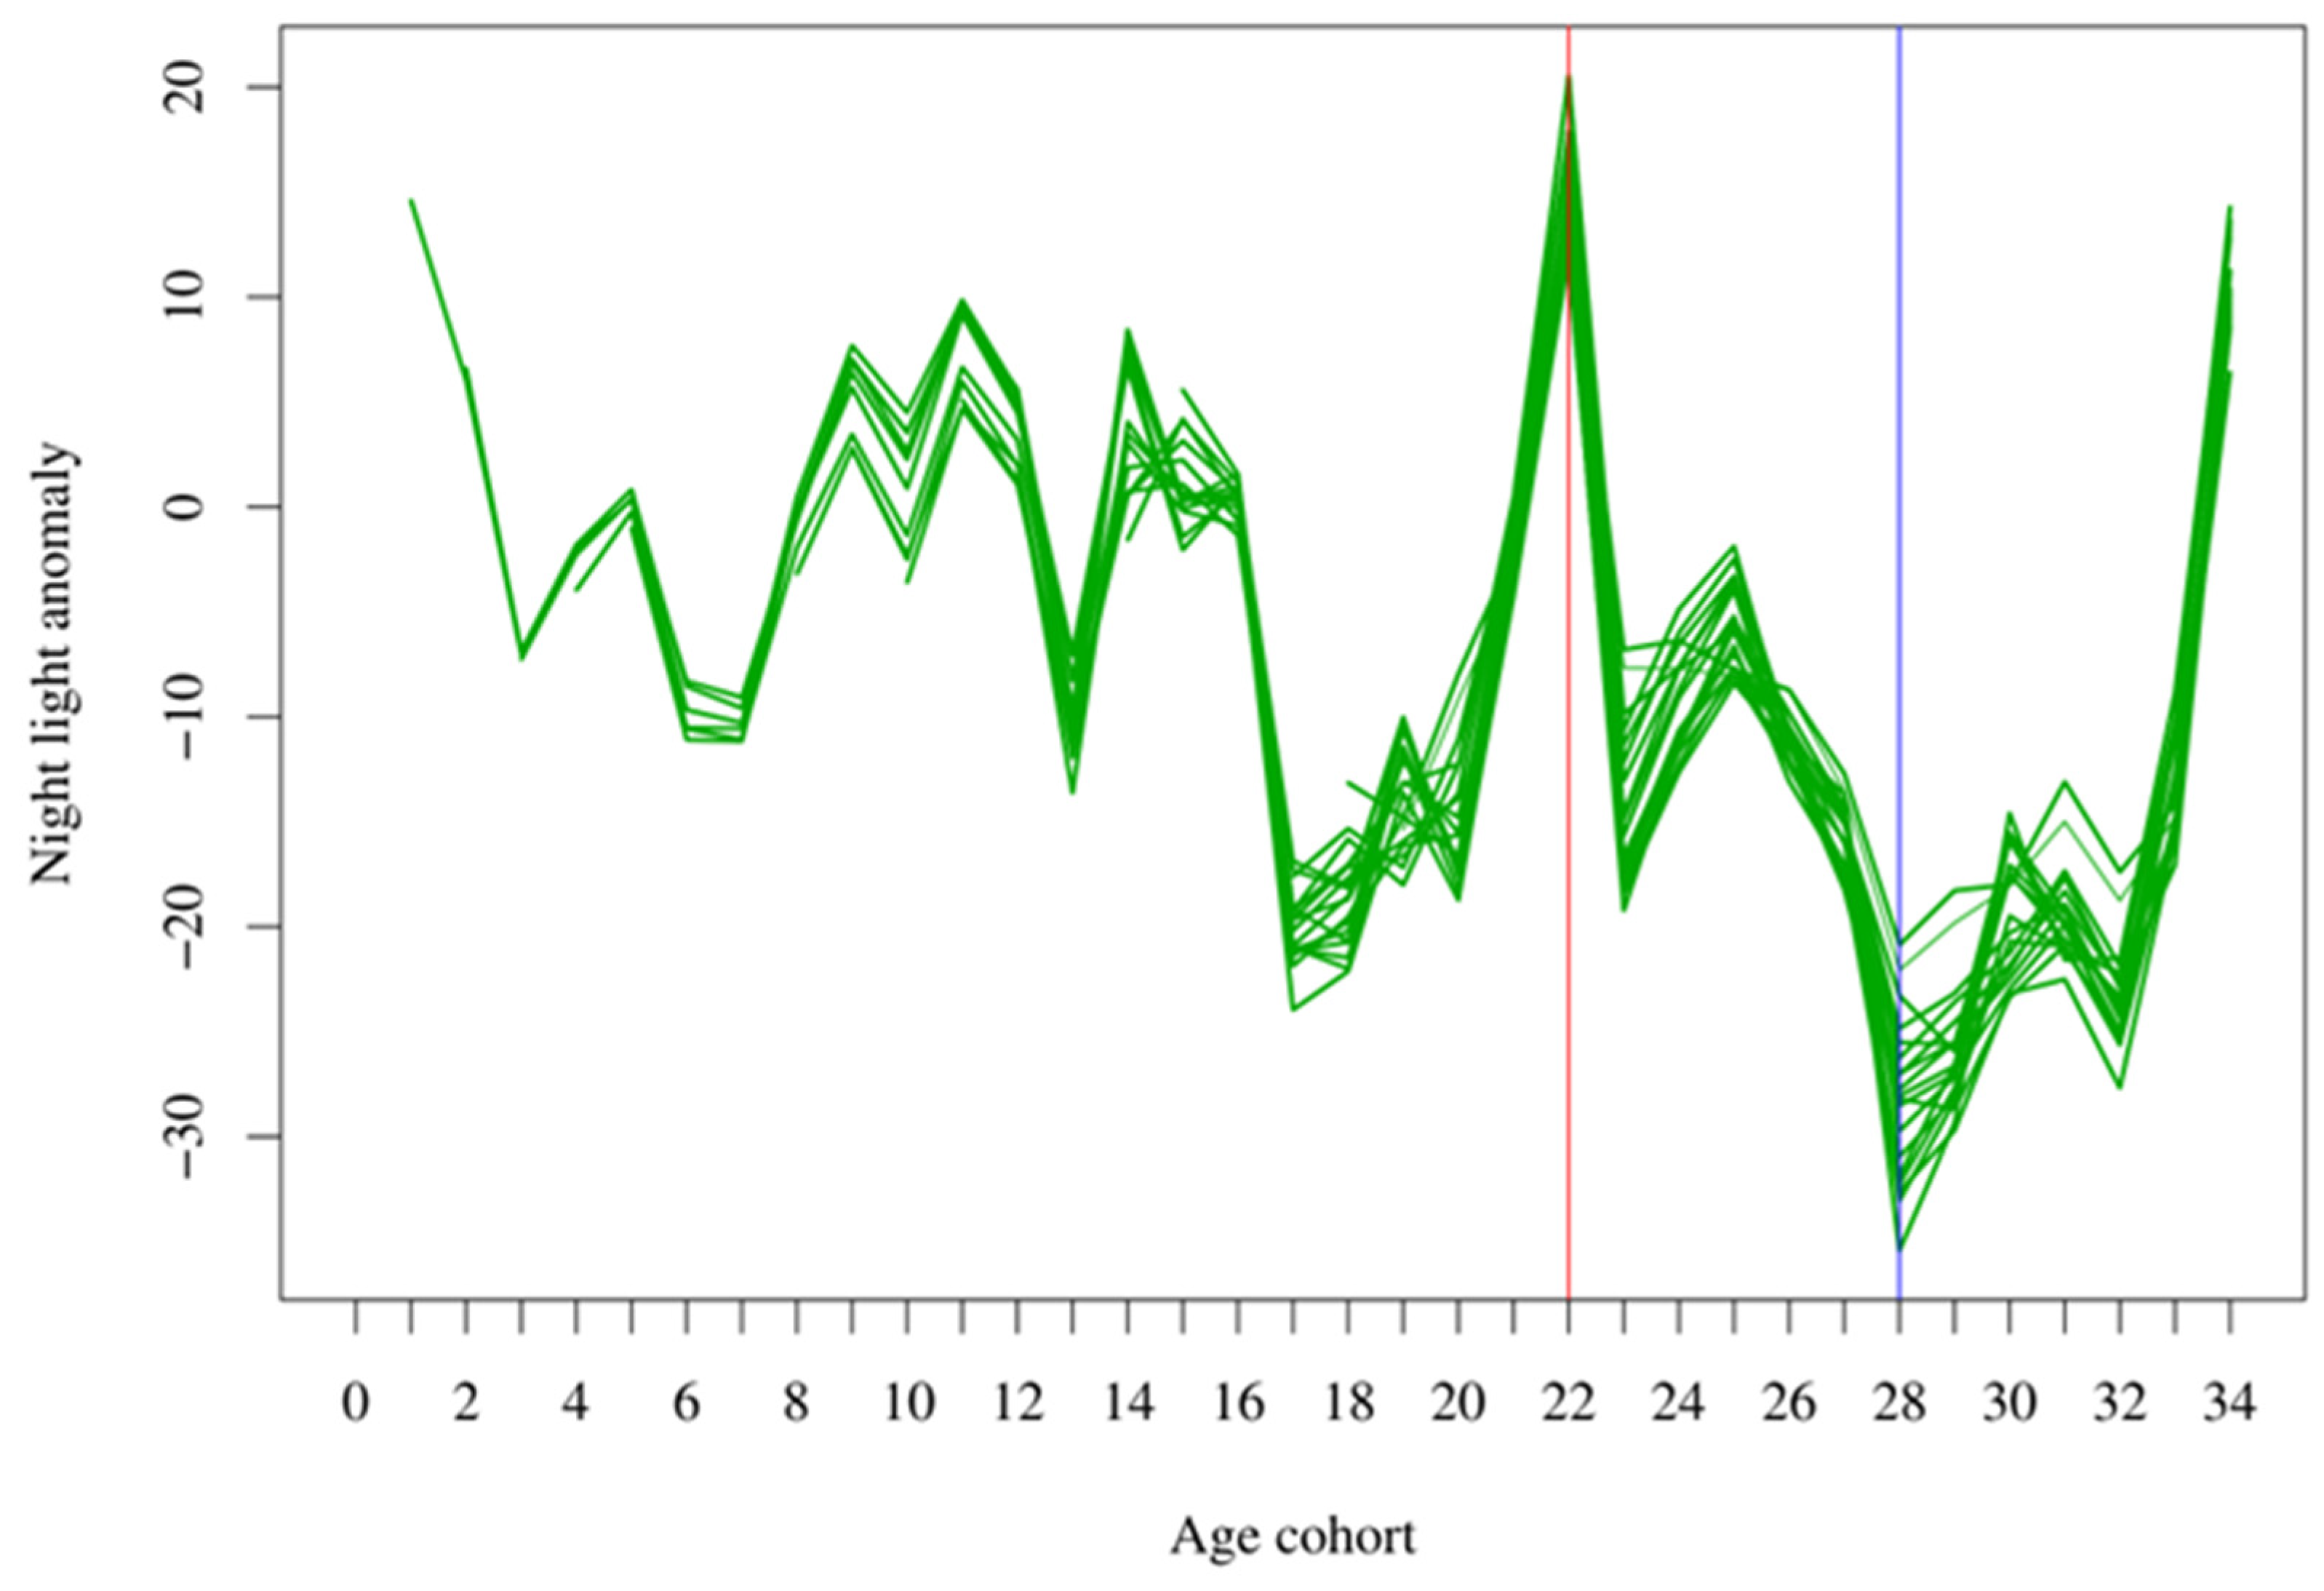
Figure A4.
Thiessen polygon analysis of built-up age cohort with highest and lowest LST. Built-up age cohort 22 (a) and built-up age cohort 28 (b).
Figure A4.
Thiessen polygon analysis of built-up age cohort with highest and lowest LST. Built-up age cohort 22 (a) and built-up age cohort 28 (b).
References
- Oke, T.R. City size and the urban heat island. Atmos. Environ. 1973, 7, 769–779. [Google Scholar] [CrossRef]
- Arnfield, A.J. Two decades of urban climate research: A review of turbulence, exchanges of energy and water, and the urban heat island. Int. J. Climatol. J. R. Meteorol. Soc. 2003, 23, 1–26. [Google Scholar] [CrossRef]
- Arsiso, B.K.; Tsidu, G.M.; Stoffberg, G.H.; Tadesse, T. Influence of urbanization-driven land use/cover change on climate: The case of Addis Ababa, Ethiopia. Phys. Chem. Earth Parts A/B/C 2018, 105, 212–223. [Google Scholar] [CrossRef]
- Kim, H.; Gu, D.; Kim, H.Y. Effects of Urban Heat Island mitigation in various climate zones in the United States. Sustain. Cities Soc. 2018, 41, 841–852. [Google Scholar] [CrossRef]
- Zhou, D.; Zhao, S.; Liu, S.; Zhang, L. Spatiotemporal trends of terrestrial vegetation activity along the urban development intensity gradient in China’s 32 major cities. Sci. Total Environ. 2014, 488–489, 136–145. [Google Scholar] [CrossRef] [PubMed]
- Phelan, P.E.; Kaloush, K.; Miner, M.; Golden, J.; Phelan, B.; Silva, H., III; Taylor, R.A. Urban heat island: Mechanisms, implications, and possible remedies. Annu. Rev. Environ. Resour. 2015, 40, 285–307. [Google Scholar] [CrossRef]
- Magura, T.; Ferrante, M.; Lövei, G.L. Only habitat specialists become smaller with advancing urbanization. Glob. Ecol. Biogeogr. 2020, 29, 1978–1987. [Google Scholar] [CrossRef]
- Zhang, J.; Wu, L. Influence of human population movements on urban climate of Beijing during the Chinese New Year holiday. Sci. Rep. 2017, 7, 45813. [Google Scholar] [CrossRef] [PubMed]
- Parsons, K. Human Thermal Environments: The Effects of Hot, Moderate, Andcold Environments on Human Health, Comfort, and Performance, 3rd ed.; CRC Press: Boca Raton, FL, USA, 2014; pp. 1–586. [Google Scholar]
- Kotharkar, R.; Surawar, M. Land use, land cover, and population density impact on the formation of canopy urban heat islands through traverse survey in the Nagpur urban area, India. J. Urban Plan. Dev. 2016, 142, 04015003. [Google Scholar] [CrossRef]
- Wu, L.; Zhang, J. Assessing population movement impacts on urban heat island of Beijing during the Chinese New Year holiday: Effects of meteorological conditions. Theor. Appl. Climatol. 2018, 131, 1203–1210. [Google Scholar] [CrossRef]
- Manoli, G.; Fatichi, S.; Schläpfer, M.; Yu, K.; Crowther, T.W.; Meili, N.; Burlando, P.; Katul, G.G.; Bou-Zeid, E. Magnitude of urban heat islands largely explained by climate and population. Nature 2019, 573, 55–60. [Google Scholar] [CrossRef] [PubMed]
- Mathew, A.; Khandelwal, S.; Kaul, N. Spatial and temporal variations of urban heat island effect and the effect of percentage impervious surface area and elevation on land surface temperature: Study of Chandigarh city, India. Sustain. Cities Soc. 2016, 26, 264–277. [Google Scholar] [CrossRef]
- Chithra, S.; Nair, M.H.; Amarnath, A.; Anjana, N. Impacts of impervious surfaces on the environment. Int. J. Eng. Sci. Invent. 2015, 4, 27–31. [Google Scholar]
- Nguyen, T.M.; Lin, T.-H.; Chan, H.-P. The environmental effects of urban development in Hanoi, Vietnam from satellite and meteorological observations from 1999–2016. Sustainability 2019, 11, 1768. [Google Scholar] [CrossRef]
- Parsaee, M.; Joybari, M.M.; Mirzaei, P.A.; Haghighat, F. Urban heat island, urban climate maps and urban development policies and action plans. Environ. Technol. Innov. 2019, 14, 100341. [Google Scholar] [CrossRef]
- Liang, Z.; Wu, S.; Wang, Y.; Wei, F.; Huang, J.; Shen, J.; Li, S. The relationship between urban form and heat island intensity along the urban development gradients. Sci. Total Environ. 2020, 708, 135011. [Google Scholar] [CrossRef] [PubMed]
- Xu, H.-Q.; Chen, B.-Q. Remote sensing of the urban heat island and its changes in Xiamen City of SE China. J. Environ. Sci. 2004, 16, 276–281. [Google Scholar]
- Du, H.; Wang, D.; Wang, Y.; Zhao, X.; Qin, F.; Jiang, H.; Cai, Y. Influences of land cover types, meteorological conditions, anthropogenic heat and urban area on surface urban heat island in the Yangtze River Delta Urban Agglomeration. Sci. Total Environ. 2016, 571, 461–470. [Google Scholar] [CrossRef]
- Xu, N.; Deng, F.; Liu, B.; Li, C.; Fu, H.; Yang, H.; Zhang, J. Changes in the urban surface thermal environment of a Chinese coastal city revealed by downscaling MODIS LST with random forest algorithm. J. Meteorol. Res. 2021, 35, 759–774. [Google Scholar] [CrossRef]
- Sun, F.; Liu, M.; Wang, Y.; Wang, H.; Che, Y. The effects of 3D architectural patterns on the urban surface temperature at a neighborhood scale: Relative contributions and marginal effects. J. Clean. Prod. 2020, 258, 120706. [Google Scholar] [CrossRef]
- Yang, F.; Lau, S.S.; Qian, F. Summertime heat island intensities in three high-rise housing quarters in inner-city Shanghai China: Building layout, density and greenery. Build. Environ. 2010, 45, 115–134. [Google Scholar] [CrossRef]
- Luan, X.; Yu, Z.; Zhang, Y.; Wei, S.; Miao, X.; Huang, Z.Y.; Teng, S.N.; Xu, C. Remote sensing and social sensing data reveal scale-dependent and system-specific strengths of urban heat island determinants. Remote Sens. 2020, 12, 391. [Google Scholar] [CrossRef]
- Chakraborty, T.; Sarangi, C.; Lee, X. Reduction in human activity can enhance the urban heat island: Insights from the COVID-19 lockdown. Environ. Res. Lett. 2021, 16, 054060. [Google Scholar] [CrossRef]
- Bera, D.; Das Chatterjee, N.; Mumtaz, F.; Dinda, S.; Ghosh, S.; Zhao, N.; Bera, S.; Tariq, A. Integrated Influencing Mechanism of Potential Drivers on Seasonal Variability of LST in Kolkata Municipal Corporation, India. Land 2022, 11, 1461. [Google Scholar] [CrossRef]
- Ayanlade, A. Seasonality in the daytime and night-time intensity of land surface temperature in a tropical city area. Sci. Total Environ. 2016, 557, 415–424. [Google Scholar] [CrossRef] [PubMed]
- Shi, Y.; Liu, S.; Yan, W.; Zhao, S.; Ning, Y.; Peng, X.; Chen, W.; Chen, L.; Hu, X.; Fu, B. Influence of landscape features on urban land surface temperature: Scale and neighborhood effects. Sci. Total Environ. 2021, 771, 145381. [Google Scholar] [CrossRef] [PubMed]
- Heinl, M.; Hammerle, A.; Tappeiner, U.; Leitinger, G. Determinants of urban–rural land surface temperature differences—A landscape scale perspective. Landsc. Urban Plan. 2015, 134, 33–42. [Google Scholar] [CrossRef]
- Degefu, M.A.; Argaw, M.; Feyisa, G.L.; Degefa, S. Effects of urbanization on the relationship between greenspace patterns and evolution of regional heat island in cities of Ethiopia. Chin. J. Popul. Resour. Environ. 2021, 19, 330–343. [Google Scholar] [CrossRef]
- Liu, Y.; Li, H.; Gao, P.; Zhong, C. Monitoring the spatiotemporal dynamics of urban green space and its impacts on thermal environment in Shenzhen city from 1978 to 2018 with remote sensing data. Photogramm. Eng. Remote Sens. 2021, 87, 81–89. [Google Scholar] [CrossRef]
- Yue, W.; Qiu, S.; Xu, H.; Xu, L.; Zhang, L. Polycentric urban development and urban thermal environment: A case of Hangzhou, China. Landsc. Urban Plan. 2019, 189, 58–70. [Google Scholar] [CrossRef]
- Lin, J.; Wei, K.; Guan, Z. Exploring the connection between morphological characteristic of built-up areas and surface heat islands based on MSPA. Urban Clim. 2024, 53, 101764. [Google Scholar] [CrossRef]
- Zheng, Y.; Han, Q.; Keeffe, G. An Evaluation of Different Landscape Design Scenarios to Improve Outdoor Thermal Comfort in Shenzhen. Land 2024, 13, 65. [Google Scholar] [CrossRef]
- Jamei, Y.; Rajagopalan, P.; Sun, Q.C. Spatial structure of surface urban heat island and its relationship with vegetation and built-up areas in Melbourne, Australia. Sci. Total Environ. 2019, 659, 1335–1351. [Google Scholar] [CrossRef] [PubMed]
- Qian, Y.; Li, Z.; Zhou, W.; Chen, Y. Quantifying spatial pattern of urban greenspace from a gradient perspective of built-up age. Phys. Chem. Earth Parts A/B/C 2019, 111, 78–85. [Google Scholar] [CrossRef]
- Zhong, Y.; Lin, A.; Zhou, Z.; Chen, F. Spatial pattern evolution and optimization of urban system in the Yangtze River economic belt, China, based on DMSP-OLS night light data. Sustainability 2018, 10, 3782. [Google Scholar] [CrossRef]
- Stewart, I.; Krayenhoff, E.; Voogt, J.; Lachapelle, J.; Allen, M.; Broadbent, A. Time evolution of the surface urban heat island. Earth’s Future 2021, 9, e2021EF002178. [Google Scholar] [CrossRef]
- de Lima, G.N.; Rueda, V.O.M. The urban growth of the metropolitan area of Sao Paulo and its impact on the climate. Weather. Clim. Extrem. 2018, 21, 17–26. [Google Scholar] [CrossRef]
- Zhang, W.; Jiang, J.; Zhu, Y. Spatial-temporal evolution of urban thermal environment based on spatial statistical features. Ying Yong Sheng Tai Xue Bao J. Appl. Ecol. 2015, 26, 1840–1846. [Google Scholar]
- Cai, Y.; Chen, Y.; Tong, C. Spatiotemporal evolution of urban green space and its impact on the urban thermal environment based on remote sensing data: A case study of Fuzhou City, China. Urban For. Urban Green. 2019, 41, 333–343. [Google Scholar] [CrossRef]
- Cao, J.; Zhou, W.; Wang, J.; Hu, X.; Yu, W.; Zheng, Z.; Wang, W. Significant increase in extreme heat events along an urban–rural gradient. Landsc. Urban Plan. 2021, 215, 104210. [Google Scholar] [CrossRef]
- Li, F.; Yan, Q.; Bian, Z.; Liu, B.; Wu, Z. A POI and LST adjusted NTL urban index for urban built-up area extraction. Sensors 2020, 20, 2918. [Google Scholar] [CrossRef] [PubMed]
- Zhang, X.; Li, P. A temperature and vegetation adjusted NTL urban index for urban area mapping and analysis. ISPRS J. Photogramm. Remote Sens. 2018, 135, 93–111. [Google Scholar] [CrossRef]
- Yu, Z.; Jing, Y.; Yang, G.; Sun, R. A new urban functional zone-based climate zoning system for urban temperature study. Remote Sens. 2021, 13, 251. [Google Scholar] [CrossRef]
- Zhao, X.; Huang, J.; Ye, H.; Wang, K.; Qiu, Q. Spatiotemporal changes of the urban heat island of a coastal city in the context of urbanisation. Int. J. Sustain. Dev. World Ecol. 2010, 17, 311–316. [Google Scholar] [CrossRef]
- Li, Y.; Sun, Y.; Li, J.; Gao, C. Socioeconomic drivers of urban heat island effect: Empirical evidence from major Chinese cities. Sustain. Cities Soc. 2020, 63, 102425. [Google Scholar] [CrossRef]
- Grigoraș, G.; Urițescu, B. Spatial hotspot analysis of Bucharest’s urban heat island (UHI) using modis data. Ann. Valahia Univ. Targoviste. Geogr. Ser. 2018, 18, 14–22. [Google Scholar] [CrossRef]
- Wang, J.; Huang, B.; Fu, D.; Atkinson, P.M.; Zhang, X. Response of urban heat island to future urban expansion over the Beijing–Tianjin–Hebei metropolitan area. Appl. Geogr. 2016, 70, 26–36. [Google Scholar] [CrossRef]
- Aminiyan, M.M.; Aminiyan, F.M.; Mousavi, R.; Heydariyan, A. Heavy metal pollution affected by human activities and different land-use in urban topsoil: A case study in Rafsanjan city, Kerman province, Iran. Eurasian J. Soil Sci. 2016, 5, 97–104. [Google Scholar] [CrossRef]
- Li, X.; Zhou, Y.; Yu, S.; Jia, G.; Li, H.; Li, W. Urban heat island impacts on building energy consumption: A review of approaches and findings. Energy 2019, 174, 407–419. [Google Scholar] [CrossRef]
- Grover, A.; Singh, R.B. Analysis of urban heat island (UHI) in relation to normalized difference vegetation index (NDVI): A comparative study of Delhi and Mumbai. Environments 2015, 2, 125–138. [Google Scholar] [CrossRef]
- Du, H.; Cai, Y.; Zhou, F.; Jiang, H.; Jiang, W.; Xu, Y. Urban blue-green space planning based on thermal environment simulation: A case study of Shanghai, China. Ecol. Indic. 2019, 106, 105501. [Google Scholar] [CrossRef]
- Zhang, K.; Wang, R.; Shen, C.; Da, L. Temporal and spatial characteristics of the urban heat island during rapid urbanization in Shanghai, China. Environ. Monit. Assess. 2010, 169, 101–112. [Google Scholar] [CrossRef] [PubMed]
- Qin, Z.; Dall’Olmo, G.; Karnieli, A.; Berliner, P. Derivation of split window algorithm and its sensitivity analysis for retrieving land surface temperature from NOAA-advanced very high resolution radiometer data. J. Geophys. Res. Atmos. 2001, 106, 22655–22670. [Google Scholar] [CrossRef]
- Morini, E.; Touchaei, A.G.; Castellani, B.; Rossi, F.; Cotana, F. The impact of albedo increase to mitigate the urban heat island in Terni (Italy) using the WRF model. Sustainability 2016, 8, 999. [Google Scholar] [CrossRef]
- Zhou, D.; Zhang, L.; Hao, L.; Sun, G.; Liu, Y.; Zhu, C. Spatiotemporal trends of urban heat island effect along the urban development intensity gradient in China. Sci. Total Environ. 2016, 544, 617–626. [Google Scholar] [CrossRef] [PubMed]
- Peng, S.; Piao, S.; Ciais, P.; Friedlingstein, P.; Ottle, C.; Bréon, F.-M.; Nan, H.; Zhou, L.; Myneni, R.B. Surface urban heat island across 419 global big cities. Environ. Sci. Technol. 2012, 46, 696–703. [Google Scholar] [CrossRef] [PubMed]
- Clinton, N.; Gong, P. MODIS detected surface urban heat islands and sinks: Global locations and controls. Remote Sens. Environ. 2013, 134, 294–304. [Google Scholar] [CrossRef]
- Yuan, F.; Sawaya, K.E.; Loeffelholz, B.C.; Bauer, M.E. Land cover classification and change analysis of the Twin Cities (Minnesota) Metropolitan Area by multitemporal Landsat remote sensing. Remote Sens. Environ. 2005, 98, 317–328. [Google Scholar] [CrossRef]
- Cai, D.; Fraedrich, K.; Guan, Y.; Guo, S.; Zhang, C. Urbanization and the thermal environment of Chinese and US-American cities. Sci. Total Environ. 2017, 589, 200–211. [Google Scholar] [CrossRef]
- Coseo, P.; Larsen, L. How factors of land use/land cover, building configuration, and adjacent heat sources and sinks explain Urban Heat Islands in Chicago. Landsc. Urban Plan. 2014, 125, 117–129. [Google Scholar] [CrossRef]
- Liu, Y.; Li, L.; Chen, L.; Cheng, L.; Zhou, X.; Cui, Y.; Li, H.; Liu, W. Urban growth simulation in different scenarios using the SLEUTH model: A case study of Hefei, East China. PLoS ONE 2019, 14, e0224998. [Google Scholar] [CrossRef] [PubMed]
- Jiao, H.; Zhang, X.; Yang, C.; Cao, X. The characteristics of spatial expansion and driving forces of land urbanization in counties in central China: A case study of Feixi county in Hefei city. PLoS ONE 2021, 16, e0252331. [Google Scholar] [CrossRef]
- Gong, P.; Li, X.; Wang, J.; Bai, Y.; Chen, B.; Hu, T.; Liu, X.; Xu, B.; Yang, J.; Zhang, W.; et al. Annual maps of global artificial impervious area (GAIA) between 1985 and 2018. Remote Sens. Environ. 2020, 236, 111510. [Google Scholar] [CrossRef]
- Holben, B.N. Characteristics of maximum-value composite images from temporal AVHRR data. Int. J. Remote Sens. 1986, 7, 1417–1434. [Google Scholar] [CrossRef]
- Karabulut, M. An examination of relationships between vegetation and rainfall using maximum value composite AVHRR-NDVI data. Turk. J. Bot. 2003, 27, 93–101. [Google Scholar]
- Mildrexler, D.J.; Zhao, M.; Heinsch, F.A.; Running, S.W. A new satellite-based methodology for continental-scale disturbance detection. Ecol. Appl. 2007, 17, 235–250. [Google Scholar] [CrossRef]
- Sun, W.; Wang, P.X.; Zhang, S.Y.; Zhu, D.H.; Liu, J.M.; Chen, J.H.; Yang, H.S. Using the vegetation temperature condition index for time series drought occurrence monitoring in the Guanzhong Plain, PR China. Int. J. Remote Sens. 2008, 29, 5133–5144. [Google Scholar] [CrossRef]
- Zhao, S.; Zhou, D.; Zhu, C.; Qu, W.; Zhao, J.; Sun, Y.; Huang, D.; Wu, W.; Liu, S. Rates and patterns of urban expansion in China’s 32 major cities over the past three decades. Landsc. Ecol. 2015, 30, 1541–1559. [Google Scholar] [CrossRef]
- Gong, P.; Li, X.; Zhang, W. 40-Year (1978–2017) human settlement changes in China reflected by impervious surfaces from satellite remote sensing. Sci. Bull. 2019, 64, 756–763. [Google Scholar] [CrossRef]
- Men, B.; Wu, Z.; Liu, H.; Tian, W.; Zhao, Y. Spatio-temporal Analysis of Precipitation and Temperature: A Case Study Over the Beijing–Tianjin–Hebei Region, China. Pure Appl. Geophys. 2020, 177, 3527–3541. [Google Scholar] [CrossRef]
- Lewis, F.; Butler, A.; Gilbert, L. A unified approach to model selection using the likelihood ratio test. Methods Ecol. Evol. 2011, 2, 155–162. [Google Scholar] [CrossRef]
- Chernick, M.R.; González-Manteiga, W.; Crujeiras, R.M.; Barrios, E.B. Bootstrap Methods; Springer: Berlin/Heidelberg, Germany, 2011. [Google Scholar]
- Brown, C.E. Coefficient of variation. In Applied Multivariate Statistics in Geohydrology and Related Sciences; Springer: Berlin/Heidelberg, Germany, 1998; pp. 155–157. [Google Scholar]
- Hu, D.; Meng, Q.; Zhang, L.; Zhang, Y. Spatial quantitative analysis of the potential driving factors of land surface temperature in different “Centers” of polycentric cities: A case study in Tianjin, China. Sci. Total Environ. 2020, 706, 135244. [Google Scholar] [CrossRef]
- Meng, Q.; Zhang, L.; Sun, Z.; Meng, F.; Wang, L.; Sun, Y. Characterizing spatial and temporal trends of surface urban heat island effect in an urban main built-up area: A 12-year case study in Beijing, China. Remote Sens. Environ. 2018, 204, 826–837. [Google Scholar] [CrossRef]
- van Hove, L.W.A.; Jacobs, C.M.J.; Heusinkveld, B.G.; Elbers, J.A.; van Driel, B.L.; Holtslag, A.A.M. Temporal and spatial variability of urban heat island and thermal comfort within the Rotterdam agglomeration. Build. Environ. 2015, 83, 91–103. [Google Scholar] [CrossRef]
- Mumtaz, F.; Li, J.; Liu, Q.; Arshad, A.; Dong, Y.; Liu, C.; Zhao, J.; Bashir, B.; Gu, C.; Wang, X. Spatio-temporal dynamics of land use transitions associated with human activities over Eurasian Steppe: Evidence from improved residual analysis. Sci. Total Environ. 2023, 905, 166940. [Google Scholar] [CrossRef]
- Wang, X.; Zhou, T.; Tao, F.; Zang, F. Correlation analysis between UBD and LST in Hefei, China, using Luojia1-01 night-time light imagery. Appl. Sci. 2019, 9, 5224. [Google Scholar] [CrossRef]
- Nganyiyimana, J.; Ngarambe, J.; Yun, G.Y. Nighttime light: A potential proxy for local nocturnal urban heat island intensity in seoul. J. Green Build. 2023, 18, 29–41. [Google Scholar] [CrossRef]
- Cai, Z.; Tang, Y.; Zhan, Q. A cooled city? Comparing human activity changes on the impact of urban thermal environment before and after city-wide lockdown. Build. Environ. 2021, 195, 107729. [Google Scholar] [CrossRef]
- Kammuang-Lue, N.; Sakulchangsatjatai, P.; Sangnum, P.; Terdtoon, P. Influences of population, building, and traffic densities on urban heat island intensity in Chiang Mai City, Thailand. Therm. Sci. 2015, 19, 445–455. [Google Scholar] [CrossRef]
- Al-Mohannadi, M.S. Motorized Transportation and the UHI Effect in Doha: The Impact of Traffic on the Heat Island Effect. Ph.D. Dissertation, Qatar University, Doha, Qatar, 2017. [Google Scholar]
- Zhao, Z.; Sharifi, A.; Dong, X.; Shen, L.; He, B.-J. Spatial variability and temporal heterogeneity of surface urban heat island patterns and the suitability of local climate zones for land surface temperature characterization. Remote Sens. 2021, 13, 4338. [Google Scholar] [CrossRef]
- Yang, X.; Li, Y. The impact of building density and building height heterogeneity on average urban albedo and street surface temperature. Build. Environ. 2015, 90, 146–156. [Google Scholar] [CrossRef]
- Odunuga, S.; Badru, G. Landcover change, land surface temperature, surface albedo and topography in the Plateau Region of North-Central Nigeria. Land 2015, 4, 300–324. [Google Scholar] [CrossRef]
- Bonafoni, S.; Baldinelli, G.; Rotili, A.; Verducci, P. Albedo and surface temperature relation in urban areas: Analysis with different sensors. In Proceedings of the 2017 Joint Urban Remote Sensing Event (JURSE), Dubai, United Arab Emirates, 6–8 March 2017; pp. 1–4. [Google Scholar]
- Li, T.; Yu, B.; Hu, Z.; Chen, Z. Numerical simulation on impact of building density on urban heat island with an urban porous media model. Hsi-Chiao Tung Ta Hsueh/J. Xi’an Jiaotong Univ. 2012, 46, 134–138. [Google Scholar]
- Zheng, Z.; Zhou, W.; Yan, J.; Qian, Y.; Wang, J.; Li, W. The higher, the cooler? Effects of building height on land surface temperatures in residential areas of Beijing. Phys. Chem. Earth Parts A/B/C 2019, 110, 149–156. [Google Scholar] [CrossRef]
- Yu, W.; Yang, J.; Cong, N.; Ren, J.; Yu, H.; Xiao, X.; Xia, J. Attribution of urban diurnal thermal environmental change: Importance of global–local effects. IEEE J. Sel. Top. Appl. Earth Obs. Remote Sens. 2023, 16, 8087–8101. [Google Scholar] [CrossRef]
- Buyantuyev, A.; Wu, J. Urban heat islands and landscape heterogeneity: Linking spatiotemporal variations in surface temperatures to land-cover and socioeconomic patterns. Landsc. Ecol. 2010, 25, 17–33. [Google Scholar] [CrossRef]
- Estoque, R.C.; Murayama, Y.; Myint, S.W. Effects of landscape composition and pattern on land surface temperature: An urban heat island study in the megacities of Southeast Asia. Sci. Total Environ. 2017, 577, 349–359. [Google Scholar] [CrossRef] [PubMed]
- Thomaz, S.M.; Agostinho, A.A.; Gomes, L.C.; Silveira, M.J.; Rejmanek, M.; Aslan, C.E.; Chow, E. Using space-for-time substitution and time sequence approaches in invasion ecology. Freshw. Biol. 2012, 57, 2401–2410. [Google Scholar] [CrossRef]
- Damgaard, C. A critique of the space-for-time substitution practice in community ecology. Trends Ecol. Evol. 2019, 34, 416–421. [Google Scholar] [CrossRef]
- Blois, J.L.; Williams, J.W.; Fitzpatrick, M.C.; Jackson, S.T.; Ferrier, S. Space can substitute for time in predicting climate-change effects on biodiversity. Proc. Natl. Acad. Sci. USA 2013, 110, 9374–9379. [Google Scholar] [CrossRef]
- Wogan, G.O.; Wang, I.J. The value of space-for-time substitution for studying fine-scale microevolutionary processes. Ecography 2018, 41, 1456–1468. [Google Scholar] [CrossRef]
- Julien, Y.; Sobrino, J.A.; Mattar, C.; Ruescas, A.B.; Jimenez-Munoz, J.C.; Soria, G.; Hidalgo, V.; Atitar, M.; Franch, B.; Cuenca, J. Temporal analysis of normalized difference vegetation index (NDVI) and land surface temperature (LST) parameters to detect changes in the Iberian land cover between 1981 and 2001. Int. J. Remote Sens. 2011, 32, 2057–2068. [Google Scholar] [CrossRef]
- Marzban, F.; Sodoudi, S.; Preusker, R. The influence of land-cover type on the relationship between NDVI–LST and LST-T air. Int. J. Remote Sens. 2018, 39, 1377–1398. [Google Scholar] [CrossRef]
- Fatemi, M.; Narangifard, M. Monitoring LULC changes and its impact on the LST and NDVI in District 1 of Shiraz City. Arab. J. Geosci. 2019, 12, 127. [Google Scholar] [CrossRef]
- Fabeku, B.B.; Balogun, I.A.; Adegboyega, S.A.-A.; Faleyimu, O.I. Spatio-temporal variability in land surface temperature and its relationship with vegetation types over Ibadan, south-western Nigeria. Atmos. Clim. Sci. 2018, 8, 318–336. [Google Scholar] [CrossRef]
Figure 1.
Maps showing the location of Anhui Province in China (a); Hefei, the capital of Anhui Province (b); the spatial distribution of built-up age in 2018 in the study area (c). The largest polygon with the blackline boundary in (c) is the main urban area, and gray means natural areas.
Figure 1.
Maps showing the location of Anhui Province in China (a); Hefei, the capital of Anhui Province (b); the spatial distribution of built-up age in 2018 in the study area (c). The largest polygon with the blackline boundary in (c) is the main urban area, and gray means natural areas.
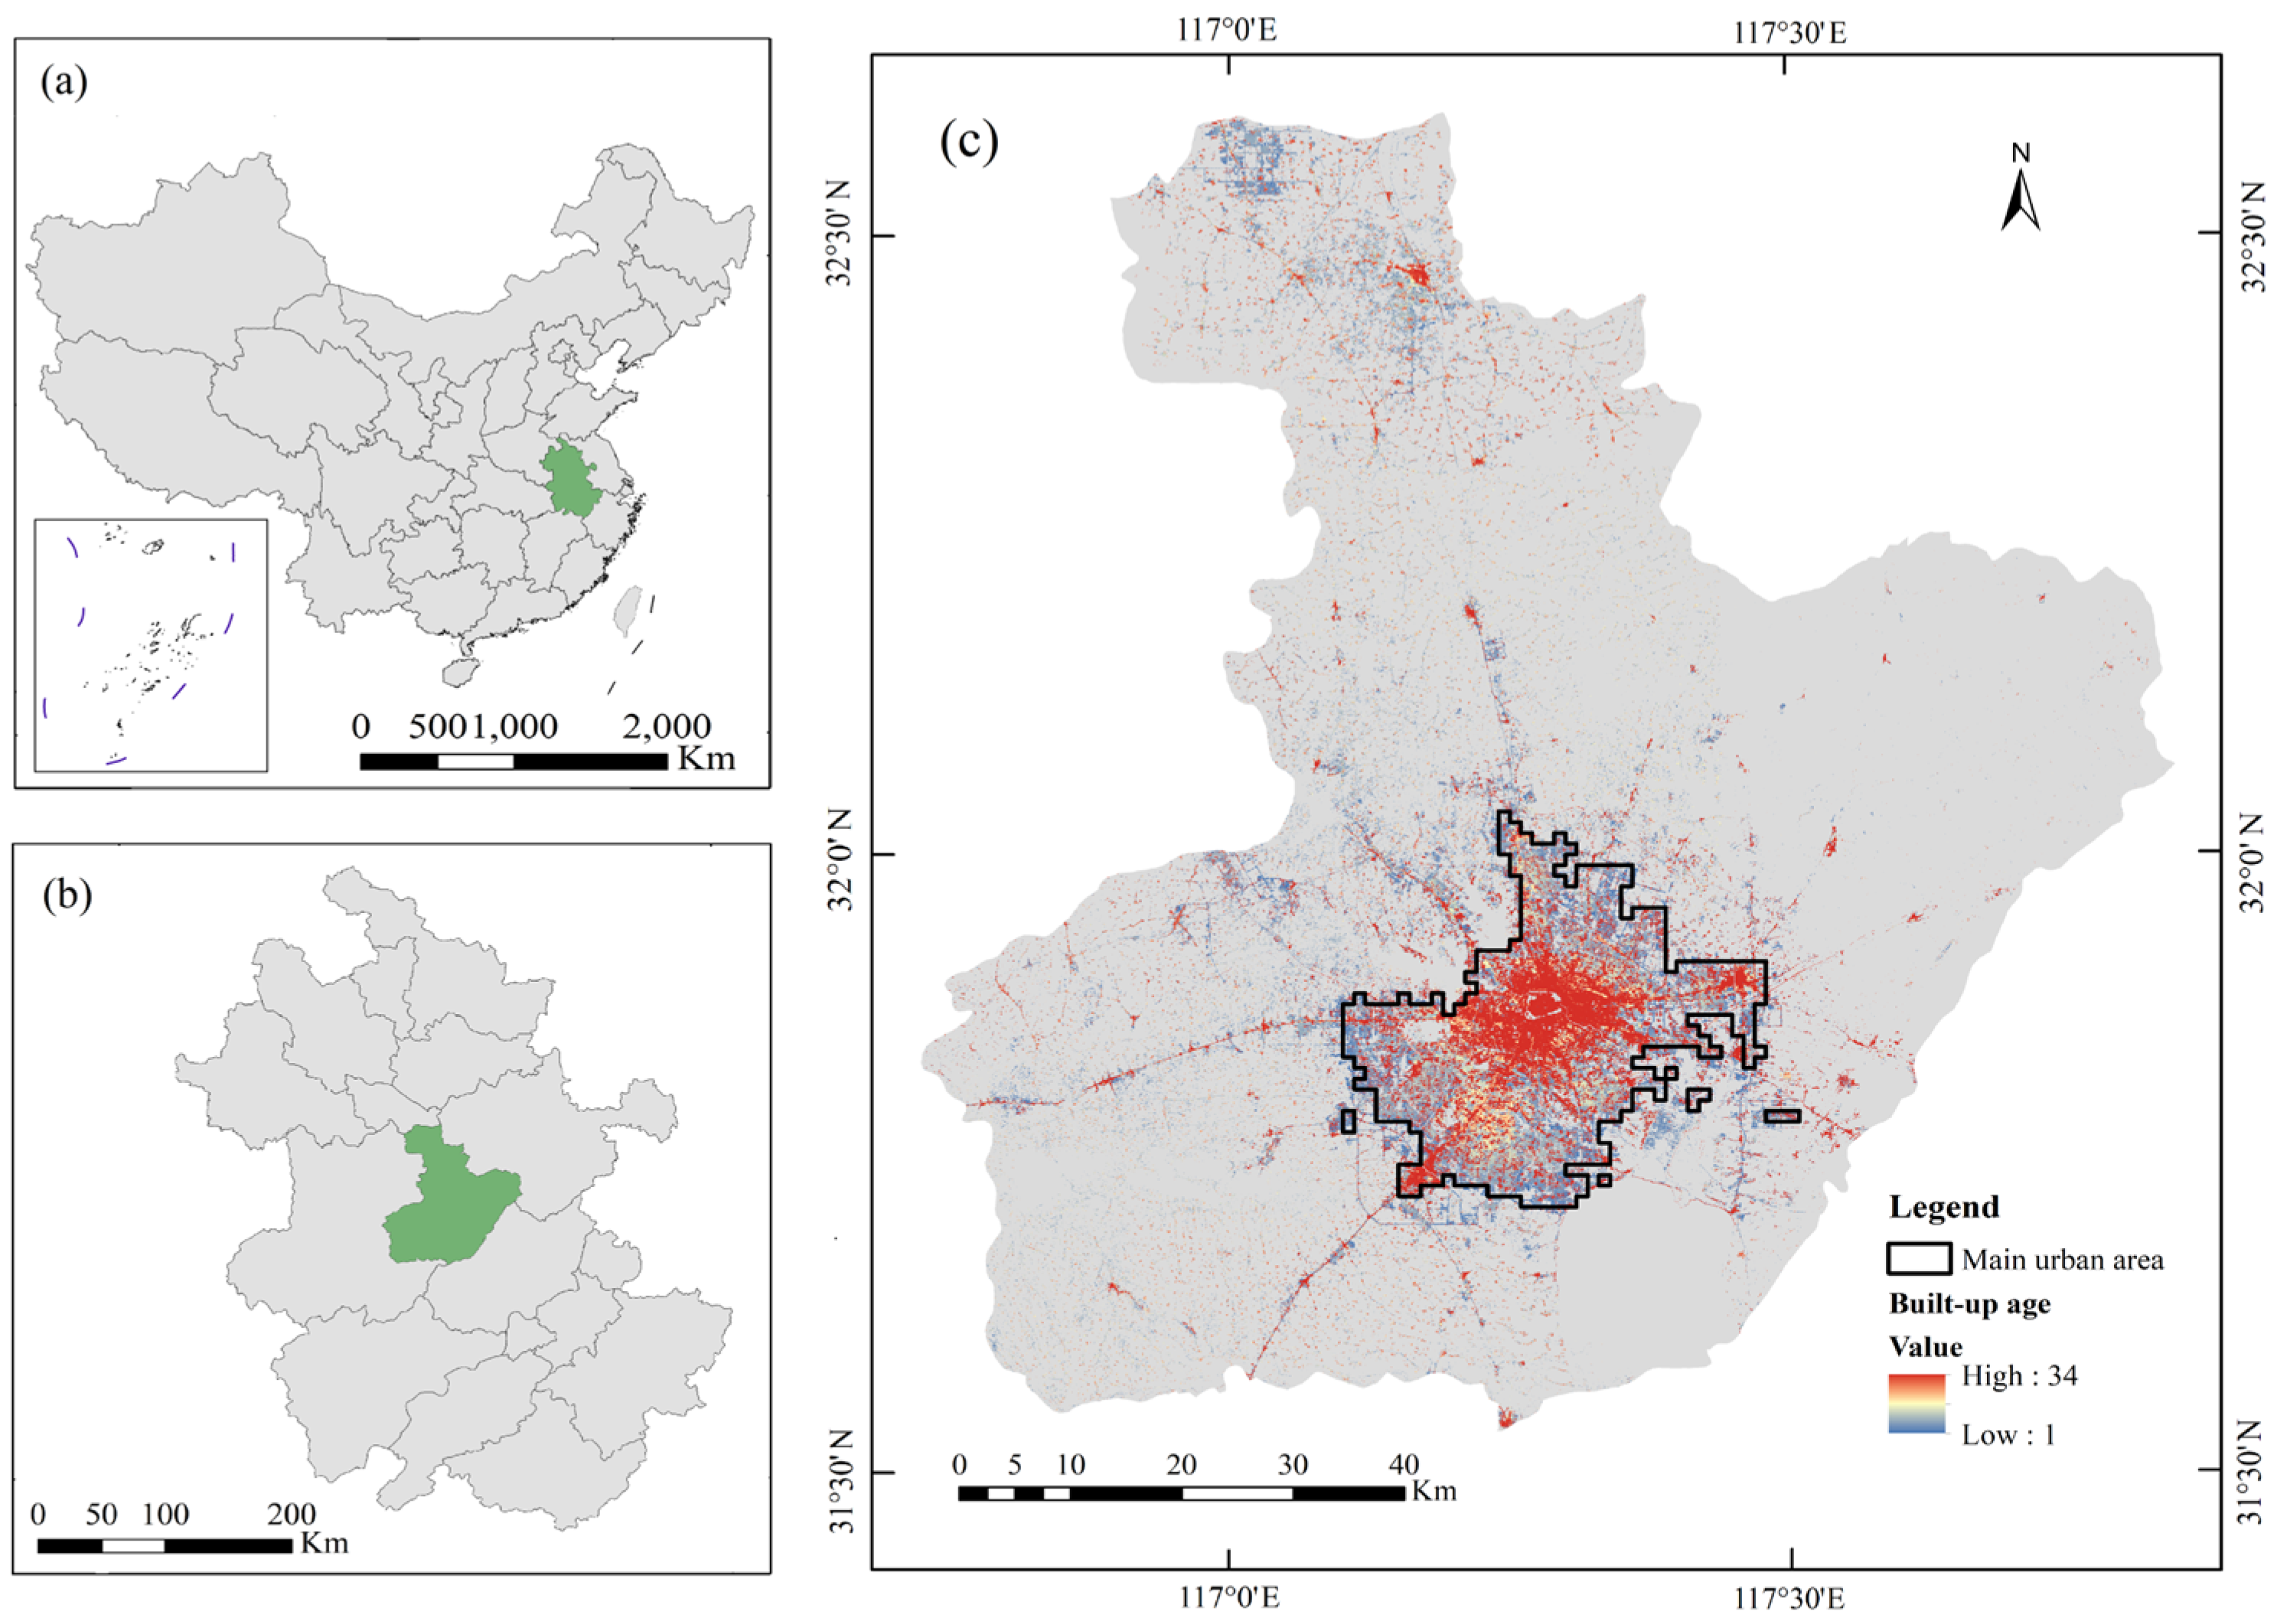
Figure 2.
Methodology flow chart.

Figure 3.
The annual urban expansions in area and the proportion of age cohorts (a) and urban expansion rate (b) from 1985 to 2018 in the main urban area and the entire administrative regions. It can be seen that the annually expanded urban areas effectively depict the frequency distribution of built-up age cohorts.
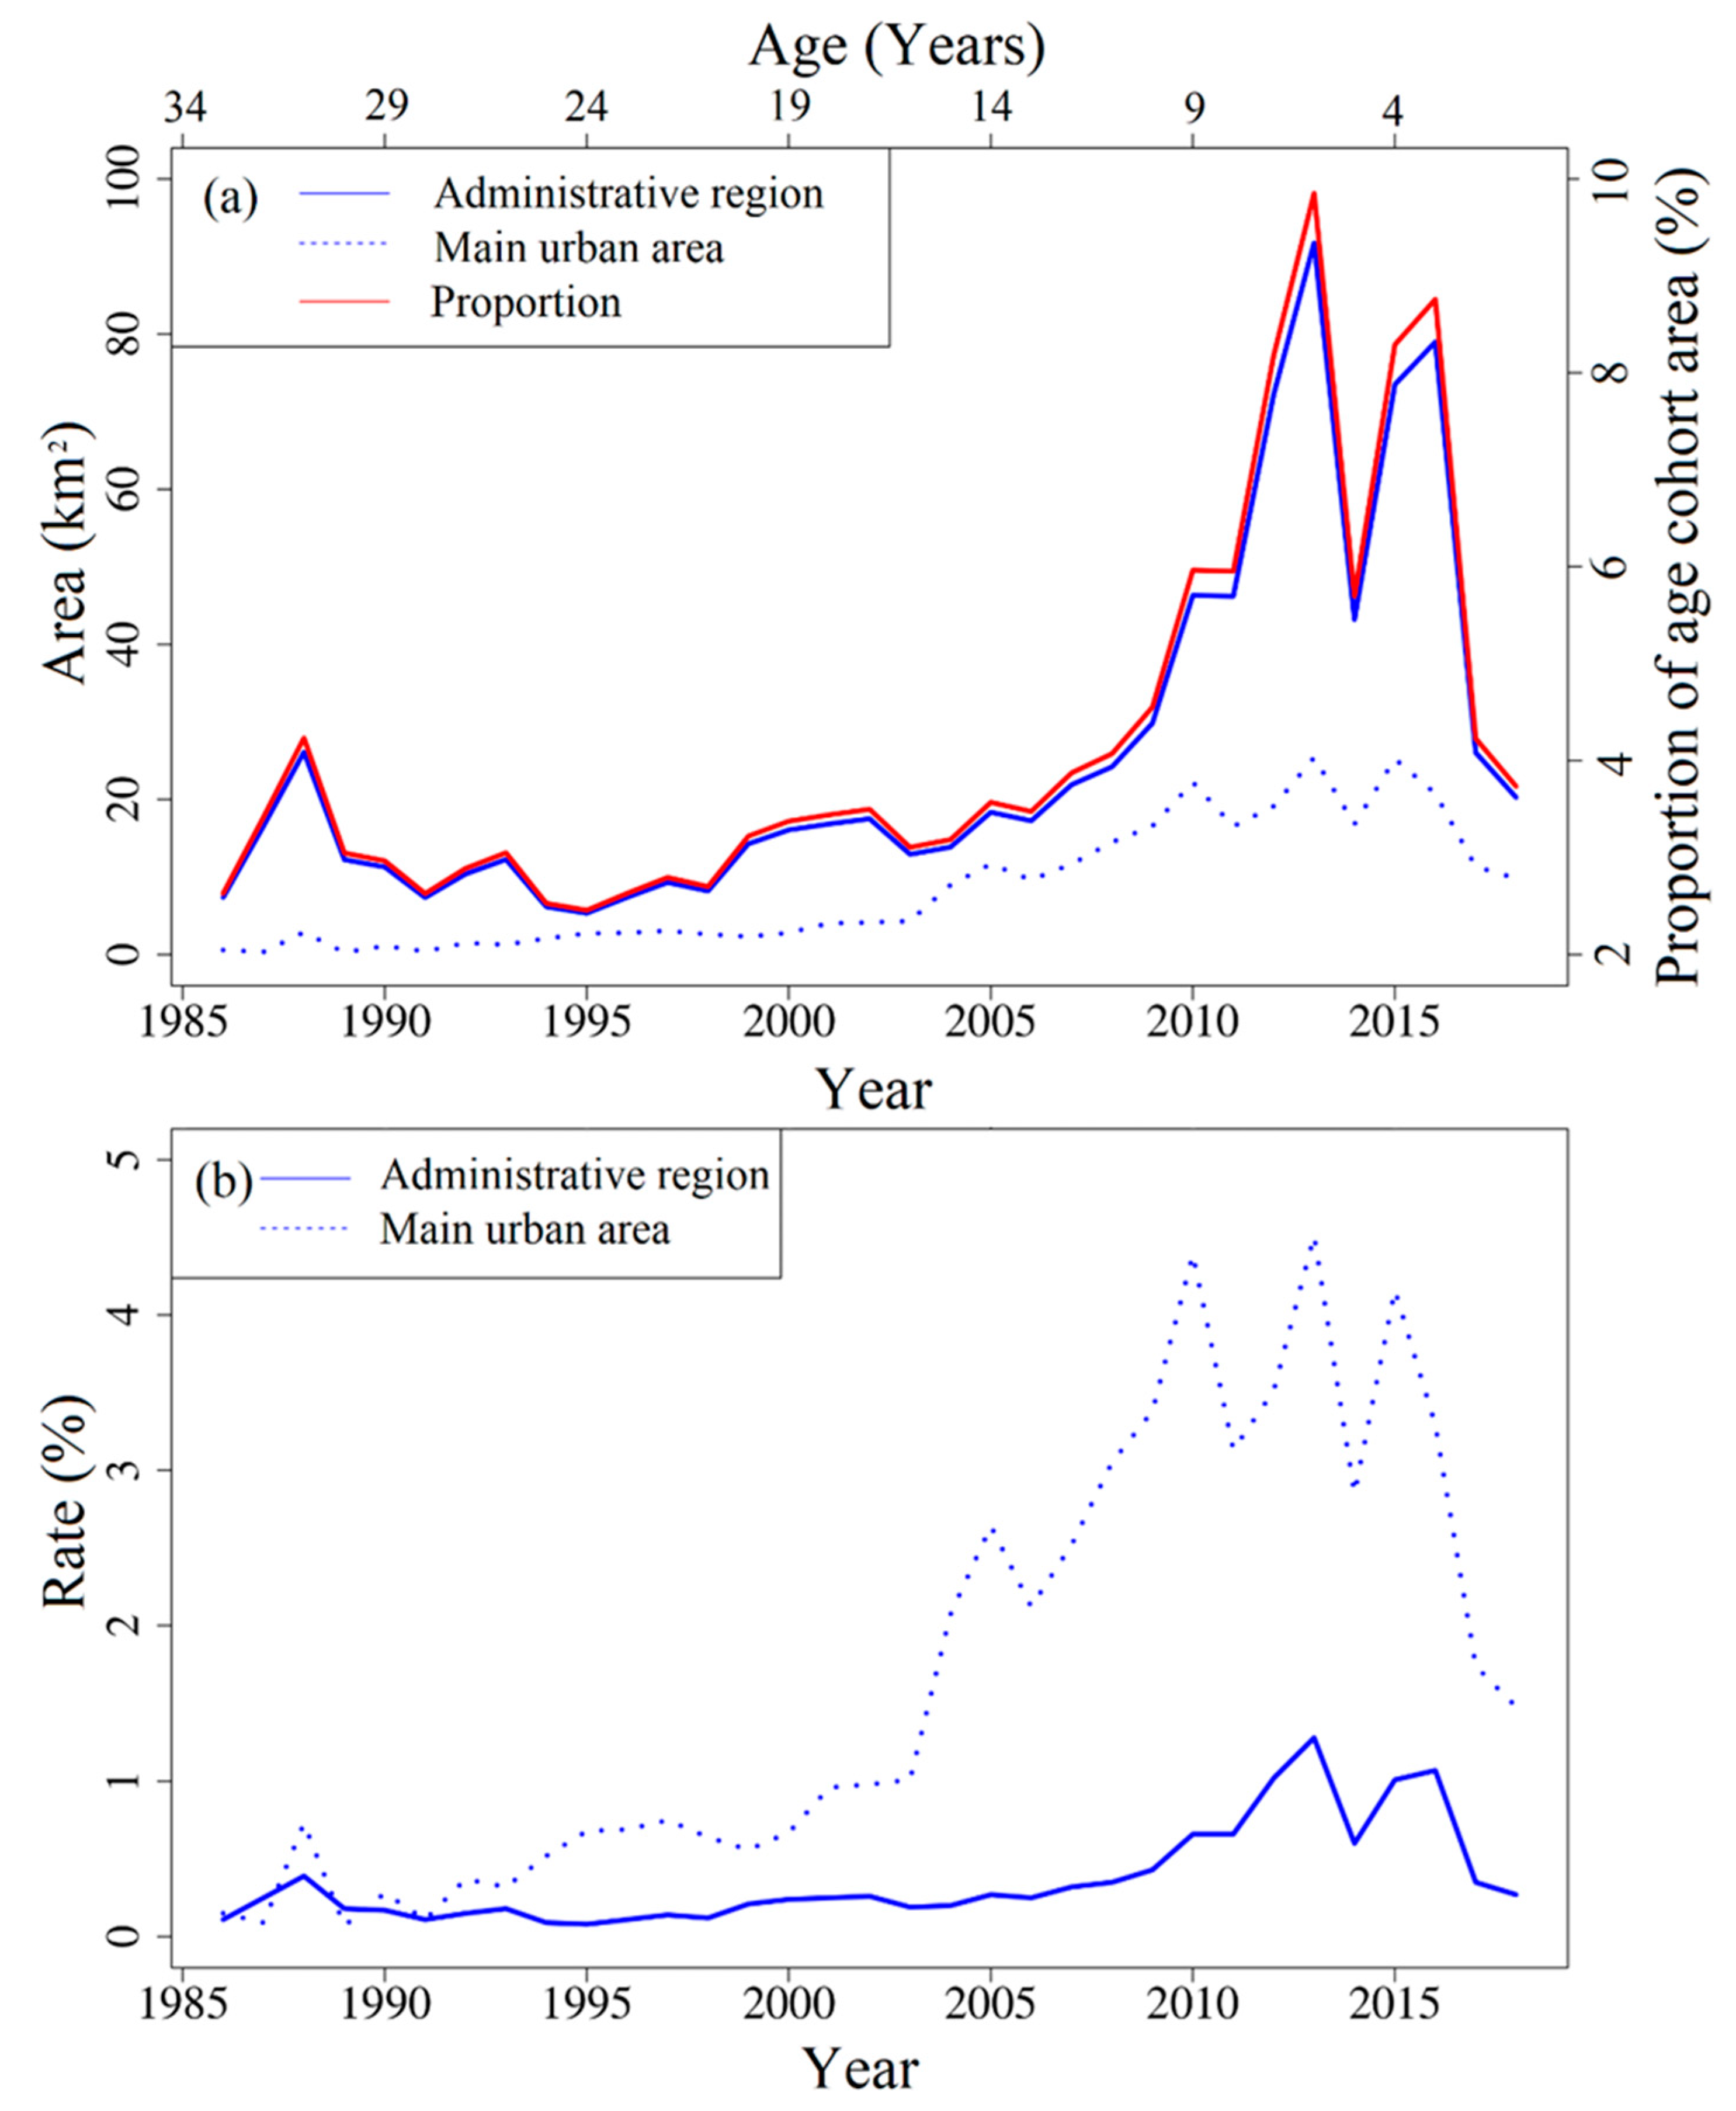
Figure 4.
The change of LST anomalies along a chronosequence of built-up age cohorts. An age cohort is defined as all the new built-up pixels appearing in a year. The vertical red line and blue line show age cohorts 22 and 28, respectively, with the highest and lowest LST anomalies consistently across all years.

Figure 5.
The linear regressions between LST anomalies and the anomalies of driving variables for built-up age cohorts.
Figure 5.
The linear regressions between LST anomalies and the anomalies of driving variables for built-up age cohorts.
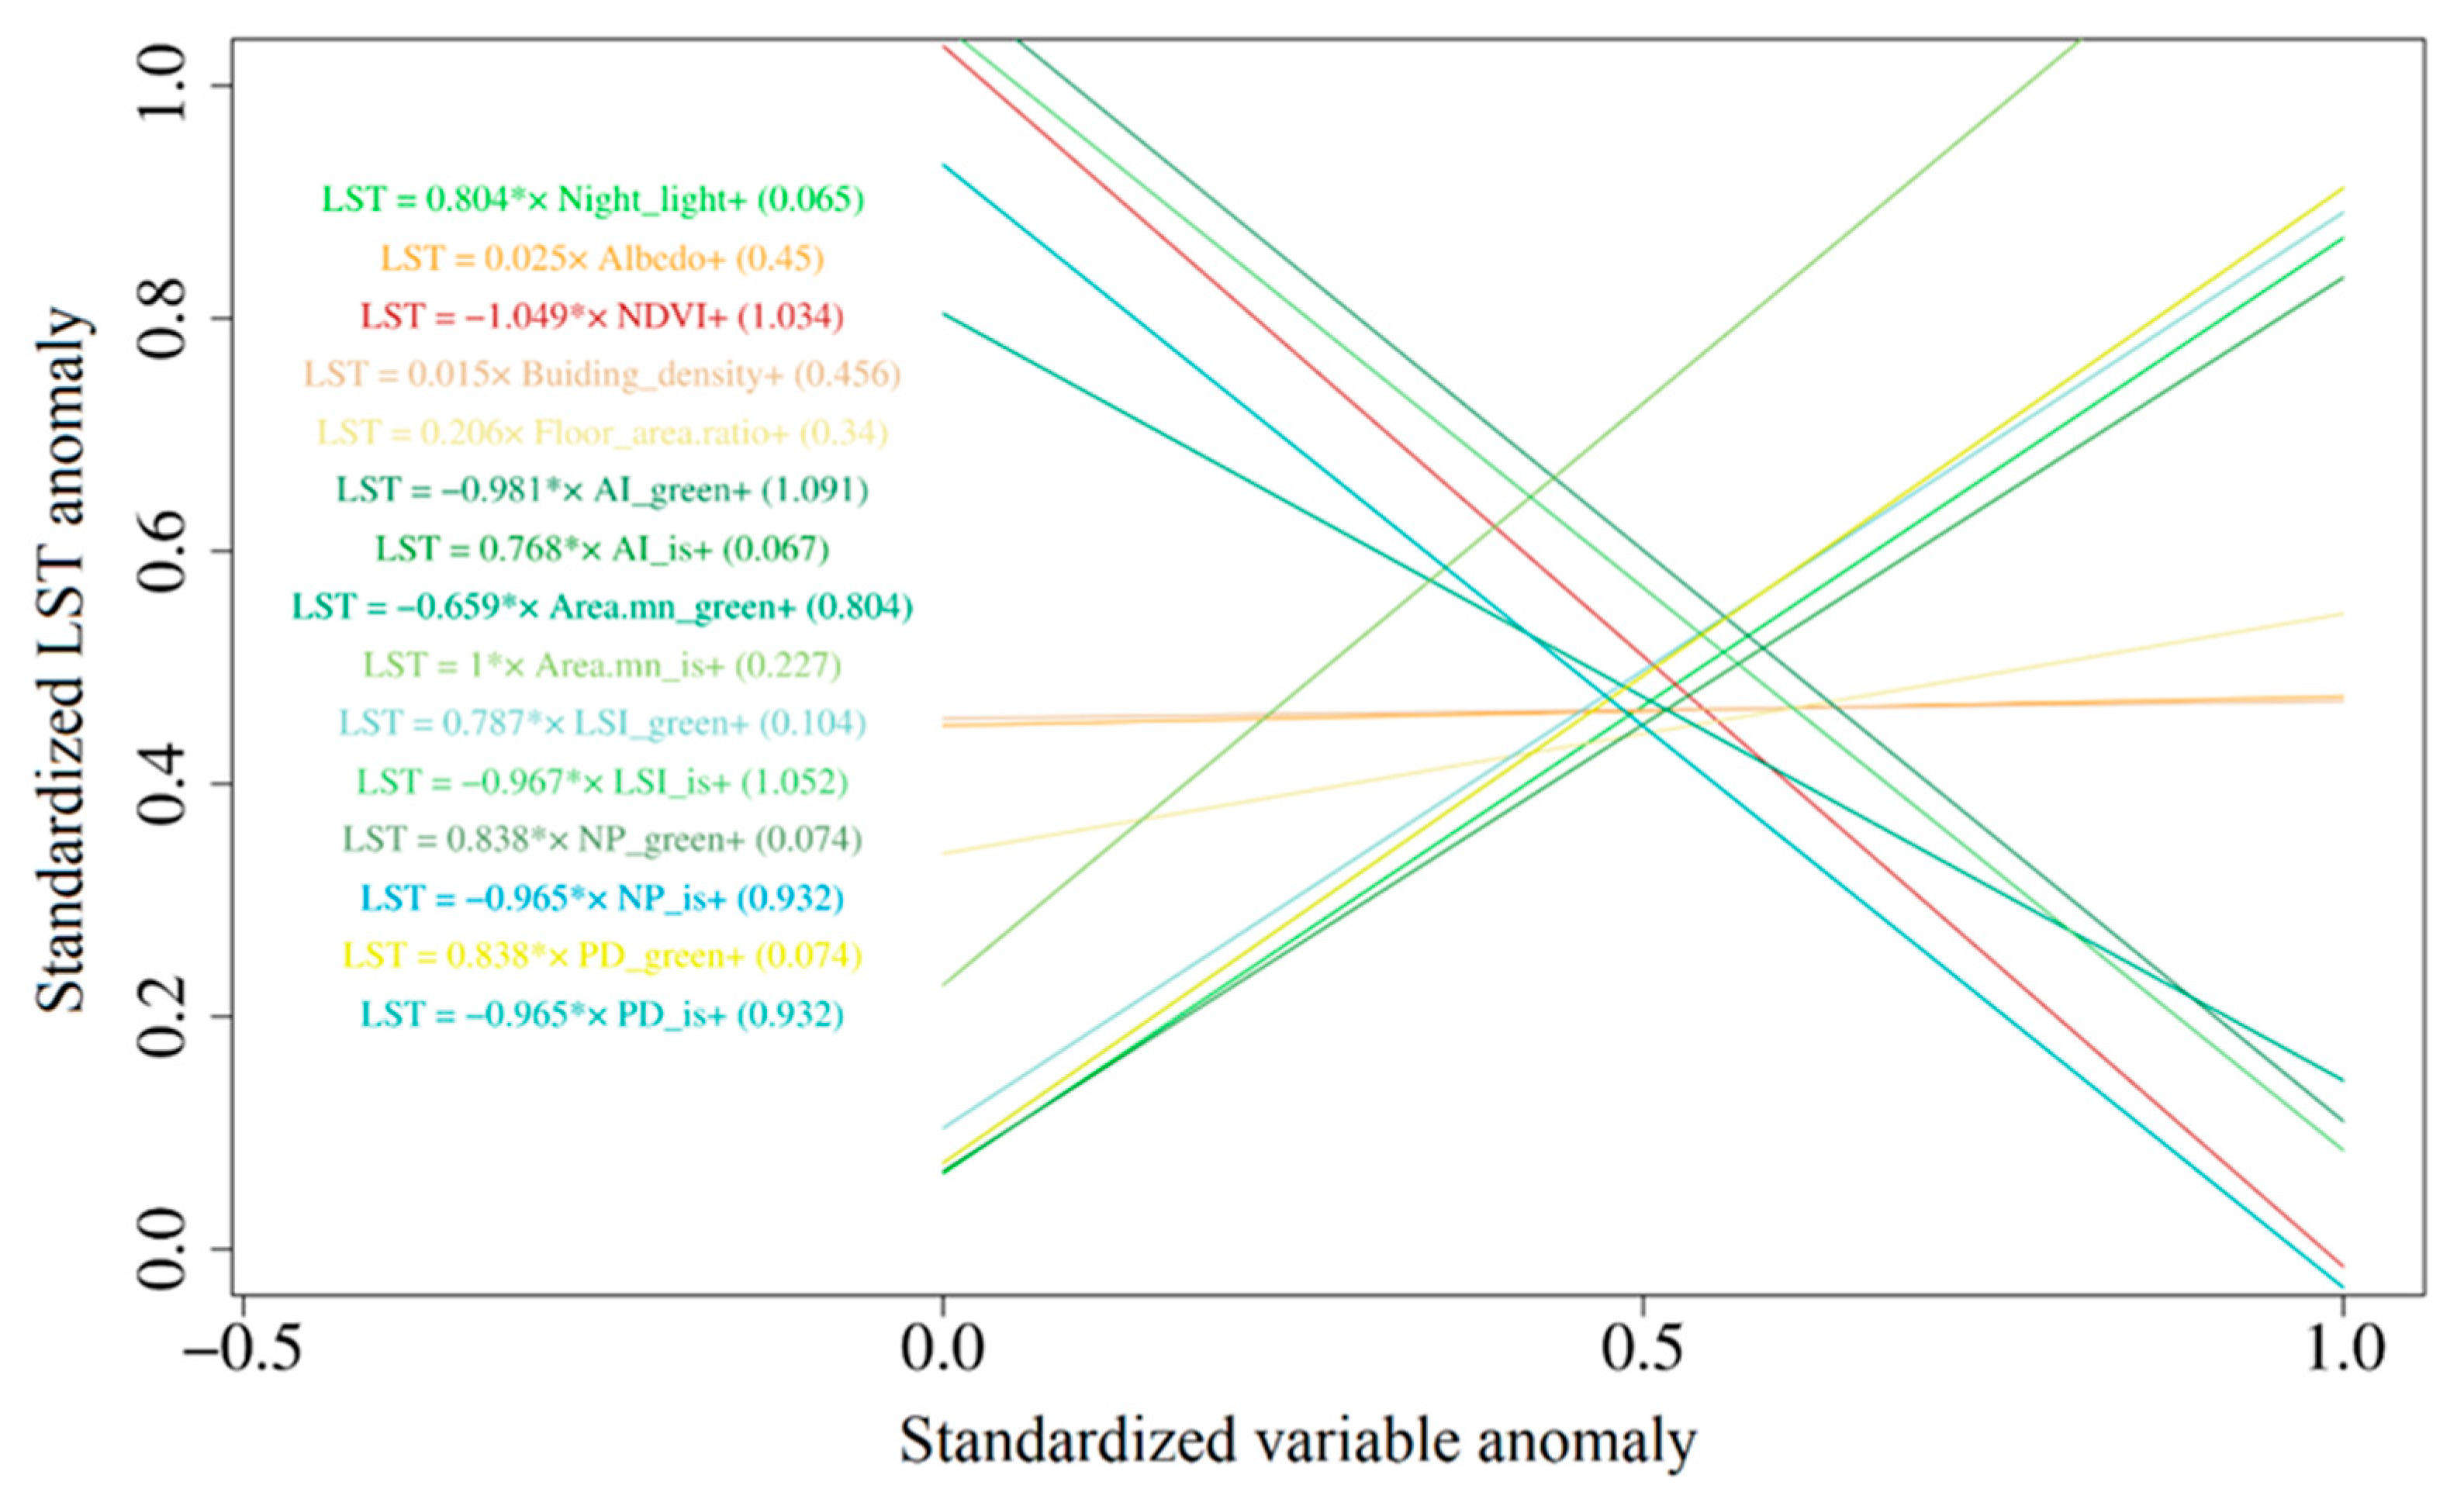
Figure 6.
The change of LST sensitivity to UDI (a), NDVI sensitivity to UDI (b), and Albedo sensitivity to UDI (c) from 2000–2019. Sensitivity is defined as the slope of the linear regression between variables and UDI.
Figure 6.
The change of LST sensitivity to UDI (a), NDVI sensitivity to UDI (b), and Albedo sensitivity to UDI (c) from 2000–2019. Sensitivity is defined as the slope of the linear regression between variables and UDI.
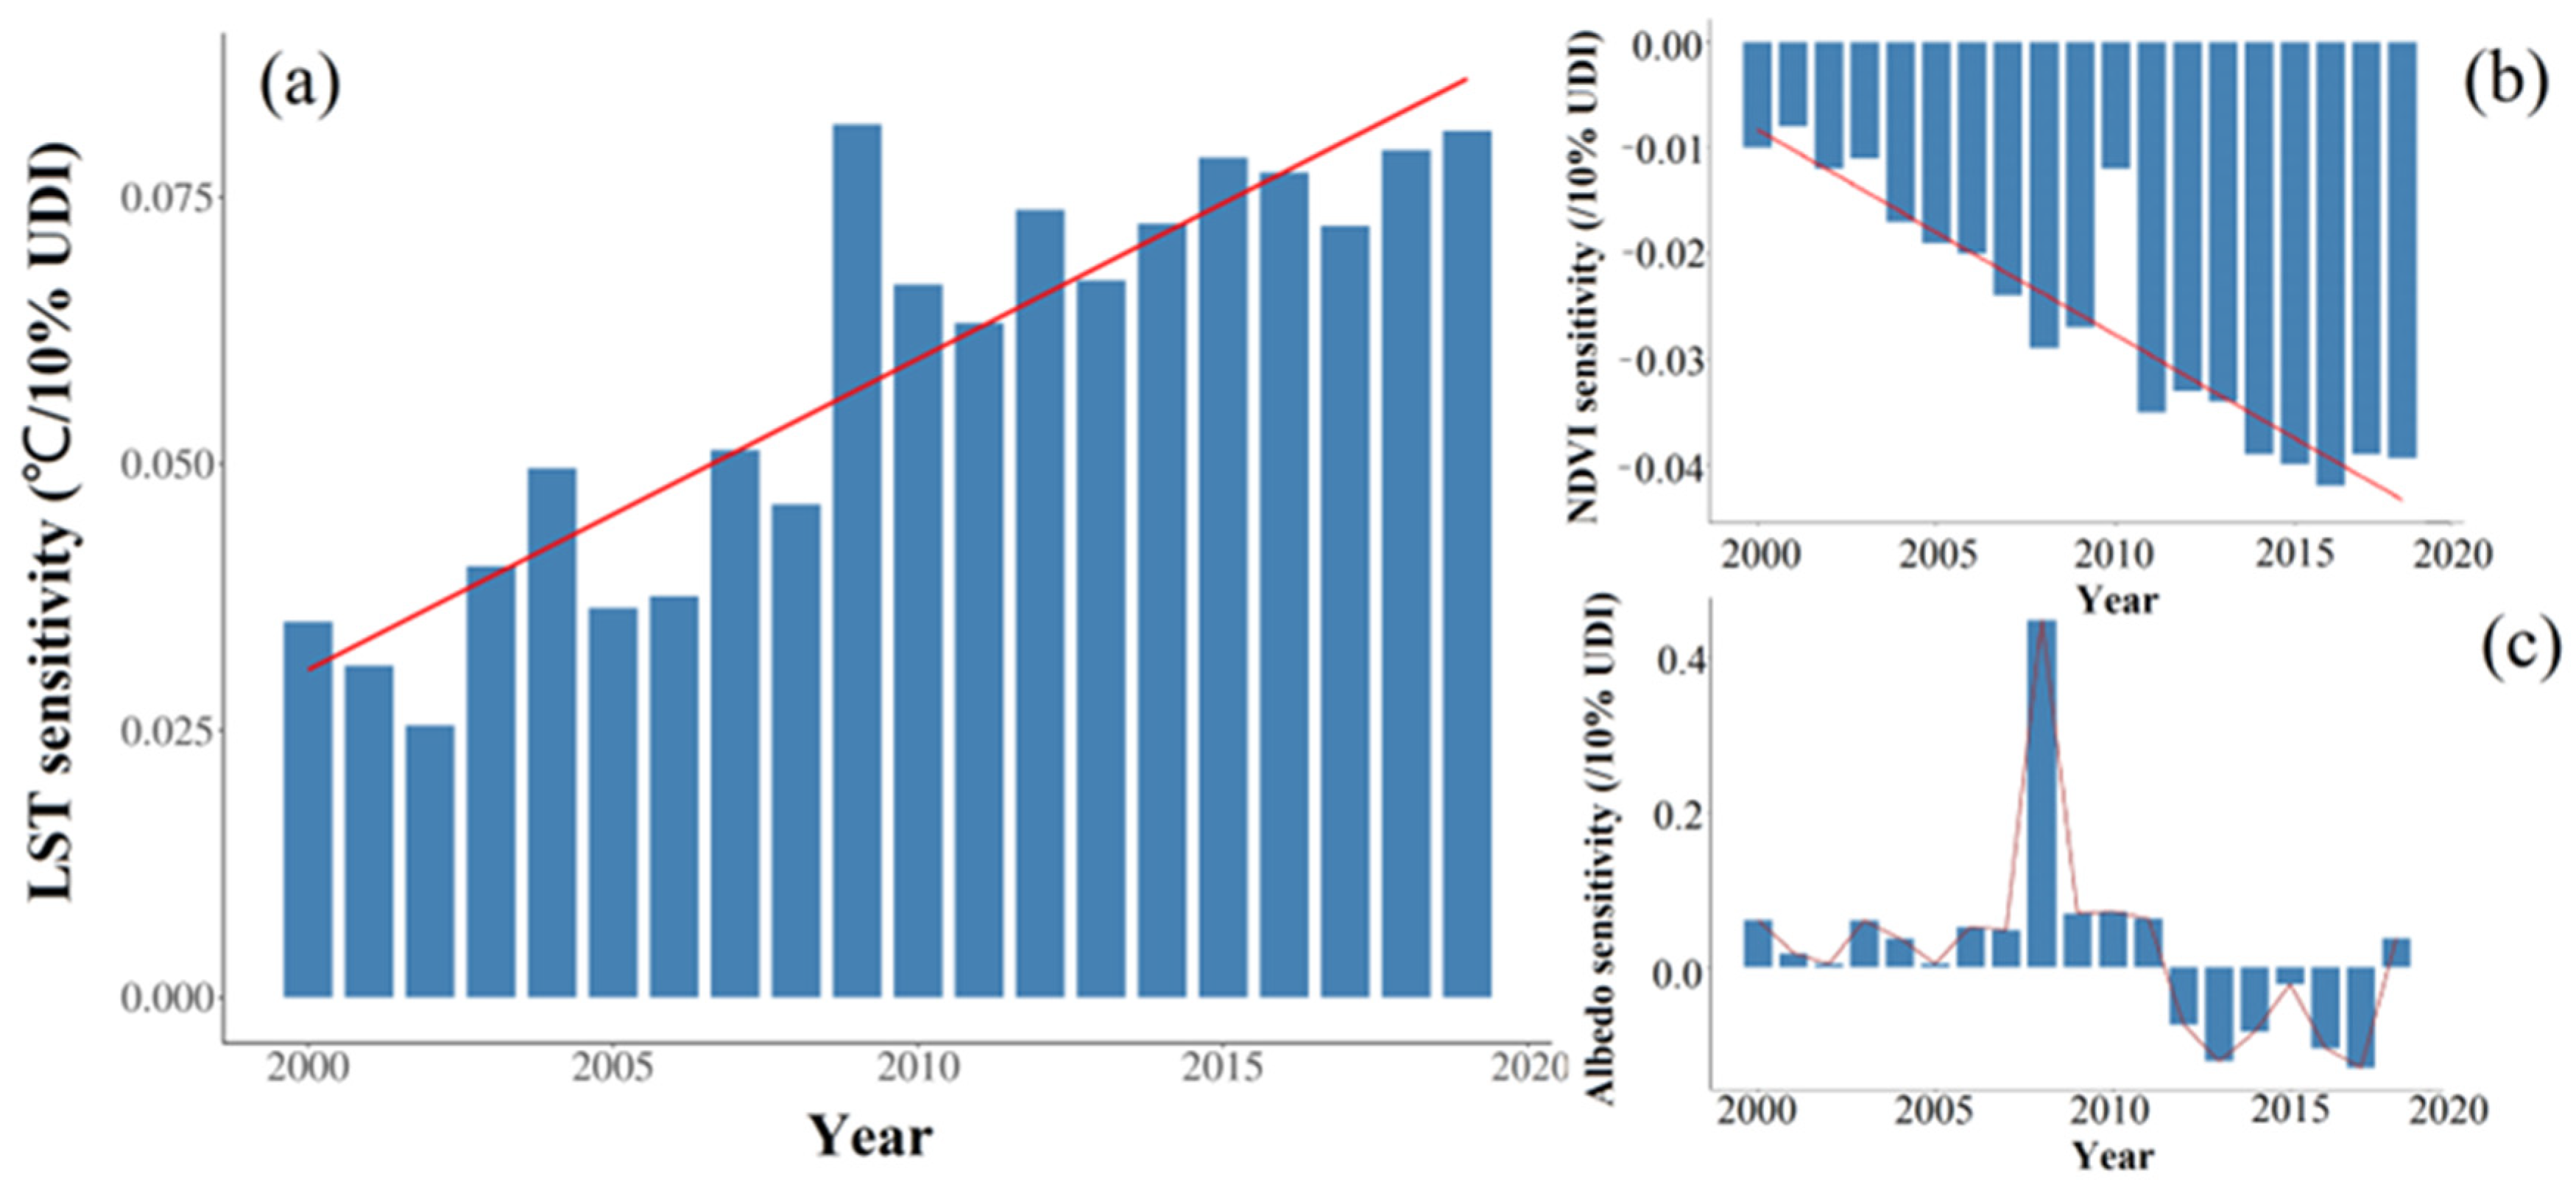
Table 1.
Characteristics of the data used in this study.
| Dataset | Spatial Resolution | Year | Pre-Processing | Purpose |
|---|---|---|---|---|
| Aqua MODIS 8-day composite products LST | 1 km | 2000–2019 | MVC, Mosaic | To calculate the annual maximum LST from 2000 to 2019 |
| Global artificial Impervious surface | 30 m | 1985–2018 | Reclassify, Resample, Mosaic | To calculate the built-up age and UDI |
| Land Use/cover | 30 m | 2017 | Resample, Mosaic | To extract the main urban area and calculate the landscape metrics |
| DMSP/OLS Night light | 1 km | 2000–2013 | Resample, Mosaic | To conduct attribution analysis |
| VIIRS Night light | 500 m | 2013–2018 | Resample, Mosaic | To conduct attribution analysis |
| Landsat Thematic Mapper (TM) and Enhanced Thematic Mapper Plus (ETM+) images | 30 m | 2018 | Interpolation, Atmospheric Correction, De-cloud, Band Data Scaling | To calculate NDVI |
| MODIS MCD43A4 | 500 m | 2018 | Resample, Mosaic | To conduct attribution analysis |
Disclaimer/Publisher’s Note: The statements, opinions and data contained in all publications are solely those of the individual author(s) and contributor(s) and not of MDPI and/or the editor(s). MDPI and/or the editor(s) disclaim responsibility for any injury to people or property resulting from any ideas, methods, instructions or products referred to in the content. |
© 2024 by the authors. Licensee MDPI, Basel, Switzerland. This article is an open access article distributed under the terms and conditions of the Creative Commons Attribution (CC BY) license (https://creativecommons.org/licenses/by/4.0/).
Share and Cite
MDPI and ACS Style
Li, Y.; Liu, S.; Liu, M.; Guo, R.; Shi, Y.; Peng, X.; Feng, S. Evolution and Built-Up Age Dependency of Urban Thermal Environment. Remote Sens. 2024, 16, 1495. https://doi.org/10.3390/rs16091495
AMA Style
Li Y, Liu S, Liu M, Guo R, Shi Y, Peng X, Feng S. Evolution and Built-Up Age Dependency of Urban Thermal Environment. Remote Sensing. 2024; 16(9):1495. https://doi.org/10.3390/rs16091495
Chicago/Turabian StyleLi, Yuanyuan, Shuguang Liu, Maochou Liu, Rui Guo, Yi Shi, Xi Peng, and Shuailong Feng. 2024. "Evolution and Built-Up Age Dependency of Urban Thermal Environment" Remote Sensing 16, no. 9: 1495. https://doi.org/10.3390/rs16091495
Note that from the first issue of 2016, this journal uses article numbers instead of page numbers. See further details here.