

Study on the Impact of Urban Morphologies on Urban Canopy Heat Islands Based on Relocated Meteorological Stations


1
School of Mathematics and Computer Science, Tongling University, Tongling 244000, China
2
School of Atmospheric Physics, Nanjing University of Information Science and Technology, Nanjing 210044, China
*
Author to whom correspondence should be addressed.
Remote Sens. 2024, 16(9), 1500; https://doi.org/10.3390/rs16091500
Submission received: 5 April 2024
/
Revised: 18 April 2024
/
Accepted: 23 April 2024
/
Published: 24 April 2024
(This article belongs to the Special Issue Climate and Environmental Changes Monitored by Satellite Remote Sensing III)
Abstract
:This study addresses a crucial gap in understanding the impact of urban morphologies on the canopy urban heat islands (CUHI) effect. The selection of reference stations lacks a unified standard, and their surface air temperature (SAT) sequences are also inevitably influenced by urbanization. However, synchronous observational data from relocated meteorological stations could provide high-quality sample data for studying CUHI. Utilizing remote sensing techniques, the findings of this paper revealed that the observation environment of stations after relocation exhibited remarkable representativeness, with their observation sequences accurately reflecting the local climatic background. The differences in synchronized observation sequences could characterize the CUHI intensity (CUHII). Among the various factors, land use parameters and landscape parameters played particularly significant roles. Furthermore, the fitting performance of the random forest (RF) model for both training and testing data was significantly superior to that of the linear model and support vector regression (SVR) model. Additionally, the influence of local circulation on CUHI could not be overlooked. The mechanisms by which urban morphologies affect CUHII under different circulation backgrounds deserve further investigation.
1. Introduction
Over the past century, the remarkable expansion of urban areas and unprecedented population growth have resulted in annual increments of anthropogenic heat emissions, giving rise to pronounced urban heat islands (UHI) effects [1,2]. The UHI phenomenon occurs when urban temperatures surpass those in surrounding suburban and rural areas, primarily due to altered urban underlying surface characteristics and anthropogenic heat emissions [3,4,5]. The canopy urban heat islands (CUHI) specifically refers to the temperature difference between urban and rural air, extending from the ground level to the rooftops of urban buildings [6]. This phenomenon has significant implications for human welfare, as it directly or indirectly impacts human comfort and health, energy consumption, urban flooding and waterlogging, wildlife activities, air quality, urban infrastructure, and financial losses, among others [7,8,9]. Given its far-reaching consequences, the study of CUHI and its influencing factors is crucial for effective urban planning and climate adaptation strategies.
Weather stations around the globe measure air temperature for the station-point locations that were used for generating these gridded datasets [10]. Limited by the number of sites [11], the generation of these datasets is based on the unweighted averaging of the station/location-specific temperature changes [12]. However, compared to land surface temperature, air temperature has a more direct impact on human health and socio-economic activities. The CUHII is commonly defined as the difference in near-surface temperature between urban and rural stations or regions. The classification of meteorological stations is typically based on various criteria, population [13,14,15], land cover/land use (LCLU) [16,17,18], and spatial location [19]. Using population as an example, Liu et al. [15] classified meteorological stations with a population of fewer than 40,000 as reference stations. However, Rogers et al. [13] defined reference stations as those located more than 2 km away from urban areas with a population of less than 10,000. In terms of land use criteria, Ren et al. [16] considered a station as a reference station if the area within a 2 km radius centered on the station had less than 33% artificial construction. Sun et al. [17] identified a rural site as one where the percentage of built-up land areas within 1–5 km and 7–78 km buffer zones was less than 3% and 15%, respectively.
Overall, there is currently no uniform standard for determining the reasonable threshold between urban stations and reference stations. Furthermore, due to the inevitable impact of urbanization on reference stations, it is challenging to find a purely rural reference station near an urban station. Therefore, the surface air temperature (SAT) sequence differences obtained in existing studies are minimal estimates [20,21]. Relocated stations are typically surrounded by vegetated areas such as open cropland, providing a representative meteorological observation environment. Their meteorological observation sequences can accurately reflect the local climate background [3,22], making them suitable as relatively pure rural comparison stations. Additionally, the “Specifications for Surface Meteorological Observations” mandates at least one year of synchronous observations between the new stations and old stations when relocating a national-level surface meteorological observation station. Therefore, the synchronous observations from relocated stations could provide high-quality sample data for studying CUHI.
There is now a widespread consensus that the spatial heterogeneity of urban areas and their infrastructure directly leads to the spatially inhomogeneous distribution of near-surface air temperature [23,24]. Compared to rural regions, urban surfaces exhibit lower albedo, which amplifies the CUHI effect by absorbing more solar radiation [25,26]. Furthermore, urban buildings increase surface roughness and decrease wind speed, making it difficult for urban heat to dissipate [27,28]. The type of urban surface, its spatial structure, and distribution pattern are crucial factors determining the thermal environment [29].
Scholars have begun to utilize remote sensing technology to conduct an investigation of the relationship between urban morphologies and CUHI. Shi et al. [30] evaluated the impact of urban morphologies around meteorological stations on SAT sequences by analyzing land use types within buffers surrounding these stations. Li et al. [31] quantitatively studied the relationship between different LCLU and the SAT sequences within station buffers using remote sensing data. However, most of these studies relied on indicators such as land surface temperature, land use and land cover, and normalized difference vegetation index, without fully considering the impact of spatial patterns and configurations of different LCLU on the CUHI. Additionally, Wang et al. [32] conducted a correlation analysis between obstacle information around stations and SAT sequences, revealing the influence of the urban morphologies on temperature SAT sequences, which is not a simple linear relationship. This suggests that linear statistical methods might not be sufficient to precisely quantify the relationship between urban morphologies and CUHI. In conclusion, there is a need to further explore the driving mechanisms of urban morphologies on CUHI.
Anhui Province is in the western part of the Yangtze River Delta region (YRD). The impact of urbanization has led to the frequent relocation of numerous stations in Anhui Province in recent years [33,34]. This provides an excellent opportunity to study the influence of urban morphologies on CUHI. This research focused on Anhui Province and selected meteorological stations with relocation histories. This paper focused on meteorological stations with relocation histories, employing remote sensing techniques and machine learning methods to explore the response characteristics of CUHII to urban morphological parameters. This work will enhance the understanding of the relationship between human activities and regional climate change.
2. Data and Methodology
2.1. Data
2.1.1. SAT Data
In Anhui Province, national-level meteorological observation stations have been established, including three national basic climate stations, national basic meteorological stations, and national general meteorological stations. The daily averaged SAT can be obtained by calculating the arithmetic mean of the multiple observed SAT values within a given day, which serves as a crucial metric for climate research.
2.1.2. Land Cover Data
Land cover plays a pivotal role in regulating the intricate processes of energy exchange, water cycling, and carbon sequestration across diverse regions of the Earth [35]. Over the past few decades, China has undergone significant changes in its land cover patterns, primarily driven by rapid economic development. To capture these changes and facilitate climate research, Wuhan University has released the annual China Land Cover Dataset (CLCD). This dataset, developed by Yang and Huang [36], represents a comprehensive compilation of land use information with a spatial resolution of 30 m. The CLCD is based on a vast collection of 335,709 Landsat images sourced from Google Earth Engine, ensuring a high degree of accuracy and reliability. The latest iteration of this dataset encompasses land cover information for China, spanning from 1985 to 2021. Moreover, the overall accuracy of land classification in the CLCD is reported to be 80%, indicating its high reliability and usefulness for climate research and related fields.
2.2. Methodology
2.2.1. Selection of Relocated Station Samples
The selection of research samples from relocated stations was based on historical records of relocations, investigations and assessment reports on the detection environment of meteorological stations, and high-resolution terrestrial satellite remote sensing imagery. The selection criteria adhered to the following principles:
- (1)
- Stations were relocated primarily due to significant deterioration of the detection environment, such as increased urbanization and industrial pollution. This relocation aimed to preserve the integrity and reliability of the meteorological data;
- (2)
- To minimize potential variations in climate conditions, the altitude differences between the original and new locations were strictly controlled to be less than 50 m. Additionally, the horizontal straight-line distance between the two locations did not exceed 20 km;
- (3)
- Terrain and landforms were carefully considered to ensure minimal significant differences between the original and new stations. Both locations were situated in similar geographical regions to maintain consistency in climatic characteristics;
- (4)
- To ensure comparability and continuity of the meteorological data, there were no changes in the type of observational instruments used at the new location.
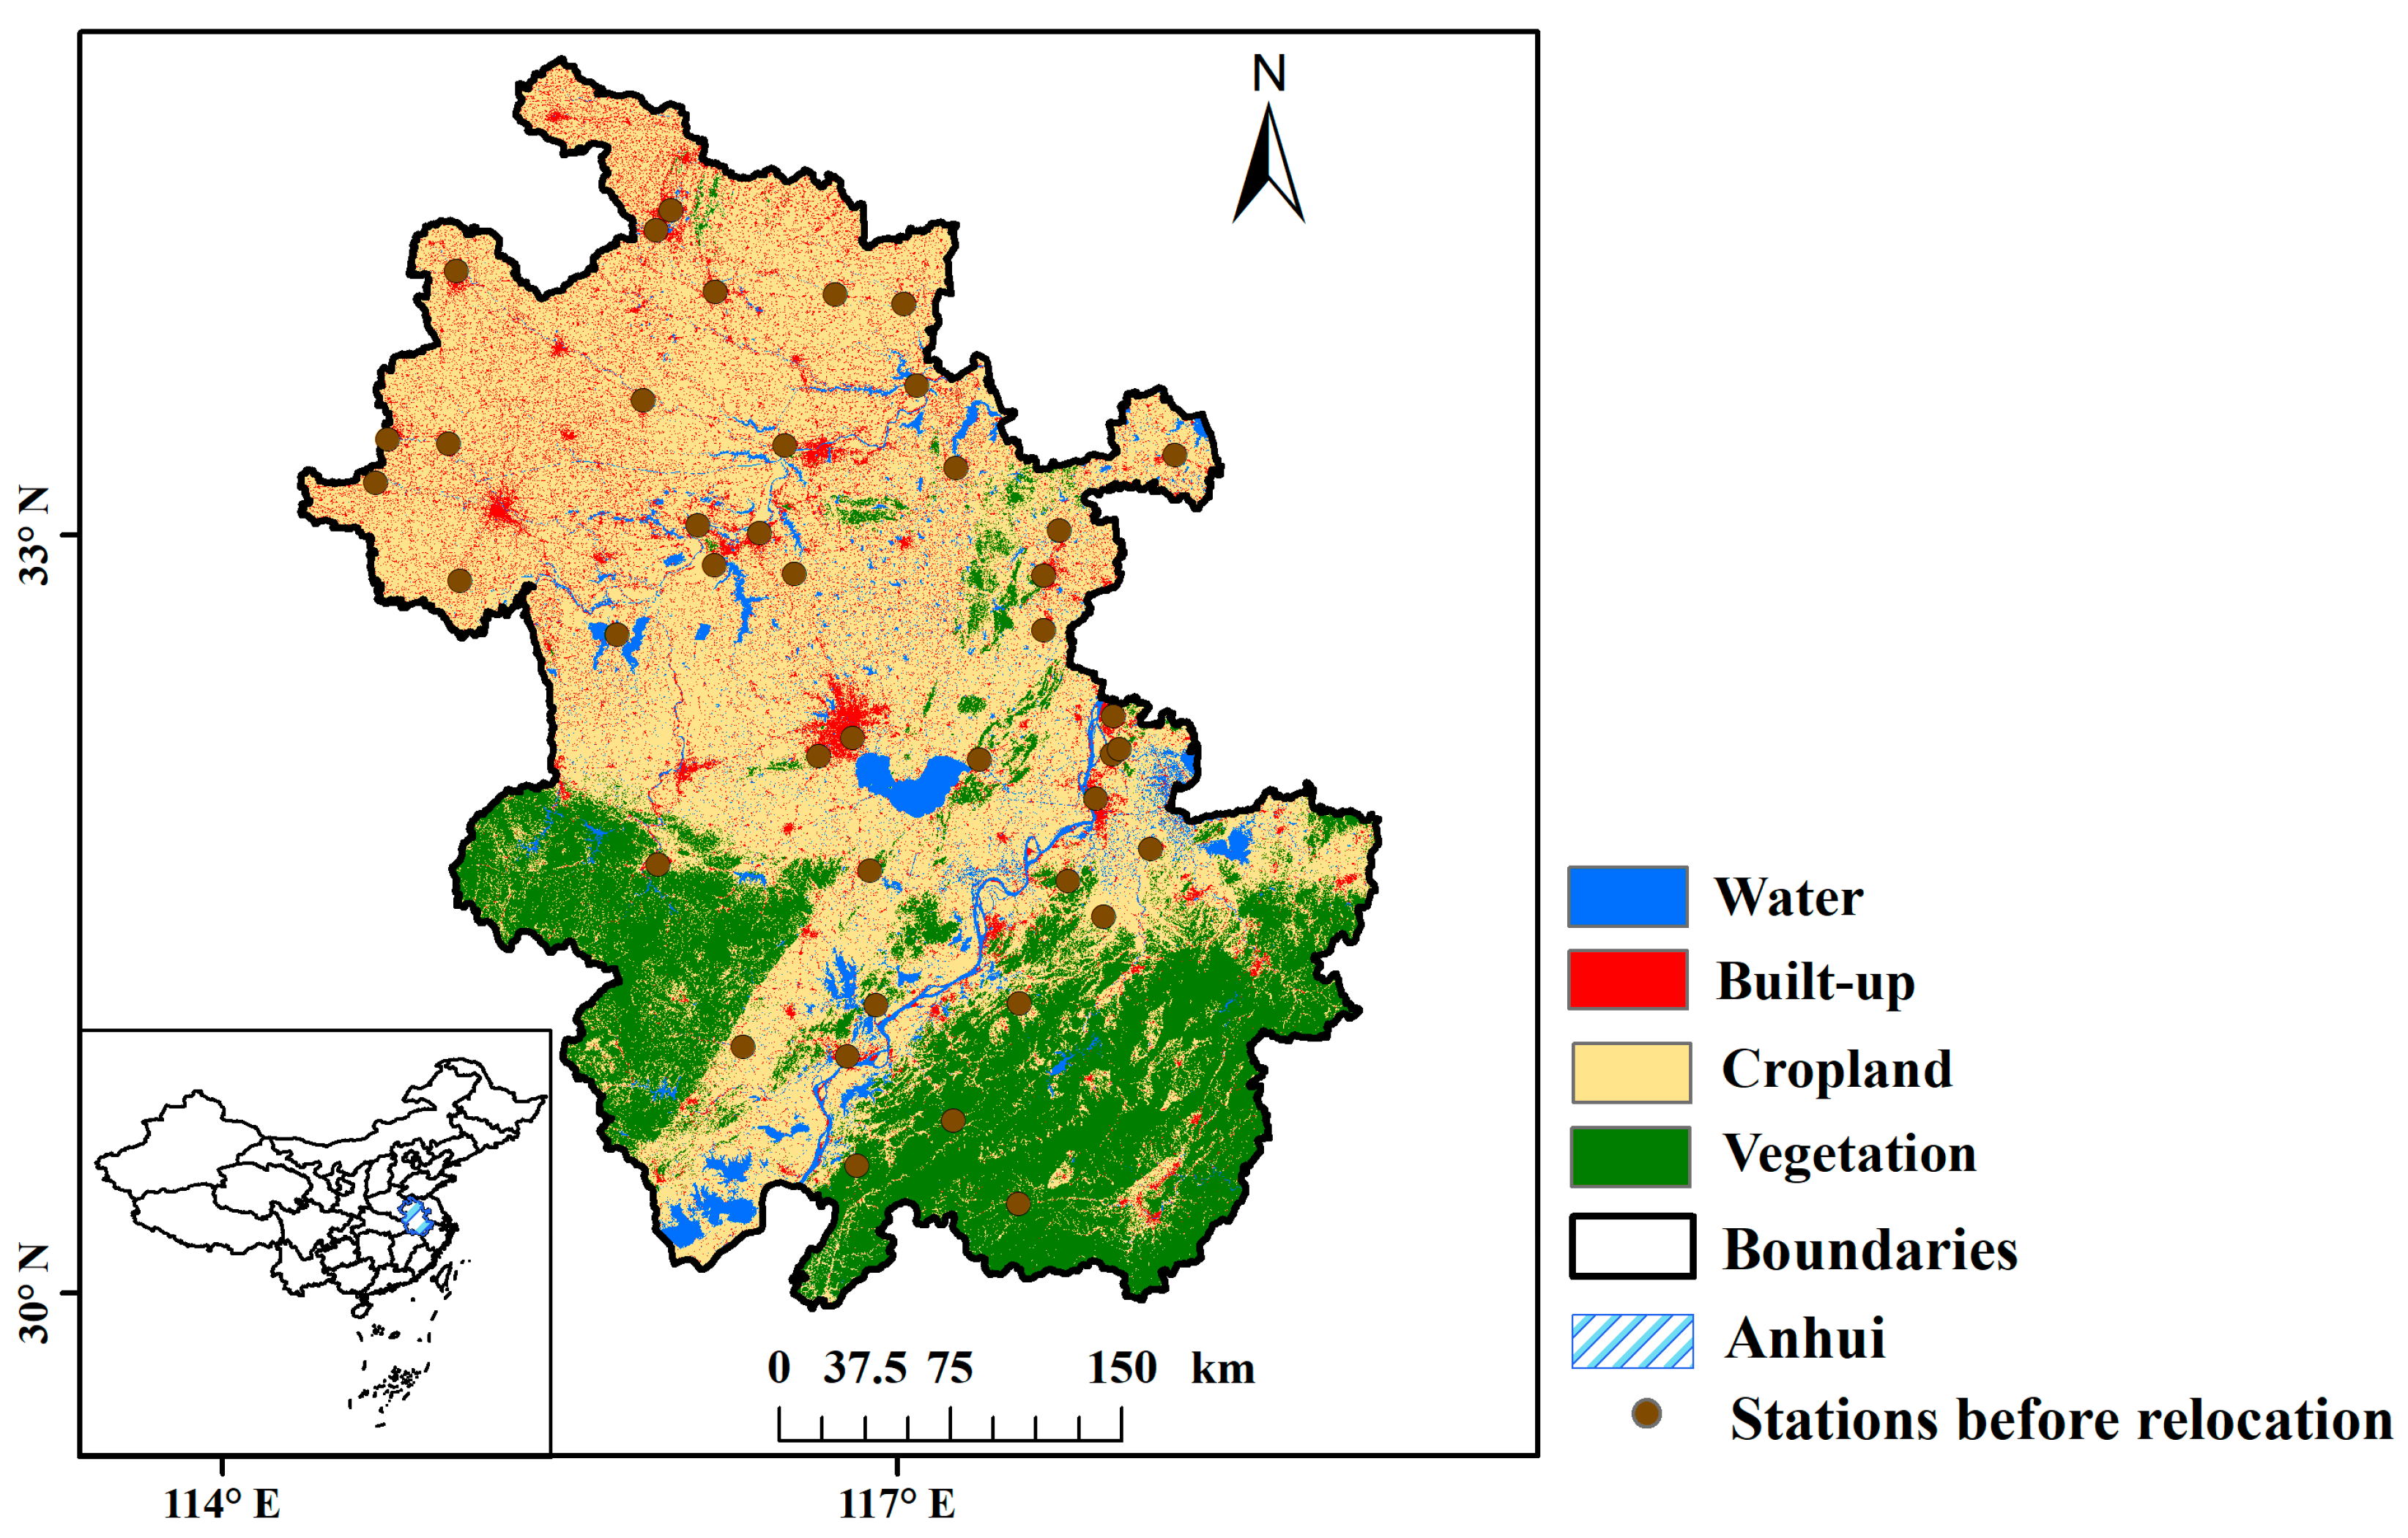
Based on these criteria, this paper screened 42 relocated station samples (as illustrated in Figure 1), which were equally distributed across northern Anhui, Jianghuai, along the river, and southern Anhui. Previous studies have suggested that under conditions of advection and turbulent transport, the maximum influence range of observations made from a shielded box at a height of 1.5 m within the observation field typically does not exceed 5 km [37,38]. Therefore, this study implemented a buffer zone centered on each station, with a radius extending 5 km outward.
2.2.2. Establishment of Urban Morphology Parameter Datasets
In this study, four land use types—built-up, water bodies, cropland, and vegetation—were selected from the CLCD dataset to characterize the land use around meteorological stations. Land use parameters included the ratio of built-up area (ARbt), ratio of water body area (ARw), ratio of cropland area (ARc), and ratio of vegetation area (ARv). Landscape parameters primarily encompassed the largest patch index (LPI) and the average fractal dimension (FRA) for each land use [39,40]. LPI indicates the prevailing land use within the research area; a higher value suggests a more prominent role of that type in the overall landscape [41]. FRA is an index that characterizes the shape of patches; a higher fractal dimension indicates a more complex shape and a more discrete distribution of patches [41]. Landscape parameters were calculated using Fragstats 4.2 software. Location parameters encompassed the distances (DIS) between the stations and the centroids of different land uses, as well as the distances between the stations and the urban centers [42]. In ArcGIS 10.0, the various land uses within the station buffers were extracted, and the centroids of these land uses were obtained using Calculate Geometry. Furthermore, this study also collected social indicators, such as population (POP) and gross domestic product (GDP) of the cities where the stations were located. These social indicators serve as proxies for understanding the socio-economic characteristics of the regions in question, which might potentially influence the thermal environment of the stations [21,40].
2.2.3. Fitting of the CUHII
This study investigated the physical mechanisms underlying the formation of the CUHI and utilized diverse statistical models to analyze the responsive relationship between CUHII and urban morphological parameters.
Multiple linear regression assumes a linear correlation between the dependent variable and independent variables, utilizing two or more influencing factors as predictors to explain the variation in the dependent variable [43]. Despite its simplicity and ease of interpretation, the traditional linear regression model often falls short when handling complex nonlinear relationships.
Support vector regression (SVR) is widely used as an effective supervised learning method. By introducing the concept of support vectors, SVR improves the fitting ability of data while maintaining the complexity of the model [44].
The random forest (RF) model, a popular and highly flexible machine learning approach derived from decision trees [45], exhibits remarkable capabilities. Unlike the traditional linear regression model, the random forest is a non-parametric method that can effectively simulate the intricate nonlinear relationships between predicted values and various predictor variables [46]. Furthermore, it allows for the identification of variable importance [47], providing valuable insights into the contributions of different factors. This study employed the 10-fold cross-validation (CV) approach to train and test the RF model. The predictive performance of the 10-fold CV was evaluated using the coefficient of determination (R2). Furthermore, it was necessary to identify the two most critical parameters of the model: the number of trees grown, and the number of randomly sampled candidate variables considered for each split. The significance of each variable was determined by the mean decrease in accuracy and mean decrease in impurity, where higher values of these metrics indicate greater contributions of the input variables.
Employing CHUII as the dependent variable, this paper incorporated various influencing factors into two distinct models: a linear model and an RF model. These models encompassed a range of independent variables, including land use parameters, landscape metrics, geometric characteristics, and social factors. Subsequently, this paper evaluated the influence of urban spatial morphologies on urbanization bias by analyzing the importance scores and significance levels of the input parameters within each model. This approach allowed the researchers to gain a comprehensive understanding of the factors that contribute to CHUII and their relative importance.
3. Results
3.1. Comparison of Typical Station before and after Relocation
As evident from Figure 2, with the continuous acceleration of urbanization, the Hefei station was surrounded by urban construction in 2018. The Hefei station, prior to its relocation, had a score of 63.2 in the observation environment report. Following its relocation, the station was situated 30.2 km northwest of its old position. This relocation resulted in a notable enhancement of the station’s observation environment, evident in the significant increase of its score to 99.3.
As illustrated in Figure 3, in terms of land use parameters, following the relocation, the ARbt decreased significantly from 42.17% to 4.23%, indicating a substantial reduction in the area occupied by buildings around the station. Conversely, the ARc increased from 56.04% to 91.09%, reflecting a notable growth in the farmland area surrounding the station. Additionally, the ARw increased from 1.01% to 3.11%, while the ARv exhibited a slight decrease. Regarding landscape parameters, the LPIbt decreased from 24.73 to 5.97 after the relocation, showing a marked decline in the dominance of the built-up area. Conversely, the LPIc increased from 38.88 to 60.18, signifying that farmland emerged as the most important land use type. FRA exhibited minor changes. In terms of location parameters, the DISbt increased from 0.53 km to 3.13 km following the relocation, while the DISc decreased significantly from 0.97 km to 0.07 km. Furthermore, various parameters related to water bodies and vegetation demonstrated improvements to varying degrees. Synchronous comparison observations revealed that the annual mean temperature at the old station before relocation was 17.05 °C, whereas the annual mean temperature at the new station after relocation was 16.03 °C. Additionally, the CUHII of Hefei in 2018 was measured to be 1.02 °C. Evidently, the observation environment at the relocated Hefei station is representative, and its observation sequence effectively reflects the climatic background of the region. The differences in the synchronous observations could be utilized to represent the CUHII.
3.2. Characteristics of CUHI and Urban Morphologies in Relocation Station Samples
As mentioned above, the SAT sequences recorded at the new station after relocation were significantly lower than those recorded at the old station before relocation. The differences between the synchronous observations of the two stations could be used to represent the CUHII of the target city. This section has compiled statistics on the characteristics of the SAT differences for all relocated stations, as illustrated in Figure 4.
Figure 4 illustrates that the CUHII in Anhui Province ranged from 0.06 to 1.12 °C overall. Utilizing the natural breaks classification method [48], the relocated stations could be categorized into seven groups. The group with the highest CUHII, ranging from 0.97 to 1.12 °C, comprises five stations. The maximum value was observed at Mengcheng Station in northern Anhui, where the area of buildings surrounding the station before relocation had already reached 61.08%. In Anhui, the CUHII at Huainan station in the north, the CUHII at Hefei station in the center, and the CUHII at Dongzhi station in the south all exceeded 1 °C. Notably, the ratio of the built-up area surrounding these stations before relocation was all greater than 40%. Contrastingly, the group with the lowest CUHII, ranging from 0.06 to 0.21 °C, includes four stations. The minimum value was recorded at Fengtai station in northern Anhui, where the ratio of built-up area around the station before relocation was only 15.2%. The ratio of the built-up area around the other three stations before relocation was also below 20%.
Figure 5 exhibits the probability density distribution of urban morphological parameters surrounding the stations prior to relocation. Taking the built-up area as an example, the mean ARbt of the relocated stations was 31.08%, with a maximum of 68.8% and a minimum of 9.3%. As the ratio of the built-up area increased, the corresponding probability density gradually increased and then gradually decreased, exhibiting overall characteristics of a normal distribution. Notably, the probability density reached its highest value when the ratio of the built-up area concentrated between 25% and 30%, and the probability density curve exhibited a left-skewed shape. The mean LPIbt of the relocated stations was 24.37, with a maximum of 66.96 and a minimum of 2.49. The probability density peaked between 20 and 25. Additionally, the mean FRAbt of the relocated stations was 1.09, ranging from a maximum of 1.13 to a minimum of 1.02, with the highest probability density occurring between 1.08 and 1.1. The mean DISbt of the relocated stations was 0.76 km, with a maximum of 1.75 km and a minimum of 0.22 km. The probability density reached its peak between 0.71 km and 0.82 km. These results suggested that the observation environment of the stations prior to relocation had already been compromised by urbanization, and their SAT sequences contained the warming effect of urbanization.
3.3. The Impact of Urban Morphologies on the CUHI
This section analyzed the correlation between the CUHII and urban morphological parameters within the buffer zone using relocated station samples. In Figure 6, the red value indicates a negative correlation coefficient, while the blue value represents a positive correlation coefficient. The shading intensity gradually increased from light to dark, showing a strengthening correlation from weak to strong. The asterisks denote the significance level of the correlation.
As depicted in Figure 6, LPIbt exhibited the most robust correlation with CUHII among all influencing factors, attaining a correlation coefficient of 0.68 and a significance level of 0.001. Conversely, the ARc exhibited the strongest negative correlation with the CUHII, with a correlation coefficient of −0.59 and a significance level of 0.001. These results suggested that as the urban development area increased and the cropland area decreased, the CUHII rose most significantly. The continuous increase in urban buildings leads to a decrease in the thermal capacity of the underlying surface and an increase in anthropogenic heat, which in turn results in the deterioration of the local thermal environment. On the other hand, the vegetation in farmland has a larger thermal capacity, which can mitigate daytime temperature increases at the stations [49]. Reduced evaporation in urban areas further exacerbates this effect [50]. Researchers have discovered a negative correlation between the SAT series observed and their distance from the urban core [51].
However, this study did not obtain similar results. The correlation coefficient between DISu and CUHIII is 0.09, which did not pass the significance test. This might be related to the sample size, and the research scope will be further expanded to the Yangtze River Delta region in the future. Furthermore, the correlation coefficients between ARbt, LPIc, POP, and the intensity of the CUHII were all greater than 0.4, with significance levels exceeding 0.01.
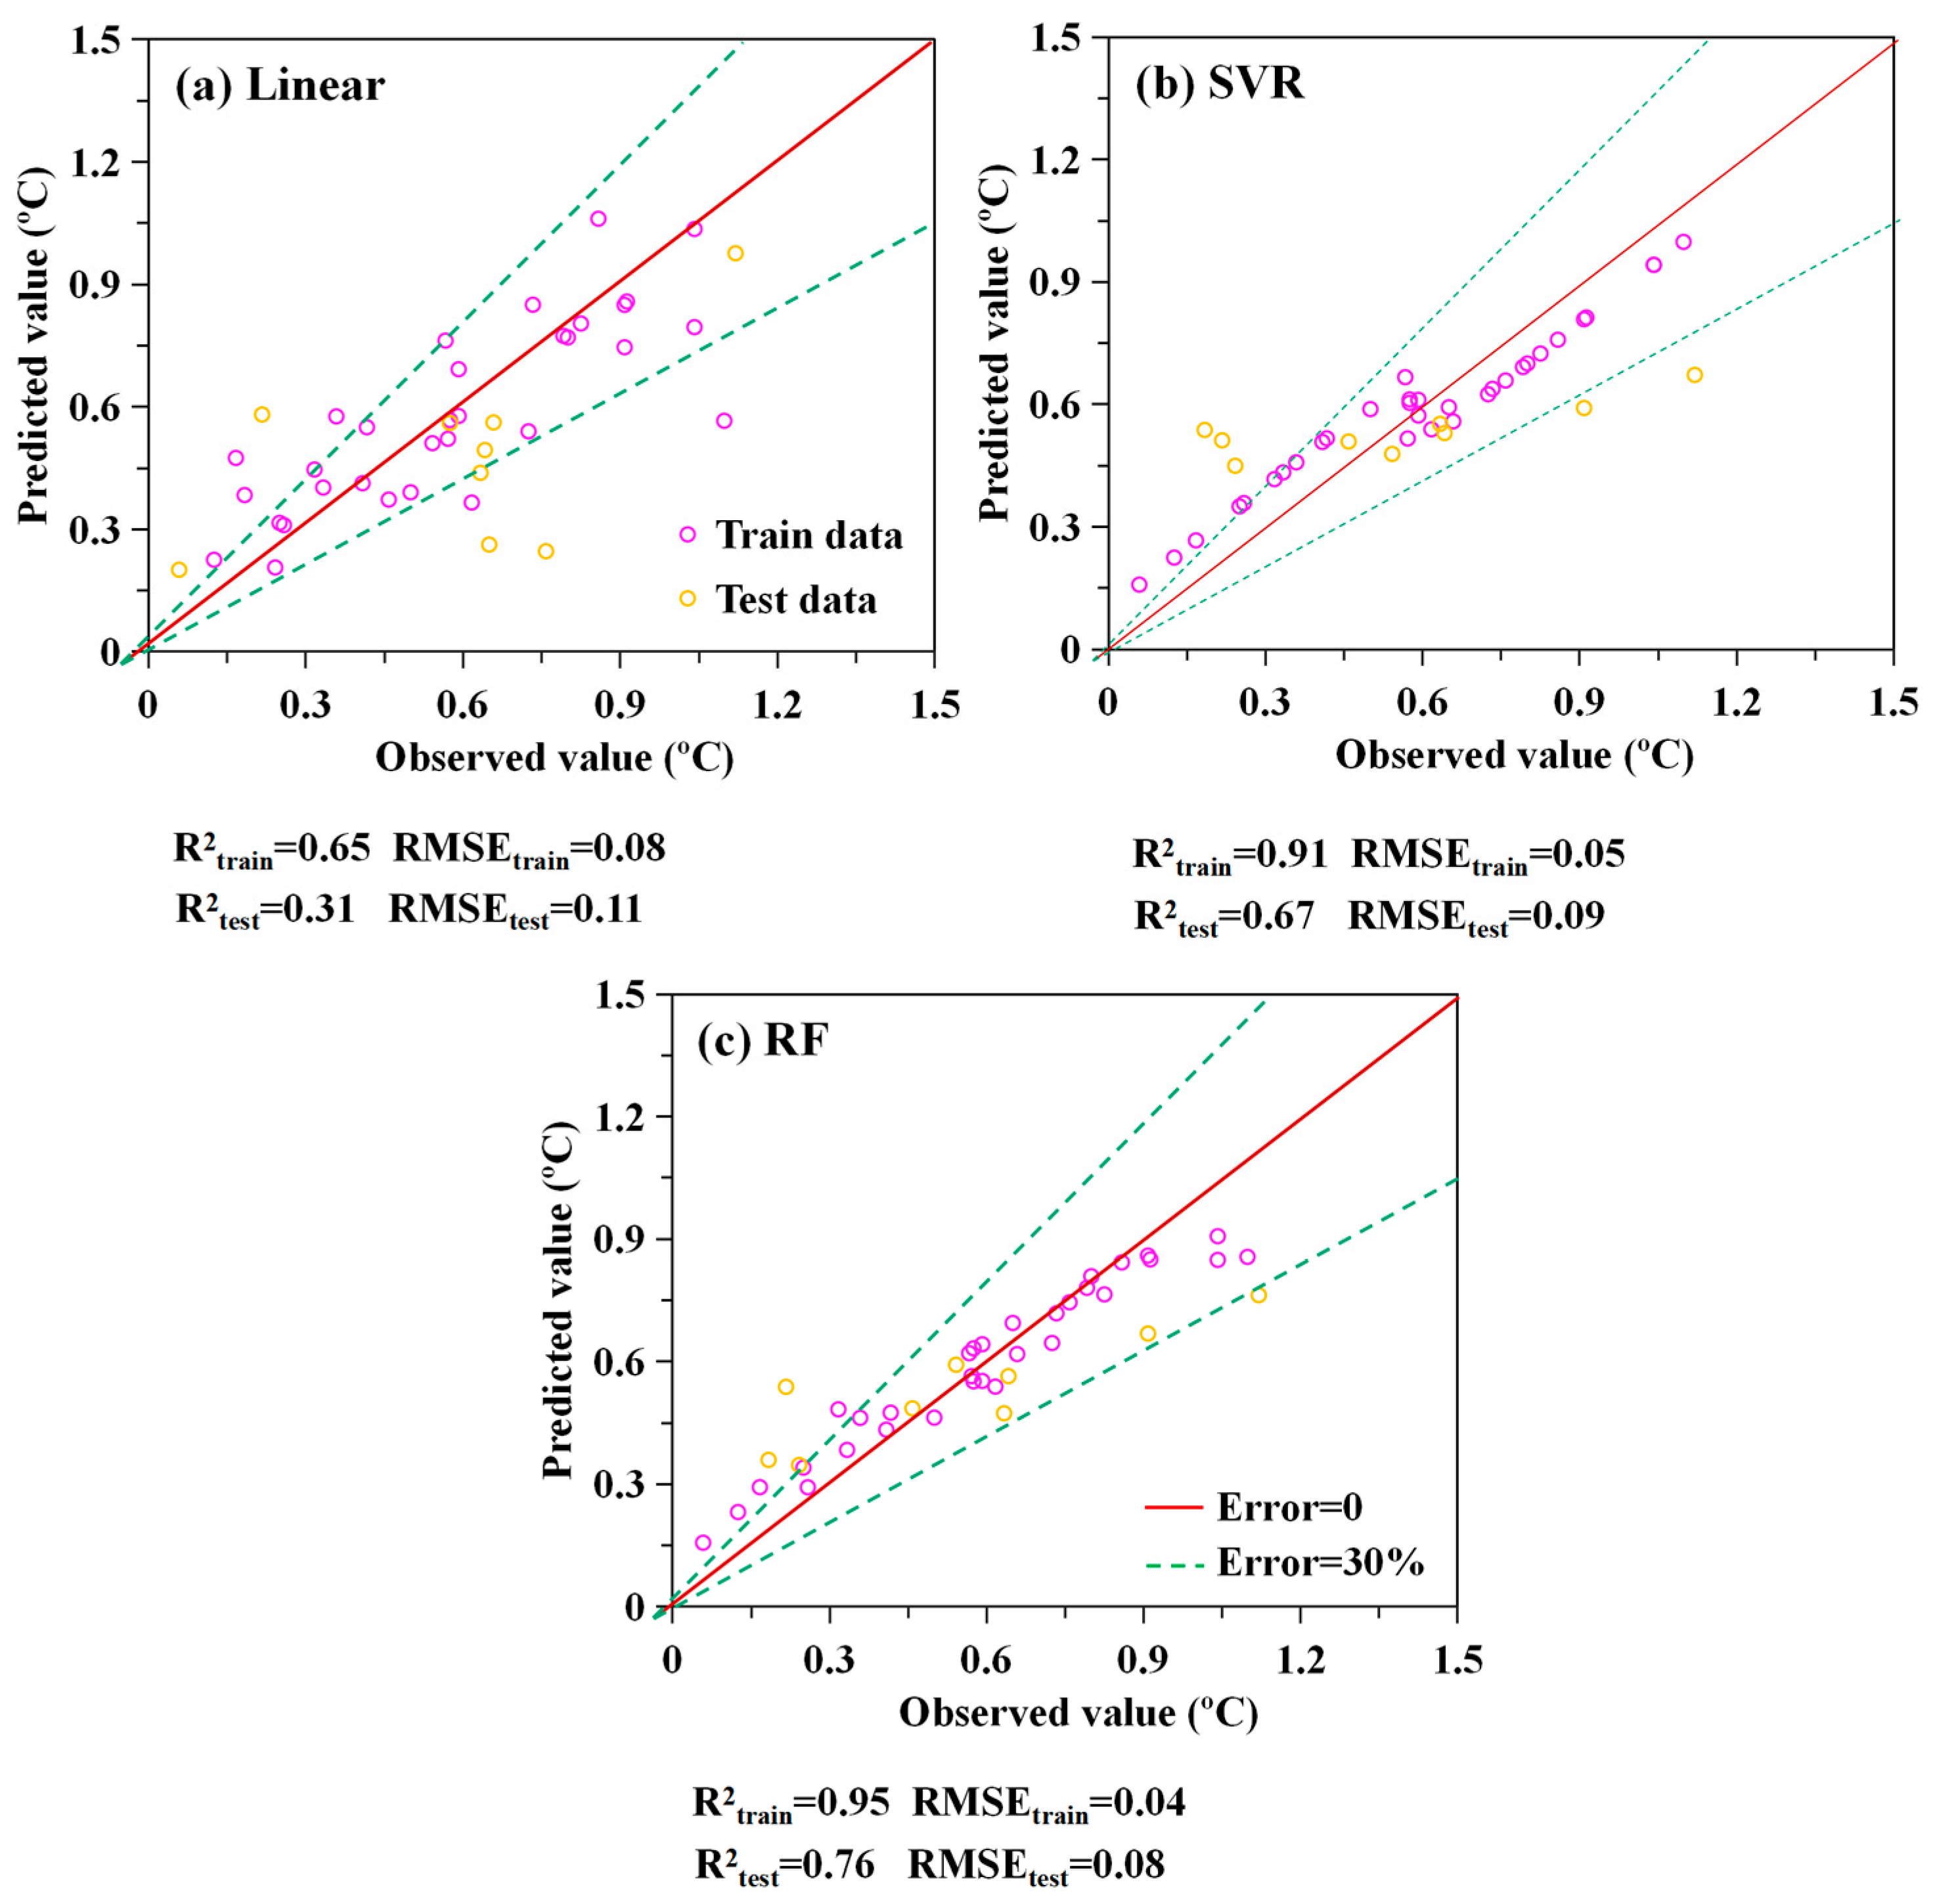
The linear model has demonstrated a certain degree of predictive power for CHUII, achieving a R2 of 0.65 and a root-mean-square error (RMSE) of 0.08 °C within the training data (Figure 7a). Subsequently, this study utilized this trained linear model to simulate CHUII in the test data and compared the resulting predicted value with the observed value. Notably, the predicted CHUII was underestimated for seven stations and overestimated for two stations. The SVR model has demonstrated a certain degree of predictive power for CHUII, achieving a R2 of 0.65 and a RMSE of 0.08 °C within the training data (Figure 7a). Furthermore, the predicted errors exceeded 30% for five stations, and the linear model exhibited an R2 of 0.34 and an RMSE of 0.22 °C. Figure 7b illustrates that the SVR model demonstrated superior performance compared to the linear model in predicting the amplified CHUII, achieving an R2 value of 0.91 and an RSME value of 0.05 °C within the training data. Similarly, in the test data, the SVR model also demonstrated superior performance compared to the linear model, achieving an R2 value of 0.67 and an RSME value of 0.09 °C.
Additionally, this section employed the RF model to assess the CHUII prediction. Based on the performance metrics presented in Figure 7b, it was evident that the RF model yielded a superior R2 value of 0.95 and a lower RMSE of 0.04 °C. Analogously, the trained RF model was used to predict CHUII in the test data. In this case, the predicted CUHII was underestimated for five stations and overestimated for four stations. Notably, only two stations exhibited predicted errors exceeding 30%. The RF model achieved an R2 of 0.76 and an RMSE of 0.08 °C when evaluated on the test data. Overall, the RF model demonstrated a significantly better fitting performance for both training and testing datasets compared to the linear model and SVR model. Therefore, the RF model can be considered a reliable tool for capturing the intricate relationship between CHUII and urban morphologies.
Subsequently, this paper proceeded to evaluate the relative importance of various influencing factors in predicting CHUII by the RF model. Among the land use parameters (depicted by the red bar), the results revealed that ARbt emerged as the most influential factor governing CHUII. ARbt ranked second in terms of its significance in modulating CUHII, with an importance value reaching 0.18. This finding aligned with previous studies, which suggested that the contrast in artificial construction between urban and rural areas alters surface net radiation and its partitioning into latent and sensible heat fluxes [52]. The subsequent parameters, in descending order of importance, were ARc, ARw, and ARv. Turning to the landscape parameters (illustrated by the purple bar), LPIbt stood out as another dominant variable and the most significant parameter across all variables, with an importance value of 0.25. A higher LPIbt value indicated a lower degree of spatial heterogeneity, which may hinder material and energy circulation with neighboring patches [53]. The impact of LPIc on CUHII was also noteworthy, with an importance value of 0.17. The observed decrease in CUHII with increasing urban vegetation coverage could be attributed to the evapotranspiration [54] and shading effects [55] provided by urban vegetation. Additionally, the importance of DISbt and POP exceeded 0.08, indicating their substantial contribution to the model. Overall, the influence of land use and landscape parameters on CHUII was significantly greater than that of location and social parameters on CHUII. Among these, the most pivotal parameters included LPIbt, LPIc, ARbt, and ARc.
These findings provide valuable insights into the complex relationships between urban morphologies and CHUII. It is worth noting that the present study has not taken into account the impact of vertical parameters of urban land cover on CUHII. Research has demonstrated that the three-dimensional morphological characteristics of urban underlying surfaces play a significant role in the local thermal environment [56,57]. For instance, urban trees mitigate urban heat by providing shade to their surrounding environment [58]. In future studies, the researchers will further explore the driving effect of three-dimensional morphological characteristics of urban underlying surfaces on CUHII using remote sensing techniques.
4. Discussion
In this section, synchronized daily and hourly data were utilized to further analyze the characteristics of CUHII. The daily mean CUHII was obtained by subtracting the daily mean SAT sequence of the old station before relocation from that of the new station after relocation. As can be seen from Figure 8, the daily mean CUHII closely approximated a normal distribution. With a sample size of 15,347, the CUHII varied between −2.3 °C and 4.4 °C, with an arithmetic mean of 0.5717 °C and a standard deviation of 0.5683 °C. The analysis revealed that despite the notable variations in CUHII, the bulk of the data clustered around the mean, effectively reducing the overall fluctuations in the sample. Furthermore, the kurtosis value of the sample stood at 2.06, and the number of days with a CUHII of 0.4 °C was the highest, reaching 1515 days.
It is noteworthy that Figure 9 reveals the existence of 828 negative samples in the daily average CUHII, comprising approximately 5.39% of the entire dataset. This indicates instances where the observed SAT at the old site was lower than that at the new site, which were considered non-CUHI days. Apart from the selected parametric indicators mentioned above, local circulations arising from different geographical environments also have a significant impact on the spatial and temporal distribution of urban extreme high temperatures [8,59].
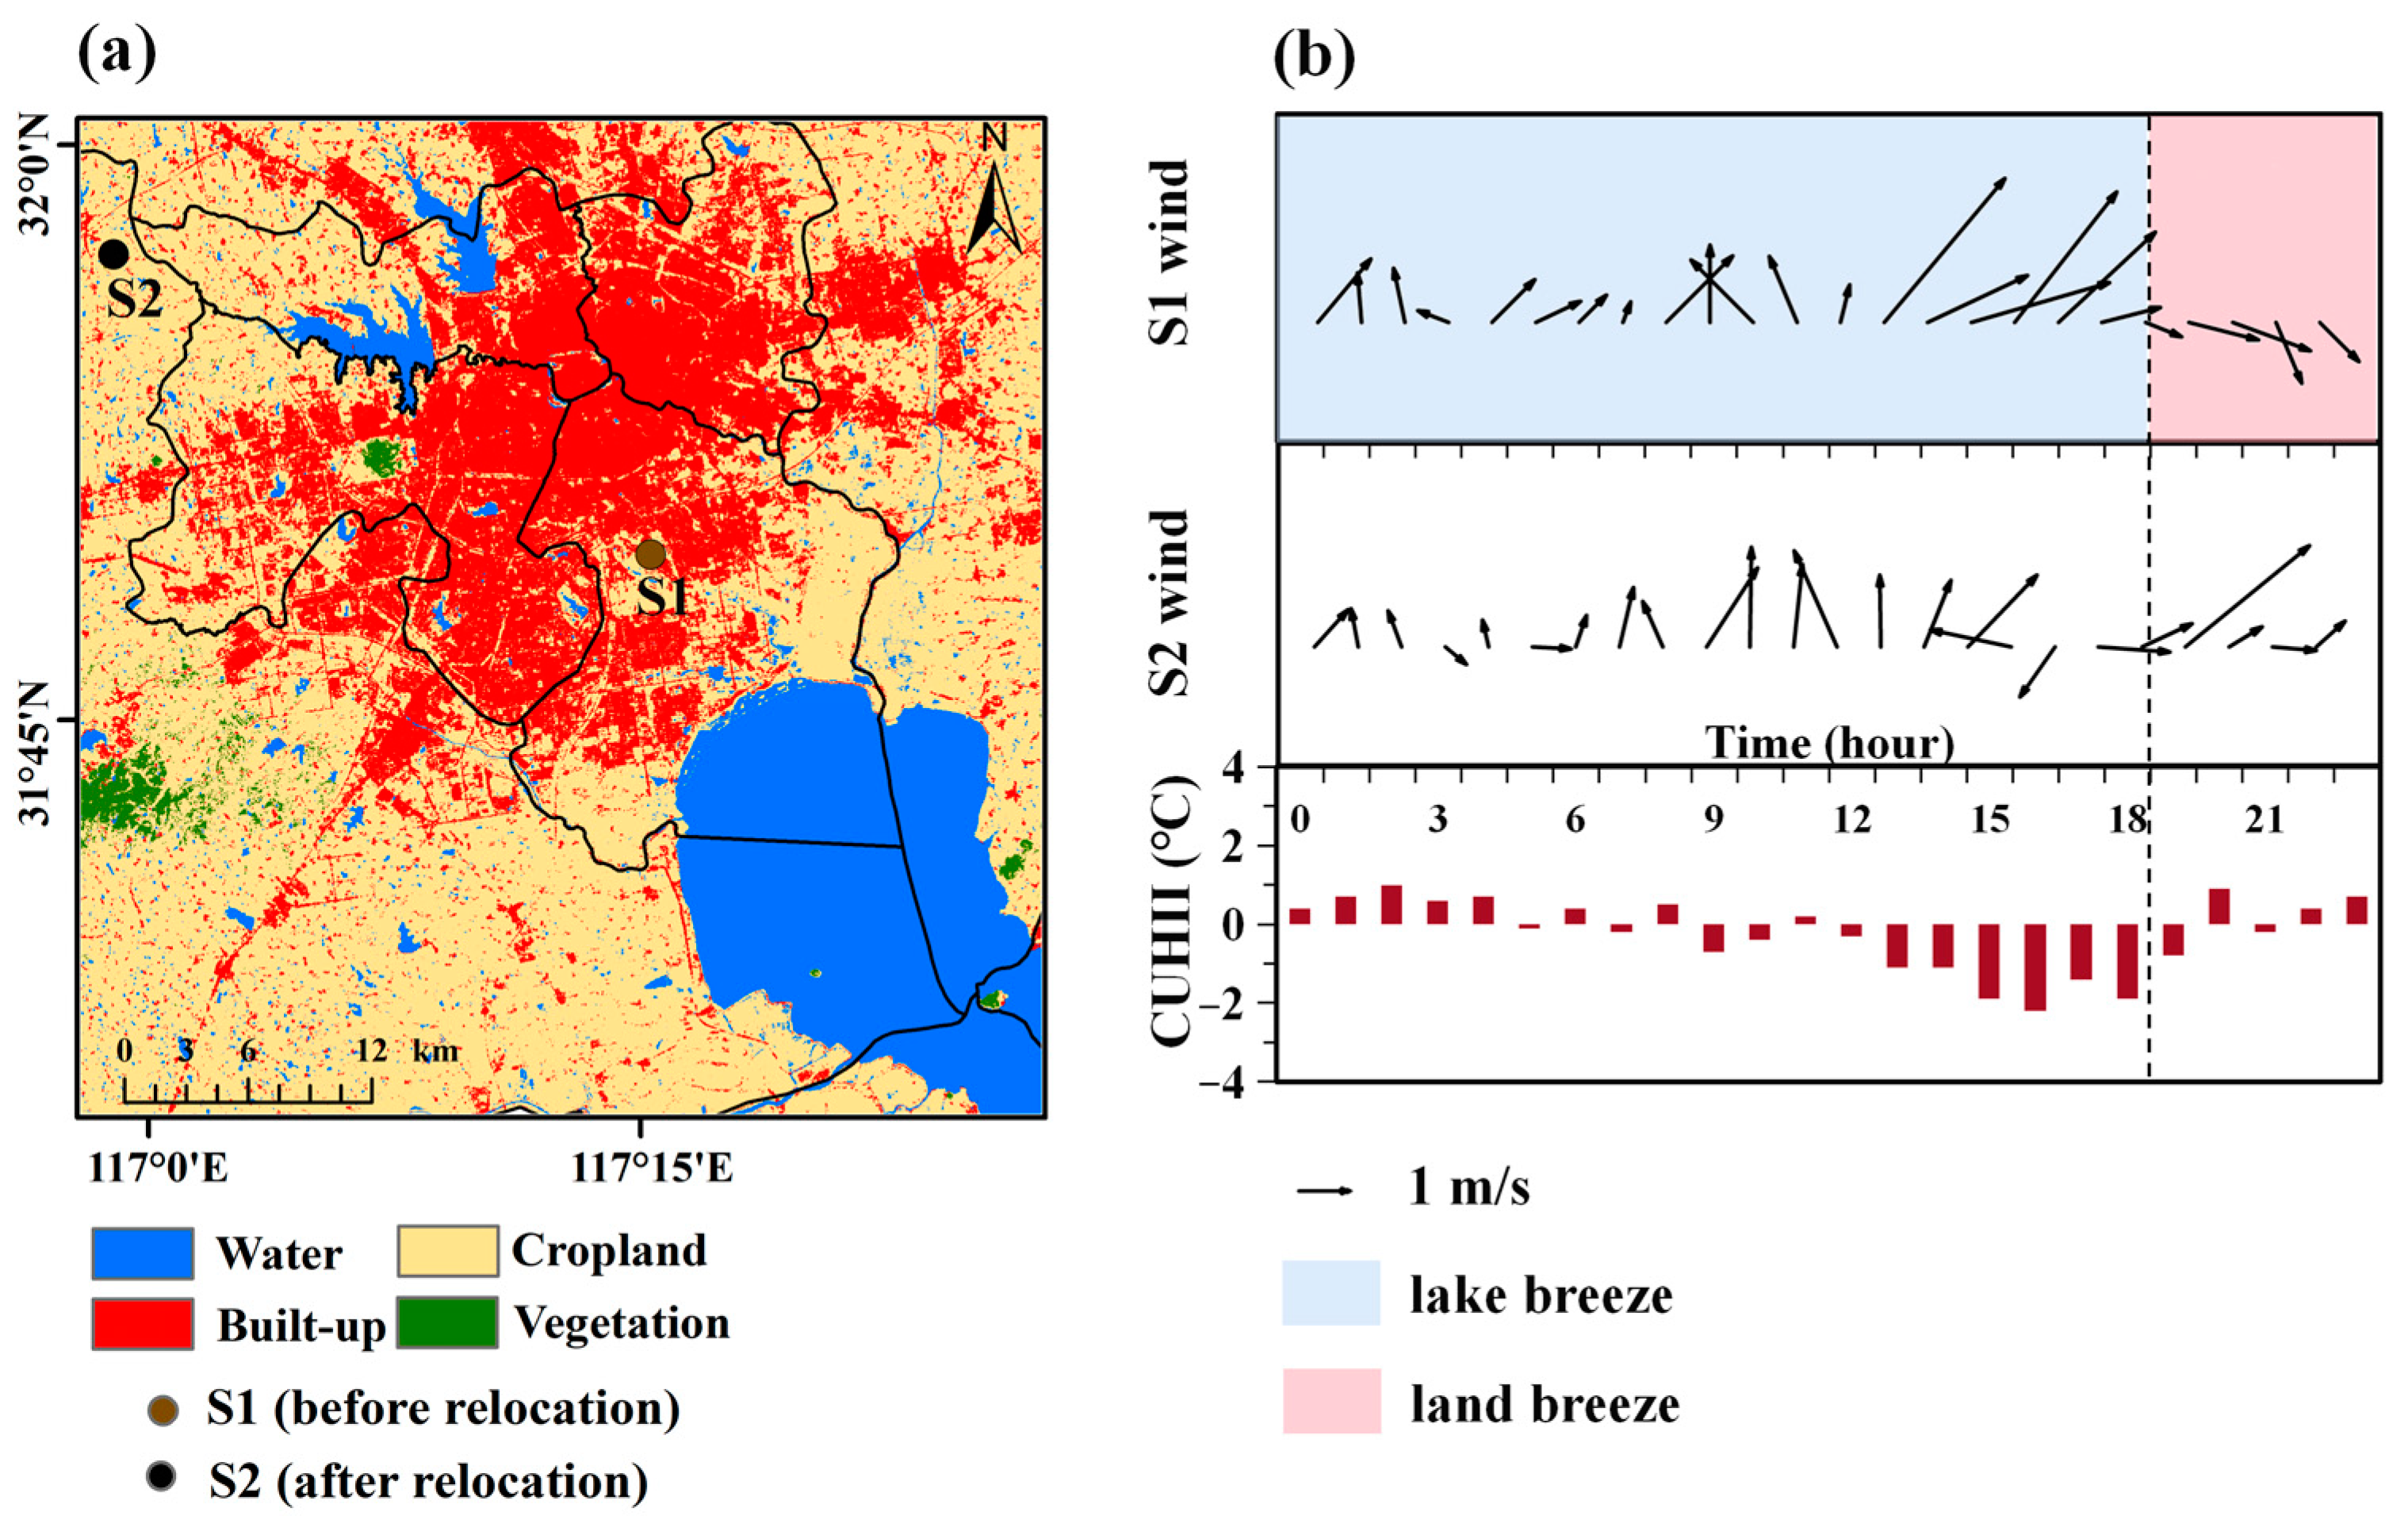
In this section, Hefei was chosen as the study area to explore the influence of local circulations on CUHII. As depicted in Figure 10a, prior to relocation, the Hefei station (S1) was situated on the northwest side of Chaohu Lake, with a mere 10 km of straight-line distance from the lake’s surface. Following the relocation, the Hefei station (S2) moved away from the proximity of Chaohu Lake. Chaohu Lake, with a total area of 760 square kilometers, is the fifth-largest freshwater lake in China. The land-based stations in the Chaohu Lake basin are affected by the lake–land breeze to varying degrees, with the influence being more significant as the distance to the lake decreases [60]. Lake–land breeze, a mesoscale local circulation phenomenon, results from the pressure difference caused by thermal differences between the lake and the land surface [61].
Synchronous daily observations showed that the non-CUHI days at the Hefei station totaled 104 days. Among these days, this paper selected a non-CUHI day, 28 July 2018, to analyze the intricate relationship between wind fields and the CUHII. Prior to relocation, from 00:00 to 18:00, S1 was primarily influenced by southwesterly winds, known as the lake breeze. Notably, between 13:00 and 17:00, due to the differences in thermal properties between land and the lake surface under the influence of solar radiation, the southerly wind strengthened significantly. After 18:00, as the land cooled faster, forming a high-pressure zone, while the lake cooled slower, creating a low-pressure zone, the wind direction shifted to northerly, marking the transition to the land breeze.
Following the relocation, two significant changes were observed at S2. Firstly, the overall wind strength decreased significantly. Secondly, there was no significant reverse in wind direction during the night, indicating a weak influence from the lake–land breeze. Turning to the diurnal variation of CUHII, it was primarily positive from 00:00 to 12:00 the next day due to urban warming. During the period from 13:00 to 17:00, S1 reached a peak value of 2.68 m/s, while S2 only reached 1.41 m/s. The lake breeze disrupts the CUHI circulation structure, alters the distribution of near-surface heat and water vapor, suppresses the vertical development of the CUHI, and affects the entire urban area [62]. Consequently, the CUHII rapidly decreased to −1.1 to −2.2 °C, reaching its lowest point at 16:00. After 18:00, with the transition to the land breeze and the higher temperature of the lake body compared to the land at night, the land breeze warmed the surrounding areas [62], leading to a gradual increase in the CUHII. It is evident that, in addition to urban morphologies, local circulation also plays a significant role in influencing the CUHI. In the future, studies will further analyze the driving mechanisms of urban morphologies on the CUHI under different local circulation backgrounds using statistical and numerical modeling techniques.
5. Conclusions
This study identified meteorological stations with histories of relocation and established spatial datasets of urban morphologies around these stations through remote sensing techniques. By combining various statistical methods, the response characteristics of the CUHI to urban morphological parameters were elucidated.
Statistical analysis revealed that the mean ARbt around the relocated stations was 31.08%, with a maximum of 68.8% and a minimum of 9.3%. As the built-up area increased, the corresponding probability density initially rose gradually, peaking between 25% and 30% of the building area ratio. Prior to relocation, the detection environment of the stations had already been compromised by urbanization, with their SAT sequences reflecting the warming effects of this process. Furthermore, the LPIbt exhibited the strongest correlation with CUHII, with a correlation coefficient of 0.68 and a significance level of 0.001. The correlation coefficients between ARbt, LPIc, POP, and CUHII also exceeded 0.4. The results of relative importance corroborated those of the correlation analysis. Notably, the R2 and RMSE of the RF model in both the training and test datasets outperformed those of the linear model and SVR model, indicating that the RF model was a reliable tool for fitting the relationship between CUHII and urban morphologies. Lastly, a non-CUHI day was selected in Hefei for further analysis. Due to the influence of the lake–land breeze, wind speeds at the old station were significantly higher than those at the new station, particularly during the afternoon hours from 13:00 to 17:00, when the wind speed difference peaked at 1.27 m/s. Consequently, CUHII decreased to −2.2 °C at 16:00, highlighting the significant role of local circulations in influencing CUHII.
Looking ahead, the researchers plan to conduct more comprehensive studies on the response of CUHII to urban morphological characteristics under various local circulation backgrounds, utilizing a combination of statistical analysis and numerical simulations. The objective of the study was to gradually reveal the mechanisms underlying the impact of urban morphologies on the CUHII, thereby providing more scientific and effective decision support for urban planning, climate adaptation, and environmental protection.
Author Contributions
Conceptualization, T.S., P.Q. and Y.Y.; methodology, T.S. and Y.Y.; software, T.S. and Y.Y.; validation, T.S. and Y.Y.; formal analysis, T.S.; investigation, T.S. and P.Q.; resources, T.S.; data curation, T.S. and Y.Y.; writing—original draft preparation, T.S. and Y.Y.; writing—review and editing, P.Q. and T.S. All authors have read and agreed to the published version of the manuscript.
Funding
This study was supported by the National Natural Science Foundation of China (42105147), the Joint Research Project for Meteorological Capacity Improvement (22NLTSQ013) and the Collaborative Innovation Fund of Education Department of Anhui Province (GXXT-2023-050).
Institutional Review Board Statement
Not applicable.
Informed Consent Statement
Not applicable.
Data Availability Statement
The original contributions presented in the study are included in the article, further inquiries can be directed to the corresponding author.
Conflicts of Interest
The authors declare no conflicts of interest.
Abbreviations
List of abbreviations used in this paper:
| Abbreviations | Full Names |
| UHI | Urban heat islands |
| CUHI | Canopy urban heat islands |
| CUHI | Canopy urban heat islands intensity |
| LCLU | Land cover/land use |
| SAT | Surface air temperature |
| YRD | Yangtze River Delta region |
| CLCD | China Land Cover Dataset |
| SVR | Support Vector Regression |
| RF | Random Forest |
| CV | Cross-validation |
| R2 | coefficient of determination |
| RMSE | root-mean-square error |
| ARbt | Ratio of built-up area |
| ARw | Ratio of water body area |
| ARc | Ratio of cropland area |
| ARv | Ratio of vegetation area |
| LPIbt | Largest patch index of built-up area |
| LPIw | Largest patch index of water body area |
| LPIc | Largest patch index of cropland area |
| LPIv | Largest patch index of vegetation area |
| DISbt | Distances between the stations and the built-up area |
| DISw | Distances between the stations and the water body area |
| DISc | Distances between the stations and the cropland area |
| DISv | Distances between the stations and the vegetation area |
| DISu | Distances between the stations and the urban center |
References
- Grimm, N.B.; Faeth, S.H.; Golubiewski, N.E.; Redman, C.L.; Wu, J.G.; Bai, X.M.; Briggs, J.M. Global change and the ecology of cities. Science 2008, 319, 756–760. [Google Scholar] [CrossRef] [PubMed]
- Wang, W.; Zhou, W.; Ng, E.Y.Y.; Xu, Y. Urban heat islands in Hong Kong: Statistical modeling and trend detection. Nat. Hazards 2016, 83, 885–907. [Google Scholar] [CrossRef]
- Yang, Y.; Wang, L.; Huang, Y.; Shi, C.; Shi, T. Impact of urbanization on meteorological observation and its environment representativeness: A case study of Shouxian national climate station. Meteorol. Sci. Technol. 2017, 45, 7–13. (In Chinese) [Google Scholar] [CrossRef]
- Kang, H.Q.; Zhu, B.; Zhu, T.; Gao, J.H.; Sun, J.L.; Su, J.F. Investigation of an urban heat island episode along Suzhou-Wuxi-Changzhou urban cluster. Trans. Atmos. Sci. 2014, 37, 432–440. (In Chinese) [Google Scholar] [CrossRef]
- Li, Y.; Sebastian, S.; Kropp, J.P.; Rybski, D. On the influence of density and morphology on the urban heat island intensity. Nat. Commun. 2020, 11, 2647. [Google Scholar] [CrossRef] [PubMed]
- Li, Y.; Yang, T.; Zhao, G.; Ma, C.; Yan, Y.; Xu, Y.; Wang, L.; Wang, L. A systematic review of studies involving canopy layer urban heat island: Monitoring and associated factors. Ecol. Indic. 2024, 158, 111424. [Google Scholar] [CrossRef]
- Yang, Y.; Guo, M.; Ren, G.; Liu, S.; Zong, L.; Zhang, Y.; Zheng, Z.; Miao, Y.; Zhang, Y. Modulation of wintertime canopy urban heat island (CUHI) intensity in Beijing by synoptic weather pattern in planetary boundary layer. J. Geophys. Res. Atmos. 2022, 127, e2021JD035988. [Google Scholar] [CrossRef]
- Chen, S.; Yang, Y.; Deng, F.; Zhang, Y.; Liu, D.; Liu, C.; Gao, Z. A high-resolution monitoring approach of canopy urban heat island using a random forest model and multi-platform observations. Atmos. Meas. Tech. 2022, 15, 735–756. [Google Scholar] [CrossRef]
- Yang, Y.; Guo, M.; Wang, L.; Zong, L.; Liu, D.; Zhang, W.; Guo, Y. Unevenly spatiotemporal distribution of urban excess warming in coastal Shanghai megacity, China: Roles of geophysical environment, ventilation and sea breezes. Build. Environ. 2023, 235, 110180. [Google Scholar] [CrossRef]
- Shawky, M.; Ahmed, M.R.; Ghaderpour, E.; Gupta, A.; Achari, G.; Dewan, A.; Hassan, Q.K. Remote sensing-derived land surface temperature trends over South Asia. Ecol. Inform. 2023, 74, 101969. [Google Scholar] [CrossRef]
- Gubler, S.; Hunziker, S.; Begert, M.; Croci-Maspoli, M.; Konzelmann, T.; Brönnimann, S.; Schwierz, C.; Oria, C.; Rosas, G. The influence of station density on climate data homogenization. Int. J. Climatol. 2017, 37, 4670–4683. [Google Scholar] [CrossRef]
- Rahaman, K.R.; Hassan, Q.K.; Chowdhury, E.H. Quantification of local warming trend: A remote sensing-based approach. PLoS ONE 2017, 12, e0169423. [Google Scholar] [CrossRef] [PubMed]
- Rogers, C.D.W.; Gallant, A.J.E.; Tapper, N.J. Is the urban heat island exacerbated during heatwaves in southern Australian cities? Theor. Appl. Climatol. 2019, 137, 441–457. [Google Scholar] [CrossRef]
- Scott, A.A.; Waugh, D.W.; Zaitchik, B.F. Reduced urban heat island intensity under warmer conditions. Environ. Res. Lett. 2018, 13, 064003. [Google Scholar] [CrossRef] [PubMed]
- Liu, Y. A Preliminary Analysis of the Influence of Urbanization on Precipitation Change Trend in North China. Master’s Thesis, Lanzhou University, Lanzhou, China, 2006. (In Chinese). [Google Scholar]
- Ren, G.; Zhang, A.; Chu, Z.; Zhou, J.; Ren, Y.; Zhou, Y. Principles and procedures for selecting reference surface air temperature stations in China. Meteorol. Sci. Technol. 2010, 38, 78–85. [Google Scholar] [CrossRef]
- Sun, S.; Zhou, D.; Chen, H.; Li, J.; Ren, Y.; Liao, H.; Liu, Y. Decreases in the urban heat island effect during the Coronavirus Disease 2019 (COVID-19) lockdown in Wuhan, China: Observational evidence. Int. J. Climatol. 2022, 42, 8792–8803. [Google Scholar] [CrossRef]
- Zhou, D.; Sun, S.; Li, Y.; Zhang, L.; Huang, L. A multi-perspective study of atmospheric urban heat island effect in China based on national meteorological observations: Facts and uncertainties. Sci. Total Environ. 2023, 854, 158638. [Google Scholar] [CrossRef] [PubMed]
- Yang, P.; Ren, G.; Hou, W. Impact of daytime precipitation duration on urban heat island intensity over Beijing city. Urban Clim. 2019, 28, 100463. [Google Scholar] [CrossRef]
- Zhang, Y. Assessment and Correction of Urban Bias in Surface Air Temperature Series of Eastern China over Time Period 1913–2012. Master’s Thesis, China Academy of Meteorological Sciences, Beijing, China, 2014. (In Chinese). [Google Scholar]
- Wen, K.; Ren, G.; Li, J.; Zhang, A.; Ren, Y.; Sun, X.; Zhou, Y. Recent surface air temperature change over mainland China based on an urbanization-bias adjusted dataset. J. Clim. 2019, 32, 2691–2705. [Google Scholar] [CrossRef]
- Yang, Y.; Wu, B.; Shi, C.; Zhang, J.; Li, Y.; Tang, W.; Wen, H.; Zhang, H.; Shi, T. Impacts of urbanization and station-relocation on surface air temperature series in Anhui Province, China. Pure Appl. Geophys. 2013, 170, 1969–1984. [Google Scholar] [CrossRef]
- Fenner, D.; Meier, F.; Bechtel, B.; Otto, M.; Scherer, D. Intra and inter ‘local climate zone’ variability of air temperature as observed by crowdsourced citizen weather stations in Berlin, Germany. Meteorol. Z. 2017, 26, 525–547. [Google Scholar] [CrossRef]
- Dang, B.; Liu, Y.; Lyu, H.; Zhou, X.; Du, W.; Xuan, C.; Xing, P.; Yang, R.; Xiong, F. Assessment of urban climate environment and configuration of ventilation corridor: A refined study in Xi’an. J. Meteorol. Res. 2022, 36, 914–930. [Google Scholar] [CrossRef]
- Oke, T.R. The energetic basis of the urban heat island. Q. J. R. Meteorol. Soc. 1982, 108, 1–24. [Google Scholar] [CrossRef]
- Afnfield, A.J. Two decades of urban climate research: A review of turbulence, exchanges of energy and water, and the urban heat island. Int. J. Climatol. 2003, 23, 1–26. [Google Scholar] [CrossRef]
- Fujibe, F. Long-term surface wind changes in the Tokyo metropolitan area in the afternoon of sunny days in the warm season. J. Meteorol. Soc. Jpn. Ser. II 2003, 81, 141–149. [Google Scholar] [CrossRef]
- Zong, L.; Liu, S.; Yang, Y.; Ren, G.; Li, Y. Synergistic Influence of Local Climate Zones and Wind Speeds on the Urban Heat Island and Heat Waves in the Megacity of Beijing, China. Front. Earth Sci. 2021, 9, 673786. [Google Scholar] [CrossRef]
- Li, Y.; Ye, H.; Sun, X.; Zheng, J.; Meng, D. Coupling analysis of the thermal landscape and environmental carrying capacity of urban expansion in Beijing (China) over the past 35 years. Sustainability 2021, 13, 584. [Google Scholar] [CrossRef]
- Shi, T.; Huang, Y.; Wang, H.; Shi, C.; Yang, Y. Influence of Urbanization on the Thermal Environment of Meteorological Stations: Satellite-observational Evidence. Adv. Clim. Chang. Res. 2015, 6, 7–15. [Google Scholar] [CrossRef]
- Li, Y.; Shi, T.; Yang, Y.; Wu, B.; Wang, L.; Shi, C.; Guo, J.; Ji, C.; Wen, H. Satellite-based Investigation and Evaluation of the Observational Environment of Meteorological Stations in Anhui Province. Pure Appl. Geophys. 2015, 172, 1735–1749. [Google Scholar] [CrossRef]
- Wang, C.; Wei, X.; Yan, J.; Jin, L. Grade evaluation of detection environment of meteorological stations in Beijing. J. Appl. Meteor. Sci. 2019, 30, 117–128. [Google Scholar] [CrossRef]
- Comprehensive Observation Department of China Meteorological Administration. Basic Information Change Table of National Surface Meteorological Observation Station; China Meterological Administration: Beijing, China, 2015. (In Chinese)
- Meteorological Observation Centre of CMA. Investigation and Evaluation Report on Detection Environment of National Surface Meteorological Observation Station and Aerological Station; China Meterological Administration: Beijing, China, 2013. (In Chinese)
- Ana, C.L.M.P.; Payésa, T.; Rozely, F.D.S. The conservation success over time: Evaluating the land use and cover change in a protected area under a long re-categorization process. Land Use Policy 2013, 30, 177–185. [Google Scholar] [CrossRef]
- Yang, J.; Huang, X. The 30 m annual land cover dataset and its dynamics in China from 1990 to 2019. Earth Syst. Sci. Data 2021, 13, 3907–3925. [Google Scholar] [CrossRef]
- Cai, X.H. Footprint analysis in micrometeorology and its extended applications. Chin. J. Atmos. Sci. 2008, 32, 123–132. (In Chinese) [Google Scholar] [CrossRef]
- Yang, Y.; Zhang, M.; Li, Q.; Chen, B.; Luo, M. Modulations of surface thermal environment and agricultural activity on intraseasonal variations of summer diurnal temperature range in the Yangtze River Delta of China. Sci. Total Environ. 2020, 736, 139445. [Google Scholar] [CrossRef] [PubMed]
- Li, J.; Song, C.; Cao, L.; Zhu, F.; Meng, X.; Wu, J. Impacts of landscape structure on surface urban heat islands: A case study of Shanghai, China. Remote Sens. Environ. 2011, 115, 3249–3263. [Google Scholar] [CrossRef]
- Ren, G.; Li, J.; Ren, Y.; Chu, Z.; Zhang, A.; Zhou, Y.; Zhang, L.; Zhang, Y.; Bian, T. An integrated procedure to determine a reference station network for evaluating and adjusting urban bias in surface air temperature data. J. Appl. Meteorol. Climatol. 2015, 54, 1248–1266. (In Chinese) [Google Scholar] [CrossRef]
- Wu, J. Landscape Ecology, Pattern, Process, Scale and Grade; Higher Education Press: Beijing, China, 2000; pp. 107–115. [Google Scholar]
- Liu, J.; Kuang, W.; Zhang, Z.; Xu, L.; Qin, Y.; Ning, J. Spatiotemporal characteristics, patterns and causes of land use changes in China since the late 1980s. Acta Geogr. Sin. 2014, 69, 3–14. (In Chinese) [Google Scholar] [CrossRef]
- Li, Q. Statistical modeling experiment of land precipitation variations since the start of the 20th century with external forcing factors. Chin. Sci. Bull. 2020, 65, 2266–2278. [Google Scholar] [CrossRef]
- Smola, A.J.; Schölkopf, B. A tutorial on support vector regression. Stat. Comput. 2004, 14, 199–222. [Google Scholar] [CrossRef]
- Breiman, L. Random Forests. Mach. Learn. 2001, 45, 5–32. [Google Scholar] [CrossRef]
- Hastie, T.; Tibshirani, R.; Friedman, J. The Elements of Statistical Learning: Data Mining, Inference, and Prediction, 2nd ed.; Springer Science + Business Media, LLC: New York, NY, USA, 2009. [Google Scholar]
- Zeng, Z.; Wang, Z.; Gui, K.; Yan, X.; Gao, M.; Luo, M.; Geng, H.; Liao, T.; Li, X.; An, J. Daily global solar radiation in China estimated from high-density meteorological observations: A random forest model framework. Earth Space Sci. 2020, 7, e2019EA001058. [Google Scholar] [CrossRef]
- Li, S.; Shan, J. Adaptive Geometric Interval Classifier. SPRS Int. J. Geo-Inf. 2022, 11, 430. [Google Scholar] [CrossRef]
- Zeng, Y.; Zhang, S.; Zhang, H.; Huang, W.; Liu, H. Study on urban heat island effects and its associated surface indicators. Remote Sens. Technol. Appl. 2010, 25, 1–7. [Google Scholar] [CrossRef]
- Zhao, L.; Oppenheimer, M.; Zhu, Q.; Liu, X. Interactions between urban heat islands and heat waves. Environ. Res. Lett. 2018, 13, 034003. [Google Scholar] [CrossRef]
- Knight, S.; Smith, C.; Roberts, M. Mapping Manchester’s urban heat island. Weather 2010, 65, 188–193. [Google Scholar] [CrossRef]
- Miao, S.; Dou, J.; Chen, F.; Li, J.; Li, A. Analysis of observations on the urban surface energy balance in Beijing. Sci. China Earth Sci. 2012, 55, 1881–1890. [Google Scholar] [CrossRef]
- Estoque, R.C.; Murayama, Y.; Myint, S.W. Effects of landscape composition and pattern on land surface temperature: An urban heat island study in the megacities of Southeast Asia. Sci. Total Environ. 2017, 577, 349–359. [Google Scholar] [CrossRef]
- Givoni, B. Urban design for hot humid region. Renew. Energy 1994, 5, 1047–1053. [Google Scholar] [CrossRef]
- Shashua-Bar, L.; Hoffman, M.E. Vegetation as climatic component in the design of an urban street-an empirical model for predicting the cooling effect of urban green areas with trees. Energy Build. 2000, 31, 221–235. [Google Scholar] [CrossRef]
- Chun, B.; Guldmann, J.M. Spatial statistical analysis and simulation of the urban heat island in high-density central cities. Landsc. Urban Plan. 2014, 125, 76–88. [Google Scholar] [CrossRef]
- Zheng, Z.; Zhou, W.; Yan, J.; Qian, Y.; Wang, J.; Li, W. The higher, the cooler? Effects of building height on land surface temperatures in residential areas of Beijing. Phys. Chem. Earth 2019, 110, 149–156. [Google Scholar] [CrossRef]
- Guo, A.; He, T.; Yue, W.; Xiao, W.; Yang, Y.; Zhang, M.; Li, M. Contribution of urban trees in reducing land surface temperature: Evidence from China’s major cities. Int. J. Appl. Earth Obs. Geoinf. 2023, 125, 103570. [Google Scholar] [CrossRef]
- Zhou, X.; Okaze, T.; Ren, C.; Cai, M.; Mochida, A. Evaluation of urban heat islands using local climate zones and the influence of sea-land breeze. Sustain. Cities Soc. 2020, 55, 102060. [Google Scholar] [CrossRef]
- Yin, C.; Wang, T.; Shi, C.; Wei, W. Analysis on wind characteristics at typical sites over Chaohu Lake basin. Trans. Atmos. Sci. 2012, 35, 249–256. (In Chinese) [Google Scholar] [CrossRef]
- Wanlong, C.; Jiang, C. A numerical simulation on lake-land breeze of Qinghai Lake. J. Lake Sci. 1995, 7, 289–296. (In Chinese) [Google Scholar] [CrossRef]
- Ren, X.; Wang, Y.; Zhang, Z.; Yang, Y.; Chen, H.U. Simulation studies for Lake Taihu effect on surrounding cities thermal environment. Acta Meteorol. Sin. 2017, 75, 645–660. (In Chinese) [Google Scholar] [CrossRef]
Figure 1.
Spatial pattern of stations before relocation in Anhui Province.

Figure 2.
The land use of Hefei (a), the station location before relocation (b), and the station location after relocation (c).
Figure 2.
The land use of Hefei (a), the station location before relocation (b), and the station location after relocation (c).

Figure 3.
Comparison of parameters around Hefei station prior to and following its relocation. The land parameters (a), the landscape parameters (b), and the location parameters (c). For ease of readability, parameters with relatively small numerical values have been plotted on the secondary vertical axis. The full names of the abbreviations in the figure can be found in the appendix.
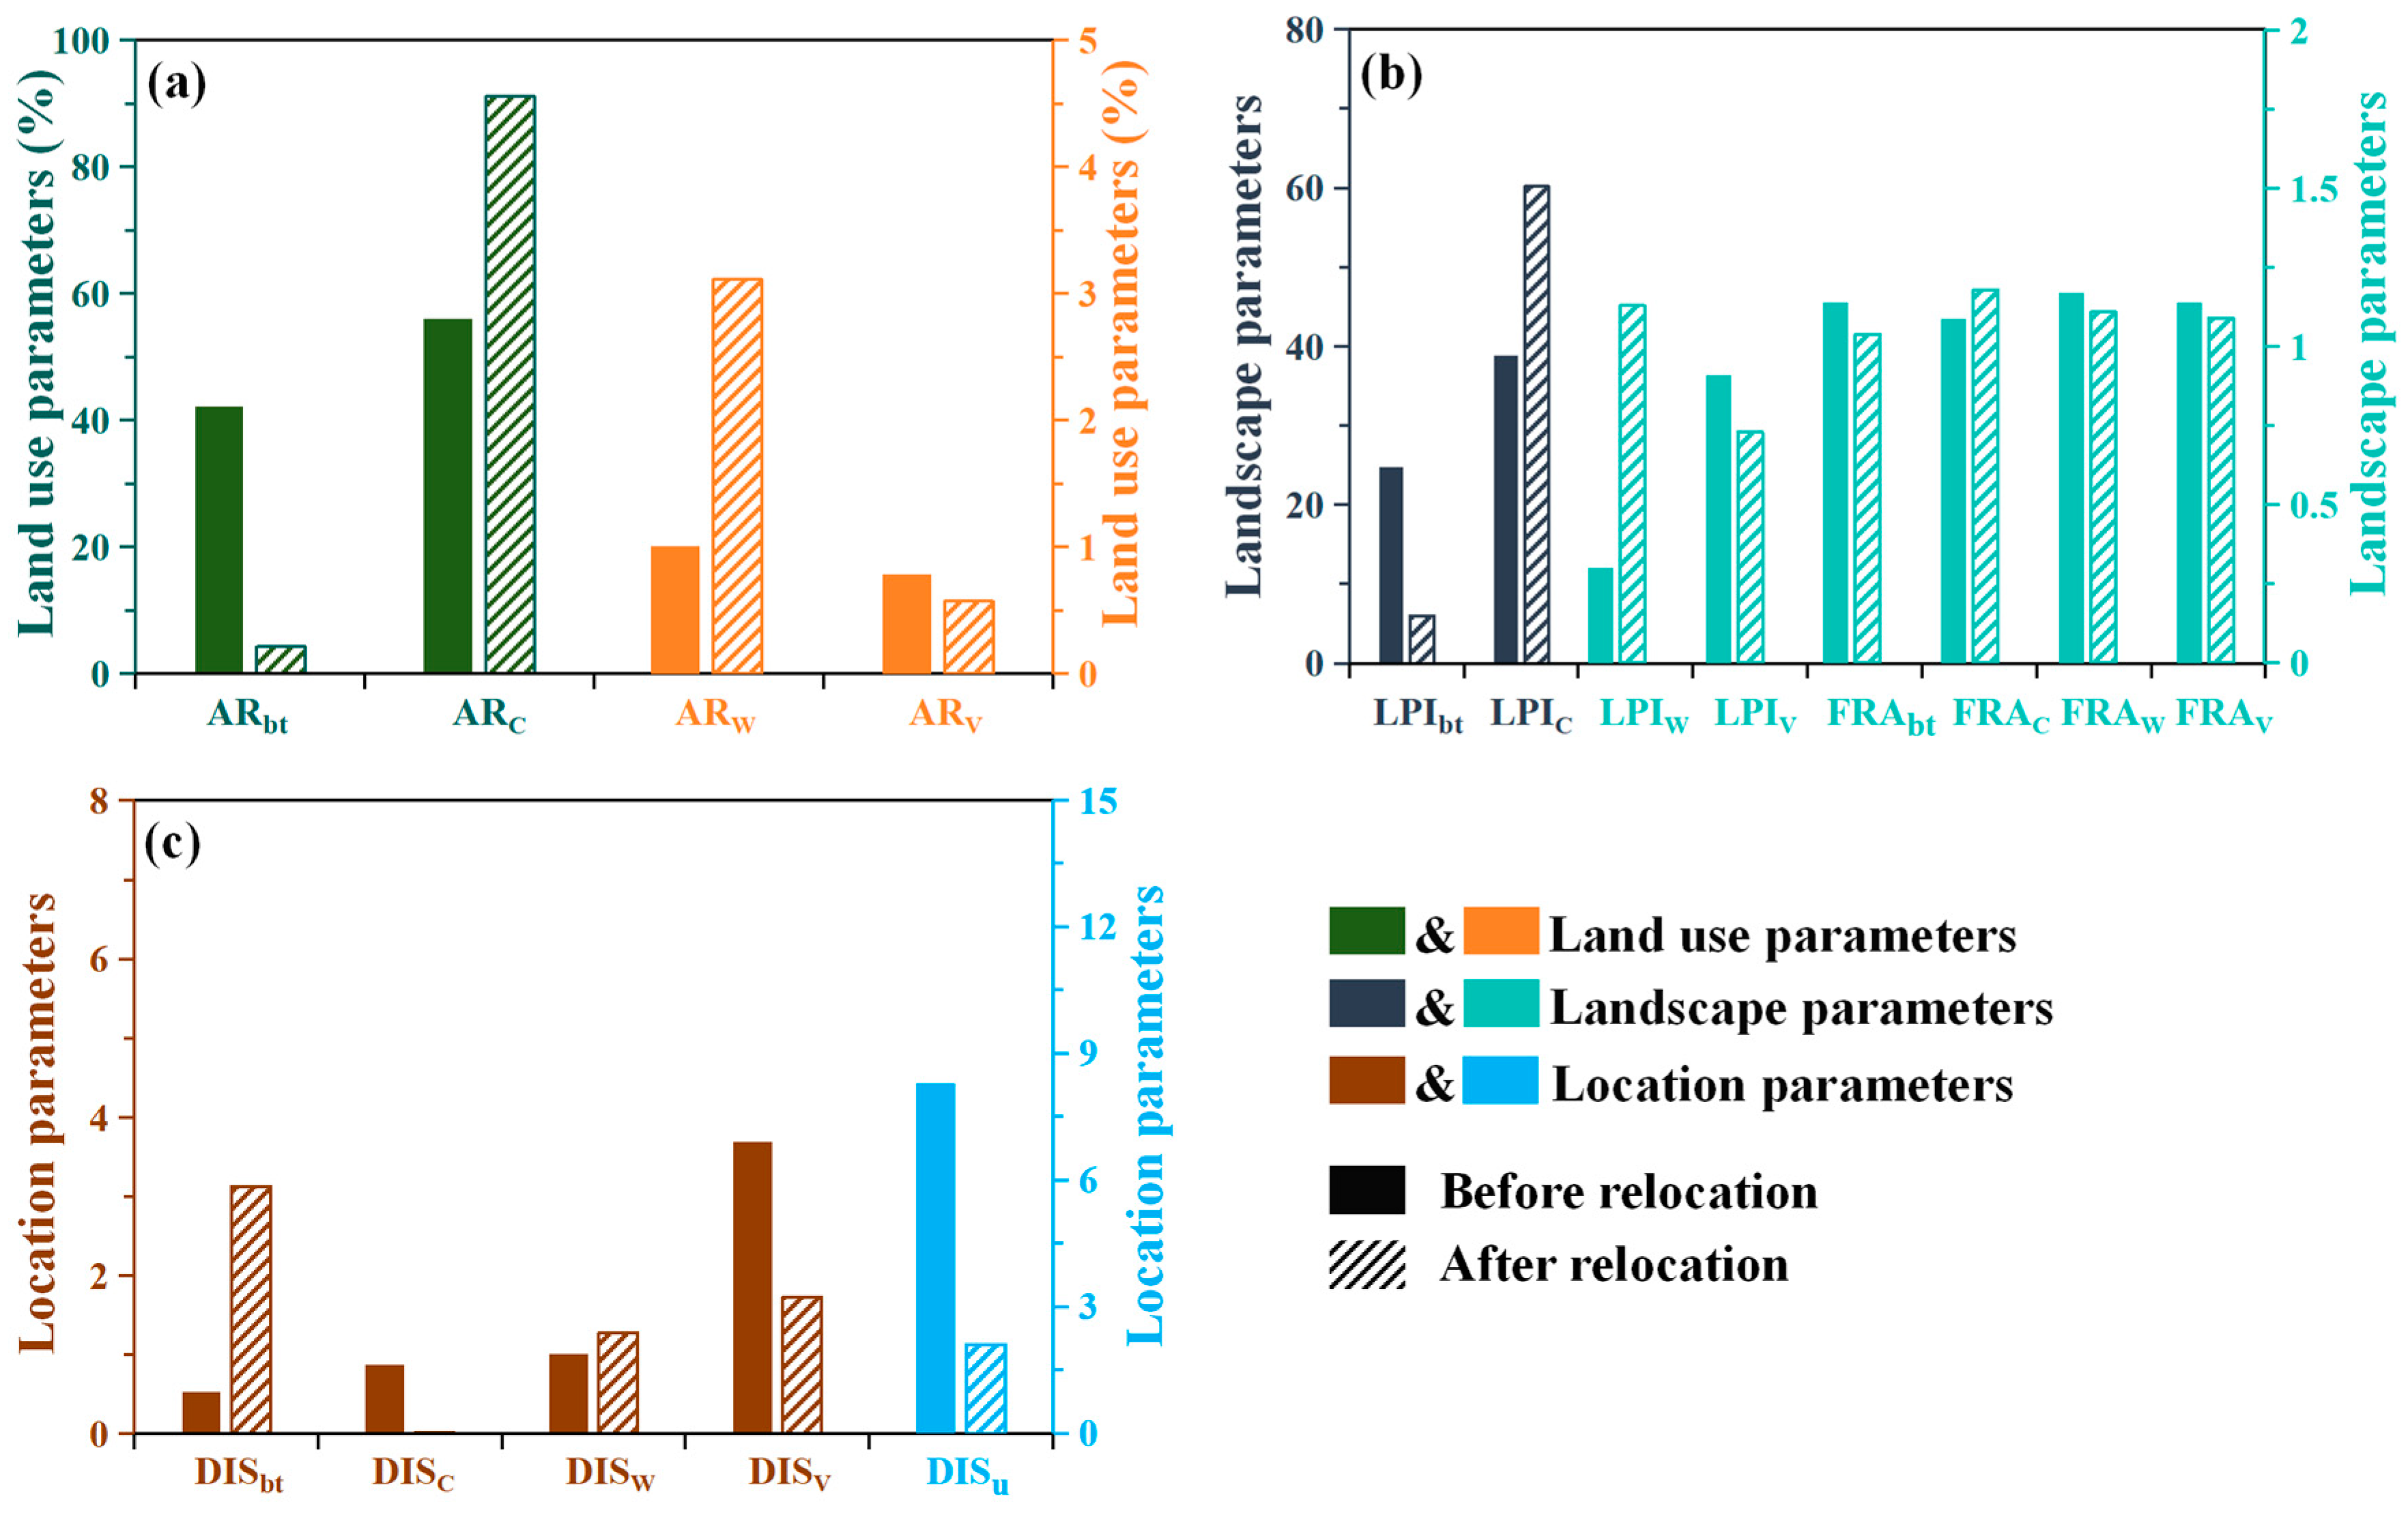
Figure 4.
Spatial pattern of CUHI of relocation station samples (a), scatter plots of CUHII of relocation station samples (b), and box plots of CUHII of relocation samples for different ranges (c).
Figure 4.
Spatial pattern of CUHI of relocation station samples (a), scatter plots of CUHII of relocation station samples (b), and box plots of CUHII of relocation samples for different ranges (c).
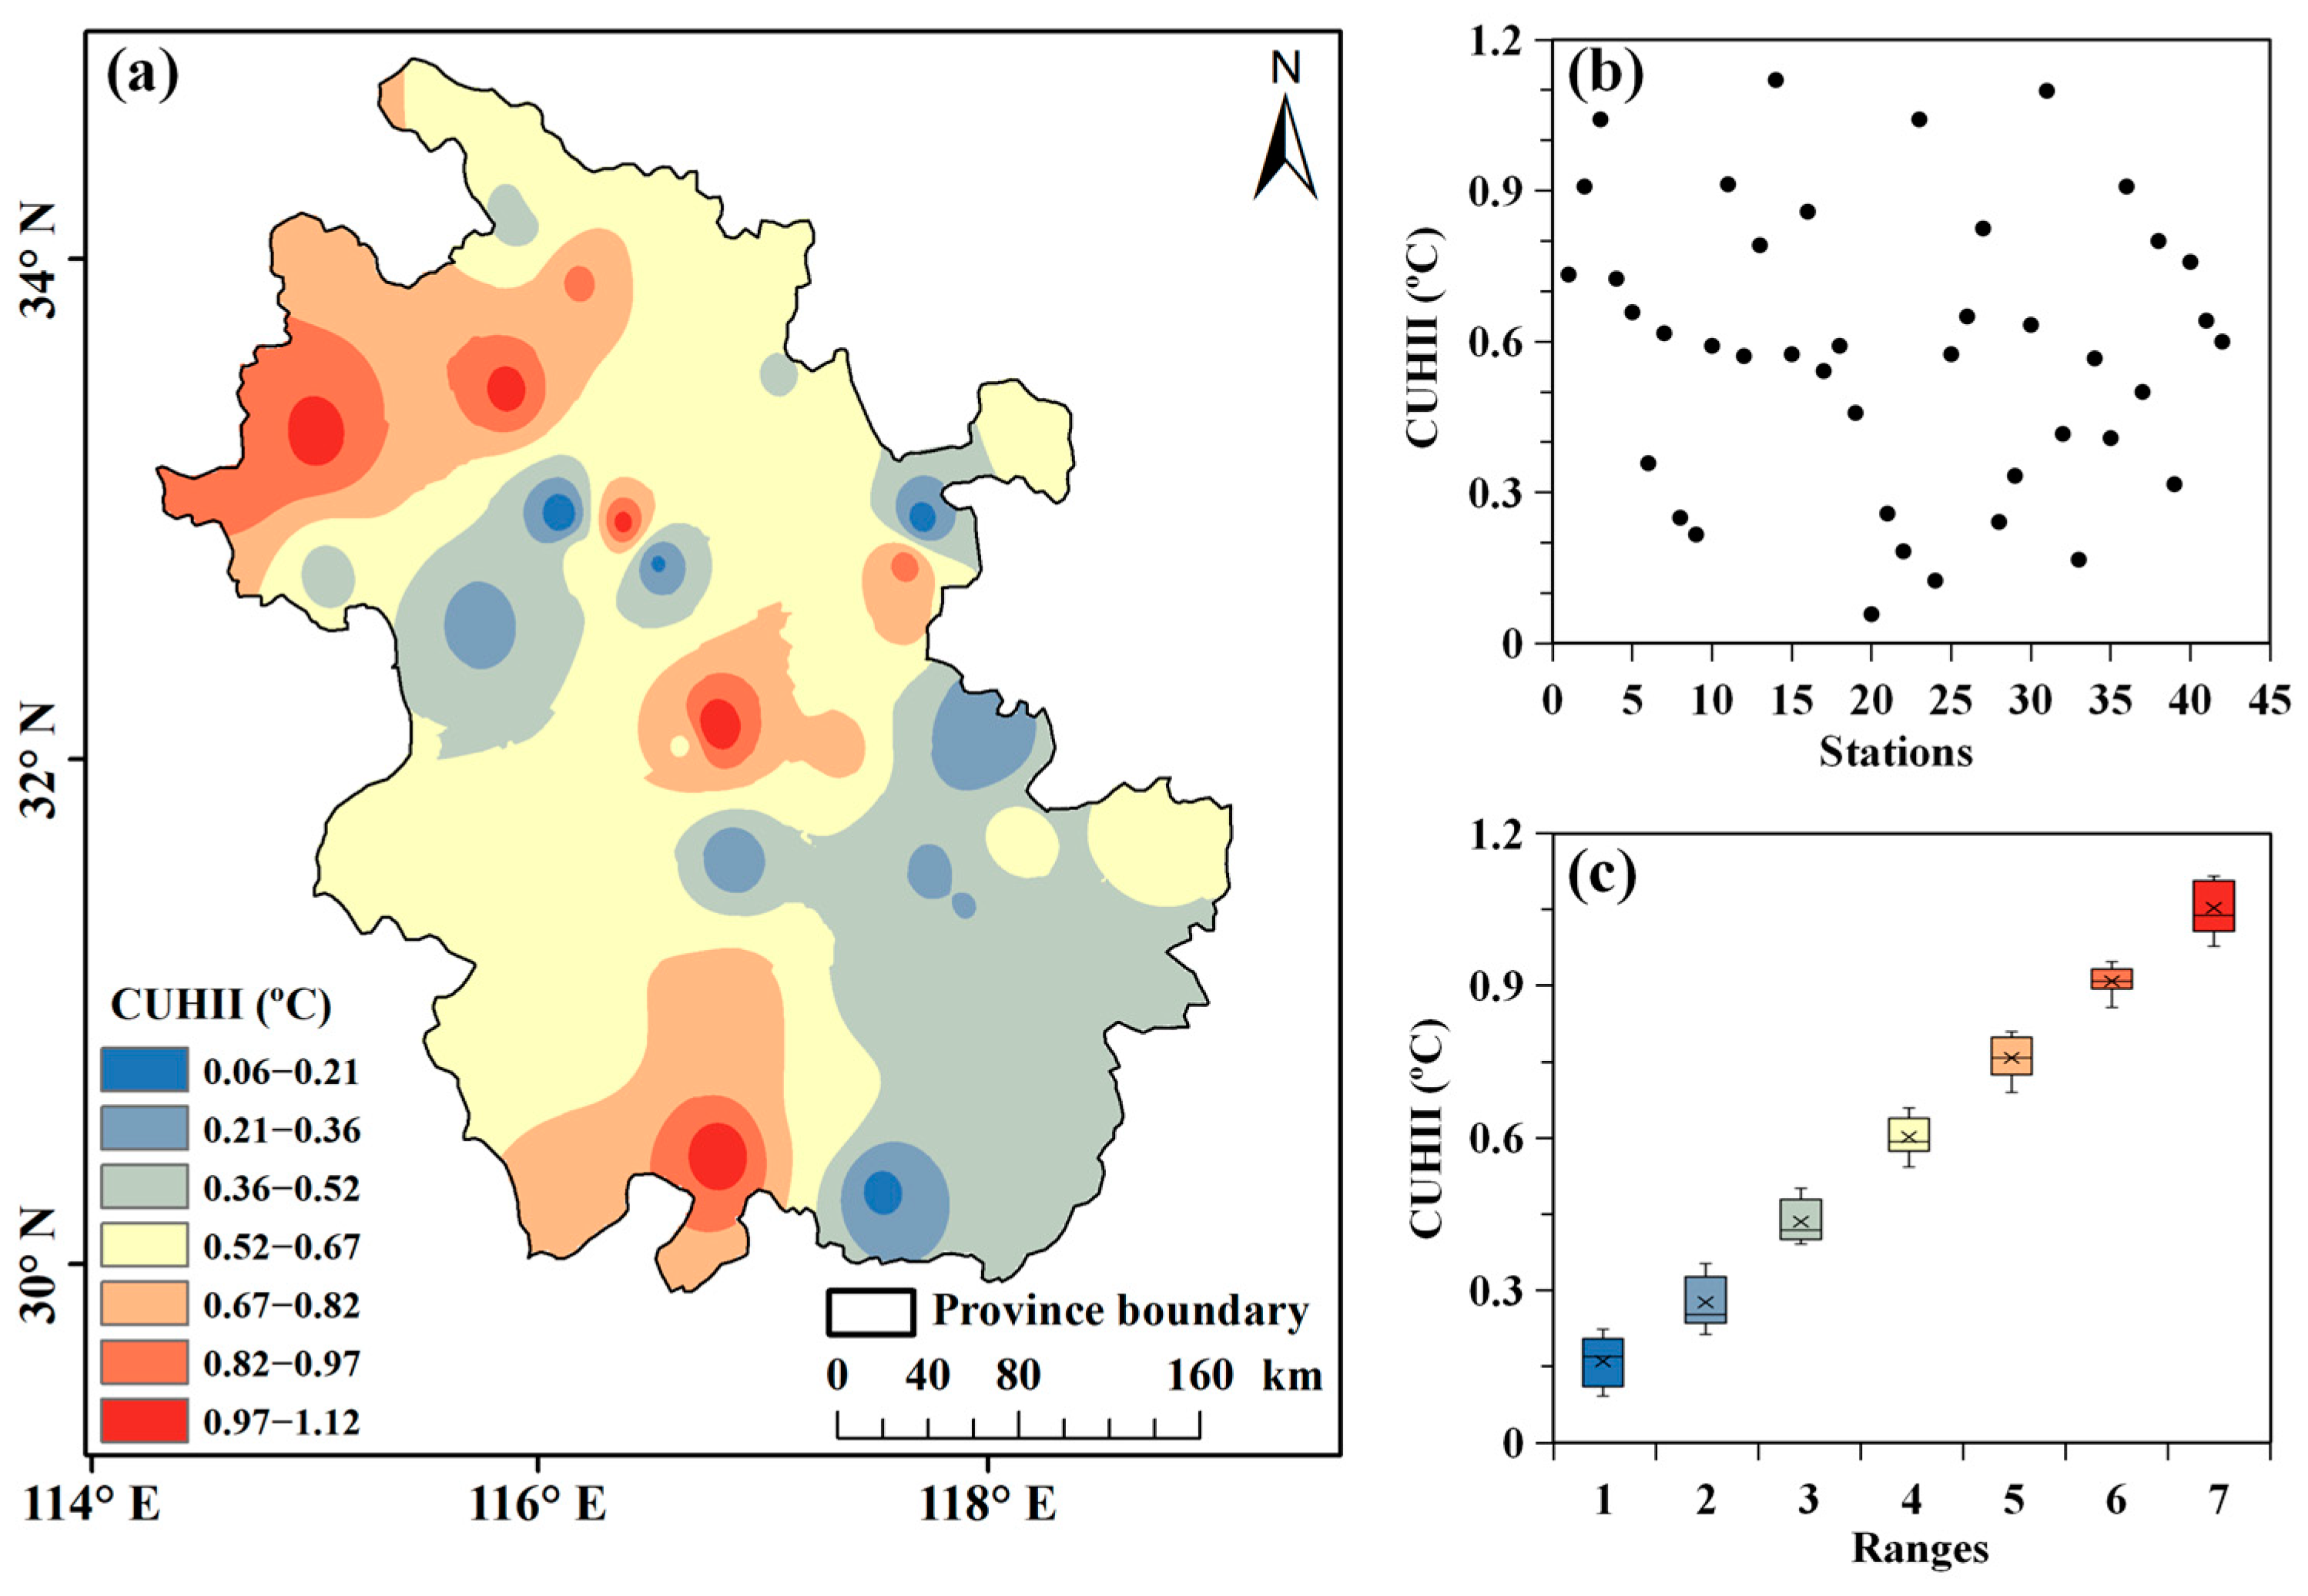
Figure 5.
The probability density distribution of urban morphological parameters surrounding the stations before relocation.
Figure 5.
The probability density distribution of urban morphological parameters surrounding the stations before relocation.
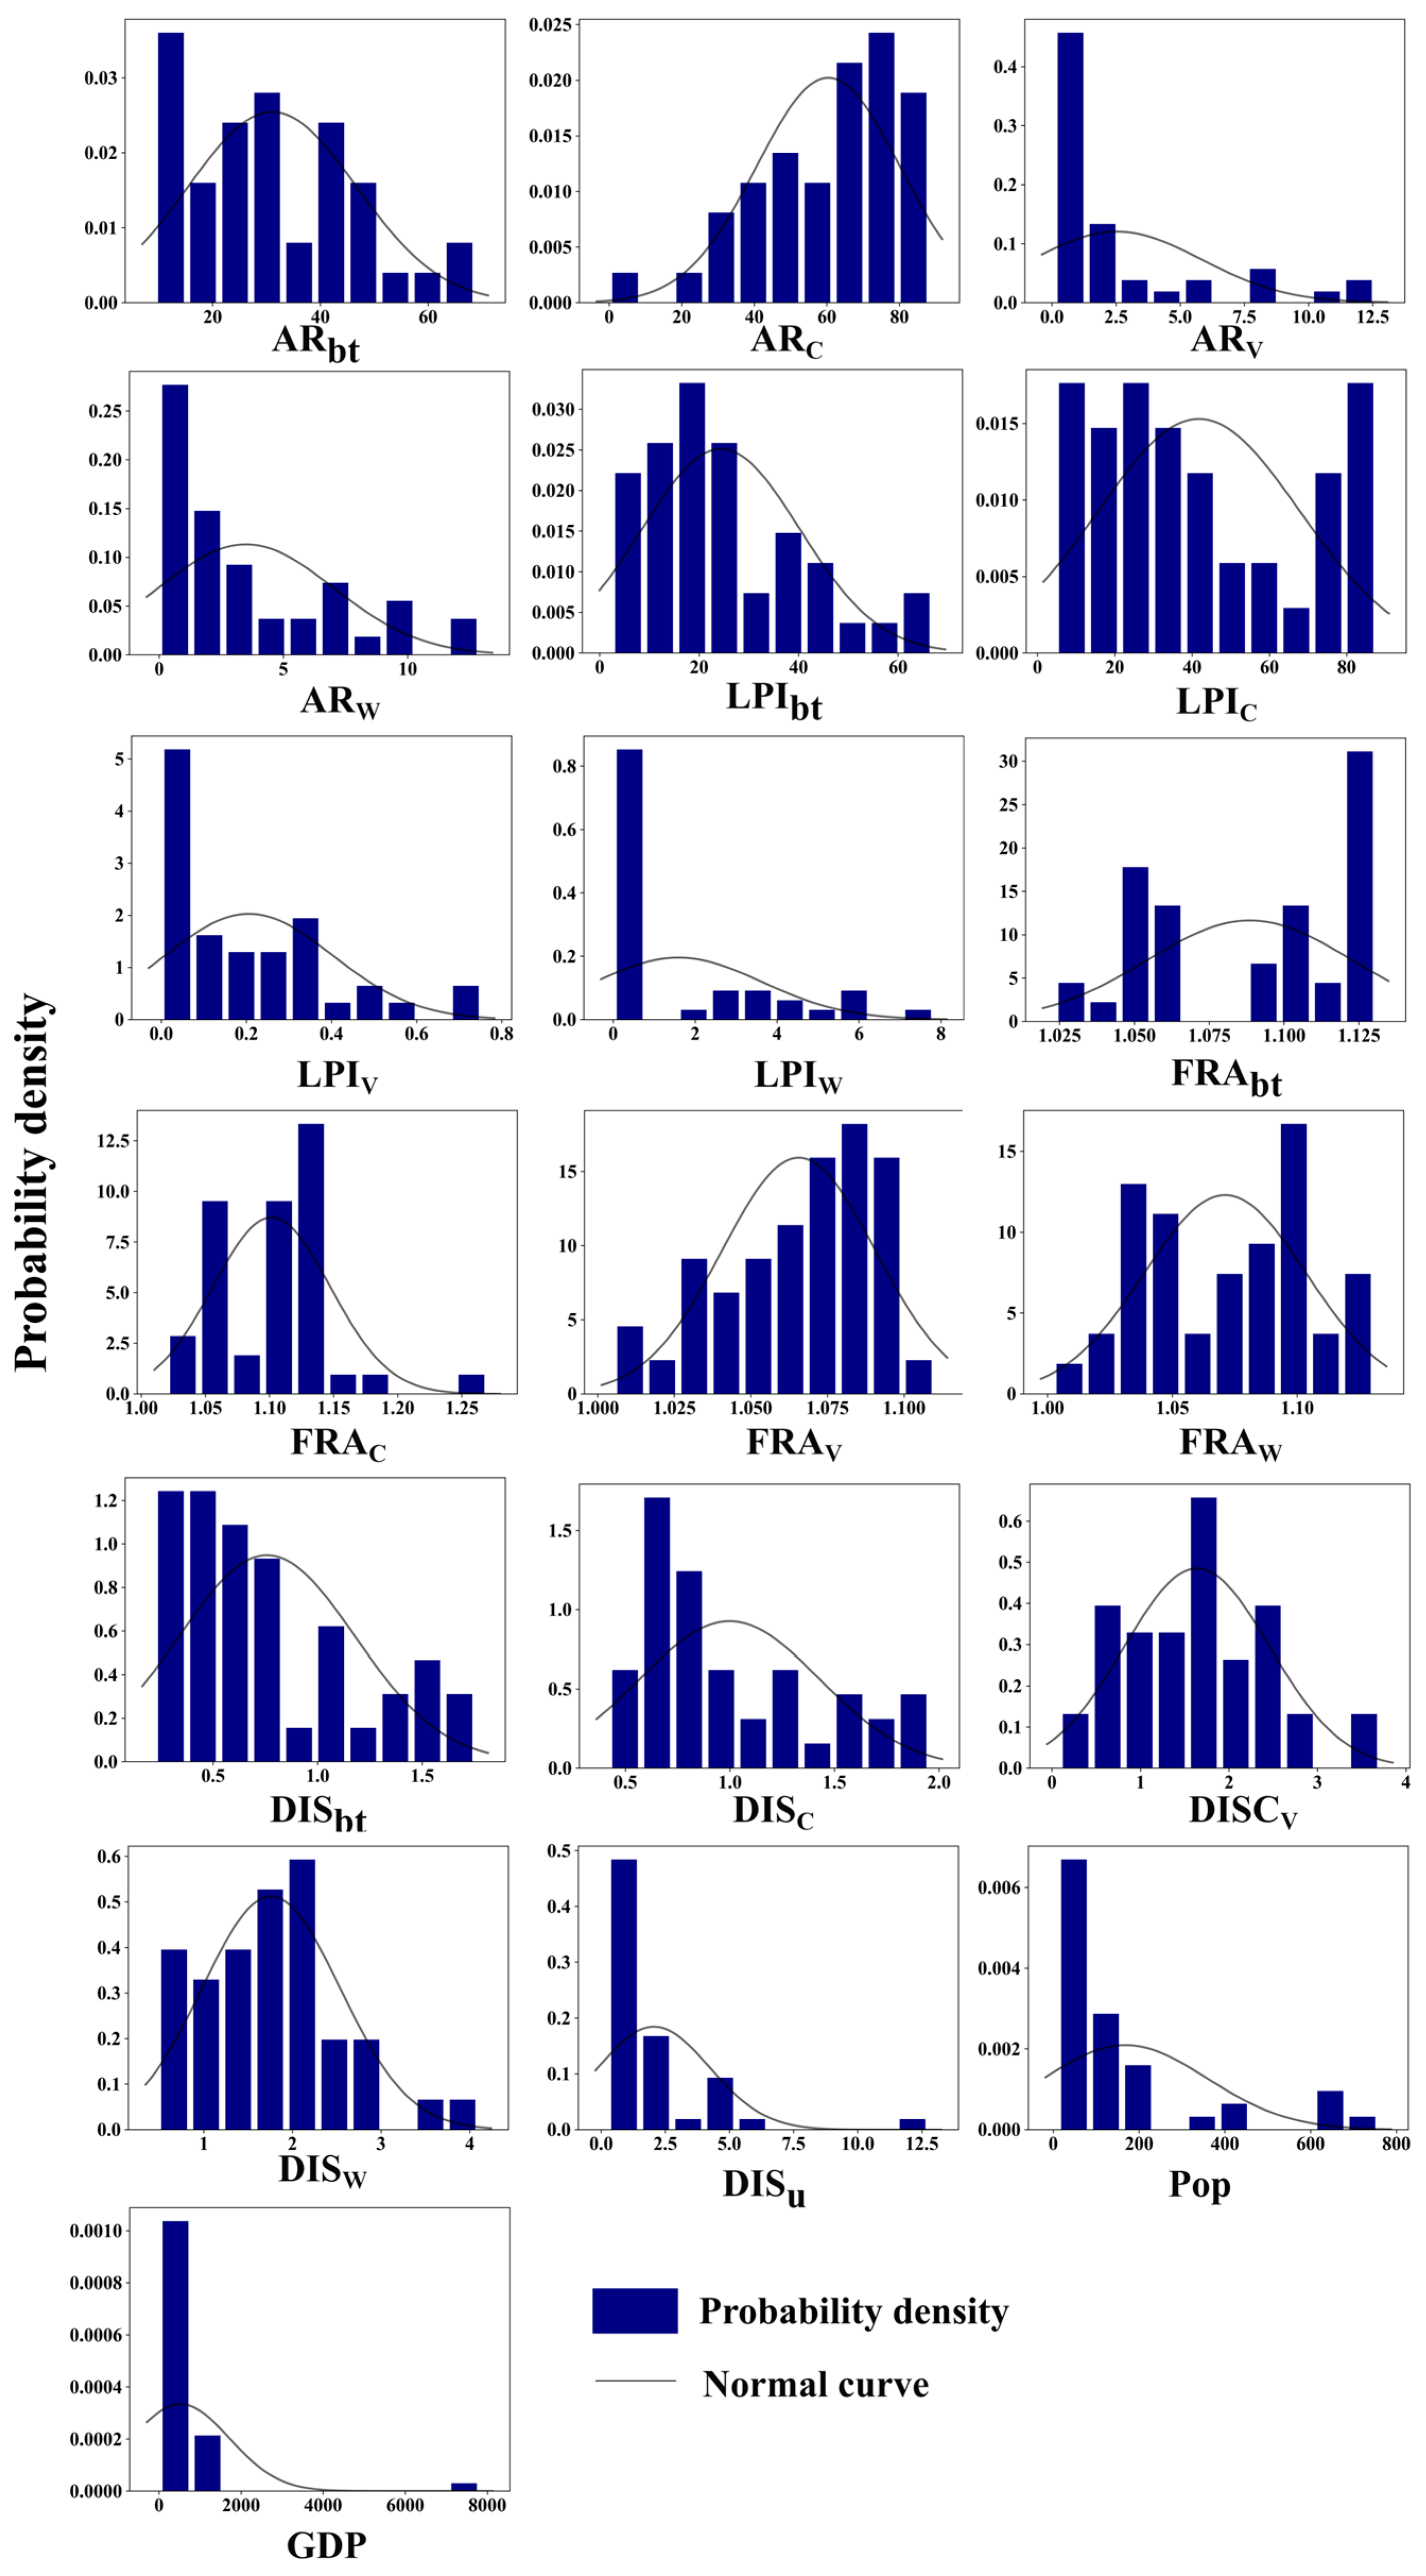
Figure 6.
The Spearman correlation analysis of CUHII and various parameters.

Figure 7.
Comparison between predicted CUHII values and observed CUHII values by conducting different models. Linear model (a), SVR model (b), RF model (c).
Figure 7.
Comparison between predicted CUHII values and observed CUHII values by conducting different models. Linear model (a), SVR model (b), RF model (c).

Figure 8.
The importance rank of urban morphological variables for the RF model predicting the CHUII.
Figure 8.
The importance rank of urban morphological variables for the RF model predicting the CHUII.
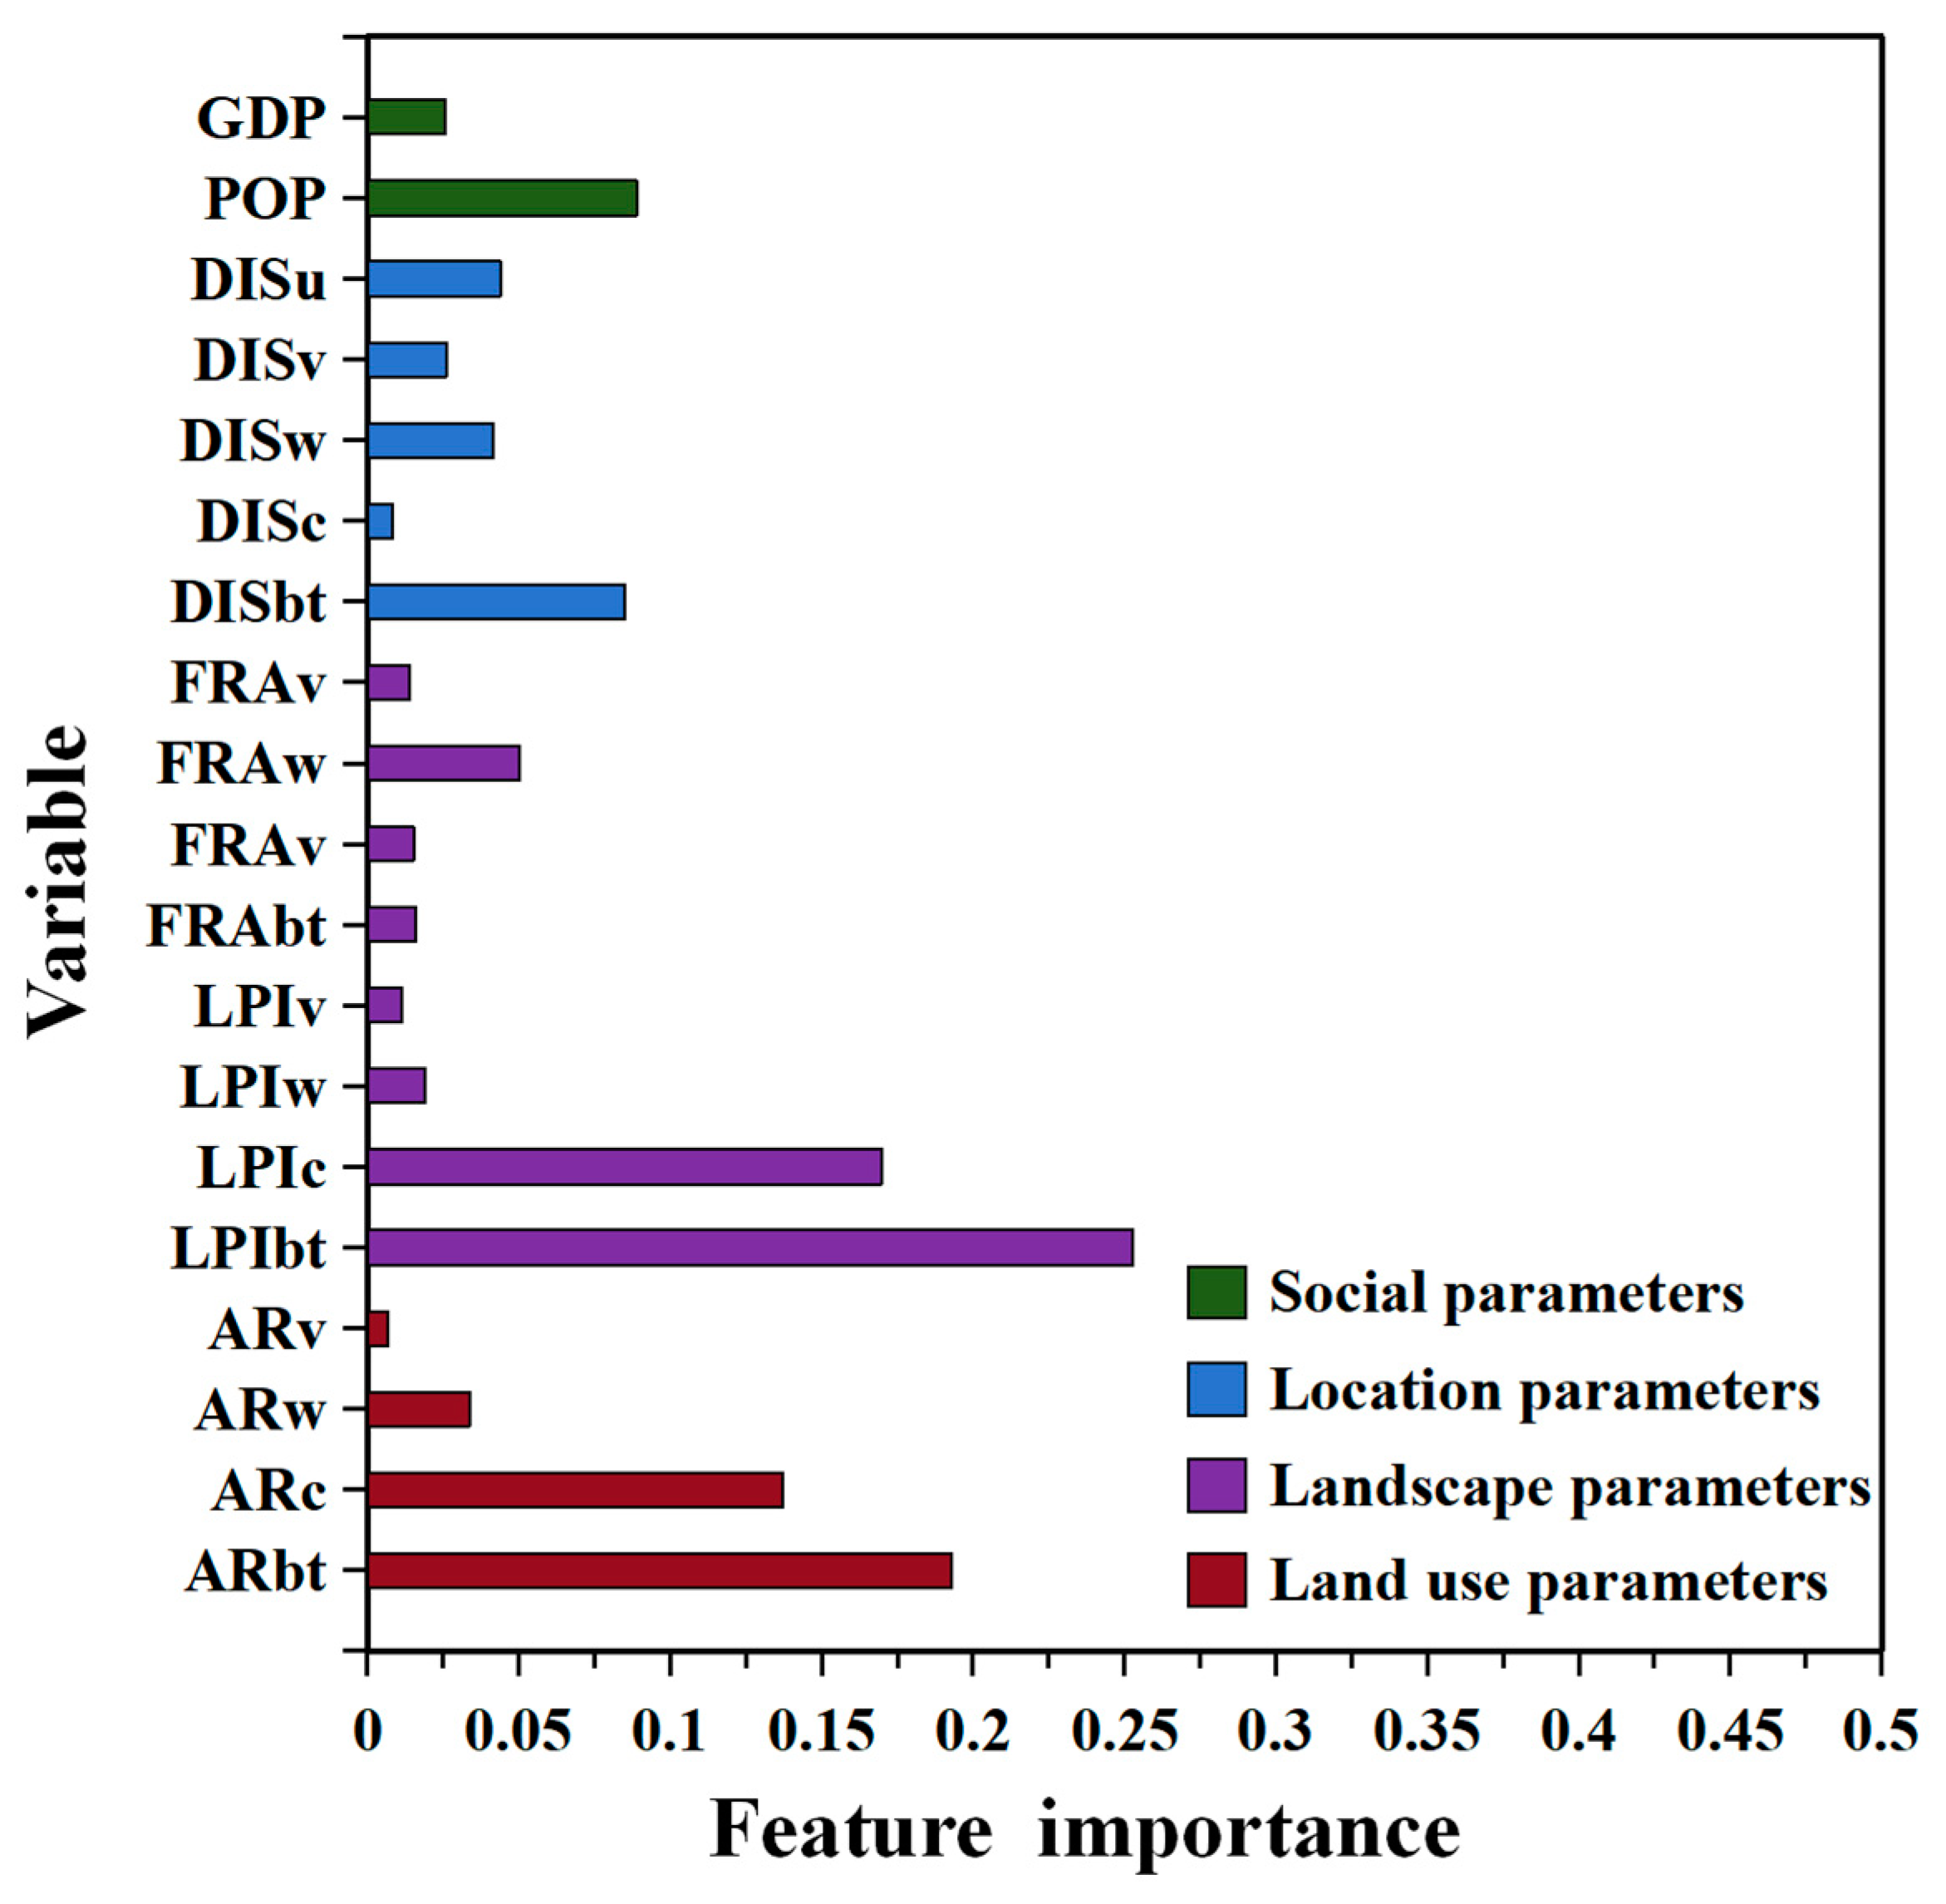
Figure 9.
Frequency and probability density distribution of daily CUHII.

Figure 10.
The location and terrain characteristics of Hefei station before and after relocation (a). The impact of local circulation on CUHII in Hefei station on 28 July 2018 (b).
Figure 10.
The location and terrain characteristics of Hefei station before and after relocation (a). The impact of local circulation on CUHII in Hefei station on 28 July 2018 (b).

Disclaimer/Publisher’s Note: The statements, opinions and data contained in all publications are solely those of the individual author(s) and contributor(s) and not of MDPI and/or the editor(s). MDPI and/or the editor(s) disclaim responsibility for any injury to people or property resulting from any ideas, methods, instructions or products referred to in the content. |
© 2024 by the authors. Licensee MDPI, Basel, Switzerland. This article is an open access article distributed under the terms and conditions of the Creative Commons Attribution (CC BY) license (https://creativecommons.org/licenses/by/4.0/).
Share and Cite
MDPI and ACS Style
Shi, T.; Yang, Y.; Qi, P. Study on the Impact of Urban Morphologies on Urban Canopy Heat Islands Based on Relocated Meteorological Stations. Remote Sens. 2024, 16, 1500. https://doi.org/10.3390/rs16091500
AMA Style
Shi T, Yang Y, Qi P. Study on the Impact of Urban Morphologies on Urban Canopy Heat Islands Based on Relocated Meteorological Stations. Remote Sensing. 2024; 16(9):1500. https://doi.org/10.3390/rs16091500
Chicago/Turabian StyleShi, Tao, Yuanjian Yang, and Ping Qi. 2024. "Study on the Impact of Urban Morphologies on Urban Canopy Heat Islands Based on Relocated Meteorological Stations" Remote Sensing 16, no. 9: 1500. https://doi.org/10.3390/rs16091500
Note that from the first issue of 2016, this journal uses article numbers instead of page numbers. See further details here.