1. Introduction
There are various plant species within the family
Mimosacea that have a strong tendency to invade, and which, from the morphological point of view, are similar to Marabú and Aroma [
1,
2,
3,
4]. However, the spontaneous propagation of both in Cuba over the last two centuries has caused a displacement of native plant communities and has formed a homogeneous landscape, with territorial and productive repercussions [
5]. Hence, there have even been considerations of exploiting them on a grand scale as a natural resource.
In most cases, the origin of colonization is due to human factors, by the transmission of organisms that establish themselves and expand into new territories, upsetting the functioning of natural eco-systems by displacing autochthonous species [
6]. The group of leguminous plants to which Marabú belongs is found within the taxonomic groups with the greatest number of species registered with such characteristics [
7,
8].
Marabú (
Dychrostachys cinerea) is a leguminous species, which is native to Africa, India, South Thailand and Malyasia, as well as other territories situated in North Australia. It has a variable morphology; nine subspecies and thirteen varieties can be distinguished, although only
Dychrostachys cinerea (L.)
subsp. africana is represented in Cuba [
9,
10,
11].
It is a small tree no bigger than 5 m in height and up to 18 cm in diameter, whose trunk has numerous branches both thick and fine, full of thorns, which usually form an impenetrable fence. The bark is either grey, greyish-brown or whitish, and bipinnate leaves of 8 to 12 cm in length. It produces a great quantity of viable seeds, which are easily dispersed by farm animal defecation, water currents and human activity itself, among other factors [
12,
13].
The strongly developed, wide radicular system guarantees the Marabú´s resistance to prolonged droughts, resilience after cutting or burning and vigorous sprouting capacity after such adversities [
10,
11,
14]. Besides, it adapts to a variety of soils, germinating in open ground and sunny areas (heliophilousa), and it would seem to find conditions favorable for its development in those places where natural vegetation has been destroyed [
15].
1.1. Marabú Expansion in Cuba
The mentioned variety is widespread over three continents, but nowhere is it considered a vegetal plague as it is on the Cuban archipelago. Its arrival in Cuba probably occurred around the middle of the XIX century, due to circumstances that are not clear, and it began to expand into the old province of Camagüey and progressively conquered new territories; according to estimations at the time, there were some 443,190 ha in the decade of the thirties of the last century [
16,
17].
In the National Agricultural Census of 1946, only one municipality of Cuba reported to be free from Marabú. Eleven municipalities had more than 9% of plots of land covered, seven had between 6.1% and 9% and 21 had 3.1% to 6%. The provinces most affected were Pinar del Río, Las Villas and Camagüey, while in the east, where there was hardly any trace around 1915 [
8,
18], it now covers on average 1.8% of plots of land.
Between 1960 and 1990, the area invaded by the plant was calculated as some 671,500 ha and today it is estimated to have increased to 1,141,550 ha, which threatens 56% of farming land [
19,
20].
Marabú has occupied both land abandoned by man due to its scarce production potential, and also ploughed areas. However, it does not flourish in wooded areas or in cultivated land. Farming areas, with an agrarian structure dominated by great extensions of land, are the most affected, through farm animal propagation [
6,
21].
All in all, the high invading potential of this species, as displayed in Cuba, is due, among other reasons, to the fact that it evolved originally in continental environments, and so has a more stable genetic patrimony and consequently competes better with autochthonous elements, the majority of which have come from island territories [
22]. In addition, there are no plagues or diseases that limit its development in the places of origin.
1.2. Characteristics of the Expansion
The colonization of Marabú led to a whole series of territorial and socioeconomical problems. Firstly, the homogenization of the landscape reduced the natural beauty of the area. This not only affected the tourist trade, but also altered the functioning of the eco-systems that Marabú invaded; affecting all components, whether biotic or abiotic, as well as the relationships that exist between them, by creating its own ecological niche [
19,
20,
22]. Secondly, the reduction of biodiversity displaced the autochthonous flora and vegetation. This is particularly important when it occurs on an island, as is the case of Cuba, which has abundant endemic species, many of which have a significantly restricted distribution area—this could promote the extinction of certain autochthonous species. And thirdly, by colonizing ground abandoned for agriculture, its later re-conversion would only be possible after large amounts of investment and considerable effort [
3,
23].
On the other hand, Marabú plays an important role in the conservation and improvement of the soil, as it wide radicular system prevents erosion, and as with other leguminous plants or shrubs, it establishes atmospheric nitrogen by establishing symbiosis with bacteria that this element capture from the air [
24]. These factors, together with their abundant and spontaneous propagation, means they are considered to be the species that plays the most important role in protecting the hydro-regulatory borders of the river basins of the country. If we bear in mind that soil degradation is the most urgent environmental problem in Cuba, we can understand better the scale of this benefit [
19,
25,
26].
The present study was carried out in the Guanabo and Itabo watersheds, close to the city of Havana. The main objectives were: (i) to analyze from a spatial point of view the expansion of Marabú (Dychrostachys cinerea) and Aroma (Acacia farnesiana) thickets during the period 1985–2005, (ii) to determine the characteristics of the areas where these species have developed, and lastly (iii) to define which variables have exerted the greatest influence on the expansion of these species. Therefore, this research is a first step toward developing applied strategies to control the plant dissemination.
2. Study Area
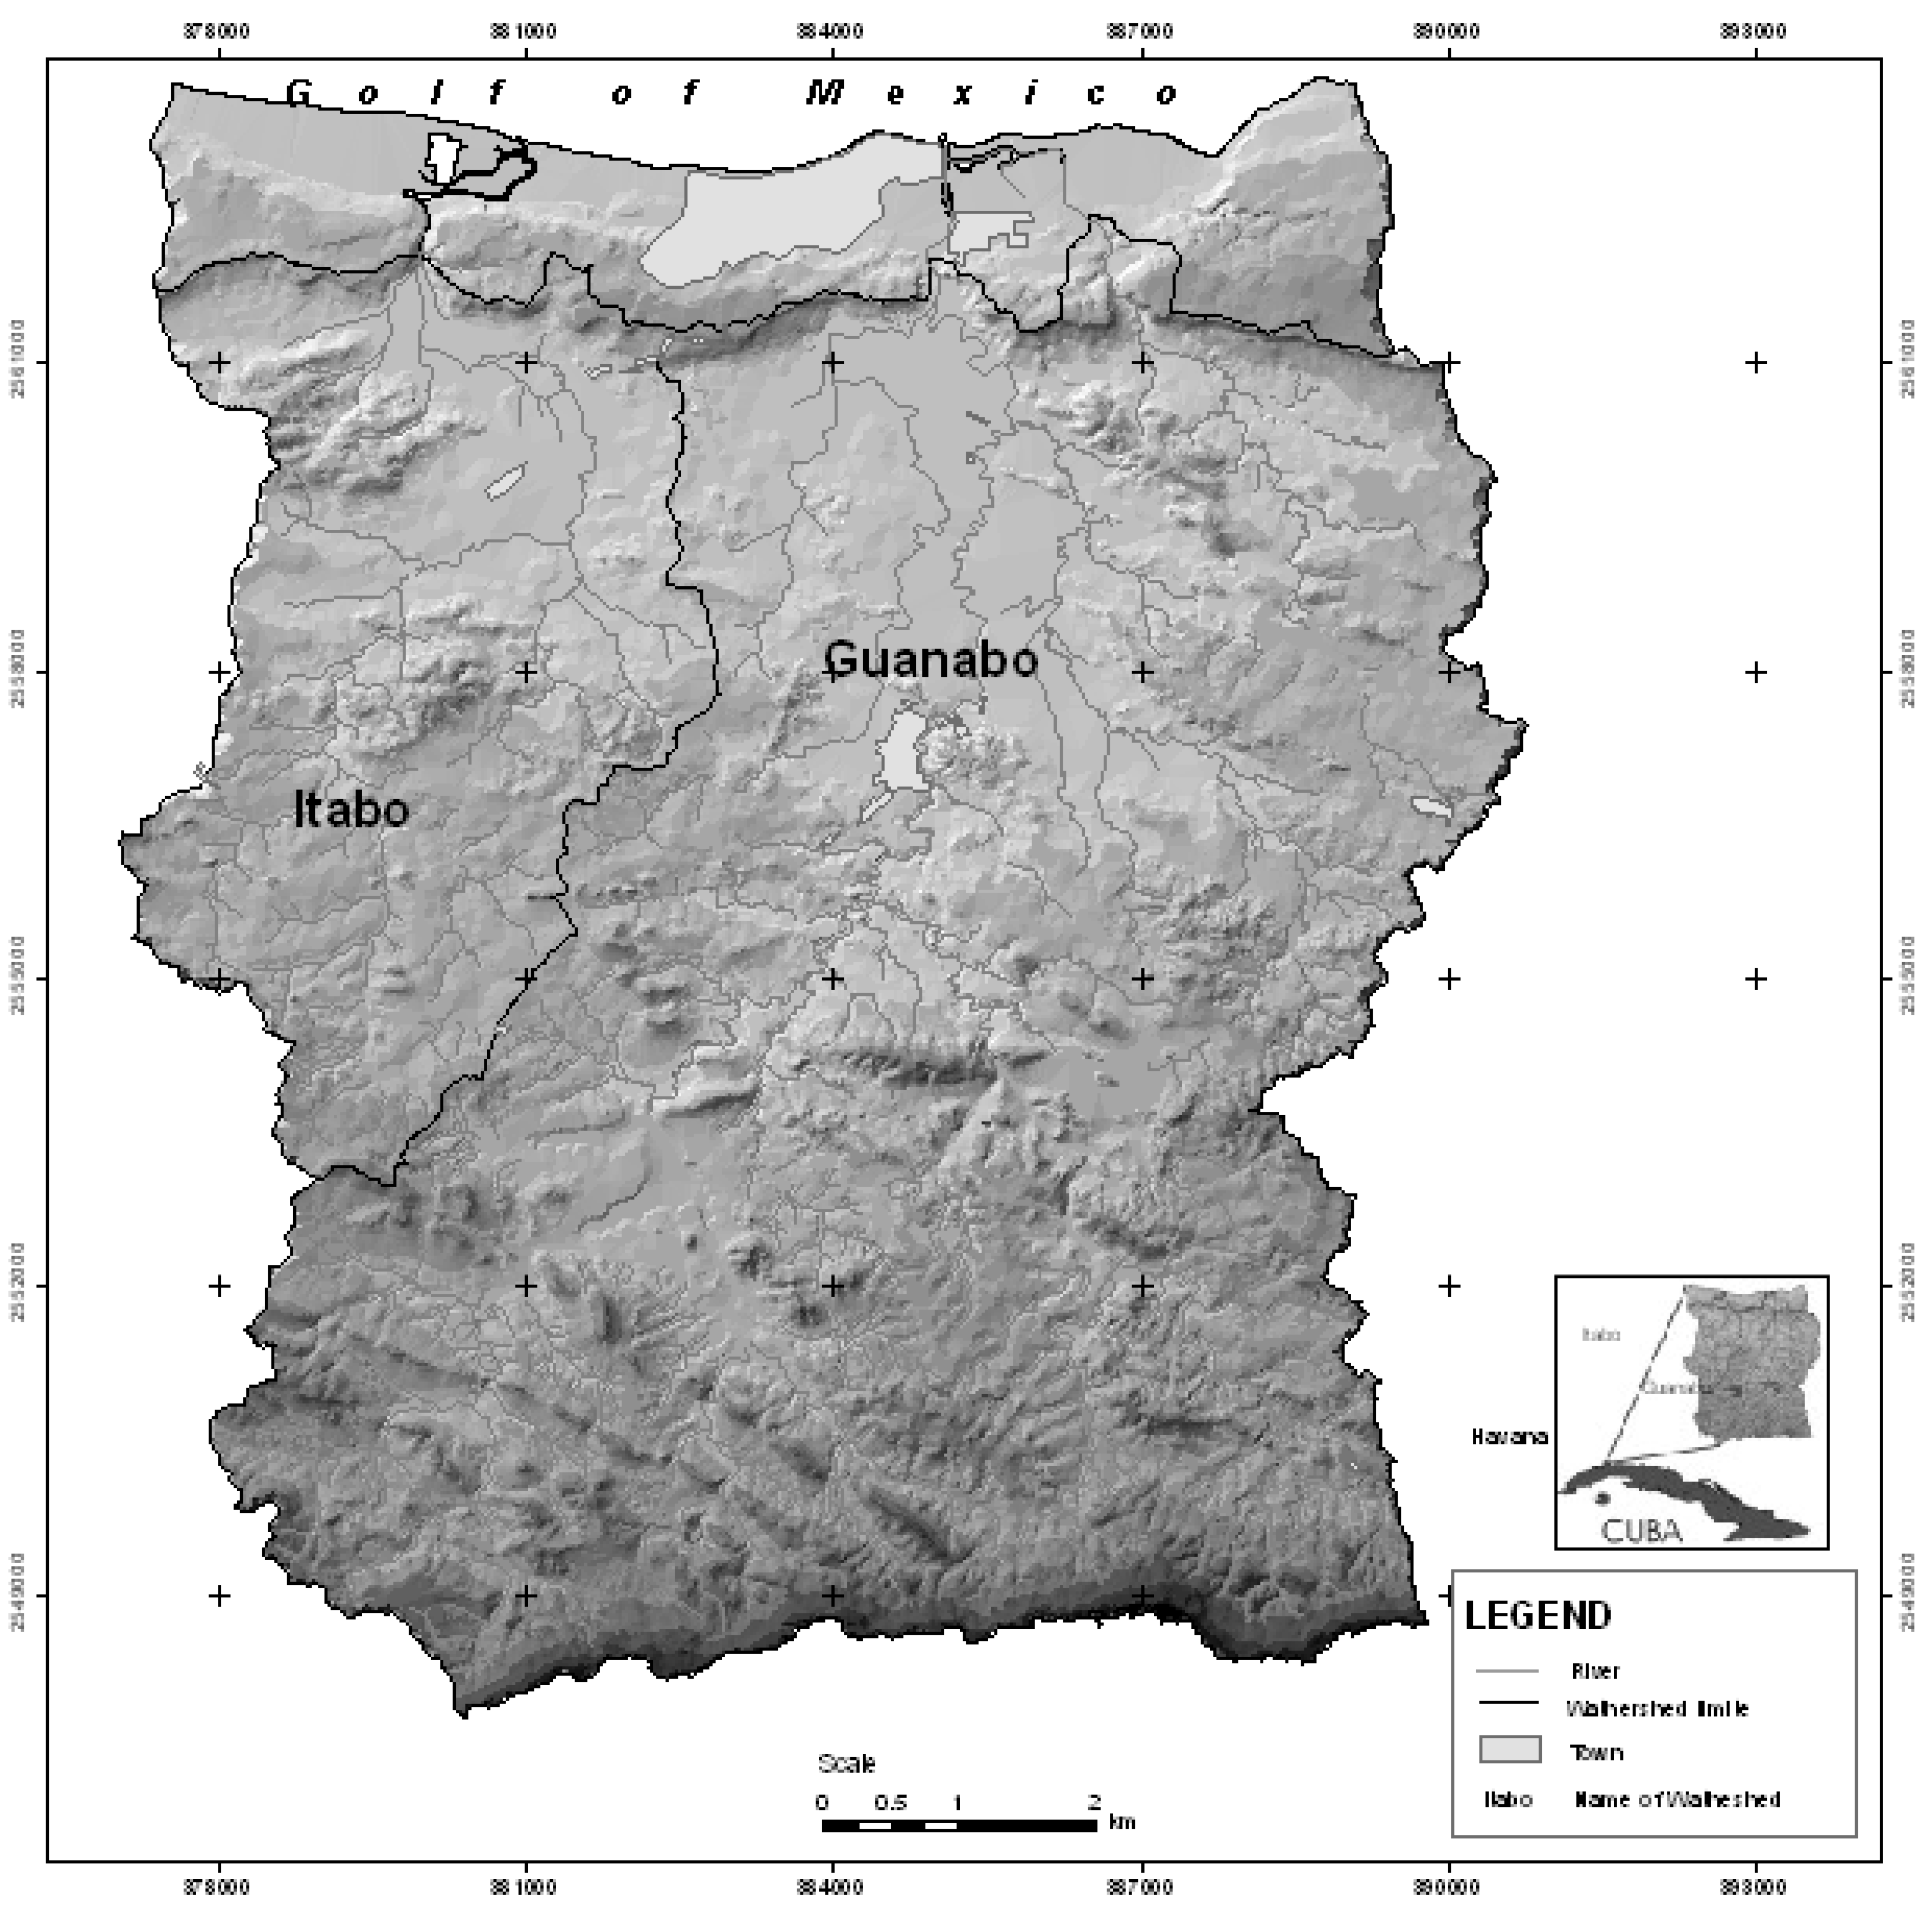
The basins of the rivers Itabo and Guanabo in the north-east of Havana have a latitude of 23°00′ to 23°10′ from the central island watershed to the north. Both partially cross the empty area of the great Havana-Matanzas anticlinal, which runs longitudinally and parallel to the coast, which is cut by the river currents (
Figure 1).
The basin of the river Guanabo, with a surface area of 199.2 km2, is located on the north-eastern border of the Havana City province, bordered on the east by the river Jaruco basin, on the west by the river basins of the Itabo and Tarara, to the south by the steep hills of Francisco Javier Lomas, Tapaste and the Jaruca steps and to the north by the Sibarimar cove, a little inlet surrounded by mangrove swamp.
The principal river, the Guanabo, begins two kilometers south of the La Coca dam at latitude 23°04′N and longitude 82°07′W at an altitude of 150 metres a.s.l., and flows north for 22.1 km, connecting with five tributaries, and coming out in Sibarimar cove.
Figure 1.
Location of the basins of the rivers Itabo and Guanabo in Havana, Cuba.
Figure 1.
Location of the basins of the rivers Itabo and Guanabo in Havana, Cuba.
The basin of the Itabo river, also called Justiz or Boca Ciega, with a surface area of 35.6 km2, is found on the northern slope, located north-west of the Guanabo river basin. It is bordered to the west with the Tarara river basin, to the east and south with the Ganabo river basin and to the north with the Sibarimar cove where it comes out. Its main current rises at latitude 23°08′N and longitude 82°11′W, at 75 m. a.s.l., coming out on the beach known as Boca Ciega, reaching a length of 17 km.
3. Methodology
3.1. Mapping of Scrubland Expansion
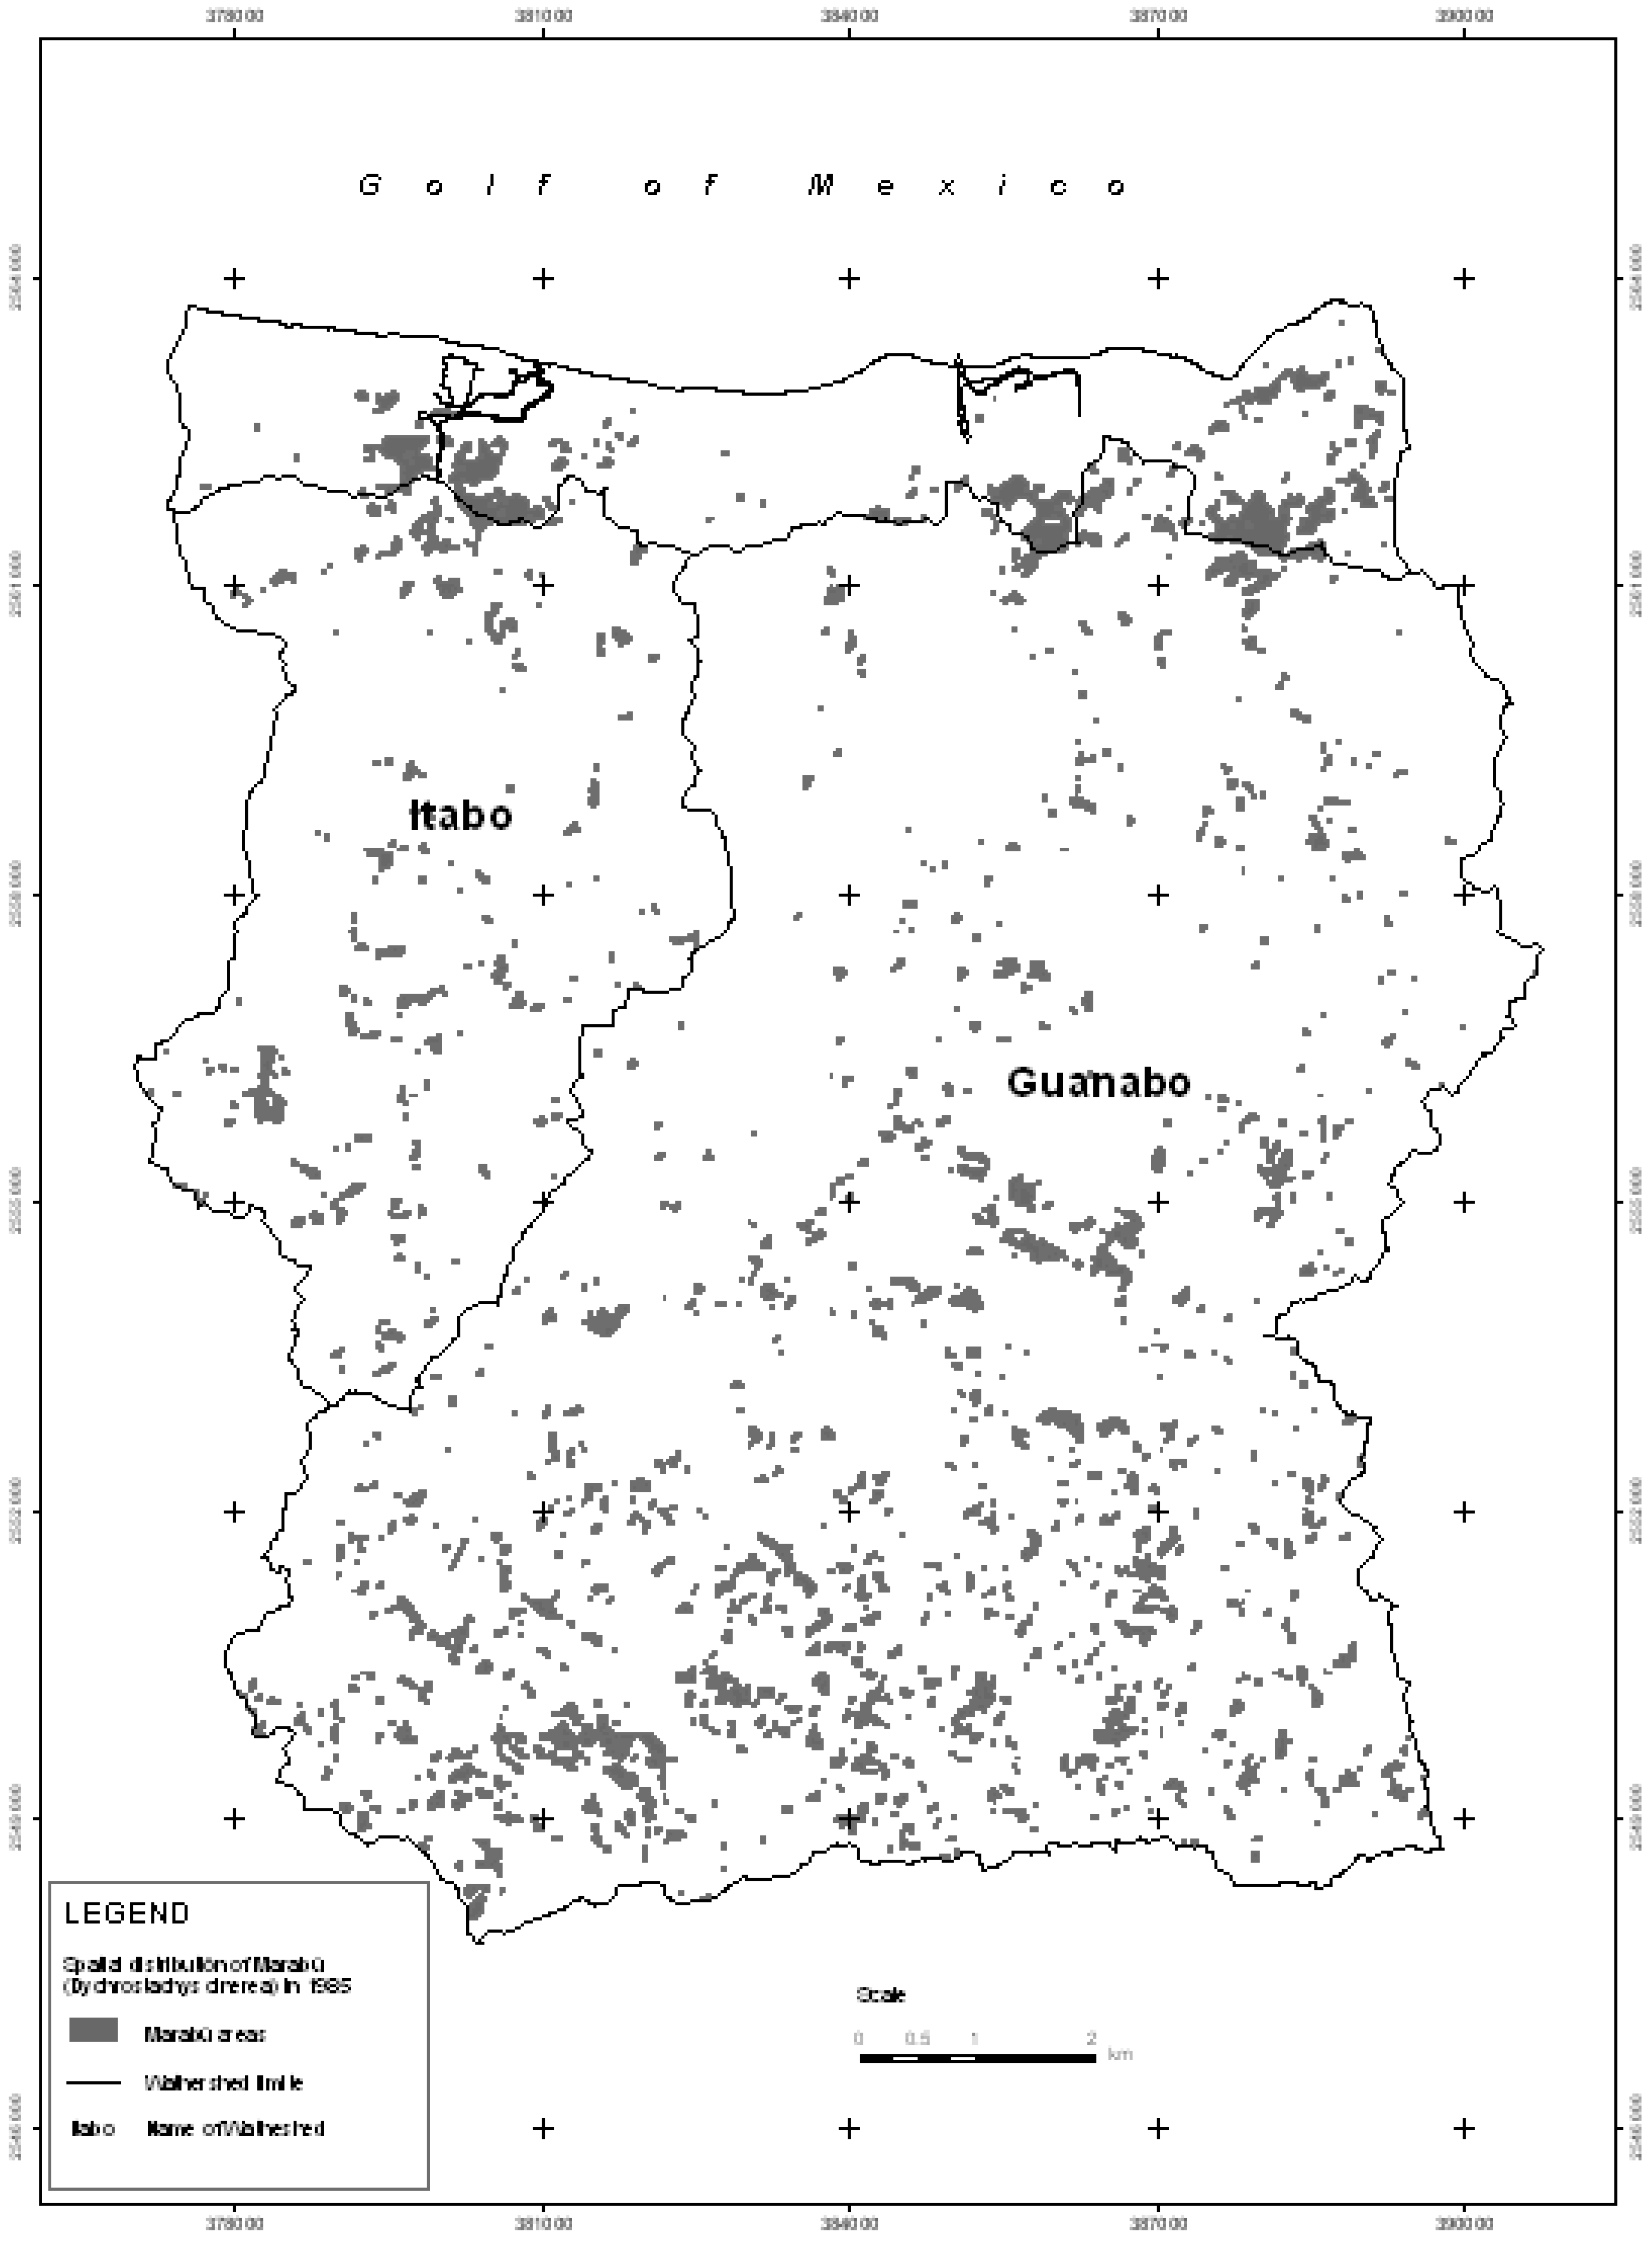
Due to the introduction of digital processing techniques of satellite imaging and particularly multi-spectral classification (supervised classification), maps were drawn up showing ground-use for the years 1985 (for which we used Landsat 7 TM) and 2005 (using Quickbird images). From both of these maps, the areas affected by the Marabú plant species (
Dychrostachys cinerea) were taken and represented on two new maps (
Figure 2 and
Figure 3), to facilitate the study of their expansion [
27,
28].
Figure 2.
Spatial distribution of Marabú (Dychrostachys cinerea) in 1985.
Figure 2.
Spatial distribution of Marabú (Dychrostachys cinerea) in 1985.
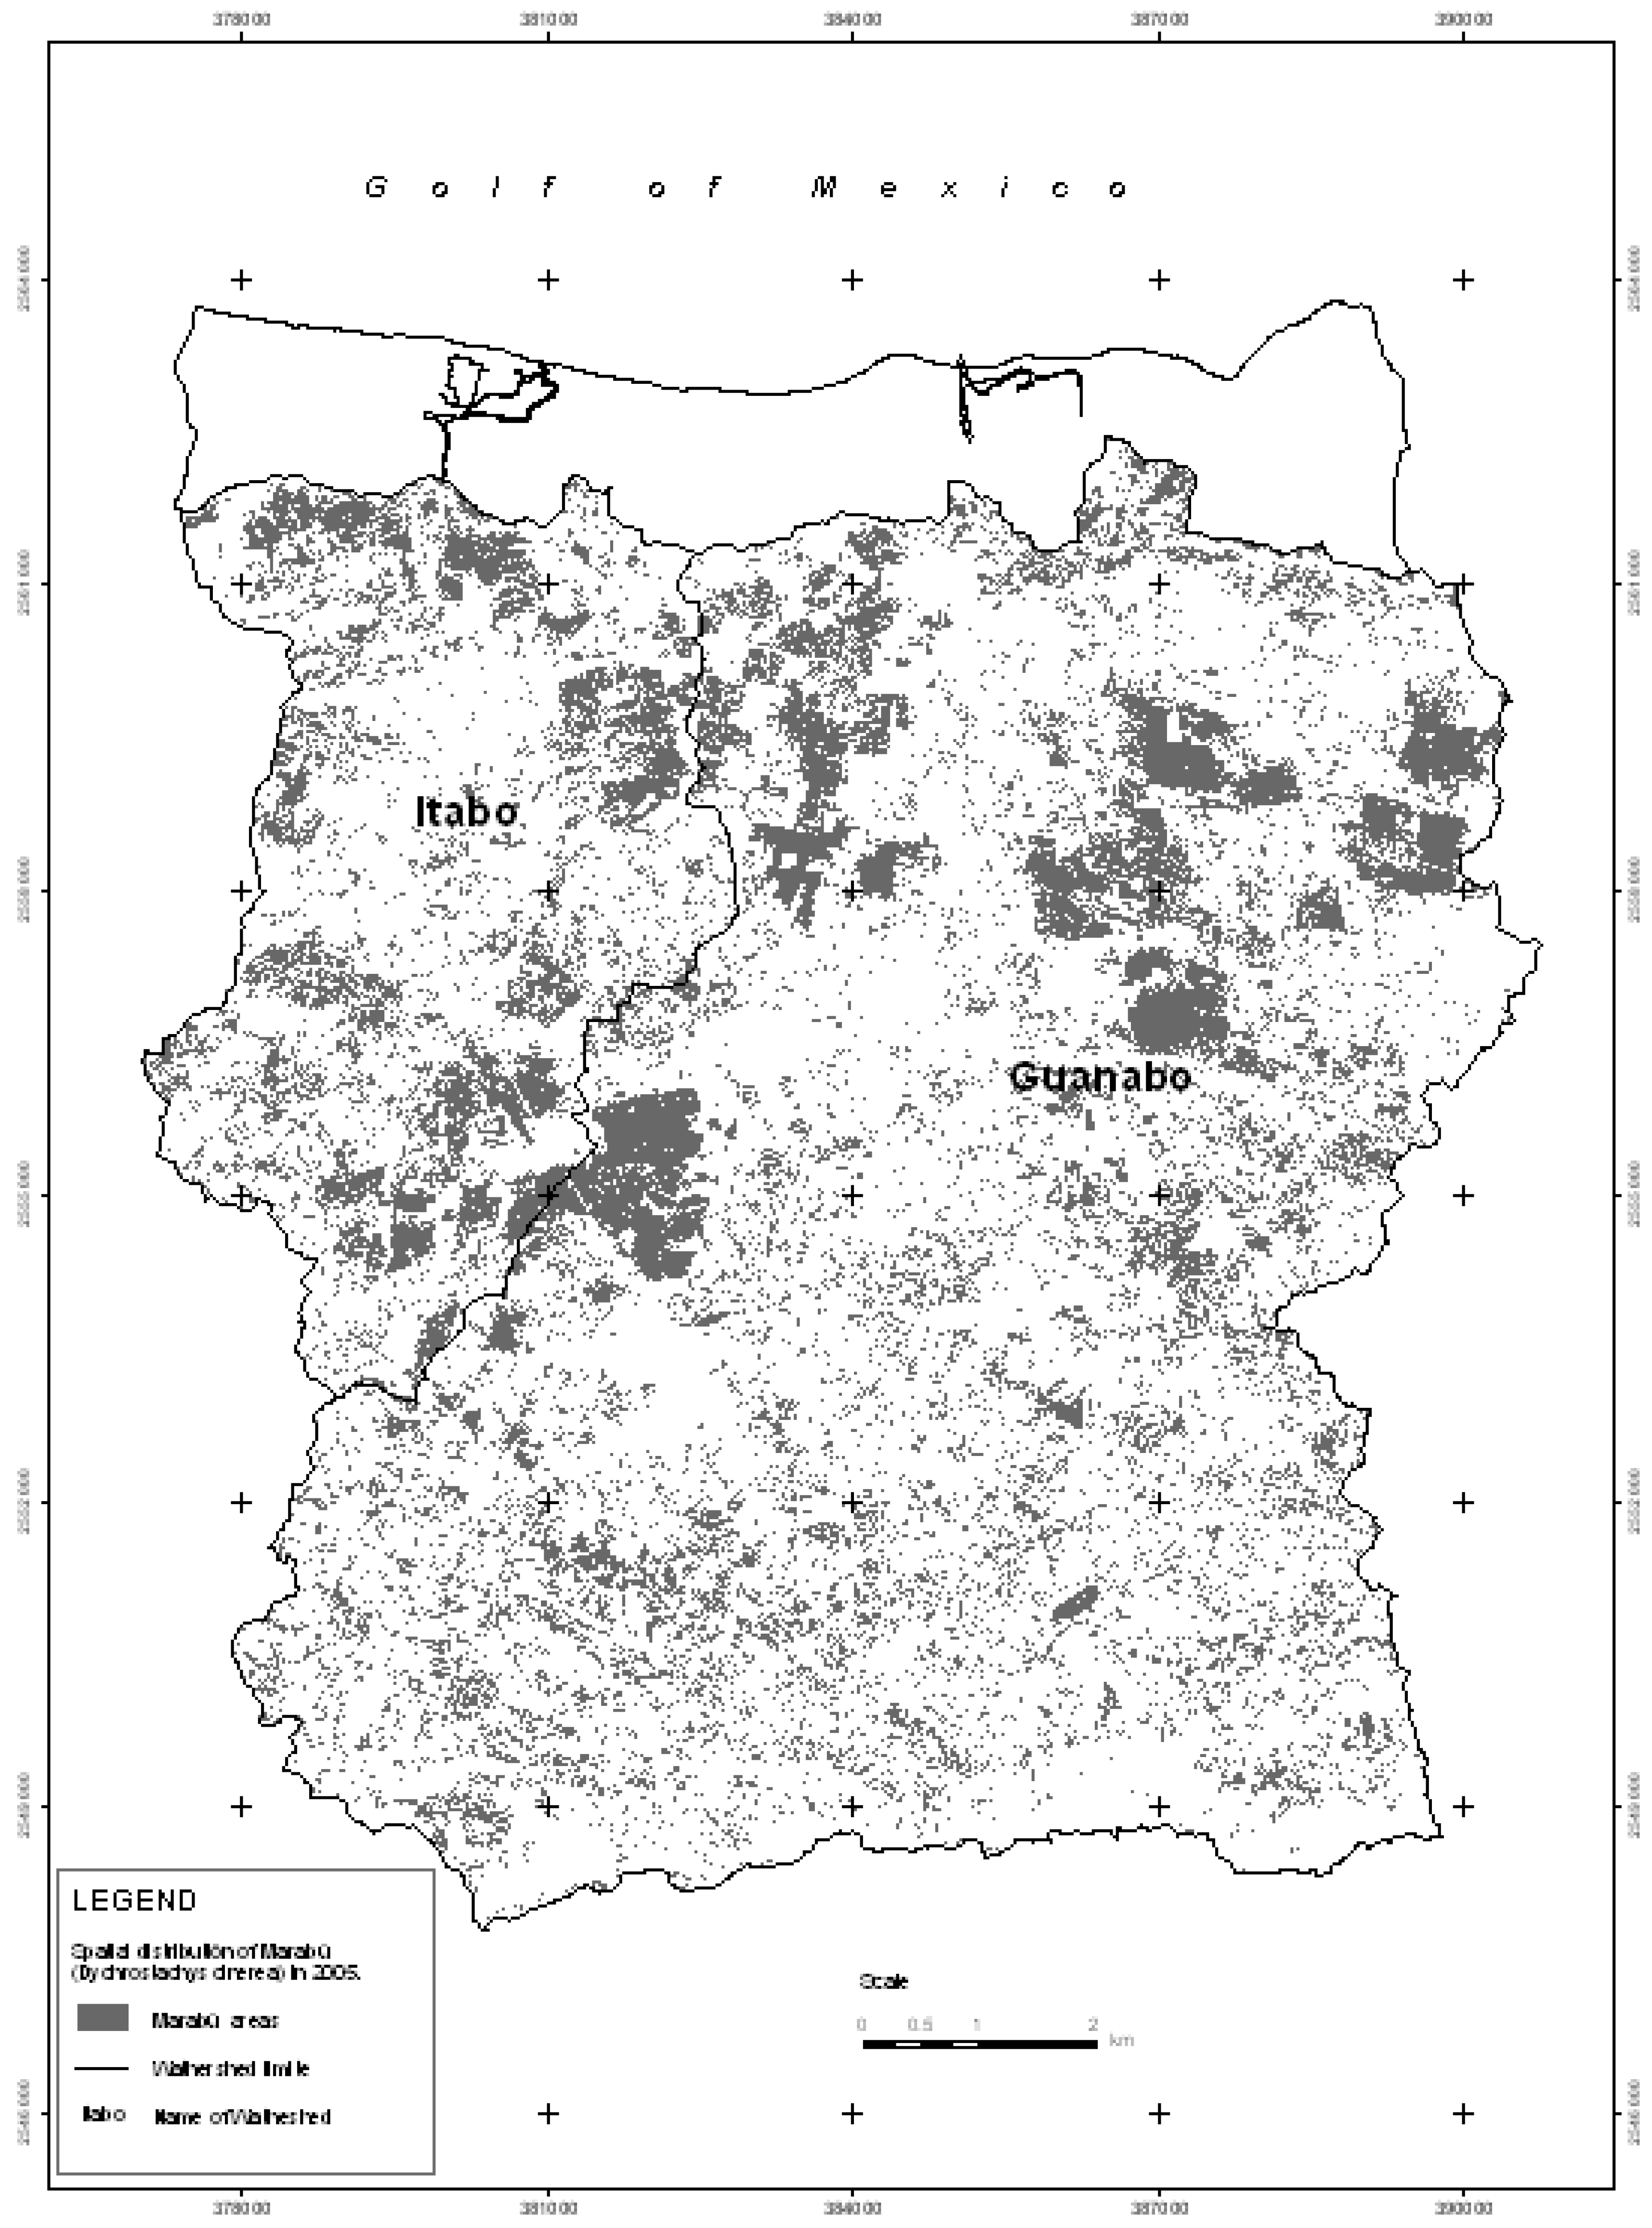
Figure 3.
Spatial distribution of Marabú (Dychrostachys cinerea) in 2005.
Figure 3.
Spatial distribution of Marabú (Dychrostachys cinerea) in 2005.
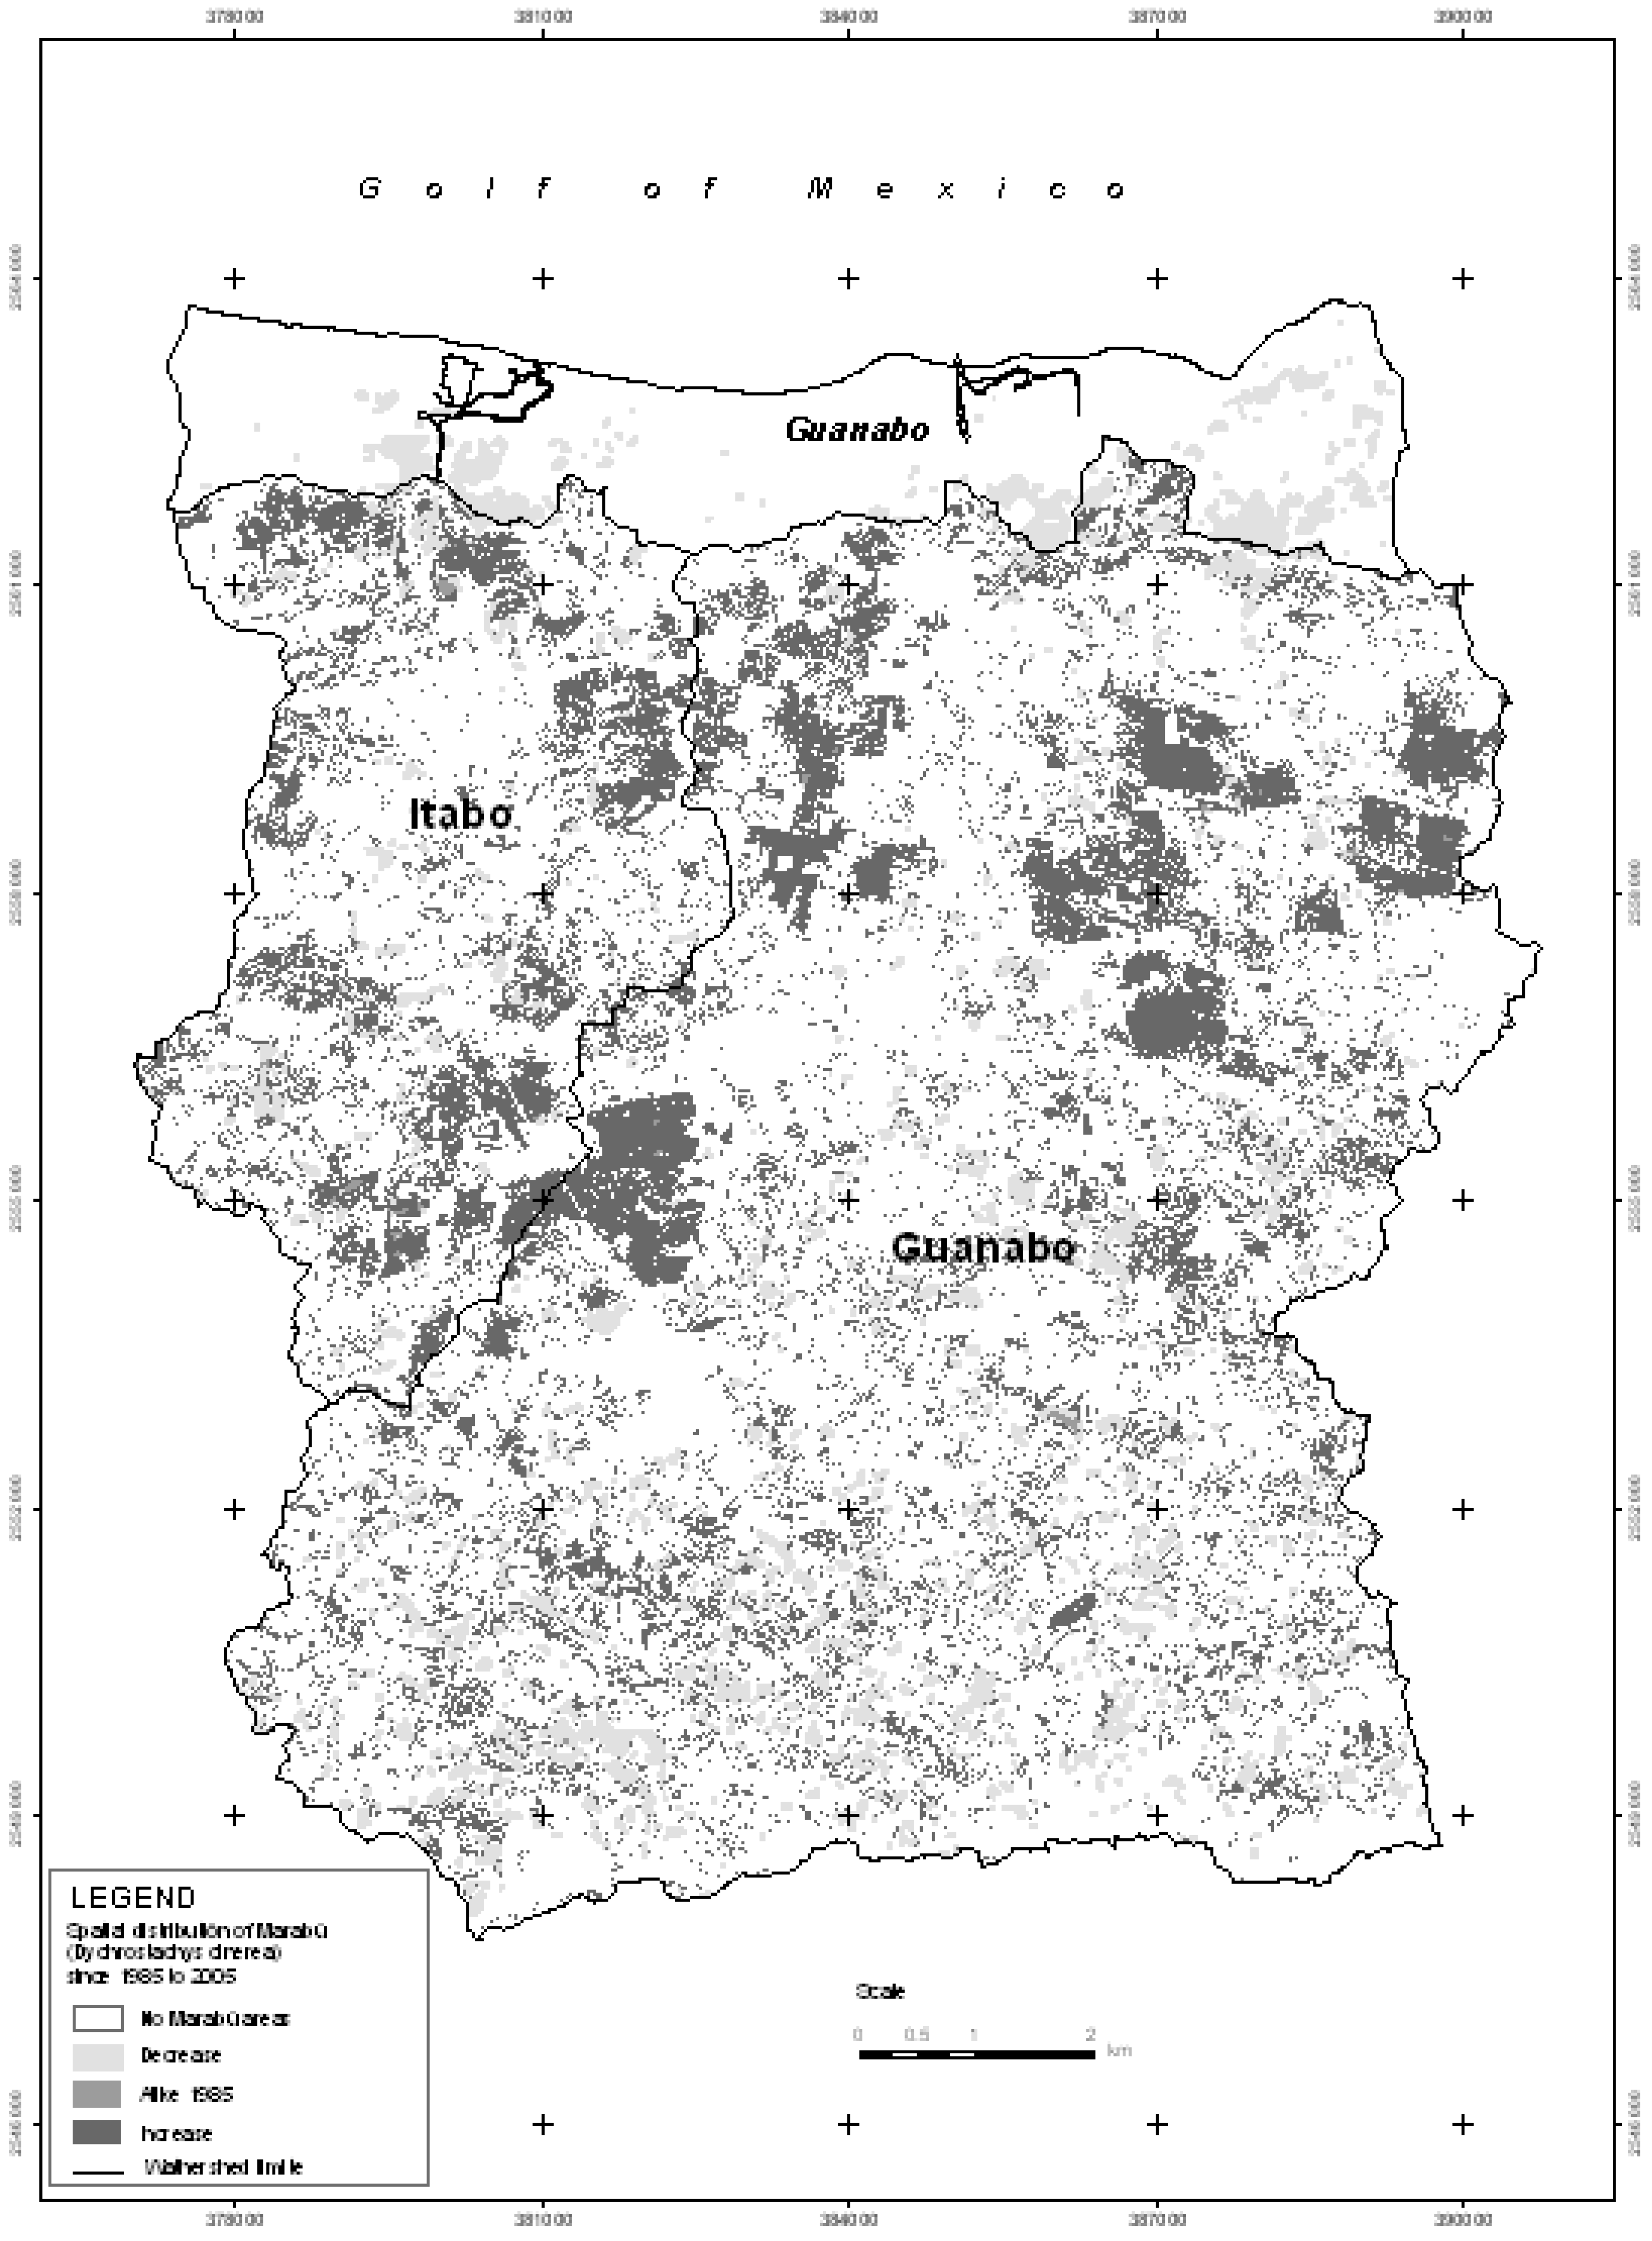
Analysis of GIS data was used to remove overlapping operations and to reclassify: the areas exhibiting stability, growth or a decrease in growth of this scrubland during the period 1985–2005 (
Figure 4), and the areas most densely invaded by these plant species in the year 2005 (
Figure 5).
3.2. Characterization of the Expansion Areas of these Species
Once the zones affected by these invading plants in the area of study had been mapped, their characteristics from the point of view of natural components were studied, with the aim of determining if any natural condition or tendency existed that might have facilitated or prevented the spread of these scrubland species [
7]. To do this, seven variables were selected: relief height, inclination of the slope, slope aspect, annual average temperature, annual average rainfall, distance from the drainage network, and soil type [
4].
Lastly, by means of cartographic super-positioning operations, a series of tables were drawn up representing the behavior of these variables inside the scrubland occupied areas.
Figure 4.
Expansion of Marabú (Dychrostachys cinerea) from 1985 to 2005.
Figure 4.
Expansion of Marabú (Dychrostachys cinerea) from 1985 to 2005.
These results initially allowed us to characterize how the scrubland is distributed within these areas to be able to determine which variables exhibit most influence in the spread of these scrubland species.
3.3. Analysis of the Influence of Natural Components, Land Use, and Ownership on the Expansion of the Species
The quantitative variables (the first six variables) could be statistically analyzed to establish the degree of relationship with the expansion of these scrubland species. By calculating the specific biserial correlation coefficient, used to correlate a quantitative variable with a pure binary variable [
29], we were able to check statistically whether these quantitative variables influenced the expansion of these scrubland plants during the period studied. To calculate this coefficient, each was considered a binary variable (in the presence of Marabú and Aroma scrubland) according to each of the natural components selected (quantitative variables).
The specific biserial correlation coefficient was obtained using the following Formula (1):
where:
rbp—specific biserial correlation coefficient;
Yp—Average Y figures of sampling subjects where X = 1;
Yq—Average Y figures of sampling subjects where X = 0;
Sy—Typical deviation of Y considering n observations;
p—Proportion of sampling subjects where X = 1;
q—Proportion of sampling subjects where X = 1.
The coefficient rbp can range from −1 to 1 (−1 ≤ rbp ≤ 1) and the closer it is to −1 or 1, the greater the correlation. An rbp value close to zero indicates that the correlation between the variables is almost nil. The rbp sign indicates the type of relationship; a negative sign indicates an inverse relationship while a positive sign indicates a direct relationship [
10].
Lastly, the relationship between the non-quantative variables (soil type, land use, land property structure) and the distribution of Marabú scrubland as a key factor in the expansion of this type of cover, was analyzed using different analytical operations using a GIS.
4. Results and Discussion.
4.1. Mapping and Expansion Analysis of Marabú Scrubland
As can be seen in
Table 1, 60% of the area has never been affected by this scrubland, while 8% (14 km
2) has remained the same from 1985 to 2005. However, the most significant aspect is the growth of Marabú in the same period to around 51 km
2 in both basins, which meant the colonization of 30.35% of the total area.
Table 1.
The dynamics of the change in Marabú scrubland plants (Dychrostachys cinerea) in the area studied during the period 1985–2005.
Table 1.
The dynamics of the change in Marabú scrubland plants (Dychrostachys cinerea) in the area studied during the period 1985–2005.
| Marabú |
| Watershed | Without | Decreased | Stabilized | Increased |
| | Km2 | % | Km2 | % | Km2 | % | Km2 | % |
| Itabo | 23.84 | 14.21 | 0.10 | 0.06 | 4.17 | 2.49 | 14.77 | 8.80 |
| Guanabo | 78.45 | 46.75 | 0.39 | 0.23 | 9.92 | 5.91 | 36.18 | 21.56 |
| Total | 102.29 | 60.95 | 0.50 | 0.30 | 14.09 | 8.40 | 50.94 | 30.35 |
When this analysis was carried out for each basin, we observed that in the Itabo basin the areas free from Marabú reached 23.84 km2 and in the Guanabo basin 78.45 km2, which represents 14.21% and 46.75% of the land, respectively. These plants remained in 4.17 km2 in Itabo and 9.92 km2 in Guanabo, while they spread significantly in almost 14.77 km2 in Itabo and 36.18 km2 in Guanabo, which represents 8.80% of the Itabo basin and 21.56% of the whole of the Guanabo basin %. The area where there was a decrease in this species was small; in neither basin did it even reach 1 km2.
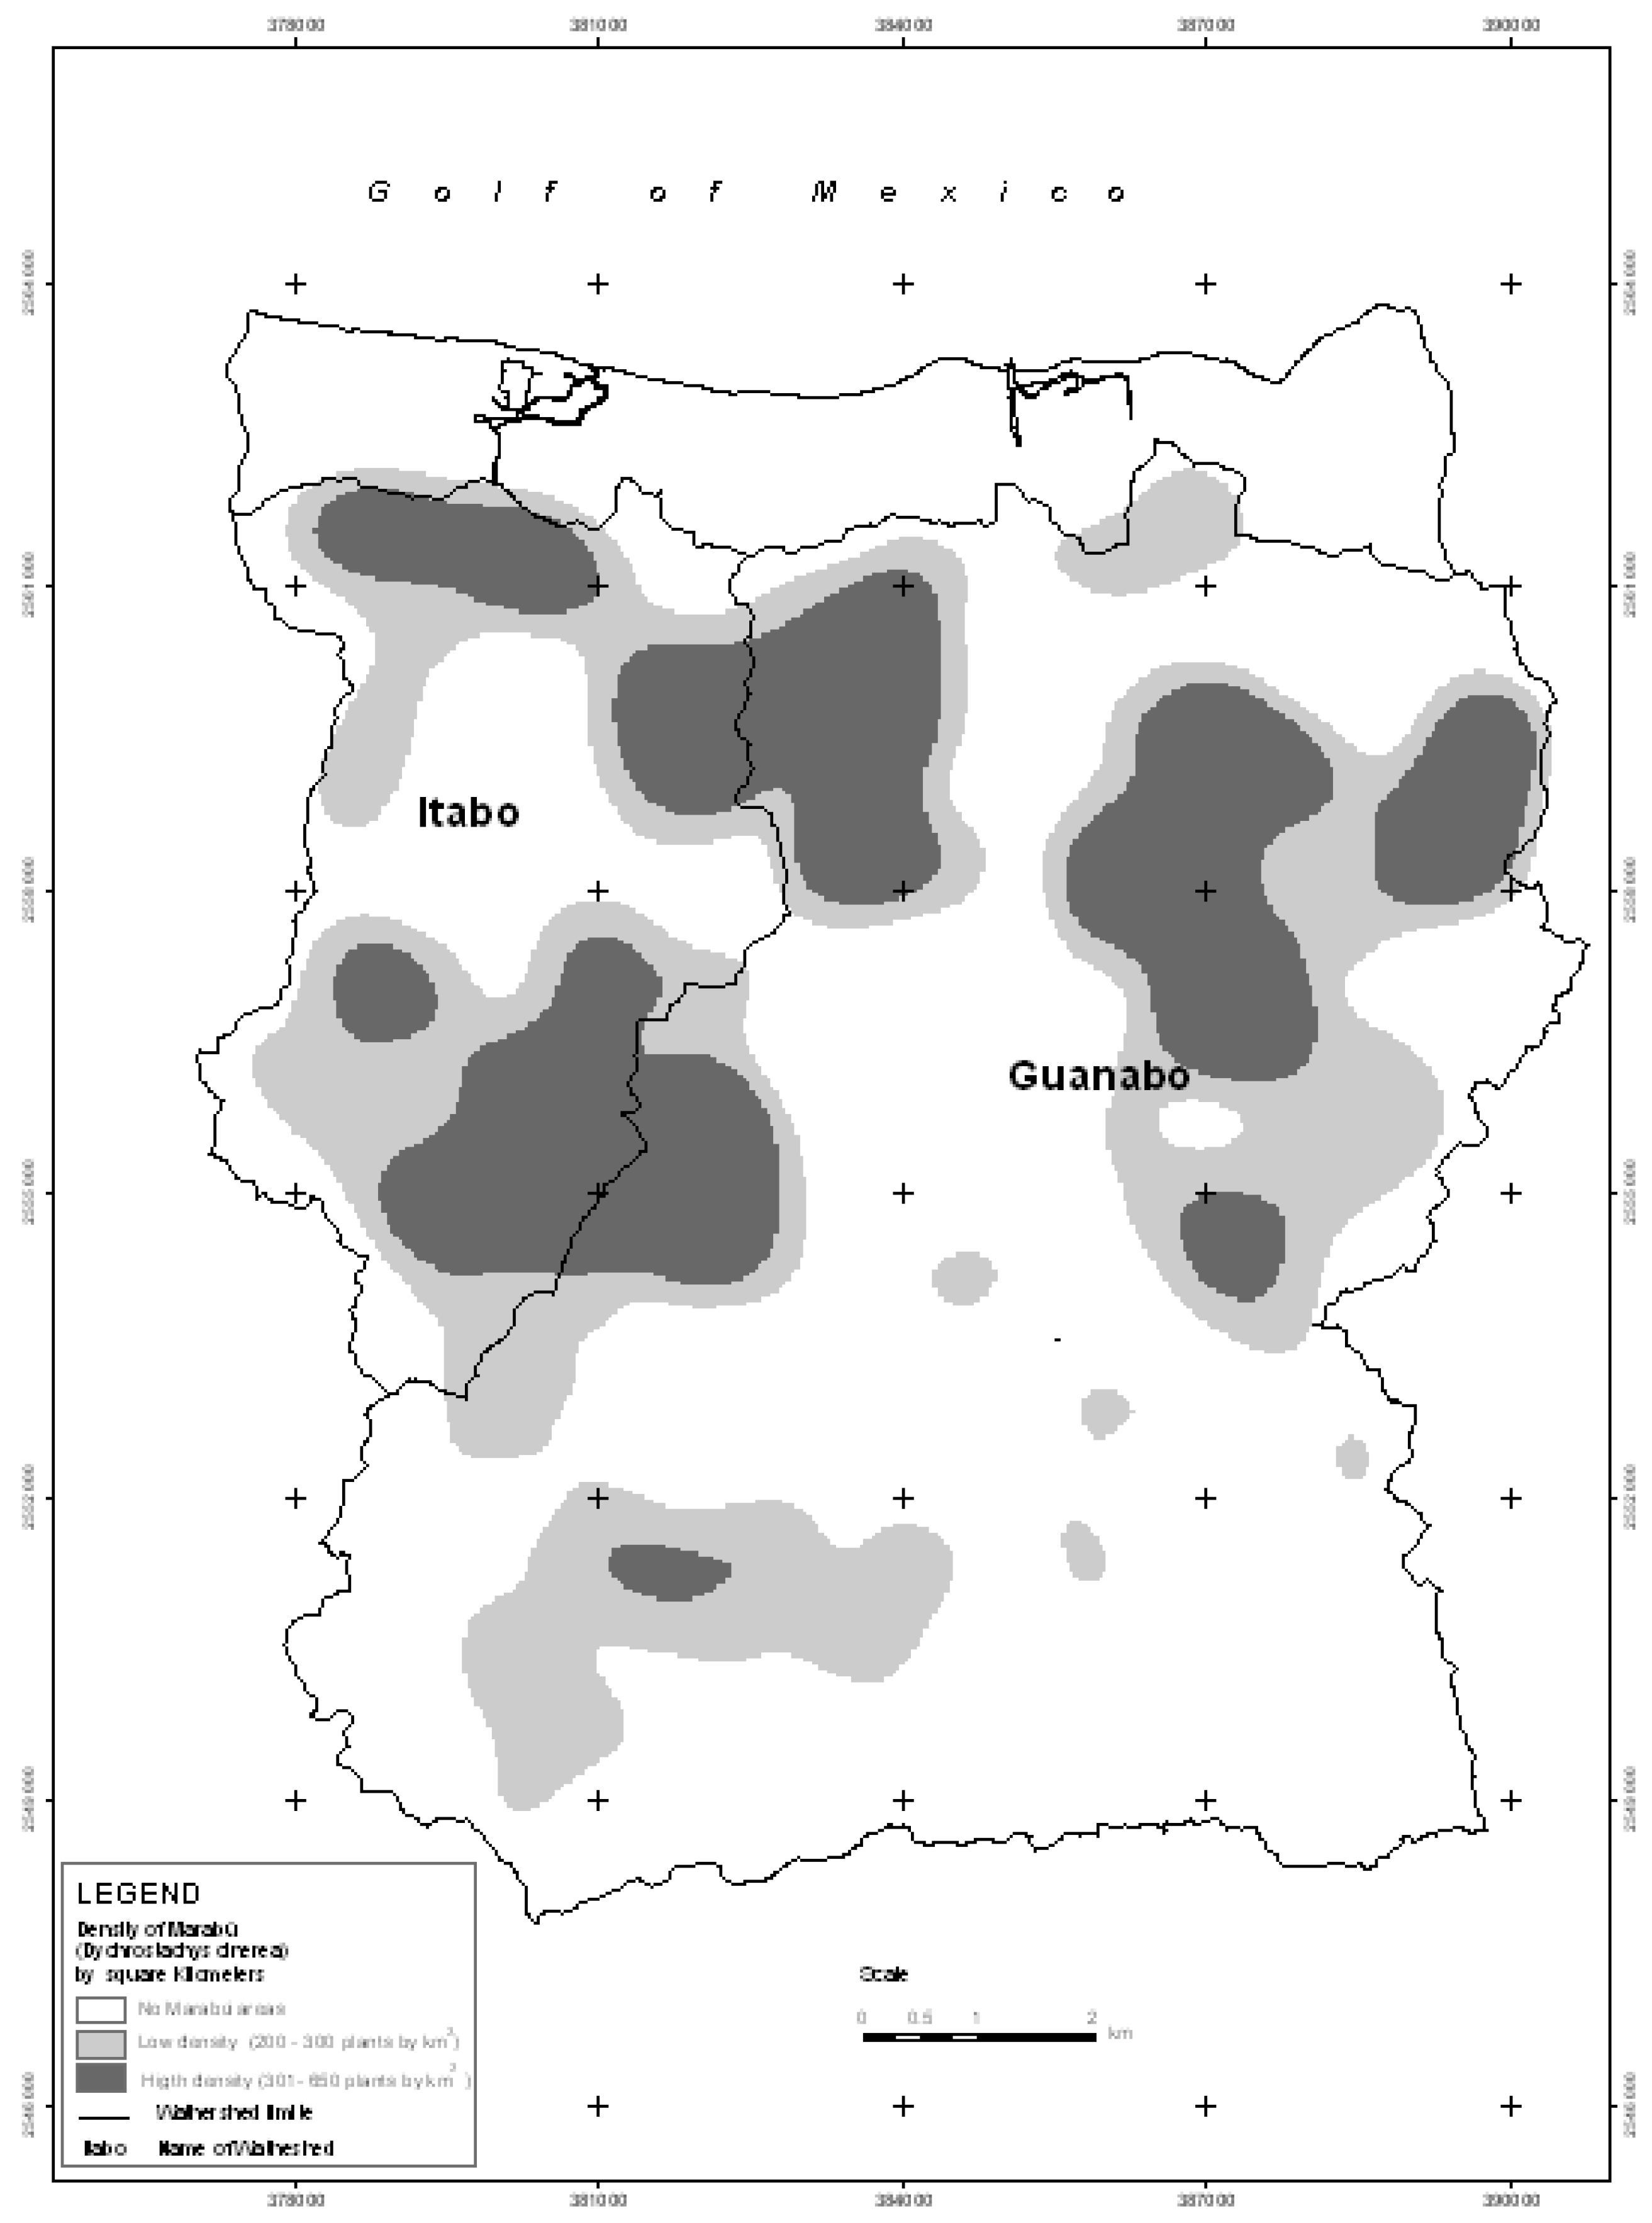
Figure 5.
Density of Marabú (Dychrostachys cinerea) in 2005.
Figure 5.
Density of Marabú (Dychrostachys cinerea) in 2005.
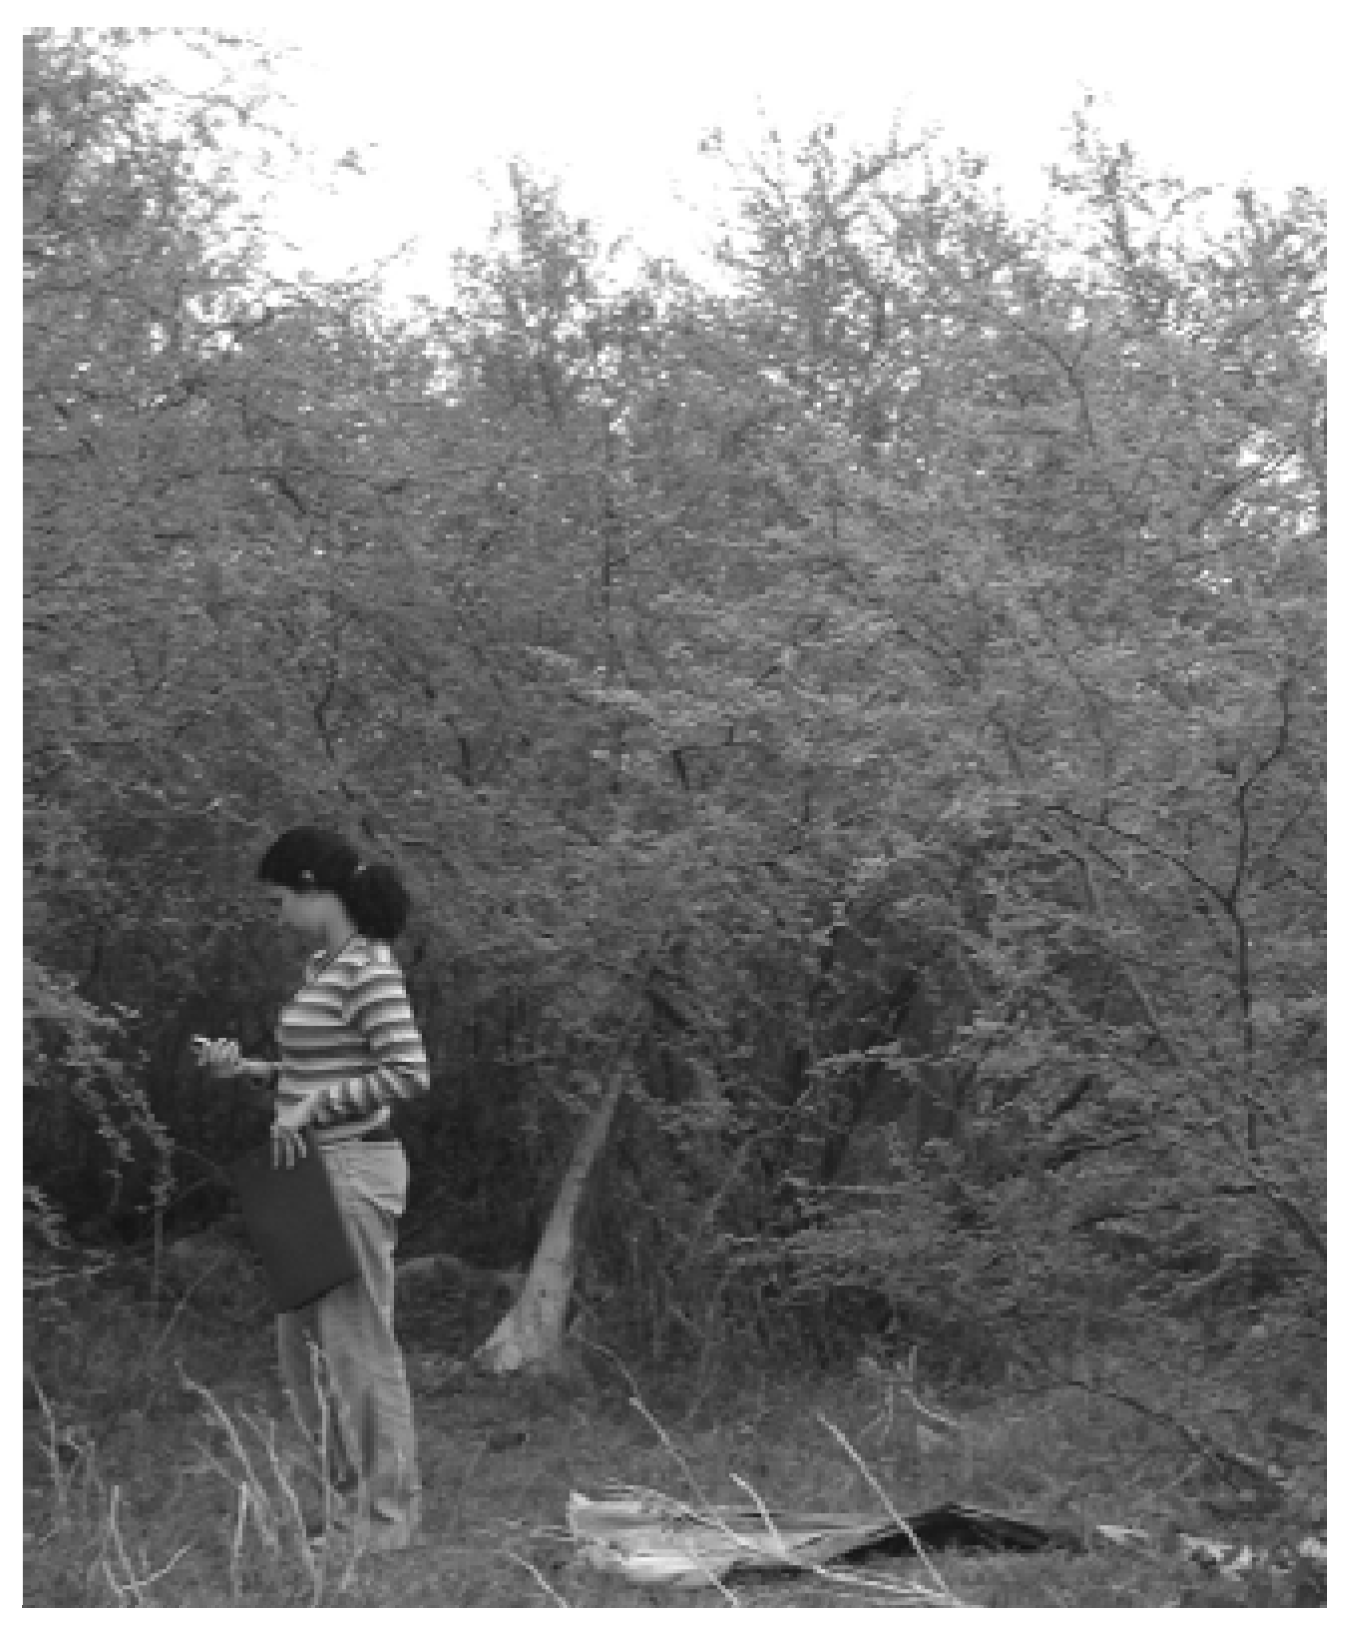
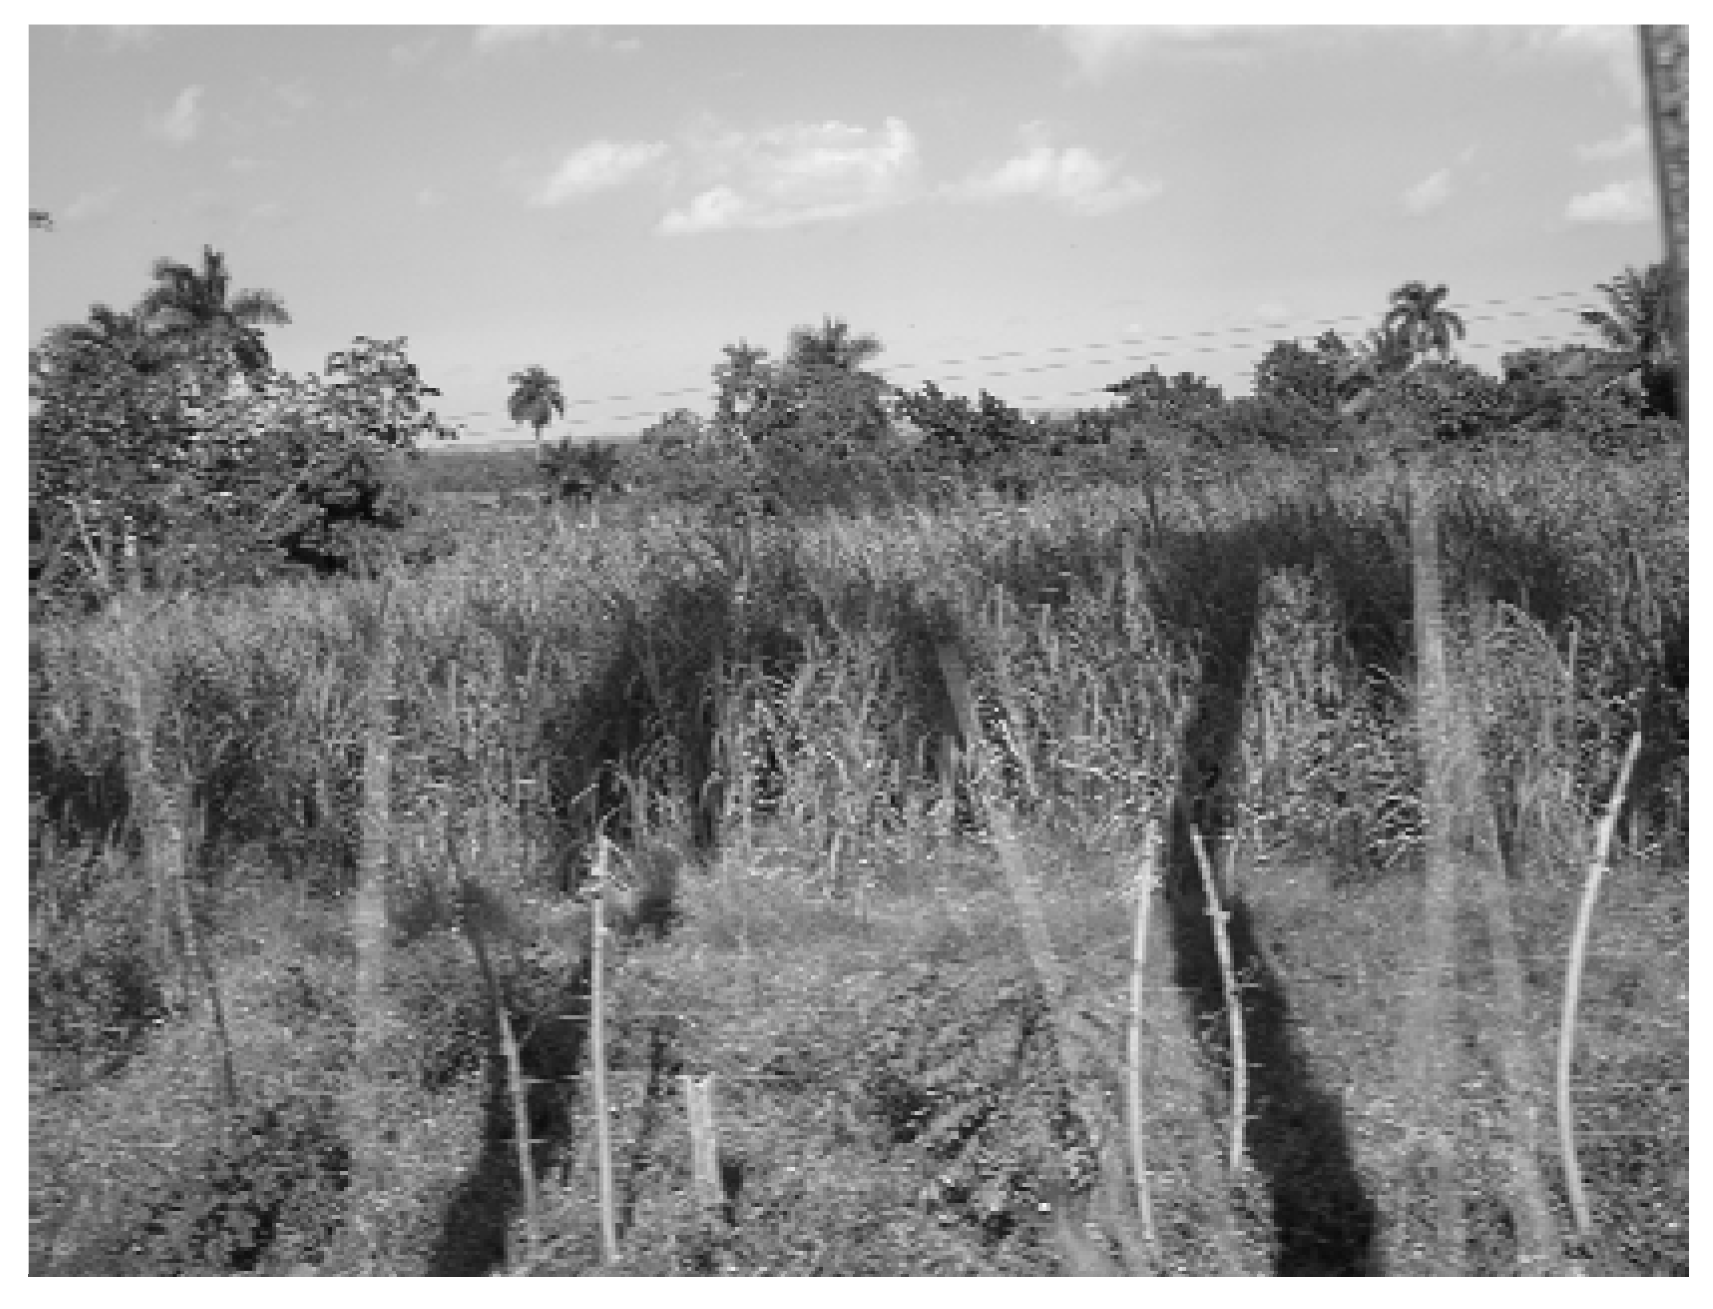
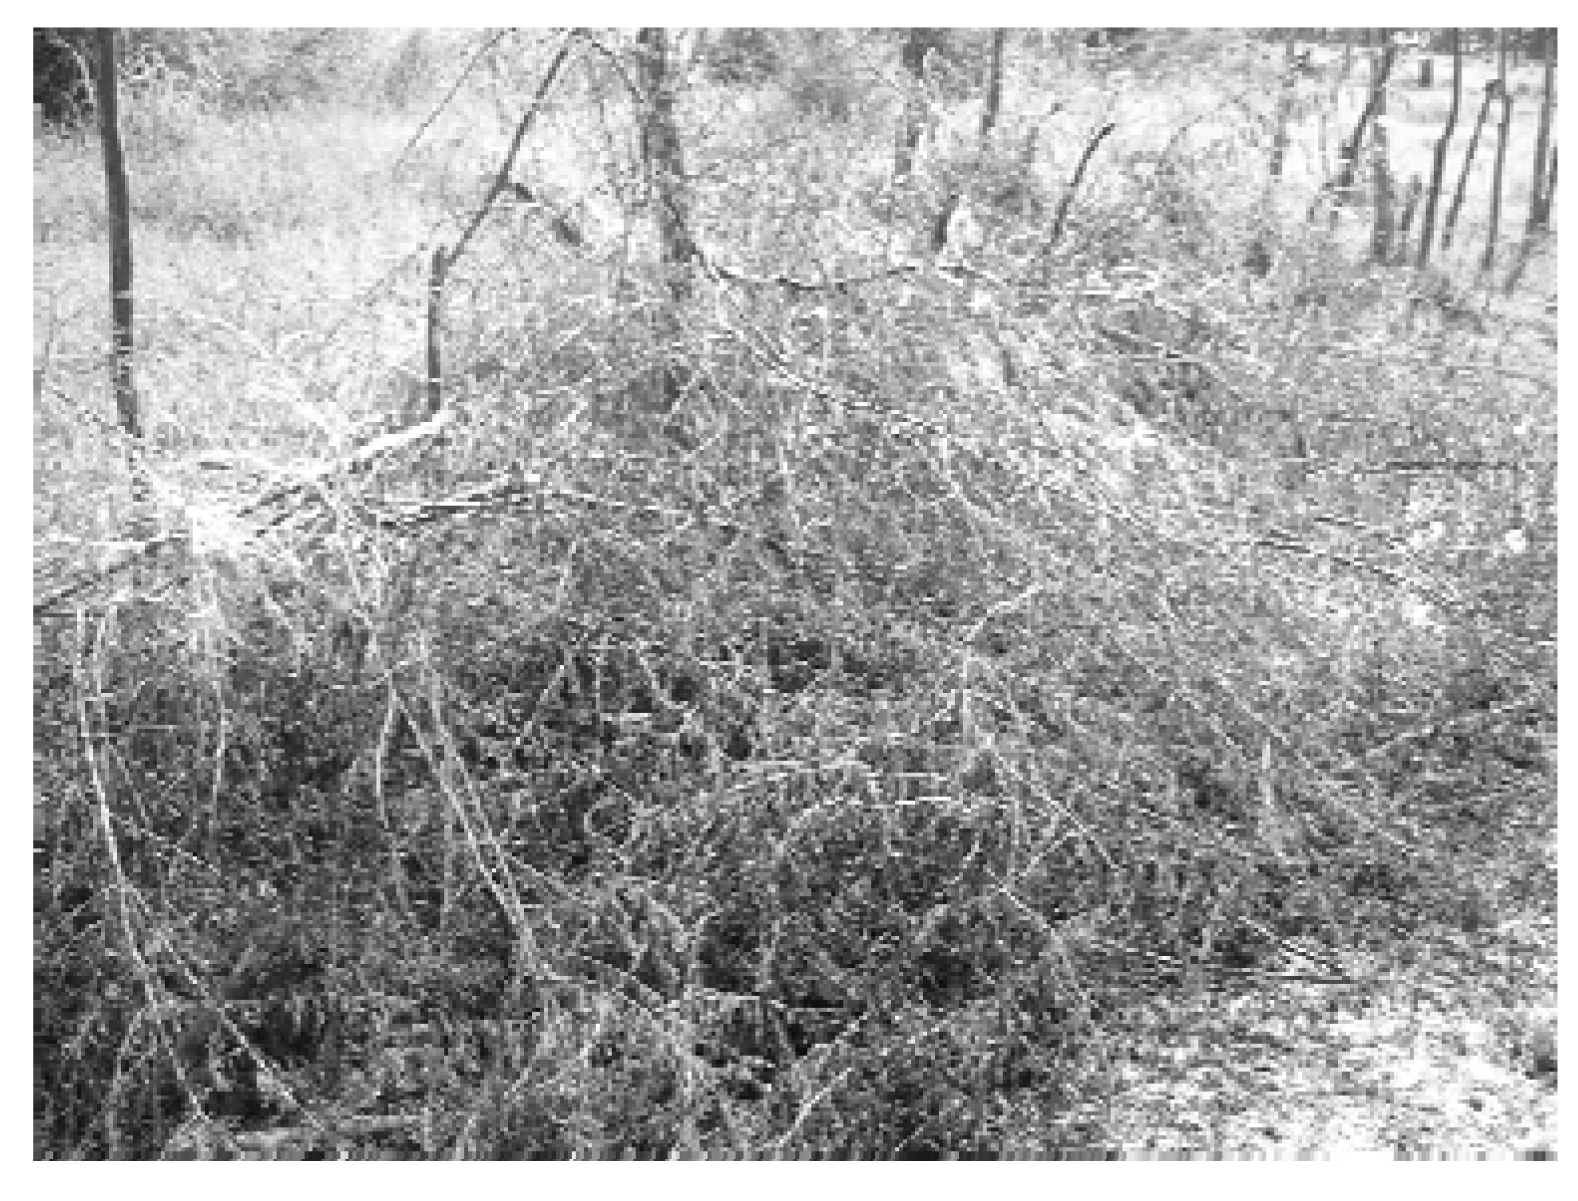
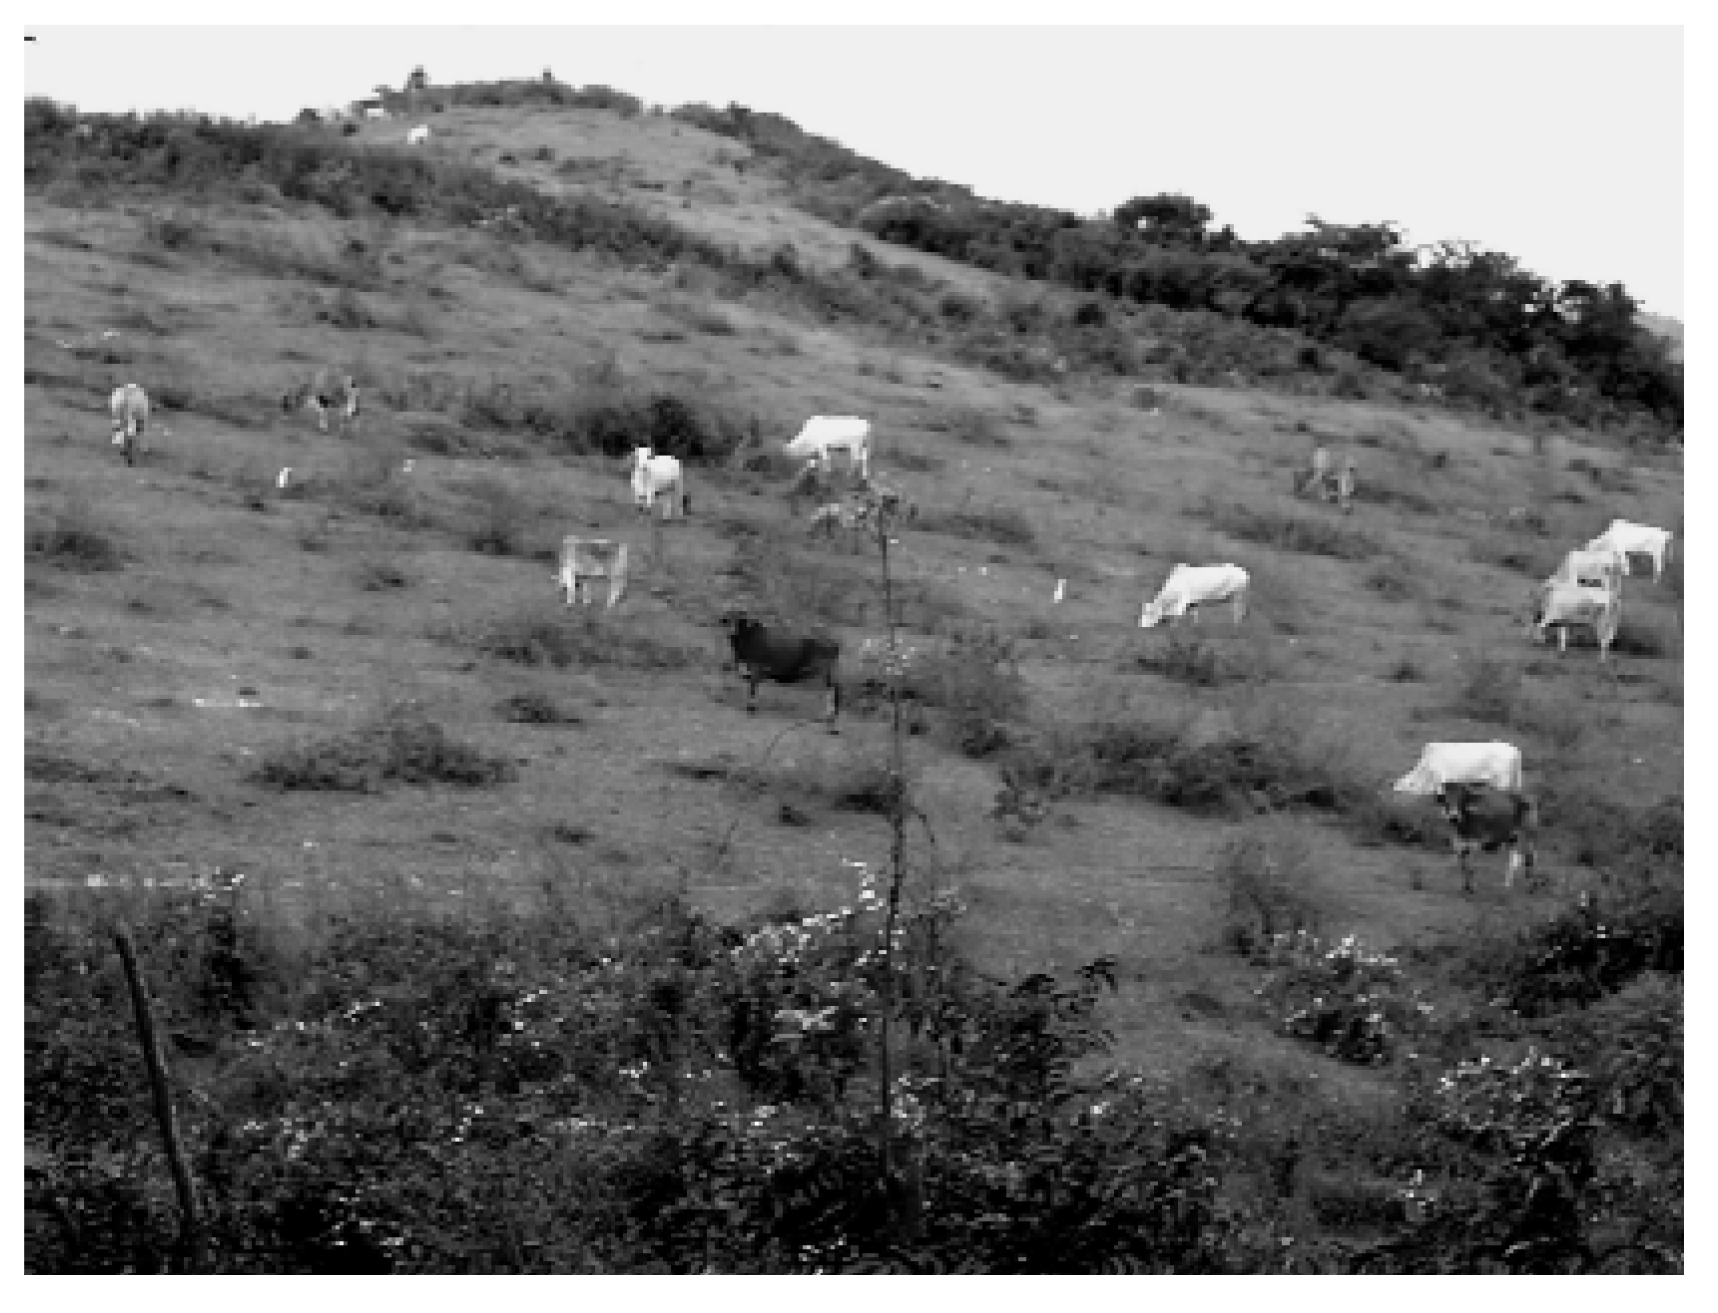
Figure 5 shows the areas of greatest concentration of Marabú in the year 2005. In some areas, this specie acquired great density and even formed forests (
Figure 6), although in some places it is eliminated by cutting and burning (
Figure 7), thus recovering areas for cultivation and grazing of livestock (
Figure 8 and
Figure 9).
Figure 6.
Marabú size in densely concentrated regions.
Figure 6.
Marabú size in densely concentrated regions.
Figure 7.
Elimination of Marabú by cutting.
Figure 7.
Elimination of Marabú by cutting.
Figure 8.
Marabú colonization.
Figure 8.
Marabú colonization.
Figure 9.
Marabú colonization.
Figure 9.
Marabú colonization.
Initially, the invaded areas were in the south of the Guanabo basin and to a lesser degree towards the center in the form of small associated thickets. However, during the last 20 years, the landscape has changed completely, Marabú is still found in a great part of the areas identified in 1985, but from then until 2005 it has continued to expand towards the north in both basins, to the north-east of the Guanabo basin and to the south of the Itabo basin, forming dense forests (
Figure 6).
4.2. Characterization of the Expansion Areas of this Species
Seven variables were selected to analyze the characteristics of the areas where the scrubland had invaded, from the point of view of the natural components of the area, with the aim of establishing any natural conditions existed that might have facilitated such expansion.
4.2.1. Height
Table 2 shows the variations in altitute of growth of the Marabú scrubland plants that were found in 1985 and 2005. Since there is a great range of heights, it would seem that height has not been an influencing factor in the spatial distribution of this species, finding the same figures close to sea level as those at 7.36 m.
On average, the height was close to 2 m in 1985 and these areas corresponded mainly to river terraces, while in 2005 the average was 1.27 m, which only shows a tendency to occupy the areas closest to the basins.
Table 2.
Marabú features.
Table 2.
Marabú features.
| | | 1985 | | | 2005 | |
|---|
| Marabú Features | Minimum | Maximun | Average | Minimum | Maximun | Average |
|---|
| Height (m a.s.l) | 0.07 | 7.36 | 2.00 | 0.07 | 7.46 | 1.27 |
| Slope gradient (°) | 0.00 | 83.68 | 4.12 | 0.00 | 84.57 | 4.82 |
| Slope aspect (°) | 0.00 | 315.98 | 78.98 | 1.00 | 360.00 | 134.55 |
| Distance from drainage network (m) | 0.50 | 325.18 | 60.18 | 0.72 | 1,718.13 | 236.84 |
| Average annual temperature (°C) | 23.12 | 25.65 | 24.45 | 23.07 | 25.65 | 24.72 |
| Average annual rainfall (mm) | 384.42 | 914.66 | 694.74 | 376.76 | 912.76 | 658.76 |
4.2.2. Inclination of the Slope
As seen in
Table 2, this variable cannot be considered a limiting factor in the expansion of this scrubland either, since it colonized both totally flat land and also very steep slopes of 83.11° in 1985 and 84.57° in 2005. The average slope gradient lies between 4–5°, given that the basin does not have great orographic features (
Figure 1).
4.2.3. Slope Aspect
There is no evidence that this variable limits expansion of this species either, as Marabú was found in both flat areas or with no slope and in areas facing towards the north 315.98° in the case of 1985 and up to 360° in the case of 2005, with areas in almost all possible aspects. On average, the aspect in 1985 was close to 79° (NE–E), while in 2005 it was 134° (E–SE).
4.2.4. Distance from the Drainage Network
These scrubland plants have appeared both close to the banks of the rivers and more distant at over 1.7 kilometres away. Thus, we can deduce that this variable has not had any great influence on the expansion of these plants. The average distance from drainage in 1985 was 60.18 m, while in 2005 it was close to 237 m.
4.2.5. Soil Types
Table 3 and
Table 4 show the surfaces occupied by these scrubland plants according to each soil class for the years 1985 and 2005, respectively. In dark brown soil with carbonates was where these plants expanded most (63% and 56% in 1985 and 2005, respectively), but at the same time it is the soil which is found most in the basins.
Table 3.
Distribution of Marabú thickets (Dychrostachys cinerea) by soil class (1985).
Table 3.
Distribution of Marabú thickets (Dychrostachys cinerea) by soil class (1985).
| Soil Class | Total Area (m2) | Marabú Area (m2) | % ofTotal Area | % of Marabú Area |
|---|
| Brown greyish | 2,331,812.94 | 49,203.99 | 2.11 | 0.84 |
| Fersialíthic P.R | 3,492,488.71 | 212,193.17 | 6.08 | 3.64 |
| Fersialíthic RPF | 21,706,647.07 | 706,187.96 | 3.25 | 12.11 |
| Brown with carbonates | 83,812,171.74 | 3,654,063.93 | 4.36 | 62.65 |
| Húmic carbonated | 5,093,343.08 | 258,210.23 | 5.07 | 4.43 |
| Red rendzin | 932,881.48 | 52,090.222 | 5.58 | 0.89 |
| Brown without carb. | 4,437,313.32 | 111,673.13 | 2.52 | 1.91 |
| Esquelétic | 3,420,052.30 | 202,940.00 | 5.93 | 3.48 |
| Alluvial | 18,498,086.72 | 449,754.56 | 2.43 | 7.71 |
| Quarry | 1,380,447.39 | 90,839.01 | 6.58 | 1.56 |
| Mixed | 1,608,405.52 | 45,102.53 | 2.80 | 0.77 |
Table 4.
Distribution of Marabú thickets (Dychrostachys cinerea) by soil class (2005).
Table 4.
Distribution of Marabú thickets (Dychrostachys cinerea) by soil class (2005).
| Soil Class | Total Area (m2) | Marabú Area (m2) | % of Total Area | % of Marabú Area |
|---|
| Brown greyish | 2,331,812.94 | 466,625.000 | 20.01 | 1.47 |
| Fersialíthic P.R | 3,492,488.71 | 811,100.000 | 23.22 | 2.55 |
| Fersialíthic RPF | 21,706,647.07 | 3,779,250.000 | 17.41 | 11.87 |
| Brown with carb. | 83,812,171.74 | 17,801,150.000 | 21.24 | 55.91 |
| Húmic carbonated | 5,093,343.08 | 1,167,900.000 | 22.93 | 3.67 |
| Red rendzin | 932,881.48 | 372,900.000 | 39.97 | 1.17 |
| Brown without carb. | 4,437,313.32 | 1,225,500.000 | 27.62 | 3.85 |
| Esquelétic | 3,420,052.30 | 422,350.000 | 12.35 | 1.33 |
| Alluvial | 18,498,086.72 | 5,013,125.000 | 27.10 | 15.74 |
| Quarry | 1,380,447.39 | 353,250.000 | 25.59 | 1.11 |
| Mixed | 1,608,405.52 | 428,225.000 | 26.62 | 1.34 |
In 1985 (
Table 3), in humic carbonated soil these species occupied close to 4.43% of the total surface, in Fersialithic soil RPF more than 12%, and in alluvial soil 7%.
In 2005 (
Table 4), in carbonated humic soil we find 3.67% of the total surface occupied by Marabú, in Fersialithic RPF soil close to 11.87%, and in alluvial soil it is greater than 15% of the area covered by thickets. This ground, together with the dark brown soil without carbonates, was used for farming in the 80s and was neglected during the economic crisis period of the 90s of the last century.
4.2.6. Temperature
The Marabú scrubland plants developed when the temperature was between 23.12 °C and 25.65 °C in 1985 and between 23.07 °C and 25.65 °C in 2005, which indicates a narrow thermic range. The average figures for both years were close to 24 °C. So, there is no relationship between this variable and the expansion of the thickets.
4.2.7. Rainfall
The areas of expansion of Marabú had an annual rainfall that oscillated between 384.42 mm and 914.66 mm in 1985, and between 376.76 mm and 912.76 mm in 2005, which shows that there is a very wide variance in the amount of rainfall in the areas where these thickets have developed. However, it should be pointed out Marabú does not colonize areas with less than 376 mm of rainfall. The average value, registered by the meteorological stations, is close to 700 mm of rainfall.
4.3. Influence of Natural Components, Land Use and Ownership, in the Expansion of these Species
There is no clear influence of natural components on the expansion of these thickets. To check the link between the selected variables we used a statistical coefficient.
The specific biserial correlation coefficient allowed us to measure the relationship between the variables (presence, absence) with a quantitative variable so that it was possible to measure the relationship between Marabú and natural components, with the exception of soil type as it is a qualitative variable.
Table 5 shows the results of the application of this index.
Table 5.
Biserial correlation coefficient of the relationship between Marabú and natural components.
Table 5.
Biserial correlation coefficient of the relationship between Marabú and natural components.
| Marabú features | Correlation Coefficient |
|---|
| Height (m) | −0.09 |
| Slope gradient (°) | −0.04 |
| Slope aspect (°) | −0.005 |
| Distance from drainage network (m) | 0.038 |
| Average annual temperature (°C) | 0.07 |
| Average annual rainfall (mm) | 0.0089 |
The results show that the influence of natural components on the expansion of these thickets is insignificant, values very close to zero were obtained in all cases, which indicates that the correlation between these variables and the expansion of thickets is almost nil. However, there is some difference in the behavior of the variables. For this reason, we decided to study other factors that might have influenced the expansion of these thickets, such as the use and ownership or property structure of the land.
If we take as a reference point the use of the land in 1985 to analyze where the expansion took place in the years up until 2005, we can see (
Table 6) that the grazing areas were most affected, with 24 km² (representing 75.69%) of the Marabú area, with the areas given over to cultivation following with almost 4 km², which means 11.9% of the total in both basins, and 2 km² of the wooded areas, which is equivalent to 6.06%.
Table 6.
Marabú distribution (Dychrostachys cinerea) in terms of land use (taking 1985 as a reference point).
Table 6.
Marabú distribution (Dychrostachys cinerea) in terms of land use (taking 1985 as a reference point).
| Land use | Marabú area |
|---|
| Km2 | % |
|---|
| Water | 0.06 | 0.19 |
| Urban areas | 0.66 | 2.05 |
| Forest | 1.95 | 6.06 |
| Farming | 3.79 | 11.79 |
| Grass | 24.35 | 75.69 |
| Total | 32.17 | 95.79 |
The main proprietors of the land in the Itabo and Guanabo basins are grouped into the four Basic Units of Cooperative Production (UBPC) belonging to the Livestock Company “Bacuranao”, with 4,430 ha. Of these, the cooperatives “Protesta de Baramguá” and “Victoria de Girón” account for approximately 1,900 ha. To complete the group of proprietors we have the Company of Various Crops which has more than 1,000 ha and which is also the food supplier for the basin. On the other hand, there are small producers associated to Credit and Service Cooperatives (CCS) which have 4.2% of the cultivable ground, which on average does not reach 100 ha. They grow vegetables and cereals using traditional production methods, with much reduced resources, on land without irrigation, and with crops adapted to the alternating dry and rainy periods. All of which results in low productivity [
11,
19,
22,
25,
26].
The extreme south of the Guanabo basin belongs to the province of Havana, and it plays an important part in the forestal and livestock use of its land which extends for almost 4,785 ha and is mainly represented by the Companies “Forestal Mayabeque”, “Pecuaria Nazareno” and “Pecuaria Guaicanamar”. In
Table 7, there is a summary of the main land proprietors in the Itabo and Guanabo basins.
Table 7.
Land Ownership in the Itabo and Guanabo basins.
Table 7.
Land Ownership in the Itabo and Guanabo basins.
| Land Owners | Área (ha) |
|---|
| Company Bacuranao | 4,427.7 |
| - UBPC “26 de Julio” | 272.0 |
| - UBPC “Protesta de Baraguá” | 1,900.3 |
| - UBPC “Desembarco del Granma” | 352.1 |
| - UBPC “Victoria de Girón” | 1,903.3 |
| Company of several farming | 1,424.8 |
| Company Havana Province | 4,785.0 |
| Governmental Company | 65.5 |
| Private Sector | 505.6 |
| Total | 1,195.20 |
Table 8 reflects the percentage of each of the proprietors of the total land being studied. The total land studied has excluded areas occupied by reservoirs, urban areas and roads, which in total represents around (9.2%) of the two basins as these areas are not affected by Marabú thickets.
Table 8.
The presence of Marabú scrubland (Dychrostachys cinerea) according to land ownership.
Table 8.
The presence of Marabú scrubland (Dychrostachys cinerea) according to land ownership.
| Land Owners | Surface | Marabú |
|---|
| Area (%) | 1985 | 2005 |
|---|
| km² | % | km² | % |
|---|
| Governmental Company | 63.8 | 5.48 | 78.7 | 26.93 | 83.7 |
| Private Sector | 11.6 | 0.35 | 4.8 | 2.41 | 7.5 |
| Without information | 15.4 | 1.14 | 16.5 | 2.84 | 8.8 |
| Total | 90.8 | 6.97 | 100.0 | 32.18 | 100.0 |
If we assume that land ownership has remained almost unchanged between the years 1985 and 2005 (which we conclude from interviews held with the local people), and we analyze the sectors most affected by the spread of Marabú, we observe that in the state sector the increase has been from 5.48 km² to 26.93 km², while in the private sector a significantly lower figure for growth was reported (from 1.14 km² to 2.84 km²). The increase in the period studied for these scrubland plants was around 25 km², but the percentage corresponding to the proprietors was very different, as the most colonized areas were those belonging to the state sector in both years with figures of 78.7% and 83.7%, respectively. For the area under study we had no information as to the proprietors of 8.8% of the land.
5. Conclusions
1. The Guanabo and Itabo river basins have experienced a significant change in land use during the period 1985–2005, with an expansion of 30.35% of the area occupied by invading Marabú thickets (Dychrostachys cinera).
2. Satellite digital processing of images has allowed us to have at our disposal maps of land use for the years 1985 and 2005 showing different types of plant cover, among them, Marabú thicket cover, despite having different spatial resolution images, different satellites and sensors.
3. The application of techniques detecting change with GIS allowed mapping and representation of the dynamics of change and the areas of greatest density of this species of invading plants in the Itabo and Guanabo basins during the period 1985–2005.
4. The characterization of the natural components in the zones with these thickets led us to conclude that they do not influence in any way the expansion of these thickets. This was checked statistically by means of the specific biserial correlation coefficient.
5. The tenure and use of the land constitute factors which have most influenced the expansion of these invading plants in the river basins during the last 20 years, the areas under state ownership being those where these scrubland plants have proliferated most (83.7%) and the grazing areas where the plants have developed most (75.69%).
6. Despite others authors [
24] showing that intrusive scrubland (
Acacia caven) has been used for foraging, fencing and to restore the fertility of exhausted soils, the Marabú could blocks the soil fertility increasing the soil acidity. This soil degradation process must be analyzed to start a soil recovery policy.


