Article

Retrieving Clear-Sky Surface Skin Temperature for Numerical Weather Prediction Applications from Geostationary Satellite Data

1
Science Systems and Applications, Inc., Hampton, VA 23666, USA
2
NASA Langley Research Center, Hampton, VA 23681, USA
3
NASA Goddard Space Flight Center, Greenbelt, MD 20771, USA
4
Science Systems and Applications, Inc., Lanham, MD 20706, USA
*
Author to whom correspondence should be addressed.
Remote Sens. 2013, 5(1), 342-366; https://doi.org/10.3390/rs5010342
Submission received: 1 November 2012 / Revised: 8 January 2013 / Accepted: 10 January 2013 / Published: 17 January 2013

Abstract

:
Atmospheric models rely on high-accuracy, high-resolution initial radiometric and surface conditions for better short-term meteorological forecasts, as well as improved evaluation of global climate models. Remote sensing of the Earth’s energy budget, particularly with instruments flown on geostationary satellites, allows for near-real-time evaluation of cloud and surface radiation properties. The persistence and coverage of geostationary remote sensing instruments grant the frequent retrieval of near-instantaneous quasi-global skin temperature. Among other cloud and clear-sky retrieval parameters, NASA Langley provides a non-polar, high-resolution land and ocean skin temperature dataset for atmospheric modelers by applying an inverted correlated k-distribution method to clear-pixel values of top-of-atmosphere infrared temperature. The present paper shows that this method yields clear-sky skin temperature values that are, for the most part, within 2 K of measurements from ground-site instruments, like the Southern Great Plains Atmospheric Radiation Measurement (ARM) Infrared Thermometer and the National Climatic Data Center Apogee Precision Infrared Thermocouple Sensor. The level of accuracy relative to the ARM site is comparable to that of the Moderate-resolution Imaging Spectroradiometer (MODIS) with the benefit of an increased number of daily measurements without added bias or increased error. Additionally, matched comparisons of the high-resolution skin temperature product with MODIS land surface temperature reveal a level of accuracy well within 1 K for both day and night. This confidence will help in characterizing the diurnal and seasonal biases and root-mean-square differences between the retrievals and modeled values from the NASA Goddard Earth Observing System Version 5 (GEOS-5) in preparation for assimilation of the retrievals into GEOS-5. Modelers should find the immediate availability and broad coverage of these skin temperature observations valuable, which can lead to improved forecasting and more advanced global climate models.

Graphical Abstract

1. Introduction

Reliable global measurements of land and ocean surface skin temperature are necessary for improving both climate and numerical weather prediction (NWP) models. Accurate calculations of the surface emitting temperatures in climate models are key for computing the surface radiative and sensible heat balance, as well as the top-of-atmosphere (TOA) radiative budget [1]. Determination of the accuracy of those calculations can be accomplished by comparing measured surface skin temperatures and their computed counterparts [1]. Furthermore, the differences between the model and observed values can aid revisions of the model parameterizations needed to minimize model errors [2]. Thus, achieving model and observational agreement of skin temperatures at various time and space scales will minimize an important source of uncertainty in climate models. Similarly, NWP models can benefit from such comparisons [3]. Ideally, their predictions could also be improved by assimilating the observations, if they are available in a timely fashion [46]. Because current NWP models operate at relatively high spatial and temporal resolutions, measurements of critical assimilated parameters should be provided at comparable resolutions.
For global and continental-scale NWP models, it is desirable to have observations at the same time step used in the analyses and predictions. Low-Earth-orbit (LEO) satellites provide very high spatial resolution data, but are typically limited to a few overpasses per day. For example, a global land surface heat flux dataset is constructed from LEO observations [7]. However, for taking into account the often strong diurnal variation of the land surface skin temperature (LST), data from geostationary-Earth-orbit satellites (GEOsats) are needed because they produce full-disk images at resolutions from 0.25–1 h [3]. The International Satellite Cloud Climatology Project (ISCCP, [8]) generates an historical three-hourly LST product that would meet the accuracy needs for most models, but it is not available until years after the observations [9]. With reliable calibrations, e.g., Minnis et al.[10,11], operational GEOsat imagers can be used to derive cloud and radiation properties in near-real-time (NRT)—an important component of future GEOsat-based research. For instance, land and sea surface temperature retrievals are of key importance for the next-generation Geostationary Operational Environmental Satellite-R Series (GOES-R) platform, on which the Advanced Baseline Imager (ABI) will provide data for high-accuracy, high-resolution retrievals of surface skin temperature [12]. Development of a robust LST algorithm for the ABI is recognized to be important for the future of meteorological and climatological prediction [13].
A variety of efforts have been devoted to providing NRT retrievals of LST using GEOsat data. Near-real-time LSTs are produced operationally from Meteosat Spinning Enhanced Visible and Infrared Imager (SEVIRI) data providing coverage for Europe and Africa [14,15]. Sun and Pinker developed a split-window method to retrieve LST over the United States using GOES-8 data [16]. Inamdar et al. employed 1-km Moderate-resolution Imaging Spectroradiometer (MODIS) emissivities to estimate 1-km LST using 4-km GOES data to produce routine, high temporal and spatial resolution measurements of LST over the United States [17,18]. Full-disk LSTs covering the Western Hemisphere are also produced operationally in NRT by the National Oceanic and Atmospheric Administration/National Environmental Satellite, Data and Information Service using a method developed by Wu et al. and updated by Pinker et al.[1921]. Despite the numerous products available, there do not appear to be any routine high-temporal resolution quasi-global (excluding regions poleward of 60°N and 60°S) LST data produced in NRT with a single method using multiple GEOsat imagers. Although it may be difficult to remove all inter-satellite artifacts in any retrieval, a consistent approach should eliminate the differences among the various analysis methods and simplify assimilation and other uses of those data by NWP models.
To address this need, this article describes the development of a routine NRT cloud and radiation analysis of quasi-global GEOsat data to produce a relatively high-resolution clear-sky surface skin temperature product for both land and ocean. Examples of the results are shown and the retrieved values are compared to Atmospheric Radiation Measurement (ARM) and National Climatic Data Center (NCDC) ground-site data and to MODIS LST measurements. Additionally, comparisons between the GEOsat-derived skin temperatures and their counterparts simulated by the NASA Goddard Earth Observing System Model, Version 5 (GEOS-5, [22]) are performed as the initial step for utilizing these quasi-global GEOsat data in the GEOS-5 assimilation process. The results of this study should be valuable for the advancement of climate models and short-term weather prediction owing to the quasi-global-scale coverage and high temporal frequency of the skin temperature retrievals.

2. Data and Methodology

Although the skin temperature retrievals are performed quasi-globally using multiple GEOsats, this paper primarily focuses on a regional evaluation of retrievals from GOES-13 for periods during 2011 and 2012. The intention of this article is to introduce our product by discussing results in terms of GOES-13, as it is the most familiar region for the authors, while leaving discussion of other GEOsat domains for future work. Again, data are available for other regions, but the quasi-global skill analysis is outside the scope of this paper.

2.1. Clear-Sky Retrievals

Quasi-global radiometric and cloud microphysical property retrievals are achieved through the use of five GEOsats: GOES-East (GOES-13 in this study), GOES-West (GOES-15), Meteosat-9 (Met-9), the second Multifunctional Transport Satellite (MTSAT-2) and the FengYun-2E (FY-2E). With one exception, the full-disk data are currently analyzed every 3 h between 60°N and 60°S using reduced resolution, which is accomplished by sampling the full-resolution data for every other (GOES-13, GOES-15, MTSAT-2 and FY-2E) or every third (Met-9), scan line and pixel to facilitate NRT processing of the NASA Langley GEOsat Cloud and Radiation Product [11]. As part of an evolutionary process heading toward full spatial and temporal resolution products, the MTSAT-2 data are already being analyzed every hour at the UTC half hour.
The analysis applies the cloud mask algorithm developed for the Clouds and the Earth’s Radiant Energy System (CERES) to classify pixels as cloudy or clear on a 1° × 1° grid [23]. The algorithm relies on comparisons of observations with estimates of the clear-sky TOA brightness temperature or reflectance at 0.65, 3.8 and 10.8 μm. Those estimates are made using the CERES 10’ clear-sky albedo and surface emissivity database along with the appropriate bidirectional and directional reflectance models, predicted surface temperatures and corrections for atmospheric absorption and emission [23,24]. The six-hourly, 1.0°-resolution, 72-level Modern-Era Retrospective Analysis for Research and Applications (MERRA) model forecasts provide the surface temperature and the temperature and humidity profiles used to compute the atmospheric corrections; together yielding an estimated TOA brightness temperature [25]. The surface temperatures and profiles are linearly interpolated in time to the satellite image time and the center of each 1° × 1° region. Other trace gases and ozone are also taken into account in the corrections. The specific logic of the cloud mask algorithm can be found in Minnis et al.[26], in which tests for many scenarios (e.g., scenes over snow, scenes over desert, sun-glint-influenced ocean scenes, smoke and thin cirrus) are described. Note that although the MERRA surface temperature (brought to TOA) is used as a seed value in this initial application of the cloud mask, decisions based solely on the difference between 11-μm observations and modeled values happen only for 2.3% (5.3%) of the pixels over land during the day (night), according to CERES Edition 2 QC reports, though usually even less frequently (unpublished data). Thus, the initial influence of the model skin temperature is significantly diminished.
After the cloud mask is applied, the mean 0.65-μm reflectance and 3.8- and 10.8-μm brightness temperatures are computed from the respective clear and cloudy pixels for each 1° × 1° grid box. If a sample size of at least 20% of the pixels within the grid box are considered clear, then the mean clear values replace the original clear-sky radiance estimates and the cloud mask is repeated with the new clear-sky values (Figure 1). That is, on this second iteration of the cloud mask, the TOA brightness temperature comes solely from observations, thus the influence of the model is even further diminished. The 20% criterion is used to minimize the influence of cloudy pixels on the final temperature value while maximizing the number of samples. The impact of the 20% threshold is explored in Section 3.2. Otherwise, if fewer than 20% of the pixels are clear, then the original clear-sky estimate and cloud mask are retained and no skin temperature is calculated. That is, skin temperature, reported here, is only based on observed TOA brightness temperature and never on a modeled value. The resulting cloudy pixels are then analyzed using the retrieval algorithms described by Minnis et al. for CERES to determine the pixel cloud properties [27]. When no solution is determined, the algorithm sometimes reclassifies the pixel as clear.
The mean observed 10.8-μm clear-sky TOA temperatures T for each 1° × 1° region are then used to determine the surface-leaving radiance or equivalent brightness temperature To. The radiance observed at the TOA can be represented numerically as:
B ( T ) = i = n 1 t i [ B ( T o ) ] + ( 1 t 1 ) B ( T 1 ) + i = n 2 ( 1 t i ) B ( T i ) j = i 1 t j ,
where the surface skin temperature is:
T s = B 1 { [ B ( T o ) ( 1 ε s ) L s ] / ε s } ,
and the downwelling radiance at the surface is:
L s = ( 1 t n ) B ( T n ) + i = 1 n 1 ( 1 t i ) B ( T i ) j = n i + 1 t j .
The subscripts i and j denote an atmospheric layer number, where 1 and n refer to the layers at the TOA and just above the surface, respectively. The atmospheric layer temperature is Ti, and B is the Planck function evaluated at 10.8-μm; B−1 is its inverse. The layer transmissivity, ti, uses the correlated k-distribution technique. This technique is described in detail by Goody et al.[28] and Kratz [29], in which the discrete version of the spectral-mean transmission tΔω(u,p, θ) is depicted as:
t Δ ω ( u , p , θ ) i = 1 n w i exp [ k i ( p , θ ) u ]
where ki(p, θ) is an absorption coefficient as a function of pressure p and temperature θ for a particular wavenumber ω, u is a pathlength and wi is a weighting factor for which the summation over n calculations must equal 1 [28,29]. This radiative transfer approach is utilized instead of the split-window method (e.g., Sun and Pinker [16]), because some of the GEOsat imagers lack the requisite 12.0-μm channel.
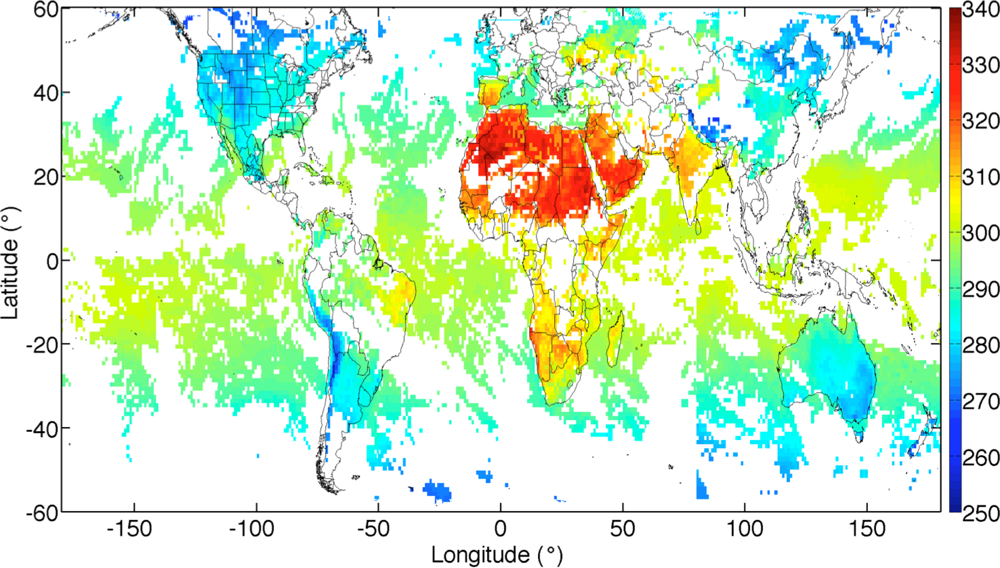
This is the nominal process to yield what is referred to here as the low-resolution (1° × 1°) skin temperature product (LRTP). Figure 2 shows an example of the quasi-global LRTP for 12:00 UTC, 15 May 2012 based on analyses of all 5 satellites ( www-angler.larc.nasa.gov/cgi-bin/site/showdoc?docid=22&domain=GLOBAL_GEO&lkdomain=Y). Some vertical lines, e.g., at 80°E, that correspond to the inter-satellite boundaries are evident in the figure, but they primarily reflect slight differences in cloud detection owing to a variety of reasons. Along those same boundaries, there are few, if any, discontinuities in the retrieved skin temperature values, indicating that the retrievals are consistent from one satellite to the next. While suitable, perhaps, for use with low-resolution NWP models, the LRTP is rather coarse and may not be ideal for higher resolution models.
Although the cloud mask and retrieval process are performed using a 1° × 1° grid in the case of the LRTP, the raw product is a set of parameters for each pixel used in the analysis. Thus, Ts could be retrieved for every pixel determined to be clear. As currently formulated, such an endeavor would be quite costly in computer time, requiring much additional application of the radiative transfer atmospheric corrections and cloud-contamination screening. To match the GEOS-5 resolution, the pixel-level retrievals are gridded and averaged into grid cells at the new 0.25° × 0.3125° resolution. One of the gridded products is the TOA clear-sky infrared temperature (TIRC). The correlated k-distribution technique is applied to account for atmospheric effects, as in the LRTP process above, to yield Ts for each grid box at the new resolution. The new values constitute the high-resolution skin temperature product (HRTP).

2.2. Instrument Comparison

The HRTP results for the seasonal months of October (2011), January, April and July (2012) are compared to narrowband radiating temperature measurements collected by the 10-m upwelling version of the ARM Infrared Thermometer (IRT) located at the Southern Great Plains (SGP) Central Facility. The IRT is a ground-based instrument that provides measurements of equivalent blackbody brightness temperature. The 11.0-μm upwelling IRT measures 60-s averaged ground radiating temperature, meaning it does not measure a true skin temperature, but rather the ground-leaving radiance equivalent to To[30]. This characteristic differs from the GEOsat retrievals that correct for surface emissivity as in Equation (2). The comparisons use Ts from the HRTP tile containing the Central Facility with IRT measurements at the time the tile was scanned. Similarly, ground site measurements of Ts from the NOAA National Climatic Data Center (NCDC) Apogee Precision Infrared Thermocouple Sensor (IRTS-P) at Avondale, Pennsylvania, are compared to HRTP Ts values. Because IRTS-P values are hourly averages and HRTP values are computed instantaneously every 3 h, the mean of two consecutive HRTP values is compared to the corresponding 3-hourly mean from the IRTS-P.
In the same manner, daytime and nighttime 1-km LST data from MODIS (Level-2 product, Collection 5, 11.0-μm, 5-min granules), onboard both the Terra and Aqua platforms, from the 5 × 5 pixel array centered on the ARM Central Facility, are averaged and compared to the ARM IRT data during the same seasonal period. This evaluation is conducted to determine how the HRTP performs relative to the MODIS LST at the ARM site. To further examine the LST and Ts differences, 1-km MODIS LST data were averaged to the same resolution as the HRTP tiles and compared to HRTP values over two 15° × 10° regions for both day and night. The first region is over the SGP domain (42–32°N and 105–90°W) and the second region is over the northeastern United States (47–37°N and 90–75°W). Over the SGP region, the Terra overpass is near 17:45 UTC, whereas the Aqua overpass is near 08:45 UTC. Aqua crosses over the northeastern region near 17:45 UTC. Similar to the GEOsat retrievals, the MODIS generalized split-window LST algorithm corrects for surface emissivity [3133]. More importantly, however, the MODIS LST product has undergone extensive validation with in situ measurements during field campaigns and is found to have accuracy better than 1 K, making it an ideal standard [3436].
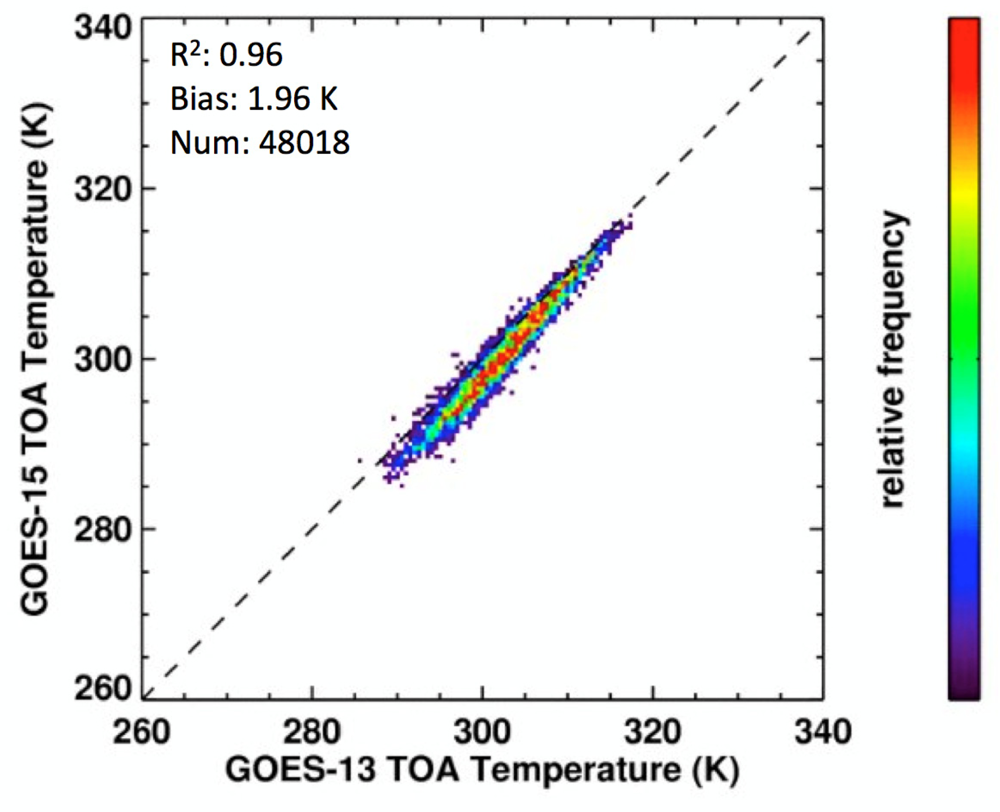
The comparisons take into account spectral response function (SRF) differences between the MODIS and GOES channels through application of a hyper-spectral-instrument-based spectral band adjustment factor. Measurements from the Infrared Atmospheric Sounding Interferometer (IASI) taken over land for four seasonal months of 2008 are convolved with the GOES-13 and MODIS 10.8-μm-channel SRFs to obtain matched brightness temperatures equivalent to actual GOES-13 and MODIS observations [37]. The equivalent brightness temperatures are regressed for both day (Figure 3(a)) and night (Figure 3(b)). Overall, T from the GOES-13 equivalent brightness temperatures is 0.70 K and 0.67 K greater than T from the MODIS equivalent brightness temperatures, for day and night, respectively. Corrections for these differences are represented by the ratio of the means of GOES-13 and MODIS equivalent T. Thus, a correction factor of 0.9975 is applied to GOES-13 HRTP values to account for spectral differences.

2.3. Model Comparison

The model comparisons for 1 August 2011 to 31 July 2012 utilize land surface temperature output from the GEOS-5.7.2 system at the 0.25° × 0.3125° resolution. Mean differences and root-mean-square differences (RMSD) are computed between GEOS-5 estimates and the GOES-13 satellite retrievals for grid cells with a land fraction greater than 0.95 (as defined by the GEOS-5 land cover mask) using only times when both data products indicate clear-sky conditions (defined here as cloud cover fraction less than 0.05 in both data products). Seasonal and annual statistics are computed separately for eight synoptic and off-synoptic times (00:00 UTC, 03:00 UTC, …, 21:00 UTC). Only grid cells having a minimum of 37 (20) days with valid data at the time-of-day in question during the 12-month annual (3-month seasonal) periods are included in the statistics. The minimum of 37 is chosen for the annual statistics such that at least 10% of the time series is analyzed (in practice it is much more). For the seasonal analysis, which is used to confirm that there is even sampling throughout the year, using the same 10% criterion could allow too few data points for meaningful second-order statistics to be calculated, thus a minimum of 20 data points is specified. On average, metrics were computed from 29 and 26 data points per grid cell for daytime and nighttime seasonal statistics, respectively. Annual statistics are based on ∼100 data points per grid cell on average. Note that for the purpose of assimilation into a model, data do not necessarily have to be available at all times or all locations in order to be useful.

3. Results and Discussion

3.1. Low- and High-Resolution Skin Temperature Comparison

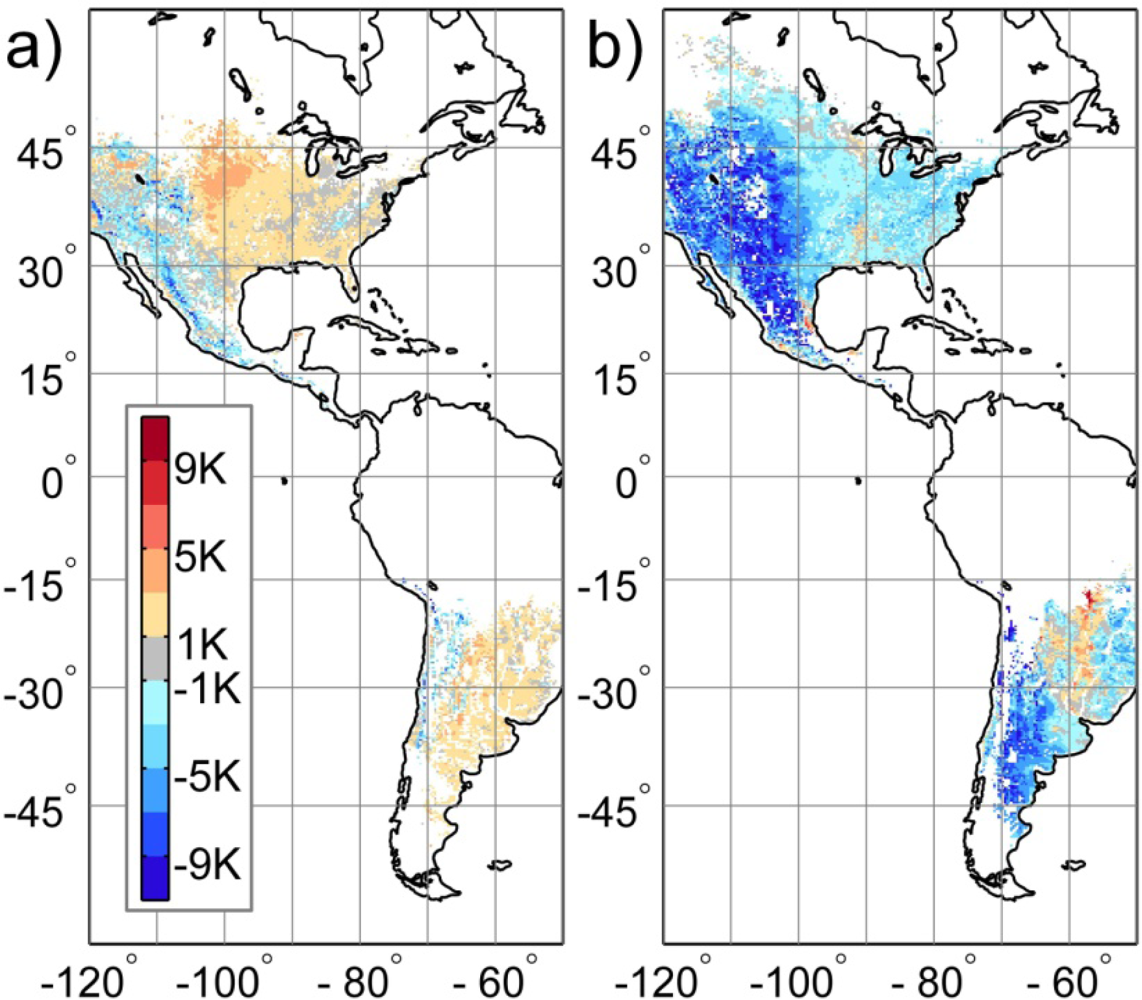
Figure 4 shows northern hemisphere LRTP and HRTP results for 17:45 UTC, 29 May 2011. Compared to the LRTP results (Figure 4(a)), the HRTP (Figure 4(b)) reveals finer topographical details, such as the thin cold band following the western Mexico Sierra Madre Occidental mountain range. Gaps in the coverage indicate either complete cloudiness or that there is uncertainty whether the Ts of the grid cell comes from modeled or observed values (only assured observation-based Ts is permitted). A likely cause for these gaps is sub-tile-scale clouds not allowing enough clear-pixel observations to modify the T for that tile (see Section 2.1). The change in the gap distribution from low- to high-resolution suggests that cloud masking criteria are not being met on the 1° × 1° grid, yet are satisfied for the 0.25° × 0.3125° resolution and vice versa. For example, a scene of broken cumulus could allow for an individual cloud to cover at least 80% of a fine-resolution tile, and yet, the total cloud amount within the coarse-resolution grid cell still remains below that threshold. Finally, the HRTP shows slightly better agreement and less error than the LRTP when compared to the ARM IRT, the NCDC IRTS-P and MODIS LST (see Sections 3.2 and 3.3).
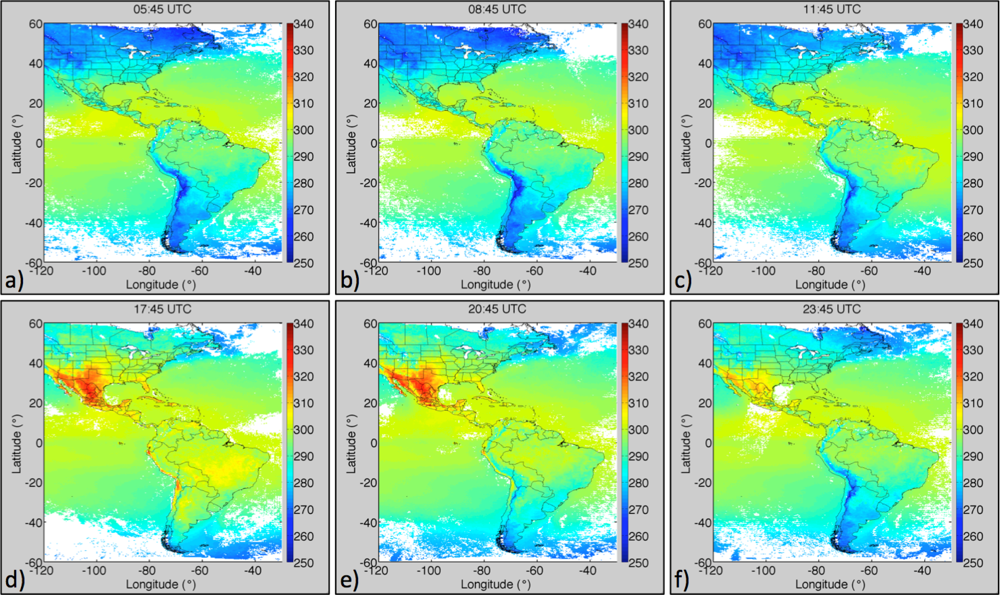
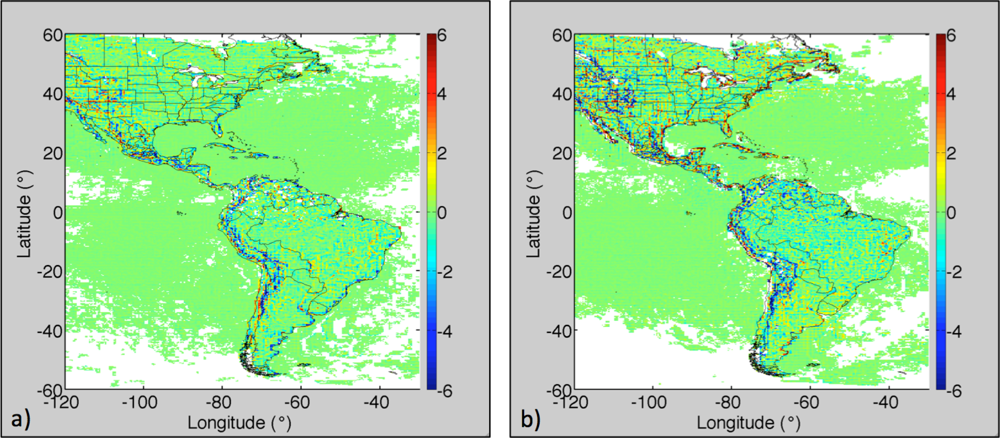
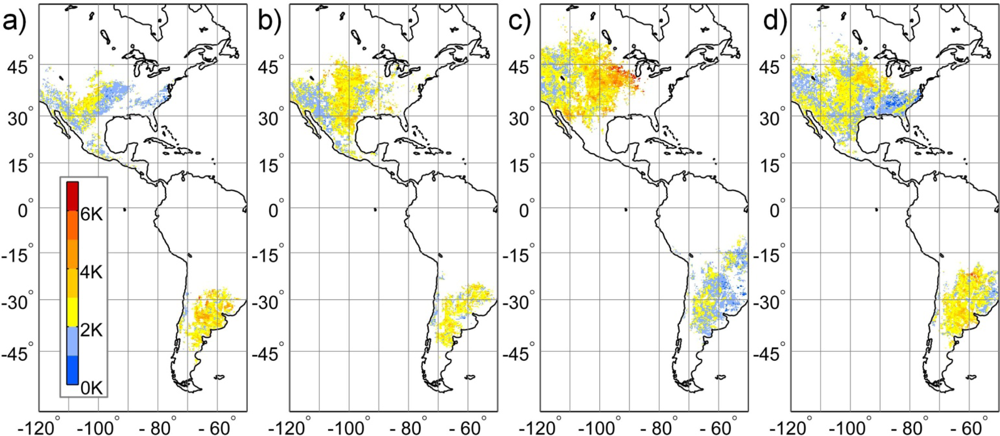
Eight HRTP retrievals are available for the GEOsat domain each day, which allows for reasonable characterization of the diurnal cycle. The 3-hourly GOES-13 retrievals of Ts for May 2011 were averaged at the nominal image times to obtain maps of the monthly mean, nearly-full-disk, diurnal variation in clear-sky skin temperature. Figure 5 reveals the typical daily heating and cooling patterns of the GOES-13 region. The cooler band in western Mexico is evidence that the feature observed in Figure 4(b) is a common attribute of the Sierra Madre Occidental mountain range during this month. Significant daily warming is evident along the South American Pacific coast, over the Brazilian savannah region, and over Central America, Mexico and the southwestern United States. Strong cooling is seen over the Rocky and Andes Mountains at night. Given that the more geographically narrow features (e.g., coasts and mountain ranges) are not resolved as well on the 1° × 1° scale, biases in high-resolution skin temperature compared to the low-resolution skin temperature are expected near these areas. The differences in Ts between the LRTP and HRTP results in Figure 6 show a slight warm bias, on average, in HRTP along the South American central-west coast (other coastal areas as well) and a cold bias along the Andes Mountain chain and mountainous regions of North America (Figure 6(b)). Note that for Figure 6, absolute differences can exceed 10 K, especially in the mountains during the day, but the scale only ranges from ±6 K as to not dilute the finer details in regions where absolute differences are less than 1 or 2 K.

3.2. Comparison with Ground-Site and MODIS Land Surface Temperature

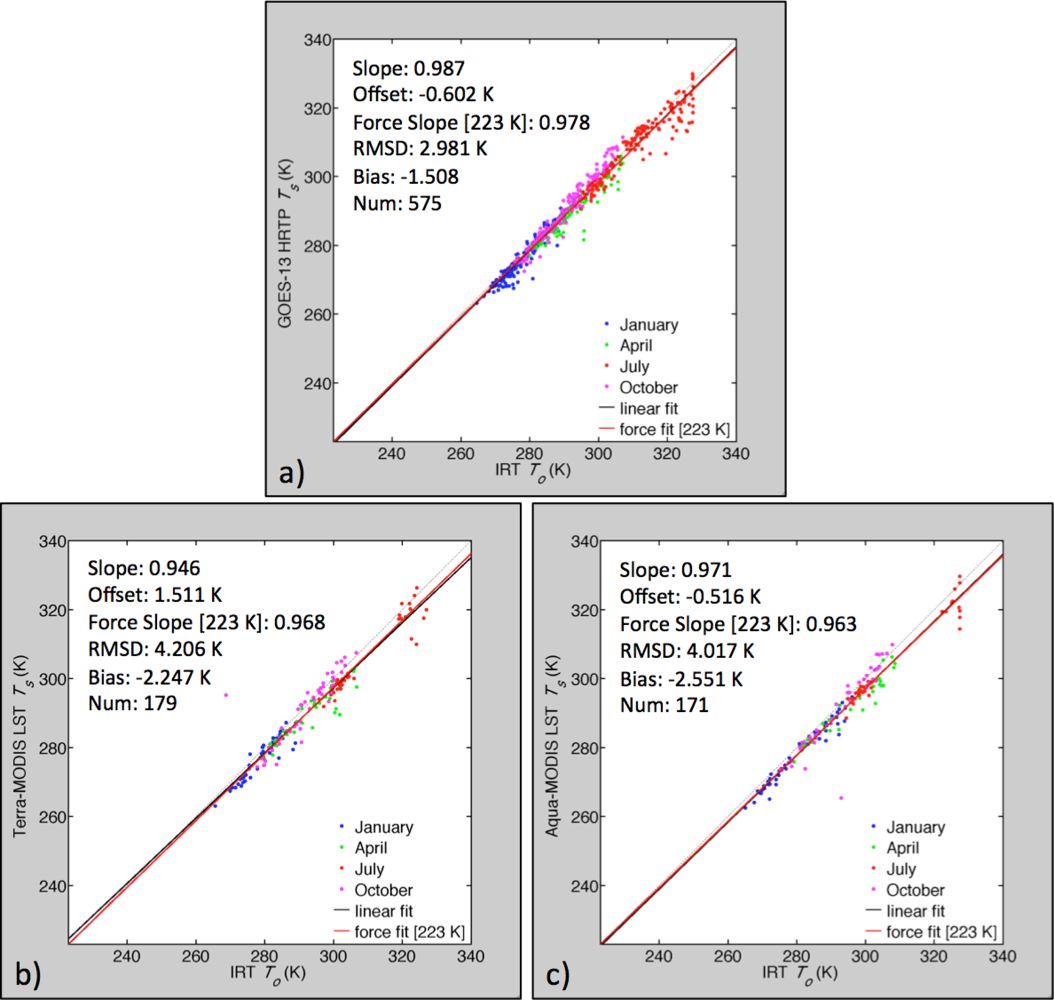
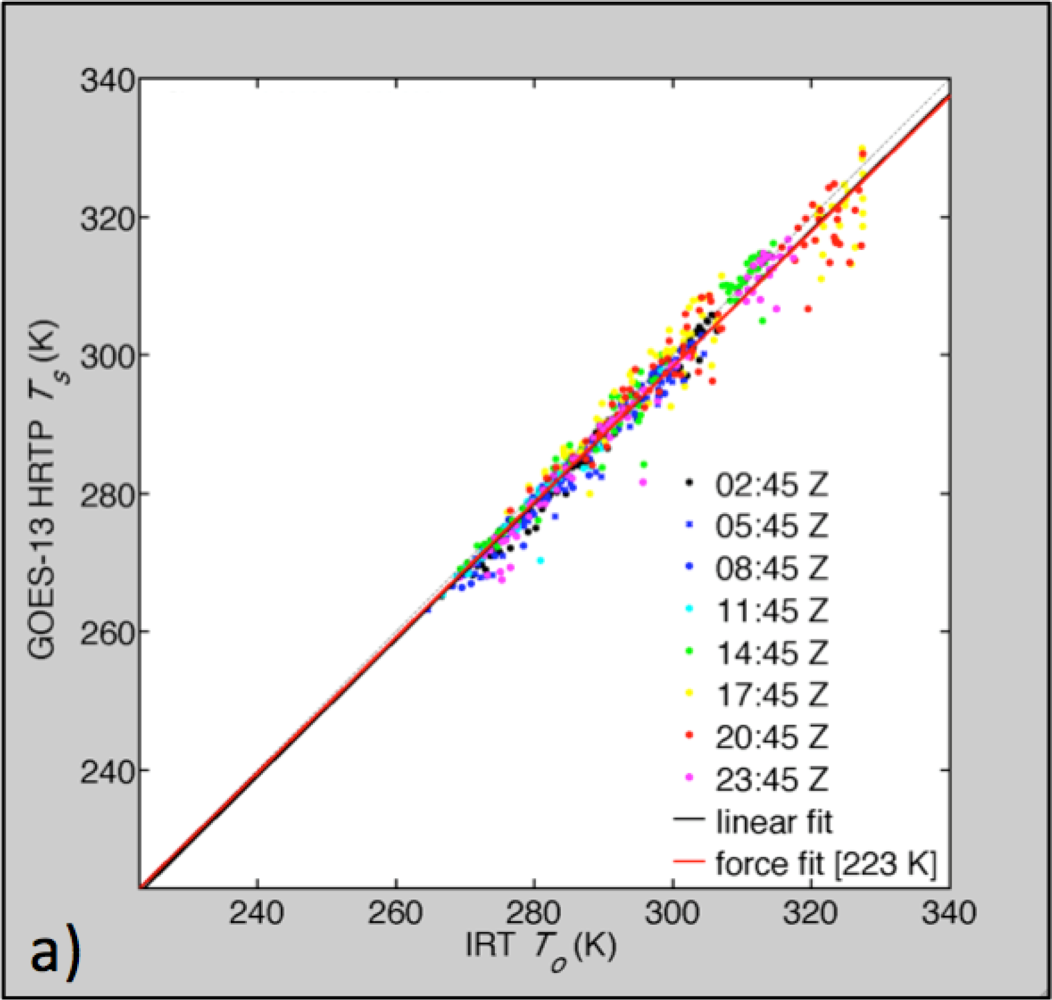
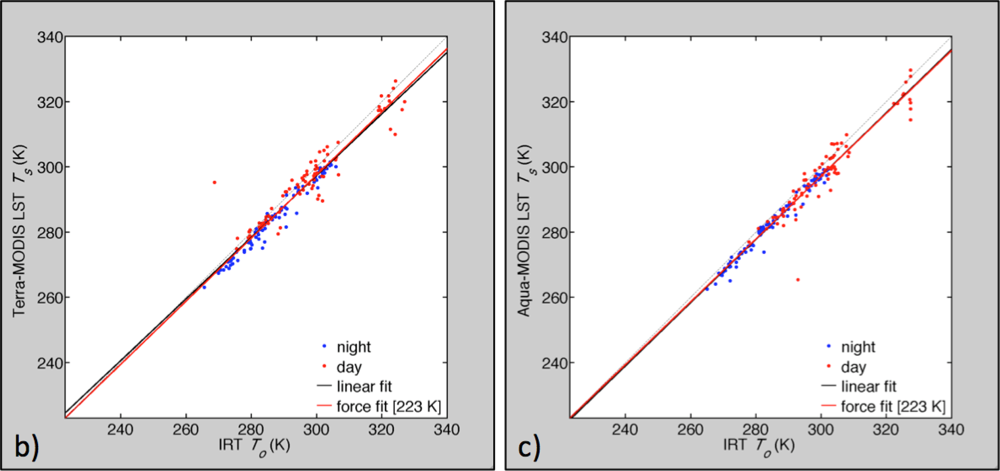
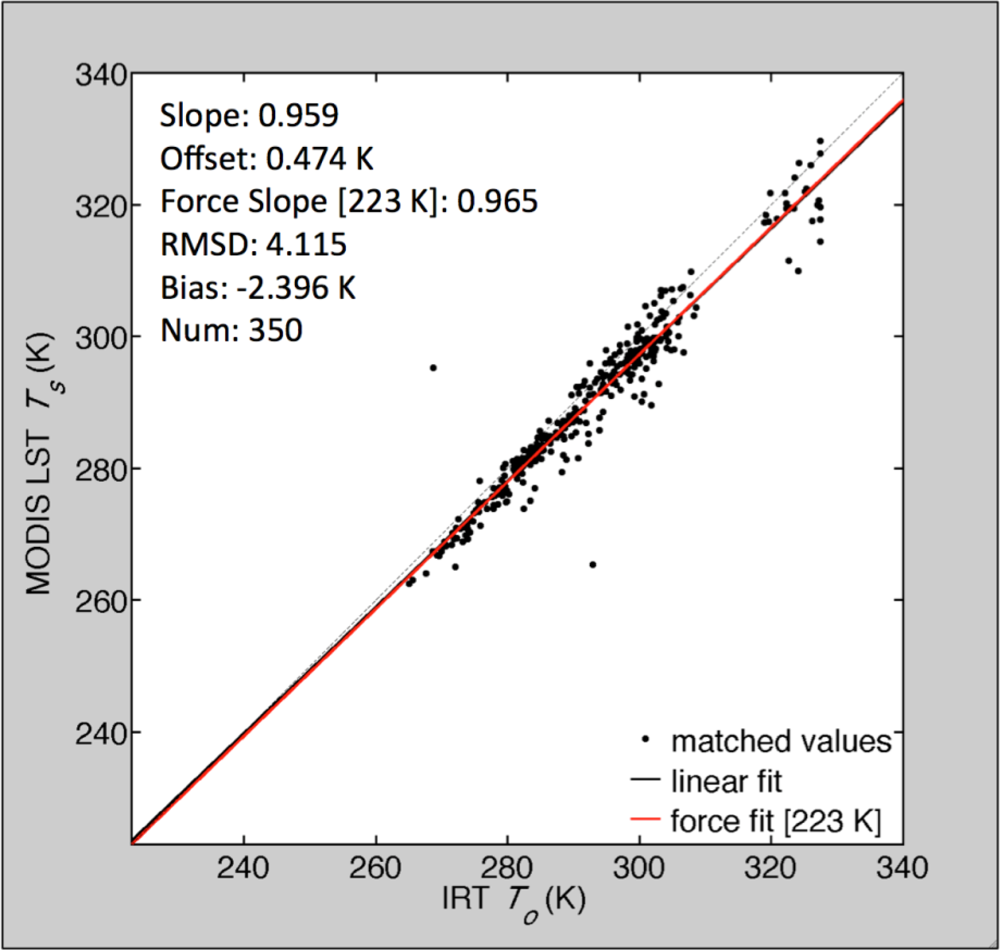
High-resolution skin temperature retrievals from GOES-13 allow for frequent comparison with data taken at the ARM SGP Central Facility—a site often used for instrument validation [3842]. Figures 7 and 8 show comparisons of To from the Central Facility’s 10-m IRT with the HRTP Ts and the Terra- and Aqua-MODIS LST values for the seasonal months of October 2011–July 2012 (Note: the force fits in these figures represent the slopes of the linear regression forced through the minimum measureable temperature of the IRT (223 K) [30]. Because the force fit is a ratio of the y-axis and x-axis means, it provides an unambiguous slope that indicates which variable exceeds the other, on average).
The results indicate that the HRTP values are 1.5-K lower, on average, than the IRT measurements. During daytime, the bias is −1.2 K compared to −1.8 K at night, with standard deviations of the differences (SDDs) of 3.2 K and 1.6 K, respectively. A summary of the biases, or mean differences, and the SDDs associated with the different instrument comparisons can be found in Table 1. The overall mean difference is within the 2.5–5.0 K accuracy specified for the GOES-R ABI LST retrieval product [43], but the SDD is slightly greater than the 2.3-K precision required for GOES-R ABI retrievals [43,44]. However, SDD for the GOES-with-MODIS comparisons is within the precision of 1–2 K desired for the ISCCP product relative to MODIS LSTs (Section 3.3, [9]). The Terra-MODIS and Aqua-MODIS LST values overall are, respectively, 2.2 K and 2.6 K less, on average, than the IRT measurements, with SDDs near 3.3 K. Thus, compared to the ARM IRT data, the GOES-13 HRTP is at least as accurate as the MODIS LST, but with the benefit of a greater number of daily measurements without added bias or increased error. Most likely, the biases for all three of the satellite-ARM comparisons are less during the day than at night, because the IRT saturates at 330 K (see Figures 79) and solar illumination angles affect the satellite retrievals (see Section 3.3). If measurements could be gathered past that limit, the daytime biases would likely be larger than their nocturnal counterparts, which is more typically the case [9].
This measurement discrepancy problem can be illustrated using an instrument that takes true Ts readings, such as the Avondale, PA NCDC IRTS-P. Results from the HRTP and IRTS-P comparison, for day and night, are also shown in Table 1. Compared to the ARM IRT evaluation, HRTP biases and SDDs are smaller at night by 1.3 and 0.3 K, respectively. During the day, the magnitude of the HRTP–IRTS-P bias exceeds its ARM counterpart by 1.4 K, and the SDD is larger by 0.3 K. The reason for this increased daytime error is the fact that the IRTS-P is not saturated at 330 K, meaning that the HRTP from GOES-13, which can only measure max T values of 330 K, appears much cooler than the NCDC instrument during the day in July. Of course, in both ground site comparisons, there is a rather large spatial sampling difference between the grid-based satellite retrievals and point-like IR thermometer measurements. Despite the issues, such comparisons are valuable, because it is clear that the GOES-13 retrieval effectively tracks the variations in To and Ts.
Table 2 shows the results of comparing both the HRPT and LRPT with the surface measurements and MODIS retrievals of LST. In all cases, use of the high-resolution data improves the agreement of the GOES retrievals and the other measurements. The biggest drop in SDD occurs for the ARM site comparisons.
The GOES results used here are based on the estimation of Ts whenever the cloud-cover (CC) for the 1° region was less than 80%. This somewhat loose threshold, used because it provides more samples, can introduce a bias error into both the HRTP and LRTP, because, as the CC increases, the chance of partially cloudy or colder pixels affecting the retrievals rises. Because the cloud fraction is available for each grid-cell retrieval, it is possible to evaluate the impact of the cloud threshold on the bias and SDD relative to the surface measurements. To that end, the IRT comparisons were performed using the same data as in Figure 7(a), but three cases are considered: CC > 30%, CC ≤ 30%, and, the clearest, CC = 0%. As seen in Table 1 for those cases, the mean differences are −3.1, −1.1 and −0.5 K, respectively. The corresponding SDD values are 2.7, 2.4 and 1.8 K. The numbers of samples for the same three cases are 112, 463 and 327, respectively. Thus, if only the 100% clear cases are considered, the number of samples decreases by 43%.
Although the satellite could systematically see more cloud-shadowed clear areas than the IRT, the drop in the bias and SDD with decreasing CC is most likely due to decreased cloud contamination of TIRC. Therefore, if only the pixels from a cloud-free 0.25° × 0.3125° region are used for the IRT comparison, the accuracy and precision are well within the GOES-R ABI guidelines and comparable to the comparisons of the GOES-R split-window algorithm with surface observations, which only used cloud free scenes [44]. The difference is also similar to that for the comparison of HRPT and MODIS in Table 1. Thus, for highest accuracy, it is recommended that only cloud-free regions be used for Ts. However, because CC is available with each HRTP observation, it would be possible to increase the number of grid cells with useful Ts values by determining a cloud-contamination bias as a function of CC and correcting the estimates of Ts for grid cells having CC between 20 and 100%. Such a process could compensate for some of the regions lost by invoking the tighter threshold of CC < 5% or so.
Another limitation is the use of Ts from GOES-13 for comparison with To from ARM. This is the reason why the MODIS comparisons are valuable. Given that the MODIS LST product has undergone extensive validation with in situ measurements during field campaigns and is found to have an accuracy better than 1 K, it is a goal that the HRTP at least match this standard [3436]. The comparisons to ARM data remain valuable, because they demonstrate that both MODIS and the GOES-based HRTP exhibit similar bias and error compared to the often-cited ground site measurements [3842]. Additionally, they permit evaluation of the cloud cover threshold as discussed above. The next section will further address the accuracy of the GOES-13 HRTP relative to the MODIS standard.

3.3. Direct Matching with MODIS Land Surface Temperature

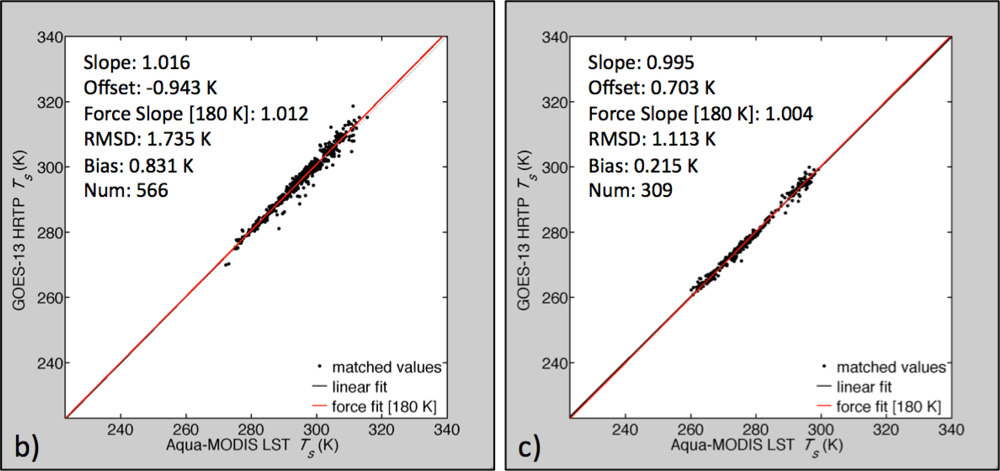
A concern related to these satellite versus ground-site comparisons of the previous section is the discrepancy between the satellite and surface sampling areas. The pixels constitute a much larger sampling region than the discrete, comparatively point-like measurements of the IR thermometers. Therefore, a summation and average of MODIS pixel values within the HRTP tile boundaries should provide a better representation of how well the HRTP compares to MODIS LST. The comparisons are conducted within 15 min of each other, and the maximum viewing zenith angle (VZA) difference between the instruments is 15°. Daytime (∼17:45 UTC) comparisons between GOES-13 HRTP and Terra-MODIS (Figure 10(a)) over the SGP region reveal that the HRTP is 2.9 ± 1.8 K warmer than the LST. Nighttime (∼08:45 UTC) comparisons over the same region using Aqua-MODIS (Figure 10(c)) show that GOES-13 HRTP is only 0.2 ± 1.1 K warmer than MODIS. Comparisons conducted using the Aqua-MODIS data over the northeastern US during daytime (Figure 10(b)) reveal improved agreement, with the HRTP being 0.8 ± 1.5 K warmer than the MODIS LST. These matches are significantly correlated (p < 0.0001). Coefficients of determination are 0.97 or better, which suggests a consistent linear agreement over a large dynamic range.
When considering a 2-K precision [9], Aqua-MODIS direct analyses easily meet this requirement for both day and night. To understand why the daytime Terra-MODIS mean difference is so large, it is necessary to consider angular influences on inter-satellite comparisons. Disparity between the HRTP and Terra-MODIS daytime LST actual and predicted results could be due to different viewing and illumination geometry. At the time of the Terra (∼17:45 UTC) overpass, GOES-13 and MODIS view the SGP region with rather different viewing geometries. The GOES-13 instrument observes the region from the east at a VZA of 44° to 57°. The MODIS instrument always views the region from the west with VZAs that vary from 50° to 66°. The solar zenith angles vary from 17° to 66°. This area can be classified as grassland and cropland with relatively small terrain variability. According to the analyses of multi-angular data by [45] and [46], it is realistic for the average clear-sky brightness temperature anisotropy for the GOES-13 viewing and illumination angles at the times of the MODIS overpasses in the SGP region to be between 0.5 and 4 K.
This effect is demonstrated in Figure 11, which compares matched TIRC values from GOES-East and GOES-West near 17:45 UTC in the SGP region. Compared to GOES-15 after intercalibrating the two satellites as in Minnis et al.[45] and correcting for a relative 1-K bias in the GOES-15 data, GOES-13 is 2 K warmer on average. At night (08:45 UTC), the difference is 0 K after correcting for the bias. At 20:45 UTC, when GOES-13 views the shady portion and GOES-15 views more of the illuminated side, the mean temperature from GOES-13 is 1.4 K cooler. Similar results were found by Minnis et al.[45]. For comparisons using other times and viewing and illumination angles, the Terra-MODIS results would likely be comparable to the Aqua-MODIS and GOES-13 daytime comparison in Figure 10(b). For this case, both Aqua MODIS and GOES-13 view the northeastern US from the east, which means the instruments generally observe the same illumination condition, and therefore, it is expected that they would match more closely. It is concluded, therefore, that the greater GOES-13 values in Figure 10(a) are, for the most part, due to viewing and illumination angle differences.
In general, satellite infrared retrievals of Ts assume that the surface emissivity is isotropic and that there is no relative azimuth angle (RAA) dependency. As seen above and in earlier studies, the RAA can have a dramatic effect. However, the largest errors are confined to certain angular configurations. Minnis et al.[46] found that the anisotropy depends on terrain variability and vegetation type. The greatest excursions from isotropy were primarily found for RAA < 30° (shady side) and RAA > 150° (illuminated side) for VZA > 40°. Such angles generally occur only 2–4 h per day for a given GEOsat, and both shady and sunlit sides are observed over a 24-h period (e.g., [45]). Thus, biases, such as those seen in Figures 10(a) and 11, would tend to be balanced out when averaged over the course of the day, and the precision of the observations relative to MODIS would be more likely the SDD values of 1.5 and 1.1 K in Figures 10(b) and 10(c), respectively. But, until a method for correcting for RAA-dependent biases is developed and applied, users should be aware of these angle effects and make use of the angular information included in the HRTP dataset.
Small differences between GOES-13 HRTP and MODIS LST can also, at least, partially be explained by atmospheric corrections to TIRC and differences between auxiliary emissivity data. The MODIS retrievals utilize a generalized split-window method, solving for surface emissivity and LST simultaneously with day/night pairs of observations over a given site [31,32,35]. The split-window approach accounts for the atmospheric absorption without reliance on a model estimate of atmospheric humidity, while the GEOsat processing uses MERRA profiles and a fixed set of surface emissivities for each month. To examine the impact of using a different set of surface emissivities and atmospheric temperatures and humidities, the Ts retrievals were performed using atmospheric profiles from the NOAA Global Forecast System (GFS) and MODIS-derived surface emissivities [47,48]. The mean skin temperature computed using the GFS soundings is 0.2 ± 0.71 K less than that found using MERRA forecasts. If the MODIS emissivities are used in the GOES-13 retrievals, Ts decreases, on average, by 0.8 K in the SGP region and by 0.1 K in the northeastern US region. Although not a direct comparison of MODIS and GEOsat emissivities and atmospheric corrections, the results are likely a reasonable representation of the variability in Ts expected due to differences in atmospheric corrections and emissivities. Assuming that is the case, it may be concluded that the 0.8-K (day) and 0.2-K (night) warm biases of GOES-13 relative to MODIS can be explained by the algorithm and auxiliary input differences.
Taking all of these aspects into account, it is evident that the GOES-13 high-resolution skin temperature product is, on average, within the recommended ∼2-K accuracy of MODIS LST [9,44]. In fact, both day and night comparisons are, on average, well within 1 K of the MODIS values, which have an accuracy of ±1 K [3436]. Before concluding that the accuracy determined here is representative everywhere, it will be necessary, in the future, to perform GEOsat Ts and MODIS LST comparisons around the globe. Furthermore, there are particular times of day when a larger error could occur due to angular effects, and future studies should address means to correct such biases.

3.4. Comparison with GEOS-5 Land Surface Temperature

Additional insights into the skin temperature retrievals can be gained from a comparison against model estimates. Figure 12 shows the nighttime (06:00 UTC) and daytime (18:00 UTC) mean differences between the model and high-resolution satellite estimates (GEOS-5 minus GOES-13) for the 12-month period from 1 August 2011 to 31 July 2012. For most of North America north of 45°N and tropical South America north of 20°S, there were not enough clear-sky days to compute meaningful statistics (Section 2.3). In the rest of the Americas, the mean differences during the night are typically within ±3 K. Higher mean differences are found in the mountainous regions of western Mexico, the western United States and the Andes, where GEOS-5 temperatures are less than Ts from GOES-13 by more than 3 K, on average. Moreover, GEOS-5 LSTs exceed the GOES-13 averages by 3–5 K in much of the Dakotas and in small patches of central Argentina.
During the day, the mean differences are considerably larger (Figure 12(b)), similar to the MODIS-ISCCP findings of Jiménez et al.[9]. In the western United States, western Mexico and western Argentina, GEOS-5 land surface temperatures are cooler than the GOES-13 retrievals by up to 10 K. Such large daytime differences, however, can be expected. While the satellite retrievals describe a true “skin” temperature, the GEOS-5 land surface temperature estimates are for a prognostic model surface layer with a small, but non-zero heat capacity [5]. The peak daytime model temperatures are therefore considerably lower than the satellite-retrieved skin temperatures. The situation is different in east-central Argentina, where GEOS-5 land surface temperatures exceed the GOES-13 retrievals by as much as 9 K. An analysis of GEOS-5 cloud optical depth estimates suggests that these counter-intuitive differences are most likely caused by errors in the GEOS-5 moist physics and cloud parameterizations, which lead to strongly biased model temperatures that adversely impact model skin temperature estimates, even during clear days (not shown).
Figure 13 shows daytime (18:00 UTC) seasonal root-mean-square differences (RMSD) values (excluding seasonal mean differences) versus GEOS-5 for the high-resolution GOES-13 skin temperature retrievals. The RMSD values are usually between 1 and 4 K, except during summer. The RMSD values exceed 4 K during JJA in much of the north-central United States and during DJF in portions of Argentina and Uruguay. The lowest RMSD values of 1–2 K are found during cooler conditions (e.g., in the eastern and central United States during DJF, in the southern United States during SON and in eastern Argentina and Uruguay during JJA). As can be expected, the nighttime (06:00 UTC) RMSD values are considerably lower and are typically 1–3 K across the domain and throughout the year (not shown).
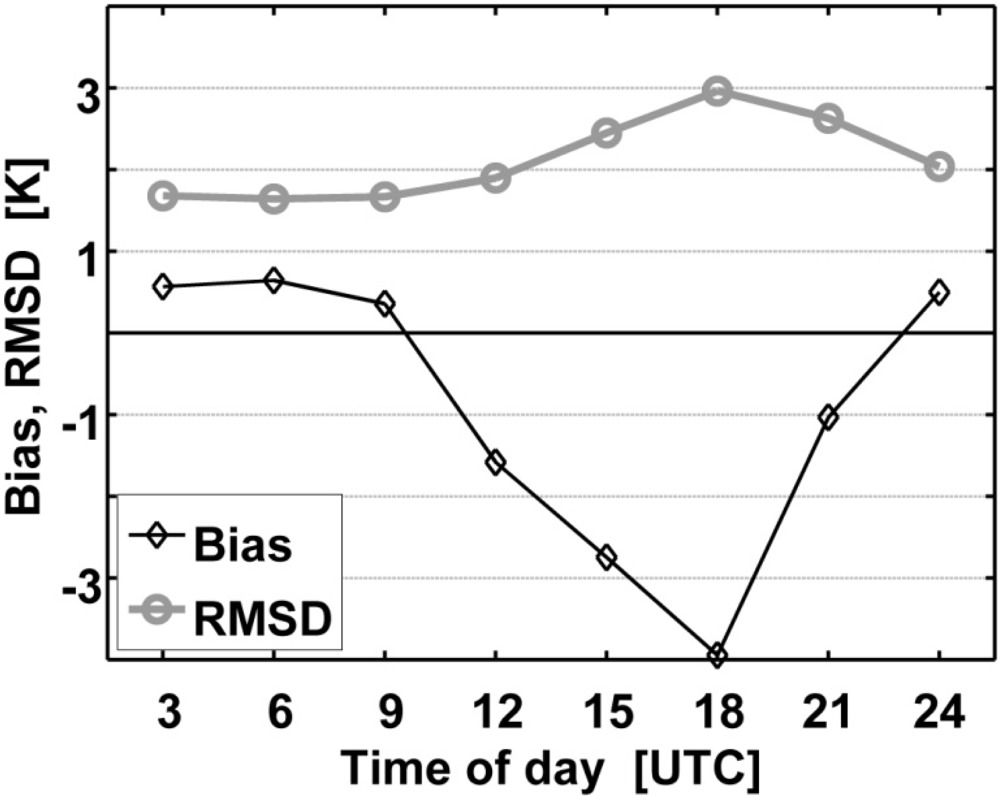
The area-average diurnal cycles of the annual bias and RMSD (excluding annual mean differences) values are shown in Figure 14. The domain-averaged bias is typically below 1 K during the night (00:00 UTC to 09:00 UTC) and is considerably larger during the day (up to −4 K at 18:00 UTC). The mean absolute bias is typically 0.5–1 K greater than the absolute value of the bias shown in Figure 14. Similarly, the RMSD values are typically below 2 K during nighttime, including early morning and evening (00:00 UTC to 12:00 UTC). During the daytime (15:00 UTC to 21:00 UTC), however, the RMSD values exceed 2 K, with a maximum of 3 K at 18:00 UTC.
The differences between the GEOS-5 estimates and the GOES-13 satellite retrievals of skin temperature are not small, but this analysis nevertheless suggests that the high-resolution retrievals are largely consistent with the independent GEOS-5 estimates. Very similar bias and RMSD values versus GEOS-5 were found for the low-resolution GOES-13 retrievals (not shown). Looking forward, the comparison of the GOES-13 skin temperature retrievals with estimates of land surface temperature from the GEOS-5 atmospheric analysis system is a necessary step towards the assimilation of the GEOsat retrievals into the GEOS-5 system. The spatial and temporal variations of the biases shown in Figures 12 and 14 must be addressed as part of the assimilation system, which can be accomplished using a bias estimation and correction approach [5]. Furthermore, the seasonal variations of the RMSD values (Figure 13) should be reflected in the model and observation error covariances that are required for the assimilation of the satellite observations into GEOS-5. Our analysis also reveals serious issues with cloud modeling in the GEOS-5 atmospheric model during summer over portions of Argentina. These issues manifest themselves in large and counter-intuitive mean differences between the GEOS-5 land surface temperatures and the GOES-13 satellite retrievals, but can only be fully resolved through improvements in the GEOS-5 atmospheric model.

4. Concluding Remarks

A technique for retrieving quasi-global surface skin temperature from geostationary satellites was presented. Although a regional evaluation for the GOES-East region was the chief focus of this article, the skin temperature product is available for all GEOsat domains, which will be discussed in future work. Results of this technique were shown to be within the GOES-R ABI and ISCCP ∼2-K precision requirements and are comparable to the accuracy of MODIS to within 1 K, but with the added benefits of having consistent, predictable geometry and being able to increase sampling frequency without adding bias or increasing error, except for particular viewing and illumination conditions that are observed for only 2–4 h out of a 24-h day. Although it lacks the spatial resolution of MODIS, the GEOsat product, unlike LST values from LEO satellites, can be acquired nearly simultaneously, quasi-globally, throughout the day. As part of real-time processing, data similar to those seen in Figure 2 are currently generated for eight synoptic and off-synoptic times each day. These quasi-global datasets have the potential to play an important role in numerical weather prediction models.
The retrieval technique is flexible such that any resolution output down to the pixel level can be provided for LST studies, model assimilation and validation, surface flux estimates and other uses. Initial comparisons with GEOS-5 output have revealed systematic biases with diurnal and seasonal dependencies that must be better understood and that must be addressed when the observations are used in the assimilation process. Some of the differences are due to an unavoidable mismatch between the modeled land surface temperatures and the skin temperature retrievals, while part of the differences are due to GEOS-5 model structural and parameter errors, as well as errors in the retrievals. The latter may arise, for example, from angular variations in the upwelling clear radiances that are not accounted for in the retrievals. Nevertheless, these results constitute an important step towards assimilation of the GEOsat retrievals into the GEOS-5 system. Future work should focus on broadening the scale of data assimilation to all non-polar regions.
The comparisons indicate that surface skin temperature from the NASA Langley GEOsat Cloud and Radiation Product, which is currently available, can be improved further. In the near future, hourly retrievals will replace the current three-hourly HRTP dataset and full-resolution, instead of sub-sampled, data will be analyzed. Development of techniques to remove viewing and illumination angle dependencies would help facilitate a decrease in the instantaneous errors during the daytime. To achieve full inter-satellite consistency, the analysis will utilize GEOsat infrared radiances that are calibrated against a common reference and account for spectral response function differences. For consistency with GEOS-5, the analyses will utilize the GEOS-5 forecasts instead of the current MERRA temperature and humidity output. It is hoped that the spatial and temporal advantages of this skin temperature product will help further advance weather prediction.

Acknowledgments

This research was supported by the NASA Modeling, Analysis and Prediction Program and the NASA Satellite Calibration Interconsistency Program. The IASI data were provided by the NOAA Comprehensive Large Array-Data Stewardship System. The IRT data were provided by the ARM Climate Research Facility. The MODIS land product data were provided by NASA’s Earth Observing System ClearingHouse Team. Computing was supported by the NASA High End Computing Program. The NCDC Quality Controlled Datasets were provided by the US Climate Reference Network of the NOAA National Climatic Data Center. We thank Yan Chen and Robert Arduini for providing MODIS-derived surface emissivity maps, Patrick Heck and Douglas Spangenberg for their work on diagnosing correlated k-distribution algorithm discrepancies and Qing Trepte for her input on the cloud mask.

References and Notes

  1. Bodas-Salcedo, A.; Ringer, M.; Jones, A. Evaluation of the surface radiation budget in the atmospheric component of the Hadley Centre Global Environmental Model (HadGEM1). J. Clim 2008, 17, 4723–4748. [Google Scholar]
  2. Tsuang, B.; Chou, M.; Zhang, Y.; Roesch, A.; Yang, K. Evaluations of land ocean skin temperatures of the ISCCP satellite retrievals and the NCEP and ERA reanalyses. J. Clim 2008, 21, 308–330. [Google Scholar]
  3. Garand, L. Toward an integrated land-ocean surface skin temperature analysis from the variational assimilation of infrared radiances. J. Appl. Meteorol 2003, 42, 570–583. [Google Scholar]
  4. Bosilovich, M.; Radakovich, J.; Silva, A.D.; Todling, R.; Verter, F. Skin temperature analysis and bias correction in a coupled land-atmosphere data assimilation system. J. Meteorol. Soc. Jpn 2007, 85A, 205–228. [Google Scholar]
  5. Reichle, R.H.; Kumar, S.V.; Mahanama, S.P.P.; Koster, R.D.; Liu, Q. Assimilation of satellite-derived skin temperature observations into land surface models. J. Hydrometeorol 2010, 11, 1103–1122. [Google Scholar]
  6. Rodell, M.; Houser, P.R.; Jambor, U.; Gottschalck, J.; Mitchell, K.; Meng, C.-J.; Arsenault, K.; Cosgrove, B.; Radakovich, J.; Bosilovich, M.; et al. The global land data assimilation system. Bull. Amer. Meteor. Soc 2004, 85, 381–394. [Google Scholar]
  7. Jiménez, C.; Prigent, C.; Aires, F. Toward an estimation of global land surface heat fluxes from multisatellite observations. J. Geophys. Res 2009, 114, D06305. [Google Scholar]
  8. Rossow, W.; Schiffer, R. Advances in understanding clouds from ISCCP. Bull. Am. Meteorol. Soc 1999, 80, 2261–2287. [Google Scholar]
  9. Jiménez, C.; Prigent, C.; Catherinot, J.; Rossow, W.; Liang, P. A comparison of ISCCP land surface temperature with other satellite and in situ observations. J. Geophys. Res. 2012, 117, DO8111. [Google Scholar]
  10. Minnis, P.; Nguyen, L.; Doelling, D.R.; Young, D.F.; Miller, W.F.; Kratz, D.P. Rapid calibration of operational and research meteorological satellite imagers, Part II: Comparison of infrared channels. J. Atmos. Oceanic Technol 2002, 19, 1250–1266. [Google Scholar]
  11. Minnis, P.; Smith, W.L., Jr.; Young, D.F.; Nguyen, L.; Rapp, A.D.; Heck, P.W.; Sun-Mack, S.; Trepte, Q.Z.; Chen, Y. A Near-Real Time Method for Deriving Cloud and Radiation Properties from Satellites for Weather and Climate Studies. Proceedings of the AMS 11th Conference on Satellite Meteorology and Oceanography, Madison, WI, USA, 15–18 October 2001; pp. 477–480.
  12. Yu, Y.; Tarpley, D.; Privette, J.L.; Goldberg, M.D.; Rama Varma Raja, M.K.; Vinnikov, K.L.; Xu, H. Developing algorithm for operational GOES-R land surface, temperature product. IEEE Trans. Geosci. Remote Sens 2009, 47, 936–951. [Google Scholar]
  13. Yu, Y.; Tarpley, D.; Xu, H.; Chen, M. GOES-R Advanced Baseline Imager (ABI) Algorithm Theoretical Basis Document for Land Surface Temperature; 2.0; NOAA NESDIS Center for Satellite Applications and Research: Camp Springs, MD, USA, 2010. [Google Scholar]
  14. DaCamara, C.C. The Land Surface Analysis SAF: One Year of Pre-Operational Activity. Proceedings of the 2006 EUMETSAT Meteorological Satellite Conference, Helsinki, Finland, 12–16 June 2006.
  15. Trigo, I.; Monteiro, I.T.; Olesen, F.; Kabsch, E. An assessment of remotely sensed land surface temperature. J. Geophys. Res 2008, 113, D17108. [Google Scholar]
  16. Sun, D.; Pinker, R.T. Estimation of land surface temperature from a Geostationary Operational Environmental Satellite (GOES-8). J. Geophys. Res 2003, 108. [Google Scholar] [CrossRef]
  17. Inamdar, A.K.; French, A.; Hook, S.; Vaughan, G.; Luckett, W. Land surface temperature (LST) retrieval at high spatial and temporal resolutions over the southwestern US. J. Geophys. Res 2008, 113, D07107. [Google Scholar]
  18. Inamdar, A.K.; French, A. Disaggregation of GOES land surface temperatures using surface emissivity. J. Geophys. Res 2009, 36, L02408. [Google Scholar]
  19. Wu, X.; Menzel, W.P.; Wade, G.S. Estimation of sea surface temperatures using GOES-8/9 radiance measurements. Bull. Amer. Meteor. Soc 1999, 80, 1127–1138. [Google Scholar]
  20. Pinker, R.; Li, X.; Yegorova, E.; Meng, W. Toward improved satellite estimates of short-wave radiative fluxes—Focus on cloud detection over snow: 2. Results. J. Geophys. Res 2007, 112, D09204. [Google Scholar]
  21. Pinker, R.T.; Sun, D.; Hung, M.-P.; Li, C.; Basara, J.B. Evaluation of satellite estimates of land surface temperature from GOES over the United States. J. Appl. Meteor. Climatol 2009, 48, 167–180. [Google Scholar]
  22. Rienecker, M.M.; Suarez, M.J.; Todling, R.; Bacmeister, J.; Takacs, L.; Liu, H.-C.; Gu, W.; Sienkiewicz, M.; Koster, R.D.; Gelaro, R.; Stajner, I.; Nielsen, J.E. The GEOS-5 Data Assimilation System—Documentation of Versions 5.0.1, 5.1.0 and 5.2.0; NASA Tech. Rep. Series on Global Modeling and Data Assimilation; NASA/TM-2008-104606; NASA: Greenbelt, MD, USA, 2008; Volume 27, p. 92. [Google Scholar]
  23. Minnis, P.; Kratz, D.P.; Coakley, J.A., Jr.; King, M.D.; Garber, D.; Heck, P.; Mayor, S.; Young, D.F.; Arduini, R. Cloud Optical Property Retrieval (Subsystem 4.3). Clouds and the Earth’s Radiant Energy System (CERES) Algorithm Theoretical Basis Document, Cloud Analyses and Radiance Inversions (Subsystem 4); NASA RP 1376; CERES Science Team, Ed.; NASA: Hampton, VA, USA, 1995; Volume 3, pp. 135–176. [Google Scholar]
  24. Chen, Y.; Sun-Mack, S.; Minnis, P.; Young, D.F.; Smith, W.L., Jr. Surface spectral emissivity derived from MODIS data. Proc. SPIE 2002. [Google Scholar] [CrossRef]
  25. Rienecker, M.M.; Suarez, M.J.; Gelaro, R.; Todling, R.; Bacmeister, J.; Liu, E.; Bosilovich, M.G.; Schubert, S.D.; Takacs, L.; Kim, G.-K.; et al. MERRA: NASA’s Modern-Era Retrospective Analysis for Research and Applications. J. Clim 2011, 24, 3624–3648. [Google Scholar]
  26. Minnis, P.; Trepte, Q.Z.; Sun-Mack, S.; Chen, Y.; Doelling, D.R.; Young, D.F.; Spangenberg, D.A.; Miller, W.F.; Wielicki, B.A.; Brown, R.R.; et al. Cloud detection in nonpolar regions for CERES using TRMM VIRS and Terra and Aqua MODIS data. IEEE Trans. Geosci. Remote Sens 2008, 46, 3857–3884. [Google Scholar]
  27. Minnis, P.; Sun-Mack, S.; Young, D.F.; Heck, P.W.; Garber, D.P.; Chen, Y.; Spangenberg, D.A.; Arduini, R.F.; Trepte, Q.Z.; Smith, W.L., Jr.; et al. CERES edition-2 cloud property retrievals using TRMM VIRS and Terra and Aqua MODIS data—Part I: Algorithms. IEEE Trans. Geosci. Remote Sens 2011, 49, 4374–4400. [Google Scholar]
  28. Goody, R.; West, R.; Chen, L.; Crisp, D. The correlated-k method for radiation calculations in nonhomogeneous atmospheres. J. Quant. Spectrosc. Radiat. Transfer 1989, 42, 539–550. [Google Scholar]
  29. Kratz, D.P. The correlated k-distribution technique as applied to the AVHRR channels. J. Quant. Spectrosc. Radiat. Transfer 1995, 53, 501–507. [Google Scholar]
  30. Morris, V.; Long, C.; Nelson, D. Deployment of an Infrared Thermometer Network at the Atmospheric Radiation Measurement Program Southern Great Plains Climate Research Facility. Proceedings of the Sixteenth Atmospheric Radiation Science Team Meeting, Albuquerque, NM, USA, 27–31 March 2006.
  31. Wan, Z.; Li, Z.-L. A physics-based algorithm for retrieving land-surface emissivity and temperature from EOS/MODIS data. IEEE Trans. Geosci. Remote Sens 1997, 35, 980–996. [Google Scholar]
  32. Wan, Z.; Dozier, J. A generalized split-window algorithm for retrieving land-surface temperature measurement from space. IEEE Trans. Geosci. Remote Sens 1996, 34, 892–905. [Google Scholar]
  33. Snyder, W.; Wan, Z. BRDF models to predict spectral reflectance and emissivity in the thermal infrared. IEEE Trans.Geosci. Remote Sens 1998, 36, 214–225. [Google Scholar]
  34. Wan, Z.; Zhang, Y.; Zhang, Q.; Li, Z. Validation of the land-surface temperature products retrieved from Terra Moderate Resolution Imaging Spectroradiometer data. Remote Sens. Environ 2002, 83, 163–180. [Google Scholar]
  35. Wan, Z. New refinements and validation of the MODIS land-surface temperature/emissivity products. Remote Sens. Environ 2008, 112, 59–74. [Google Scholar]
  36. Wan, Z.; Zhang, Y.; Zhang, Q.; Li, Z.-L. Quality assessment and validation of the MODIS global land surface temperature. Int. J. Remote Sens 2004, 25, 59–74. [Google Scholar]
  37. Hilton, F.; Armante, R.; August, T.; Barnet, C.; Bouchard, A.; Camy-Peyret, C.; Capelle, V.; Clarisse, L.; Clerbaux, C.; Coheur, P.-F.; et al. Hyperspectral earth observations from IASI: Five years of accomplishments. Bull. Amer. Metorol. Soc 2012, 93, 347–370. [Google Scholar]
  38. Minnis, P.; Smith, W.L., Jr. Cloud and radiative fields derived from GOES-8 during SUCCESS and the ARM–UAV spring 1996 flight series. Geophys. Res. Lett 1998, 25, 1113–1116. [Google Scholar]
  39. Knuteson, R.O.; Dedecker, R.G.; Feltz, W.F.; Osborne, B.J.; Revercomb, H.E.; Tobin, D.C. Progress towards a Characterization of the Infrared Emissivity of the Land Surface in the Vicinity of the ARM SGP Central Facility: Surface (S-AERI) and Airborne Sensors (NAST-I/S-HIS). Proceedings of the Eleventh ARM Science Team Meeting, Atlanta, GA, USA, 19–23 March 2001.
  40. Minnis, P.; Sun-Mack, S.; Chen, Y.; Khaiyer, M.M.; Yi, Y.; Ayers, J.K.; Brown, R.R.; Dong, X.; Gibson, S.C.; Heck, P.W.; et al. CERES edition-2 cloud property retrievals using TRMM VIRS and Terra and Aqua MODIS data, part II: Examples of average results and comparisons with other data. IEEE Trans. Geosci. Remote Sens 2011, 49, 4401–4430. [Google Scholar]
  41. Duda, D.P.; Minnis, P. A Study of Skin Temperature/Cloud Shadowing Relationships at the ARM SGP Site. Proceedings of the 10th ARM Science Team Meeting, San Antonio, TX, USA, 13–17 March 2000.
  42. Gambheer, A.V.; Doelling, D.R.; Spangenberg, D.A.; Minnis, P. Cloud and Radiative Fields Derived from GOES-8 during SUCCESS and the ARM–UAV Spring 1996 Flight Series. Proceedings of the AMS 13th Conference on Satellite Meteorology and Oceanography, Norfolk, VA, USA, 20–24 September 2004; 8, p. 6.
  43. GOES-R Series Ground Segment (GS) Project Functional and Performance Specification (F&PS) Version 1.10; 2009. Available online: http://www.star.nesdis.noaa.gov/star/goesr/MRD/FPS_1.10.pdf (accessed on 2 August 2012).
  44. Yu, Y.; Tarpley, D.; Privette, J.L.; Flynn, L.E.; Xu, H.; Chen, M.; Vinnikov, K.L.; Sun, D.; Tian, Y. Validation of GOES-R satellite land surface temperature algorithm using SURFRAD ground measurements and statistical estimates of error properties. IEEE Trans. Geosci. Remote Sens 2012, 50, 704–713. [Google Scholar]
  45. Minnis, P.; Khaiyer, M. Anisotropy of land surface skin temperature derived from satellite data. J. Appl. Meteorol 2000, 39, 1117–1129. [Google Scholar]
  46. Minnis, P.; Gambheer, A.V.; Doelling, D.R. Azimuthal anisotropy of longwave and infrared window radiances from the clouds and the Earth’s radiant energy system on the Tropical Rainfall Measuring Mission and Terra satellites. J. Geophys. Res 2004, 109. [Google Scholar] [CrossRef]
  47. Environmental Modeling Center. The GFS Atmospheric Model; NCEP Office Note 442; Global Climate and Weather Modeling Branch, EMC: Camp Springs, MD, USA, 2003. [Google Scholar]
  48. Seemann, S.W.; Borbas, E.E.; Knuteson, R.O.; Stephenson, R.; Huang, H.-L. Development of a global infrared land surface emissivity database for application to clear sky sounding retrievals from multispectral satellite radiance measurements. J. Appl. Meteor. Clim 2008, 47, 108–123. [Google Scholar]
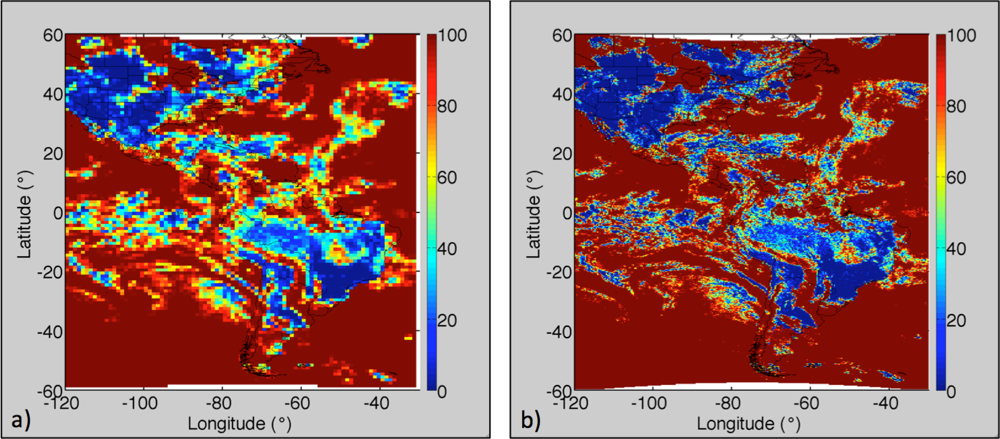
Figure 1. Cloud fraction (%) at (a) low (1.0° × 1.0°) and (b) high (0.25° × 0.3125°) in the Geostationary Operational Environmental Satellites (GOES)-13 domain, 17:45 UTC, 15 July 2011.
Remotesensing 05 00342f1
Figure 2. Low resolution (1° × 1°) clear-sky surface skin temperatures (K) from five GEOsat imagers, 12:00 UTC, 15 May 2012.
Remotesensing 05 00342f2
Figure 3. Comparison of GOES-13 and Moderate-resolution Imaging Spectroradiometer (MODIS) equivalent brightness temperatures computed using Infrared Atmospheric Sounding Interferometer (IASI) data over land from four seasonal months of 2008.
Remotesensing 05 00342f3
Figure 4. Surface skin temperature (K) derived from GOES-13 full-disk retrievals for 17:45 UTC, 29 May 2011. (a) Low (1° × 1°) and (b) high (0.25° × 0.3125°) resolution.
Remotesensing 05 00342f4
Figure 5. Mean 3-hourly high-resolution skin temperature product (HRTP) (K) for May 2011, except for 02:45 and 14:45 UTC.
Remotesensing 05 00342f5
Figure 6. Difference (K) between low-resolution skin temperature product (LRTP) and HRTP (HRTP minus LRTP) for (a) 05:45 and (b) 17:45 UTC May 2011 image-time averages.
Remotesensing 05 00342f6
Figure 7. Regressions of (a) GOES-13 HRTP or (b) Terra- and (c) Aqua-MODIS land surface skin temperature (LST) with the Atmospheric Radiation Measurement (ARM) 10-m upwelling Infrared Thermometer (IRT) measurements from October 2011 and January, April and July 2012. Data points are color-coded by month.
Remotesensing 05 00342f7
Figure 8. Same as Figure 7, except data points are color-coded by time of day.
Remotesensing 05 00342f8aRemotesensing 05 00342f8b
Figure 9. A combination of Figure 7(b,c): Terra- and Aqua-MODIS combined LST compared to ARM 10-m upwelling IRT measurements from October 2011 and January, April and July 2012.
Remotesensing 05 00342f9
Figure 10. Comparisons of HRTP and MODIS LST within 15 min of each other over the (a) Southern Great Plains at 17:45 UTC, (b) Northeast United States at 17:45 UTC and (c) Southern Great Plains at 08:45 UTC during October 2011 and January, April and July 2012.
Remotesensing 05 00342f10aRemotesensing 05 00342f10b
Figure 11. July 2012 comparison of GOES-15 and GOES-13 clear-sky top-of-atmosphere (TOA) infrared (IR) temperature (K) near 17:45 UTC in the Southern Great Plains (SGP) region.
Remotesensing 05 00342f11
Figure 12. Mean difference (K) between GEOS-5 land surface temperature and GOES-13 HRTP for clear-sky conditions at (a) 06:00 UTC (nighttime) and (b) 18:00 UTC (daytime), averaged over 1 August 2011 to 31 July 2012.
Remotesensing 05 00342f12
Figure 13. Daytime (18:00 UTC) seasonal root-mean-square differences (RMSD) (excluding seasonal mean difference) in Kelvin between GEOS-5 land surface temperature and GOES-13 HRTP for clear-sky conditions for (a) DJF (Dec 2011–Feb 2012), (b) MAM (Mar–May 2012), (c) JJA (Aug 2011, Jun–Jul 2012) and (d) SON (Sep–Nov 2011).
Remotesensing 05 00342f13
Figure 14. Bias and RMSD (excluding annual mean differences) in Kelvin between GEOS-5 land surface temperature and GOES-13 skin temperature for clear-sky conditions, averaged over 1 August 2011 to 31 July 2012, and the areas in North, Central and South America shown in Figures 12 and 13.
Remotesensing 05 00342f14
Table 1. Mean difference and standard deviations of the difference (SDD) (K) between measured temperatures.
Mean DifferenceSDD
GOES (Ts) – IRT (To)MODIS (Ts) – IRT (To)GOES (Ts) – IRTS-P (Ts)GOES (Ts) – MODIS (Ts)GOES (Ts) – IRT (To)MODIS (Ts) – IRT (To)GOES (Ts) – IRTS-P (Ts)GOES (Ts) – MODIS (Ts)
Day1.22.12.60.83.24.53.51.5
Night1.82.70.50.21.61.51.31.1
Both1.52.41.50.62.63.32.81.4
CC>30%3.1xxx2.7xxx
CC<=30%1.1xxx2.4xxx
CC=0%0.5xxx1.8xxx
Table 2. Inter-instrument comparison statistics from the HRTP and LRTP.
HRTPLRTP
GOES (Ts) – IRT (To)GOES (Ts) – IRTS-P (Ts)GOES (Ts) – MODIS (Ts)GOES (Ts) – IRT (To)GOES (Ts) – IRTS-P (Ts)GOES (Ts) – MODIS (Ts)
R20.970.960.990.950.950.98
Bias (K)1.51.50.61.10.10.4
SDD (K)2.62.81.43.43.41.8